The Creation of the Diagnostic Accuracy Quality Scale (DAQS) 1 Chad Cook PT, PhD, MBA, 2 Joshua Cleland PT, PhD, 3 Eric Hegedus PT, DPT, MHSc, 4 Alexis Wright PT, DPT, PhD, 5 Mark Hancock PT, PhD 1 Professor and Chair, Division of Physical Therapy, Walsh University, 2020 East Maple, North Canton, OH 44720, 330 490 7370, [email protected] 2 Professor, Franklin Pierce University, 5 Chenell Drive, Concord, NH 03301, 603.785.5576, [email protected] 3 Professor and Founding Chair, Department of Physical Therapy, School of Health Sciences, High Point University, 833 Montlieu Ave, Highpoint, NC 27262, 336-841-4596 Office, 336-906- 2133 Cell, [email protected] 4 Assistant Professor, Department of Physical Therapy, High Point University, 833 Montlieu Ave., High Point, NC 27262, 336-841-9270, [email protected] 5 Senior Lecturer, Discipline of Physiotherapy, Faculty of Human Sciences, Macquarie University, North Ryde, NSW, 2109, +61298506622, [email protected] Corresponding Author Chad Cook PT, PhD, MBA, FAAOMPT Professor and Chair Division of Physical Therapy Walsh University 2020 East Maple, North Canton, OH 44720 330 490 7370 [email protected]

Welcome message from author
This document is posted to help you gain knowledge. Please leave a comment to let me know what you think about it! Share it to your friends and learn new things together.
Transcript
The Creation of the Diagnostic Accuracy Quality Scale (DAQS) 1Chad Cook PT, PhD, MBA, 2Joshua Cleland PT, PhD, 3Eric Hegedus PT, DPT, MHSc, 4Alexis Wright PT, DPT, PhD, 5Mark Hancock PT, PhD
1Professor and Chair, Division of Physical Therapy, Walsh University, 2020 East Maple, North Canton, OH 44720, 330 490 7370, [email protected] 2Professor, Franklin Pierce University, 5 Chenell Drive, Concord, NH 03301, 603.785.5576, [email protected] 3Professor and Founding Chair, Department of Physical Therapy, School of Health Sciences, High Point University, 833 Montlieu Ave, Highpoint, NC 27262, 336-841-4596 Office, 336-906-2133 Cell, [email protected] 4Assistant Professor, Department of Physical Therapy, High Point University, 833 Montlieu Ave., High Point, NC 27262, 336-841-9270, [email protected] 5Senior Lecturer, Discipline of Physiotherapy, Faculty of Human Sciences, Macquarie University, North Ryde, NSW, 2109, +61298506622, [email protected]
Corresponding Author Chad Cook PT, PhD, MBA, FAAOMPT Professor and Chair Division of Physical Therapy Walsh University 2020 East Maple, North Canton, OH 44720 330 490 7370 [email protected]
Abstract
Background. Clinical tests and measures are used as proxy measures for a targeted diagnosis. The
utility of a dedicated clinical test and measure is dependent on the diagnostic accuracy values and
the quality of the study in which the test was examined. Scales, which allow a summative scoring
of bias within a study, provide clinicians with the ability to discriminate between which studies
were potentially influenced from bias. This bias could profoundly mediate the diagnostic
accuracy results of the study. At present, there are no scales advocated to measure the bias of
diagnostic accuracy studies.
Objective. The objective of this study was to create a new diagnostic accuracy scale that provides
a quantitative summary of the methodological quality of studies evaluating clinical tests and
measures.
Design. The study used a 4 round Delphi survey designed to create, revise, and develop consensus
for a quality scale. A Delphi survey is a series of sequential questionnaires designed to distill and
obtain the most reliable consensus from a group of experts.
Methods. The 4 round Delphi involved a work team (authors of this paper) and a respondent team
of experts. The respondent team was targeted based on past publications within the literature. An
initial round among the work team created a working document, which was then modified and
revised, with opportunities to create new items threaded in the second round. Rounds III and IV
involved voting the importance of each of the proposed items and consensus development from
the respondent group. Consensus for selection of an item required a 75% approval for importance
of that item.
Results. Sixteen individuals made up the Delphi team of experts. They exhibited a variety of
research and professional backgrounds and had a strong history of publication in the area of
diagnostic accuracy. Modification and revision of the initial work team instrument created a scale
with 21 items that reflected multiple methodological areas of diagnostic accuracy. Consensus for
the Diagnostic Accuracy Quality Scale (DAQS) was met for all items in Round III and IV.
Limitations. The new scale needs validation through weighted assessment. In addition, there was
a high proportion of physical therapist/researchers who functioned on the work and respondent
teams.
Conclusions. There is a need for systematic review and meta-analysis of clinical tests and
measures within the literature and there is a requisite use of a scale to critique the quality of the
articles included in any review in order to produce clear, clinically useful information. At present,
the current qualitative scales available for clinicians are not meant to fill this need necessitating
the need for a quality assessment scale such as the one we propose.
Keywords: Diagnostic accuracy, Validity, Scale, Quality Assessment
Background
A clinician’s armamentarium for diagnosis of pathoanatomical conditions includes
dedicated clinical special tests, which function as proxy measures for the targeted condition.1
These clinical tests are important to orthopedic diagnosticians, and the diagnostic information
gained from these tests is used to guide treatment decision-making and estimate prognosis .2 Tests
that have poor diagnostic accuracy provide little value during the diagnostic process. In turn, tests
that have purportedly high diagnostic value, but were ascertained within low quality studies that
exhibit substantial biases, may artificially predispose decision-making and may lead to increased
decision errors.1 With the number of clinical diagnostic tests and measures continuing to
proliferate and the recent importance of an accurate and appropriate diagnosis by selected
professionals as first-point providers, it is necessary to thoroughly evaluate a test’s diagnostic
utility prior to incorporating it into clinical practice.3,4
Two studies have previously identified a number of methodological factors that increase
bias in a diagnostic accuracy study.3,5 Using a weighted linear regression analysis with weights
proportional to the reciprocal of the variance of the log diagnostic odds ratio, Lijmer and
colleagues3 indicated that; a) the use of a case-control design, b) use of different reference tests, c)
lack of blinding of the index test when determining the reference standard, d) no description of
the index test, and e) no description of the population, were significantly associated with higher
estimates of diagnostic accuracy values and inflated utility. Using a different methodology (meta-
epidemiological regression approach) but a similar purpose, Rutjes and associates5 reported the
effect of design methodological deficiencies on estimates of diagnostic accuracy. Statistically
significant design methodologies included; a) use of a non-consecutive sample and b)
retrospective data collection. A number of other design methodologies exhibited high relative
diagnostic odds toward biasing the results (case control design, incorporation bias, etc.) but also
exhibited excessively wide confidence intervals, and were not statistically significant.
Recognition of the influence of biases on diagnostic accuracy results has prompted the
creation of guidelines to improve design and reporting of diagnostic accuracy studies.6 The
Standards for Reporting of Diagnostic Accuracy (STARD) 6 was designed to provide researchers
with a checklist and flow diagram that should be used prospectively for optimal study design. The
flow diagram outlines a method for patient recruitment, the order of test execution, the number of
patients undergoing the index test, and the specific reference test selected. The STARD includes
25 items that are divided into five major topics and six subsequent subtopics.
In contrast to prospective guidelines such as STARD, quality checklists or scales exist in
order to retrospectively rate design bias or overall study quality. Yet checklists and scales are two
very different tools. Checklists typically do not have a quantitative value or summary score
affiliated with the tool.7 On the other hand, within a scale, the construct being considered is
evaluated on a continuum, with quantitative units that reflect varying levels of a trait of
characteristics.8 Scales have numeric scores attached to the tool and have overall summary scores
that can be used by clinicians to evaluate the quality of the component being measured.8 Scales
provide numeric ratings of the quality of the published work thus allowing clinicians to carefully
evaluate the source of the data values, prior to adoption in clinical practice.2
A quality checklist that was developed for assessment of diagnostic accuracy studies is the
original Quality Assessment of Diagnostic Accuracy Studies (QUADAS)9 tool. The QUADAS
tool was developed to assess the quality by examining pertinent elements of internal and external
validity within the study.9 The original QUADAS tool was developed through a four round
Delphi panel, which reduced 28 critical criteria for evaluation of a completed diagnostic accuracy
study to 14 final components. After evaluation of the potential to use the QUADAS tool as scale,
the authors recommended its use only as a checklist with no summary scoring.10 In an attempt to
improve on the weaknesses of the original QUADAS, the QUADAS-211 was developed in 2011.
QUADAS-211 was created using a similar 4 round Delphi format as the original. The
QUADAS-2 document was designed to measure both internal bias and applicability, which the
authors define as the degree to which individual study criteria match the review question. New to
the QUADAS-2 is the use of signaling questions that allow an investigator to report the presence
of bias or non-applicability within 4 key domains.11 Key foci of the 4 domains include patient
selection, index tests, reference standards, and flow and timing. There are eleven specific
questions within the tool and each domain has two qualitative summative questions that assess
risks of bias and matching with the review question. As with the original QUADAS, the
QUADAS-2 attempts to function as a qualitative assessment checklist for all forms of diagnostic
accuracy; including investigation of measures that are not associated with clinical tests (e.g.,
imaging, laboratory test results, etc.).
Recently, Schueler and colleagues12 expressed concerns about QUADAS-2. They
questioned the value of the applicability measure, expressed concern about the fact that the
QUADAS-2 is more time-consuming than the original instrument, and indicated that calculating
inter-rater agreement only on the domain questions may be a shortcoming. Worth noting is that
the creators of QUADAS-2 also found varying reliability when the checklist was piloted.11 Our
experience13 with the QUADAS-2 has identified some additional concerns. We also found low
level of agreement when scoring among seasoned raters,13 and feel the tool is not able to
discriminate between a poorly designed and a strongly designed study, and feel there is no
obvious advantages compared to the original QUADAS. In addition, both the QUADAS-2 and
the original QUADAS, are purposively qualitative in nature and do not allow the ability to score a
study using a numeric value; a quality that is fundamental to a scale.
It is our interpretation that the need of a quantitative scale for methodological quality of
diagnosis studies is evident within the literature. Scales are used in evaluating bias in randomized
controlled trials and a number of other study design types. Although not supported by the
creators,10 numerous studies,14-18 have calculated summary scores when using the original
QUADAS to evaluate the quality of diagnostic accuracy studies. Others19 have even weighted
individual QUADAS items providing a summative score that they feel more accurately captures
the bias elements of a study. The impetus behind summating to a single score is simple: scales
provide an easy to use, quick to assess, numeric value that is understood by researchers,
clinicians, and the lay population. Consequently, the objective of this study was to create a new
diagnostic accuracy scale that provides a quantitative summary of the methodological quality of
studies evaluating clinical tests and measures. It is our hope that the new scale could be validated
in the future as a quantitative measure of bias in studies of diagnostic accuracy for clinical tests.
Methods
Design
Our study used a 4 round Delphi survey instrument that incorporated both a work group
and a respondent group. A Delphi survey is a series of sequential questionnaires designed to
distill and obtain the most reliable consensus from a group of experts.20 This survey method is
useful in situations where frequent clinical or practical judgments are encountered, yet there is a
lack of published research to provide evidence-based decision making. 20
Subjects
Respondent Group: Delphi participants were targeted if they were first (primary) or last
(senior) authors on recently published diagnostic accuracy studies associated with clinical tests
(between 2005-2012). We were particularly interested in authors who were involved in the
research of diagnostic accuracy of clinical tests and measures, which was the targeted focus of the
current quality scale. Search terms used when identifying authors included “diagnostic accuracy
(tw)”, “validation (tw)”, and “clinical tests (tw)”. We collected 50 consecutive author names of
appropriately identified studies that also provided author contact information in the manuscript.
The search was performed on Pubmed by a single author (CC). An appropriate article qualified if
the title and abstract provided an instance in which a clinical test was validated in a diagnostic
accuracy design.
Work Group: Because a portion of creation of a consensus document required qualitative
work, a work team was necessary to collate ideas and themes. The work group of this study
consisted of the authors of this paper. All authors were experienced in publishing works on
diagnostic accuracy, a majority was well experienced in evaluating quality of diagnostic accuracy
studies either in textbook or systematic review formats, and a minority was experienced with
Delphi studies.
Procedure
This Delphi survey consisted of 4 rounds of questionnaires that respondents consecutively
answered.21,22 The first round was completed by the Work team. The work team developed an
initial diagnostic accuracy quality scale following the first 3 procedures outlined by Streiner and
Norman23 for development of quality assessment tools. Their process outlines 5 critical steps, as
follows: (1) preliminary conceptual decisions; (2) item generation; (3) assessment of face validity;
(4) field trials; and 5) generation of a refined instrument, allowing for the generation, refinement,
and potential adaptation of a tool, created during a continuous improvement process.
During rounds two to four the respondent group was responsible for modifying the tool
that was generated in the first round. Invitations to the respondents for Round II of the study were
distributed through e-mail, each providing a direct web link with a web-based consent form and
survey. Potential respondents who did not answer the request for participation were sent a
reminder notice to encourage participation using a method suggested by Dillman.24 Two
consecutive follow-up reminders were delivered at 10 and 20 days after the initial invitation was
sent.25,26 Demographics/background information was also captured during Round II. The
Cherries27 guideline for confidentiality of subjects was followed and the identification of each
Delphi participant remained confidential throughout the study.
Assessment of Face Validity and Consensus Assessment
As stated, Round I involved the identification of potential items from the work team. The
team created the document through open ended suggestions and consensus. Items were created
from three primary foci: 1) design bias, 2) transferability to practice, and 3) methodological rigor.
As consensus-based adjustments occurred, two primary foci, 1) design bias and 2) transferability
to practice, were the principal themes. Initially, the work team generated a 19 item quality scale.
This scale was presented to the respondents for Round 2.
Round II involved acceptance, modification, and suggestion of new items from the
response team. Each participant was provided the same instructions and description of the study
purpose; which was stated to: create a new scale that provides clinicians with an easy to use,
quick to assess, numeric value that is understood by researchers, clinicians, and the lay
population. Within this round, each response team member was allowed to comment on each
quality item and make recommendations for removal, addition, modification, or acceptance of the
item. Upon completion by the respondent team, literal coding (by the work team) was used for
regeneration of items from Round I. After Round II, there were 21 items within the quality scale.
Round III involved scoring the importance of the items created in the literal coding phase
of Round II. Delphi participants scored each item as “strongly agree”, “agree”, “disagree”, or
“strongly disagree”, and provided comments again for each item. Upon completion, scores were
tabulated and placed in a bar graph for each item. Round IV involved the respondent group re-
scoring items (upon seeing the bar graph scores of the others from Round III from each
participant from the previous round). Again, Delphi participants scored each item as “strongly
agree”, “agree”, “disagree”, or “strongly disagree”. At the end of Round IV, items that were
scored as “strongly agree” or “agree” by 75% or higher of the participants were retained in the
diagnostic accuracy quality scale.
Sample Size
There is no critical sample size for a Delphi Study28; however, based on previous
experiences we targeted 50 authors in order to capture an expected 15 for the Delphi study. We
concluded that 15 respondents would be the ideal number for processing within our electronic
medium. In addition, although our process for creating the diagnostic accuracy quality scale was
different than the process used in creating the QUADAS (we have involved both a work team and
a respondent group of experts; the QUADAS involves only a work team), we had similar numbers
to those of the original QUADAS9 (created by a Delphi team of 9 individuals) and the QUADAS-
211 (generated by 24 individuals).
Results
There were 16 respondents (response rate of 32%) to the Delphi survey and all 16
completed all three designated rounds (100%). There were 11 males and 5 females and the mean
age was 43.6 (SD=8.5; range 29, 62 years). The multinational group of respondents was from the
Netherlands (2), Ireland (2), the United Kingdom (2), Turkey (1), Canada (1), Australia (1), New
Zealand (1), and the United States (6). Primary occupations included university
lecturer/researcher (1), physical therapist/researcher (5), epidemiologist (2), medical
physician/researcher (2), athletic trainer/researcher (2), chiropractor/researcher (1), and
researcher/research fellow (3), with 14/16 (87.5%) indicating an academic appointment of some
nature. Eleven (11) of the 16 specialized in orthopedics-related research, whereas others identified
dentistry (1), rheumatoid diseases (1), physical medicine and rehabilitation (1), and primary care
(1). Mean percentage of time devoted exclusively to research was 47.1% (SD=26.7). Those with
clinical experience within their professional fields had practiced on average 20.6 years (SD=9.2;
range 8, 41) with a mean of 38.1 publications (SD=45.6; range 2, 150).
Initially, the work team had created a 29 item list that was further reduced (after combined
concepts to 19 items). The work team’s 19 item scale increased to a 21 item scale in Round II
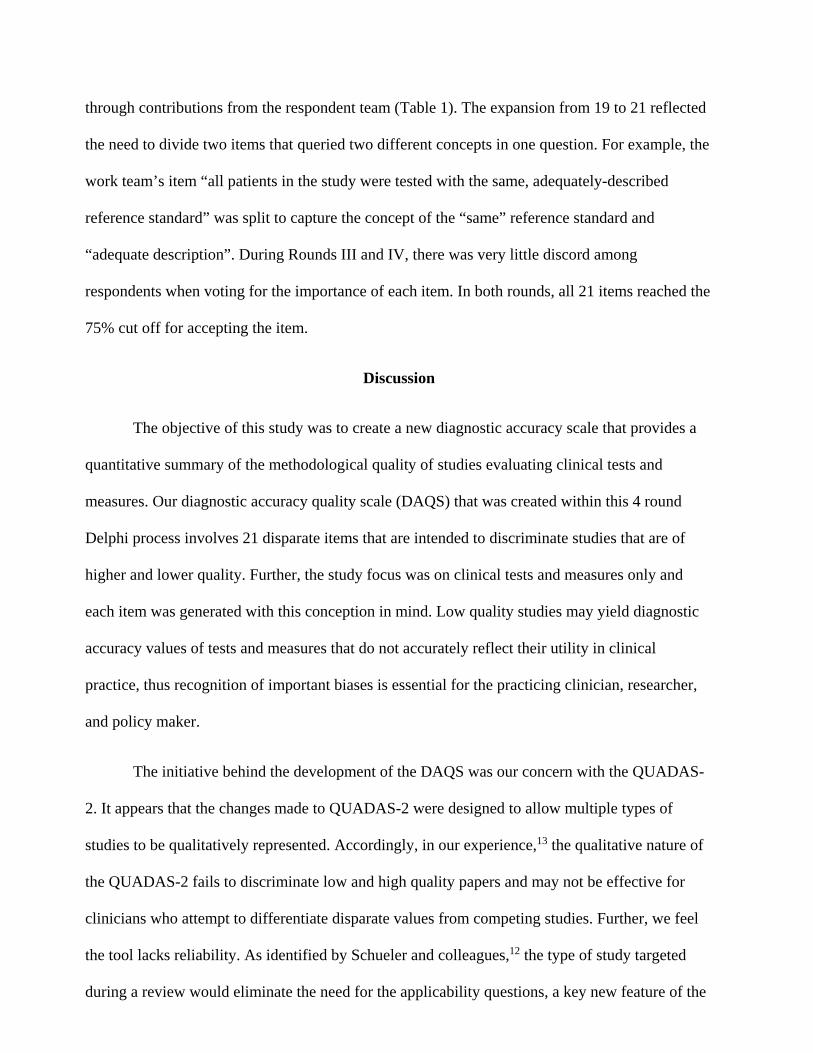
through contributions from the respondent team (Table 1). The expansion from 19 to 21 reflected
the need to divide two items that queried two different concepts in one question. For example, the
work team’s item “all patients in the study were tested with the same, adequately-described
reference standard” was split to capture the concept of the “same” reference standard and
“adequate description”. During Rounds III and IV, there was very little discord among
respondents when voting for the importance of each item. In both rounds, all 21 items reached the
75% cut off for accepting the item.
Discussion
The objective of this study was to create a new diagnostic accuracy scale that provides a
quantitative summary of the methodological quality of studies evaluating clinical tests and
measures. Our diagnostic accuracy quality scale (DAQS) that was created within this 4 round
Delphi process involves 21 disparate items that are intended to discriminate studies that are of
higher and lower quality. Further, the study focus was on clinical tests and measures only and
each item was generated with this conception in mind. Low quality studies may yield diagnostic
accuracy values of tests and measures that do not accurately reflect their utility in clinical
practice, thus recognition of important biases is essential for the practicing clinician, researcher,
and policy maker.
The initiative behind the development of the DAQS was our concern with the QUADAS-
2. It appears that the changes made to QUADAS-2 were designed to allow multiple types of
studies to be qualitatively represented. Accordingly, in our experience,13 the qualitative nature of
the QUADAS-2 fails to discriminate low and high quality papers and may not be effective for
clinicians who attempt to differentiate disparate values from competing studies. Further, we feel
the tool lacks reliability. As identified by Schueler and colleagues,12 the type of study targeted
during a review would eliminate the need for the applicability questions, a key new feature of the
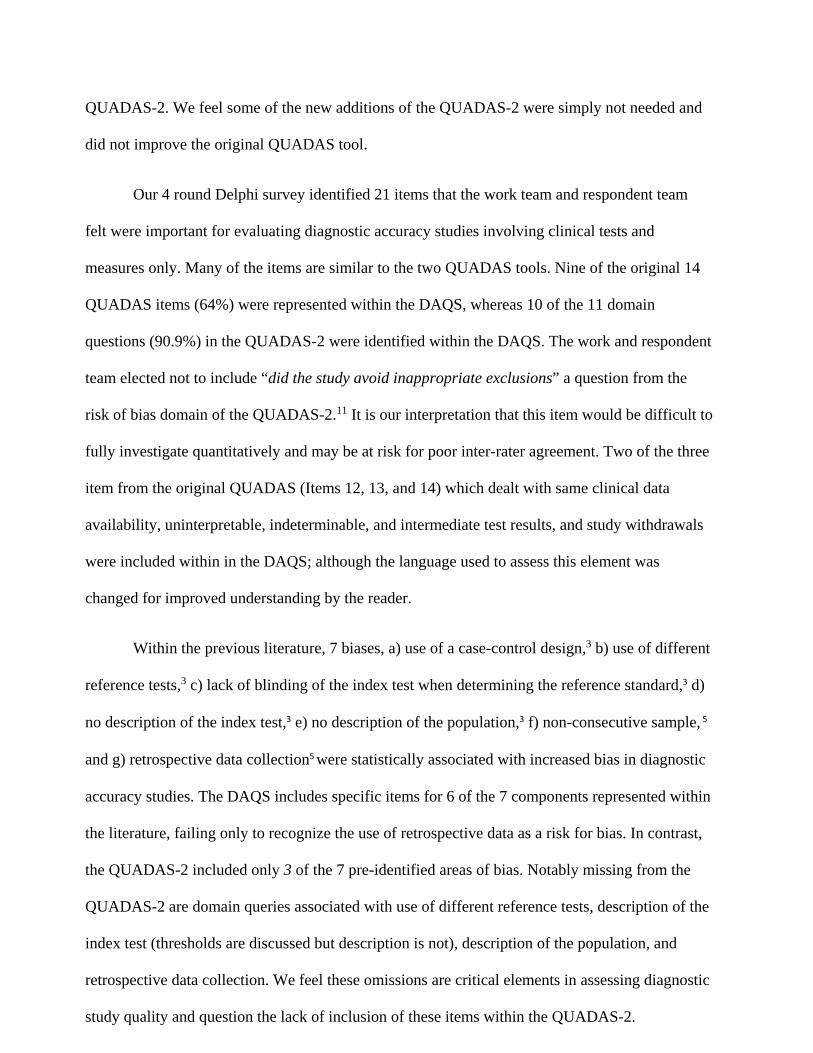
QUADAS-2. We feel some of the new additions of the QUADAS-2 were simply not needed and
did not improve the original QUADAS tool.
Our 4 round Delphi survey identified 21 items that the work team and respondent team
felt were important for evaluating diagnostic accuracy studies involving clinical tests and
measures only. Many of the items are similar to the two QUADAS tools. Nine of the original 14
QUADAS items (64%) were represented within the DAQS, whereas 10 of the 11 domain
questions (90.9%) in the QUADAS-2 were identified within the DAQS. The work and respondent
team elected not to include “did the study avoid inappropriate exclusions” a question from the
risk of bias domain of the QUADAS-2.11 It is our interpretation that this item would be difficult to
fully investigate quantitatively and may be at risk for poor inter-rater agreement. Two of the three
item from the original QUADAS (Items 12, 13, and 14) which dealt with same clinical data
availability, uninterpretable, indeterminable, and intermediate test results, and study withdrawals
were included within in the DAQS; although the language used to assess this element was
changed for improved understanding by the reader.
Within the previous literature, 7 biases, a) use of a case-control design,3 b) use of different
reference tests,3 c) lack of blinding of the index test when determining the reference standard,3 d)
no description of the index test,3 e) no description of the population,3 f) non-consecutive sample, 5
and g) retrospective data collection5 were statistically associated with increased bias in diagnostic
accuracy studies. The DAQS includes specific items for 6 of the 7 components represented within
the literature, failing only to recognize the use of retrospective data as a risk for bias. In contrast,
the QUADAS-2 included only 3 of the 7 pre-identified areas of bias. Notably missing from the
QUADAS-2 are domain queries associated with use of different reference tests, description of the
index test (thresholds are discussed but description is not), description of the population, and
retrospective data collection. We feel these omissions are critical elements in assessing diagnostic
study quality and question the lack of inclusion of these items within the QUADAS-2.
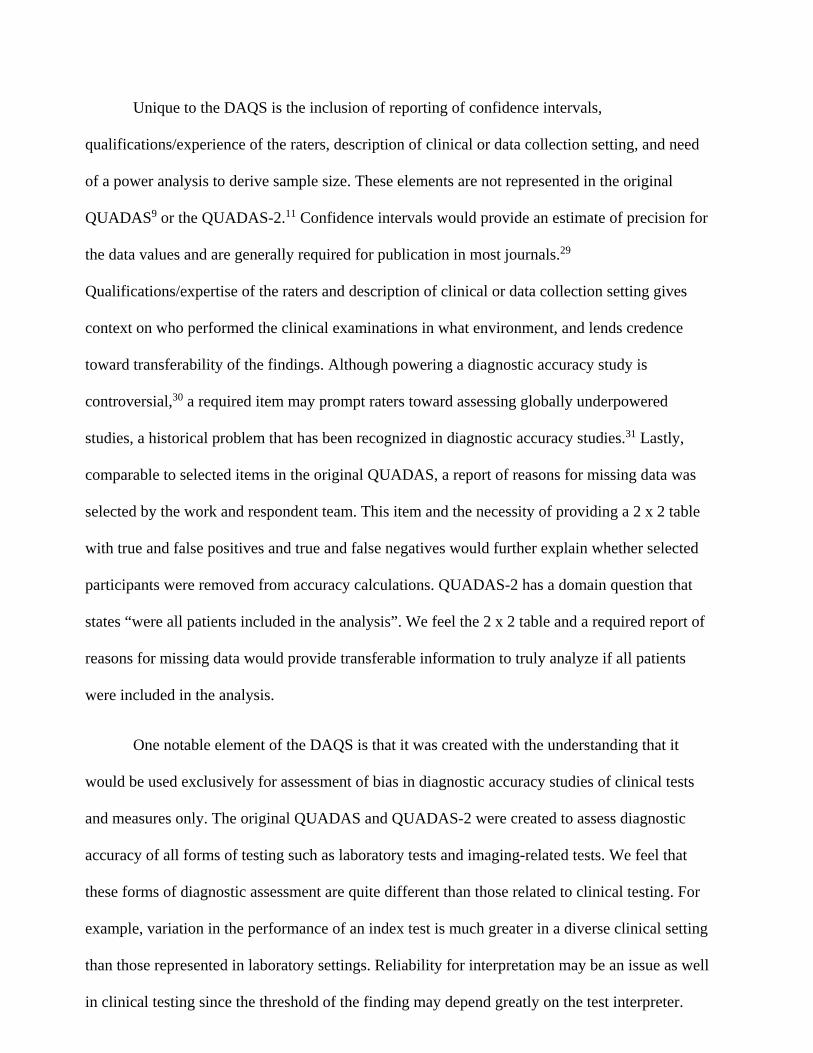
Unique to the DAQS is the inclusion of reporting of confidence intervals,
qualifications/experience of the raters, description of clinical or data collection setting, and need
of a power analysis to derive sample size. These elements are not represented in the original
QUADAS9 or the QUADAS-2.11 Confidence intervals would provide an estimate of precision for
the data values and are generally required for publication in most journals.29
Qualifications/expertise of the raters and description of clinical or data collection setting gives
context on who performed the clinical examinations in what environment, and lends credence
toward transferability of the findings. Although powering a diagnostic accuracy study is
controversial,30 a required item may prompt raters toward assessing globally underpowered
studies, a historical problem that has been recognized in diagnostic accuracy studies.31 Lastly,
comparable to selected items in the original QUADAS, a report of reasons for missing data was
selected by the work and respondent team. This item and the necessity of providing a 2 x 2 table
with true and false positives and true and false negatives would further explain whether selected
participants were removed from accuracy calculations. QUADAS-2 has a domain question that
states “were all patients included in the analysis”. We feel the 2 x 2 table and a required report of
reasons for missing data would provide transferable information to truly analyze if all patients
were included in the analysis.
One notable element of the DAQS is that it was created with the understanding that it
would be used exclusively for assessment of bias in diagnostic accuracy studies of clinical tests
and measures only. The original QUADAS and QUADAS-2 were created to assess diagnostic
accuracy of all forms of testing such as laboratory tests and imaging-related tests. We feel that
these forms of diagnostic assessment are quite different than those related to clinical testing. For
example, variation in the performance of an index test is much greater in a diverse clinical setting
than those represented in laboratory settings. Reliability for interpretation may be an issue as well
in clinical testing since the threshold of the finding may depend greatly on the test interpreter.
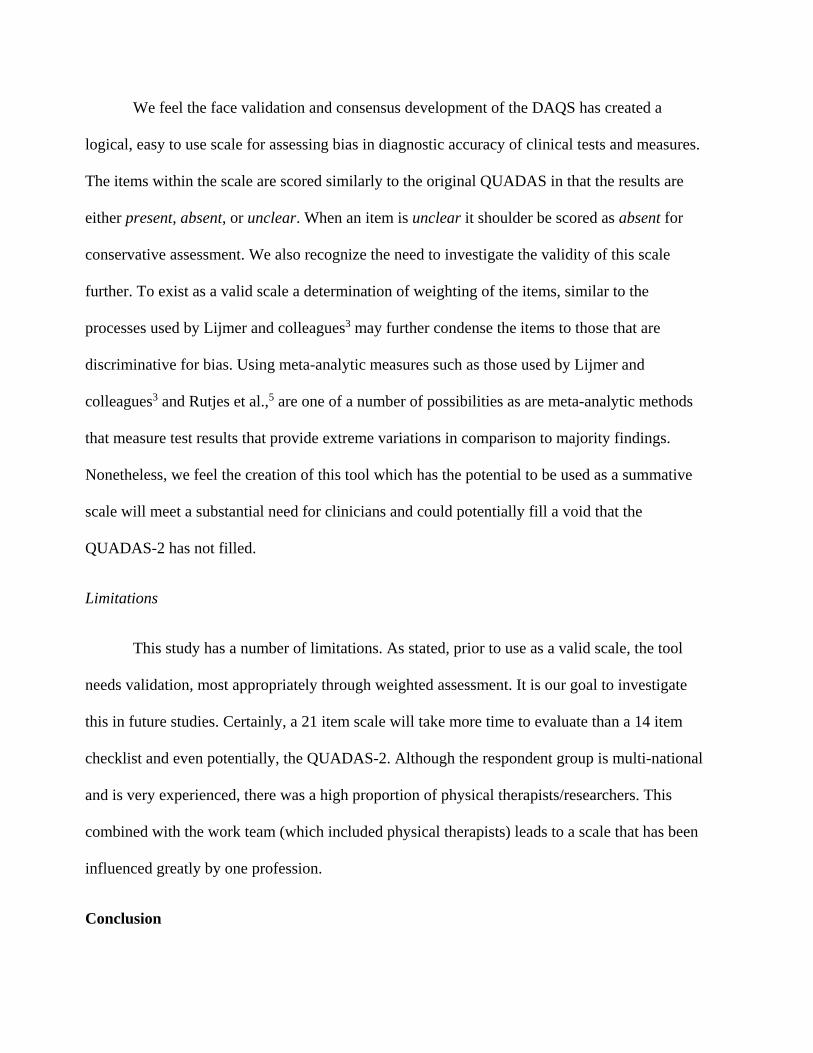
We feel the face validation and consensus development of the DAQS has created a
logical, easy to use scale for assessing bias in diagnostic accuracy of clinical tests and measures.
The items within the scale are scored similarly to the original QUADAS in that the results are
either present, absent, or unclear. When an item is unclear it shoulder be scored as absent for
conservative assessment. We also recognize the need to investigate the validity of this scale
further. To exist as a valid scale a determination of weighting of the items, similar to the
processes used by Lijmer and colleagues3 may further condense the items to those that are
discriminative for bias. Using meta-analytic measures such as those used by Lijmer and
colleagues3 and Rutjes et al.,5 are one of a number of possibilities as are meta-analytic methods
that measure test results that provide extreme variations in comparison to majority findings.
Nonetheless, we feel the creation of this tool which has the potential to be used as a summative
scale will meet a substantial need for clinicians and could potentially fill a void that the
QUADAS-2 has not filled.
Limitations
This study has a number of limitations. As stated, prior to use as a valid scale, the tool
needs validation, most appropriately through weighted assessment. It is our goal to investigate
this in future studies. Certainly, a 21 item scale will take more time to evaluate than a 14 item
checklist and even potentially, the QUADAS-2. Although the respondent group is multi-national
and is very experienced, there was a high proportion of physical therapists/researchers. This
combined with the work team (which included physical therapists) leads to a scale that has been
influenced greatly by one profession.
Conclusion

The sheer volume of dedicated clinical special tests32,33 and the rapid rate at which new
tests are developed suggests the need for systematic review and meta-analysis of these tests; and
the requisite use of a scale to critique the quality of the articles included in any review in order to
produce clear, clinically useful information. The QUADAS tools, both the original and 2, are not
meant to fill this need necessitating the development of a validated scale that provides a clear
ranking of studies based on their quality in design and reporting. We have taken the first steps to
fill this void with the development of the DAQS.
References
1. Bossuyt PMM. The quality of reporting in diagnostic test research: Getting better, still not
optimal. Clin Chem. 2004;50:465–467.
2. Cook C, Cleland J, Huijbregts P. Creation and Critique of Studies of Diagnostic Accuracy:
Use of the STARD and QUADAS Methodological Quality Assessment Tools. J Man
Manip Ther. 2007;15(2):93-102.
3. Lijmer JG, Mol BW, Heisterkamp S, et al. Empirical evidence of design-related bias in
studies of diagnostic tests. JAMA. 1999;282:1061–1063.
4. Whiting PF, Weswood ME, Rutjes AW, et al. Evaluation of QUADAS, a tool for the
quality assessment of diagnostic accuracy studies. BMC Med Res Methodol. 2006;6:9.
5. Rutjes Am Reitsma J, DiNisio M, Smidt N, van Rijn J, Bossuyt P. Evidence of bias and
variation in diagnostic accuracy studies. CMAJ. 2006;174:1-12.
6. Bossuyt PM, Reitsma JB, Bruns DE, Gatsonis CA, Glasziou PP, Irwig LM, Lijmer JG,
Moher D, Rennie D, de Vet HC, Standards for Reporting of Diagnostic Accuracy.
Towards complete and accurate reporting of studies of diagnostic accuracy: the STARD
Initiative. Ann Intern Med. 2003;138:40-44.
7. Clark L, Watson D. Constructing validity: Basic issues in objective scale development.
Psychol Assess. 1995;7:309-319.
8. Moher D, Jadad A, Nichol G, Perlman M, Tugwell P, Walsh S. Assessing the quality of
randomized controlled trials: An annotated bibliography of scales and checklists.
Controlled Clin Trials. 1995;16:62-73.
9. Whiting P, Rutjes AV, Reitsma JB, Bossuyt PM, Kleijnen J. The development of
QUADAS: a tool for the quality assessment of studies of diagnostic accuracy included in
systematic reviews. BMC Med Res Methodol. 2003;3:25.
10. Whiting P, Harbord R, Kleijnen J. No role for quality scores in systematic reviews of
diagnostic accuracy studies. BMC Med Res Methodol. 2005;26:19.
11. Whiting P, Rutjes W, Westwood M, Mallet S, Deeks J, Reitsma J, et al. QUADAS-2: A
revised tool for the quality assessment of diagnostic accuracy studies. Annals Intern Med.
2011;155:529-536.
12. Schueler S, Schuetz GM, Dewey M. The revised QUADAS-2 tool. Ann Intern Med.
2012;156:323.
13. Hegedus EJ, Goode AP, Cook CE, et al. Which physical examination tests provide
clinicians with the most value when examining the shoulder? Update of a systematic
review with meta-analysis of individual tests. Br J Sports Med. 2012 Aug 27. [Epub ahead
of print]
14. Hegedus EJ, Cook C, Hasselblad V, Goode A, McCrory DC. Physical examination tests
for assessing a torn meniscus in the knee: a systematic review with meta-analysis. J
Orthop Sports Phys Ther. 2007;37(9):541-550.
15. Hegedus EJ, Goode A, Campbell S, Morin A, Tamaddoni M, Moorman CT 3rd, et al.
Physical examination tests of the shoulder: a systematic review with meta-analysis of
individual tests. Br J Sports Med. 2008;42(2):80-92; discussion 92.
16. Tijssen M, van Cingel R, Willemsen L, de Visser E. Diagnostics of femoroacetabular
impingement and labral pathology of the hip: a systematic review of the accuracy and
validity of physical tests. Arthroscopy. 2012;28(6):860-871.
17. Reneker J, Paz J, Petrosino C, Cook C. Diagnostic accuracy of clinical tests and signs of
temporomandibular joint disorders: a systematic review of the literature. J Orthop Sports
Phys Ther. 2011;41(6):408-16.
18. Simpson R, Gemmell H. Accuracy of spinal orthopaedic tests: a systematic review.
Chiropr Osteopat. 2006 Oct 31;14:26.
19. Alqami A, Schneiders A, Hendrick P. Clinical tests to diagnose lumbar segmental
instability: A systematic review. J Orthop Sports Phys Ther. 2011;41:130-140.
20. Stheeman SE, van’t Hof MA, Mileman PA, van der Stelt PF. Use of the Delphi technique
to develop standards for quality assessment in diagnostic radiology. Community Dent
Health. 1995;12:194 –199.
21. Binkley J, Finch E, Hall J, et al. Diagnostic classification of patients with low back pain:
report on a survey of physical therapy experts. Phys Ther. 1993;73:138 –155.
22. Cleary K. Using the Delphi process to reach consensus. J Cardiopulm Phys Ther.
2001;1:20 –23.
23. Streiner DL, Norman GR. Health Measurement Scales: A Practical Guide to Their
Development and Use (4th ed.) Oxford: Oxford University Press; 2008.
24. Dillman DA. Mail and Internet Surveys: The Tailored Design Method. 2nd ed. New York,
NY: John Wiley & Sons Inc; 2000:363.
25. Lopopolo RB. Hospital restructuring and the changing nature of the physical therapist’s
role. Phys Ther. 1999;79:171–185.
26. Pesik N, Keim M, Sampson TR. Do US emergency medicine residency programs provide
adequate training for bioterrorism? Ann Emerg Med. 1999;34:173–176.
27. Eysenbach G. Improving the quality of Web surveys: the Checklist for Reporting Results
of Internet E-Surveys (CHERRIES). J Med Internet Res. 2004;6:e34.
28. Dvorak J, Panjabi MM, Novotny JE, et al. Clinical validation of functional flexion-
extension roentgenograms of the lumbar spine. Spine. 1991;16:943–950.
29. Hegedus EJ, Stern B. Beyond SpPIN and SnNOUT: Considerations with Dichotomous
Tests During Assessment of Diagnostic Accuracy. J Man Manip Ther. 2009;17:E1-5.
30. Chu H, Cole SR. Sample size calculation using exact methods in diagnostic test studies. J
Clin Epidemiol. 2007;60(11):1201-2; author reply 1202.
31. Flahault A, Cadilhac M, Thomas G. Sample size calculation should be performed for
design accuracy in diagnostic test studies. J Clin Epidemiol. 2005;58:859–862.
32. Cook C, Hegedus E. Orthopedic Physical Examination Tests: An Evidence-Based Approach. 2nd
edition. Upper Saddle River NJ; Prentice Hall: 2013.
33. Cleland J, Koppenhaver S. Netter’s Orthopaedic Clinical Examination: An Evidence-Based
Approach. 2nd edition. Saunders: 2010.
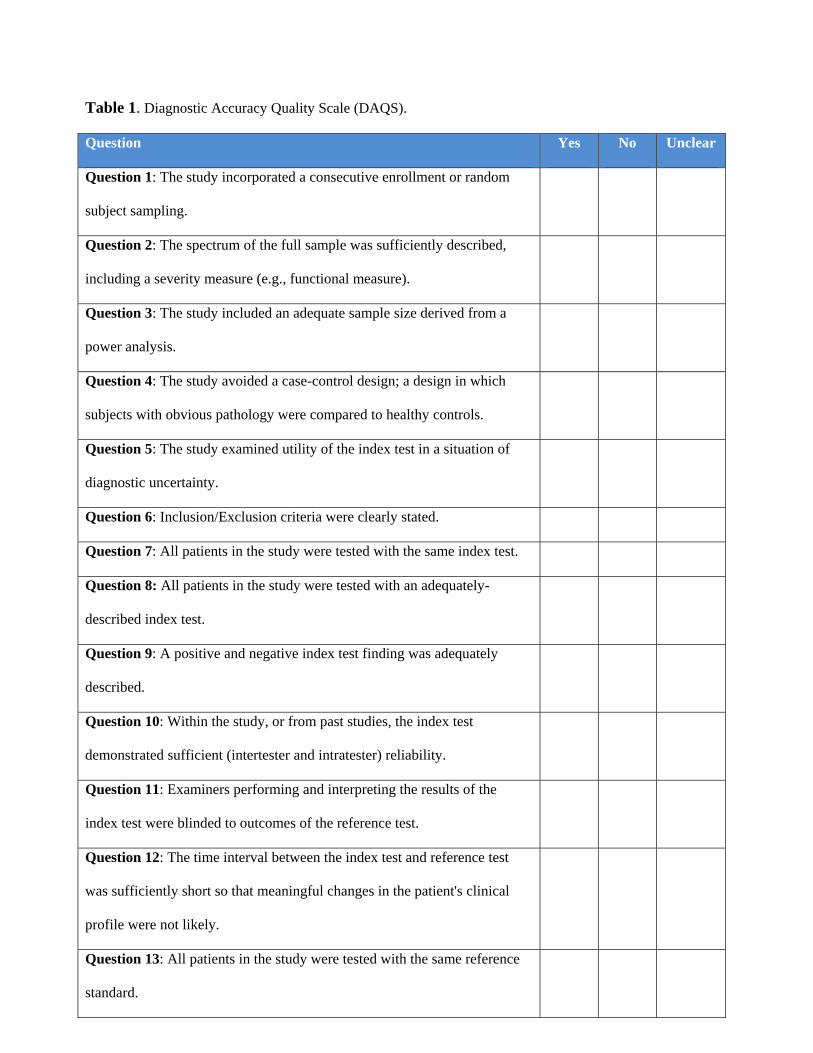
Table 1. Diagnostic Accuracy Quality Scale (DAQS). Question Yes No Unclear
Question 1: The study incorporated a consecutive enrollment or random
subject sampling.
Question 2: The spectrum of the full sample was sufficiently described,
including a severity measure (e.g., functional measure).
Question 3: The study included an adequate sample size derived from a
power analysis.
Question 4: The study avoided a case-control design; a design in which
subjects with obvious pathology were compared to healthy controls.
Question 5: The study examined utility of the index test in a situation of
diagnostic uncertainty.
Question 6: Inclusion/Exclusion criteria were clearly stated.
Question 7: All patients in the study were tested with the same index test.
Question 8: All patients in the study were tested with an adequately-
described index test.
Question 9: A positive and negative index test finding was adequately
described.
Question 10: Within the study, or from past studies, the index test
demonstrated sufficient (intertester and intratester) reliability.
Question 11: Examiners performing and interpreting the results of the
index test were blinded to outcomes of the reference test.
Question 12: The time interval between the index test and reference test
was sufficiently short so that meaningful changes in the patient's clinical
profile were not likely.
Question 13: All patients in the study were tested with the same reference
standard.
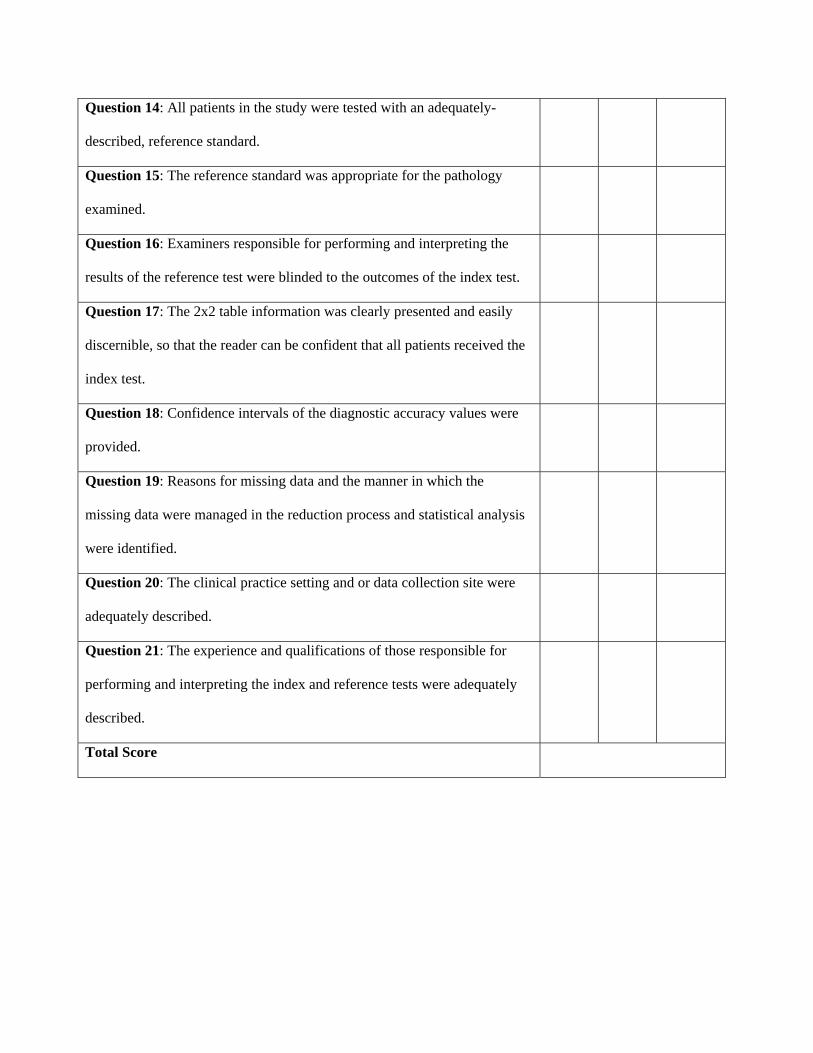
Question 14: All patients in the study were tested with an adequately-
described, reference standard.
Question 15: The reference standard was appropriate for the pathology
examined.
Question 16: Examiners responsible for performing and interpreting the
results of the reference test were blinded to the outcomes of the index test.
Question 17: The 2x2 table information was clearly presented and easily
discernible, so that the reader can be confident that all patients received the
index test.
Question 18: Confidence intervals of the diagnostic accuracy values were
provided.
Question 19: Reasons for missing data and the manner in which the
missing data were managed in the reduction process and statistical analysis
were identified.
Question 20: The clinical practice setting and or data collection site were
adequately described.
Question 21: The experience and qualifications of those responsible for
performing and interpreting the index and reference tests were adequately
described.
Total Score
Related Documents