T HE C OUPLING OF A CTION AND P ERCEPTION IN M USICAL M EANING F ORMATION P IETER-J AN MAES ,E DITH VAN DYCK , MICHELINE L ESAFFRE ,MARC L EMAN Ghent University, Ghent, Belgium P IETER M. K ROONENBERG Leiden University, Leiden, The Netherlands THE EMBODIED PERSPECTIVE ON MUSIC COGNITION has stressed the central role of the body and body move- ments in musical meaning formation processes. In the present study, we investigate by means of a behavioral experiment how free body movements in response to music (i.e., action) can be linked to specific linguistic, metaphorical descriptions people use to describe the expressive qualities they perceive in the music (i.e., per- ception). We introduce a dimensional model based on the Effort/Shape theory of Laban in order to target musical expressivity from an embodied perspective. Also, we investigate whether a coupling between action and perception is dependent on the musical background of the participants (i.e., trained versus untrained). The results show that the physical appearance of the free body movements that participants perform in response to music are reliably linked to the linguistic descriptions of musical expressiveness in terms of the underlying quality. Moreover, this result is found to be independent of the participants’ musical background. Received: July 25, 2012, accepted January 24, 2013. Key words: embodied music cognition, expressive ges- tures, action-perception coupling, musical metaphor, musical expressiveness W HEN PEOPLE SPEAK ABOUT WESTERN ART music, metaphors are ubiquitous (Cox, 2011; Guck, 1994). Embodied, sensory- motor experiences are considered to play an important role in the use and understanding of metaphors (Crawford, 2009; Gibbs, Costa Lima, & Francozo, 2004). Metaphorical constructs (e.g., ‘‘life is a journey’’) tend to elucidate abstract ideas (e.g., ‘‘life’’) by relating them to concrete, sensory-motor experiences (e.g., ‘‘journey’’). In the context of music, research has indicated that a substantial part of musical metaphors relate to people’s experience of physical motion and space (Cox, 2011; Johnson & Larson, 2003; Larson, 2012). Moreover, in the general paradigm of embodied music cognition, theories have been developed explaining how people perceive and understand music, at least partly, in terms of the body movements that music induces. Examples are the motor model of musical expressiveness (Leman, 2007), the motor-mimetic theory (Godøy, 2003), and the mimetic hypothesis (Cox, 2011). In the present study, we elaborate on the idea that the embodied experience of music is an important factor in people’s use and understanding of musical metaphors. People often respond to music by making body move- ments that reflect aspects of its melodic and rhythmic contours, or of the sound-producing gestures from which it originated (Godøy, 2010). This may instigate a sense of imagined participation with the production of the sound, an idea that is addressed in a broad range of musicological studies under different names, such as imagined activity (Maus, 1988), kinaesthetic empathy (Mead, 1999), imaginary agency (Levinson, 2006), sim- ulated control (Leman, 2007), and active perception (Krueger, 2009). What all of these accounts have in common is their reference to a direct, sensory-motor engagement with music; to how music literally ‘‘moves’’ people, and to how they feel they are immersed in, and resonate with, the physical sound energy. In the present study, we ask how this form of embodied sensory- motor engagement with music might be related to the use of musical metaphors. We present an experiment designed to investigate the extent to which physical and expressive properties of music-induced body move- ments (i.e., action) are reflected in the linguistic meta- phors that people use to describe the expressive qualities they recognize in the music (i.e., perception). Here, perception refers to the identification, organiza- tion, and interpretation of what is received through the senses (here, the auditory sense), and involves a combination of ‘‘bottom-up’’ sensory processing, and ‘‘top-down’’ processes (expectation, knowledge, etc.). Accordingly, perception itself pertains to a level of understanding that could be conceptualized as linguis- tic metaphors. Music Perception, VOLUME 32, ISSUE 1, PP. 67–84, ISSN 0730-7829, ELECTRONIC ISSN 1533-8312. © 2014 BY THE REGENTS OF THE UNIVERSITY OF CALIFORNIA ALL RIGHTS RESERVED. PLEASE DIRECT ALL REQUESTS FOR PERMISSION TO PHOTOCOPY OR REPRODUCE ARTICLE CONTENT THROUGH THE UNIVERSITY OF CALIFORNIA PRESS ’ S RIGHTS AND PERMISSIONS WEBSITE, HTTP:// WWW. UCPRESSJOURNALS . COM/ REPRINTINFO. ASP. DOI: 10.1525/ MP.2014.32.1.67 Action-Perception Coupling 67

Welcome message from author
This document is posted to help you gain knowledge. Please leave a comment to let me know what you think about it! Share it to your friends and learn new things together.
Transcript
THE COUPLING OF ACTION AND PERCE PTI ON IN MUSICAL
MEANING FORMAT ION
PI E T E R-JAN MA ES, EDITH VA N DYCK,MI C H E L IN E LESAFFRE, MAR C LE MA N
Ghent University, Ghent, Belgium
PI E T E R M. KRO ONE NBE RG
Leiden University, Leiden, The Netherlands
THE EMBODIED PERSPECTIVE ON MUSIC COGNITION
has stressed the central role of the body and body move-ments in musical meaning formation processes. In thepresent study, we investigate by means of a behavioralexperiment how free body movements in response tomusic (i.e., action) can be linked to specific linguistic,metaphorical descriptions people use to describe theexpressive qualities they perceive in the music (i.e., per-ception). We introduce a dimensional model based onthe Effort/Shape theory of Laban in order to targetmusical expressivity from an embodied perspective.Also, we investigate whether a coupling between actionand perception is dependent on the musical backgroundof the participants (i.e., trained versus untrained). Theresults show that the physical appearance of the freebody movements that participants perform in responseto music are reliably linked to the linguistic descriptionsof musical expressiveness in terms of the underlyingquality. Moreover, this result is found to be independentof the participants’ musical background.
Received: July 25, 2012, accepted January 24, 2013.
Key words: embodied music cognition, expressive ges-tures, action-perception coupling, musical metaphor,musical expressiveness
W HEN PEOPLE SPEAK ABOUT WESTERN ART
music, metaphors are ubiquitous (Cox,2011; Guck, 1994). Embodied, sensory-
motor experiences are considered to play an importantrole in the use and understanding of metaphors(Crawford, 2009; Gibbs, Costa Lima, & Francozo,2004). Metaphorical constructs (e.g., ‘‘life is a journey’’)tend to elucidate abstract ideas (e.g., ‘‘life’’) by relatingthem to concrete, sensory-motor experiences (e.g.,‘‘journey’’). In the context of music, research has
indicated that a substantial part of musical metaphorsrelate to people’s experience of physical motion andspace (Cox, 2011; Johnson & Larson, 2003; Larson,2012). Moreover, in the general paradigm of embodiedmusic cognition, theories have been developed explaininghow people perceive and understand music, at leastpartly, in terms of the body movements that musicinduces. Examples are the motor model of musicalexpressiveness (Leman, 2007), the motor-mimetic theory(Godøy, 2003), and the mimetic hypothesis (Cox, 2011).In the present study, we elaborate on the idea that theembodied experience of music is an important factor inpeople’s use and understanding of musical metaphors.
People often respond to music by making body move-ments that reflect aspects of its melodic and rhythmiccontours, or of the sound-producing gestures fromwhich it originated (Godøy, 2010). This may instigatea sense of imagined participation with the productionof the sound, an idea that is addressed in a broad rangeof musicological studies under different names, such asimagined activity (Maus, 1988), kinaesthetic empathy(Mead, 1999), imaginary agency (Levinson, 2006), sim-ulated control (Leman, 2007), and active perception(Krueger, 2009). What all of these accounts have incommon is their reference to a direct, sensory-motorengagement with music; to how music literally ‘‘moves’’people, and to how they feel they are immersed in, andresonate with, the physical sound energy. In the presentstudy, we ask how this form of embodied sensory-motor engagement with music might be related to theuse of musical metaphors. We present an experimentdesigned to investigate the extent to which physical andexpressive properties of music-induced body move-ments (i.e., action) are reflected in the linguistic meta-phors that people use to describe the expressivequalities they recognize in the music (i.e., perception).Here, perception refers to the identification, organiza-tion, and interpretation of what is received throughthe senses (here, the auditory sense), and involves acombination of ‘‘bottom-up’’ sensory processing, and‘‘top-down’’ processes (expectation, knowledge, etc.).Accordingly, perception itself pertains to a level ofunderstanding that could be conceptualized as linguis-tic metaphors.
Music Perception, VOLUME 32, ISSUE 1, PP. 67–84, ISSN 0730-7829, ELE CTRONIC ISSN 1533-8312. © 2014 BY THE REGENTS O F THE UN IVERSIT Y O F CALIFORNIA ALL
RIGHTS RESERVED. PLEASE DIRECT ALL REQUESTS FOR PERMISSION TO PHOTOCOPY OR REPRODUC E ARTICLE CONTENT THROUGH THE UNIVERSIT Y OF CALIFORNIA PRESS’S
RIGHTS AND PERMISSIONS WEBSITE, HT TP://WWW.UC PRESSJOURNALS.COM/REPRINTINFO.ASP. DOI: 10.1525/MP.2014.32.1.67
Action-Perception Coupling 67
Our analytical framework for mapping low-levelphysical movement properties onto high-level expressivelinguistic concepts will be the Effort/Shape model thatoriginated in the Laban Movement Analysis (LMA)method (Laban, 1947; Laban & Ullmann, 1966/2011).This is an integrated conceptual system that relatesphysical movements to expressive qualities such asemotion, intentionality, and so on. By adapting themodel, we are able to incorporate linguistic metaphorsto our analysis. The Effort/Shape model has beenapplied in earlier studies of expressive movementresponses to music (Camurri, Mazzarino, Ricchetti,Timmers, & Volpe, 2004; Maes, Leman, Lesaffre,Demey, & Moelants, 2010), although no attempts havebeen made to use it to clarify the relationship betweenfree movement responses to music and the use of lin-guistic musical metaphors. As the name implies, themodel consists of two main components: Effort, whichrefers to the subtle, energetic qualities of an expressivemovement; and Shape, which relates to changes in bodyshape. Both components are subdivided into differentcategories. There are four categories within the Effortcomponent, and in turn these are structured around aconceptual opposition: 1) Effort-weight relates to thequalities strong-light; 2) Effort-time relates to sudden-sustained; 3) Effort-flow is structured around bound-free; and 4) Effort-space is classified as direct-indirect.Similarly, the Shape component is divided into threecategories structured around the polarities spreading-enclosing, rising-descending, and advancing-retreating.This last opposition is not taken into account in the
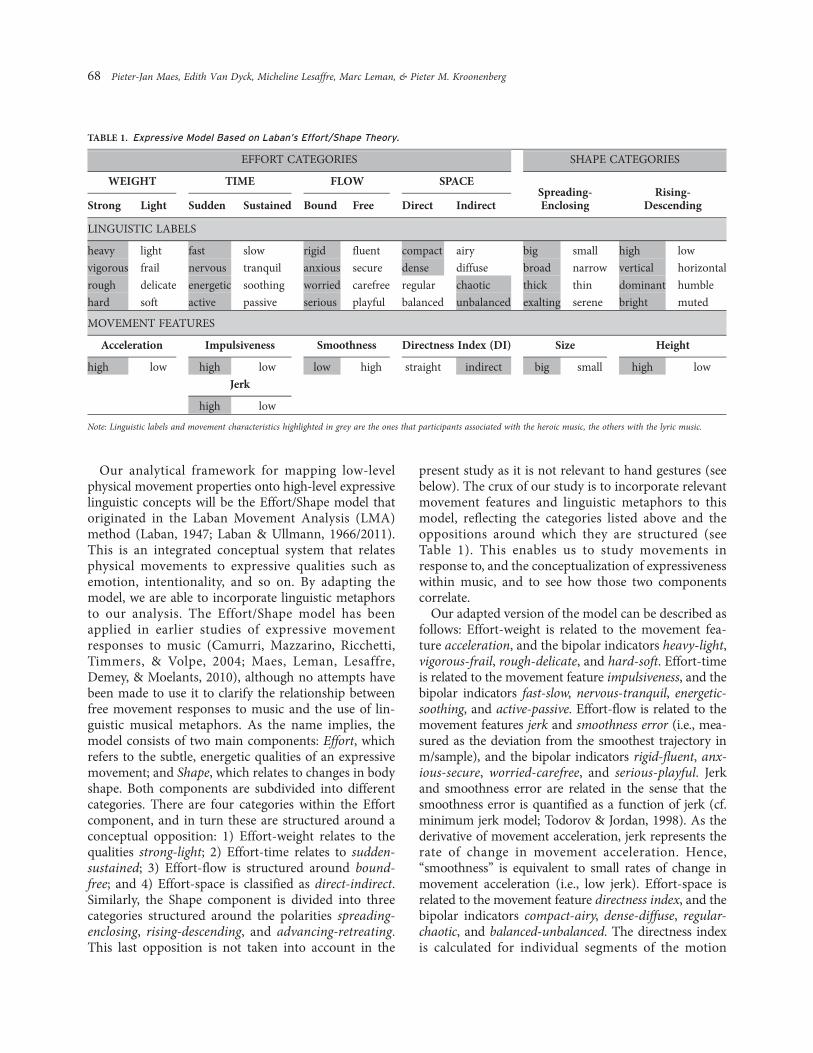
present study as it is not relevant to hand gestures (seebelow). The crux of our study is to incorporate relevantmovement features and linguistic metaphors to thismodel, reflecting the categories listed above and theoppositions around which they are structured (seeTable 1). This enables us to study movements inresponse to, and the conceptualization of expressivenesswithin music, and to see how those two componentscorrelate.
Our adapted version of the model can be described asfollows: Effort-weight is related to the movement fea-ture acceleration, and the bipolar indicators heavy-light,vigorous-frail, rough-delicate, and hard-soft. Effort-timeis related to the movement feature impulsiveness, and thebipolar indicators fast-slow, nervous-tranquil, energetic-soothing, and active-passive. Effort-flow is related to themovement features jerk and smoothness error (i.e., mea-sured as the deviation from the smoothest trajectory inm/sample), and the bipolar indicators rigid-fluent, anx-ious-secure, worried-carefree, and serious-playful. Jerkand smoothness error are related in the sense that thesmoothness error is quantified as a function of jerk (cf.minimum jerk model; Todorov & Jordan, 1998). As thederivative of movement acceleration, jerk represents therate of change in movement acceleration. Hence,‘‘smoothness’’ is equivalent to small rates of change inmovement acceleration (i.e., low jerk). Effort-space isrelated to the movement feature directness index, and thebipolar indicators compact-airy, dense-diffuse, regular-chaotic, and balanced-unbalanced. The directness indexis calculated for individual segments of the motion
TABLE 1. Expressive Model Based on Laban’s Effort/Shape Theory.
EFFORT CATEGORIES SHAPE CATEGORIES
WEIGHT TIME FLOW SPACESpreading-Enclosing
Rising-DescendingStrong Light Sudden Sustained Bound Free Direct Indirect
LINGUISTIC LABELS
heavy light fast slow rigid fluent compact airy big small high lowvigorous frail nervous tranquil anxious secure dense diffuse broad narrow vertical horizontalrough delicate energetic soothing worried carefree regular chaotic thick thin dominant humblehard soft active passive serious playful balanced unbalanced exalting serene bright muted
MOVEMENT FEATURES
Acceleration Impulsiveness Smoothness Directness Index (DI) Size Height
high low high low low high straight indirect big small high lowJerk
high low
Note: Linguistic labels and movement characteristics highlighted in grey are the ones that participants associated with the heroic music, the others with the lyric music.
68 Pieter-Jan Maes, Edith Van Dyck, Micheline Lesaffre, Marc Leman, & Pieter M. Kroonenberg
trajectories of the dominant hand. This measureexpresses the ratio between the length of the straighttrajectory connecting the beginning and end point ofa motion segment and the distance of the actual coveredtrajectory between these two points. Shape-spreading/enclosing is related to the movement feature size, and thebipolar indicators big-small, broad-narrow, thick-thin,and exalting-serene. Shape-rising/descending is relatedto the movement feature height, and the bipolar indica-tors high-low, vertical-horizontal, dominant-humble, andbright-muted.
The experiment was conducted in two parts. In onepart - the motor-attuning part - people were asked toperform free body movements in response to music,and their responses were recorded with an opticalmotion tracking system. In the other part - the self-report part - people were asked to associate 24 pairsof bipolar adjectives with the music while simply listen-ing to the music. Rather than use various, shorterextracts of music, we opted for a single, continuouspiece in which contrast is an inherent part of the com-position. Dynamic contrasts are a typical feature ofLate-Romantic music, and the particular music wechose was the beginning of the first movement ofBrahms’ First Piano Concerto. The reasons for thischoice are threefold. First, listening to a continuousmusical piece is assumed to create a more ecologicallyvalid listening situation in which participants canimmerse themselves in the music. Second, it allows usto investigate whether the expressive extremes of thematerial within a single piece are reflected in bodymovement responses and musical metaphors. Third,an emphasis on musical contrast corresponds to thepolarities around which the Effort/Shape model is struc-tured. We extracted acoustic properties from the audiosignal; an energy property (i.e., amplitude) and spec-trum properties (i.e., irregularity, spectral flatness, spec-tral sharpness, and spectral variance). Based on thecontrasts we found in the musical material, we definedtwo musical styles: heroic and lyric. For each of thesestyles we identified three exemplary passages within thepiece, and we asked participants to rate each of those sixpassages according to our set of 24 bipolar adjectivescales. Our movement analysis took into account onlythose movements that were performed during those sixspecific passages, although participants were asked toperform free body movements continuously throughoutthe musical piece.
Three main research questions are asked in the pres-ent study. First, whether or not contrasts in music arereflected in people’s movement responses to it, and intheir ratings of its character across the bipolar adjective
scales. Second, whether there are similarities among theparticipants’ responses, and whether these relate to themusical background of the participants (i.e., trained ver-sus untrained). In addressing this question, we hypothe-sized that differences in movement responses and verbaldescriptions between the two musical styles would bemore pronounced in people with a musical background,as perception is influenced by learned, ‘‘top-down’’ pro-cesses involving expectation and knowledge. Third, usingthe Effort/Shape model, we wanted to investigate thecorrelation between people’s movement responses andthe musical metaphors they attribute to the music.
Method
PARTICIPANTS
We invited 36 students enrolled in a broad range ofacademic disciplines at Ghent University to participatein the experiment. They received no compensation forparticipating in the study. None of the participantsreceived formal dance training in the past. Two distinctgroups of participants were recruited systematically, onthe basis of their musical background. The musicallytrained group comprised 18 participants (10 male, 8female) with a mean age of 23.8 years (SD ¼ 3.7) andwho played a musical instrument and had a mean num-ber of 9.7 years (SD ¼ 5.4) of music training. The musi-cally untrained group comprised 18 participants (10male, 8 female) with a mean age of 24.6 (SD ¼ 4.8) andwho did not have either music education of any sort(except for the obligatory courses in primary and sec-ondary school) or play a musical instrument. In addi-tion, we asked after the experiment how familiarparticipants were with the type of music used in theexperiment. This question was rated on a five-pointLikert scale, with 1 as not at all familiar, 3 as somewhatfamiliar, and 5 as extremely familiar. The mean rating ofthe participants in the musically trained group was 4.17(SD¼ 0.38), whereas the mean musical familiarity ratingfor the musically untrained group was 1.67 (SD ¼ 0.48).
We also tested the level of introversion/extraversionof each participant as we considered that this might bean influential factor. For this measure, we used theDutch translation of the Big Five Inventory test (Denis-sen, Geenen, Van Aken, Gosling, & Potter, 2008) provid-ing a score from 1 to 5, with 1 equalling very introvert and5 equalling very extravert. A statistical t-test indicatedthat there was no significant difference between the twogroups: for the musically trained group, (M¼ 3.49, SD¼0.62), and for the musically untrained group (M ¼ 3.51,SD ¼ 0.67), t(34) ¼ ".10, p > .05 (p ¼ .92). So, bothgroups were highly homogeneous in this respect.
Action-Perception Coupling 69
MATERIALS
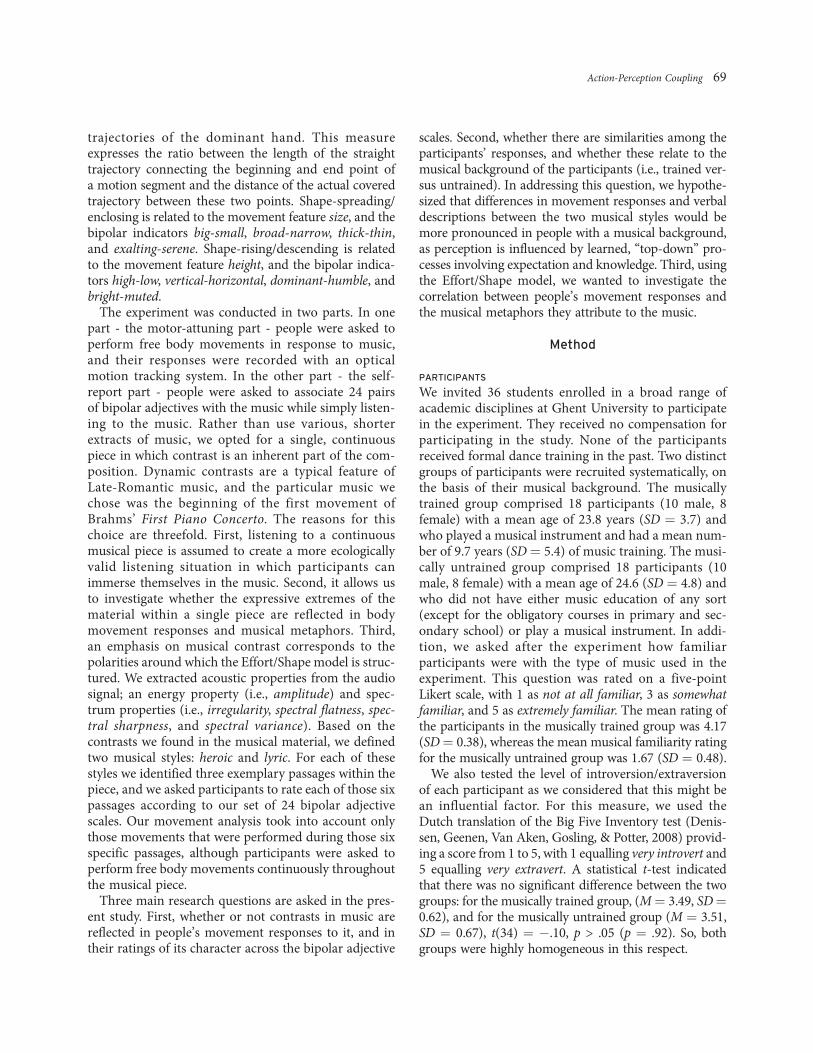
Musical stimulus. The musical stimulus that was used inthe experiment is Johannes Brahms’ First Piano Con-certo, Opus 15 in D minor from 1858. The recording weused was made by Krystian Zimmerman, accompaniedby the Berlin Philharmonic Orchestra conducted bySimon Rattle. For the experiment, we used the first 6min 10 s of the Maestoso movement (see Figure 1). Inthis excerpt three heroic passages alternate with threelyric passages (see Figure 1). The first of the lyric pas-sages is relatively long in comparison with the othertwo, so we deleted a portion of that passage (1 min56 s - 2 min 46 s of the recording), which was notevident for those unfamiliar with the piece. Thus, theeventual stimulus had a duration of 5 min 20 s. Frag-ments of equal duration were required for the move-ment analysis and self-report analysis, so we defined sixfragments with a duration of 30 s each - three heroicand three lyric, as explained above. Contrary to whatthese labels might suggest, these two categories were notdefined in terms of their expressive content, but purelyin terms of the physical acoustic properties of the audiosignal. We used the VAMP libXtract plugin (Bullock,2007, 2008) hosted in Sonic Visualizer (Cannam, Land-one, & Sandler, 2010) to extract the acoustic properties(see above). Precise details of the specific extractionmethods can be found in Bullock (2008). For eachacoustic property we obtained a continuous time seriesand then, for each one, the two distributions of sam-ples (corresponding to the heroic and lyric fragments)were statistically analyzed and compared by means ofa nonparametric Mann-Whitney U test. The results showthat the levels of amplitude, irregularity, spectral sharp-ness, and spectral variance were significantly higher in the
heroic fragments compared to lyric fragments, and thatthe levels of spectral flatness were significantly lowerin the heroic fragments compared to the lyric fragments(p < .001).
Questionnaire (self-report part). The questionnaire wasbased on the semantic differential method (Osgood,Suci, & Tannenbaum, 1957), which can be used to assesspeople’s attitudes towards all sorts of concepts, objects,events, etc. In particular, the method has proved usefulin rating people’s emotional experience of musical frag-ments (e.g., Fujihara & Tagashira, 1984; Murakami &Kroonenberg, 2003; Nielzen & Cesarec, 1981; O’Briant& Wilbanks, 1978; Senju & Ohgushi, 1987; Swanwick,1973; White & Butler, 1968). The method is based ona set of scales consisting of bipolar pairs of adjectives,placed at each end of a continuous rating scale (usuallya seven-point scale, although five-point and nine-pointscales are also used). Respondents are asked to tick one ofthe seven points in between each bipolar adjective pair,indicating the rate of association (cf. intensity) of a par-ticular concept, object, event, etc. with one of the adjec-tives (cf. direction). In our study, we used a 24-item, nine-point, semantic differential list to rate the six musicalfragments, as we were interested in small nuancesbetween different respondents. Each category in theEffort/Shape model itself is constituted by four bipolaradjective indicators (Table 1), and we chose our adjectivesfrom the Laban Movement Analysis (LMA) effort bank(http://www.lmaeffortbank.com) as well as the Hevneradjective circle. The latter presents adjectives that aresupposed to reflect the principal feelings that can beevoked in humans by listening to music (Hevner,1936). Respondents were asked to rate the six musical
0 40 80 120 160 200 240 280−1
−0.5
0
0.5
1
Am
plitu
de
Time (s)
FIGURE 1. Waveform of the musical stimulus used in the experiment (i.e., the first five minutes of the first movement of Brahms’ First PianoConcerto). The hatched regions (each 30 s long) indicate the three heroic fragments, the cross-hatched regions (each 30 s long) the three lyricfragments.
70 Pieter-Jan Maes, Edith Van Dyck, Micheline Lesaffre, Marc Leman, & Pieter M. Kroonenberg
fragments while they listened to the corresponding music.The questionnaire was administered with Qualtrics(www.qualtrics.com) running online on a MacBook Pro.
PROCEDURE
Participants took part in the experiment individually,and beforehand, they were each given an explanationof the procedure and the tasks they had to carry out.Necessarily, they were equipped with the motion cap-ture jacket and followed calibration procedure. Theorder in which the two parts of the experiment(motor-attuning part, self-report part) were executedwas counterbalanced to eliminate order effects. Bothparts of the study were carried out in the motion cap-ture space, an octagonal area of 6.5 m diameter,enclosed by black curtains in order to separate theparticipants from the experimenters. Prior to themotor-attuning part of the experiment, the partici-pants received the following instructions: ‘‘Translateyour experience of the music into free full-body move-ment. Try to become absorbed in the music that ispresented and express your feelings into body move-ment. There is no good or wrong way of doing it. Justperform what comes up in you.’’ They were allowed touse a space indicated by a round carpet, with a diameterof 4 m. We made the room completely dark, as the pilotstudy had indicated that this helped participants to feelmore comfortable and less constrained in executingtheir task. The music was played through a stereo setupcomprising two Behringer B2031A Truth Active StudioMonitors at a predefined, comfortable volume. In theself-report part of the experiment, participants filled inthe questionnaire at a table adjacent to the carpet. Theywere asked to fill in the questionnaire while listening tothe music. Again, the room was darkened and the sameplayback system was used, just as in the motor-attuning part of the experiment. Participants wereinstructed to tick one of the nine points between eachbipolar adjective pair, indicating the level of associa-tion they perceived between the descriptors and eachof the musical fragments. The order of the musicalfragments was counterbalanced, to avoid order effects.From beginning to end, each experiment lasted forabout one hour, at the end of which people were askedto fill in an exit questionnaire about their experience ofthe experiment. Finally, participants were offeredrefreshments while the experimenters explained thepurpose of the experiment.
MOVEMENT DATA ACQUISITION (MOTOR-ATTUNING PART)
In our study, we focused on hand gestures. This choicewas motivated by previous research showing that the
hands play a privileged role in music-induced gestures(Godøy, 2010). Three-dimensional movements of bothhands were captured with an OPTITRACK infraredoptical system consisting of 12 synchronized camerasand recorded with the ARENA motion capture software(http://www.naturalpoint.com). Participants were askedto wear a special jacket on which markers could beattached with Velcro. A default human upper body skel-eton model provided in the ARENA software was con-structed from 19 infrared reflecting markers that wereattached to the jacket in a predefined manner: fourmarkers for the hip and three markers for the chest,upper arms, and hands. Following the testing phase,data from the performances of all participants wereexported into BioVision Hierarchy (BVH) files. Usingthe MATLAB motion capture toolbox (http://www.cs.man.ac.uk/~neill/mocap) complemented with our ownalgorithms, we calculated the three-dimensional posi-tion and displacement of both hands in reference to thebody-center (the center of the hips) independent of howthe participant is positioned or orientated relative to themotion capture space. The selection and calculation ofthe individual movement features (acceleration, impul-siveness, smoothness error, jerk, directness index, size,height) was based on previous studies applying theEffort/Shape model in the study of human movementbehavior (Camurri et al., 2004; Petersen, 2008; VanDyck, Maes, Hargreaves, Lesaffre, & Leman, 2013). Afull description of the different features and the proce-dures used to calculate them is presented in Van Dycket al. (2013). Accordingly, for each subject (N ¼ 36) weobtained a single-value measure per musical style foreach of the seven movement features. With these data,we drew up seven 36 # 2 (i.e., participants # styles)matrices for further statistical analysis.
Results
MOTOR-ATTUNING TASK: MOVEMENT ANALYSIS
The seven 36 # 2 matrices representing the generalmeasures of all movement features were integrated ina 2 # 2 # 2 mixed-design ANOVA, with musical back-ground (musically trained/untrained), and task order(first motor-attuning/self-report) as between-subjectsfactors and musical style (heroic/lyric) as a within-subject factor. The dependent variable, movementresponse, is in fact constituted by multiple dependentmeasures related to the different movement featuresunder consideration (i.e., acceleration, impulsiveness,jerk, smoothness error, directness index, size, height).The main question concerns the effect of these depen-dent variables on changes within the two groups,
Action-Perception Coupling 71
rather than intercorrelations between the outcomevariables. Therefore, it is appropriate to apply multipleunivariate analyses on each of the dependent variables(ANOVA) instead of using a single multivariate anal-ysis (MANOVA) (cf. Huberty & Morris, 1989; Park &Schutz, 2006).
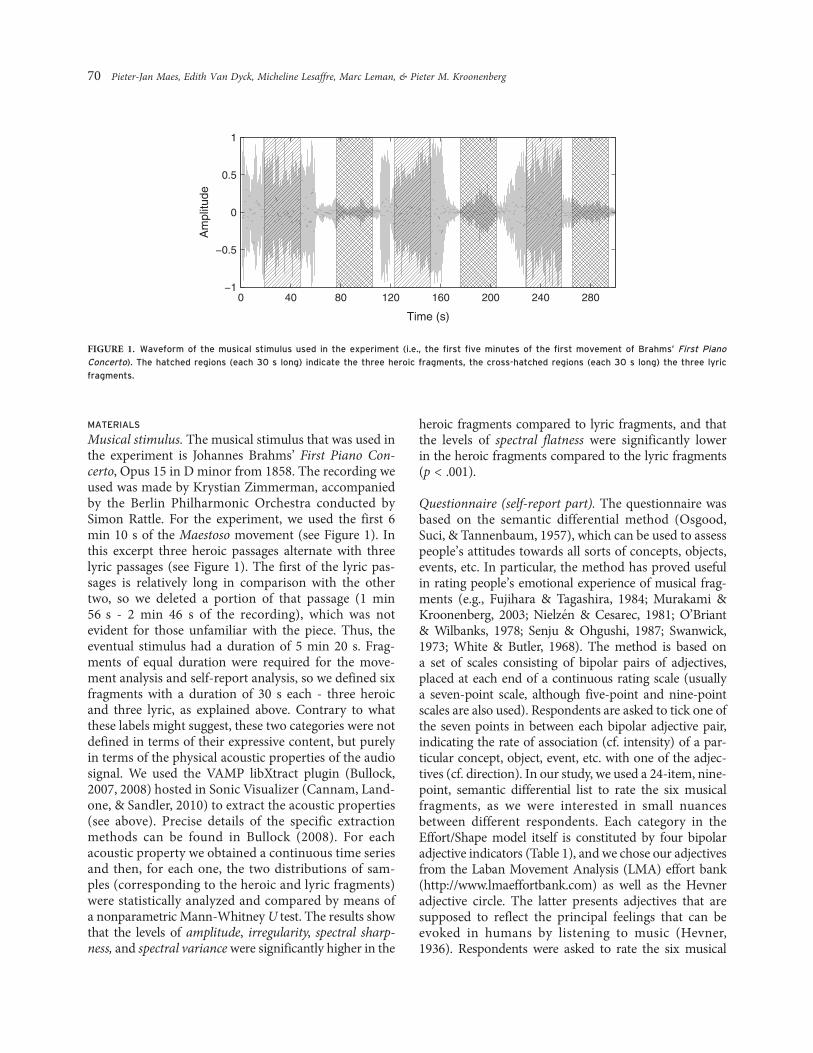
Kolmogorov-Smirnov and Levene’s tests showed thatthe assumptions of normality and homogeneity of var-iance could be accepted for all features (p > .05). Alleffects displayed in Figure 2 are reported as significantat p < .001. There was a significant main effect of musi-cal style for acceleration, F(1, 34) ¼ 163.42, r ¼ .91,impulsiveness, F(1, 34) ¼ 187.96, r ¼ .92, jerk, F(1, 34)¼ 171.36, r ¼ .91, smoothness error, F(1, 34) ¼ 124.50,r ¼ .89, directness index, F(1, 34) ¼ 125.38, r ¼ .89, size,F(1, 34) ¼ 124.84, r ¼ .89, and height, F(1, 34) ¼ 75.48,r ¼ .83. These results revealed that, in the lyric condition(M ¼ 0.79, SD ¼ 0.06), the level of the directness indexwas higher than in the heroic condition (M¼ 0.60, SD¼0.11). In addition, in the heroic condition, levels of accel-eration (M¼ 0.06, SD¼ 0.02), impulsiveness (M¼ 4.44,SD ¼ 1.51), jerk (M ¼ 0.005, SD ¼ 0.002), smoothnesserror (M¼ 0.06, SD¼ 0.03), size (M¼ 0.90, SD¼ 0.12),and height (M¼ 0.32, SD¼ 0.15) were higher comparedto the lyric condition (acceleration: M¼ 0.02, SD¼ 0.01;impulsiveness: M ¼ 1.73, SD ¼ 0.74; jerk: M ¼ 0.002,SD¼ 0.001; smoothness error: M¼ 0.02, SD¼ 0.01, size:M ¼ 0.76, SD ¼ 0.11; height: M ¼ 0.17, SD ¼ 0.14).
Regarding musical background, significant effectswere found for size, F(1, 34) ¼ 4.60, p < .05, r ¼ .34,and height, F(1, 34) ¼ 7.60, p < .01, r ¼ .43: results forthe musically trained group (size: M ¼ 0.87, SD ¼ 0.12;height: M¼ 0.30, SD¼ 0.14) were higher than those forthe musically untrained group (size: M ¼ 0.79, SD ¼0.14; height: M ¼ 0.19, SD ¼ 0.17). However, no sucheffect was found for acceleration, F(1, 34) ¼ 1.77, r ¼.22, impulsiveness, F(1, 34) ¼ 1.98, r ¼ .23, jerk, F(1,34) ¼ 1.70, r ¼ .22, smoothness error, F(1, 34) ¼ 1.95,r ¼ .23, or directness index, F(1, 34) ¼ 3.41, r ¼ .30,indicating that levels for these features were to allintents and purposes the same in the musically trainedand the musically untrained group. Similarly, task orderdid not prove to be influential for acceleration, F(1, 34)< 1, r ¼ .06, impulsiveness, F(1, 34) < 1, r ¼ .03, jerk,F(1, 34) < 1, r ¼ .07, smoothness error, F(1, 34) < 1, r ¼.08, directness index, F(1, 34) < 1, r¼ .14, size, F(1, 34) <1, r ¼ .04, or height, F(1, 34) ¼ 1.05, r ¼ .17. Weobserved no significant interaction effects betweenthe musical style and musical background. The resultswere as follows: for acceleration, F(1, 34)¼ 1.80, r¼ .22;for impulsiveness, F(1, 34) ¼ 1.18, r ¼ .18; for jerk, F(1,34) ¼ 2.08, r ¼ .24; for smoothness error, F(1, 34) ¼2.08, r ¼ .24; for directness index, F(1, 34) ¼ 2.17, r ¼.24; for size, F(1, 34) < 1, r¼ .16; for height, F(1, 34) < 1,r ¼ .04. In addition, there was no significant interactioneffect between the musical style and the task order for
Height (m)Size (m)Directness Index
Smoothness error (m/sample)Jerk (m/s3)Impulsiveness (m/s2)
musically untrained group
musically trained group
Acceleration (m/s2)
HEROIC LYRICHEROIC LYRICHEROIC LYRIC
HEROIC LYRICHEROIC LYRICHEROIC LYRICHEROIC LYRIC
× 10−3
0
0.2
0.4
0.6
0.6
0.7
0.8
0.9
1
0.4
0.5
0.6
0.7
0.8
0.9
0.02
0.04
0.06
0.08
0.1
0.12
2
4
6
8
2
4
6
0.02
0.04
0.06
0.08
0.1
0.12
FIGURE 2. Representation of the means over all subjects (N ¼ 36), per group (musically trained/untrained), per condition (heroic/lyric) for all sevenmovement features.
72 Pieter-Jan Maes, Edith Van Dyck, Micheline Lesaffre, Marc Leman, & Pieter M. Kroonenberg
acceleration, F(1, 34)¼ 2.34, r¼ .22, impulsiveness, F(1,34) ¼ 1.18, r ¼ .18, jerk, F(1, 34) ¼ 2.62, r ¼ .27,smoothness error, F(1, 34) < 1, r¼ .16, directness index,F(1, 34) ¼ 3.06, r ¼ .29, size, F(1, 34) < 1, r ¼ .03, orheight, F(1, 34) < 1, r ¼ .10. Finally, we found no sig-nificant interaction between musical style, musicalbackground and task order for acceleration, F(1, 34) <1, r ¼ .16, impulsiveness, F(1, 34) < 1, r ¼ .02, jerk, F(1,34) < 1, r ¼ .15, smoothness error, F(1, 34) < 1, r ¼ .01,directness index, F(1, 34) < 1, r ¼ .13, size, F(1, 34) < 1,r ¼ .05, or height, F(1, 34) < 1, r ¼ .01.
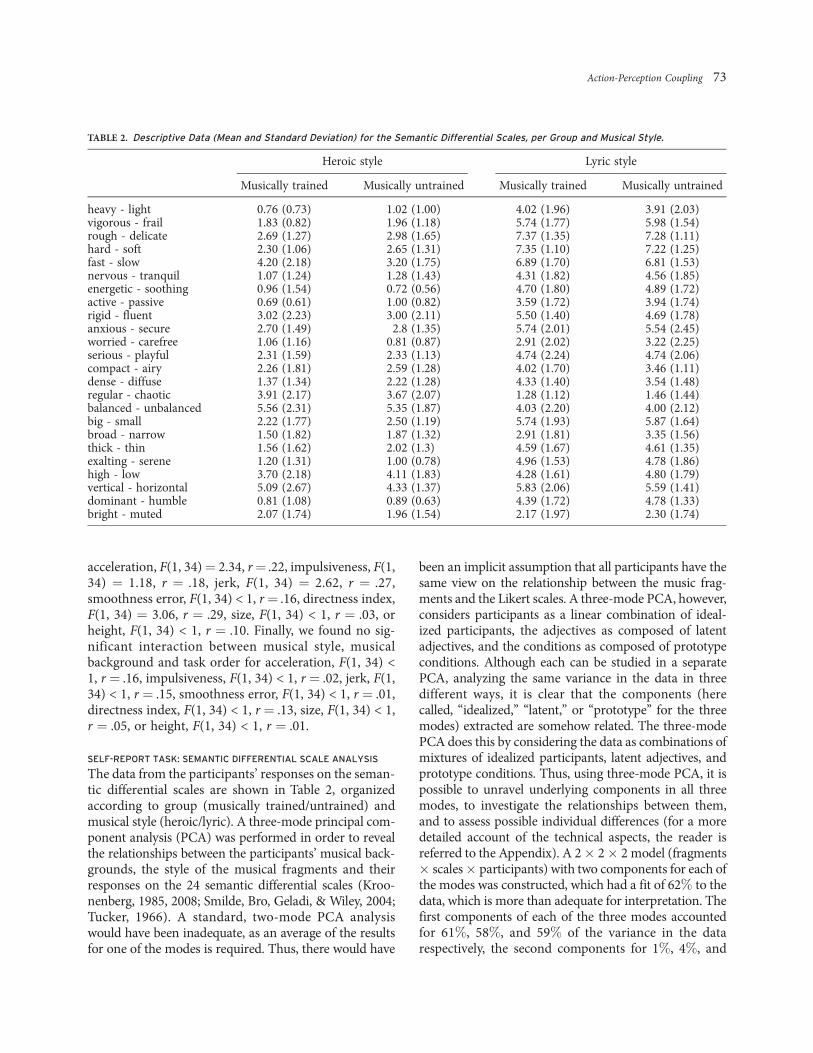
SELF-REPORT TASK: SEMANTIC DIFFERENTIAL SCALE ANALYSIS
The data from the participants’ responses on the seman-tic differential scales are shown in Table 2, organizedaccording to group (musically trained/untrained) andmusical style (heroic/lyric). A three-mode principal com-ponent analysis (PCA) was performed in order to revealthe relationships between the participants’ musical back-grounds, the style of the musical fragments and theirresponses on the 24 semantic differential scales (Kroo-nenberg, 1985, 2008; Smilde, Bro, Geladi, & Wiley, 2004;Tucker, 1966). A standard, two-mode PCA analysiswould have been inadequate, as an average of the resultsfor one of the modes is required. Thus, there would have
been an implicit assumption that all participants have thesame view on the relationship between the music frag-ments and the Likert scales. A three-mode PCA, however,considers participants as a linear combination of ideal-ized participants, the adjectives as composed of latentadjectives, and the conditions as composed of prototypeconditions. Although each can be studied in a separatePCA, analyzing the same variance in the data in threedifferent ways, it is clear that the components (herecalled, ‘‘idealized,’’ ‘‘latent,’’ or ‘‘prototype’’ for the threemodes) extracted are somehow related. The three-modePCA does this by considering the data as combinations ofmixtures of idealized participants, latent adjectives, andprototype conditions. Thus, using three-mode PCA, it ispossible to unravel underlying components in all threemodes, to investigate the relationships between them,and to assess possible individual differences (for a moredetailed account of the technical aspects, the reader isreferred to the Appendix). A 2# 2# 2 model (fragments# scales# participants) with two components for each ofthe modes was constructed, which had a fit of 62% to thedata, which is more than adequate for interpretation. Thefirst components of each of the three modes accountedfor 61%, 58%, and 59% of the variance in the datarespectively, the second components for 1%, 4%, and
TABLE 2. Descriptive Data (Mean and Standard Deviation) for the Semantic Differential Scales, per Group and Musical Style.
Heroic style Lyric style
Musically trained Musically untrained Musically trained Musically untrained
heavy - light 0.76 (0.73) 1.02 (1.00) 4.02 (1.96) 3.91 (2.03)vigorous - frail 1.83 (0.82) 1.96 (1.18) 5.74 (1.77) 5.98 (1.54)rough - delicate 2.69 (1.27) 2.98 (1.65) 7.37 (1.35) 7.28 (1.11)hard - soft 2.30 (1.06) 2.65 (1.31) 7.35 (1.10) 7.22 (1.25)fast - slow 4.20 (2.18) 3.20 (1.75) 6.89 (1.70) 6.81 (1.53)nervous - tranquil 1.07 (1.24) 1.28 (1.43) 4.31 (1.82) 4.56 (1.85)energetic - soothing 0.96 (1.54) 0.72 (0.56) 4.70 (1.80) 4.89 (1.72)active - passive 0.69 (0.61) 1.00 (0.82) 3.59 (1.72) 3.94 (1.74)rigid - fluent 3.02 (2.23) 3.00 (2.11) 5.50 (1.40) 4.69 (1.78)anxious - secure 2.70 (1.49) 2.8 (1.35) 5.74 (2.01) 5.54 (2.45)worried - carefree 1.06 (1.16) 0.81 (0.87) 2.91 (2.02) 3.22 (2.25)serious - playful 2.31 (1.59) 2.33 (1.13) 4.74 (2.24) 4.74 (2.06)compact - airy 2.26 (1.81) 2.59 (1.28) 4.02 (1.70) 3.46 (1.11)dense - diffuse 1.37 (1.34) 2.22 (1.28) 4.33 (1.40) 3.54 (1.48)regular - chaotic 3.91 (2.17) 3.67 (2.07) 1.28 (1.12) 1.46 (1.44)balanced - unbalanced 5.56 (2.31) 5.35 (1.87) 4.03 (2.20) 4.00 (2.12)big - small 2.22 (1.77) 2.50 (1.19) 5.74 (1.93) 5.87 (1.64)broad - narrow 1.50 (1.82) 1.87 (1.32) 2.91 (1.81) 3.35 (1.56)thick - thin 1.56 (1.62) 2.02 (1.3) 4.59 (1.67) 4.61 (1.35)exalting - serene 1.20 (1.31) 1.00 (0.78) 4.96 (1.53) 4.78 (1.86)high - low 3.70 (2.18) 4.11 (1.83) 4.28 (1.61) 4.80 (1.79)vertical - horizontal 5.09 (2.67) 4.33 (1.37) 5.83 (2.06) 5.59 (1.41)dominant - humble 0.81 (1.08) 0.89 (0.63) 4.39 (1.72) 4.78 (1.33)bright - muted 2.07 (1.74) 1.96 (1.54) 2.17 (1.97) 2.30 (1.74)
Action-Perception Coupling 73
3%. For the purposes of this experiment, we were inter-ested in (1) the participants’ global consensus about thecharacterization of the musical fragments in terms of thesemantic differential scales, and (2) the individual differ-ences with respect to this consensus characterization whichis expressed via the second component of the participants.The high consensus among the participants (61% varianceaccounted for) dominates the perceived relationshipsbetween the scales and the fragments. However, as indi-cated below, there are different views for a limited numberof participants with respect to some scale-fragment com-binations which are worth to pursue even though they onlyrepresent 1% variance accounted for. For instance, a possi-ble difference between musically trained and untrainedparticipants can be evaluated in this way.
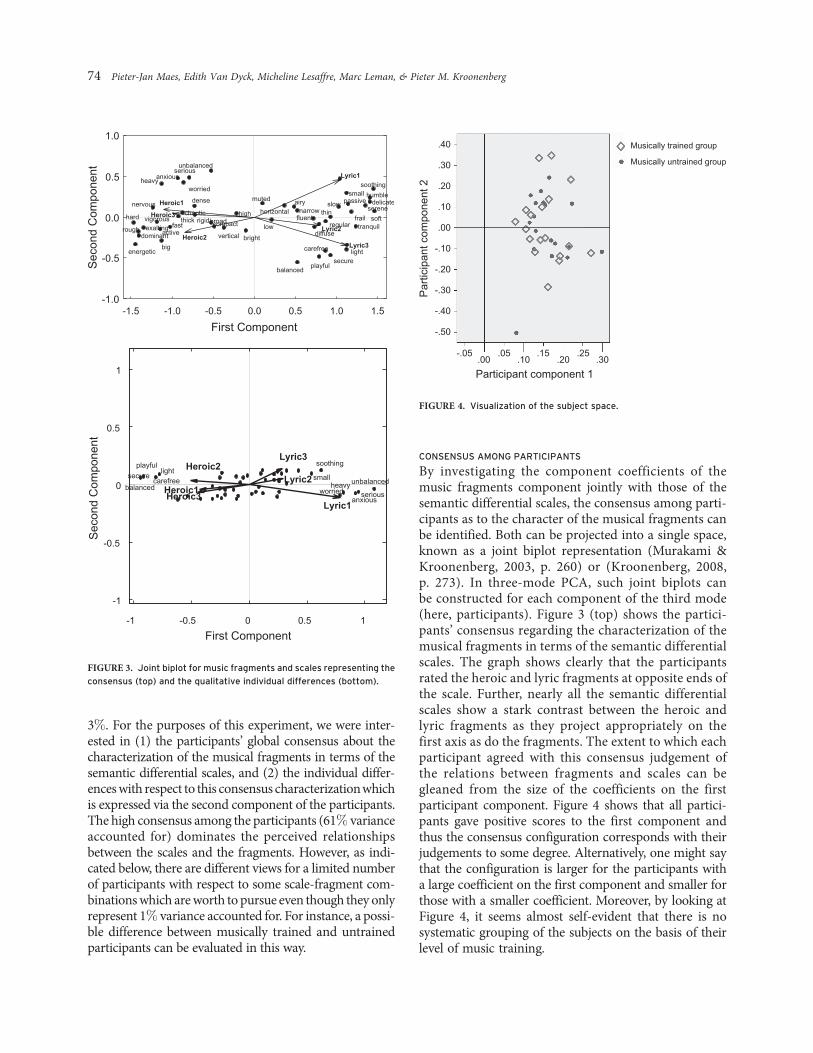
CONSENSUS AMONG PARTICIPANTS
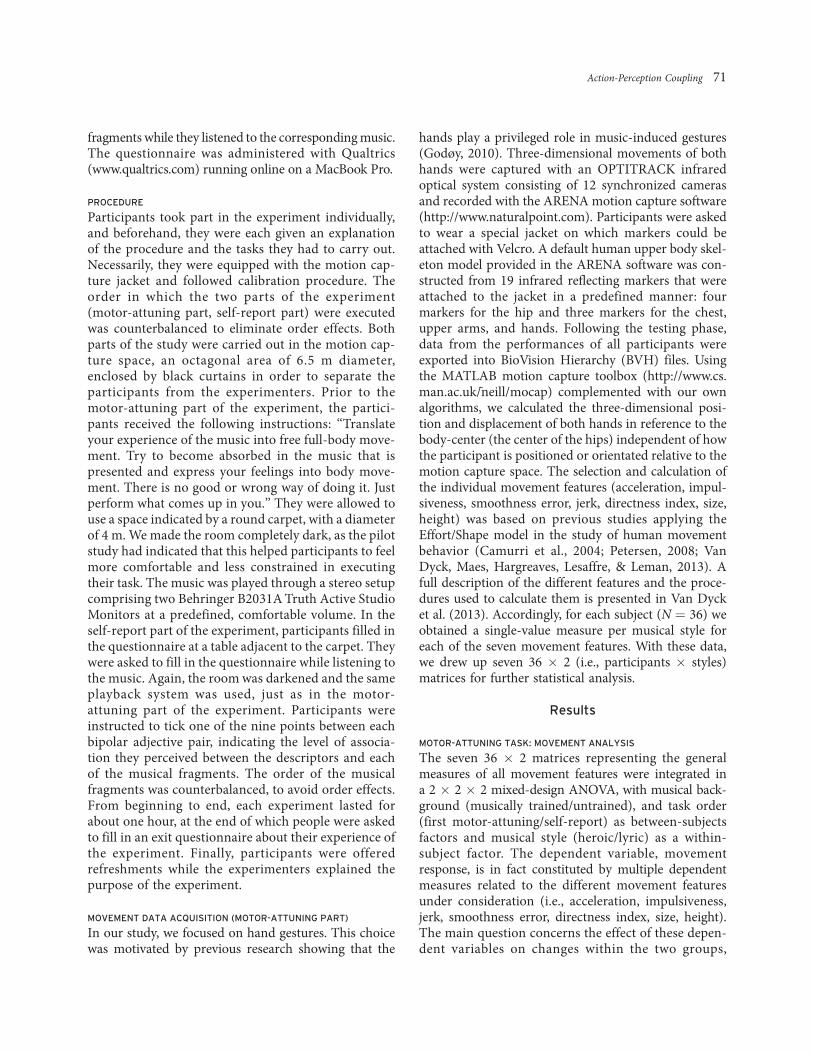
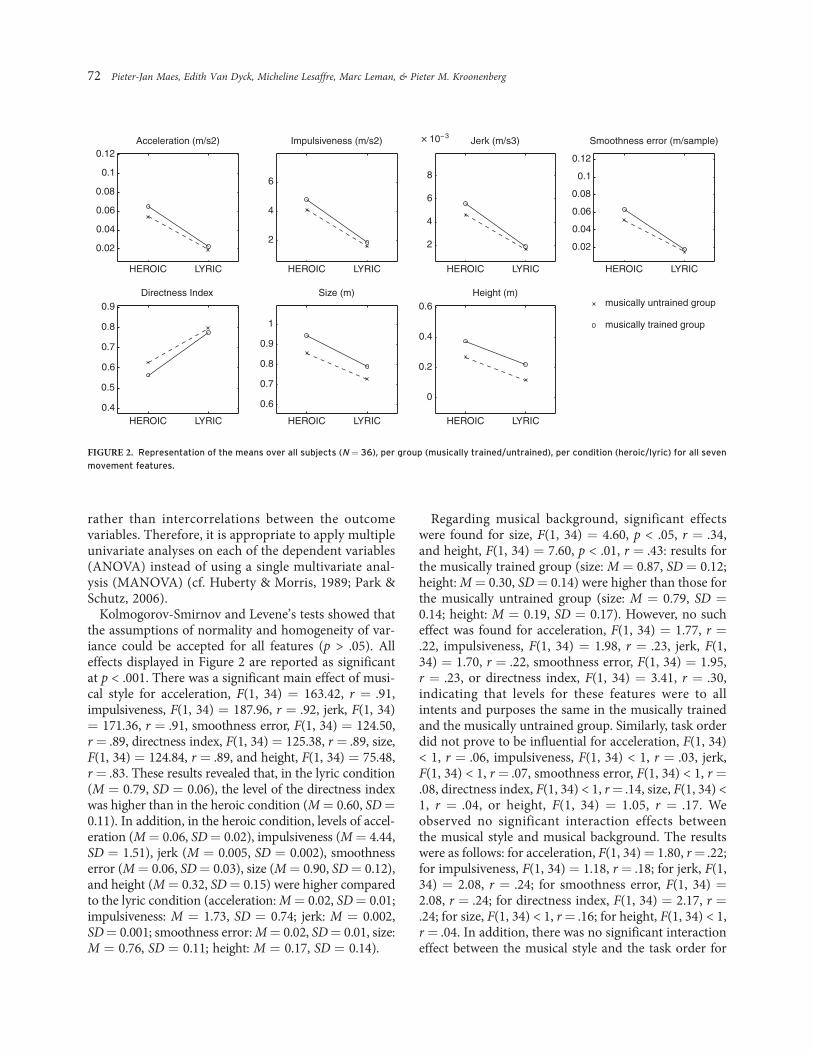
By investigating the component coefficients of themusic fragments component jointly with those of thesemantic differential scales, the consensus among parti-cipants as to the character of the musical fragments canbe identified. Both can be projected into a single space,known as a joint biplot representation (Murakami &Kroonenberg, 2003, p. 260) or (Kroonenberg, 2008,p. 273). In three-mode PCA, such joint biplots canbe constructed for each component of the third mode(here, participants). Figure 3 (top) shows the partici-pants’ consensus regarding the characterization of themusical fragments in terms of the semantic differentialscales. The graph shows clearly that the participantsrated the heroic and lyric fragments at opposite ends ofthe scale. Further, nearly all the semantic differentialscales show a stark contrast between the heroic andlyric fragments as they project appropriately on thefirst axis as do the fragments. The extent to which eachparticipant agreed with this consensus judgement ofthe relations between fragments and scales can begleaned from the size of the coefficients on the firstparticipant component. Figure 4 shows that all partici-pants gave positive scores to the first component andthus the consensus configuration corresponds with theirjudgements to some degree. Alternatively, one might saythat the configuration is larger for the participants witha large coefficient on the first component and smaller forthose with a smaller coefficient. Moreover, by looking atFigure 4, it seems almost self-evident that there is nosystematic grouping of the subjects on the basis of theirlevel of music training.
FIGURE 3. Joint biplot for music fragments and scales representing theconsensus (top) and the qualitative individual differences (bottom).
.40
.30
.20
.10
.00
.00.05
.10.15
.20.25
.30
-.10
-.20
-.30
-.40
-.50
-.05
FIGURE 4. Visualization of the subject space.
74 Pieter-Jan Maes, Edith Van Dyck, Micheline Lesaffre, Marc Leman, & Pieter M. Kroonenberg
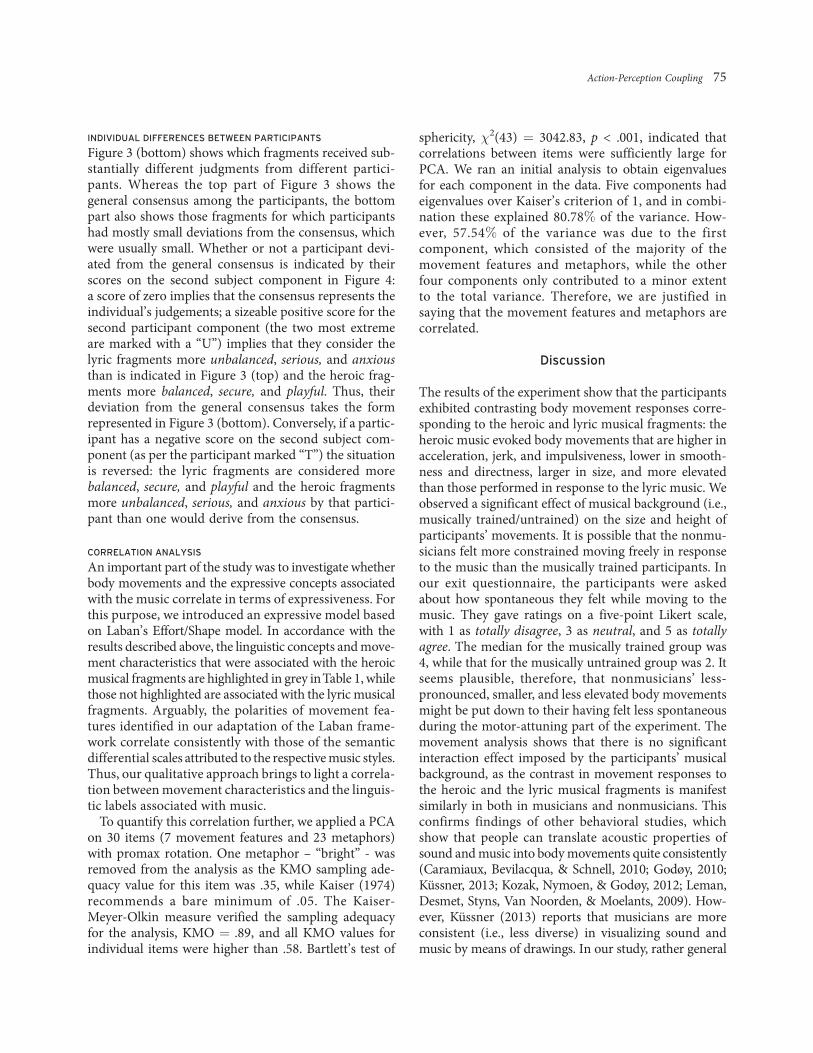
INDIVIDUAL DIFFERENCES BETWEEN PARTICIPANTS
Figure 3 (bottom) shows which fragments received sub-stantially different judgments from different partici-pants. Whereas the top part of Figure 3 shows thegeneral consensus among the participants, the bottompart also shows those fragments for which participantshad mostly small deviations from the consensus, whichwere usually small. Whether or not a participant devi-ated from the general consensus is indicated by theirscores on the second subject component in Figure 4:a score of zero implies that the consensus represents theindividual’s judgements; a sizeable positive score for thesecond participant component (the two most extremeare marked with a ‘‘U’’) implies that they consider thelyric fragments more unbalanced, serious, and anxiousthan is indicated in Figure 3 (top) and the heroic frag-ments more balanced, secure, and playful. Thus, theirdeviation from the general consensus takes the formrepresented in Figure 3 (bottom). Conversely, if a partic-ipant has a negative score on the second subject com-ponent (as per the participant marked ‘‘T’’) the situationis reversed: the lyric fragments are considered morebalanced, secure, and playful and the heroic fragmentsmore unbalanced, serious, and anxious by that partici-pant than one would derive from the consensus.
CORRELATION ANALYSIS
An important part of the study was to investigate whetherbody movements and the expressive concepts associatedwith the music correlate in terms of expressiveness. Forthis purpose, we introduced an expressive model basedon Laban’s Effort/Shape model. In accordance with theresults described above, the linguistic concepts and move-ment characteristics that were associated with the heroicmusical fragments are highlighted in grey inTable 1, whilethose not highlighted are associated with the lyric musicalfragments. Arguably, the polarities of movement fea-tures identified in our adaptation of the Laban frame-work correlate consistently with those of the semanticdifferential scales attributed to the respective music styles.Thus, our qualitative approach brings to light a correla-tion between movement characteristics and the linguis-tic labels associated with music.
To quantify this correlation further, we applied a PCAon 30 items (7 movement features and 23 metaphors)with promax rotation. One metaphor – ‘‘bright’’ - wasremoved from the analysis as the KMO sampling ade-quacy value for this item was .35, while Kaiser (1974)recommends a bare minimum of .05. The Kaiser-Meyer-Olkin measure verified the sampling adequacyfor the analysis, KMO ¼ .89, and all KMO values forindividual items were higher than .58. Bartlett’s test of
sphericity, !2(43) ¼ 3042.83, p < .001, indicated thatcorrelations between items were sufficiently large forPCA. We ran an initial analysis to obtain eigenvaluesfor each component in the data. Five components hadeigenvalues over Kaiser’s criterion of 1, and in combi-nation these explained 80.78% of the variance. How-ever, 57.54% of the variance was due to the firstcomponent, which consisted of the majority of themovement features and metaphors, while the otherfour components only contributed to a minor extentto the total variance. Therefore, we are justified insaying that the movement features and metaphors arecorrelated.
Discussion
The results of the experiment show that the participantsexhibited contrasting body movement responses corre-sponding to the heroic and lyric musical fragments: theheroic music evoked body movements that are higher inacceleration, jerk, and impulsiveness, lower in smooth-ness and directness, larger in size, and more elevatedthan those performed in response to the lyric music. Weobserved a significant effect of musical background (i.e.,musically trained/untrained) on the size and height ofparticipants’ movements. It is possible that the nonmu-sicians felt more constrained moving freely in responseto the music than the musically trained participants. Inour exit questionnaire, the participants were askedabout how spontaneous they felt while moving to themusic. They gave ratings on a five-point Likert scale,with 1 as totally disagree, 3 as neutral, and 5 as totallyagree. The median for the musically trained group was4, while that for the musically untrained group was 2. Itseems plausible, therefore, that nonmusicians’ less-pronounced, smaller, and less elevated body movementsmight be put down to their having felt less spontaneousduring the motor-attuning part of the experiment. Themovement analysis shows that there is no significantinteraction effect imposed by the participants’ musicalbackground, as the contrast in movement responses tothe heroic and the lyric musical fragments is manifestsimilarly in both in musicians and nonmusicians. Thisconfirms findings of other behavioral studies, whichshow that people can translate acoustic properties ofsound and music into body movements quite consistently(Caramiaux, Bevilacqua, & Schnell, 2010; Godøy, 2010;Kussner, 2013; Kozak, Nymoen, & Godøy, 2012; Leman,Desmet, Styns, Van Noorden, & Moelants, 2009). How-ever, Kussner (2013) reports that musicians are moreconsistent (i.e., less diverse) in visualizing sound andmusic by means of drawings. In our study, rather general
Action-Perception Coupling 75
measures of expressive movement behavior (up to thelevel of individual gesture segments) were taken intoaccount, and thereby, data captured over large time scaleswere reduced to single-value measures. Thus, specificdynamic processes over time were cancelled out. Func-tional data analysis (FDA) could provide a valuable alter-native as it can model data, drawn from continuousprocesses, as functions of time. This approach enablesus to reveal underlying dynamic processes and couldprovide the means for further investigation of the con-sistency and diversity of movement behavior in responseto music.
The results of the analysis of the semantic differen-tial scales show that the heroic and lyric fragmentswere associated with opposite adjectives in terms ofexpressive quality. Moreover, a high degree of consen-sus among the participants’ responses was found, withno differentiation between musicians and nonmusi-cians. This finding could be related to the work ofBigand and colleagues, who report that emotionalresponses to music are stable and only weakly influencedby musical expertise (Bigand & Poulin-Charronnat, 2006;Bigand, Vieillard, Madurell, Marozeau, & Dacquet, 2005).Possibly, this can be explained by the fact that nowadayspeople are exposed to music on a regular basis, oftensimilar to that used in the experiment, in variouseveryday-life contexts (film, television, etc.). This allowspeople to develop a specific attitude towards expressionof the music.
Currently, there are very few studies explicitly ad-dressing how body movements performed in responseto music might be related to people’s descriptions of musi-cal expressivity and emotion (Maes et al., 2010; Sievers,Polansky, Casey, & Wheatley, 2013). For that purpose, weintroduced a dimensional model, enabling us to com-pare body movement features and linguistic labelsbased on their underlying expressive qualities. Thesequalities were defined in terms of the taxonomy out-lined in Laban’s Effort/Shape model. As explainedabove, the polarities of the movement features correlateconsistently with those of the semantic differentialscales, in relation the different musical styles. Consideringthe semantic differential scales, the model was stronglyconfirmed for the categories Effort-weight, Effort-time,Effort-flow, and Shape-spreading/enclosing. For the cate-gory Shape-rising/descending, we observed a tendencytowards correlation although substantially weaker. Thecategory Effort-space resulted in negative correlations forthe linguistic labels compact and dense. It could be arguedthat neither of these labels were perfectly suited for thecategory Effort-space and that this resulted in negativecorrelations. However, the overall results indicate that,
generally speaking, body movements performed inresponse to the music reflect expressive qualities similarto the linguistic labels that are associated with that music.In other words, body movements correlate with the lin-guistic labels on the level of qualities related to expressivegestures. There is, therefore, a strong basis for supportingour hypothesis that linguistic descriptions of music sharecommon grounds with the body movements that are asso-ciated with music. A grounded, modal view on cognitionand emotion could possibly explain the connectionbetween body movements in response to music andcross-domain associations of music explicated in lin-guistic descriptions (Barsalou, 2008; Lindquist, Wager,Kober, Bliss-Moreau, & Barrett, 2012). Studies have shownthat sensory, motor (Bangert et al., 2006; Chen, Penhune,& Zatorre, 2008; Haueisen & Knosche, 2001), and intro-spective (Alluri et al., 2011; Chapin, Jantzen, Kelso,Steinberg, & Large, 2010) brain areas become activatedwhen people listen to music passively. Studies have alsoindicated that the processing of action-related concepts,abstract concepts, as well as those relating to abstractemotional states recruit neural cell assemblies distributedover sensory (vision, audition, etc.), motor (movement,proprioception, etc.) and introspective (mental statesthat include affect, motivation, intentions, meta-cognition, etc.) brain areas (e.g., Aziz-Zadeh & Dama-sio, 2008; Citron, 2012; Moseley, Carota, Hauk, Mohr, &Pulvermuller, 2012). So, both listening to music, and theprocessing of concepts create, what Barsalou (1999)calls, perceptual symbols (i.e., neural networks distrib-uted over sensory, motor and introspective brain areas).It seems plausible therefore, that if both perceptual sym-bols partially overlap, that one gets associated with theother. Our study suggests that this overlap can occur, atleast partly, in motor-related processing areas.
That the general physical appearance of the move-ment responses to the music shared similar character-istics across participant groups is a highly interestingfinding, all the more because the body movements canbe related to a vocabulary of expressive qualities andconcepts. This indicates that the human body can func-tion as a nonverbal means for communicating socialmeaning, as well as emotion and intentionality in gen-eral. Further, it provides support for the idea that thehuman body functions as a mediator, turning purelysubjective phenomena (like feelings, intentions andideas) into physical phenomena (vision, audition andso on) and vice versa. Moreover, our results suggest thatthe human body plays an important role in the processof musical meaning formation, albeit not an exclusiveone. The present study shows that people’s engagementwith the music was structured around a dynamic
76 Pieter-Jan Maes, Edith Van Dyck, Micheline Lesaffre, Marc Leman, & Pieter M. Kroonenberg
contrast and tension between opposite qualities thatcould be related to expressive gestures. For the purposeof the study, the beginning of the first movement ofBrahms’ First Piano Concerto was ideally suited as itcovers all of the categories, as well as the oppositionswithin each category, of Laban’s Effort/Shape model.However, the method we have introduced, combiningthe Effort/Shape model, semantic differential scales, andthe various algorithms for the extraction of expressivemovement features, could easily be extended to othermusic as well. Moreover, it would be interesting toinvestigate whether the Effort/Shape model could beused to annotate people’s own descriptions and imageryrelated to how they perceive musical expressivity.
Based on our findings, it is tempting to conclude thatour embodied understanding of music (i.e., action)mediates the cross-domain linguistic descriptionsascribed to the music (i.e., perception). However, we canonly draw limited conclusions about the relationshipbetween action and perception. That a correlation existsbetween both does not imply that there is a causal rela-tionship. However, previous literature claims that theuse of metaphors is grounded in, and structured by,physically embodied experiences (Crawford, 2009;Gibbs et al., 2004), and in turn, this idea suggests thatmoving to music may shape people’s interpretation andunderstanding of its expressiveness. A recent study byMaes and Leman (2013) seems to support this idea. Inthis study, two groups of children were trained (condi-tioned) to perform either a happy or a sad choreographyin response to the same music, which had an expres-sively ambiguous character. Afterwards, the children’sperception of musical expressiveness was assessed interms of valence and arousal. The results suggested thatthe expressive qualities of the choreographed move-ments had a significant impact on how the childrenperceived musical expressiveness. In addition, studieshave started to devote attention to the effects that peo-ple’s body movements may exert on how they perceiveother aspects of music, like pitch (Repp & Knoblich,2009), meter (Phillips-Silver & Trainor, 2005, 2007), andmusical preference (Sedlmeier, Weigelt, & Walther, 2011).Alongside the results of the present study, it seems
increasingly evident that human motor processes area substantial - although not exclusive - part of people’sengagement with music. Moreover, these results providean argument for the development of methodologies inmusic education that exploit an active engagement ofpeople’s bodies with music.
Conclusion
In this experiment, participants were obliged to fulfiltwo tasks. First, they were to translate the musicalexpressiveness they experienced into correspondingbody movements. Second, they had to rate the perceivedassociation between the music and specific linguisticlabels. The results of the study show that contrasts inmusical style (heroic/lyric) were clearly reflected in thefree body movements made in response to the music,and that participants associated distinct sets of linguisticlabels to those musical styles. The results for both taskswere independent of the musical background of theparticipants (i.e., musically trained/untrained). More-over, it was shown that there are correlations betweenbody movement features (i.e., action) and linguisticlabels (i.e., perception) based on their underlyingexpressive qualities. This action-perception correlationcan possibly be explained by a grounded, modal view onmusic cognition and perception. However, moreresearch is required to reveal causal relationshipsbetween action and perception in musical significationprocesses.
Author Note
This work is part of the EmcoMetecca project supportedby the Flemish Government (http://www.ipem.ugent.be/EmcoMetecca). The authors want to thank Ivan Sche-pers for the technical support, and Dr. Jon Hargreavesfor the grammatical corrections.
Correspondence concerning this article should beaddressed to Pieter-Jan Maes, Department of Musicol-ogy, Ghent University, Sint-Pietersnieuwstraat 41, 9000Ghent, Belgium. E-mail: [email protected]
References
ALLURI, V., TOIVIAINEN, P., JAASKELAINEN, I., GLEREAN, E.,SAMS, M., & BRATTICO, E. (2011). Large-scale brain networksemerge from dynamic processing of musical timbre, key andrhythm. NeuroImage, 59(4), 3677-3689.
AZIZ-ZADEH, L., & DAMASIO, A. (2008). Embodied semanticsfor actions: Findings from functional brain imaging. Journal ofPhysiology, 102(1-3), 35-39.
Action-Perception Coupling 77
BANGERT, M., PESCHEL, T., SCHLAUG, G., ROTTE, M., DRESCHER,D., HINRICHS, H., HEINZE, H.-J., & ALTENMULLER, E. (2006).Shared networks for auditory and motor processing in pro-fessional pianists: Evidence from fMRI conjunction.Neuroimage, 30(3), 917-926.
BARSALOU, L. (1999). Perceptual symbol systems. Behavioral andBrain Sciences, 22(4), 577-660.
BARSALOU, L. (2008). Grounded cognition. Annual Review ofPsychology, 59, 617-645.
BIGAND, E., & POULIN-CHARRONNAT, B. (2006). Are we ‘‘expe-rienced listeners’’? A review of the musical capacities that do notdepend on formal music training. Cognition, 100(1), 100-130.
BIGAND, E., VIEILLARD, S., MADURELL, F., MAROZEAU, J., &DACQUET, A. (2005). Multidimensional scaling of emotionalresponses to music: The effect of musical expertise and of theduration of the excerpts. Cognition and Emotion, 19(8),1113-1139.
BULLOCK, J. (2007). Libxtract: A lightweight library for audiofeature extraction. In K. K Jensen (Ed.), Proceedings of theInternational Computer Music Conference (ICMC) (pp. 25-28),Copenhagen, Denmark: Re: New – Digital Arts Forum.
BULLOCK, J. (2008). Implementing audio feature extraction:implementing audio feature extraction in live electronic music(Unpublished doctoral dissertation). Birmingham CityUniversity, Birmingham, England.
CAMURRI, A., MAZZARINO, B., RICCHETTI, M., TIMMERS, R., &VOLPE, G. (2004). Multimodal analysis of expressive gesture inmusic and dance performances. In A. Camurri & G. Volpe(Eds.), Gesture-based communication in human-computerinteraction (LNCS) (Vol. 2915, pp. 357-358). Berlin, Germany:Springer-Verlag.
CANNAM, C., LANDONE, C., & SANDLER, M. (2010). Sonicvisualiser: An open source application for viewing, analysing,and annotating music audio files. In A. del Bimbo, S.-F. Chang,& A. Smeulders (Eds.). Proceedings of the InternationalConference on Multimedia (ICM) (pp. 1467-1468). Firenze,Italy. New York, NY: ACM.
CARAMIAUX, B., BEVILACQUA, F., & SCHNELL, N. (2010). Towardsa gesture-sound cross-modal analysis. In S. Kopp & I.Wachsmuth (Eds.), Gesture in embodied communication andhuman-computer interaction (LNCS) (Vol. 5934, pp. 158-170).Berlin, Germany: Springer-Verlag.
CHAPIN, H., JANTZEN, K., KELSO, J., STEINBERG, F., & LARGE, E.(2010). Dynamic emotional and neural responses to musicdepend on performance expression and listener experience.PLoS ONE, 5(12), e13812.
CHEN, J., PENHUNE, V., & ZATORRE, R. (2008). Listening tomusical rhythms recruits motor regions of the brain. CerebralCortex, 18(12), 2844-2854.
CITRON, F. (2012). Neural correlates of written emotion wordprocessing: A review of recent electrophysiological andhemodynamic neuroimaging studies. Brain and Language,122(3), 211-226.
COX, A. (2011). Embodying music: Principles of the mimetichypothesis. Music Theory Online, 17(2), 1-24.
CRAWFORD, L. (2009). Conceptual metaphors of affect. EmotionReview, 1(2), 129-139.
DENISSEN, J., GEENEN, R., VAN AKEN, M., GOSLING, S., &POTTER, J. (2008). Development and validation of a Dutchtranslation of the Big Five Inventory (BFI). Journal ofPersonality Assessment, 90(2), 152-157.
FUJIHARA, T., & TAGASHIRA, N. (1984). A multidimensionalscaling of classical music perception. Japanese Journal ofPsychology, 55(2), 75-79.
GABRIEL, K. R. (1971). The biplot graphic display of matriceswith application to principal component analysis. Biometrika,58(3), 453–467.
GIBBS, R., COSTA LIMA, P., & FRANCOZO, E. (2004). Metaphor isgrounded in embodied experience. Journal of Pragmatics,36(7), 1189-1210.
GODØY, R. (2003). Motor-mimetic music cognition. Leonardo,36(4), 317-319.
GODØY, R. (2010). Gestural affordances of musical sound. In R.Godøy & M. Leman (Eds.), Musical gestures: Sound, move-ment, and meaning. New York: Routledge.
GUCK, M. (1994). Analytical fictions. Music Theory Spectrum,16(2), 217-230.
HAUEISEN, J., & KNOSCHE, T. (2001). Involuntary motor activityin pianists evoked by music perception. Journal of CognitiveNeuroscience, 13(6), 786-792.
HEVNER, K. (1936). Experimental studies of the elements ofexpression in music. The American Journal of Psychology,48(2), 246-268.
HUBERTY, C., & MORRIS, J. (1989). Multivariate analysis versusmultiple univariate analyses. Psychological Bulletin, 105(2),302-308.
JOHNSON, M. L., & LARSON, S. (2003). ‘‘Something in the way shemoves’’-metaphors of musical motion. Metaphor and Symbol,18(2), 63-84.
KAISER, H. F. (1974). An index of factorial simplicity.Psychometrika, 39(1), 31-36.
KOZAK, M., NYMOEN, K., & GODØY, R. I. (2012). Effects ofspectral features of sound on gesture type and timing. InE. Efthimiou, G. Kouroupetroglou, & S.-E. F. (Eds.), Gestureand sign language in human-computer interaction andembodied communication (LNAI) (Vol. 7206, pp. 69-80).Berlin, Germany: Springer-Verlag.
78 Pieter-Jan Maes, Edith Van Dyck, Micheline Lesaffre, Marc Leman, & Pieter M. Kroonenberg
KROONENBERG, P. M. (1983). Three-mode principal componentanalysis: Theory and applications. Leiden, The Netherlands:DSWO Press.
KROONENBERG, P. (1985). Three-mode principal componentsanalysis of semantic differential data: The case of a triple per-sonality. Applied Psychological Measurement, 9(1), 83-94.
KROONENBERG, P. M. (1995). Introduction to biplots for G#Etables (Research report No. 51). Brisbane, Australia: Centre forStatistics, University of Queensland.
KROONENBERG, P. (2008). Applied multiway data analysis.Hoboken, NJ: John Wiley & Sons.
KRUEGER, J. (2009). Enacting musical experience. Journal ofConsciousness Studies, 16(2-3), 98-123.
KUSSNER, M. B. (2013). Music and shape. Literary and LinguisticComputing, 28(3), 472-479.
LABAN, R. (1947). Effort. London, UK: MacDonald & Evans.LABAN, R., & ULLMANN, L. (2011). Choreutics. Hampshire, UK:
Dance Books Ltd. (Original work published 1966)LARSON, S. (2012). Musical forces: Motion, metaphor, and
meaning in music. Bloomington, IN: Indiana University Press.LEMAN, M. (2007). Embodied music cognition and mediation
technology. Cambridge, MA: MIT Press.LEMAN, M., DESMET, F., STYNS, F., VAN NOORDEN, L., &
MOELANTS, D. (2009). Sharing musical expression throughembodied listening: a case study based on Chinese Guqinmusic. Music Perception, 26(3), 263-278.
LEVINSON, J. (2006). Contemplating art: Essays in aesthetics. NewYork: Oxford University Press.
LINDQUIST, K., WAGER, T., KOBER, H., BLISS-MOREAU, E., &BARRETT, L. (2012). The brain basis of emotion: A meta-analytic review. Behavioral and Brain Sciences, 35(3), 121-202.
MAES, P.-J., & LEMAN, M. (2013). The influence of bodymovements on children’s perception of music with anambiguous expressive character. PLoS ONE, 8(1), e54682.
MAES, P.-J., LEMAN, M., LESAFFRE, M., DEMEY, M., & MOELANTS,D. (2010). From expressive gesture to sound: The development ofan embodied mapping trajectory inside a musical interface.Journal on Multimodal User Interfaces, 3(1-2), 67-78.
MAUS, F. (1988). Music as drama. Music Theory Spectrum, 10,56-73.
MEAD, A. (1999). Bodily hearing: Physiological metaphors andmusical understanding. Journal of Music Theory, 43(1), 1-19.
MOSELEY, R., CAROTA, F., HAUK, O., MOHR, B., &PULVERMULLER, F. (2012). A role for the motor system inbinding abstract emotional meaning. Cerebral Cortex, 22(7),1634-1647.
MURAKAMI, T., & KROONENBERG, P. (2003). Three-mode modelsand individual differences in semantic differential data.Multivariate Behavioral Research, 38(2), 247-283.
NIELZEN, S., & CESAREC, Z. (1981). On the perception of emo-tional meaning in music. Psychology of Music, 9(2), 17-31.
O’BRIANT, M., & WILBANKS, W. (1978). The effect of context onthe perception of music. Bulletin of the Psychonomic Society,12(6), 441-441.
OSGOOD, C., SUCI, G., & TANNENBAUM, P. (1957). The mea-surement of meaning (Vol. 47). Urbana, IL: University ofIllinois Press.
PARK, I., & SCHUTZ, R. (2006). Repeated measures and longi-tudinal data analysis. In T. Wood & W. Zhu (Eds.),Measurement theory and practice in kinesiology. Champaign,IL: Human Kinetics Publishers.
PETERSEN, D. (2008). Space, time, weight, and flow: Suggestionsfor enhancing assessment of creative movement. PhysicalEducation and Sport Pedagogy, 13(2), 191-198.
PHILLIPS-SILVER, J., & TRAINOR, L. J. (2005). Feeling the beat:Movement influences infant rhythm perception. Science,308(5727), 1430.
PHILLIPS-SILVER, J., & TRAINOR, L. J. (2007). Hearing what thebody feels: Auditory encoding and rhythmic movement.Cognition, 105, 533-546.
REPP, B. H., & KNOBLICH, G. (2009). Performed or observedkeyboard actions affect pianists’ judgments of relative pitch.Quarterly Journal of Experimental Psychology, 62(11),2156-2170.
SEDLMEIER, P., WEIGELT, O., & WALTHER, E. (2011). Music is inthe muscle: How embodied cognition may influence musicpreferences. Music Perception, 28, 297-306.
SENJU, M., & OHGUSHI, K. (1987). How are the player’sideas conveyed to the audience? Music Perception, 4,311-323.
SIEVERS, B., POLANSKY, L., CASEY, M., & WHEATLEY, T. (2013).Music and movement share a dynamic structure that supportsuniversal expressions of emotion. Proceedings of the NationalAcademy of Sciences, 110(1), 70-75.
SMILDE, A., BRO, R., GELADI, P., & WILEY, J. (2004). Multi-wayanalysis with applications in the chemical sciences (Vol. 978).Hoboken, NJ: Wiley Online Library.
SWANWICK, K. (1973). Musical cognition and aesthetic response.Bulletin of the British Psychological Society, 1(2), 7-13.
TODOROV, E., & JORDAN, M. (1998). Smoothness maximizationalong a predefined path accurately predicts the speed profilesof complex arm movements. Journal of Neurophysiology, 80(2),696-714.
TUCKER, L. (1966). Some mathematical notes on three-modefactor analysis. Psychometrika, 31(3), 279-311.
VAN DYCK, E., MAES, P. J., HARGREAVES, J., LESAFFRE, M., &LEMAN, M. (2013). Expressing induced emotions throughfree dance movement. Journal of Nonverbal Behavior, 37(3),175-190.
WHITE, W., & BUTLER, J. (1968). Classifying meaning incontemporary music. The Journal of Psychology, 70,261-266.
Action-Perception Coupling 79
Appendix
DATA STRUCTURE AND RESEARCH QUESTIONS
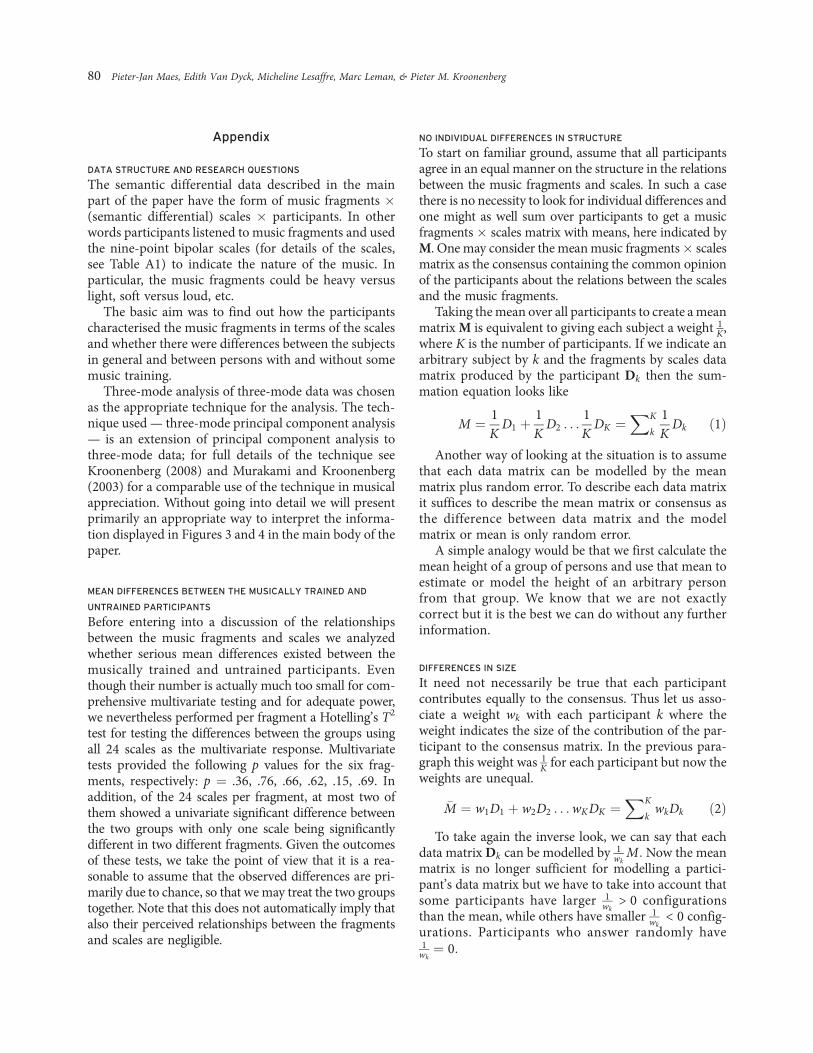
The semantic differential data described in the mainpart of the paper have the form of music fragments #(semantic differential) scales # participants. In otherwords participants listened to music fragments and usedthe nine-point bipolar scales (for details of the scales,see Table A1) to indicate the nature of the music. Inparticular, the music fragments could be heavy versuslight, soft versus loud, etc.
The basic aim was to find out how the participantscharacterised the music fragments in terms of the scalesand whether there were differences between the subjectsin general and between persons with and without somemusic training.
Three-mode analysis of three-mode data was chosenas the appropriate technique for the analysis. The tech-nique used — three-mode principal component analysis— is an extension of principal component analysis tothree-mode data; for full details of the technique seeKroonenberg (2008) and Murakami and Kroonenberg(2003) for a comparable use of the technique in musicalappreciation. Without going into detail we will presentprimarily an appropriate way to interpret the informa-tion displayed in Figures 3 and 4 in the main body of thepaper.
MEAN DIFFERENCES BETWEEN THE MUSICALLY TRAINED AND
UNTRAINED PARTICIPANTS
Before entering into a discussion of the relationshipsbetween the music fragments and scales we analyzedwhether serious mean differences existed between themusically trained and untrained participants. Eventhough their number is actually much too small for com-prehensive multivariate testing and for adequate power,we nevertheless performed per fragment a Hotelling’s T2
test for testing the differences between the groups usingall 24 scales as the multivariate response. Multivariatetests provided the following p values for the six frag-ments, respectively: p ¼ .36, .76, .66, .62, .15, .69. Inaddition, of the 24 scales per fragment, at most two ofthem showed a univariate significant difference betweenthe two groups with only one scale being significantlydifferent in two different fragments. Given the outcomesof these tests, we take the point of view that it is a rea-sonable to assume that the observed differences are pri-marily due to chance, so that we may treat the two groupstogether. Note that this does not automatically imply thatalso their perceived relationships between the fragmentsand scales are negligible.
NO INDIVIDUAL DIFFERENCES IN STRUCTURE
To start on familiar ground, assume that all participantsagree in an equal manner on the structure in the relationsbetween the music fragments and scales. In such a casethere is no necessity to look for individual differences andone might as well sum over participants to get a musicfragments # scales matrix with means, here indicated byM. One may consider the mean music fragments# scalesmatrix as the consensus containing the common opinionof the participants about the relations between the scalesand the music fragments.
Taking the mean over all participants to create a meanmatrix M is equivalent to giving each subject a weight 1
K,where K is the number of participants. If we indicate anarbitrary subject by k and the fragments by scales datamatrix produced by the participant Dk then the sum-mation equation looks like
M ¼ 1K
D1 þ1K
D2 . . .1K
DK ¼XK
k
1K
Dk ð1Þ
Another way of looking at the situation is to assumethat each data matrix can be modelled by the meanmatrix plus random error. To describe each data matrixit suffices to describe the mean matrix or consensus asthe difference between data matrix and the modelmatrix or mean is only random error.
A simple analogy would be that we first calculate themean height of a group of persons and use that mean toestimate or model the height of an arbitrary personfrom that group. We know that we are not exactlycorrect but it is the best we can do without any furtherinformation.
DIFFERENCES IN SIZE
It need not necessarily be true that each participantcontributes equally to the consensus. Thus let us asso-ciate a weight wk with each participant k where theweight indicates the size of the contribution of the par-ticipant to the consensus matrix. In the previous para-graph this weight was 1
K for each participant but now theweights are unequal.
!M ¼ w1D1 þ w2D2 . . . wK DK ¼XK
kwkDk ð2Þ
To take again the inverse look, we can say that eachdata matrix Dk can be modelled by 1
wkM: Now the mean
matrix is no longer sufficient for modelling a partici-pant’s data matrix but we have to take into account thatsome participants have larger 1
wk> 0 configurations
than the mean, while others have smaller 1wk
< 0 config-urations. Participants who answer randomly have1
wk¼ 0:
80 Pieter-Jan Maes, Edith Van Dyck, Micheline Lesaffre, Marc Leman, & Pieter M. Kroonenberg
In our length analogy we could try to predict thelength of a person on the basis of the mean length overall persons to get a better estimate for the real length. Tomodel the difference in length we multiply the meanlength for each participant with some coefficient wk.
DIFFERENCES IN QUALITY
In practice there are more differences between partici-pants than only differences in size. There are generallyalso difference in quality. Some participants have adifferent interpretation or evaluation of the relationbetween the soft – hard and the light – dark contrastsfor particular music fragments. They agree overall withthe consensus but for these fragments they consider thetwo contrasts more appropriate than one could bedescribed by the consensus alone. In component anal-ysis such effects show up as an additional component.This additional component for the participants has anadditional matrix M2 associated with it.
!M2 ¼ v1D1 þ v2D2 . . . vK DK ¼XK
kvkDk ð3Þ
Thus M2 is constituted with different weights, wherea small weight for a participant means that his or her
data do not contribute to the construction of the addi-tional mean-like matrix.
If we look at the inverse problem of estimating theoriginal scores from the model information we canmodel the data of a participant k by adding the meanand the mean-like matrix with different weights. Weshould choose these weights in such a way that thedifference between the data and the weighted sum ofthe two mean matrices is as small as possible.
In the (imperfect) length analogy in the case when wehave men and women, we try to find a coefficient tomultiply the mean with and one to apply to the typicaldeviation, for instance the average deviation over per-sons. The length of a man m1 is thus lengthm1 ¼ 1
wm1#
MeanLengthþ 1vm1#Typical deviationþ errorm1 and for
a woman v1 this is lengthv1 ¼ 1wv1#MeanLengthþ 1
vv1#
Typical deviationþerrorv1, where vm1 is positive and vv1 isnegative because on average men are taller than womenand thus we predict a higher weight.
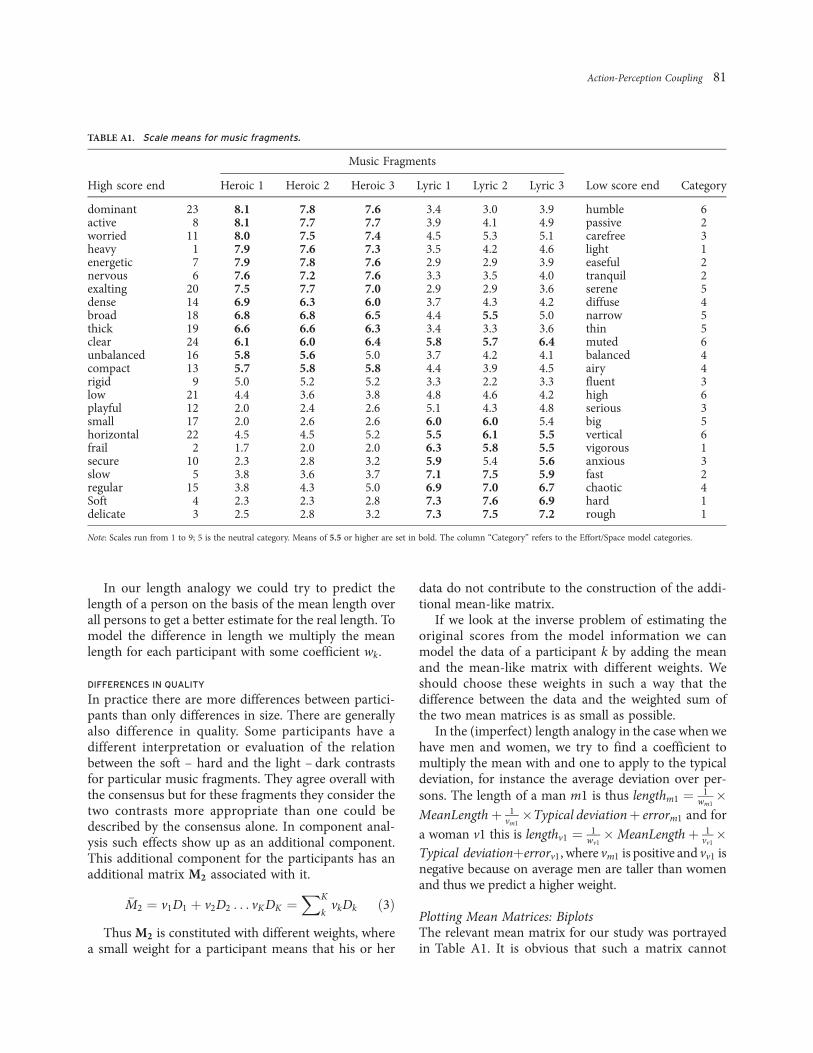
Plotting Mean Matrices: BiplotsThe relevant mean matrix for our study was portrayedin Table A1. It is obvious that such a matrix cannot
TABLE A1. Scale means for music fragments.
Music Fragments
High score end Heroic 1 Heroic 2 Heroic 3 Lyric 1 Lyric 2 Lyric 3 Low score end Category
dominant 23 8.1 7.8 7.6 3.4 3.0 3.9 humble 6active 8 8.1 7.7 7.7 3.9 4.1 4.9 passive 2worried 11 8.0 7.5 7.4 4.5 5.3 5.1 carefree 3heavy 1 7.9 7.6 7.3 3.5 4.2 4.6 light 1energetic 7 7.9 7.8 7.6 2.9 2.9 3.9 easeful 2nervous 6 7.6 7.2 7.6 3.3 3.5 4.0 tranquil 2exalting 20 7.5 7.7 7.0 2.9 2.9 3.6 serene 5dense 14 6.9 6.3 6.0 3.7 4.3 4.2 diffuse 4broad 18 6.8 6.8 6.5 4.4 5.5 5.0 narrow 5thick 19 6.6 6.6 6.3 3.4 3.3 3.6 thin 5clear 24 6.1 6.0 6.4 5.8 5.7 6.4 muted 6unbalanced 16 5.8 5.6 5.0 3.7 4.2 4.1 balanced 4compact 13 5.7 5.8 5.8 4.4 3.9 4.5 airy 4rigid 9 5.0 5.2 5.2 3.3 2.2 3.3 fluent 3low 21 4.4 3.6 3.8 4.8 4.6 4.2 high 6playful 12 2.0 2.4 2.6 5.1 4.3 4.8 serious 3small 17 2.0 2.6 2.6 6.0 6.0 5.4 big 5horizontal 22 4.5 4.5 5.2 5.5 6.1 5.5 vertical 6frail 2 1.7 2.0 2.0 6.3 5.8 5.5 vigorous 1secure 10 2.3 2.8 3.2 5.9 5.4 5.6 anxious 3slow 5 3.8 3.6 3.7 7.1 7.5 5.9 fast 2regular 15 3.8 4.3 5.0 6.9 7.0 6.7 chaotic 4Soft 4 2.3 2.3 2.8 7.3 7.6 6.9 hard 1delicate 3 2.5 2.8 3.2 7.3 7.5 7.2 rough 1
Note: Scales run from 1 to 9; 5 is the neutral category. Means of 5.5 or higher are set in bold. The column ‘‘Category’’ refers to the Effort/Space model categories.
Action-Perception Coupling 81
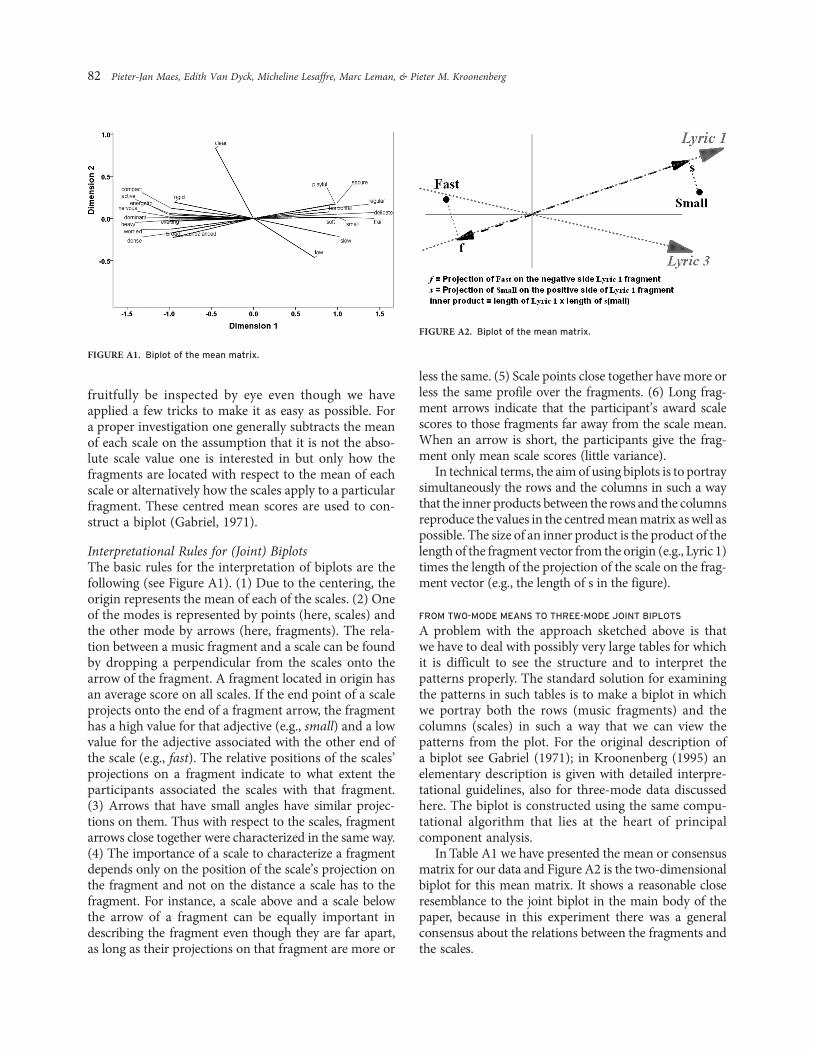
fruitfully be inspected by eye even though we haveapplied a few tricks to make it as easy as possible. Fora proper investigation one generally subtracts the meanof each scale on the assumption that it is not the abso-lute scale value one is interested in but only how thefragments are located with respect to the mean of eachscale or alternatively how the scales apply to a particularfragment. These centred mean scores are used to con-struct a biplot (Gabriel, 1971).
Interpretational Rules for (Joint) BiplotsThe basic rules for the interpretation of biplots are thefollowing (see Figure A1). (1) Due to the centering, theorigin represents the mean of each of the scales. (2) Oneof the modes is represented by points (here, scales) andthe other mode by arrows (here, fragments). The rela-tion between a music fragment and a scale can be foundby dropping a perpendicular from the scales onto thearrow of the fragment. A fragment located in origin hasan average score on all scales. If the end point of a scaleprojects onto the end of a fragment arrow, the fragmenthas a high value for that adjective (e.g., small) and a lowvalue for the adjective associated with the other end ofthe scale (e.g., fast). The relative positions of the scales’projections on a fragment indicate to what extent theparticipants associated the scales with that fragment.(3) Arrows that have small angles have similar projec-tions on them. Thus with respect to the scales, fragmentarrows close together were characterized in the same way.(4) The importance of a scale to characterize a fragmentdepends only on the position of the scale’s projection onthe fragment and not on the distance a scale has to thefragment. For instance, a scale above and a scale belowthe arrow of a fragment can be equally important indescribing the fragment even though they are far apart,as long as their projections on that fragment are more or
less the same. (5) Scale points close together have more orless the same profile over the fragments. (6) Long frag-ment arrows indicate that the participant’s award scalescores to those fragments far away from the scale mean.When an arrow is short, the participants give the frag-ment only mean scale scores (little variance).
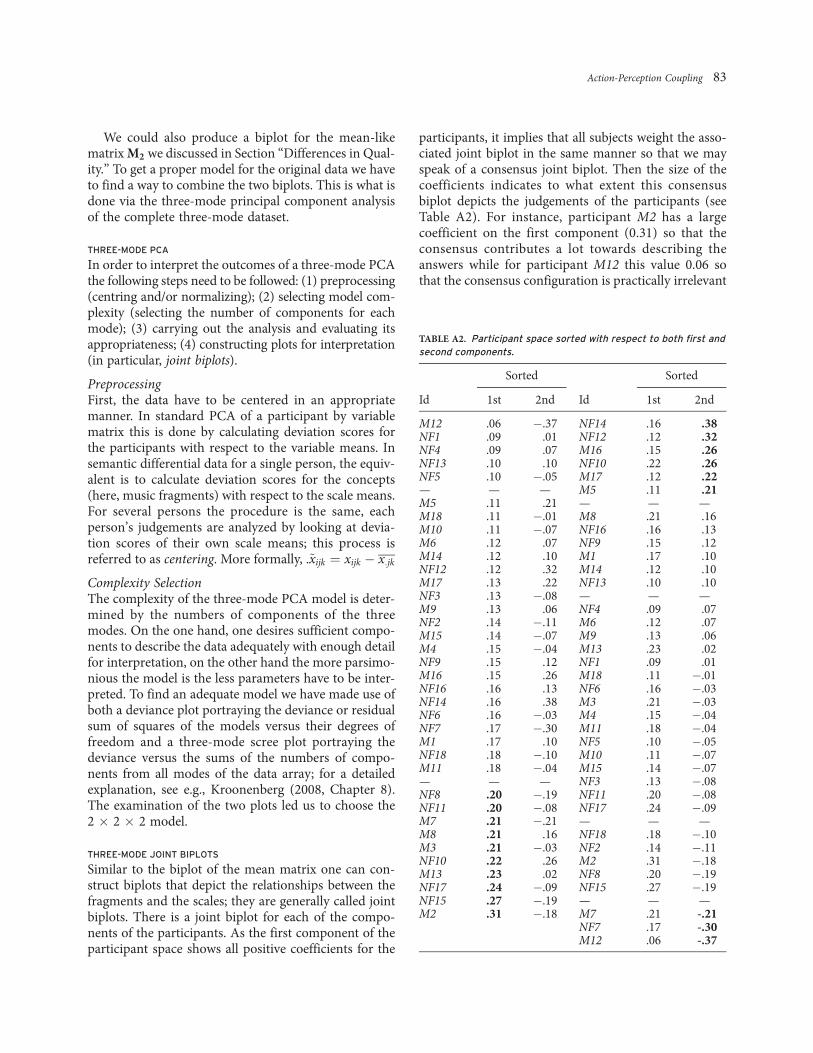
In technical terms, the aim of using biplots is to portraysimultaneously the rows and the columns in such a waythat the inner products between the rows and the columnsreproduce the values in the centred mean matrix as well aspossible. The size of an inner product is the product of thelength of the fragment vector from the origin (e.g., Lyric 1)times the length of the projection of the scale on the frag-ment vector (e.g., the length of s in the figure).
FROM TWO-MODE MEANS TO THREE-MODE JOINT BIPLOTS
A problem with the approach sketched above is thatwe have to deal with possibly very large tables for whichit is difficult to see the structure and to interpret thepatterns properly. The standard solution for examiningthe patterns in such tables is to make a biplot in whichwe portray both the rows (music fragments) and thecolumns (scales) in such a way that we can view thepatterns from the plot. For the original description ofa biplot see Gabriel (1971); in Kroonenberg (1995) anelementary description is given with detailed interpre-tational guidelines, also for three-mode data discussedhere. The biplot is constructed using the same compu-tational algorithm that lies at the heart of principalcomponent analysis.
In Table A1 we have presented the mean or consensusmatrix for our data and Figure A2 is the two-dimensionalbiplot for this mean matrix. It shows a reasonable closeresemblance to the joint biplot in the main body of thepaper, because in this experiment there was a generalconsensus about the relations between the fragments andthe scales.
FIGURE A1. Biplot of the mean matrix.
FIGURE A2. Biplot of the mean matrix.
82 Pieter-Jan Maes, Edith Van Dyck, Micheline Lesaffre, Marc Leman, & Pieter M. Kroonenberg
We could also produce a biplot for the mean-likematrix M2 we discussed in Section ‘‘Differences in Qual-ity.’’ To get a proper model for the original data we haveto find a way to combine the two biplots. This is what isdone via the three-mode principal component analysisof the complete three-mode dataset.
THREE-MODE PCA
In order to interpret the outcomes of a three-mode PCAthe following steps need to be followed: (1) preprocessing(centring and/or normalizing); (2) selecting model com-plexity (selecting the number of components for eachmode); (3) carrying out the analysis and evaluating itsappropriateness; (4) constructing plots for interpretation(in particular, joint biplots).
PreprocessingFirst, the data have to be centered in an appropriatemanner. In standard PCA of a participant by variablematrix this is done by calculating deviation scores forthe participants with respect to the variable means. Insemantic differential data for a single person, the equiv-alent is to calculate deviation scores for the concepts(here, music fragments) with respect to the scale means.For several persons the procedure is the same, eachperson’s judgements are analyzed by looking at devia-tion scores of their own scale means; this process isreferred to as centering. More formally, .~xijk ¼ xijk " x:jk
Complexity SelectionThe complexity of the three-mode PCA model is deter-mined by the numbers of components of the threemodes. On the one hand, one desires sufficient compo-nents to describe the data adequately with enough detailfor interpretation, on the other hand the more parsimo-nious the model is the less parameters have to be inter-preted. To find an adequate model we have made use ofboth a deviance plot portraying the deviance or residualsum of squares of the models versus their degrees offreedom and a three-mode scree plot portraying thedeviance versus the sums of the numbers of compo-nents from all modes of the data array; for a detailedexplanation, see e.g., Kroonenberg (2008, Chapter 8).The examination of the two plots led us to choose the2 # 2 # 2 model.
THREE-MODE JOINT BIPLOTS
Similar to the biplot of the mean matrix one can con-struct biplots that depict the relationships between thefragments and the scales; they are generally called jointbiplots. There is a joint biplot for each of the compo-nents of the participants. As the first component of theparticipant space shows all positive coefficients for the
participants, it implies that all subjects weight the asso-ciated joint biplot in the same manner so that we mayspeak of a consensus joint biplot. Then the size of thecoefficients indicates to what extent this consensusbiplot depicts the judgements of the participants (seeTable A2). For instance, participant M2 has a largecoefficient on the first component (0.31) so that theconsensus contributes a lot towards describing theanswers while for participant M12 this value 0.06 sothat the consensus configuration is practically irrelevant
TABLE A2. Participant space sorted with respect to both first andsecond components.
Sorted Sorted
Id 1st 2nd Id 1st 2nd
M12 .06 ".37 NF14 .16 .38NF1 .09 .01 NF12 .12 .32NF4 .09 .07 M16 .15 .26NF13 .10 .10 NF10 .22 .26NF5 .10 ".05 M17 .12 .22— — — M5 .11 .21M5 .11 .21 — — —M18 .11 ".01 M8 .21 .16M10 .11 ".07 NF16 .16 .13M6 .12 .07 NF9 .15 .12M14 .12 .10 M1 .17 .10NF12 .12 .32 M14 .12 .10M17 .13 .22 NF13 .10 .10NF3 .13 ".08 — — —M9 .13 .06 NF4 .09 .07NF2 .14 ".11 M6 .12 .07M15 .14 ".07 M9 .13 .06M4 .15 ".04 M13 .23 .02NF9 .15 .12 NF1 .09 .01M16 .15 .26 M18 .11 ".01NF16 .16 .13 NF6 .16 ".03NF14 .16 .38 M3 .21 ".03NF6 .16 ".03 M4 .15 ".04NF7 .17 ".30 M11 .18 ".04M1 .17 .10 NF5 .10 ".05NF18 .18 ".10 M10 .11 ".07M11 .18 ".04 M15 .14 ".07— — — NF3 .13 ".08NF8 .20 ".19 NF11 .20 ".08NF11 .20 ".08 NF17 .24 ".09M7 .21 ".21 — — —M8 .21 .16 NF18 .18 ".10M3 .21 ".03 NF2 .14 ".11NF10 .22 .26 M2 .31 ".18M13 .23 .02 NF8 .20 ".19NF17 .24 ".09 NF15 .27 ".19NF15 .27 ".19 — — —M2 .31 ".18 M7 .21 -.21
NF7 .17 -.30M12 .06 -.37
Action-Perception Coupling 83
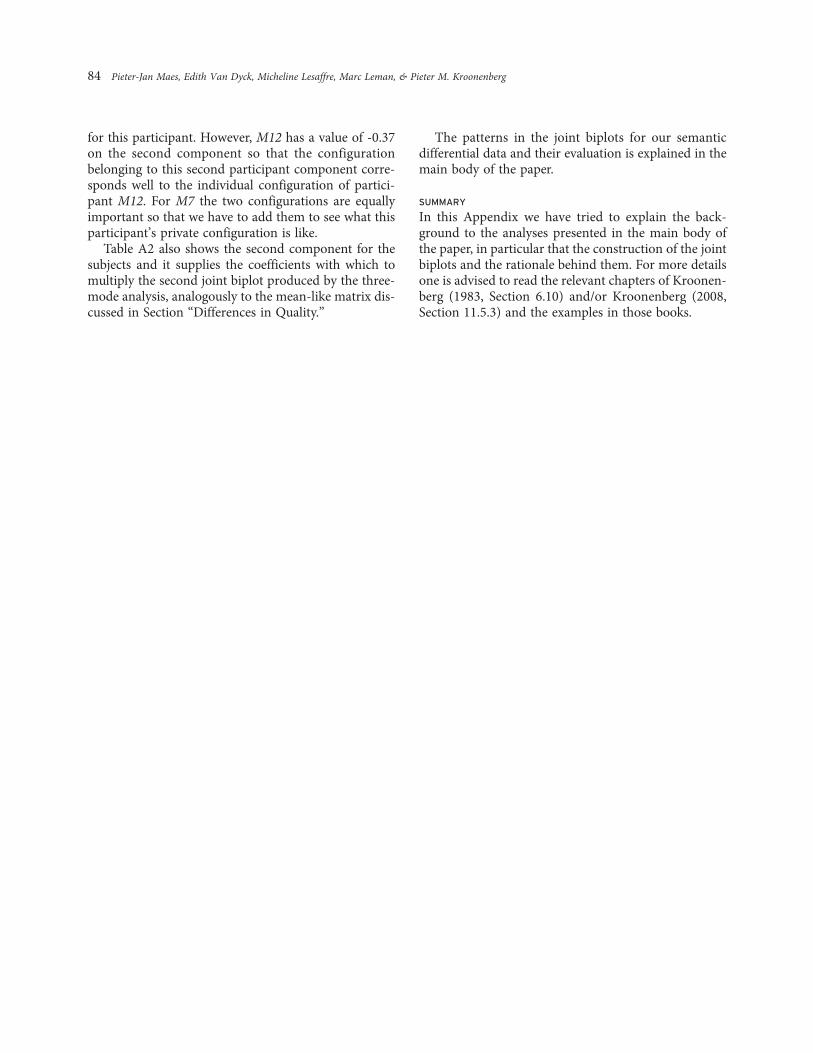
for this participant. However, M12 has a value of -0.37on the second component so that the configurationbelonging to this second participant component corre-sponds well to the individual configuration of partici-pant M12. For M7 the two configurations are equallyimportant so that we have to add them to see what thisparticipant’s private configuration is like.
Table A2 also shows the second component for thesubjects and it supplies the coefficients with which tomultiply the second joint biplot produced by the three-mode analysis, analogously to the mean-like matrix dis-cussed in Section ‘‘Differences in Quality.’’
The patterns in the joint biplots for our semanticdifferential data and their evaluation is explained in themain body of the paper.
SUMMARY
In this Appendix we have tried to explain the back-ground to the analyses presented in the main body ofthe paper, in particular that the construction of the jointbiplots and the rationale behind them. For more detailsone is advised to read the relevant chapters of Kroonen-berg (1983, Section 6.10) and/or Kroonenberg (2008,Section 11.5.3) and the examples in those books.
84 Pieter-Jan Maes, Edith Van Dyck, Micheline Lesaffre, Marc Leman, & Pieter M. Kroonenberg
Related Documents