The County of San Diego Planning Commission Hearing Report Date: October 14, 2016 Case/File No.: N/A Place: County Operations Center 5520 Overland Avenue San Diego, CA 92123 Project: Comprehensive Renewable Energy Plan Phase I Report Time: 9:00 a.m. Location: San Diego County Agenda Item: #1 General Plan: N/A Appeal Status: N/A Zoning: N/A Applicant: N/A Community: ALL Environmental: CEQA Exemption § 15262 Feasibility and Planning Studies APN: N/A A. EXECUTIVE SUMMARY 1. Report Purpose As directed by the Board of Supervisors, this staff report presents findings of the Comprehensive Renewable Energy Plan (CREP) Phase I work plan and proposes recommendations for Phase II. The findings include results of economic, feasibility and best management practices research and analysis. The staff report highlights the economic analysis findings that demonstrate increases in renewable energy investment are directly proportional to job creation and consumer savings. The staff report also summarizes 17 best management practices that were developed with input from consultants, internal and external stakeholders, and the Technical Advisory Committee (“Committee”). Based on information from the technical reports and stakeholder engagement, County staff is recommending 11 best management practices for further consideration. 2. Requested Actions The Planning Commission is requested to: 1. Review the CREP Draft Phase I Report (EMpower 2015) and Executive Summary Report (Ascent 2016); 2. Consider input from the Committee and the public on recommendations for Phase II; 3. Consider staff findings and recommendations for Phase II; 4. Recommend actions by priority for the Board of Supervisors to provide staff direction for Phase II. 1 - 1

Welcome message from author
This document is posted to help you gain knowledge. Please leave a comment to let me know what you think about it! Share it to your friends and learn new things together.
Transcript

The County of San Diego
Planning Commission Hearing Report
Date: October 14, 2016 Case/File No.: N/A
Place: County Operations Center 5520 Overland Avenue San Diego, CA 92123
Project: Comprehensive Renewable Energy Plan Phase I Report
Time: 9:00 a.m. Location: San Diego County
Agenda Item: #1 General Plan:
N/A
Appeal Status: N/A
Zoning: N/A
Applicant: N/A Community: ALL Environmental:
CEQA Exemption § 15262 Feasibility and Planning Studies
APN:
N/A
A. EXECUTIVE SUMMARY 1. Report Purpose
As directed by the Board of Supervisors, this staff report presents findings of the Comprehensive Renewable Energy Plan (CREP) Phase I work plan and proposes recommendations for Phase II. The findings include results of economic, feasibility and best management practices research and analysis. The staff report highlights the economic analysis findings that demonstrate increases in renewable energy investment are directly proportional to job creation and consumer savings.
The staff report also summarizes 17 best management practices that were developed with input from consultants, internal and external stakeholders, and the Technical Advisory Committee (“Committee”). Based on information from the technical reports and stakeholder engagement, County staff is recommending 11 best management practices for further consideration.
2. Requested Actions
The Planning Commission is requested to:
1. Review the CREP Draft Phase I Report (EMpower 2015) and Executive Summary Report (Ascent 2016);
2. Consider input from the Committee and the public on recommendations for Phase II; 3. Consider staff findings and recommendations for Phase II; 4. Recommend actions by priority for the Board of Supervisors to provide staff direction for
Phase II.
1 - 1
2
B. BACKGROUND This staff report presents the results of the Comprehensive Renewable Energy Plan (CREP) Phase I work plan and proposes recommendations for Phase II. This staff report summarizes economic, feasibility and best management practices research conducted with the assistance of outside consultants, and findings and recommendations developed through internal and external stakeholder participation. The findings include an overview of existing renewable energy conditions in San Diego County, opportunities for greater efficiencies, and a list of 17 best management practices.
The following sections outline the direction from the Board, and steps taken to identify the findings and recommendations for the Board’s consideration for Phase II.
1. Board Direction
On April 10, 2013 (3), the Board of Supervisors (Board) directed the Chief Administrative Officer to research and develop options for a comprehensive renewable energy plan, and to prepare a work plan including time and cost estimates.
On September 25, 2013 (1), County staff provided the CREP Phase I work plan for consideration by the Board (Attachment A). In summary, the work plan included the following five components:
1) Coordinate with the County’s Energy and Sustainability Team to analyze the County’s existing renewable energy programs and efforts, finding opportunities for efficiencies and bringing resources and knowledge together into a more focused program.
2) Work with private sectors stakeholders to understand the trends, issues and challenges facing renewable energy development in our region.
3) Conduct economic, feasibility and best management practices research with the assistance of outside consultants to address the report topic areas noted below.
a. Overview of existing renewable energy resources available within the unincorporated county
b. Cost analysis of different types of renewable energy c. Cost analysis of energy delivery models d. Consumer choice alternatives e. Discussion of incentives, policies and best management practices in other
jurisdictions that promote sustainable renewable energy development f. Overview of the renewable energy industry in San Diego County and its potential
for growth 4) Develop findings and recommendations for the Board’s consideration through internal and
external stakeholder participation. 5) Form a Renewable Energy Advisory Committee comprised of stakeholders interested
and/or involved in the promotion of renewable energy.
The County provided a presentation on the work plan, and the Board directed staff to initiate Phase I excluding 3b and 3c (Attachment B).
1 - 2

3
The Board established appropriations of $300,000 in County Planning & Development Services to fund Phase I, and directed the Director to form a Renewable Energy Technical Advisory Committee. The Board also directed staff to prepare a “pipelining” provision for existing applications for discretionary renewable energy projects.
The purpose of the “pipelining” provision is to ensure new rules or policies do not retroactively apply to or delay renewable energy projects with completed discretionary applications. Implementation of the Phase I work plan-- including consultant contracting and reporting-- does not constitute Board approval of new rules or policies that would necessitate a “pipelining” provision. No discretionary projects were delayed due to preparation of Phase I findings and recommendations. The provision will apply to new rules or policies the Board directs staff to prepare in Phase II that require a scope, schedule and appropriation of funds. As applicable, Phase II work plans will include the provision as follows: “any discretionary renewable energy project applications deemed complete prior to new rules taking effect shall be governed by existing rules and the new rules shall not be retroactively applied to such projects.”
Finally, the Board directed staff to return within 14 months of executing all required consultant service contracts.
2. Consultant Service Contracts
The County prepared a consultant scope of work based on the Board’s direction from September 2013. From December 2013 through January 2014, County Planning & Development Services solicited proposals for consulting services to assist with implementation of the Phase I work plan (County Request for Proposals 6312). Through a competitive bid process, staff selected EMpower Devices and Associates (EMpower) to prepare a comprehensive report to serve as a foundational resource for developing findings and recommendations concerning the County’s renewable energy-related plans, programs and policies.
On June 9, 2014, the County and EMpower entered into a contract to initiate the statement of work, including the following summary of tasks:
� identify and quantify the renewable energy resources available in San Diego County based on currently available models and data to show the relative resource potential throughout the County;
� provide an overview of alternative energy models, such as Community Choice Aggregation and "Direct Access" purchasing, that provides consumers with options beyond the traditional investor owned utility model;
� identify the incentives, policies and best management practices utilized in other jurisdictions and examine whether they produce desired effects; and
� conduct an economic analysis to identify the current and potential renewable energy industry jobs and investment within the region.
In 2014, the contract was amended to include stakeholder outreach of up to six meetings throughout the County with the goal of obtaining diverse feedback and input from the public on consultant findings and recommendations.
1 - 3
4
Throughout 2014 and 2015, EMpower and the County made significant progress on the project, including coordinating two Committee meetings to discuss the research approach, economic analysis methodology, and opportunities to increase renewable energy in San Diego County. In July 2015, EMpower published the Draft Phase I Report (Attachment C). However, due to schedule delays, the contract term expired before the draft document could be finalized.
In April 2016, the County distributed the Draft Phase I Report for public review. In order to complete implementation of the Phase I work plan, the County contracted with Ascent Environmental (Ascent) to provide support. In August 2016, Ascent was contracted to assist with additional Committee meetings, meetings with the Community Planning/Sponsor Group Chairs, and public workshops to solicit input on the best management practices described in the Draft Phase I Report.
Ascent is also the prime consultant responsible for preparing the County’s Climate Action Plan (CAP) and associated Environmental Impact Report. Renewable energy information gathered during implementation of the CAP public outreach and engagement process was synthesized by the County and Ascent. To date, public input on renewable energy measures was solicited during approximately 20 CAP stakeholder meetings, four CAP visioning sessions, and two CAP public workshops.
Using the remaining funds appropriated, Ascent prepared an Executive Summary Report that refines and builds upon information provided in the Draft Phase I Report, including an assessment of the anticipated return on investment and prioritization of the best management practices. Ascent published the Executive Summary Report in September 2016, and the County distributed it for public review (Attachment D).
3. Technical Advisory Committee
An Ad Hoc Technical Advisory Committee (“Committee”) for the CREP was appointed by the Director of County Planning & Development Services in July 2014. The Committee was formed to provide a breadth of knowledge related to renewable energy, and contribute technical insight through a series of meetings. The Committee appointed a Chair and Vice Chair, and agreed to be governed by By-laws and Rosenberg’s Rules of Order. The Committee is comprised of the following members:
1. Peder Norby, Committee Chair, County Planning Commissioner 2. Craig Benedetto, Committee Vice Chair, San Diego Regional Chamber of Commerce 3. Corinne Lytle Bonine, Chambers Group (formerly with URS Corporation) 4. Douglas Kot, American Institute of Architects, Leadership in Energy and Environmental
Design, DNV GL 5. John Reaves, Attorney and Credentialed Mediator 6. Jason Anderson, Cleantech San Diego 7. Ken Parks, San Diego Gas & Electric 8. Richard Caputo, San Diego State University
Since October 2014, the County and consultants met with the Committee four times to collaborate at key milestones during implementation of the Phase I work plan.
1 - 4

5
For the Committee meetings, County staff produced agendas, presentations, and other materials to guide the discussions. Topics discussed at each meeting include:
1. introductions and research approach; 2. economic analysis methodology and opportunities to increase renewable energy in San
Diego County; 3. Draft Phase I Report best management practices; and 4. staff recommendations for Board consideration.
In advance of the third meeting, County staff published a “workbook” for Committee members and public attendees to brainstorm on the advantages and disadvantages of several best management practices, and to provide input during the meeting. Although the Committee did not vote or provide consensus on findings and recommendations, they offered extensive feedback for the County to consider during each phase of the process.
The meetings were properly noticed and open to the public in accordance with Brown Act requirements. Public comments were accommodated at each meeting, and minutes and other materials were posted on the project website for public review. Technical Advisory Committee meeting minutes are included in Attachment E.
C. ANALYSIS AND DISCUSSION
Staff provided the most current information on the project website as it progressed through the planning phases. The Board letter and minute order, Draft Phase I Report, Executive Summary Report, Technical Advisory Committee meeting materials, public workshop materials and background information are provided on the project website: http://www.sandiegocounty.gov/pds/advance/CREP.html
The following sections provide an overview of existing renewable energy resources provided by the County and available within the unincorporated communities, and summarize the results of the economic analysis, alternative energy models and best management research, and internal and external stakeholder engagement conducted during Phase I.
1. County of San Diego Achievements in Renewable Energy
The County continues to be a leader in promoting renewable energy and energy efficiency in the region. In 2009, the County approved the Strategic Energy Plan, which is a road map to improve the quality of life for San Diegans by investing in innovative ways to reduce energy and greenhouse gases at County facilities and in the larger community. The County is capturing 2.5% of its annual electricity needs for County-owned facilities through approximately 20 small photovoltaic (PV) systems at local parks and recreation centers, and through a Power Purchase Agreement completed in 2011. These efforts will provide an estimated 2,867 megawatt hours of renewable energy annually, and reduce greenhouse gas emissions by an estimated 2,015 Metric Tons per year.
1 - 5

6
The County recently updated the 2009 Strategic Energy Plan to include renewable energy goals for 2015-2020 such as:
� reduce energy use intensity by 10% comparing data from Fiscal Year 2019-2020 against baseline data from Fiscal Year 2014-2015;
� realize cost avoidance and savings through energy savings opportunities and new technology;
� realize a 10% reduction in greenhouse gas emissions for all new County-owned vehicles comparing data from 2020 against baseline data from 2015;
� facilitate development and use of renewable energy that is compatible with natural resources and community character;
� reduce demand for fossil fuel consumption and address vehicle emissions by reducing vehicle miles traveled and promoting alternative fuel vehicles; and
� develop greenhouse gas reduction targets and establish mitigation measures and adaptation strategies for unincorporated areas of the County.
On June 10, 2016, the County was recognized for being a leader in energy efficiency at the 11th Annual Energy Showcase hosted by San Diego Gas & Electric (SDG&E). The County was among 11 San Diego businesses and organizations that were named ‘Energy Champions’ for their investments and commitment to sustainability and energy efficiency in the San Diego region.
The Energy Showcase highlighted the County’s achievements in partnering with SDG&E to implement strategies in the County’s 2015-2020 Strategic Energy Plan. The Energy Champion award distinguishes the County as a leader in energy efficiency and sustainable innovation with the main focus of improving the quality of life for San Diegans.
In 2015, the County received more than $150,000 in rebates from SDG&E to replace inefficient lighting at a half dozen County facilities. The lighting projects reduced the County’s utility bills by saving 3 million kilowatt hours of electricity. Similarly, the County completed retrofits of 2,246 County-owned and operated streetlights with LED fixtures, which will reduce an estimated 1.8 million kilowatts per year and provide approximately $150,000 in energy cost savings annually.
Throughout 2015 and 2016, the County installed 37 electric vehicle charging stations at 11 different sites, completing the County’s Electric Vehicle Supply Equipment network for the public and County employees. The County permitted 41 electric vehicle charging stations in Fiscal Year 2016, more than triple the amount permitted in Fiscal Year 2014. In addition, the County purchased 17 hybrid vehicles to replace mid-sized, standard gas powered vehicles in the County’s fleet.
In May 2016, the Alpine Library was opened as the County’s first Zero Net Energy building. Using state of the art technology, the library offers the community more services and more hours in a building that is four times the size of the previous facility. As a Zero Net Energy building, the total amount of energy used by the Alpine Library on an annual basis is approximately equal to the amount of renewable energy created onsite. The Alpine Library is estimated to save $15,000 in energy costs annually. The Imperial Beach Library is currently under construction as the County’s next Zero Net Energy building.
1 - 6

7
In terms of large campuses, the County Operations Center in Kearny Mesa uses high efficiency mechanical and lighting systems and onsite energy generation, which improves energy performance to 42% better than the California Energy Commission’s Title 24 requirements. The campus is supplemented with electricity from the 435 kilowatt PV system on the parking facility and provides electric vehicle charging infrastructure. The campus has achieved Leadership in Energy and Environmental Design Gold and Platinum Certifications, and earned numerous awards for design and sustainability including: SDG&E Energy Leader for New Construction; California Center for Sustainable Energy Outstanding Governmental Building of the Year; San Diego Architectural Foundation People’s Choice Orchid Award; and the American Institute of Architects California Council’s Merit Award for Sustainable Design.
To date, the County has approved two large-scale wind projects and 10 large-scale solar projects in the unincorporated County. In 2013 and 2015, the County approved ordinances to amend the Building Code to promote photovoltaics, wind energy, and electric vehicle charging systems and to expedite processing of small, residential rooftop solar permits. The County received national, state and local awards for streamlining solar permitting. Solar permitting is available to be fully processed online, issued within the same day, and with waived fees. Some of the County’s renewable energy permitting efforts include the following:
� averaged 6,555 residential PV permits issued each year, and increased residential PV permits 90% from Fiscal Years 2014 to 2016;
� permitted 7,424 residential PV permits online in Fiscal Year 2015-2016, an increase of 47% from the previous year;
� permitted 1,250 residential PV permits in-person in Fiscal Year 2015-2016, an increase of 13% from the previous year;
� permitted 70 commercial solar permits in Fiscal Year 2015-2016, an increase of 67% from the previous year;
� permitted four residential wind turbines since Fiscal Year 2014; and � permitted more than 189,000 kilowatts of renewable energy.
The County not only provides streamlined solar and wind permitting services, but also supports financing opportunities for solar and home efficiency upgrades. As authorized under California law, the County currently participates in five different Property Assessed Clean Energy Programs (PACE) programs. These programs allow for the financing of energy efficient projects, water efficiency projects and renewable energy upgrades that can be repaid through annual property tax bills. The County provides information on the following existing PACE programs: CaliforniaFIRST; Figtree PACE; Residential HERO PACE Program; Commercial HERO PACE Program; Ygrene Energy Fund; and AllianceNRG.
1 - 7

8
In addition, a Green Working Group of the following 11 County departments was established to provide extensive functional threading and bring knowledge and resources together during development of the County’s Climate Action Plan:
� Department of Planning & Development Services � Air Pollution Control District � Department of General Services � Department of Public Works � Office of Emergency Services � Department of Agriculture, Weights and Measures � Department of Parks And Recreation � Health & Human Services Agency � Department of Environmental Health � Department of Human Resources � Office of the County Counsel
The Green Working Group meets on a monthly basis to discuss climate planning best management practices, including potential renewable energy measures that may integrate into the Climate Action Plan.
While the County has undertaken efforts to expand renewable energy and green building development, there is an opportunity for a more comprehensive approach to increase renewable energy opportunities, create jobs in the region, and reduce costs for consumers.
2. EMpower Draft Phase I Report
The following sections summarize the economic analysis, alternative energy models and best management practice research provided by EMpower in the Draft Phase I Report.
a. Economic Analysis The economic analysis of the Draft Phase I Report examines the possible economic benefits of investing in renewable energy within the unincorporated areas of the County. EMpower used a proprietary analytical tool to model four economic scenarios that investigate how changes in investments and technologies might benefit jobs, incomes and net gains in the renewable energy industry.
First, the model addresses changes in energy bill expenditures over time. For this task, the four scenarios assume different percentages ranging from 33%, 50%, 80% and 100% of electricity will be generated by renewable energy. All scenarios show decreasing energy bill expenditures, or an increase in consumer savings, ranging from 16% to as much as 49% by 2050 (see Table 1).
1 - 8

9
Table 1 Energy Bill Expenditures in the Unincorporated County (2015-2050)1
Energy Expenditure 2015 2025 2040 2050 % Change Reduction in 2050 to Reference Case
Reference Case 622 821 1,200 1,547 0%
Scenario I 622 801 1,106 1,294 16%
Scenario II 622 797 1,031 1,132 27%
Scenario III 622 796 967 922 40%
Scenario IV 622 796 934 797 49% Notes: Numbers may not add up due to rounding. For more detailed analysis, see Empower Report. M = Millions
1 Numbers are presented in 2012 dollars
Source: Empower Devices (2015)
Overall, increasing mixes of renewable energy options and efficiency will translate into lower energy bill expenditures in the unincorporated areas as soon as 2025. Next, the model weighs the costs and economic benefits of each scenario. Costs include policies or programs needed to implement each scenario, along with technological investments needed to increase energy efficiency and create more renewable energy options. Economic benefits include net energy savings and net job creation.
In the scenarios, an increase in the mix of renewable energy increases, translates to larger net energy savings and more jobs created. For more detailed analysis, including specific breakdown of economic impacts by 5-year increments, refer to Section 3.3.2.2 of the Draft Phase I Report (Attachment C).
Table 2 Annual Average and Cumulative Economic Impacts of Innovation Scenarios
Benefit-Cost Ratio
ANNUAL AVERAGE1 CUMULATIVE1 Program/Policy
Costs Technological Investments2
Energy Bill Savings3
Net Energy Savings4
Net Job Creation
Investments Energy Bill Savings
Scenario I 5.3 $2 M $17 M $71 M $53 M 600 $500 M $2,600 M Scenario II 2.3 $5 M $45 M $120 M $99 M 1,000 $1,900 M $4,300 M Scenario III 1.9 $9 M $84 M $167 M $137 M 1,500 $3,100 M $6,000 M Scenario IV 1.9 $11 M $103 M $192 M $161 M 1,800 $3,700 M $6,900 M Notes: Numbers may not add up due to rounding. For more detailed analysis, see Empower Report. M = Millions 1 Annual and cumulative numbers are presented as 2012 dollars 2 Technological investments include investments that promote energy efficiency and renewable energy 3 Energy bill savings include savings from the industrial, residential, and commercial sectors 4 Net Energy savings subtract policy/program costs (1st column) with technological investments (2nd column). Source: Empower Devices (2015)
1 - 9
10
In summary, the economic analysis in the Draft Phase I Report concludes an increase in renewable energy supply will result in an increase in consumer savings and jobs.
b. Alternative Energy Models The Draft Phase I Report also describes alternative energy models that provide energy customers options to purchase renewable energy through different avenues from the traditional investor-owned utility. Investor-owned utilities are private electricity and natural gas providers.
The California Public Utilities Commission regulates investor-owned utilities such as San Diego Gas & Electric (SDG&E), Pacific Gas & Electric, and Southern California Edison, which comprise approximately three quarters of the electricity supply in California. SDG&E provides energy service to 3.6 million people through 1.4 million electric meters and 873,000 natural gas meters in San Diego and southern Orange counties. The SDG&E service area spans 4,100 square miles and serves the entire geographic area of San Diego County.
There are a number of alternative energy models that provide consumers options beyond the traditional investor-owned utility model. The consultant reports discuss three alternative energy models including Community Choice Aggregation, Direct Access and Sustainable Energy Utility. The reports provide examples throughout the region, and analyze the possible advantages and disadvantages of each. The following discussion summarizes and builds upon the most pertinent information from the reports.
Community Choice Aggregation (CCA) allows city and county governments to pool electricity customers to purchase power, while also allowing them to administer energy programs on behalf of their residents and businesses. A CCA works in partnership with an existing utility, which continues to deliver power, maintain the grid and provide billing. This alternative energy model allows a local community to shape the program and prioritize benefits such as increased investment in renewable energy sources, among others.
To date, CCAs have been established by law in California, Illinois, Massachusetts, New Jersey, Ohio and Rhode Island. Since its passing in 2002, a number of CCA programs have been proposed in California, including programs in San Francisco (CleanPowerSF), the East Bay (Oakland, Berkeley, and Emeryville), and the San Joaquin Valley (San Joaquin Valley Power Authority).
The first CCA program to operate in California, Marin Clean Energy, was formed in Marin County and began serving customers in May 2010. Sonoma County launched Sonoma Clean Power (including Mendocino County) in 2014. The City of Lancaster, through Lancaster Choice Energy, began offering service to select customers in May 2015, with broad public enrollment in late 2015.
1 - 10
11
Beginning in October 2016, the Peninsula Clean Energy Authority will provide residents and business in San Mateo County and the 20 incorporated cities with clean energy through a CCA. In July 2016, Los Angeles County began investigating a CCA through a feasibility study, and was directed by the Board of Supervisors in September 2016 to explore a Joint Powers Authority with approximately 80 incorporated cities. Similarly, Riverside County has hired a consultant to prepare a CCA feasibility study, and is coordinating with the Coachella Valley Association of Governments regarding local cities joining the effort. The Western Riverside Council of Governments has indicated it will solicit bids to conduct a CCA feasibility study for its 18 member cities as well. Alameda County is also pursuing a feasibility study.
In the local region, the City of Solana Beach published a CCA technical analysis in April 2016, and is continuing to explore the opportunity. The City of San Diego is conducting a CCA feasibility study to determine if community choice will help meet its Climate Action Plan goal of 100% clean energy by 2035.
The California legislature passed Senate Bill 790 in 2011, which required the California Public Utilities Commission to create a Code of Conduct to limit electrical corporations’ abilities to market or lobby against Community Choice Aggregators except through shareholder-funded, pre-approved Independent Marketing Divisions. SDG&E is the first electrical corporation to seek approval of such a division. On July 14, 2016, the California Public Utilities Commission passed a resolution to approve SDG&E to form an Independent Marketing Division for CCAs. According to their website, “SDG&E supports a customer’s right to choose its electricity service provider, including a Community Choice Aggregator. SDG&E will fully cooperate with the CCA or potential CCA to provide them with information to facilitate the process of investigating, forming and implementing a CCA program, consistent with state law and SDG&E’s CPUC-approved tariffs/rules.”
Direct Access (DA) gives eligible retail customers the choice to purchase electric power directly from an independent electric service provider rather than through an investor owned utility exclusively. During Fiscal Year 2015-2016, the County saved $2.9 million, or approximately 15%, average savings for County facilities by procuring electricity through DA.
While similar to a CCA program, DA is different in that it is: (1) not available to residential customers; and (2) by law (i.e., Senate Bill 695) is capped to a set number of gigawatt-hour electric service providers from which a customer can purchase power. This limits the County’s ability to ensure that a DA program could deliver increased levels of renewable energy and energy efficiency, as well as reduced levels of greenhouse gas emissions.
Sustainable Energy Utility (SEU) is an independent and financially self-sufficient entity responsible for delivering energy efficiency, energy conservation and customer-sited renewable energy to end users. Through an SEU, energy users throughout a city or state can build a relationship with a single organization whose direct interest is to help residents and businesses use less energy and generate their own clean energy.
1 - 11

12
As a nonprofit umbrella entity at a city, county, or state level, an SEU relies on a third-party management model, competitive contracting and performance incentives to deliver sustainable energy services across all sectors and customer classes. As such, an SEU is publicly accountable and can be financially self-sufficient. It also has access to a range of potential funding sources and revenue streams and can achieve energy savings without raising taxes or utility rates.
The Sonoma County Water Agency partnered with the Foundation for Renewable Energy & Environment to develop the Sonoma County Efficiency Financing (SCEF) Program. The SCEF is a scaled-down SEU model that does not require legislative action. Under this program, participating organizations contract with private Energy Service Companies to complete energy and water conservation measures. The participating organizations receive substantial utility cost-savings, including a contractual guarantee sufficient to cover the full cost of all retrofit work. The program uses tax-exempt bonds to finance projects.
After summarizing the available alternative energy models, the Draft Phase I Report lists and describes several best management practices that may promote renewable energy throughout San Diego County.
c. Best Management Practices
In the Draft Phase I Report, EMpower identifies approximately 16 best management practices for consideration. The best management practices (“BMP”) are listed below and further detailed in Attachment C.
BMP #1: Amend the General Plan and Add an Energy Element BMP #2: Establish a New Office of Sustainability BMP #3: Establish Institutional Capacity such as Community Choice Aggregation, Direct Access or Sustainable Energy Utility BMP #4: Establish Financial Capacity such as Property Assessed Clean Energy Program, Bonds, Peer-to-Peer Lending or Crowdfunding BMP #5: Develop a Solar Energy Workforce Development Initiative BMP #6: Build an Energy Assurance Plan BMP #7: Increase the County’s Percentage of Energy Derived from Various Renewable Energy Technologies BMP #8: Establish a Renewable Energy Group Procurement Initiative BMP #9: Participate in the Creation of a New Regional Energy Network BMP #10: Create a Renewable Energy Overlay/Combining Zone BMP #11: Develop a Building Energy Disclosure Program BMP#12: Promote More Aggressive Building Standards Including the Significant Retrofit of Existing Buildings BMP #13: Increase Renewable Energy Education and Outreach BMP #14: Start a Community Solar Initiatives and Legislation BMP #15: Establish a Microgrid and Develop Policies Related to Microgrids BMP #16: Establish Electric Vehicle Programs
1 - 12

13
3. Public Input
The Draft Phase I Report was posted online and parties were notified in April 2016. The Community Planning Group/Sponsor Group Chairs were updated on April 16, 2016 and August 20, 2016. Additional public comments were received at each Technical Adviory Committee meeting.
After the Draft Phase I Report was posted for public review, the County conducted additional stakeholder outreach to solicit input on the 16 best management practices. During a Technical Advisory Committee meeting, attendees recommended the County consider an additional measure, and a seventeenth best management practice was added to the list as follows:
BMP #17: Develop a Legislative Outreach Strategy to Support Renewable Energy Programs
County staff conducted outreach to identify the measures that are most effective in promoting renewable energy in San Diego County. In September 2016, staff solicited input on the 17 best management practices during public meetings in Valley Center and Boulevard, and no additional measures were added.
Valley Center Community Planning Group On September 12, 2016, staff presented an informational update to the Valley Center Community Planning Group during their monthly meeting. Staff provided a “workbook” and answered questions regarding the 17 measures, and notified attendees of additional opportunities to become engaged in the process. In summary, some participants expressed concern about costs associated with retrofitting existing buildings (BMP #12), and potential changes to the General Plan such as creating an Energy Element (BMP #1). Some also voiced concerns about how current permit applications seek to amend the General Plan, and may affect the CREP or greenhouse gas planning efforts.
In general, attendees recommended the County consider energy conservation techniques such as roof gardens and landscaping (BMP #12), and renewable energy storage mechanisms such as batteries or water (BMP #7). Some participants expressed interest in learning more about renewable energy group procurement initiatives such as the Silicon Valley Renewable Energy Project (BMP #8). The preliminary meeting minutes are included in Attachment F.
Boulevard Public Workshop On September 13, 2016, staff conducted a public workshop in Boulevard, including a facilitated exercise. Overall, staff heard concerns regarding large-scale renewable energy projects, and strong opposition to an overlay zone (BMP #10). Twenty-six community members attended and shared experiences of local renewable energy projects and potential impacts to human health, environment and workforce.
1 - 13
14
Through the exercise, workshop participants recommended the County:
� demonstrate regional leadership by generating and using more renewable energy at County facilities (BMP #7);
� consolidate a group of specialists to distribute renewable energy information and answer questions without creating an additional bureaucratic organization (BMP #2);
� be proactive in identifying and analyzing renewable energy legislation such as community solar, net metering, alternative energy models, and microgrids (BMP #17);
� consider community choice alternatives (BMP #3); � track community solar initiatives to determine applicability to the unincorporated areas
(BMP #14); and � consider establishing a renewable energy group procurement initiative (BMP #8).
After the Boulevard Public Workshop, County staff received 54 letters from Boulevard and Jacumba residents sharing disapproval of prioritizing large-scale renewable energy infrastructure projects as means of reducing greenhouse gas emissions. The letters opposed consideration of the renewable energy overlay zone in the Boulevard and Jacumba community planning areas (BMP #10), but expressed interest in alternative energy models such as community choice and Direct Access options (BMP #3) (Attachment G).
Campo Lake Morena Community Planning Group On September 26, 2016, the Campo Lake Morena Planning Group held a monthly meeting and voted on agenda item 6a “Review proposed letter for Comprehensive Renewable Energy Program report.” On September 27, 2016, staff received a letter from the planning group regarding, “Missing elements, initial draft of proposed San Diego County Comprehensive Renewable Energy Plan Report” (Attachment H).
In summary, the letter expresses concern that the Draft Phase I Report lacks a greenhouse gas analysis for the best management practices, and the CREP and Climate Action Plan “ignore soil releases altogether” when considering emissions. The letter states an overlay zone would result in releases of greenhouse gas emissions and cause a disproportionate share of energy costs to the backcountry of San Diego County. The planning group recommends that all projects complete a “cradle-to-grave review of greenhouse gas releases” including carbon release or sequestration during vegetation removal and soil disturbance, and emissions from materials manufacturing and transporting, and construction activities.
In conclusion, external stakeholders voiced concern about: renewable energy overlay zones and potential impacts to health, environment and community character; net-metering regulations; rapidly changing legislation and technology; and adding bureaucratic processes that would add little benefit to consumers and residents. Stakeholders commented the County should avoid duplication of efforts by leveraging regional collaboratives, partners and networking groups to provide services such as renewable energy education, outreach and workforce development training.
1 - 14

15
4. Technical Advisory Committee External stakeholders were engaged through a series of Technical Advisory Committee meetings on October 2, 2014; January 9, 2015; August 17, 2016; and September 21, 2016.
August 17, 2016 Meeting During the Committee meeting on August 17th, attendees were asked to identify the measures that would be most effective in promoting renewable energy in San Diego County. Staff presented the best management practices to the Committee members and public attendees, respectively. The “workbook” materials described each measure including potential advantages and disadvantages. Staff answered questions from the Committee members and public attendees before facilitating an exercise to prioritize the best management practices.
In summary, the Committee members and public attendees identified the following three priority recommendations in common:
� provide one point of contact for renewable energy information and sustainability-related resources (BMP #2);
� consider preparation of an overlay zone to streamline the planning and permitting process for renewable energy projects (BMP #10); and
� investigate opportunities to increase the County’s percentage of renewable energy use beyond 2.5% (BMP #7).
The Committee members also commented the County should consider the following measures as priority:
� develop a legislative outreach strategy to support renewable energy programs (BMP #17);
� identify opportunities to support renewable energy financing such as PACE, bonds, lending or crowdfunding (BMP #4);
� consider forming a Regional Energy Network with regional collaborators (BMP #9); and
� identify opportunities to promote electric vehicle use and infrastructure (BMP #16). Participants from the public recommended the County consider the following measures as priority:
� explore alternative energy models such as Community Choice Aggregation (BMP #3); � prepare an Energy Assurance Plan to address energy security and resilience (BMP
#6); � increase renewable energy education and outreach (BMP #13); and � consider establishing a microgrid and/or policies that remove barriers to microgrids
(BMP #15).
1 - 15
16
September 21, 2016 Meeting Staff returned to the Technical Advisory Committee on September 21, 2016 to share the potential recommendations. There was consensus the following six best management practices are lower priority:
� Amend the General Plan to Add an Energy Element (BMP #1) � Develop a Solar Workforce Development Initiative (BMP #5) � Build an Energy Assurance Plan (BMP #6) � Establish a Renewable Energy Group Procurement Initiative (BMP #8) � Develop a Building Energy Disclosure Program (BMP #11) � Promote More Aggressive Building Standards Including the Significant Retrofit of
Existing Buildings (BMP #12)
Committee members did not provide consensus on the priorities. However, the Committee and public attendees voiced general support for: investigating alternative energy models; increasing the County’s regional leadership through renewable energy generation, storage, transmission or use; promoting alternative fuel and infrastructure programs such as electric vehicle charging stations and rideshare opportunities; exploring renewable energy finance programs; exploring community solar initiatives and microgrid projects and policies; enhancing renewable energy education and outreach; providing a sustainability taskforce to be one point of contact for outreach; and being more proactive through legislative outreach.
5. Ascent Executive Summary Report Ascent prioritized the 17 best management practices based on a return on investment analysis, or the most benefit and opportunities for renewable energy development and growth. Each measure is analyzed in the Executive Summary Report, including tables that detail the costs and benefits of implementation such as advantages, disadvantages, financing options, and potential implementing body or mechanism, along with a measure of performance, or value, to the County (Attachment D). A ranking system was used to determine the mix of measures anticipated to be most effective for the County. A low, medium, or high return on investment ranking was assigned based on a number of social, economic, and political factors. For example, a number of the best management practices address ways the County can increase renewable energy opportunities through preparation of additional planning documents. While plans help to consolidate policies and convey a unified approach to an issue, they can also be costly and hard to finance. Because the County is already heavily involved in the climate action planning work program, the same objectives proposed in certain measures can be addressed in the Climate Action Plan. Rather than prepare an Energy Element for the County’s General Plan (BMP #1), it may be more beneficial to align renewable energy directives with the content of the Climate Action Plan. While an Energy Assurance Plan addresses energy security (BMP #6), other planning documents such as those from SDG&E or the County’s Multi-jurisdictional Hazard Mitigation Plan and Climate Action Plan may be better positioned to outline key assets and ways to increase energy supply resiliency. Some policy and program measures may be better addressed in the Climate Action Plan to ensure their implementation and greenhouse gas reduction potential. The advantages associated with increasing the renewable energy mix in the County are important, and because the County is currently using renewable energy, there is an opportunity to increase this percentage mix by
1 - 16

17
implementing changes (BMP #7). The exact percentage change should be aligned with Renewable Portfolio Standard requirements, be consistent with the Strategic Energy Plan, and help achieve greenhouse gas reduction targets identified in the Climate Action Plan. Overall, Ascent determined the highest return on investment would result through development of a Community Choice Aggregation Feasibility Study, tracking community solar legislation, developing microgrid policies and identifying sites for future microgrids, and creating a renewable energy overlay zone to streamline the planning process time and increase predictable development scenarios. Table 3 lists the 17 measures and prioritizes them based on return on investment.
Table 3 Prioritized Best Management Practices based on Return on Investment BMP Title Summary ROI
Establish Institutional Capacity TTop Priority: Develop a CCA Feasibility Study High1
Start a Community Solar Initiative TTop Priority: Track Community Solar Legislation High
Establish a Microgrid and Develop Policies Related to Microgrids TTop Priority: Develop Policies & Identify Sites for Future Microgrids
High
Create a Renewable Energy Overlay / Combining Zone TTop Priority: Reduces Planning Process Time, Increases Certainty for Community
High
Increase the County’s Percentage of Energy Derived from Various Renewable Energy Technologies
Better Addressed in the County’s CAP High
Establish Electric Vehicle Programs Better Addressed in the County’s CAP High
Establish Financing Capacity Establish Appropriate Partnership/Collaboration Medium2
Develop a Solar Energy Workforce Development Initiative Establish Appropriate Partnership/Collaboration Medium
Increase Renewable Energy Education and Outreach Establish Appropriate Partnership/Collaboration Medium
Develop a Legislative Strategy to Support Renewable Energy Programs Establish Collaboration with OSIA Medium
Amend the General Plan and add an Energy Element Better Addressed in the County’s CAP Low
Establish a New Office of Sustainability High Admininistration/Operating Costs Low
Build an Energy Assurance Plan Better Addressed in the County’s CAP Low
Establish a Renewable Energy Group Procurement Initiative High Level of Coordination Needed Low
Participate in the Creation of a New Regional Energy Network High Administration Burden Low
Develop a Building Energy Disclosure Program High Administration/Operating Costs Low
Promote More Aggressive Building Standards Including the Significant Retrofit of Existing Buildings
Current Legislation Already Addresses Issue Low
Notes: CAP = Climate Action Plan, OSIA = Office of Strategy and Intergovernmental Affairs, ROI = Return on Investment 1 CCA was determined to have a “high” return on investment ranking, DA, and SEU were both determined to have a “medium” return on investment ranking 2 PACE and Bonds were determined to have a “medium” return on investment ranking. P2P/Crowdfunding was determined to have a “low” return on investment ranking. Source: Empower Devices (2015)
1 - 17

18
D. STAFF RECOMMENDATIONS Staff recommendations were informed by extensive internal and external stakeholder outreach including a Planning Commission informational item, Community Planning Group Chairs meetings, Technical Advisory Committee meetings, public meetings, and Climate Action Plan Green Working Group meetings. In addition, staff referenced the project and opportunities to provide public input during approximately 20 Climate Action Plan stakeholder meetings, four visioning sessions and two public workshops to date.
Based on public input and the consultants’ analyses, staff identified 11 priority measures. The recommendations consider an assessment of cost, financing options, advantages, disadvantages implementation mechanism, and overall opportunity to increase renewable energy development in San Diego County.
For those measures that recommend a study be conducted, staff would return to the Board with a scope and schedule to seek approval and appropriation of funds. In terms of climate planning, the renewable energy measures the Board may direct staff to initiate in Phase II can be integrated into the Climate Action Plan greenhouse gas reduction strategies. The Climate Action Plan will identify specific greenhouse gas reduction targets, and by aligning objectives of CREP Phase II with the renewable energy components of the Climate Action Plan, actions can be tied to specific emissions goals.
Staff recommends the following priority actions for consideration by the Board:
1. Prepare a Community Choice Aggregation Feasibility Study (BMP #3). The County should:
� perform a study to determine if a Community Choice Aggregation program would be feasible in San Diego County, including an analysis of existing and proposed CCAs in other regional jurisdictions such as Los Angeles County, Riverside County, City of San Diego, and City of Solana Beach, among others; and
� continue to collaborate with regional partners such as the Climate Collaborative and Local Government Partnership member agencies to assess implementation of other consumer choice alternatives such as Direct Access and Sustainable Energy Utility, or future energy models.
2. Track Community Solar and Wind Initiatives (BMP #14). The County should:
� track the regulatory decisions established by Senate Bill 43, which have not been finalized to date;
� consider developing community solar and wind programs in the future for residents in the unincorporated area that are not able to install rooftop solar or wind gain access to these opportunities as a community;
� collaborate with regional partners such as the City of Carlsbad to harvest best practices and lessons learned associated with existing and proposed community solar and wind projects; and
� provide information to the public regarding community solar and wind initiatives.
1 - 18

19
3. Prepare a Microgrid Feasibility Study (BMP #15). The County should: � conduct a feasibility study to determine if a microgrid program would be feasible in
San Diego County, including potential sites where microgrids would be ideally suited to promote renewable energy use, storage and security;
� include a cost benefit analysis of implementation of a renewable energy microgrid at a County facility;
� identify ways to streamline the permitting and environmental review process for microgrids; and
� collaborate with San Diego Gas & Electric, University of California San Diego, local military bases, and other regional partners to address microgrid operations and energy storage and security.
4. Prepare Renewable Energy Design and Development Guidelines and Zoning Regulations Applicable to the Unincorporated County (BMP #10). The County should:
� prepare guidance for renewable energy infrastructure projects such as microgrids, community solar and wind, small-scale solar and wind, biomass facilities, geothermal facilities, electric vehicle charging stations and alternative fuel facilities, energy storage facilities, or others; and
� prepare an overlay zone study that provides a streamlining mechanism for the Major Use Permit and environmental review processes, including specific measures that avoid, minimize or mitigate impacts to current and proposed land uses, environmental conditions and community welfare.
5. Increase the County’s Renewable Energy Generation, Transmission, Use and Storage (BMP #7). The County should:
� determine the specific percentage of increase based on the greenhouse gas reduction targets in the Climate Action Plan, renewable energy portfolio standards, and goals in the Strategic Energy Plan; and
� identify and prioritize capacity for onsite renewable energy projects including, but not limited to, electric vehicles and charging infrastructure, solar, wind, geothermal, biomass, other alternative fuels infrastructure, and energy storage facilities.
6. Develop Strategies to Address Barriers to Alternative Fuel Deployment (BMP #16). The County should:
� identify a range of strategies related to alternative fuels and electric vehicles in the Climate Action Plan;
� continue to collaborate with regional partners such as San Diego Gas & Electric, Center for Sustainabile Energy and the San Diego Association of Governments to identify opportunities to promote alternative fuel programs such as charging stations and transportation demand management measures electric vehicle rideshare;
� promote the benefits of the County’s Solar- and Electric Vehicle-ready Ordinance;
1 - 19

20
� identify and advertise opportunities to provide incentives for multi-family units and workplace charging; and
� identify measures to encourage vendor participation.
7. Promote Vetted Renewable Energy Finance Mechanisms such as Property Assessed Clean Energy Programs, Bonds, Peer-to-Peer Lending or Crowdfunding, Among Others (BMP #4). The County should:
� promote renewable energy financing services and training that have been vetted adequately;
� support vetting opportunities and help consumers overcome the barriers to accessing renewable energy; and
� promote financial mechanisms through education and outreach and by building upon strategic partnerships with the Center for Sustainable Energy and San Diego Regional Energy Partnership.
8. Develop and Implement a Renewable Energy Education and Outreach Strategy (BMP #13). The County should:
� build a program to engage internal stakeholders, community members and decision-makers to further promote the benefits of existing and potential renewable energy policies and programs; and
� continue to market the County’s achievements in renewable energy. 9. Develop and Implement a Strategy to Support Renewable Energy Legislation that
benefits San Diego County (BMP #17). The County should: � build upon the existing legislative review process with the Office of Strategy and
Intergovernmental Affairs to focus on renewable energy; � actively support legislation that promotes renewable energy programs and funding
opportunities; and � address legislation that affects consumer choices such as California Public
Utilities Commission regulations, net-metering restrictions, renewable energy portfolio standards, alternative energy models, and community solar and wind, among others.
10. Establish a Sustainability Taskforce within the County’s Existing Organizational Framework (BMP #2). The County should:
� build upon existing enterprise functional threading efforts to further promote renewable energy policies and programs, such as expanding the Climate Action Plan Green Working Group to provide support to the team responsible for implementing CREP Phase II; and
� provide a consolidated resource for the public to learn about the County’s sustainability-related efforts including: County projects, partnerships, policies, and programs; existing and proposed legislation; finance mechanisms; and training and workforce development opportunities.
1 - 20

1 - 21

22
ATTACHMENTS: Attachment A – Board of Supervisors Letter, September 11, 2013 (4) and September 25, 2013 (1) Attachment B – Board of Supervisors Minute Order No. 1, September 25, 2013 Attachment C – Comprehensive Renewable Energy Plan Draft Phase I Report (EMpower 2015) Attachment D – Executive Summary Report (Ascent 2016) Attachment E – Technical Advisory Committee Approved Meeting Minutes for August 17, 2016, January 9, 2015, and October 2, 2014 and Draft Meeting Minutes for September 21, 2016 Attachment F – Valley Center Community Planning Group Preliminary Meeting Minutes for September 12, 2016 Attachment G – Sample of Boulevard and Jacumba Community Comment Letters Received in September through October 2016 Attachment H – Campo Lake Morena Community Planning Group Meeting Agenda and Comment Letter for September 26, 2016
1 - 22

Attachment A – Board of Supervisors Letter, September 11, 2013 (4) and
September 25, 2013 (1)
1 - 23
COUNTY OF SAN DIEGO
LAND USE AGENDA ITEM
BOARD OF SUPERVISORS
GREG COXFirst District
DIANNE JACOBSecond District
DAVE ROBERTSThird District
RON ROBERTSFourth District
BILL HORNFifth District
D4.0 1
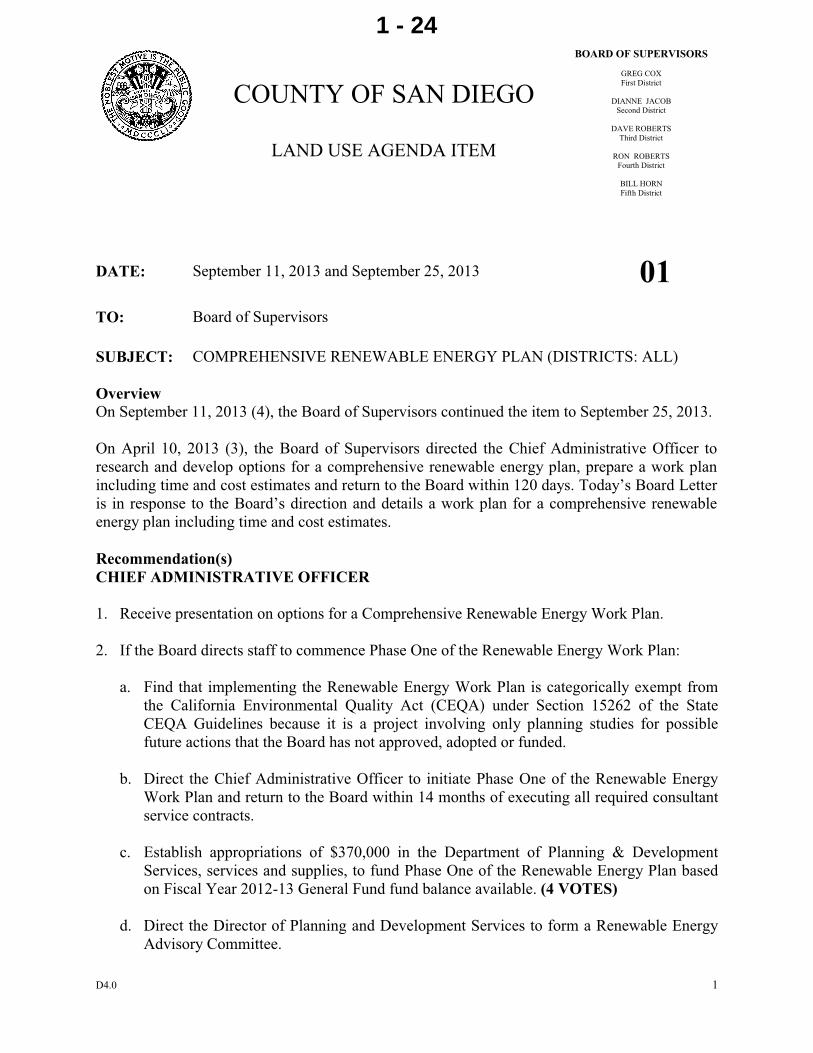
DATE: September 11, 2013 and September 25, 2013 01TO: Board of Supervisors
SUBJECT: COMPREHENSIVE RENEWABLE ENERGY PLAN (DISTRICTS: ALL)
OverviewOn September 11, 2013 (4), the Board of Supervisors continued the item to September 25, 2013.
On April 10, 2013 (3), the Board of Supervisors directed the Chief Administrative Officer to research and develop options for a comprehensive renewable energy plan, prepare a work plan including time and cost estimates and return to the Board within 120 days. Today’s Board Letter is in response to the Board’s direction and details a work plan for a comprehensive renewable energy plan including time and cost estimates.
Recommendation(s)CHIEF ADMINISTRATIVE OFFICER
1. Receive presentation on options for a Comprehensive Renewable Energy Work Plan.
2. If the Board directs staff to commence Phase One of the Renewable Energy Work Plan:
a. Find that implementing the Renewable Energy Work Plan is categorically exempt from the California Environmental Quality Act (CEQA) under Section 15262 of the State CEQA Guidelines because it is a project involving only planning studies for possible future actions that the Board has not approved, adopted or funded.
b. Direct the Chief Administrative Officer to initiate Phase One of the Renewable Energy Work Plan and return to the Board within 14 months of executing all required consultant service contracts.
c. Establish appropriations of $370,000 in the Department of Planning & Development Services, services and supplies, to fund Phase One of the Renewable Energy Plan based on Fiscal Year 2012-13 General Fund fund balance available. (4 VOTES)
d. Direct the Director of Planning and Development Services to form a Renewable Energy Advisory Committee.
1 - 24

SUBJECT: COMPREHENSIVE RENEWABLE ENERGY PLAN (DISTRICTS: ALL)
D4.0 2
e. Provide direction to staff regarding the preparation of a “pipelining” provision for discretionary renewable energy projects under review and include a provision for the Board’s consideration when staff returns with the Phase One report.
Fiscal ImpactFunds for this request are not included in the Fiscal Year 2013-2014 Operational Plan. If approved, this request will result in total costs and revenue of $370,000 in Fiscal Year 2013-14. The funding source is the General Fund fund balance. There will be no change in net General fund cost and additional staff years as a result of the recommended actions.
Business Impact StatementThe proposed project will further County, state and federal goals of utilizing alternative renewable energy resources. Facilitating renewable energy development provides alternatives for consumers, protects the environment and will help reduce the potential for energy shortages and outages which could negatively impact regional businesses.
Advisory Board StatementN/A
BackgroundSouthern California is faced with some of the highest energy costs in the state and nation. With the emergence of renewable energy and green-building technology, consumers are realizing a growing range of options to help reduce energy costs and move towards greater energy independence. While the County has undertaken efforts to expand renewable energy and green-building development, there is an opportunity for a more comprehensive approach to increaserenewable energy opportunities, reduce costs for consumers and minimize impacts to the community and its resources.
In response to the Board’s direction to research and develop options for a comprehensive renewable energy plan (REP), Planning & Development Services (PDS) staff conducted preliminary research including the review of renewable energy planning efforts in other jurisdictions and meeting with several of the County’s internal and external renewable energy stakeholders (See Table 1). The initial research and input received, found a mix of various County programs and renewable energy efforts that may become more effective if integrated into a focused renewable energy planning effort. The research also revealed an extensive amount of local private sector efforts and initiatives related to renewable energy which may serve as a knowledge base and resource for the County’s REP efforts moving forward. As a result of the preliminary research staff has prepared a two phase work program for the Board’s consideration.
Table 1 - StakeholdersInternal External
General Services East County Renewable CoalitionAir Pollution Control District Center for Sustainable EnergyDepartment of Parks & Recreation Clean TECHDepartment of Public Works (DPW) - Recycling SDG&EDPW Landfills SANDAG
1 - 25

SUBJECT: COMPREHENSIVE RENEWABLE ENERGY PLAN (DISTRICTS: ALL)
D4.0 3
Planning & Development Services University of California, San Diego Office of Strategy & Intergovernmental Affairs
Renewable Energy Work Plan
Phase OneThe foundation of developing a meaningful REP is based on research and analysis. Fundamental questions and issues must be researched and analyzed to provide decision makers with the information needed to formulate policies that will yield significant results. Phase One of the proposed REP work program consist of the following:
1. Coordinate with the County’s Energy and Sustainability Team to analyze the County’s existing renewable energy programs and efforts, finding opportunities for efficiencies and bringing resources and knowledge together into a more focused program.
2. Work with private sectors stakeholders to understand the trends, issues and challenges facing renewable energy development in our region.
3. Conduct economic, feasibility and best management practices research with the assistance of outside consultants to address the report topic areas noted below.
a. Overview of existing renewable energy resources available within the unincorporatedcounty - This overview will identify the type, location, quantity and quality of renewable energy resources available within the unincorporated area.
b. Cost analysis of different types of renewable energy (solar, wind, etc) - The cost to produce energy varies by the source. This analysis will break down the costs to develop and utilize the different types of renewable energy resources found in our region.
c. Cost analysis of energy delivery models - Various methods are used to deliver energy (distributed, utility scale); therefore, this analysis will provide the costs and benefits of the different delivery models.
d. Consumer choice alternatives - Provide an overview of alternative energy models, such as Community Choice Aggregation and “Direct Access” purchasing, that provides consumers with options beyond the traditional investor-owned utility model. The analysis will examine the viability and risks associated with implementing these alternative choice models and summarize the use of consumer choice alternatives throughout the state.
e. Discussion of incentives, policies and best management practices in other jurisdictions that promote sustainable renewable energy development - Analyze the incentives, policies and best management practices utilized in other jurisdictions and examine whether they produce desired effects.
f. Overview of the renewable energy industry in San Diego County (jobs, economic impact, etc.) and its potential for growth - Renewable Energy not only benefits the
1 - 26

SUBJECT: COMPREHENSIVE RENEWABLE ENERGY PLAN (DISTRICTS: ALL)
D4.0 4
environment and consumer; it also supports a growing industry within San Diego County. Analyzing the regional impact of the renewable energy industry may help shape the County’s REP.
4. Develop findings and recommendations for the Board’s consideration through internal and external stakeholder participation. Anticipated recommendations from this research effort are as follow:
a. Develop a Board Policy that memorializes the County’s commitment to support and encourage renewable energy development - The Board has adopted similar policies for other key industries such as agriculture (Board Policy I-133).
b. Develop a legislative strategy to support renewable energy development - Renewable energy is an emerging technology and, as a result, state and federal regulations continue to evolve. There is an opportunity for the County to play a role in advocating and advancing legislation that will benefit the consumer and industry as a whole.
c. Update existing plans, policies and incentives - A number of existing County plans, policies and incentives include components involving renewable energy. There are opportunities to thread and leverage these renewable energy components together to maximize benefits and efficiencies.
d. Identify new plans, policies, and incentives - Phase One will likely identify new plans, policies, and incentives to support renewable energy development. These new tools will be presented to the Board for consideration at the conclusion of Phase One and further developed in Phase Two upon direction from the Board.
e. Develop a marketing plan - The marketing plan will educate and inform consumers about the various renewable energy options and benefits available and provide a “road map” for consumers to tap into renewable energy incentives and programs. This effort will also provide consumers with permitting information for the various renewable technologies.
5. Form a Renewable Energy Advisory Committee comprised of stakeholders interested and/or involved in the promotion of renewable energy. This Ad Hoc Committee would consist of approximately 8-10 members selected by the Director of Planning & Development Services with backgrounds in developing, permitting and advocating for renewable technologies within our local region. Staff would conduct a series of meetings with the advisory group to discuss the findings and analysis of the Phase One research and solicit input to aide in the formulation of plan, policy and incentive recommendations to be included in the Phase One report.
Community and public input will be solicited during Phase One through a Planning Commission workshop and public review. A comprehensive report detailing all research and analysis would be presented to the Board at the completion of Phase One. The report will include recommendations presented in a format that will enable the Board to choose the specific plans,
1 - 27

SUBJECT: COMPREHENSIVE RENEWABLE ENERGY PLAN (DISTRICTS: ALL)
D4.0 5
policies and incentives it deems appropriate prior to committing resources to their development in the next phase.Phase TwoPhase Two consists of developing the recommendations approved by the Board at the completion of Phase One and completing any associated environmental analysis prior to their formal adoption. The specifics of Phase Two will remain unknown until all Phase One research and analysis has been completed and its associated recommendations have been identified and reviewed by the Board. The Phase Two work plan will be developed as an action item under Phase One and presented to the Board with the Phase One comprehensive report.
Time and CostsStaff has prepared time and cost estimates for the two phase work plan described above. The time and cost estimates provided assume consultant services will be utilized in conjunction with staff time. Phase Two time and costs are estimates based on the anticipated recommendations and will be refined based upon the recommendations ultimately approved by the Board at the completion of Phase One.
Time Cost EstimatesOptions Time Consultant
CostStaff Cost Total Cost
Phase One 18 Months $260K $110K $370KPhase Two 12 Months $25K $150K $175KTotal 30 Months $285K $260K $545K
Policy IssuePipelined Projects - Concerns are often raised that the development of new plans or policies may negatively impact projects currently under review. Determining the applicability of potential new policies and standards to applications and projects already underway may create delays or in some cases render a project infeasible. In order to alleviate concerns and provide certainty to applicants, the Board may wish to “pipeline” renewable energy projects currently under review and exempt them from any future policy changes or new requirements that may result from this REP development effort.
Upon direction from the Board, staff can prepare a “pipelining” provision for the Board’s consideration at the time staff returns to present the Phase One report.
Environmental StatementApproving the recommended actions is categorically exempt from CEQA under Section 15262 of the State CEQA Guidelines because the recommended actions involve only planning studies for possible future actions which the Board has not approved, adopted, or funded. All recommendations identified under Phase Two of the work plan will be reviewed under CEQA and will be presented to this Board for consideration.
Linkage to the County of San Diego Strategic PlanToday’s proposed actions supports the Sustainable Environments Initiative in the County of San Diego’s 2013-2018 Strategic Plan by creating a comprehensive renewable energy plan that threads the County’s planning efforts together to facilitate renewable energy development. The
1 - 28

SUBJECT: COMPREHENSIVE RENEWABLE ENERGY PLAN (DISTRICTS: ALL)
D4.0 6
proposed action ensures that planning and infrastructure support the economy and a strong region.
Respectfully submitted,
SARAH E. AGHASSIDeputy Chief Administrative Officer
ATTACHMENT(S)Attachment A – Board of Supervisors Minute Order, April 10, 2013
1 - 29

SUBJECT: COMPREHENSIVE RENEWABLE ENERGY PLAN (DISTRICTS: ALL)
D4.0 7
AGENDA ITEM INFORMATION SHEET
REQUIRES FOUR VOTES: [X] Yes [ ] No
WRITTEN DISCLOSURE PER COUNTY CHARTER SECTION 1000.1 REQUIRED[ ] Yes [X] No
PREVIOUS RELEVANT BOARD ACTIONS:April 10, 2013 (3), Comprehensive Renewable Energy Plan
BOARD POLICIES APPLICABLE:N/A
BOARD POLICY STATEMENTS:N/A
MANDATORY COMPLIANCE:N/A
ORACLE AWARD NUMBER(S) AND CONTRACT AND/OR REQUISITION NUMBER(S):N/A
ORIGINATING DEPARTMENT: Planning & Development Services
OTHER CONCURRENCES(S): N/A
CONTACT PERSON(S):
Mark Wardlaw, Director Matt Schneider Planner/Project Manager Name Name858-694-2962 858-694-3714Phone [email protected] [email protected] E-mail
1 - 30

Attachment B – Board of Supervisors Minute Order No. 1, September 25, 2013
1 - 31

09/25/13 1
COUNTY OF SAN DIEGOBOARD OF SUPERVISORS
WEDNESDAY, SEPTEMBER 25, 2013
MINUTE ORDER NO. 1
SUBJECT: CONTINUED FROM 9/11/13 AGENDA NO. 4:COMPREHENSIVE RENEWABLE ENERGY PLAN (DISTRICTS: ALL)
OVERVIEW:On September 11, 2013 (4), the Board of Supervisors continued the item to September 25, 2013.
On April 10, 2013 (3), the Board of Supervisors directed the Chief Administrative Officer to research and develop options for a comprehensive renewable energy plan, prepare a work plan including time and cost estimates and return to the Board within 120 days. Today’s Board Letter is in response to the Board’s direction and details a work plan for a comprehensive renewable energy plan including time and cost estimates.
FISCAL IMPACT:Funds for this request are not included in the Fiscal Year 2013-2014 Operational Plan. If approved, this request will result in total costs and revenue of $370,000 in Fiscal Year 2013-14. The funding source is the General Fund fund balance. There will be no change in net General fund cost and additional staff years as a result of the recommended actions.
BUSINESS IMPACT STATEMENT:The proposed project will further County, state and federal goals of utilizing alternative renewable energy resources. Facilitating renewable energy development provides alternatives for consumers, protects the environment and will help reduce the potential for energy shortages and outages which could negatively impact regional businesses.
RECOMMENDATION:CHIEF ADMINISTRATIVE OFFICER1. Receive presentation on options for a Comprehensive Renewable Energy Work Plan.
2. If the Board directs staff to commence Phase One of the Renewable Energy Work Plan: a. Find that implementing the Renewable Energy Work Plan is categorically exempt from
the California Environmental Quality Act (CEQA) under Section 15262 of the State CEQA Guidelines because it is a project involving only planning studies for possible future actions that the Board has not approved, adopted or funded.
b. Direct the Chief Administrative Officer to initiate Phase One of the Renewable Energy Work Plan and return to the Board within 14 months of executing all required consultant service contracts.
1 - 32

09/25/13 2
c. Establish appropriations of $370,000 in the Department of Planning & Development Services, services and supplies, to fund Phase One of the Renewable Energy Plan based on Fiscal Year 2012-13 General Fund fund balance available. (4 VOTES)
d. Direct the Director of Planning and Development Services to form a Renewable Energy Advisory Committee.
e. Provide direction to staff regarding the preparation of a “pipelining” provision for discretionary renewable energy projects under review and include a provision for the Board’s consideration when staff returns with the Phase One report.
ACTION:ON MOTION of Supervisor Jacob, seconded by Supervisor D. Roberts, the Board took the following action:
1. Received a presentation on options for a Comprehensive Renewable Energy Work Plan.
2. Found that implementing the Renewable Energy Work Plan is categorically exempt from the California Environmental Quality Act (CEQA) under Section 15262 of the State CEQA Guidelines because it is a project involving only planning studies for possible future actions that the Board has not approved, adopted or funded.
3. Directed the Chief Administrative Officer to initiate Phase One of the Renewable Energy Work Plan excluding 3b and 3c, and return to the Board within 14 months of executing all required consultant service contracts.
4. Established appropriations of $300,000 in the Department of Planning & Development Services, services and supplies, to fund Phase One of the Renewable Energy Plan based on Fiscal Year 2012-13 General Fund fund balance available.
5. Directed the Director of Planning and Development Services to form a Renewable Energy Advisory Committee.
6. Directed the Chief Administrative Officer to prepare a “pipelining” provision for discretionary renewable energy projects and to include a provision for the Board’s consideration when staff returns with the Phase One report; and directed that the “pipelining” provision provide that any application for a discretionary renewable energy project filed prior to new rules taking effect shall be governed by existing rules and that the new rules shall not be retroactively applied to such projects.
AYES: Cox, Jacob, D. Roberts, R. Roberts, Horn
1 - 33

09/25/13
State of California)County of San Diego) §
I hereby certify that the foregoiMinutes of the Board of Superv
THOMAS J. PASTUSZKAClerk of the Board of Superviso
By_________________Andrew Potter, Ch
- - -
ing is a full, true and correct copy of the originavisors.
ors
_____________hief Deputy
3
al entered in the
1 - 34

Attachment C – Comprehensive Renewable Energy Plan Draft Phase I Report
(Empower 2015)
1 - 35

PHASE I OF THE COMPREHENSIVE RENEWABLE ENERGY PLAN (CREP) REPORT
PREPARED FOR THE COUNTY OF SAN DIEGO
PREPARED BY
EMPOWER DEVICES AND ASSOCIATES ECONOMIC AND HUMAN DIMENSIONS RESEARCH ASSOCIATES COLORADO ENERGY GROUP, INC REVISED DRAFT REPORT JULY 14, 2015
1 - 36
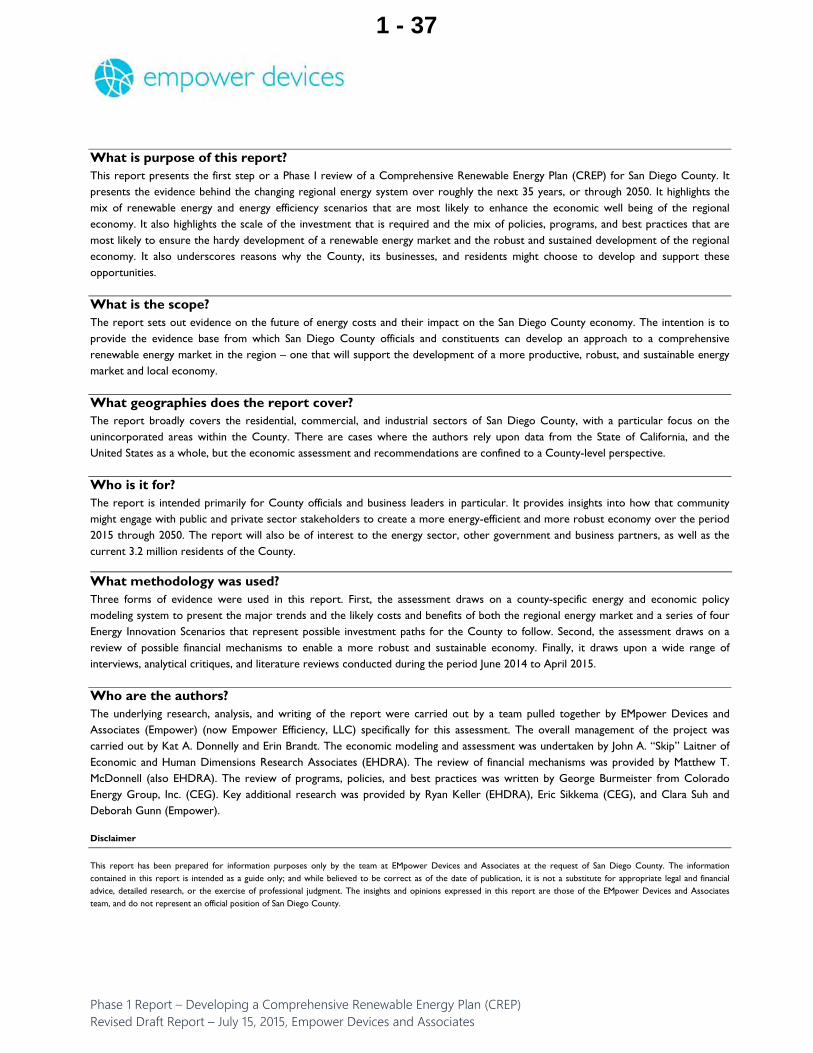
What is purpose of this report? This report presents the first step or a Phase I review of a Comprehensive Renewable Energy Plan (CREP) for San Diego County. It presents the evidence behind the changing regional energy system over roughly the next 35 years, or through 2050. It highlights the mix of renewable energy and energy efficiency scenarios that are most likely to enhance the economic well being of the regional economy. It also highlights the scale of the investment that is required and the mix of policies, programs, and best practices that are most likely to ensure the hardy development of a renewable energy market and the robust and sustained development of the regional economy. It also underscores reasons why the County, its businesses, and residents might choose to develop and support these opportunities.
What is the scope? The report sets out evidence on the future of energy costs and their impact on the San Diego County economy. The intention is to provide the evidence base from which San Diego County officials and constituents can develop an approach to a comprehensive renewable energy market in the region – one that will support the development of a more productive, robust, and sustainable energy market and local economy.
What geographies does the report cover? The report broadly covers the residential, commercial, and industrial sectors of San Diego County, with a particular focus on the unincorporated areas within the County. There are cases where the authors rely upon data from the State of California, and the United States as a whole, but the economic assessment and recommendations are confined to a County-level perspective.
Who is it for? The report is intended primarily for County officials and business leaders in particular. It provides insights into how that community might engage with public and private sector stakeholders to create a more energy-efficient and more robust economy over the period 2015 through 2050. The report will also be of interest to the energy sector, other government and business partners, as well as the current 3.2 million residents of the County.
What methodology was used? Three forms of evidence were used in this report. First, the assessment draws on a county-specific energy and economic policy modeling system to present the major trends and the likely costs and benefits of both the regional energy market and a series of four Energy Innovation Scenarios that represent possible investment paths for the County to follow. Second, the assessment draws on a review of possible financial mechanisms to enable a more robust and sustainable economy. Finally, it draws upon a wide range of interviews, analytical critiques, and literature reviews conducted during the period June 2014 to April 2015.
Who are the authors? The underlying research, analysis, and writing of the report were carried out by a team pulled together by EMpower Devices and Associates (Empower) (now Empower Efficiency, LLC) specifically for this assessment. The overall management of the project was carried out by Kat A. Donnelly and Erin Brandt. The economic modeling and assessment was undertaken by John A. “Skip” Laitner of Economic and Human Dimensions Research Associates (EHDRA). The review of financial mechanisms was provided by Matthew T. McDonnell (also EHDRA). The review of programs, policies, and best practices was written by George Burmeister from Colorado Energy Group, Inc. (CEG). Key additional research was provided by Ryan Keller (EHDRA), Eric Sikkema (CEG), and Clara Suh and Deborah Gunn (Empower).
Disclaimer
This report has been prepared for information purposes only by the team at EMpower Devices and Associates at the request of San Diego County. The information contained in this report is intended as a guide only; and while believed to be correct as of the date of publication, it is not a substitute for appropriate legal and financial advice, detailed research, or the exercise of professional judgment. The insights and opinions expressed in this report are those of the EMpower Devices and Associates team, and do not represent an official position of San Diego County.
1 - 37

Table of Contents
Executive Summary 7
1. Introduction 8
2. Report Context 11
2.1. General Context and Report Background 11
2.2. Energy Context 11
3. How Energy Impacts San Diego County’s Economy 17
3.1. Overview 17
3.2. A Closer Look at the Evidence 18
3.3. A DEEPER Look at San Diego County’s unincorporated areas 22
3.4. Further Insights and Conclusions 33
4. Institutional Arrangements and Financing Mechanisms 40
4.1. Introduction 40
4.2. Community Choice Aggregation 42
4.3. Direct Access 67
4.4. Sustainable Energy Utility 72
4.5. Property Assessed Clean Energy (PACE) Financing 77
4.6. Bonds 90
4.7. Crowdfunding 91
4.8. Qualitative Assessment 92
5. Best Practices 94
5.1. An Introduction to Best Practices 94
5.2. Best Practices Resources 96
5.3. Amend the General Plan by Adding an Energy Element 99
5.4. Establish a New Office of Sustainability/Office of Energy Resources 105
5.5. Establish an Institutional and Financial Capacity 116
5.6. A Solar Energy Workforce Development Initiative 117
5.7. Build an Energy Resilience Plan (ERP) 124
5.8 Increase the County’s Percentage of Energy Derived from Various
1 - 38

Renewable Energy Technologies 133
5.9. A Renewable Energy Group Procurement Initiative 140
5.10. Lead the Creation of a New Regional Energy Network (REN) 149
5.11. Renewable Energy Overlay/Combining Zone 156
5.12. Building Energy Disclosure 161
5.13. Promote More Aggressive Building Standards Including the
Significant Retrofit of Existing Buildings 168
5.14. Increase Renewable Energy Education and Outreach 178
5.15. Starting a Community Solar Initiative 186
5.16. Establish a Microgrid and Develop Policies Related to Microgrids 192
5.17. Establish Electric Vehicle Programs (as the first step toward integrating a more
Complete review of broader transportation services) 197
6. Findings, Conclusions, and Recommendations 207
6.1. The Key Elements of the Comprehensive Renewable Energy Plan 209
6.2. Long-Term Best Practice and Planning Elements 213
Appendices 215
A-1. Key Economic and Technology Assumptions 216
A-2. Bibliography 228
List of Figures, Tables and Boxes
FIGURES
FIGURE 3-1. The Link between California Energy Productivity and Per Capita GRP 17
FIGURE 3-2. San Diego County Historical and Projected Average Job Growth Rates 21
FIGURE 3-3. Innovation Scenario I 28
FIGURE 3-4. Innovation Scenario II 29
FIGURE 3-5. Innovation Scenario III 30
FIGURE 3-6. Innovation Scenario IV 31
FIGURE 3-7. Comparing Upside and Downside Risks 34
FIGURE 3-8. Innovation Scenario IV Energy Efficiency and Renewable Energy Power Plants
1 - 39

Equivalent 35
FIGURE 4-1. Relationship between Institutional Arrangements, Financing Mechanisms,
and Investment in Renewables/Energy Efficiency 40
FIGURE 4-2. Nationwide Context 42
FIGURE 4-3. A Hybrid Approach 43
FIGURE 4-4. SDC 35-Year Community Choice Resource Development Scenario 66
FIGURE 4-5. Direct Access Timeline 68
FIGURE 4-6. Direct Access Load as a Percentage of Total IOU Load in California 69
FIGURE 4-7. Statewide Direct Access Load Percentage 70
FIGURE 4-8 Percentage of DA Load by Customer Class 71
FIGURE 4-9. Illustration of Efficiency Financing 74
FIGURE 4-10. PACE Financing Illustration 79
FIGURE 4-11. Comparison of the Financial Mechanism Opportunity Impacts 93
FIGURE 5-1. Industry Competency Model 121
FIGURE 5-2. 4 Steps to Developing and Implementing an Energy Assurance Plan 127
FIGURE 5-3. Member Cities and Counties of CEC CALEAP Program 132
FIGURE 5-4. Shared Renewables Configuration of Participants 188
FIGURE 6-1. Understanding the Economy-Wide Sustainability Context 208
FIGURE 6-2. Planning Elements for a Robust and Sustainable San Diego County 211
FIGURE 6-3. Steps to Implementing a Comprehensive Renewable Energy Plan 213
FIGURE A-1. Diagram of the DEEPER Policy Analysis System 217
FIGURE A-2. Changes in the Average Annual Energy Resource Costs for the
unincorporated areas of San Diego County (2012-2015) 224
TABLES
TABLE 3-1. Population, Productivity and GRP Growth Rates in San Diego County 19
TABLE 3-2. Summary of Energy Expenditures (in millions of 2012 dollars) 22
TABLE 3-3. Energy Bill Expenditures in the unincorporated areas (2015-2050) 26
TABLE 3-4. Summary of Innovation Scenario Impacts (Average/year 2015-2050) 27
1 - 40

TABLE 3-5. Average Annual Environmental Benefits by Scenario 32
TABLE 3-6. Detailed Results from Innovation Scenario I 36
TABLE 3-7. Detailed Results from Innovation Scenario II 37
TABLE 3-8. Detailed Results from Innovation Scenario III 38
TABLE 3-9. Detailed Results from Innovation Scenario IV 39
TABLE 3-10. Table of Net Savings Benefits by Payment Plan 41
TABLE 4-1. Renewable Portfolio Standard 61
TABLE 4-2. PACE Program Comparison 88
TABLE 5-1. California Counties and Cities with Energy Elements 103
TABLE 5-2. Reasons for Adding Energy Elements by CA Jurisdiction 104
TABLE 5-3. Sample Office of Sustainability Staff 110
TABLE 5-4. Comparable Offices of Sustainability 110
TABLE 5-5. Identifying Key Assets 128
TABLE 5-6. Cities and Counties with Energy Assurance Plans 131
TABLE 5-7. Renewable Energy Generation Targets of Select CA Counties and Cities 135
TABLE 5-9. Renewable Energy Procurement Initiatives 148
TABLE 5-10. SoCalREN and BayREN Budgets (2013-2014) 153
TABLE 5-11. Energy Disclosure Requirements by Jurisdiction 166
TABLE 5-12. Selected Aggressive California Municipal Building Standards 175
TABLE 5-13. California Jurisdictions and their Community Reach Codes 176
TABLE 5-15. E&O Programs and Budgets of CA Cities and Counties 182
TABLE 5-16. E&O Programs in California Counties 184
TABLE 5-17. Three Dominant Models for Community Solar 190
TABLE 5-18. Notable Microgrid Projects in the United States 195
TABLE 5-19. U.S. Department of Defense Microgrid Projects in Collaboration with
The Department of Energy and the Department of Homeland Security 196
TABLE 5-20. Rebates (issued and reserved) March 2010-February 2015 200
TABLE 5-21. EV Projects in the United States 206
1 - 41

TABLE A-1. Reference Case Data for unincorporated areas of San Diego County 219
TABLE A-2. Employment Impacts by Sector for San Diego County 2012 220
BOXES
BOX 1. Emerging Market Technologies 25
BOX II. Scale of Renewable Energy and Energy Efficiency Power Plant Equivalents 35
BOX III. The Return on Borrowing Money to Fund a Project 41
BOX IV. Open Architecture and the San Diego County Energy Economy 212
1 - 42

Executive Summary
To Be Completed.
1 - 43

“If you are not prepared for the change, you’re too late.”
- James Avery, SDG&E
1. Introduction
On any given day, an office worker in San Diego County might “telecommute” from home rather than drive to the office. At the same time, a farmer may power up a tractor to begin the harvesting of crops, while a truck driver may be on the way to deliver a replacement part that will allow a manufacturer to resume production. These separate work events all share three critical elements. The first is that someone undertakes an activity to get the job done. This element is typically referred to as labor, or perhaps skilled employment. The second is the use of machinery or some type of equipment that enables the production of goods and services. This item is the result of annual investments made each and every year in that equipment, or perhaps in supporting infrastructure that enables the other equipment to be used. Buildings, roads, bridges, pipelines, power plants, and new solar technologies are all examples of supporting infrastructure. The combined investments in all of that equipment and infrastructure, as they accumulate over time, are often referred to as capital.
The third element is the high-quality flow of energy – electricity, natural gas, or gasoline, whether they are provided by conventional energy or by renewable energy resources. It is energy in the form of food that animates labor, and in the form of electricity or natural gas that enables capital to carry out the desired set of tasks. Depending on the mix and productive uses of resources put to work, the local economy is able to deliver the desired mix of goods and services to meet the needs of area businesses and the local residents. This so-called work is typically measured as personal income or gross regional product (GRP).
In most economic development assessments, labor and capital are often thought to be the main elements that drive economic activity; but it is energy – the third, and the most often overlooked component of the economic process – that may prove the most critical driver of economic and social well-being. To extend our example above, a software engineer cannot develop code without electricity to power the computer. The truck driver cannot deliver a replacement part without the diesel fuel to power the truck engine. When optimally sourced and efficiently used, energy can amplify local economic development, and it can enhance a more robust and resilient economy. But, the wrong mix of those resources, coupled with the inefficient use of the resulting energy flows, can appreciably constrain the vigor of a local economy.
The San Diego County region has one of the largest population centers in the United States, with over 3 million people covering 4,200 square miles. In 2015, an estimated 1.9 million people in San Diego County will regularly go to work each day of the year. Consumers and businesses, together with the variety of municipal government operations at work in the county, will spend an estimated $10 billion dollars to meet their combined energy needs. The many payments made each day or each month will enable them to cool and light their homes, to drive to work, to listen to music or watch TV, and to power the county’s many commercial enterprises. Electricity purchases, for example, will further enable access to the Internet, as well as filter and purify the water that is delivered to local homes, schools, and businesses every day.
Although San Diego County derives many important benefits as they pay their various bills, there also may be a very big opportunity to save money – perhaps as much as $3 billion dollars more per year – even as the use of that energy also releases massive amounts of pollutants into the air. The current mix of energy resources used to support economic activity within San Diego County will also produce and release into the atmosphere 2,700 tons of sulfur dioxide (SO2), 11,400 tons of particulate matter, 56,000 tons of nitrogen oxide (NOx), and 56,000 tons of volatile organic compounds (VOC). These and other pollutants are expected to add $3-$7 billion to the county’s
1 - 44

annual health care costs, ranging from the costs associated with 500 or more premature deaths, 16,000 cases of upper respiratory symptoms, and 80,000 lost worker days (Ayres and Warr 2009, Abt Associates 2013).1
The impact of the county’s requirements extends well beyond immediate health care costs. In addition to the SO2 and NOX pollutants, the various energy sources will also be pumping an estimated 26 million metric tons of carbon dioxide (CO2) emissions into the earth’s atmosphere (Gordon, Silva-Send et al. 2013). Both scientists and insurance companies increasingly recognize that this annual discharge of CO2 contributes to global climate change whose effects are increasingly noticed around the world. Recent statements by members of the insurance industry attest to this concern (McHale and Leurig 2012). Furthermore, as the authors disclose later in this assessment, the inefficient use of energy may also cost the County an average of 35,000 jobs over the period 2015-2050 and as many as 100,000 jobs by 2050. This also means an estimated $2-$5 billion annually in lost wages (in 2012 dollars).
There is little question that the production and use of energy holds great economic value for both San Diego County and the United States. In fact, many renewable energy industries are growing exponentially. According to the recent Solar Foundation's Solar Job Census, one out of every 78 new jobs created in the U.S. in 2014 was created by the solar industry - representing 1.3 percent of all new jobs (Luecke, 2014). Renewables alone will not meet the County’s energy needs, but it remains a potential economic gold mine for the region. County officials are to be congratulated on identifying this economic opportunity, and beginning the important research on it through this Phase I report that will help strengthen future policy and investment decisions.
As then President George W. Bush emphasized in 2006, there is a critical need for greater emphasis on energy efficiency and a more diversified energy portfolio. A recent report by the International Energy Agency (IEA) noted that the inefficient conversion of energy can create a large array of problems which can weaken or constrain the development of a more robust economy (Campbell, Ryan et al. 2014). German physicist Reiner Kümmel and his colleagues studied the economic process and noted that the economic weight of energy is significantly larger than its cost share (Kümmel 2013). Research by economist Robert Ayres and his colleague and then PhD student Benjamin Warr (2005) documented that improvements in both the quality and efficiency of delivered energy services may be the critical factor in the growth of an economy. Indeed, they suggested that greater levels of energy efficiency is one of the primary drivers that support meaningful technological progress, and that sustained technological progress may come only with extensive upgrades in a region’s overall energy efficiency.2
For very similar reasons, the economy of San Diego County may also be at a crossroads. As detailed in a recent study published by the American Council for an Energy-Efficient Economy (ACEEE), it turns out that the U.S. economy is only 14 percent energy-efficient. That is to say, of all the energy consumed within the economic process, more than 85 percent of it is wasted. The authors see a lot of that waste in the form of air pollution and carbon dioxide emissions. With an inefficient use of energy and also with the over-reliance on fossil fuel resources, the County may face serious economic and competitive challenges should it continue the current pattern of energy production and consumption.
As the authors suggest in this assessment, productive investments in renewable energy systems and system upgrades in energy-efficient technologies can provide all of San Diego County’s energy needs by 2050. While there
1 The various pollutants and health impacts are author-derived estimates based on San Diego County emission scenarios for 2017 given the various health effects identified by the Environmental Protection Agency’s Co-Benefits Risk Assessment (COBRA) model. 2 For more background and a deeper discussion on the critical link between the productive conversion of high quality energy and a robust economy, see Ayres and Warr (2010), Rifkin (2011), and Laitner (2014).
1 - 45

are substantial upgrades that must be made to the region’s telecommunication and electricity grid before large-scale improvements can be made, it is both technically and economically feasible.3 In short, a significant portion of the billions of dollars already spent each year for energy consumption can be used in other ways to more productively strengthen the County’s larger economy – provided local business leaders and policy makers choose to make those smarter and more productive investments.
This report explores future economic development opportunities available to San Diego County. More specifically, the authors examine the possible economic benefits within the unincorporated areas of the County if household and businesses were to shift away from current investment patterns to pursue a more productive and cleaner energy future. The authors investigate the benefits that renewable energy and energy efficiency resources can deliver to the local economy as the basis for a revitalized economic development and look at what scale of investment will be necessary to drive those improvements. Also included is an evaluation of the value to County residents of fewer harmful pollutants in the air. Lastly, the report determines how a shift in spending toward clean energy could strengthen the region’s ability to support more incomes and jobs.
With that backdrop, Section II of this assessment provides the larger context and overall background that reinforces the analysis found in this report. Section III explores the current patterns of economic activity and energy consumption – especially as the authors look to the evidence of previous inquiries and investigations that might inform the assessment here. It also includes an overview of the methodology the authors use to estimate the economic impacts of the greater diversity in the use of energy resources and, in particular, the greater level of renewable energy and energy efficiency improvements. Section IV explores the variety of financial mechanisms that will enable the County to build those opportunities, while Section V offers a review of best practices among the many policies and programs that are likely to enable that positive outcome. Finally, Section VI summarizes the major results of this inquiry and highlights the next critical steps to ensure a more robust, resilient, and sustainable economy within the County. In addition, Appendix A-1 offers further details about the economic model used to complete this assessment for the County.
3 In a very thoughtful interview, San Diego Gas & Electric Senior Vice-President of Power Supply, James Avery highlighted some of the emerging problems now associated with the rapid adoption of photovoltaic energy systems (essentially devices which convert sunlight directly into electricity). At the same time he noted: “The authors haven’t begun to think of the technologies that will evolve” out of the digitalization of the grid, he said. “The wealth of opportunities far exceeds the programs and applications that exist today.” See, http://www.utilitydive.com/news/sdge-if-youre-not-prepared-for-the-change-its-too-late/366979/
1 - 46

2. Report Context
2.1. General Context and Report Background
In April 2013, the San Diego County Board of Supervisors requested that San Diego County identify options for developing a Comprehensive Renewable Energy Plan (CREP). The work plan that resulted from this request calls for developing a CREP in phases to establish a path for transforming the County’s renewable energy and energy efficiency markets for the benefit of the region. The goal is to develop a CREP that will build stakeholder consensus and start the process of renewable energy market transformation. For Phase One, San Diego County staff are tasked with identifying key economic and business information to formulate recommendations that can inform, inspire, and motivate decision makers.
This report is intended to inform the Phase One decision-making process and serve as a roadmap for how energy, economic, and environmental goals can be met through the expansion of renewable energy and energy efficiency in San Diego County’s unincorporated areas. Given the intentionally comprehensive nature of the CREP, this report not only outlines several paths for renewables, but also shows how energy efficiency fits into these paths.
To date, San Diego County has developed numerous policies and programs that directly or indirectly shape how the County and its constituents pursue renewable energy. However, these actions often happen in silos. This report outlines these existing energy-related actions, as well as presents how future policies and programs can be developed using a comprehensive, multi-sector approach to renewable energy development in the county.
This report proposes scenarios of what could be possible for renewable energy, and outlines what resources and actions are necessary for such scenarios to be realized. It does not look at renewable energy in isolation, but rather how it is directly linked to sustainability, energy efficiency, and the local economy.
2.2. Energy Context
Research shows that California counties are only recently starting to address the streamlining of renewable energy development within the planning process, with most activity occurring since 2010 (CEG 2014). When considering the implementation of Best Practices within the CREP, the County of San Diego must consider a number of complex energy-related requirements or initiatives already underway at the Federal, State, regional, and local levels. The interplay between these moving parts needs to be understood as much as possible when considering any new programs or policies. Ideally, the mix of programs and policies ultimately selected for implementation by the County for the CREP will help meet many of these existing and upcoming requirements set at the State and Federal levels.
2.2.1 Federal Energy Context
Federal energy policy, or the lack thereof, has a major impact on the County. For example, the lack of Federal action on the price of carbon generally puts more pressure and responsibility on the County and other jurisdictions in this area. At the Federal level, the U.S. Environmental Protection Agency (EPA) is proposing to reduce carbon dioxide emissions from the nation’s fleet of power plants by a total of 30 percent from 2005 levels by the year 2030 as part of the implementation of Section 111 (D) of the Clean Air Act. The EPA is doing this by developing separate carbon pollution-reduction frameworks for new and existing power plants. Increasing the use of renewables and making energy efficiency improvements are two of the four major strategies suggested by the EPA for states and their constituents to use to meet these national emission standards. As such, the actions that come out of the CREP will be critical in helping to meet these new Federal standards.
1 - 47

Another regional plan that will critically influence the development of renewable energy in San Diego County is the Desert Renewable Energy Conservation Plan (DRECP). The DRECP was initiated in 2008 by a California Executive Order (S-14-08), but it will impact existing Federal agencies. The area covered by the DRECP includes 22.6 million acres across seven California counties, with the eastern portion of San Diego County included in the impact area. The general purpose of the DRECP is to expedite siting and construction of renewable energy power facilities and transmission lines through streamlined environmental review and permitting, while conserving and managing plant and wildlife communities in the desert regions. This desert conservation and renewable energy and transmission focus will be covered through three separate components of the DRECP: A U.S. Bureau of Land Management (BLM) Land Use Plan Amendment; a U.S. Fish and Wildlife Service (FWS) General Conservation Plan; and a California Department of Fish and Wildlife (CDFW) Natural Communities Conservation Plan. Proponents of the DRECP are looking for a comprehensive, landscape approach that considers an entire region for development versus the project-by-project approach that tends to dominate planning efforts in many California counties today. The DRECP was driven early in part by the intent to meet the State’s 33 percent by 2020 Renewable Portfolio Standards (RPS). DRECP proponents plan to develop 20,000 Megawatts of renewable energy power over the next 25 years, which is no small feat. With habitat issues dominating the San Diego region, participation in the DRECP will be increasingly important in the next two years as public opinion is sought on policy alternatives.
In addition to the extensive Federal government activity underway in the renewable energy area, electric and gas utilities across the country are wrestling with new business models that include starting new renewable energy divisions, and partnerships with companies involved in the renewable energy field. The dramatic reduction in the costs of solar, an 80 percent drop since 2008, and new financing options has opened up new markets, and has many utility executives worried about losing market share and control of energy supply as solar penetration rates move from less than 1 percent to perhaps 10 percent. As the cost of solar continues to plummet and reach parity with energy efficiency and traditional fossil fuel plants, new, riskier, investor-driven merchant solar projects that do not already have a buyer in-hand, per decades of traditional utility regulation, are starting to pop up and gain attention.
2.2.2. State and Regional Energy Context
California’s Renewables Portfolio Standard (RPS) is one of the most ambitious renewable energy standards in the country. The California RPS program requires investor-owned utilities (IOUs), electric service providers, and community choice aggregators to increase procurement from eligible renewable energy resources to 33 percent of total procurement by 2020. In his January 5, 2015, inaugural address, Governor Jerry Brown proposed that by 2030 the RPS be increased from one-third to 50 percent of the State’s electricity resources.4
California Environmental Quality Act (CEQA) issues are prominent in San Diego County. CEQA has been used legitimately, and some say inappropriately, to stop renewable energy development in the County of San Diego and other California counties. As a result, developers, County officials, and an active group of environmental stakeholders are interested in designing a “habitat-friendly” CREP that allows developers to adhere to CEQA while also speeding up the CEQA-related permitting process.
While utilities are busy trying to figure out how to make money on solar, they are also knee-deep in electric vehicle (EV) infrastructure development. EVs continue to gain market share. California accounts for about 40 percent of all plug-in cars sold in the U.S., with over 100,000 cars sold through August 2014 (Bloomberg News, September 9, 2014). Governor Brown issued an executive order in March 2012 that established the goal of getting 1.5 million zero-emission vehicles (ZEVs) on California roads by 2025. Environment California announced in October of 2014
4 For the full set of Governor Brown’s recommendations for California energy policy, see his complete transcript at: http://www.latimes.com/local/political/la-me-pc-brown-speech-text-20150105-story.html#page=1.
1 - 48

that California had more than 100,000 EVs on the road, and 20,000 of these vehicles are in San Diego County. Battery manufacturers are teaming with utilities and state governments in an attempt to lower the cost of batteries and create viable storage technologies, long considered the “holy grail” for renewable energy, since the energy produced by solar, wind, and other renewables can be generated, stored, and released when it is the most profitable to do so.
Complicating the CREP planning scenarios further is the fact that the County and its local governments are currently looking at participation in a new (one County) San Diego-area Regional Energy Network (REN), likely managed through the San Diego Association of Governments (SANDAG). This third REN would complement work performed by the other two RENs, one in the Bay area (the BayREN), and one in Los Angeles (the SoCalREN). The proposal to start a REN in this region has been around for years; only recently have the discussions seemed to pick up momentum with State and Public Utilities Commission (PUC) staff. How the REN is structured has huge consequences for the County. With active County involvement and leadership, and a commitment to implementing some of the recommendations contained in this report, the REN could be a valuable, worthwhile entity that could help the county increase renewable program involvement by a factor of 10 or more.
Community Choice Aggregation (CCA) refers to the opportunity for the County of San Diego to purchase electricity on behalf of its residential and commercial constituents. Numerous California counties are involved in CCA now. The potential benefits associated with CCA, a reduction in electricity costs and more renewables, are discussed in more detail in a separate section of this report. The County already benefits from electricity purchased via Direct Access, another option that allows the County to purchase electricity directly from competitive electricity service providers (ESPs). Direct Access has not been available to new residential customers since the program was suspended in 2001 during the energy crisis.
The County of San Diego is to be congratulated for its plans to create a regional energy plan (the CREP) focused on renewable energy. Most comprehensive energy plans are statewide, or confined within a local government territory. Comprehensive regional energy planning involving multiple local governments, aside from transportation plans required for federal funding, is a relatively new phenomenon. There are very few examples of regional energy plans. The first official regional energy plan occurred when 12 counties in Ohio worked on a plan in 2012, through the National Association of Regional Councils and Colorado Energy Group, Inc. Their focus was on moving their counties toward using more renewables and natural gas, and away from traditional coal power supplies. The County of San Diego has the opportunity to engage adjacent counties in the CREP, especially the eastern portion of the county where so much renewable energy development and associated new transmission line planning are occurring. Air quality and the associated regulations managed through the County of San Diego’s Air Pollution Control District can be positively impacted and influenced by increased renewable energy in the region.
Many local governments are looking to regional energy plans to help address the fact that energy outages do not neatly follow geographic boundaries or transmission line routes. California local governments are designing and implementing new Energy Assurance Plans (EAPs) and Energy Resilience Plans (ERPs) that identify and prioritize key assets and services provided by government, and “harden” the power sources associated with these assets and services making them more resilient. The City of Chula Vista was one of only three California local governments of the first 43 local governments to design and implement an EAP since 2009 with the help of federal funding (the other two were Visalia and San Jose).5 The County of San Diego Office of Emergency Services is currently preparing an Energy Resilience Plan (ERP). Using solar photovoltaics (PV) as back-up or primary power to key assets within the framework of an ERP, can bolster the CREP.
5 CEC, CaLEAP, September 2014.
1 - 49

Generally, most of the innovation with renewable energy programs comes from local governments. They have more flexibility, and are able to act more quickly than their Federal and State counterparts. The City of Lancaster, California, aspires to be the “Solar Capital of the World,” and has set-up a business division within the City to both sell renewable energy to other cities, and also provide technical assistance to cities that want to generate electricity through solar. Lancaster also requires that all new residential construction incorporate solar power, an aggressive and rare policy. Dozens of similar policies are highlighted in the Best Practices chapter.
2.2.2.1 The Local Energy Context in San Diego County
Current County resources directed to renewable energy, and energy in general, are divided among multiple departments. The County participates in multiple energy collaboratives across the region and participation is dictated by the subject area. As of early 2015, there is no centralized coordination of efforts in the County when it comes to energy.
The County currently participates in San Diego Gas and Electric Company’s (SDG&E) Local Governement Partnership Program. The LGP provides funding for energy efficiency program implementation across three departments: Planning and Development Services (PDS), Department of Parks and Recreation (DPR), and Department of General Services (DGS) (SDG&E and County of San Diego, 2015).
The County participates in the San Diego Association of Governments (SANDAG) Energy Working Group,which provides input and feedback on issues related to the Regional Energy Strategy and tasks of the Regional Energy Planning Program . The County also participates in the Regional Planning Technical Working Group, a key forum for decisions related to SANDAG’s Regional Transportation Plan and implementation of its projects and programs. In addition, the County plays a role in the Bicycle Pedestrian Working Group, which establishes grant criteria and oversees the dispensing of grants for active transportation projects (County of San Diego 2013).
The County has an effective Strategic Energy Plan (SEP) in place that is primarily focused on the internal actions of the County. The SEP is currently based on a three-year cycle, and the next cycle will likely be a five-year cycle, with updated plans developed to address regulatory, technical, economic, and societal changes. The main priorities for the next update are to: minimize utility (water and energy) consumption/costs and to ensure sustainability practices are assimilated into the organization.
The County will be developing a new Climate Action Plan (CAP). The purpose of the CAP will be to address issues related to growth and climate change, and to safeguard the environment for residents and visitors. Approval and implementation of the CAP will result in emission reductions.
The County has several notable achievements in the renewable energy and energy efficiency areas. As of December 2012, the County permitted more than 45.25 megawatts of renewable energy in the unincorporated area, which generates the equivalent of enough annual power for approximately 45,000 single-family homes. From fiscal years 2010 to 2013, there was an average of 1,588 photovoltaic permits issued each year in the unincorporated area of San Diego County, with a 138 percent increase from 2010 and 2011 to 2012 and 2013 (County of San Diego 2013).
The County has offered permit fee waivers for residential solar PV electrical system permits since 2001, and permit fee waivers for residential small wind turbine electrical systems since 2008. Amendments to the Zoning Ordinance were adopted in 2010 that codify the use of on-premise energy systems, which include height and setback exceptions for solar PV systems, and an administrative permit process for smaller (<10-acre) PV distribution facilities. A Wind Energy Ordinance was approved that provides an updated set of definitions, procedures, and standards for review and permitting of small turbines. The County also
1 - 50

encourages developers of new affordable housing developments to include solar PV systems, where cost effective.
Power Purchase Agreements (PPAs) are used by the County for renewable energy installations on County facilities. The County has installed solar PV at 16 different County facilities with an estimated annual output of 1.2 million kWh. More than 62 percent of that capacity comes from installations at nine facilities since 2010. Financing for these projects came from a mixture of California Energy Commission (CEC) loans, Federal grants, and County funds. With respect to the impact of solar PV incentives, the County’s official goal was, “…generation of 5 percent of existing residential electricity and 8 percent of existing commercial electricity with alternative energy systems” (E.Sikemma, County SEP). Available data show that approximately 6.7 percent of residential consumption is now being generated by alternative systems (most likely all solar PV) and only 0.2 percent of commercial consumption is being generated by commercial solar PV (E. Sikemma).
The number of permits issued for residential PV has increased exponentially since 2000. The County processed 1,935 PV permits, which were issued between July and October of 2014. The estimated cumulative annual electricity produced by residential solar PV systems increased from 608,261 kWh to 92 million kWh between 2007 and 2013. By comparison, the estimated annual kWh output from residential installations is more than 27 times that generated by County facilities. Permit activity has been much lower on the commercial side. Estimated cumulative annual production over the same period of time is 1.7 million kWh, less than 2 percent of electricity from solar PV from homes.
1 - 51

3. How Energy Impacts San Diego County’s Economy
3.1. Overview
Within its 4,200 square miles of land, San Diego County is home to 18 incorporated cities and numerous other charming neighborhoods and communities. It is renowned for its idyllic climate; music, arts, and culture; and 70 miles of pristine beaches. Whether strolling the City’s cultural heart of Balboa Park or hiking East County’s Anza-Borrego Desert State Park, the region is truly a remarkable place. Moreover, San Diego County is a bright spot in the U.S. economy. Its job growth and retail sales are projected to slightly outpace overall levels within the nation as a whole. At the same time, there are worrisome elements emerging on the horizon. While there are signs of potential weaknesses within the San Diego economy, there is good news. There are significant opportunities not only to offset those prospective weaknesses, but also increase the vitality of the area’s economy as well as social and environmental well-being.
Before examining the long-term state of the County’s emerging economy, and especially the unincorporated regions of the County, this Section will first step back to look at the connection between energy and regional economic activity. Notably, recent historical trends of California’s economy as it is positively affected by increased energy productivity will be examined. Further examination includes a possibly weaker job creation process in the United States, in California, and especially San Diego County. By taking a longer historical view, one can begin to see some bothersome tendencies that are shaping a less positive outcome for the County. More broadly, in fact, the U.S. economy appears to have been slowly weakening over the last half-century – and this weakening trend is projected to continue over the next several decades.
FIGURE 3-1. The Link between California Energy Productivity and Per Capita GRP
Source: Author calculations using Woods and Poole economic data (2014) and Energy Information Administration primary energy data (2014), both for the State of California.
What is the general cause of this worrisome trend? In short, the trend of a slumping U.S. economy is strongly connected to a decrease in the rate of high quality energy converted into actual work, where work is the ability to transform matter into the desired level of goods and services (Laitner 2014). In other words, the rate at which
1 - 52

more goods and services are obtained for every unit of energy used within the economic process has not improved sufficiently to ensure a more vigorous level of economic activity. In the period 1950 to 1980, for example, the rate of converting high quality energy into work improved about 1.4 percent per year. Over the subsequent 30-year period, 1980 to 2010, that rate of improvement declined to only 0.4 percent. As the rate of economy-wide improvement declines, so too does the rate of improved economy-wide productivity (Laitner 2014). A small decrease in the rate of improved economic productivity, in turn, results in a lagging growth in economic activity as measured by the nation’s Gross Domestic Product, or GDP, or within San Diego County, what is referred to as Gross Regional Product, or GRP. With a slightly lower magnitude of GRP, fewer jobs can be expected and generally a less dynamic material standard of living.6
Fortunately, these weakening trends can be mitigated or entirely reversed with smarter energy investments. Explained more in depth below, the County’s CREP provides a critical opportunity to diversify the region’s energy portfolio by increasing investment in renewable energy systems and energy efficiency. These investments will increase the rate at which the region converts energy into goods and services. This increase in goods and services (output) from each unit of energy (input) is otherwise known as the energy conversion rate. Should the County increase renewables and efficiency as a percentage of its total energy needs, its energy conversion rate will increase, and so too will the region’s economic productivity. Consequently, an increasing rate of economic productivity will result in a higher Gross Regional Product (GRP), creating more jobs and a higher standard of living for the region even as the environmental impacts and climate burdens are greatly diminished.
3.2. A Closer Look at the Evidence
A useful way to begin examining the link between energy and the San Diego economy is to examine three immediate sets of data: (i) the link between per capita GRP and energy productivity; (ii) projections of future per capital GRP, which is an economy-wide measure of overall economic productivity; and finally, (iii) the expected rate of future job expansion within the County. These are discussed, in turn, beginning with FIGURE 3-1, below, which highlights the upward trend in California’s per capita GRP as it has been enabled by greater levels of energy productivity. The data covers the historical period 1970 through 2012. The blue dots show the historical data while the dashed red line highlights the overall trend. The bottom line is that the economic well being as measured by per capita economic activity (per capita GRP valued in constant 2009 dollars to eliminate the impact of inflation) very closely tracks the rising level of energy productivity over time.
Several comments are worth noting at this point. First, California-wide data is used because the energy data for San Diego County isn’t collected in the same way or as consistently. Yet, the same pattern as shown in the figure above (FIGURE 3-1) appears for both the U.S. as a whole, and for other countries for which comparisons have been drawn. And that pattern also shows for other assessed states, whether Texas, Ohio, Arizona, Maine, Hawaii, or elsewhere. So there is a high degree of confidence that this same linkage would hold for San Diego County, even if it differs in some aspect or magnitude.
A second point is that while there is some variability in the relationship, a rising energy productivity – measured here as the number of GRP dollars that might be supported for every unit of energy – is absolutely critical to drive up greater per capita GRP. The reason may not be immediately obvious, but greater energy productivity means less wasted energy which, in turn, reduces a large number of costs that enables the economy to move ahead more briskly (Campbell, Ryan et al. 2014). Thus, if San Diego County wants to move its economy forward, policies, programs, and practices will all need to be directed toward greater and greater energy and resource efficiency at all
6 This, admittedly, is a highly technical analysis, but it is also one that is vital to understanding how a more vital level of economic activity might be better promoted within San Diego County. In short, for a more productive economy, policies and investments should promote a more productive use of materials, water, and especially energy resources at all levels of activity. For a deeper background in these more technical details, see Ayres and Warr (2009) and Kümmel (2011), in addition to Laitner (2014).
1 - 53

levels within the economic process. The bottom line is that if residents and businesses within San Diego County want to ensure a sustained and more vigorous level of economic activity, the County would do well to focus on greater energy and resource productivity. Indeed, it is very likely that increased per capita income will be supported only by greater energy productivity.7
TABLE 3-1 (below) offers a first look at three different economic variables specifically for San Diego County. These include population growth trends (column A), the growth in per capita Gross Regional Product (column B), and the total growth in the County’s GRP (column C). As shown in the earlier FIGURE 3-1, the latter two variables are again valued in 2009 constant dollars. Here, the County’s historical record in the years 1970 to 2014 (row 1) are reviewed jointly with future projections from 2014 to the year 2040 (Woods and Poole 2015).8 Population in San Diego County has grown about 2 percent per year since 1970. This is about twice as fast for the U.S. as a whole. Economy-wide productivity (again, measured as per capita GRP) grew at 1.9 percent annually which is about one-tenth of a percent faster than the U.S. Total GRP (found by multiplying per capita GRP by the population increase) and grew by a very healthy 4.0 percent average annual rate. On the other hand, it is the projections through 2040 that provide some cause for concern – especially the lagging productivity metric.
TABLE 3-1. Population, Productivity and GRP Growth Rates in San Diego County
Compound Average Growth Rate (A) Population
(B) Per Capita GRP
(C) Real GRP
(1) From 1970 to 2014 2.0% 1.9% 4.0% (2) From 2014 to 2040 1.1% 1.4% 2.6%
Source: Author calculations using Woods and Poole 2015 data.
Less worrisome is the drop in the population growth rate from 2 percent to 1.1 percent. What should be of immediate concern, though, is the apparent slump in the County’s economic productivity (per capita GDP) (shown in column B of Table 3-1), and the impact it will have on the County’s overall economy (column C). Although a difference of one-half percent doesn’t seem especially large, the following thought experiment illustrates the size of the potential impact on the regional economy. Population growth will be held to the projected 1.1 percent through 2040 (row 2, column A), while per capita GRP will be at the 1.9 percent historical rate shown in the period 1970 to 2014 (row 1, column B), instead of the currently projected rate of 1.4 percent. Holding these assumptions to be true, by the year 2040, the San Diego economy would be an estimated $47 billion smaller (again, in constant 2009 dollars) than might otherwise be possible. Based on the current economic profile for San Diego County (IMPLAN 2014), a smaller or less robust economy many also mean an average $5 billion fewer resources for some
7 In fact, there are two primary forms of energy productivity. First, there is the productivity in producing energy resources or generating electricity power. This happens in the combustion of fossil fuels to generate electricity, for instance. As one example, a modern coal-fired electric generation station may require a total of three units of energy for each unit of electricity that is created and sent over transmission and distribution lines to San Diego homes and businesses. New combined-cycle natural gas power plants may need three-fourths of that total energy. Combined heat and power plants (previously called cogeneration plants) require just half that amount while renewable energy technologies convert sunlight into electricity closer to a one-to-one basis. This is a significant improvement in production efficiency -- even if the solar panels fail to capture all of the light that falls on those panels. Second, there are also greater end-use efficiencies, such as the use of solid-state lighting to provide area illumination rather than the century-old incandescent or Edison lamps. The former, known as light-emitting diodes (or LEDs), require just one-tenth the energy (or less) to provide the same amount of lighting as incandescent bulbs. Both large-scale energy production and energy end-use efficiencies will be needed if San Diego County is to drive a more robust and more sustainable economy over time. 8 Woods and Poole Economics is an experienced independent firm that specializes in long-term county economic and demographic projections. Their updated annual county projections have been available since 1983. Our team has relied on their data for well over a decade. But, to ensure credible estimates the authors also compared the Woods and Poole projections with comparable data made available from Moody’s Analytics (2015). Interestingly, Moody’s suggests a slightly more pessimistic outcome.
1 - 54

combination of investment and state and local government revenues. This means fewer dollars available for infrastructure upgrades, and fewer revenues to fund educational, social, arts and cultural programs, for example.
The critical question is this: what is the general cause or causes of the fading rates of economic progress? The answer, in part, is provided by the discussion related to FIGURE 3-1. The deceleration of improvements in the conversion of energy to actual “useful work” is a critical constraint on economic activity. Indeed, the current energy system in the United States is not particularly efficient at converting energy into goods and services. Of the total high quality energy consumed to support U.S. economic activity in 2010, only 14 percent was converted into useful work. In other words, the American economy wasted 86 percent of all the energy used that year in the production of goods and services. And that magnitude of waste imposes a larger array of costs that further limits both economic activity and the job creation process (Laitner 2014).
FIGURE 3-2 provides a further look into the emerging economic prospects for San Diego County. In this case, trends in job growth are reviewed over the same historical period, from 1970 to 2014, as that compares to the projected increase in jobs out to the year 2040. The solid blue line shows the historical and the projected data while the red line highlights the overall trend. One quickly notes two things in the graph: (i) the historically volatile job creation process over time, gaining 4 percent to 7 percent new jobs in some years and losing more than 2 percent of the jobs in other years; and (ii) the generally downward sloping trend from the 1970s with future advances hovering below 2 percent per year. Indeed, the average annual job growth was 2.5 percent over the historical period 1970 to 2014 while the future expansion of jobs may average just 1.5 percent through the year 2040. The difference between the historical rate of improvement and the population-adjusted growth rate (reflecting a smaller gain in population as shown in TABLE 3-1) means that San Diego County may produce between 125,000 and 175,000 fewer jobs on average in the period 2014 to 2040. By the year 2040 it may be between 280,000 and 380,000 fewer new jobs compared to historical rate of development.
1 - 55

FIGURE 3-2. San Diego County Historical and Projected Average Job Growth Rates
Source: Author calculations using Woods and Poole 2015 data
Like the United States, San Diego County maintains a reasonably flourishing yet slowly weakening economy. Economist, international lecturer, and best-selling author Jeremy Rifkin suggests that there are diminishing returns on the current generation of the mostly 20th century technologies now at work in the economy (Rifkin 2011). This perspective is supported by an examination of how energy productivity drives material and economic prosperity (Ayres and Warr 2009) that points to a lagging rate of improvement in the use of materials, water, and especially energy resources (Laitner 2014); see also, (Kümmel 2011). Also at play is an infrastructure that suffers the effects of deterioration and that is in need of improvement and expansion to survive growing demands from County residents and businesses (ASCE San Diego Section 2012). A working memo, based on assessments of the quality of infrastructure in both the United States and California (American Society of Civil Engineers 2012, American Society of Civil Engineers 2013), indicates that San Diego may have between $16 billion and $26 billion in unfunded infrastructure upgrades (Laitner and Keller 2015). All of this points to the need to invest in the larger energy productivity of the San Diego regional economy – especially within the unincorporated areas of the County. The next section will place energy expenditures in context, followed by review of a series of four “Energy Innovation” scenarios to build a more positive economic momentum for the County.
1 - 56

3.3. A DEEPER Look at San Diego County’s unincorporated areas
3.3.1. Energy Expenditures in Context
With an estimated 505,000 residents, the unincorporated areas are about 15.5 percent of San Diego County’s total population, but they appear to pay about 17.4 percent of the cost of total County energy expenditures. Energy-related data for San Diego County is not collected in the same detail as it is tracked for either in the U.S. or the State of California. Yet, a number of data sources can be pulled to generate a reasonable profile of aggregate electricity, natural gas, and gasoline consumption. TABLE 3-2 provides this first look at energy expenditures for the entire County and for the unincorporated areas of the County as well.
TABLE 3-2. Summary of Energy Expenditures (in millions of 2012 dollars)
Population (thousands)
Natural Gas Electricity Transportation
Total Energy
San Diego County 3,253 389 3,141 5,485 9,014
Unincorporated areas 505 40 504 1,025 1,569
Percent of County 15.5% 10.3% 16.0% 18.7% 17.4%
Source: Author calculations based on a variety of data and publications for San Diego County.
The energy expenditure data shown in the table above are for the year 2012, which is the base year of the economic model used to highlight the economic impacts of different patterns of spending (see Section 3.3.2 below for a detailed description of the modeling assessment). The County as a whole spends an estimated $9 billion dollars for energy while the unincorporated areas spend just short of $1.6 billion. There are two comments that should be noted here, however.
The estimates do not include a number of major fuel types as the data are not easily obtained at the County level. These include industrial use of coal, propane, compressed natural gas, and marine fuels, among other sources. If those resources in San Diego County scale at roughly the same magnitude as at the State level, then it is likely that that the region spends 25 percent to 30 percent more than is highlighted in TABLE 3-2. At the same time, the focus of the CREP shall be the use of electricity and natural gas resources – primarily sold through San Diego Gas & Electric Company (SDG&E). Hence, there is reasonable confidence that the data provide a solid working profile to suggest different ways the County can shape future energy production and consumption to boost a more vigorous economy.
Natural gas and electricity account for 35 percent and 39 percent of the expenditure listed in TABLE 3-2 for the unincorporated areas and the entire County, respectively. Said differently, transportation expenditures are 60 percent or more of the total energy costs highlighted in Table 3-2. This suggests that a future element of a truly comprehensive energy plan should include a strong transportation component. This is especially true given the significant trend toward the use of electric vehicles both in the County and across the State of California more generally; and especially as this new generation of cars and trucks may be powered by a variety of renewable energy resources.
3.3.2. Economic Assessment
A major question of this analysis is whether there is a more optimal mix of energy investments and expenditures to benefit the County and its unincorporated areas. This section seeks to address this question through the use of different economic scenarios that provide insights into different patterns of energy use. By evaluating those “innovation scenarios” within an economic mode, the costs and benefits can be compared and contrasted for their potential impact on the larger economy. In short, an investigation of how a change in investments and technologies
1 - 57
might benefit jobs, incomes, and net gains in overall economic activity is possible. To tackle this assessment, the future “reference case” must first be laid out to see what the economy might look like assuming no further changes in the region’s energy and economic recipe (i.e., business-as-usual). A set of four scenarios (described more fully below) is highlighted to provide different insights into future energy production and consumption patterns. While there are many new emerging technologies that will undoubtedly shape future energy markets (see the related box insert on the follow page which highlights four such technologies), the following innovation scenarios only explore the known and more established set of renewable energy and energy efficiency technologies.
Analysis of the four scenarios uses the DEEPER Modeling System to determine the net economic benefits of the different investment patterns. The Dynamic Energy Efficiency Policy Evaluation Routine (DEEPER) is a proprietary analytical tool first developed by John A. “Skip” Laitner in 1990 and continuously updated for numerous economic modeling activities over the years. It has been used for a wide variety of national, state, and local policy initiatives. It is a compact 15-sector quasi-dynamic input-output model of a given regional economy modified specifically for these economic assessments for the County of San Diego.
3.3.2.1 The Reference Case and Innovation Scenarios
The likely reference case projection for both the economy and the anticipated set of energy expenditures will be made over the period 2015 through 2050. The assumption is that the unincorporated areas of the County will generally follow the trends of the County as a whole, given the starting profile of the County shown in 2012 (the base year of the DEEPER Modeling System) and moving forward over the longer time horizon.
As projected by the County-level data made available by Woods and Poole (2015), but also corroborated by other projections from Moody’s Analytics (2015), and the California Energy Commission (Kavalec, Fugate et al. 2014, Kavalec, Fugate et al. 2014), among other resources, the regional population, employment, and overall economy are projected to grow annually at about 1.1 percent, 1.5 percent, and 2.6 percent, respectively (see also TABLE A-1 in APPENDIX A-1 to this assessment). The good news is that there will be normal improvements in the overall efficient use of energy resources. Hence, consumption of energy will increase more slowly than the economy will grow. Electricity use is projected to grow about 1.4 percent annually over the period 2012 through 2050. Natural gas consumption is projected to grow more slowly at about 0.5 percent per year in that same period of time.
On the other hand, the real costs of energy are anticipated to escalate 1.3 percent and 3.2 percent for electricity and natural gas, in that order. This means that the combined energy expenditures will expand at an average 2.8 percent per year, or about 0.2 percent faster than the economy as a whole. An additional assumption is that the State’s Renewable Portfolio Standard will continue to require that 33 percent of all electricity sales be provided with renewable technologies through 2050. It is against this complete energy and economic backdrop that the four Energy Innovation Scenarios are evaluated.
Innovation Scenario I. This first scenario slowly begins to introduce a set of changes to better explore how departures from the Reference Case might impact the unincorporated areas of the San Diego County economy. The assumption, here, is that some combination of renewable-generated electricity will continue to meet 33 percent of the required electricity generation, but that efficiency of electricity usage will increase to 20 percent above the normal rate of improvement by 2050. Natural gas consumption will increase to 15 percent of Reference Case consumption. The assumptions that underpin these details are more fully explained in APPENDIX A-1.
Innovation Scenario II. In his January 5, 2015, inaugural address, Governor Jerry Brown proposed that by 2030 the Renewable Portfolio Standard be increased from one-third to 50 percent of the state’s
1 - 58

electricity resources.9 This scenario reflects that proposed change in the RPS with the further assumption that energy efficiency will reach 25 percent of total electricity consumption by 2050. Natural gas efficiency is assumed to remain at 15 percent of that usage.
Innovation Scenario III. Building on the previous scenario, this next step highlights an RPS that rises from 50 percent in 2030 so that it then rises to a full 80 percent electricity by 2050. Again, energy efficiency is assumed to increase to 25 percent and 15 percent for electricity and natural gas, respectively, also by the year 2050.
Innovation Scenario IV. Building on increments found in Innovation Scenario III, this scenario explores the prospect of an RPS that climbs from 50 percent in 2030 to a full 100 percent by 2050. Again, energy efficiency is assumed to increase to 25 percent and 15 percent for electricity and natural gas, respectively, also by the year 2050.
Given these assumptions for each of the innovation scenarios, the authors use the DEEPER modeling system to isolate the key economic impacts within the unincorporated areas of San Diego County – including net costs and savings, as well as the impact on jobs, income, and carbon dioxide emissions. APPENDIX A-1 includes more of the specifics of the modeling assumptions. The next subsection below summarizes the key results of each Innovation Scenario.
9 For the full set of Governor Brown’s recommendations for State energy policy, see his complete transcript at: http://www.latimes.com/local/political/la-me-pc-brown-speech-text-20150105-story.html#page=1.
1 - 59

BOX 1. Emerging Market Technologies
3.3.2.2 Net Economic Impacts
The most immediate impact that can be explored is the change in overall energy bill expenditures as they are affected by the assumptions in each of the four Innovation Scenarios. TABLE 3-3 offers that set of comparisons for the years 2015, 2025, 2040, and 2050. The expenditures are valued in millions of 2012 dollars which reflects the base year of the DEEPER Modeling System.
1 - 60
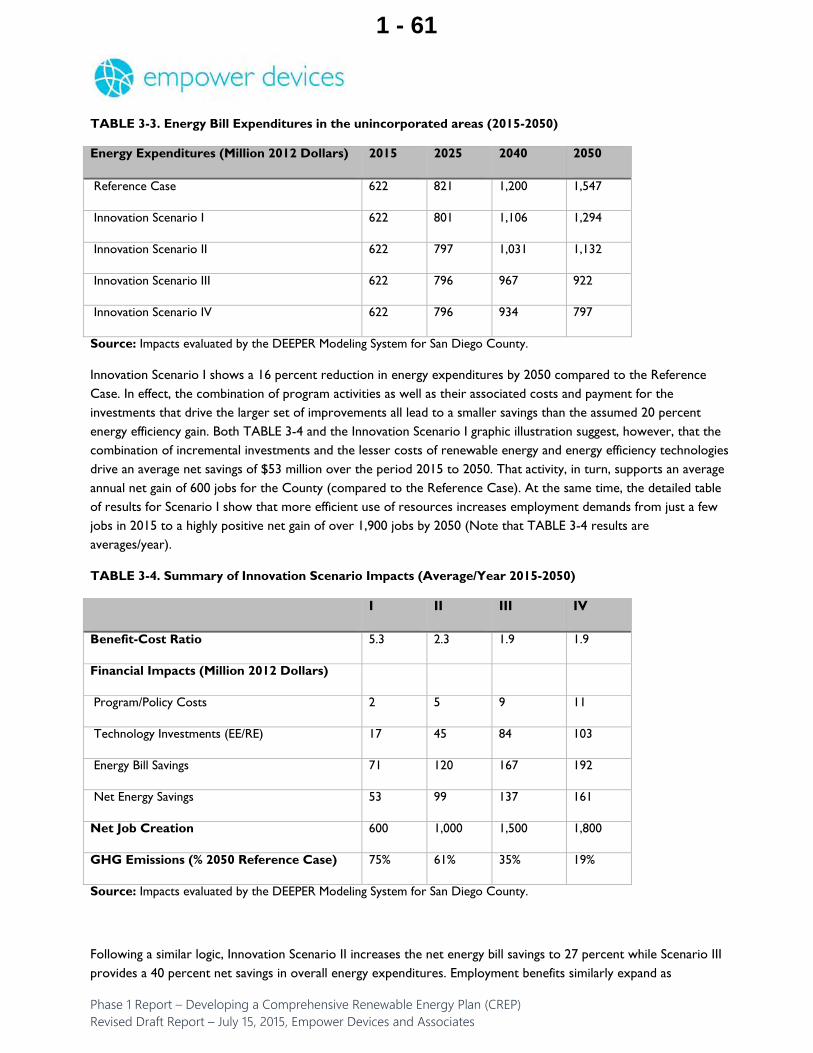
TABLE 3-3. Energy Bill Expenditures in the unincorporated areas (2015-2050)
Energy Expenditures (Million 2012 Dollars) 2015 2025 2040 2050
Reference Case 622 821 1,200 1,547
Innovation Scenario I 622 801 1,106 1,294
Innovation Scenario II 622 797 1,031 1,132
Innovation Scenario III 622 796 967 922
Innovation Scenario IV 622 796 934 797
Source: Impacts evaluated by the DEEPER Modeling System for San Diego County.
Innovation Scenario I shows a 16 percent reduction in energy expenditures by 2050 compared to the Reference Case. In effect, the combination of program activities as well as their associated costs and payment for the investments that drive the larger set of improvements all lead to a smaller savings than the assumed 20 percent energy efficiency gain. Both TABLE 3-4 and the Innovation Scenario I graphic illustration suggest, however, that the combination of incremental investments and the lesser costs of renewable energy and energy efficiency technologies drive an average net savings of $53 million over the period 2015 to 2050. That activity, in turn, supports an average annual net gain of 600 jobs for the County (compared to the Reference Case). At the same time, the detailed table of results for Scenario I show that more efficient use of resources increases employment demands from just a few jobs in 2015 to a highly positive net gain of over 1,900 jobs by 2050 (Note that TABLE 3-4 results are averages/year).
TABLE 3-4. Summary of Innovation Scenario Impacts (Average/Year 2015-2050)
I II III IV
Benefit-Cost Ratio 5.3 2.3 1.9 1.9
Financial Impacts (Million 2012 Dollars)
Program/Policy Costs 2 5 9 11
Technology Investments (EE/RE) 17 45 84 103
Energy Bill Savings 71 120 167 192
Net Energy Savings 53 99 137 161
Net Job Creation 600 1,000 1,500 1,800
GHG Emissions (% 2050 Reference Case) 75% 61% 35% 19%
Source: Impacts evaluated by the DEEPER Modeling System for San Diego County.
Following a similar logic, Innovation Scenario II increases the net energy bill savings to 27 percent while Scenario III provides a 40 percent net savings in overall energy expenditures. Employment benefits similarly expand as
1 - 61
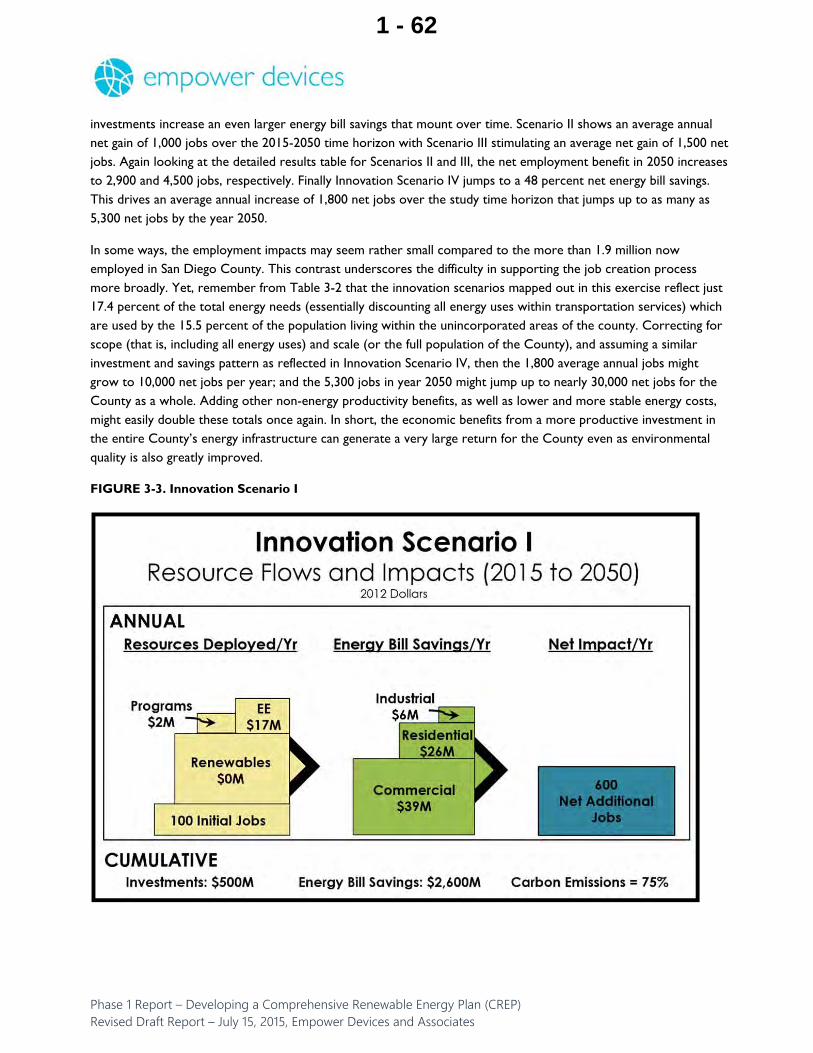
investments increase an even larger energy bill savings that mount over time. Scenario II shows an average annual net gain of 1,000 jobs over the 2015-2050 time horizon with Scenario III stimulating an average net gain of 1,500 net jobs. Again looking at the detailed results table for Scenarios II and III, the net employment benefit in 2050 increases to 2,900 and 4,500 jobs, respectively. Finally Innovation Scenario IV jumps to a 48 percent net energy bill savings. This drives an average annual increase of 1,800 net jobs over the study time horizon that jumps up to as many as 5,300 net jobs by the year 2050.
In some ways, the employment impacts may seem rather small compared to the more than 1.9 million now employed in San Diego County. This contrast underscores the difficulty in supporting the job creation process more broadly. Yet, remember from Table 3-2 that the innovation scenarios mapped out in this exercise reflect just 17.4 percent of the total energy needs (essentially discounting all energy uses within transportation services) which are used by the 15.5 percent of the population living within the unincorporated areas of the county. Correcting for scope (that is, including all energy uses) and scale (or the full population of the County), and assuming a similar investment and savings pattern as reflected in Innovation Scenario IV, then the 1,800 average annual jobs might grow to 10,000 net jobs per year; and the 5,300 jobs in year 2050 might jump up to nearly 30,000 net jobs for the County as a whole. Adding other non-energy productivity benefits, as well as lower and more stable energy costs, might easily double these totals once again. In short, the economic benefits from a more productive investment in the entire County’s energy infrastructure can generate a very large return for the County even as environmental quality is also greatly improved.
FIGURE 3-3. Innovation Scenario I
1 - 62
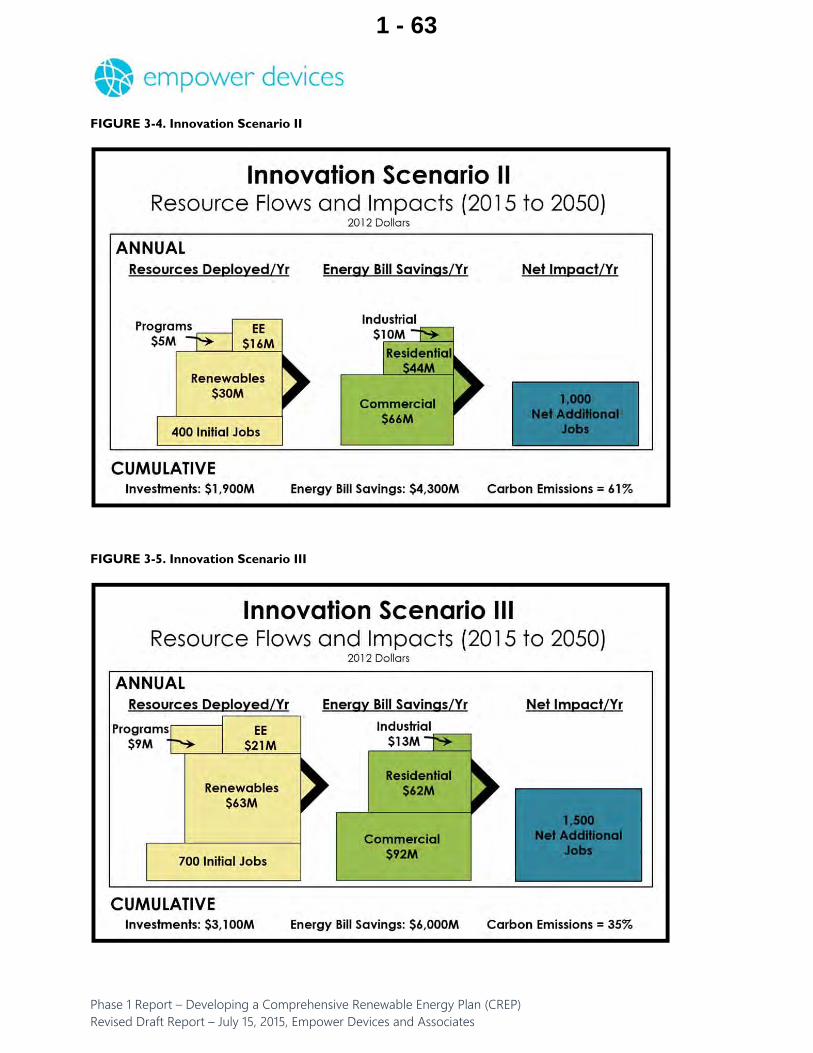
FIGURE 3-4. Innovation Scenario II
FIGURE 3-5. Innovation Scenario III
1 - 63

FIGURE 3-6. Innovation Scenario IV
3.3.2.3 Environmental Gains and Benefits
The inefficient conversion of energy leads to a large fraction of excess heat and other wastes, including fly ash and air pollutants, such as sulfur dioxide, nitrogen oxide, and volatile organic compounds that do not contribute to the economy and create health problems and other impacts including the costs of disposal (Ayres and Warr 2009). By definition then, reducing energy waste—whether in the production of electricity or the use of energy in homes and businesses—should create additional economic benefits in addition to the job and income opportunities that were previously described. This section explores several of these elements as indicated by TABLE 3-6, below.
1 - 64

TABLE 3-5. Average Annual Environmental Benefits by Scenario
I II III IV
Avoided Adult Mortality 0.6 to 1.4
Avoided Lost Work Days 97
Total Health Effects (Low – Millions of Dollars) $4.6
Total Health Effects (High – Millions of Dollars) $10.5
CO2 Emissions as Percent of 2050 Reference Case 75% 61% 35% 19%
Source: EPA Cobra Model (Abt 2013) and the DEEPER Modeling System for San Diego County.
The good news is that San Diego County already has a relatively clean set of emissions from its energy supply largely comprised of natural gas and renewable energy resources. Furthermore, both California and the County are already more energy-efficient than the U.S. as a whole. Finally, the Innovation Scenarios examine possible transitions from only electricity and nature gas energy usage, making up 17 percent of the total energy used within the unincorporated areas of the County. For these reasons, environmental benefits explored here—looking only at the net health impacts and the reduction in carbon dioxide emissions which might be obtained—are small but still significant.
Looking first at the prospective health benefits from Innovation Scenario IV (the only scenario for which this particular assessment was done), TABLE 3-5 notes only very small impacts from the very limited slice of total energy uses in the unincorporated areas of the County. At the same time, if the impacts were extended to the full population of the County rather than merely the unincorporated areas, the health benefits might grow from between $4.6 and $10.5 million, to as much as $67 million per year. Avoided mortalities might expand to 4 to 9 avoided deaths annually while avoided lost work worker days might increase to more than 600 per year. Moreover, since these scenarios extend to just 17 percent of the total energy resources consumed within the County, extending the Innovation Scenarios to all uses of energy, the health impacts might be further amplified by a factor of five or more.
The DEEPER Model provides more year-to-year detail with respect to carbon dioxide (CO2) emissions. For the 2012 base year, it appears that total CO2 emissions—including transportation, waste, and water-related greenhouse gases in addition to electricity and natural gas uses—amounted to 4.4 million tonnes of CO2
emissions equivalent in the unincorporated areas only (Gordon, Silva-Send et al. 2013). The DEEPER model suggests that electricity and natural gas uses contributed approximately 1.15 million tonnes equivalent, or about 26 percent of total greenhouse gases discharged in that year. Innovation Scenario I, as reflected in TABLE 3-5, provides the smallest reduction of just 0.45 million tonnes by 2050. This means that the combination of renewable energy and energy efficiency technologies will bring emissions down to 75 percent of the 2050 reference case. Innovation Scenario IV, on the other hand, reduces emissions by 1.34 million tonnes which is about 19 percent of the 2050 reference case projections. If the County wants to think in terms of an 80 percent reduction in carbon dioxide emissions, then it will be compelled to look closely at a scenario approximating Innovation Scenario IV.
1 - 65

3.4. Further Insights and Conclusions
The Box II insert on the following page uses Innovation Scenario IV to illustrate one plausible pattern of how the transition to a more productive economy might look in terms of the possible deployment of both renewable energy and energy efficiency technologies. Using all four of the Innovation Scenarios as a benchmark, the modeling assessment indicates that both the unincorporated areas of the County and San Diego County as a whole, are underperforming, as follows:
Businesses and residents may be paying more than necessary for the various uses of electricity and natural gas.
Redirecting program expenditures and investments away from the spending on conventional energy infrastructure can increase both employment and income opportunities for the economy as a whole.
While the environmental benefits are relatively small compared to the more typical economic impacts, this is because of an already more energy-efficient economy that is mostly powered by a cleaner set of generation resources. Yet, the impacts remain significant.
As previously noted, if the scenarios were expanded to include all uses of energy and also examined the impact across all economic sectors and geographic regions within the County, one can quickly see the many important benefits of a more productive pattern of investments in the region’s energy infrastructure. What may not be immediately apparent, but recalling the discussion surrounding FIGURES 3-1 and 3-2, is that these same investments can provide a critical hedge against a slowly weakening economy that may erode over time without accelerating the pace of the more productive use of materials, water, and especially clean energy resources. Indeed, if the County is to achieve anything close to an 80 percent reduction in total greenhouse gas emissions, it will need to begin with Innovation Scenario IV as it might apply to all energy uses within the economy.
1 - 66

FIGURE 3-7. Comparing Upside and Downside Risks
FIGURE 3-7 provides another look at the long-term energy problem confronting San Diego County. Yes, as suggested in Section 5 on best practices, there appear to be some good programming efforts already in place, and an innovative spirit that guides the overall direction of the County’s climate and energy plans. But what are the downside risks? And how might they weaken overall economic activity? More critically, how might the different Innovation Scenarios point to a more pre-emptive effort? And how might the County embrace both the financial capacity characterized in Section 4 that follows, and the set of best practices that are reviewed in Section 5, to offset the possible downside risks—indeed, to catalyze a more robust and sustainable economy over the decades to come?
1 - 67
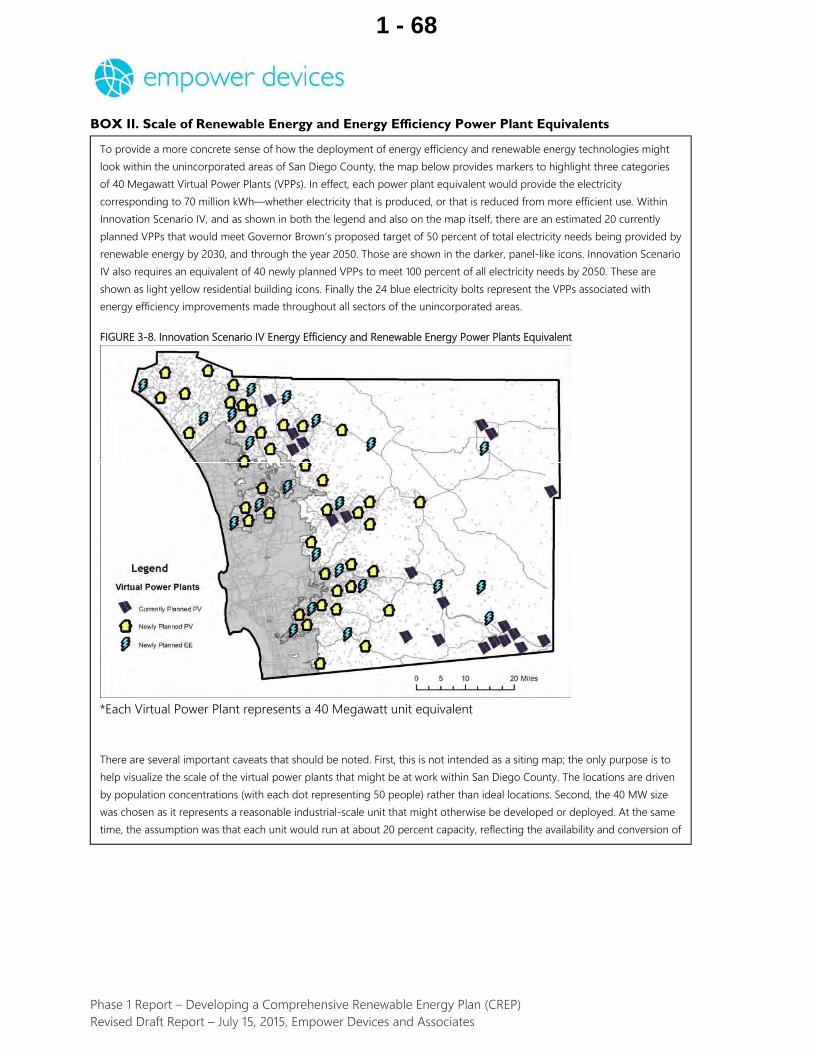
BOX II. Scale of Renewable Energy and Energy Efficiency Power Plant Equivalents
1 - 68

TABLE 3-6. DETAILED RESULTS FROM INNOVATION SCENARIO I
1 - 69

TABLE 3-7. DETAILED RESULTS FROM INNOVATION SCENARIO II
1 - 70

TABLE 3-8. DETAILED RESULTS FROM INNOVATION SCENARIO III
1 - 71

TABLE 3-9. DETAILED RESULTS FROM INNOVATION SCENARIO IV
1 - 72

4. Institutional Arrangements and Financing Mechanisms
4.1. Introduction
Having explored the economic assessment and the attendant benefits in Section 3, this next section examines how various institutional arrangements and/or financial mechanisms might help the County achieve these Innovation Scenario results. There are a wide array of institutional arrangements and financial mechanisms that the County may harness to drive greater investments in renewable energy and energy efficiency (RE/EE). Section 4 is by no means an exhaustive list, but a high level overview of some of the tools at the County’s disposal.
In this context, institutional arrangements can be thought of as the organizational and/or administrative entities that help foster investment in RE/EE. The three institutional arrangements explored in this section are: (i) community choice aggregation (CCA); (ii) direct access; and, (iii) sustainable energy utility. Institutional arrangements may themselves be able to house one or more different financial mechanisms, which may allow for synergies across multiple financial mechanisms and greater efficacy overall.
A financial mechanism, on the other hand, is a tool for directing capital for investment and subsequent deployment of energy efficiency and renewable energy systems. The financial mechanisms explored herein are: (i) Property Assessed Clean Energy (PACE) financing; (ii) bonds; and, (iii) crowdfunding.
As illustrated below in Figure 1, increased investment in RE/EE can be driven by institutional arrangements that help direct and deploy the capital raised through various financial mechanisms. This section concludes with a qualitative assessment comparing the various institutional arrangements and financial mechanisms outlined above by their ability to help drive greater levels of investment in RE/EE.
1 - 73

FIGURE 4-1. Relationship between Institutional Arrangements, Financing Mechanisms, and Investment in Renewables/Energy Efficiency
Investment inRE/EE
FinancialMechanisms
InstitutionalArrangements
1 - 74

1 - 75

4.2. Community Choice Aggregation
Communities across California are increasingly exploring ways to have more and precise control over their electricity use—both as a means to address the impacts of climate change and to enhance their local economies. Community Choice Aggregation (CCA) is one possible vehicle for achieving these objectives. CCA allows city and county governments to aggregate or pool electricity customers to purchase and develop power, as well as to administer energy programs on behalf of their residents and businesses. This institutional arrangement allows the local community to shape the CCA program to prioritize desired benefits, including but not limited to, increased investment in renewable energy sources and energy efficiency, economic development, carbon reduction strategies, and workforce development efforts. Note that only the electricity generation portion of electricity service can be provided by the CCA entity.
To date, CCA has been established by law in six states and is under consideration in at least four others (Figure 4-2).10 CCA is an energy supply model that works in partnership with the region’s existing utility, which continues to deliver power, maintain the grid, and provide consolidated billing and other customer services. As illustrated in Figure 4-3, CCA can be described as a hybrid-approach to the provision of energy services—sitting somewhere between an investor-owned utility and a municipal public utility.
FIGURE 4-2. Nationwide Context
FIGURE 4-3. CCA: A Hybrid Approach to Providing Energy Service
10 CCA is statutorily enabled in California, Illinois, Ohio, Massachusetts, New Jersey, and Rhode Island. Utah, New York, Delaware, and Minnesota are considering statutory enablement of CCA.
1 - 76

Source: LEAN Energy US (2002)
By establishing a CCA program, cities and counties can take increased ownership and control over their electricity generation and consumption. More than just buying and selling electricity, a CCA provides a platform for managing the community’s energy resource through the administration of energy efficiency programs, as well as through the development of local renewables. Indeed, some local communities have been motivated to form community choice programs as a means to achieve greater levels of renewable energy generation, encourage local investment in energy resource development, reduce greenhouse gas emissions, amplify the community’s level of energy efficiency, and catalyze electricity grid modernizations efforts (Gordon 2014).
4.2.1. California Community Choice Aggregation Background
In 2002, the California Legislature, through Assembly Bill 117, enacted legislation permitting the creation of CCA programs (2002). Under the legislation, codified as Public Utilities Code §366.2, a city, county, or Joint Powers Authority (JPA), comprised of two or more cities and counties, may implement a CCA program. Governor Jerry Brown signed California Senate Bill 790 in October 2011, which also allowed a CCA to be formed by the Kings River Conservation District, the Sonoma County Water Agency, and any California public agency possessing authority to generate and deliver electricity at retail within its designated jurisdiction (2011). In January 2012, the authority to form a CCA was furthered expanded when Governor Brown signed California Senate Bill 4 into law, providing that special districts may also become community choice aggregators.
Once formed, customers within the CCA service area are automatically enrolled, but may opt out of the CCA and continue to receive bundled electricity service from the investor-owned utility (IOU). Customers that do not opt out will have their electricity supplied by the CCA entity. The IOU continues to provide and bill CCA customers for electricity transmission and distribution, as well as other services, such as meter reading, billing, efficiency incentives, and such. Only the electricity generation portion of electricity service can be provided by the CCA
1 - 77

entity. Customers of a CCA continue to pay the same charges for the delivery of the power—transmission and distribution—as customers that remain with the IOU. The CCA entity must pay the IOU for other services provided to the CCA (e.g., billing services).
As noted, customers within a CCA jurisdiction may choose to opt out of the CCA program and continue to receive electricity from the IOU. The CCA entity is required to send at least four notices to customers informing them of their ability to opt out of the CCA program. The requisite notice schedule is as follows: two notices before CCA service starts, and two more in the first two billing cycles after CCA service starts. Customers not opting out of the CCA program at the outset of the program nevertheless retain the ability to opt out later and return to receiving electricity from the IOU. In the case of a later opt-out by a customer, the CCA program can impose a surcharge to recover any stranded costs of obtaining electricity supplies or generation capacity for that customer.
Since authorization in 2003, a number of CCA programs have been proposed but not implemented, including programs in San Francisco (CleanPowerSF), the East Bay (Oakland, Berkeley, and Emeryville), and the San Joaquin Valley (San Joaquin Valley Power Authority). The first CCA program to operate in California, Marin Clean Energy, was formed in Marin County and began serving customers in May 2010. Most recently, Sonoma County launched Sonoma Clean Power in 2014 and the City of Lancaster, through Lancaster Choice Energy, began offering service to select customers in May 2015, with broad public enrollment in late 2015.11
4.2.2. Community Choice Aggregation in San Diego
In 2005, San Diego County participated in the Community Choice Aggregation Demonstration Project, which was commissioned by the California Energy Commission and the United States Department of Energy to assist local governments in evaluating and implementing CCA. Navigant Consulting was tasked with developing a report to study the feasibility of the County forming a CCA program (Navigant 2005). The report contained detailed economic feasibility analyses and recommendations to help the community evaluate the costs and benefits afforded by CCA and move towards development of an Implementation Plan.
The detailed analysis performed by Navigant for the County suggested that by forming a CCA program, backed by investments in generation resources, the County could obtain the following benefits:
Achieve nominal electricity cost savings averaging approximately $25.3 million per year over the next 20 years, equivalent to approximately 5 percent of total electricity bills;
Increase renewable energy utilization to 40 percent by 2017, more than doubling the renewable energy content that SDG&E is required to provide over the same time period;
Obtain control over the electric generation costs to provide a higher level of rate stability for local residents and businesses; and
Improve statewide and local reliability by increasing capital investment in generation plants.
Under Navigant’s base-case assumptions, ratepayer benefits would have begun to accrue in the fifth year of program operations, assuming a 2006 implementation date and no changes in the rate designs of SDG&E. During the first four years of program operations, it was estimated that the program costs would likely exceed the equivalent rates charged by SDG&E due to the requirement that CCA customers pay a separate surcharge (cost responsibility surcharge) to SDG&E. If the County initiated a CCA program in 2006, Navigant’s analysis suggested that it would
11 Since research for this report began in Summer 2014, many communities in California, including the City of Davis, have begun exploring CCA opportunities, including starting their own CCA and joining existing CCAs.
1 - 78

likely have to charge slightly higher rates (1 percent to 2 percent) in the initial years of the program, or it would need to finance approximately $34 million of accumulated losses during the four-year start-up period.
Navigant issued the following recommendations: (1) communicate final study results through community workshops and identify next steps in proceeding toward Implementation Plan filing; (2) consider whether natural alliances exist among neighboring communities, and explore partnering arrangements to optimize supply-side alternatives and regional CCA implementation; (3) monitor the outcome of SDG&E’s Rate Design Window proceeding; (4) make a decision whether to proceed with development of an Implementation Plan. Following the feasibility study, the County did not develop an Implementation Plan.
In the ten years since that study was completed, however, much has changed in California related to energy and climate concerns. Although established in 2002 under Senate Bill 1078, California’s Renewable Portfolio Standard was accelerated under Senate Bill 107 and expanded in 2011 under Senate Bill 2. More recently, Governor Jerry Brown, in his 2015 inaugural address, proposed to accelerate California’s RPS further to 50 percent renewables by 2030 (Cart 2015).
Furthermore, one month after the feasibility study was published, in June 2005, then Governor Arnold Schwarzenegger signed Executive Order S-3-05, which established greenhouse gas (GHG) emission reductions to year 2000 levels by 2010, to 1990 levels by 2020, and to 80 percent below 1990 levels by 2050. Assembly Bill 32, or the Global Warming Solutions Act of 2006 soon followed. Municipalities across California have begun developing Climate Action Plans to meet these GHG emission goals.
Not surprisingly, developments in California over the last decade have also impacted CCA programs. As noted above, Marin County formed the State’s first CCA program in 2010—with Sonoma County and the City of Lancaster also launching their programs in 2014 and 2015, respectively. After numerous years in the planning stages, San Francisco seems poised to launch a CCA program of its own (Sabatini 2015). Moreover, the City of San Diego, in its September 2014 draft Climate Action Plan, has proposed establishing a CCA program to achieve 100 percent renewable energy on the city-wide grid by 2035 (2014). The City has authorized a feasibility study to further explore a CCA program. The feasibility study is ongoing at the time of this writing (Golding 2014).
For all of the reasons noted above, it is important for the County to revisit the CCA landscape. The County’s June 2014 Climate Action Plan underscores this point, as it calls for electricity in the region to be derived from increased levels of energy efficiency and renewable energy. A CCA program is one potential tool the County might utilize to achieve such a goal.
Prior to studying what a CCA program in the County might look like, this report first explores the potential advantages and disadvantages of CCA programs, the statutory requirements for formation, and the pros and cons of a County-led versus a regional approach. Next, the report explores existing (or soon-to-be existing) CCA programs in California. For each, the program’s product offerings and energy-related programs are examined.
1 - 79

4.2.3 Potential Benefits of a CCA Program
While offering consumers a choice where none exists for residential customers today, a CCA can be more than a simple purveyor of retail electricity. Rather, a CCA program can serve as a community’s energy integrator—enabling public-private partnerships, administering energy programs, leveraging public and private sector investments, and creating local opportunities for economic development and job creation.
The revenues received from customers, based on the electricity they consume, finance a CCA program. This can allow a community to create a dynamic institutional platform that has the ability to address the community’s electricity needs in a comprehensive manner without using any tax dollars or public funds. Depending on the goals of a particular community program, a CCA can potentially catalyze a faster switch to more renewable electricity supply and provide significant GHG reductions.
There are a number of potential benefits a public CCA entity can offer a community:
4.2.3.1. Local Control
A CCA program can enable a community to determine the source(s) of its electricity and to control how electricity dollars are spent. Indeed, a CCA program redirects substantial revenue streams previously under IOU control and places them under the direction of a community, with an increased level of public accountability. Whereas the operations and priorities of an IOU are determined by its shareholders, its management, and the California Public Utilities Commission (CPUC), a CCA entity, in contrast, is governed by a Board of Directors comprised of local elected officials. Such a governance structure may allow communities to determine program goals, operational structure, and resource procurement. A CCA program’s surplus revenues can be reinvested into the community through targeted investments in energy efficiency or renewable energy development. In this manner, citizens may be able to participate in shaping the program to address local community needs.
A May 2013 CPUC report recently highlighted the importance of an entity structure that aligns resource planning and operational protocol with local ratepayer interests. In a review of Southern California IOUs’ demand response (DR) programs12 from 2012, the CPUC determined that SCE and SDG&E used their DR programs fewer times and hours than the programs’ limits (each program is limited to a certain number of hours or events). Rather than maximizing demand response, the IOUs dispatched their peaker power plants far more frequently in 2012 in comparison to 2006 through 2011 historical averages13. (Bruce Kaneshiro 2013)
12 DR allows energy users of all kinds to act as “virtual power plants,” adding stability to the grid by voluntarilylowering their demand for electricity. Participants in DR programs get paid for providing DR capacity. Demand response providers like EnerNOC work with commercial, institutional, and industrial businesses to identify ways for facilities to participate in demand response programs without affecting business operations, comfort, or product quality. Demand response energy reduction measures are customized for each facility and can include turning off lighting, air conditioning, pumps, and other non-essential equipment. In some regions, facilities may participate in demand response by switching to backup generation, thereby reducing demand on the grid. Depending on the type of program, participants may be dispatched just once or twice a year for a few hours, or up to 100 hours per year. The more frequently dispatched programs typically offer higher payouts.
13 For example SDG&E’s Miramar Energy Facility ran 4,805 hours of 5,000 hours of emission allowance. In contrast, its Critical Peak Pricing with the most triggered hours was dispatched 49 hours out of 126 hours of annual limit.
1 - 80

These results raise questions related to why SCE and SDG&E did not use their respective DR programs to full capacity and whether financial disincentives to DR program use (despite the benefits to ratepayers) influenced the result.
4.2.3.2. Local Economic Benefits
Provided a CCA program aims to increase renewable energy and energy efficiency as a percentage of the total resource mix compared to the incumbent IOU, the entity could enjoy significant economic benefits. Such benefits are explored in detail throughout this report’s economic assessment, as shown in Section 3. The economic benefits are generally derived from savings due to (i) the reduction in electricity consumption, and (ii) a resource mix that drives a lower cost per unit of electricity and per unit of electricity service. These savings, as shown in the economic assessment of this report, are likely to result in job creation for the region.
In addition, to the extent a CCA program chooses to develop demand reduction resources, as well as solar, wind, and other renewable resources in or near its service area, these investments can create additional benefits and job growth.
Because CCA entities can finance projects with tax-exempt revenue bonds14 (which incur lower financing costs than private financing) and do not have to pay dividends to shareholders, it is possible that more net revenues from a local development program would stay within the local community. The community, in turn, may be able to decide how these proceeds are spent, such as investment in new local resources, or to otherwise lower electricity or borrowing rates.
Moreover, local economic benefits may accrue to local businesses and property owners from both electricity savings and on-site generation encouraged by CCA-administered programs. For many commercial building owners, renewable energy development can lead to increased revenues, from either direct investment or by offering leasing rights to project developers.
4.2.3.3. Increased Consumer Choice
A CCA program increases consumer choice by giving customers an option to receive electricity from the CCA entity or remain with the IOU.15 Under the current IOU model, the vast majority of customers can only buy power from one company, with little input as to how the electricity is generated or how the revenues are spent. As such, customers unhappy with their IOU have little recourse beyond reaching out to the CPUC.
4.2.3.4. Local Energy Program Development
A community choice energy agency might be able to provide an institutional platform for the development of new, locally-focused energy efficiency and renewables programs. This insight forms the heart of the Energy Innovation Scenarios characterized in Section III. A CCA program can provide businesses and homeowners alike with a single point of contact for all of their energy service needs. A customized assessment could provide a commercial or residential customer with information related to a wide array of potential program offerings including measures to: enhance energy efficiency, install distributed generation,
14 Revenue bonds are repaid through revenues, or in this case, savings, generated by public investments rather than through increased taxes. 15 Direct Access is another program that offers nonresidential customers some choice, however, the ability to participate in the program is limited.
1 - 81

conserve water, incorporate demand response, and, perhaps most importantly, provide the financing for getting it all done. Through public-private partnerships, a CCA agency can leverage private capital and coordinate the efforts of third-party programs to give customers one-stop shopping for community energy services.
Indeed, a CCA can develop ambitious energy efficiency and demand response programs that go above and beyond those administered by the incumbent IOU. Such programs can be designed specifically to meet the needs of the local community. In addition, such a program can incentivize local renewable electricity generation through well-designed net-metering and feed-in tariff programs along with other ways of aggregating, sharing, and financing new energy sources.
For instance, as examined in more detail in Section 4.2.7, Marin Clean Energy (MCE) offers a net-metering policy that pays participating customers premium rates for electricity, crediting customers at an extra $0.01/kWh. MCE’s net energy metering program catalyzes build-out of PV systems and encourages the deployment of larger systems. MCE also offers a Feed-In Tariff program (FIT), which is designed to provide competitive, predictable energy prices for local small-scale renewable energy developers over a 20-year contract term.
Similar to MCE, Sonoma Clean Power offers NetGreen—its net energy metering program—that pays participating customers full retail value plus an additional $0.01/kWh for excess electricity.
4.2.3.5. Greenhouse Gas Reductions
By reducing demand and procuring more electricity from renewable sources, a CCA program has the potential to substantially reduce greenhouse gas (GHG) emissions associated with electricity consumption. Numerous municipalities, through their Climate Action Plans, have identified electricity generation from conventional sources as a major contributor to their GHG emissions.
4.2.3.6. Rate Stability
By increasing the amount of power obtained from long-term contracts or self-owned generation facilities, a CCA program may be able to lock-in electricity prices and provide improved stability to its customers. Commercial customers in particular tend to value predictability in their energy costs to aid in business planning. Rate stability can help make the region more attractive to business and can enhance economic resilience.
4.2.3.7. Lower Financing Costs
Because public entities are able to finance electrical generation facilities with tax-exempt bonds and do not pay dividends to shareholders, a CCA program may, in the long run, be able to provide electricity at a lower cost than an IOU would be able to provide it. Instead of a 5 percent interest rate, for example, a CCA might find a 3.25 percent to 4.0 percent rate (or some other number). This could result in a $100,000 savings or more on interest payments over a 15-year period, for example (see Box III for a simplified example).
4.2.4 Potential Risks of a CCA Program
Despite the many potential advantages a community may enjoy, there are significant risks associated with CCA program development. The risks of forming a CCA program evolve as the process moves from implementation planning to commencement of program operations. Accordingly, these risk factors generally fall into three
1 - 82

categories: pre-formation (planning/implementation), post-formation (operational), and regulatory oversight risks. A short discussion about mitigating against some of the risks is included below.
4.2.4.1. Pre-formation Risks
Establishing a CCA program requires various political, engineering, legal, and financial steps, not the least of which is developing a detailed implementation plan that must be submitted to and certified by the California Public Utilities Commission (CPUC). Consultants will be needed to develop a technical feasibility study and assist with the preparation of the implementation plan. Based upon the experiences of Marin Clean Energy, Sonoma Clean Power, and Lancaster Choice Power, estimated total start-up costs should range between $1 to $3 million. Although some start-up costs are recoverable through CCA rates, funds expended for a technical feasibility study and other preliminary efforts may not be recoverable.
One cautionary tale on risks associated with CCA formation is that of CleanPowerSF—although its final chapter has yet to be written. In 2004, San Francisco began exploring a CCA program and has spent more than $4.1 million throughout various planning stages. It is unclear, however, whether the program will be realized. In August 2014, the San Francisco Public Utilities Commission rejected the proposed maximum rates for customers. Had the rates been approved, the CleanPowerSF program would have began enrolling its first customers. The San Francisco Board of Supervisors has set aside $19.5 million for the program, but Mayor Ed Lee has proposed using those funds for additional streetlights and subsidies for solar panels on homes and businesses (Lagos 2014). In January 2015, Mayor Ed Lee announced his support for CleanPowerSF after having previously opposed it. Supporters are pushing to begin phase one of enrollment as early as September 2015 (Sabatini 2015).
4.2.4.2. Post-formation Risks
Once in operation, the primary risks inherent in the operation of a CCA program are that unanticipated events cause the CCA’s costs to increase or the IOU’s rates to decrease. As noted, the CCA statute permits customers to opt out of the CCA program at any time. If the difference between the cost of electricity provided by the CCA entity and the cost of electricity provided by the IOU increases, customers may opt out of the CCA and return to IOU service. If this occurs, there is a risk that the CCA entity will have contracted for more electricity than it can sell to residents, and have to sell that excess electricity to a third party, potentially at a loss. In the worst-case scenario, this loss of customers could theoretically result in a situation where higher cost resources built or under long-term contract to the CCA entity are spread over an increasingly smaller number of customers until the CCA entity is forced to dissolve. This worst-case scenario should only occur if utility rates became much lower than CCA rates, however. Given that a CCA program relying on its own generation resources should be less subject to electricity market volatility, the risk of a drastic cost-shifting scenario is likely small.
Appropriate program rules that impose exit fees to compensate remaining program customers for commitments made on behalf of the departing customers (not unlike the cost responsibility surcharge imposed by the IOU) should help mitigate the risk of losing customers. However, if customers find themselves obligated to a program with higher rates than those offered by the IOU (or other competitors), their dissatisfaction may be directed at those administering the CCA program.
The predominate cost of service variables and risks that might impact the CCA’s operational costs are:
The cost responsibility surcharge (CRS) will vary year-to-year. The CRS is inversely related to the prevailing market price of electricity such that if market prices fall, the CRS will increase. To the
1 - 83

extent the CRS increases and the CCA program has locked in electricity prices through long-term electricity or fuel contracts, the CCA customers’ total rates will increase.
The CCA entity could improperly hedge its exposure to electricity and/or natural gas price volatility, and adverse price movements could cause rate increases for its customers. Similarly, the CCA program could over-rely on long-term contracts with fixed prices and find itself holding a high-cost portfolio if market prices subsequently fall.
The CCA program could fail to properly secure its customer base, making debt financing via capital markets impossible to obtain and exposing the CCA program to stranded costs if customers opt-out of the CCA program. Even with appropriate switching rules, large customers may go out of business or leave the area and leave behind costs that must be paid by remaining program customers.
The CCA program’s energy suppliers could default on supply contracts (credit risk) at times when energy spot markets are high, forcing the CCA entity to purchase energy at excessively high prices. Customers could fail to pay the CCA program’s charges, and the CCA program’s credit policies and customer deposits may be insufficient to recover the uncollectible bills.
IOU rate designs could change to reduce the cost of generation services and increase the costs of delivery services or shift the costs among customer classes in a manner that disadvantages the customer mix served by the CCA program.
Other regulatory risks associated with changes in the rules and tariffs administered by the CPUC or in the wholesale markets regulated by the Federal Energy Regulatory Commission (FERC) could increase the CCA program’s cost of providing service. For example, a requirement to use geographic-specific load profiles for electricity procurement could advantage coastal communities to the detriment of those located in hotter, inland climates.
Although each of these risks can be mitigated, they cannot be eliminated. Ultimately, the major operational risks are under the control of the program’s management. Disciplined, professional management is key to managing the risks inherent in offering retail electric services. The CCA program will be able to contract for services from a variety of large, experienced energy suppliers that have excellent operational capabilities. It should be noted that municipal utilities have been managing commodity, credit, and operational risks for many decades, even during times of high commodity prices and supply shortages.
Finally, if the CCA program were operated by a Joint Powers Authority (JPA), as examined in more detail below, the general funds of the cities and counties participating in the CCA program could be immunized from any contractual liabilities resulting from the CCA program. Thus, although the risks above could affect the finances of the CCA program itself (and its ratepayers), those risks would not result in liabilities payable from the general funds of participating cities and counties.
4.2.4.3. Regulatory Oversight
Another potential risk to the County and its residents related to CCA program operation is one of regulatory oversight. In contrast to the high-degree of regulatory oversight that IOUs face, the CPUC has limited oversight of CCA programs. The CPUC’s role is predominately focused on the relationship between the CCA and the IOU, rather than between the CCA and its customers (Stoner 2007).
Customers of a CCA program will not have rate increases and integrated resource planning decided under the rigors of a CPUC proceeding. Rather, a Board of Directors will be responsible for overseeing the CCA
1 - 84
program. It is critical that the Board be made up of knowledgeable professionals that will conduct CCA-related matters in an open and transparent process, and in a way that accounts for the interests of all relevant stakeholders.
4.2.5. Organization and Governance
An effective San Diego County CCA program would likely require the participation of separate jurisdictions (e.g., the County and the cities choosing to participate in the program). Collective participation can be accomplished through the creation of a Joint Powers Authority (JPA). The participating jurisdictions can create a separate authority to operate the CCA program (as was done in Marin County for its CCA program). As noted above, this method has the additional advantage of allowing the participating jurisdictions to protect their general funds from any contractual liability or debt incurred by the JPA in connection with the CCA program.
A number of issues must be resolved in connection with the formation of a JPA, including determining the respective monetary contributions of the jurisdictions to offset start-up costs. The composition of the governing board of the JPA will also require negotiation, with consideration given both to the composition of the CCA ratepayer base (i.e., assuring relatively equal representation for ratepayers regardless of jurisdiction) and to the need for each participating jurisdiction to have sufficient representation on the governing board. Resolution of these issues is necessary prior to the formation of a JPA to operate the CCA program.
4.2.6. Statutory Requirements for Formation
Section 366.2 of the Public Utilities Code sets out the requirements for formation of a CCA program. The formation process begins with the adoption of an ordinance by the entity proposing the CCA program (e.g., city, county, or JPA), followed by the preparation of an implementation plan, which must contain certain elements required by statute. Specifically, the implementation plan shall include: (i) an organizational structure of the program, its operations, and its funding; (ii) rate setting and other costs to participants; (iii) provisions for disclosure and due process in setting rates and allocating costs among participants; (iv) the methods for entering and terminating agreements with other entities; (v) the rights and responsibilities of program participants, including, but not limited to, consumer protection procedures, credit issues, and shutoff procedures; (vi) termination of program; (vii) a description of the third parties that will be supplying electricity under the program, including, but not limited to, consumer protection procedures, credit issues, and shutoff procedures. The implementation plan must also contain a statement of intent by the public entity proposing the CCA program, stating its intention to provide universal access, reliability, equitable treatment of all classes of customers, and to meet any other requirements established by state law or by the California Public Utilities Commission (CPUC).
The implementation plan must be submitted to the CPUC for review. The entity proposing the CCA program must also provide to the CPUC any information necessary to allow the CPUC to determine the cost responsibility surcharge (CRS) applicable to CCA customers. The CRS reimburses unavoidable utility electricity procurement costs resulting from the loss of customers to the CCA to protect a utility’s remaining bundled customers from bearing these costs through rate increases. Within 90 days, the CPUC must review and certify the implementation plan and inform the CCA program of the CRS applicable to it.
The CCA program must also register with the CPUC, and include with the registration an executed copy of a services agreement between the CCA entity and the utility governing the services to be provided by the utility under the CCA program. The CCA entity must also submit evidence of insurance, self-insurance, or post a bond that will cover such costs as potential re-entry fees, penalties for failing to meet operational deadlines, and errors in forecasting. Once the CCA entity has registered with the CPUC and signed the services agreement with the utility, the CCA entity must give the utility 30-days’ notice of the commencement of CCA service.
1 - 85

4.2.7. Case Studies
4.2.7.1. Marin Clean Energy
Marin Energy Authority, a JPA comprised of the County of Marin and the cities of Belvedere, Benicia, Corte Madera, Fairfax, Larkspur, Mill Valley, Novato, Ross, San Anselmo, San Rafael, Sausalito, Tiburon, Richmond, and San Pablo, operates Marin Clean Energy (MCE). Nearby jurisdictions have increasingly expressed interest in joining MCE, with the City of Benicia recently joining the program and unincorporated Napa County businesses and residents having the opportunity to purchase electricity through MCE beginning February 2015.
MCE launched in May 2010 and was introduced in phases. The first phase included about 8,000 Marin accounts, made up of residential, commercial, and municipal customers. In August 2011, MCE enrolled another 5,500 Marin accounts, the majority of which were residential, with a small number of commercial accounts. MCE completed Marin customer enrollments in July 2012 and began offering electric service to Richmond customers in July 2013. MCE will begin service to unincorporated Napa County and San Pablo in 2015.
MCE offers its customers three different product offerings: Light Green, Deep Green, and Local Sol. Customers in MCE service territory are automatically enrolled in Light Green, which provides customers with 50 percent renewable energy from sources such as solar, wind, bioenergy, geothermal, and small hydro. MCE also offers a Deep Green 100 percent Renewable Energy option. The Deep Green product costs customers $0.01 per kWh more than Light Green and, in 2013, was comprised of Green-e Energy® Certified wind energy from Cassia County and Twin Falls, Idaho, as well as Klickitat County, Washington. Part of the Deep Green energy mix included renewable energy certificates (RECs).16 MCE directs half of the revenue from the Deep Green premium to a local renewable energy development fund. Deep Green customer revenues have helped fund MCE first program-owned 2-5 megawatt solar project at the Richmond Port. The project is expected to be online by August 2016. Local Sol, MCE’s newest product, offers MCE customers the option to purchase 100 percent solar energy from a local solar farm sited in the MCE service territory. Although currently limited to approximately 200 participants, Local Sol customers enjoy guaranteed, long-term electricity rates because the product’s cost--about 30 percent more than Deep Green--is directly tied to the rates paid through MCE’s Feed-In Tariff program: $0.142 per kWh ($0.138 + $0.004 for administrative costs).
In addition to the three product offerings, MCE also serves as a platform for several local energy programs that encourage the development of distributed energy resources, including net energy metering program, feed-in-tariff, and on-bill financing programs.
4.2.7.1.1. Net Energy Metering
MCE’s Net Energy Metering (NEM) program allows customers to power their own homes and businesses from renewable generating systems, usually on their rooftops, connected to their meters. NEM is a billing arrangement that provides credit to customers with solar PV systems for the full retail value of the electricity their system generates. Under NEM, the customer’s electric meter keeps track of how much electricity is consumed by the customer and how much excess electricity is generated by the system and sent back into the electric utility grid. Over a 12-month period, the customer has to pay only for the net amount of electricity used from the utility over-and-above the amount of electricity generated by their
16 For more information on RECs, see Section 4.2.8.3.6.
1 - 86

solar system (in addition to monthly customer transmission, distribution, and meter service charges they incur) (California 2015). MCE pays its customers a $0.01/kWh premium over the retail rate paid by the local IOU, PG&E.
4.2.7.1.2. Feed-In Tariff
In contrast to NEM, MCE’s Feed-in Tariff (FIT) program is a wholesale renewable energy purchase program designed to provide competitive, predictable energy prices for local small-scale renewable energy developers over a 20-year contract term. The standard agreement offered by MCE can provide the basis for securing project financing, and should also provide a high level of certainty with respect to the revenue stream generated by the project. FIT renewable energy suppliers do not have to be MCE customers. By utilizing a standard form contract for 20-year power purchase agreements, a FIT can virtually eliminate the need for contract negotiations and keep transaction costs low.
Currently, MCE’s FIT is limited to projects up to 1 megawatt in size located within the MCE service territory. MCE will only approve a FIT application after the project has received an executed interconnection agreement from PG&E. Once a project owner or developer enters into a FIT contract arrangement with MCE it must interconnect to PG&E’s distribution system, or “grid,” and must follow PG&E’s prescribed small generator interconnection procedures.
MCE’s first FIT-supported project was executed in October 2012 with the San Rafael Airport. The 972 kilowatt rooftop solar project demonstrated that a CCA-administered FIT program can facilitate the deployment of local distributed energy as well as create local economic benefits. Synapse Electric, which built the project, hired 20 workers specifically for the project through the Marin City Community Development Corporation and CLP Resources. Synapse also hired three new locally-based full-time employees. San Rafael-based company, REP Energy, designed the installation, and the REC Group manufactured 85 percent of the solar panels, which are American-made. Power-One supplied all of the inverters, which are also American-made. The project was financed locally by the Bank of Marin and businessman Joe Shekou.
4.2.7.1.3. Other Local Projects
A CCA program can reinvest ratepayer dollars back into the local community, as evidenced by MCE’s pipeline of forthcoming local energy projects. MCE has partnered with a nonprofit organization in Novato to build a 1-megawatt, solar-shaded parking structure. The structure will be built on an existing employee parking lot and is expected to be completed by August 2015. In addition, a land lease is expected to be finalized with the City of Richmond to add solar to an existing parking structure at the Richmond Port. Initially planned to be built at 1 megawatt, the project could grow to 3 megawatts in future construction phases. The first phase of the Richmond Port project is expected to be completed by December 2015. Another land-lease deal with the City of Richmond may yield a 1-3 MW ground mount solar project on a brownfield site in Richmond. Lastly, MCE is negotiating a power purchase agreement with the Novato Landfill to capture methane gas from the landfill and turn it into renewable energy. The expected completion date for the project is April 2016.
4.2.7.1.4. Energy Efficiency Programs
Further demonstrating a CCA program’s ability to operate as an energy integrator, MCE manages energy efficiency programs for residential and commercial customers. The customer-oriented programs integrate diverse program offerings under one umbrella. The programs are designed to maximize investments in a property, reducing energy use, water use, and greenhouse gas emissions. MCE’s programs provide participants with a single point of contact to serve as facilitator and participant advocate, helping guide the
1 - 87

customer through the process from initial contact to project completion. In addition to offering financing and rebates to help overcome the cost barrier to efficiency investments, the MCE programs also provide high-consuming customers with information about how they use energy and advice for how to further reduce consumption.
4.2.7.1.5. Workforce Development
MCE will support the success of its energy efficiency programs with complimentary and critical workforce development training. Contractors and workers must have the skills necessary to support program success, and a trained workforce is essential to accomplishing market transformation. MCE engages community partners to ensure the inclusion of workers from disadvantaged communities in pursuing careers in the energy sector, and to build on existing successes, fill gaps in service, and focus on meaningful local workforce opportunities.
MCE’s workforce development programs help support the local economy. Stackable credential programs provide workers with a broad spectrum of transferable skills qualifying them for a variety of green jobs. Marketing, education, and outreach activities help increase demand for skilled labor in the region. MCE also works with local experts to align, leverage, and influence existing training programs and markets in the MCE service territory.
Workforce programs contribute to energy efficiency program success. Skilled workers ensure efficiency gains are met, and health and safety issues are addressed. The program will ensure ratepayer dollars provide meaningful opportunities, contributing to MCE’s mission of reducing greenhouse gas emissions. An increase in skilled labor spills over to benefit all ratepayers and not just program participants.
Industry Workshops & Trainings
Contractors, Architects, Builders
Engineers Continuing Education
Marketing, Outreach & Sales
Building Maintenance and Operations
Energy Management
Housing Authorities/Asset Managers
Youth Workshops & Trainings
Green Jobs Schools Program
Internships for high school students
Policy & Procedures
Develop standards for contractors
Develop health and safety protocols
Implement local hire agreements
Code Compliance, Health & Safety
Partnerships
1 - 88
Workforce Investment Boards
Economic Development Agencies
Workforce Intermediaries
Trade Unions
Community Colleges/Adult Schools
Community-based Organizations
Contractors/Contractor Associations
Municipalities
IOUs
Workforce Topic Areas
Energy Efficiency
Zero Net Energy
Energy Management
Building Operations/Management
Measure Specific Trainings
4.2.7.2. Sonoma Clean Power
In 2011, at the urging of local residents and businesses, the Sonoma County Water Agency began seriously exploring the formation of a community power program. A steering committee was formed, comprised of city council members, city managers and staff, business people, activists and other interested parties. Following more than two years of research, public opinion polling, and a detailed technical feasibility study, Sonoma County elected to move forward with its efforts to establish a CCA.
Sonoma County Water Agency drafted a detailed implementation plan in 2012—updated in 2013—that outlined the core program of increasing the region’s share of electricity generated from renewable sources. To complement the implementation plan, a series of educational meetings was held in the cities who were invited to participate in the CCA. The outreach and educational tour was followed by city council votes to determine which cities would elect to participate in the Sonoma Clean Power (SCP) program. Thus far, participants include the cities of Windsor, Cotati, Sebastopol, Santa Rosa, Sonoma, Cloverdale, and the unincorporated area of Sonoma County. The newest members of SCP, Rohnert Park and Petaluma, voted to join the CCA program in November 2014 and December 2014, respectively (Brown 2014; Dunn 2014).
SCP has begun adding customers in a phased enrollment approach. In May 2014, service began for 20,000 commercial customers. The program then rolled out to 200,000 residential customers in December 2014. To date, SCP has experienced far fewer customers opting-out than anticipated with an 89 percent retention rate (Marshall 2014).
SCP offers two product offerings to its customers: CleanStart and EverGreen. CleanStart is SCP’s default service and boasts 33 percent renewable power from sources such as geothermal, solar, and wind. EverGreen is 100 percent local renewable energy initially comprised of geothermal power sourced from
1 - 89
Calpine Geysers facilities in northeastern Sonoma County. SCP has entered into a 10-year contract that provides steadily rising volumes of geothermal power reaching 50 MW in 2018. By then, the total energy coming from that source will amount to 23 percent of SCP’s resource portfolio. SCP has also contracted for 20 years of solar power from Recurrent Energy, adding 40 MW to the agency’s previous purchase of 30 MW for a total of 70 MW (Dunn 2014).
Because SCP has only been in operation for less than a year, it has yet to mature into a complete energy integrator for the community. That said, however, SCP offers two programs to catalyze development of local energy projects: NetGreen and ProFIT.
NetGreen is a net energy metering program that is structured similar to that of MCE’s NEM program. Customers are credited at the full retail rate, plus an additional $0.01/kwh bonus for excess electricity generated from their rooftop PV system. If a customer uses more energy than the system produced, accrued credits are applied to offset any charges to the account. If the credits do not offset the charges completely, the customer is only charged for the remaining balance. At SCP’s annual account cash-out in April, any unused credits will be rolled over into the next billing cycle to help offset costs in the following year. If an account has credits in excess of $100, a check from SCP will be sent to customers for the full value of those credits up to $5,000 (2015).
ProFIT is SCP’s feed-in tariff, a renewable energy purchasing program which sets the rules and price for SCP to purchase electricity from small-scale wholesale renewable electricity projects within SCP’s service territory. ProFIT directly promotes the development of small-scale renewable generation installations within the SCP service territory by creating a standard-offer transaction with a fixed price of $95/MWh. Contracts are offered at 10 years for baseload generating facilities or 20 years for other generating facilities. Projects that meet the bonus eligibility criteria may qualify for up to $130/MWh for the initial 5 or 10 years of the contract term (2015).
4.2.7.3. Lancaster Choice Energy
Lancaster Choice Energy (LCE) is the latest CCA program in California with a launch date of May 7, 2015. Phase one of the program roll-out encompassed more than 850 accounts including all municipal accounts as well as residents and businesses that have elected to enroll early in the program. Phase two should begin in November 2015 with small commercial accounts joining the program, with the remaining customers enrolling in Early Spring 2016. Lancaster’s City Council will oversee the program and be responsible for various elements of the program, including rate setting.
The City of Lancaster is still finalizing the details of its program and will be submitting a revised implementation plan for CPUC approval. Lancaster anticipates, however, that it will offer its customers several different product offerings along the lines of those offered by MCE and SCP. Similarly, LCE will, in all likelihood, also offer a net energy meeting program as well as a feed-in tariff program.
4.2.8. Functions of a Community Choice Aggregation Program
A CCA program can serve as a comprehensive energy service provider, integrating energy supply with reduced demand in a manner that provides the community many of the benefits outlined above. Properly constructed, a CCA program can effectively manage community energy resources (both demand reduction and electricity generation) to meet community objectives. A CCA program performs the following functions:
Energy Procurement and Integrated Resource Planning Rate Setting
1 - 90
New Program Development Regulatory Compliance Public Relations and Customer Service
The authors examine each of these functions in turn.
4.2.8.1. Energy Procurement and Integrated Resource Planning
The most critical function of a CCA program is to meet the electricity demand of its customers, and to do so reliably and in a cost-effective manner. This function can be achieved by integrating generation services with demand reduction, as energy saved typically the least-cost resource. From a generation perspective, a San Diego County CCA program would likely prioritize increased investments in renewables and energy efficiency in order to capture the attendant reductions in GHG emissions. As such, emphasis should be given to energy resources that are compatible with reaching these institutional priorities.
Integrated resource planning for a prospective CCA program would include load forecasting and power supply planning on a long-term time horizon. The CCA program would need to develop integrated resource plans that maximize the cost-effective use of demand side efficiency, storage, and demand response programs, combined with traditional supply options and renewable energy resources. Special care should be given to the pursuit of a nimble, modular approach, such that the CCA program could adjust its resource portfolio to respond to emerging technologies and avoid locking itself into a suboptimal resource portfolio for the long term.
This report explores a potential high-level resource plan for San Diego County in Section 4.2.11.
1 - 91

4.2.8.2. Demand Reduction Services
One of the key components to optimizing the electricity system in the San Diego region involves reducing peak load periods so as to flatten electricity demand over time and over the region. Such an approach can help mitigate the need to utilize peaker power plants that ramp up quickly to match increasing demand—typically present in the evening hours. Peaking power is often a relatively expensive resource type. Flattening the load profile reduces the amount of generating capacity needed to satisfy peak demand and thereby reduces the overall cost of electricity. In particular, the amount of energy that has to be procured on the open market is reduced.
As an energy integrator, a San Diego County CCA program would be uniquely positioned to fund and administer energy efficiency programs that include a method for identifying and implementing the largest, most cost-effective savings across the local service territory, while complementing what SDG&E and other organizations are already doing under state programs directed by the CPUC.
Demand-response technologies should also be explored. A CCA program can offer customers financial incentives to reduce demand upon the CCA entity’s request. This can be an extremely cost-effective way to shave load peaks. For example, utilities in some forward-thinking jurisdictions have begun utilizing customers’ large-capacity hot water heaters to play a part in frequency regulation, as voltage needs to be smoothed out as demand varies. Load control devices shut down the heater during the day, but the extra capacity provides plenty of hot water. The water is heated from 11 p.m. to 7 a.m., off-peak at a lower generation rate than what consumers would pay for electricity usage during daylight hours. With enough participation, a CCA program could effectively store well over a GWh of electricity every night, utilizing the water heaters effectively as a giant, distributed battery (Opalka 2013).
For the CCA program, demand response is an effective alternative to procuring capacity that would otherwise be needed to comply with CPUC capacity requirements.
4.2.8.3. Power Procurement Services
CCA program staff would have a number of supply-side options at its disposal for procuring electricity:
4.2.8.3.1. Third-party Power Provider
The experience of Marin Clean Energy and Sonoma Clean Power demonstrates that, at the beginning, all electricity demand—including the renewable energy component—may be procured from large energy suppliers, while new local renewable resources are being funded and developed. A third party could contract for a high percentage of the program’s supply at launch while the program develops an operational record and revenue stream needed to finance its own projects. The third party would ensure that the CCA program meets the state’s Renewable Portfolio Standard requirements for renewable energy content.
4.2.8.3.2. New Generating Facilities/Power Purchase Agreements
A CCA program can also conduct an open bidding process to contract for renewable energy from new facilities. Independent power producers would submit proposals to be evaluated by staff. Firms with successful bids would then negotiate power purchase agreements. Under this approach, the CCA entity would not own the facility but simply purchase the electricity generated therefrom.
4.2.8.3.3. New Generating Facilities/Program-Owned
In the alternative, a CCA program could also build, own, and operate new generating facilities. Under such a model, the facility could be situated on public property or brownfield sites and built through a project developer hired by the CCA entity. This approach would likely make more sense after the CCA program
1 - 92

has matured, with several years of operating experience and an established credit rating, so that low-interest loans or revenue bonds can be used to finance the projects.
4.2.8.3.4. New Generating Facilities/Feed-in Tariffs
A feed-in tariff (FIT) program establishes a standard offer contract for renewable generators looking to sell electricity to the CCA entity at a fixed price for up to 10, 15 or even 20 years. With their high level of certainty, FIT contracts give smaller-scale developers the ability to secure project financing more easily. Both Marin Clean Energy and Sonoma Clean Power have successfully implemented FIT programs.
4.2.8.3.5. Behind-the-Meter Resource Development
A CCA program can develop programs that encourage homeowners and businesses within its service territory to install energy efficiency and renewable energy generating resources behind the customer meter. Such programs can include a variety of technologies, such as combined heat and power facilities, residential and commercial PV systems, as well as district heating and cooling facilities.
As noted, Marin Clean Energy operates an energy efficiency program that offers rebates to customers as well as financing to facilitate the installation of efficiency measures in the home or workplace. In addition, both Marin Clean Energy and Sonoma Clean Power provide customers a net energy metering program, which encourages customers to install PV systems with excess capacity by compensating them at the full retail rate plus an additional penny per kWh for any excess electricity generated by the system.
4.2.8.3.6. Unbundled Renewable Energy Certificates (RECs)
A renewable energy credit (REC) represents the environmental and renewable attributes of renewable electricity. A REC can be sold either “bundled” with the underlying electricity or “unbundled,” as a separate commodity from the electricity itself, into a separate REC trading market (Commission 2015). California law (Public Utilities Code § 399.12(f)) defines a REC as:
“[A] certificate of proof, issued through the accounting system established by the Energy Commission [WREGIS] . . . that one unit of electricity was generated and delivered by an eligible renewable energy resource.”
Unbundled RECs are recognized and allowed under California’s RPS, although the number of unbundled RECs that can be used for compliance is limited. Unbundled RECs could serve as a strong cost-containment option, and their utilization may give flexibility to a CCA program. A newly emerging CCA program might initially rely on RECs to some extent in order to meet RPS requirements at reasonable costs to customers. However, it is not clear that RECs result in new renewable energy development and therefore they likely would not provide a CCA program with the full array of environmental and economic benefits as other renewable energy procurement models.
4.2.8.4. Rate Setting
A CCA program is responsible for setting the rates customers pay for electricity. The program would adopt an initial rate structure following the establishment of the first year’s operating budget and prior to launch of the program. The Board of Directors would approve all future rates at a public meeting with stakeholder input.
The rate structure would likely follow the experience of other CCA programs and include the following features:
4.2.8.4.1. Rate Sufficiency
1 - 93

At a minimum, rates must be sufficient to meet the program’s annual budget requirements. This would include recovery of all expenses and any reserves or coverage requirements set forth in bond covenants or other debt-service requirements.
4.2.8.4.2. Rate Stability and Competitiveness
Rates would initially have a similar structure to SDG&E’s rate system. The program would aim to have lower rates and greater rate stability as the share of locally developed renewable resources increases—with no variable fuel cost issues such as natural gas generation. Starting with a similar rate structure to SDG&E is designed to ensure the program rates are not altered drastically and helps customers more easily transition from bundled service to the CCA program. Competitive rates will be critical to attracting and retaining key customers.
4.2.8.5. Product Offerings
The CCA program could elect to offer customers a variety of product offerings, including a 100 percent renewable energy option at a premium price, based on the costs of a 100 percent renewable supply. As demonstrated by Marin Clean Energy and Sonoma Clean Power, a 100 percent renewable option can prove quite attractive to the community and the premium dollars can be tied directly to local renewables development.
4.2.8.6. Power Charge Indifference Adjustment (PCIA)
The PCIA is a CPUC-mandated fee collected by SDG&E. It is intended to ensure that customers who switch to a CCA program pay for the above-market cost of energy that SDG&E purchased on their behalf prior to the change in service. This, in turn, assures that costs incurred by SDG&E on behalf of customers transitioning to CCA service are not shifted to the rest of the SDG&E customer base. The PCIA is designed to decline to zero over a period of several years (Mieux 2014).
4.2.8.7. California Alternate Rates for Energy (CARE) Rates
Participating qualified low- or fixed-income households, such as those currently enrolled in California Alternate Rates for Energy (CARE) program, would continue to receive the same monthly discounts on their electricity bills.
4.2.8.8. New Program Development
One of the components that makes CCA programs such an effective tool for driving community investment in renewables and energy efficiency is the ability to develop energy programs. These may include new approaches to reducing energy demand as well as the building of new, local, renewable generating assets.
In addition to net energy metering and feed-in tariff programs, a CCA could administer a wide range of other programs including community solar projects, Property Assessed Clean Energy (PACE) programs, and on-bill financing arrangements.
4.2.9. Regulatory Compliance
CCA programs face far less regulation than IOUs, but as load-serving entities, they must comply with various compliance filings related to resource plans, resource adequacy, and California’s RPS. The program should have at least one staff person dedicated to ensuring the organization maintains an active role at the CPUC, the California Energy Commission and, as necessary, the Federal Energy Regulatory Commission and the California legislature.
1 - 94

Some of the main regulatory components are as follows:
4.2.9.1. Certification of Implementation Plan
The CPUC must certify a CCA program’s implementation plan before operation may commence.
4.2.9.2. Capacity Requirement
The CPUC’s resource adequacy standards require a demonstration one year in advance that the CCA program has secured physical capacity for 90 percent of its projected peak loads for each of the five months of May through September, plus a minimum 15 percent reserve margin. On a month-ahead basis, the program must demonstrate 100 -percent of the peak load plus a minimum 15 percent reserve margin (Sonoma County Water Agency 2011).
4.2.9.3. Renewable Portfolio Standard (RPS)
State law requires that CCA programs, like IOUs and municipal utilities, provide a minimum amount of eligible renewables in their resource mix, according to the schedule presented in TABLE 4-1. The current standard mandates 33 percent renewable energy by 2020, however, Governor Brown has indicated a desire to accelerate the standard to 50 percent by 2030.
The RPS also divides renewable energy supply into three categories. Category 1 entails the use of renewable energy facilities located in the State of California or those outside the state that can meet strict scheduling procedures to ensure delivery into California. There is no limit to using Category 1 renewables for RPS compliance. The other two categories focus on renewable energy that might not be strictly delivered into the state as well as the purchase of unbundled RECs. These categories do have limits as to the percentage used for RPS compliance.
TABLE 4-1. Renewable Portfolio Standard
Year
Renewable Energy Portfolio Requirement (%)
Year
Renewable Energy Portfolio Requirement (%)
2015 23% 2018 25% 2016 23% 2019 25% 2017 25% 2020 33%
4.2.10. Establishing a CCA Program
This next section is a high-level overview of what steps would be required to set up a community choice program in San Diego County. As noted previously, any local government and some special districts in California can form a CCA program either by itself or with other jurisdictions. In Marin and Sonoma, the County governments took the lead—with the cities joining once the initiative was underway. To begin the process, the jurisdiction could pass an ordinance or resolution that states its intention to establish a CCA program and, on that basis, undertake a full feasibility study or businesses plan.
4.2.10.1. Feasibility Study
The CCA feasibility study is the basis upon which a government jurisdiction proceeds with the establishment of a CCA program. As in any other business, the study must be detailed enough to describe
1 - 95
how the program is to meet its stated goals, while also demonstrating the economic feasibility of providing the benefits the program wishes to achieve.
The study would use SDG&E load data and renewable resource assessments to identify potential projects. It would assess the potential size of the program in terms of number of customers and electricity sales, develop an initial financial and cash-flow model, predict the overall return on investment, quantify the jobs created under various procurement scenarios, and outline how the start-up costs would be financed.
Depending on the scope of the study, it could also address how local development projects would be financed, clearly outline the functions of the program, and determine staffing requirements. The plan would also examine the risks associated with establishing a CCA program and how those risks should be mitigated. As a point of reference, the feasibility study in Sonoma County cost about $100,000. A fuller business plan, one that identifies particular demand side and renewable resources for development, would likely cost more depending upon the scope. In the case of Marin and Sonoma counties, they each chose to identify potential resources after creating the CCA agency.
4.2.10.2. Initial Start-Up Costs
Setting up a CCA program requires up-front investments. In addition to the costs involved in developing the feasibility study described above, there will also be necessary legal fees associated with setting up a Joint Powers Authority (JPA) should one be required. The cost for legal fees can be minimized somewhat relative to what Marin and Sonoma incurred because model JPA agreements now exist.
If a new administrative agency is also required, the initial staffing and creation of this agency could cost around $500,000. These costs can all be repaid relatively quickly once the CCA program is launched, but typically they are borne initially by the initial set of government jurisdictions, angel investors, or through short-term loans.
For example, funds for Marin Clean Energy’s initial operations came primarily from two sources. The County of Marin loaned MCE a total of $540,000 without interest. MCE also issued promissory notes to three individuals for loans totaling $750,000, which it paid back within the first year of operations.
4.2.10.2.1. Agency Formation
Initially, the Board of Directors would be required to create a CCA agency under the direction of a Chief Executive Officer or Executive Director to be appointed by the Board.
Board of Directors
The Board of Directors would oversee and approve all important decisions, such as major power procurement contracts, raising capital for local energy development, and rate setting. The Board would provide overall policy direction to the CEO, who would have general responsibility for program operations.
The Board could also establish subcommittees that focus on particular areas of interest. Sonoma Clean Power, for example, has created a ratepayer advisory subcommittee to review and approve all electricity rates—a critical component. This SCP subcommittee includes citizens who represent the interests of the residential and commercial sectors.
Management Staff
The CEO will have management responsibilities over the following functional areas:
Energy procurement and longer-term resource planning
1 - 96

Rate setting
New program development, including net energy metering and feed-in tariff programs
Regulatory affairs
Public relations and customer service
Staff would likely be hired to cover each of these areas, while, initially, some of these positions could be filled by third-party consultants or contractors.
4.2.10.3. Implementation Plan
The CPUC, which ultimately has to approve the CCA program, requires that the CCA entity submit an implementation plan that covers all aspects of the program’s set-up and operation. However, the implementation plan need not describe the integrated resource plan, financial plan, or other aspects of the business plan.
Assembly Bill 117 and California Public Utilities Code §366.2 are clear about what needs to be included in the implementation plan to be certified by the CPUC:
Process and consequences of aggregation
Organizational structure of the program, its operations, and funding
Rate setting and other costs to participants
Disclosure and due process in setting rates and allocating costs among participants
Methods for entering and terminating agreements with other entities
Participant rights and responsibilities
Termination of the program
Description of third parties that will be supplying electricity under the program, including information about financial, technical, and operational capabilities
The first item in the list above involves a plan for phasing in customers to the program. The phase-in schedule will depend, of course, on which cities (if any) join at the outset, but in any case, not every customer in the County can or should be signed up on the initial program launch. The implementation plan must also include a statement of intent indicating that the program shall provide universal access, reliability, and equitable treatment of all customer classes, and to meet any other requirements established by state law or by the CPUC.17
17 Section 366.2 of the Public Utilities Code specifies that to form a CCA, there must be a local ordinance approved by the entity proposing the CCA, followed by the preparation of an implementation plan, which must contain specific elements outlined in the statute. After the implementation plan is approved, the CCA registers with the CPUC and provides an executed copy of the services agreement between the CCA and the utility that covers the services to be provided (e.g., billing).
1 - 97

4.2.10.4. Program Roll-Out
Drawing from the experience of Marin and Sonoma counties, once all of the steps listed above are completed, the CCA agency will need to undertake a series of start-up related activities that will likely begin between six to twelve months prior to the first sale of electricity.
Such activities include, but are not limited to:
4.2.10.4.1. Hiring Staff
The CCA Board of Directors, after appointing a CEO or Executive Director, will hire a mix of direct staff and contractors to undertake the activities necessary to effectively launch the program. Given the size of unincorporated San Diego County, an initial staff of 21 people would likely be required, covering the following functions: regulatory affairs, media and community outreach, budget and finance, power procurement, energy forecasting, and local energy programs. Some of the more technical work, such as modeling demand, longer-range forecasting, and developing the proposed rate structure, can be done with the help of consulting firms. Marin Clean Energy, which covers a smaller population than the unincorporated area of San Diego County, currently has about 18 staff members.
4.2.10.4.2. Setting Initial Renewable Portfolio Goals
The Board of Directors would need to decide on a number of basic policy issues, such as how much renewable energy content should make up the program’s initial resource mix and how it should be procured. Sonoma County decided that it wanted to start with a 33 percent renewable content, thus meeting the 2020 RPS target seven years early, and building up to a 50 percent renewable content within a few years. Such an approach would typically require the CCA agency to contract with a third party, at least initially, to purchase the requisite energy from eligible sources.
4.2.10.4.3. Satisfying Start-Up Capital Requirements
The start-up or rolling out of the program will incur costs in the 6 to 12 months prior to commencement of operations and the generation of revenue. In the case of other CCA programs, namely Marin and Sonoma, start-up costs were covered either through public funds or through short-term bank financing. These costs can be quickly recovered, however, once revenues to the program are generated.
One such start-up cost will be related to posting the CCA program bond. This is a CPUC requirement and is meant to cover the potential costs in case a program fails and the customers are returned to SDG&E bundled service. The estimated bond for Sonoma was approximately $100,000. It is unkown what a corresponding bond requirement will be for San Diego, but it is reasonable to expect a San Diego bond to be higher.
Also, working capital will be required to cover the costs—primarily purchasing electricity—that are incurred between the start of operation and the generation of revenues. Operating revenues from sales of electricity will be remitted to the CCA agency beginning approximately 60 days after the initial customer enrollments. This lag is due to the distribution utility’s standard meter reading cycle of 30 days and a 30-day payment/collections cycle. Potential funding sources for these costs include short-term bank financing (likely a line of credit that can be drawn upon as needed to cover expenditures) or in-kind services provided by the third-party energy supplier (specifically, a delay in the first payments). The program would expect to recover the principal and interest costs associated with the start-up funding via retail sales.
In the case of Sonoma, First Community Bank provided startup financing for Sonoma Clean Power’s operations in two separate tranches. The first tranche consisted of a $2.5 million line of credit, which was
1 - 98

guaranteed by Sonoma County. Subsequently, First Community Bank extended a $7.5 million line of credit, for which it required no guaranty from Sonoma Clean Power or its member jurisdictions.
4.2.10.4.4. Setting Initial Rates
Once the initial budget with the power procurement costs are determined, the agency staff would develop an initial rate structure designed to (a) cover the program’s costs; (b) be competitive with SDG&E; and (c) offer incentives designed to meet the program’s goals, such as net metering and feed-in tariffs. This process will likely be assisted by contractors, as well as the experience gleaned from the Marin and Sonoma programs.
4.2.10.4.5. Informing Customers
Before any customers (residential, commercial, or industrial) are enrolled in the program, they will receive two written notices in the mail explaining the CCA’s terms and conditions of service and how they can opt out of the program. All customers that do not opt out will be automatically enrolled. These notices will be sent at least three months prior to the commencement of service. After the first day of service, customers will receive an additional two notices (at least 30 days apart) allowing them the opportunity to opt out for no fee and return to SDG&E service. After that point, customers will still have the opportunity to return to SDG&E whenever they wish, but they might face a modest termination fee to cover the costs of switching the customer over.
4.2.11. Illustrative Resource Development Scenario
This section describes one of several possible resource development scenarios for a San Diego County CCA program. The scenario is meant to illustrate the potential of an ambitious program to deliver community investment, clean energy jobs, lower electricity bills, greenhouse gas reductions, and other benefits.
The resource development scenario presented below makes the following assumptions about program rollout and goals:
The program would phase in customers over four years: 10 percent of the customer base in Year 1, increasing to 25 percent in Year 2, increasing again to 50 percent in Year 3, and then reaching 100 percent by the end of Year 4.
Customer retention in the program would be about 80 percent, as evidenced by customer retention experienced by Marin Clean Energy and Sonoma Clean Power.
The program’s renewable energy content would start at 33 percent and rise to 80 percent by 2050.
With respect to energy efficiency, the program reduces energy demand by 2.5 percent in 2015, increasing to a 25 percent reduction of what would otherwise be demanded in 2050.
The program would develop new local renewable electricity generation, with the goal of 60 percent of total renewables in the portfolio from local sources by 2050.
Based on these assumptions, FIGURE 4-4 illustrates the resulting electricity resource development scenario.
1 - 99
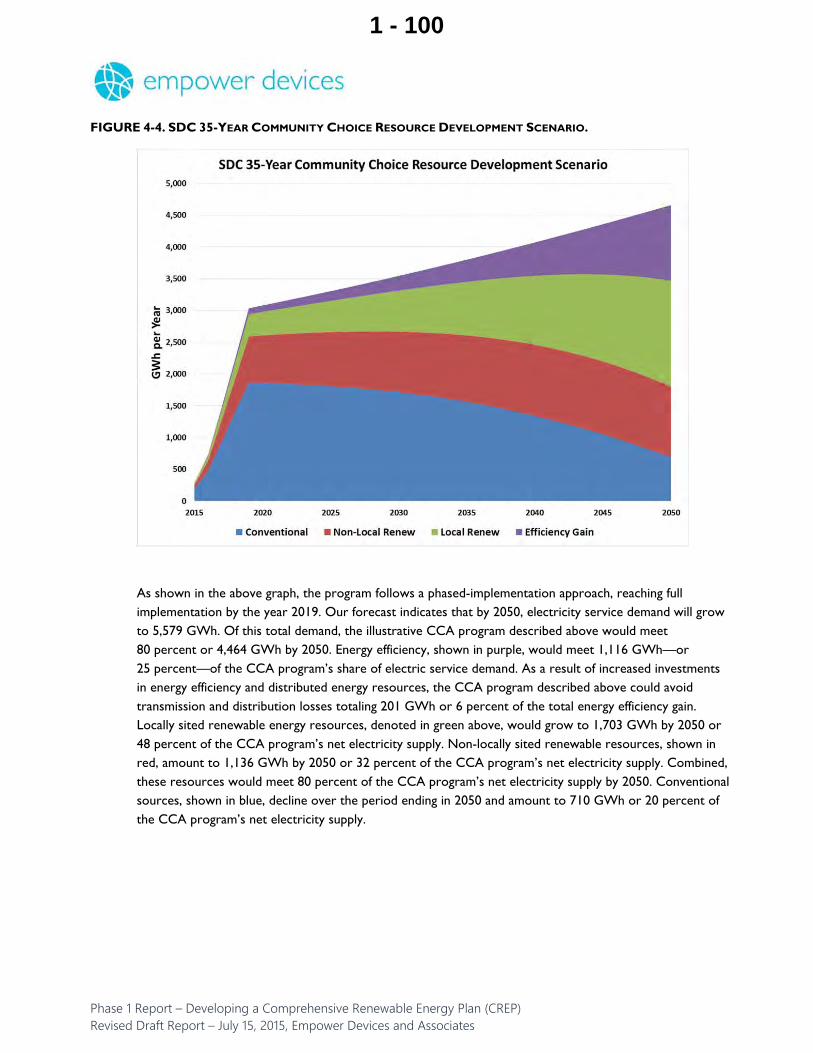
FIGURE 4-4. SDC 35-YEAR COMMUNITY CHOICE RESOURCE DEVELOPMENT SCENARIO.
As shown in the above graph, the program follows a phased-implementation approach, reaching full implementation by the year 2019. Our forecast indicates that by 2050, electricity service demand will grow to 5,579 GWh. Of this total demand, the illustrative CCA program described above would meet 80 percent or 4,464 GWh by 2050. Energy efficiency, shown in purple, would meet 1,116 GWh—or 25 percent—of the CCA program’s share of electric service demand. As a result of increased investments in energy efficiency and distributed energy resources, the CCA program described above could avoid transmission and distribution losses totaling 201 GWh or 6 percent of the total energy efficiency gain. Locally sited renewable energy resources, denoted in green above, would grow to 1,703 GWh by 2050 or 48 percent of the CCA program’s net electricity supply. Non-locally sited renewable resources, shown in red, amount to 1,136 GWh by 2050 or 32 percent of the CCA program’s net electricity supply. Combined, these resources would meet 80 percent of the CCA program’s net electricity supply by 2050. Conventional sources, shown in blue, decline over the period ending in 2050 and amount to 710 GWh or 20 percent of the CCA program’s net electricity supply.
1 - 100

4.3. Direct Access18
4.3.1. Introduction
Under traditional, bundled service, California utilities provide electricity to homes and businesses by generating the electricity, transmitting it through major electricity lines, and then distributing it through smaller electricity lines. Through direct access (DA), eligible retail customers have the choice to purchase electric power directly from an independent electric service provider (ESP) rather than only through an investor-owned utility (IOU).
Similar to a CCA program, DA provides customers with a choice when it comes to their electricity generation needs. There are, however, some key differences between the two institutional arrangements. For one, DA is no longer available to residential customers. In addition, DA is very limited as a tool for the region to drive greater investment in renewable energy and energy efficiency. By law, enrollment in DA is limited to a set number of GWh each year. Furthermore, even setting the enrollment restrictions aside, the County has no ability to control the ESPs from which an individual customer will purchase its power. This, in turn, limits the County’s ability to ensure that a DA program would actually deliver increased levels of renewables and energy efficiency, as well as decreased levels of GHG emissions to residential and commercial customers.
The sections that follow examine the history of DA in California as well as the current landscape in the San Diego region. Potential approaches toward DA the County may take in the future are also explored.
4.3.2. Background
DA was first instituted as an option for retail electric service in 1998, as part of an electric industry restructuring program to bring retail competition to California electricity markets. The electricity industry restructuring program was cut short, however, by the “electricity crisis” events of 2000 and 2001 that led to extraordinary wholesale electricity cost increases, threatening the solvency of California’s major electric utilities and the reliability of electricity services.
On October 11, 2009, Senate Bill (SB) 695 was signed into law as an urgency statute. SB 695 adds §365.1(b) to the Public Utilities Code, which states in relevant part:
The commission shall allow individual retail nonresidential end-use customers to acquire electric service from other providers in each electrical corporation’s distribution service territory, up to a maximum allowable total kilowatt-hours annual limit.
Except for this express authorization for increased DA transactions under SB 695, the previously enacted suspension of DA transactions remains in effect until repealed by legislation, or until additional DA transactions are otherwise authorized.
18 All analysis pertaining to Direct Access in this report deals with the current version of the law, as of June 2015. As indicated in this section, the California Senate, on June 3, 2015, passed SB 286, which, if made law, would substantially alter the current Direct Access program and, in turn, would substantially alter this analysis.
1 - 101

FIGURE 4-5. Direct Access Timeline
Initially, to get space under the cap in order to sign up for DA service, a nonresidential customer or the customer’s agent had to submit the customer’s eligible accounts into a first-come/first-served enrollment period. Each phase of the enrollments under the cap was filled within moments of the start of the first-come/first-served submission period. In December 2012, however, as requested by a coalition of interested stakeholders, including customers, ESPs, and the utility companies, the CPUC issued a decision that adopted new procedures to govern enrollment in DA when there is space under the current DA caps.
Beginning in 2013, nonresidential customers interested in taking DA service were required to submit to their utility a six-month notice to start service during a five business day submission period in the second week of April 2013. Each submission was assigned a random number, and the space under the cap was filled according to the random number assignments. Customers awarded space in the lottery were able to commence service in October 2013 (Domagalski 2014).
Submissions not accommodated under the cap were added to a wait list, which remained in effect until the next lottery was conducted in June 2014. On the last business day of each month, the utility determined whether there was any room under the overall load cap and notified the first customer on the wait list that the space was available. The nonresidential customer could then elect to activate DA service or remain on bundled utility service. The process continues until the room under the cap is filled (Domagalski 2014).
The switch to a lottery eliminated any need or incentive for nonresidential customers to make multiple submissions of accounts in the hopes that one of the submissions would get in early enough to get space. In fact, multiple submissions of the same accounts during the lottery window will be rejected so that each account or set of accounts that are submitted will get only one random number assignment (Domagalski 2014).
4.3.3. Direct Access in California and San Diego County
Given current restrictions, DA accounts for a relatively small portion of the electricity consumption in San Diego County and the State of California overall. As shown in FIGURE 4-6 below, as of December 31, 2014, the capped load allowance only permits ESPs to serve approximately 12.85 percent of the total IOU load in California.
1 - 102

FIGURE 4-6. Direct Access Load as a Percentage of Total IOU Load in California
Source: CPUC (2014)
Indeed, looking at the share of direct access load as a percentage of total IOU load in California over the life of the DA program, it is clear that ESPs do not account for a very significant share of the total load in California. As the chart in FIGURE 4-7 demonstrates, at the height of the DA program, before the electricity crises in 2000 to 2001, ESPs accounted for no more than 15.9 percent of total IOU load. After the suspension of the program, participation dropped to as low as 2.18 percent.
12.85%
87.15%
1 - 103
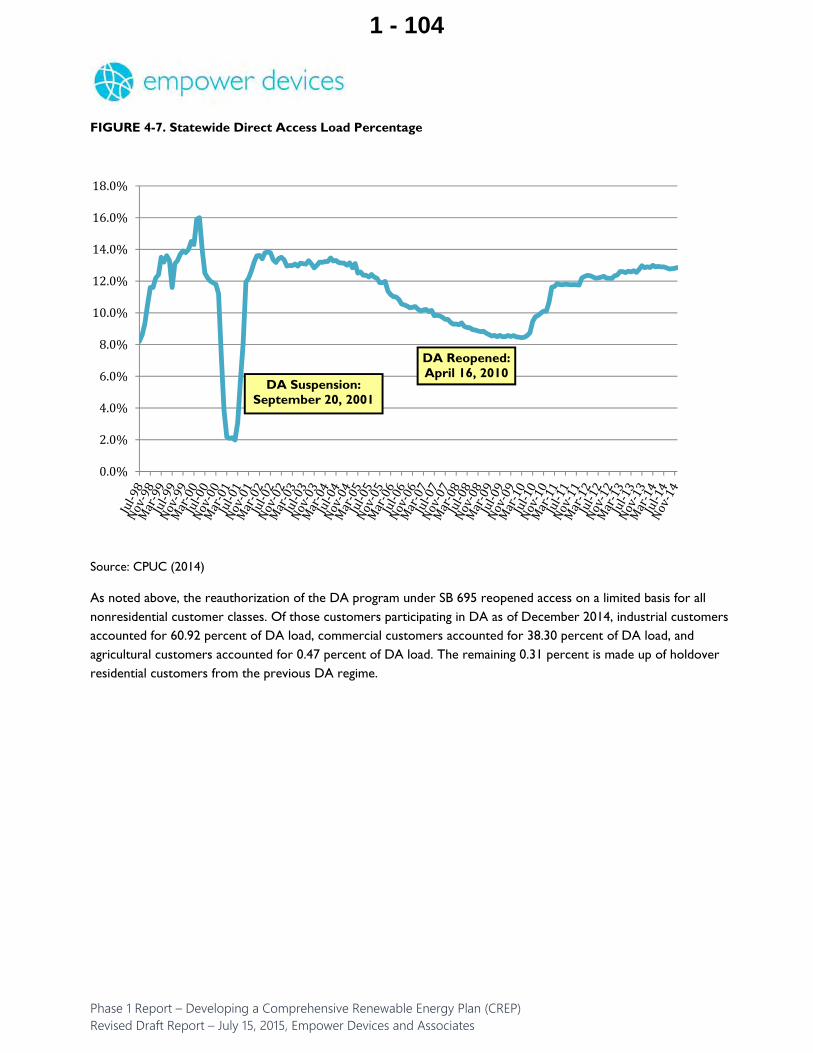
FIGURE 4-7. Statewide Direct Access Load Percentage
Source: CPUC (2014)
As noted above, the reauthorization of the DA program under SB 695 reopened access on a limited basis for all nonresidential customer classes. Of those customers participating in DA as of December 2014, industrial customers accounted for 60.92 percent of DA load, commercial customers accounted for 38.30 percent of DA load, and agricultural customers accounted for 0.47 percent of DA load. The remaining 0.31 percent is made up of holdover residential customers from the previous DA regime.
DA Suspension: September 20, 2001
DA Reopened: April 16, 2010
1 - 104

FIGURE 4-8. Percentage of DA Load by Customer Class
SDG&E began accepting Six-Month Notices to Transfer to Direct Access for any load that may become available for 2015 from June 9, 2014 to June 13, 2014 (SDG&E 2015).
As of February 2015, SDG&E was not accepting Six-Month Notices to Transfer to Direct Access. The SDG&E Total Load Allowance, 3,562 GWh, was fully subscribed.
All certified Six-Month Notices to Transfer to Direct Access Service (6-Month Notices) received during the June 2014 enrollment period have been placed on the 2015 Wait List, in order of the randomized lottery number assigned, for any load that may become available in 2015. The Wait List is in effect January 1, 2015 and expires December 31, 2015.
Pursuant to the DA rules outlined above, on the last business day of each month, SDG&E will determine if there is room under the Overall Load Cap and will notify the first customer on the Wait List that there is available space. SDG&E will provide additional information to the customer to complete the transfer to DA. Should a customer decline the space offered, the customer will be removed from the Wait List and remain on utility bundled service.
4.3.4. San Diego County Benefits
The County has taken advantage of DA as a tool to meet its own electricity consumption needs. Between 2009 and 2012, the County saved $3.7 million or approximately 9 percent average savings over bundled service from SDG&E using DA electricity procurement. The County has increased its total electrical load under DA (i.e., electricity commodity purchased from ESP) from 72 percent to 90 percent (County 2013).
4.3.5. Senate Bill 286D
Despite current restrictions, Direct Access may soon become a far more potent tool to deliver increased customer choice and renewably-generated electricity to nonresidential customers. On June 3, 2015, the California Senate approved SB 286. If the bill becomes law, beginning in January 2016, SB 286 would allow these large users to purchase 8,000 GWh annually of 100 percent renewable energy through California’s Direct Access program. In the process, the state’s greenhouse gas emissions would be reduced by about 1.7 million tons annually, the same as a 2 percent increase in the Renewable Portfolio Standard—all on a voluntary basis.
0.31%
38.30%
60.92%
0.47%
1 - 105
4.3.6. Conclusion
The DA program in California can provide eligible customers a choice when it comes to procuring electricity generation (i.e., nonresidential customers). And, as the County has demonstrated, participating customers may have an opportunity to realize real cost-savings by procuring electricity from an ESP instead of through bundled IOU service. However, under current DA caps, the ability for customers to participate is quite limited. Moreover, when viewed as a potential institutional arrangement for driving investment in renewables and energy efficiency, as currently constructed, DA has very limited ability to be impactful.
The County could consider lobbying both the CPUC and/or the state legislature to open up the DA cap beyond its current limits. Although an expanded DA program would likely result in increased choice for the County’s eligible constituents, under previous iterations, there was no reason to believe such an expansion would help the County reach its GHG emission reduction targets. SB 286, however, would empower many large nonresidential customers to contract directly for 100 percent renewable energy.
4.4. Sustainable Energy Utility
4.4.1. Summary
A Sustainable Energy Utility (SEU) presents new options to finance, market, and deliver sustainable energy services to energy end users. Developed by Dr. John Byrne and his colleagues at the Center for Energy and Environmental Policy at the University of Delaware, the objective of an SEU is to provide renewable energy and energy efficiency services with the same simplicity that traditional energy is provided through the existing utility model. SEU’s are created through legislation to establish an organization to administer financing programs, offer technical services, and coordinate the services of private Energy Service Companies (ESCOs) and financial institutions.
A typical SEU would capitalize a fund with relatively low-interest state or municipal bonds and use that capital to contract with private energy service companies to conduct energy audits and perform building energy efficiency and renewable energy upgrades. Once the project is completed, the energy customer would share the savings resulting from lower energy costs with the SEU to repay the bond and to fund the SEU’s activities. Because it can aggregate a large amount of demand for ESCO services, the SEU can help lower costs further by standardizing offerings, negotiating bulk discounts, and otherwise streamlining the process of identifying and executing cost-effective energy efficiency and renewable energy upgrades.
Although a CCA program could provide a similar energy integrator role and financing opportunities, the County may wish to further explore how an SEU model can help it attain its climate goals, particularly if the County does not pursue the formation of a CCA program. The Sonoma County Efficiency Financing Program (SCEF) is a scaled-down version of an SEU model the County may wish to replicate.
4.4.2. Background
A sustainable energy utility (SEU) is an independent and financially self-sufficient entity responsible for delivering energy efficiency, energy conservation, and customer-sited renewable energy to end users. An SEU targets all sectors and fuels, including electricity, transportation, and heating. This approach is in stark contrast to traditional demand-side policies and supply-side approaches that tend to address only certain types of fuels (e.g., electricity, but not heating or transportation) or limited “silos” of end users (e.g., residential but not municipal consumers). An SEU streamlines customer-sited energy service delivery (Houck 2009).
1 - 106
A sustainable energy utility is the single point-of-contact for efficiency and self-generation in the same way that conventional utilities are the point of contact for energy supply. The most important feature of an SEU is that energy users throughout a city or state can build a relationship with a single organization whose direct interest is to help residents and businesses use less energy and generate their own clean energy. As a nonprofit umbrella entity at a city, county, or state level, an SEU relies on a third-party management model, competitive contracting, and performance incentives to deliver sustainable energy services across all sectors and customer classes. As such, an SEU is publicly accountable and can be financially self-sufficient. It also has access to a range of potential funding sources and revenue streams, and can achieve energy savings without raising taxes or utility rates (Houck 2009).
According to Houck, the core characteristics of an SEU are as follows (2009):
Central coordination: sustainable energy services are coordinated by a single point of contact
Comprehensive programs: Programs target efficiency, conservation, and renewable energy across all fuels (e.g., electricity, heating, transportation) and customer classes (e.g., low-income, government, industrial, commercial, residential, etc.), regardless of utility service territory.
Flexible incentives: Sustainable energy services are not constrained by strict programmatic criteria that might exclude, or inadequately serve, certain customer groups.
Financial self-sufficiency: A financing plan ensures long-term self-sufficiency by generating revenue through the supply of customer-sited sustainable energy services.
Competitive procurement: A governance system is based on competitive contracting of independent management services.
Although these characteristics represent innovations over other existing administrative models, an SEU does not supplant other private-sector activities, but seeks to complement them by providing a focal point for energy efficiency, affordable energy and renewable energy, including information, incentives, and services.
The State of Delaware first adopted the SEU model and its unique bond financing structure in 2007 as an independent, non-profit organization to foster a sustainable energy future for the state. Development of the SEU model began in 2006.
In 2011, Delaware’s SEU issued the groundbreaking Energy Efficiency Bond Series. This financing created over $145 million in guaranteed dollar savings to enable a host of state buildings and higher education facilities, including those at Delaware State University, to receive $73 million in energy efficiency improvements at an effective borrowing rate of 3.7 percent over the 20-year life of tax-exempt bonds rated AA+ by Standard and Poor’s.
1 - 107

FIGURE 4-9. ILLUSTRATION OF EFFICIENCY FINANCING
4.4.3. Case Studies
4.4.3.1. Delaware SEU
The Delaware SEU is a non-profit organization unaffiliated with the state’s electric or gas utilities, but it works with them, the business sector, other nonprofits and communities throughout the state to impact Delaware’s energy profile. Its mission is to design and deliver comprehensive end user energy efficiency and customer-sited renewable energy service to Delaware’s households and businesses.
As stated in its enabling statute, SB 18, Delaware “has an opportunity to create new markets for customer-sited renewable energy generation that will help build jobs in the State of Delaware, improve our national security, keep value within the local economy, improve energy reliability, and protect Delawareans from the damaging effects of recurrent energy price spikes.” As a nonprofit agency, the SEU is governed by an Oversight Board and the Delaware Energy Office. The Oversight Board is intended to bring together a mix of public officials, energy experts, and citizens with general oversight, evaluation, and goal-setting responsibilities. Board members include the Secretary of the Department of Natural Resources and Environmental Control, the Delaware Public Advocate, seven members appointed by the Governor, and one appointee by both the President Pro Tempore of the Senate and the Speaker of the House of Representatives (Byrne 2009).
1 - 108
Through a competitive bid process, the Oversight Board selected an SEU Administrator with energy planning and management expertise for the day-to-day operations of the organization. This third-party management model relies on competitive contracting and performance incentives to meet the standards set forth by the Oversight Board. In this manner, the SEU is the point of contact for efficiency and self-generation in the same way that utilities are the point of contact for energy supply (Byrne 2009).
A critical element of the SEU is that individual energy users throughout the State can access energy services through a single organization that offers these services for the benefit of the energy user and the Delaware community. It combines Delaware’s private and public sector assets in an energy organizational structure that is publicly accountable, financially self-reproducing, and entirely focused on energy and environmental sustainability. Moreover, the SEU has a mandate to develop innovative approaches using third-party financing, federal incentives, program revenues, and leveraging sustainable energy funds available through other public sector and philanthropic sources. The SEU has the authority to issue tax-exempt bonds to contribute to the financing of its program activities, and is designated as the administrator of existing public-purpose energy funds and the Regional Greenhouse Gas Initiative (RGGI) emissions auction proceeds (Byrne 2009).
The financing model allows the SEU to do two vital things for a 21st century energy utility: (1) it has the capacity to secure sufficient capital to invest in the infrastructure of sustainable energy (rather than simply a suite of programs); and (2) it is capable of taking the “long view,” rather than having to mostly produce short-term benefits. It primarily utilizes the following funding sources: tax-exempt bonds and leases, revolving funds, and cooperative investments. The energy cost-savings created through the community investments made by the SEU are shared between the household, farm or business, on the one hand, and the SEU on the other.
Energize Delaware is an initiative of Delaware’s SEU and it administers several programs for homes and businesses. For residential properties, Energize Delaware offers a discounted home energy audit as well as rebates for energy efficiency measures through its Green for Green Program. For businesses and nonprofits, the Energize Delaware Revolving Loan Fund is a revolving loan that offers businesses financing options to encourage the adoption and installation of end-user energy efficiency measures and customer-sited renewable generation and GHG measures.
4.4.3.2. Washington, D.C.
The District of Columbia SEU is administered by the Vermont Energy Investment Corporation and is funded primarily through a utility charge. It offers rebates for businesses to help offset the costs of energy efficient equipment. In addition, it offers cash incentives and financing packages to reduce the upfront costs of qualifying home energy upgrades.
4.4.3.3. State of Vermont
Established in 2000, Efficiency Vermont is the state’s SEU. A charge on ratepayers’ electric bills provides the funds for delivery of energy efficiency services. Vermont businesses and homeowners who have used Efficiency Vermont’s services to make cost-effective efficiency investments have saved more than 660 million kWh in annual electric energy, and the cumulative lifetime economic value of efficiency investments in Vermont has totaled more than $643 million.
4.4.3.4. State of Wisconsin
Focus on Energy is Wisconsin utilities’ statewide energy efficiency and renewable resource program. The program is funded by the state’s investor-owned energy utilities and participating municipal and electric
1 - 109
cooperative utilities, and has been operating since 2001. Focus on Energy works with eligible Wisconsin residents and businesses to install cost-effective energy efficiency and renewable energy projects. Focus on Energy provides information, resources, and financial incentives help to implement energy projects that otherwise would not be completed, or to complete projects sooner than scheduled.
4.4.3.5. Sonoma County, CA
The Sonoma County Water Agency has launched a program to finance energy efficiency and water conservation retrofits for public and nonprofit facilities. The Sonoma County Water Agency has partnered with the Foundation for Renewable Energy & Environment to develop the Sonoma County Efficiency Financing (SCEF) Program. Under the SCEF Program, participating organizations contract with an Energy Service Company (ESCO) to complete energy and water conservation measures. Improvements can include street lighting, building lighting, system controls, water pumps, HVAC systems, boilers, chillers, and others. The participating organizations receive substantial utility cost-savings, including a contractual guarantee sufficient to cover the full cost of all retrofit work. The Program uses tax-exempt bonds to finance the projects.
Financing details from the SCEF Program:
No upfront capital costs required from participants. All projects costs are fully paid for through the savings guarantee.
Because participants are sharing the cost of documenting the financing, the overall interest rate including transaction costs, should always be lower than what the participant can achieve in the marketplace.
Financing is customized for each participating organization and each measure separately. No organization and no measure subsidizes any other.
The financing is tax-exempt.
Interest rate on the loan is likely to range from 1.5 percent to 4 percent, depending on credit rating, and the length of time it takes to pay for retrofits through utility bill savings.
Guaranteed dollar savings.
With this program, there is a minimum set of guarantees with savings on utilities. Those funds are used to pay back the loan and reduce Operating Expenses.
Incentivized deep retrofits (longest payback is typically 20 years with the average just under 14 years)
Common contractual documents.
Net savings accrue to public participants who own all improvements at the conclusion of the project.
Project Flexibility (selection of Energy Conservation Measures [ECMs] and repayment terms customized to meet participant needs while providing immediate, positive cash flows)
Monitoring and verification protocols that support participant goals.
4.4.4. Conclusion
1 - 110
An SEU can facilitate increased investments in energy efficiency and customer-sited renewables, which in turn, can help facilitate a more robust regional economy. The Delaware SEU created nearly 980 jobs in construction, project engineering, and building management. The SEU model can continuously organize investments over and over, creating significant potential for the model to significantly impact the regional energy economy. At the same time, an SEU keeps value in the local economy due to the employment of local contractors and its emphasis on local production of the equipment used to meet energy needs.
The SEU positions itself as a one-stop destination for conservation/energy efficiency and renewable energy, allowing everyone to interact with a single, public-minded organization, avoiding confusion and reducing administrative costs. In this way, communities can build customized programs to meet local needs rather than focusing a one-size-fits-all solution that too often characterizes the current energy economy. Another advantage, built into the fabric of the SEU, is increased reliance on distributed rather than centralized technology architectures. Such an approach insulates communities from energy price volatility, which is common with fossil fuel energy sources.
Because the traditional SEU model requires enabling legislation, San Diego County should look to Sonoma County’s SCEF, which is a scaled-down SEU model that does not require legislative action in order to implement. The County should monitor the progress and success of the SCEF program and work with subject-matter experts to determine whether a similar program might prove successful in the County.
4.5. Property Assessed Clean Energy (PACE) Financing
4.5.1. Summary
Property Assessed Clean Energy (PACE) financing is a loan alternative designed to encourage the installation of distributed renewable energy systems and energy efficiency measures by helping property owners overcome the barrier of high up-front energy equipment and installation costs.
PACE financing is designed to overcome two common roadblocks to investment in energy efficiency and renewable energy systems—lack of capital and hesitancy to make long-term investments—by (NREL 2010):
Eliminating large up-front costs for energy retrofits.
Reducing concerns about investment recovery when the property is sold, because the financing is tied to the property rather than to the owner.
Converting an annual or semi-annual payment into a net monthly cost similar to that of other personal expenses (e.g., cable, cell phone service), which are often partially or wholly offset by electric bill savings.
Improving access to credit at a competitive, fixed interest rate; in addition, PACE assessment terms of 15 to 20 years exceed typical home equity loan terms.
Reducing the likelihood of a negative impact on the municipality’s credit or obligation risk, and thus, not endangering other municipal programs.
Providing accessible energy efficiency and renewable energy information and/or educational programs; moreover, the programs are sponsored by the municipality, which could engender more trust in the accuracy of the information as opposed to contractor-led programs.
Programs currently available in San Diego County:
California HERO PACE Financing
CaliforniaFIRST
1 - 111

Figtree OnDemand (commercial only)
The County should continue to support PACE financing programs and help educate the public about the advantages PACE financing can provide. The County may want to explore the creation of Clean Energy San Diego PACE district to provide additional PACE financing options to the region (e.g., Ygrene Energy Fund, etc.).
4.5.2. Background
Under PACE programs, municipalities and counties form special tax districts that allow property owners to finance energy efficiency, water efficiency, and renewable energy projects on existing and, in some cases, new residential and commercial structures through a voluntary special tax assessment. Assessments are similar to loans in that they allow a property owner to pay off debt in installations over a long period of time. However, PACE assessments are not legally considered loans. Property owners who invest in energy efficiency measures and small renewable energy systems typically repay these assessments over 15 to 20 years via additional payments on their property tax bills (NREL 2010).
PACE financing can help state and local governments address two major roadblocks to clean energy development at both the commercial and residential level: (1) lack of capital and (2) hesitancy to make long-term energy efficiency and/or renewable energy investments.
With respect to the capital cost barrier, property owners often shy away from the up-front cost of energy improvements. Although a portion of the population is willing to make the investment, most consumers are cautious about any investment, especially given the recent economic environment. To finance energy improvements, traditionally property owners have had to self-finance through channels such as home equity loans or rely on small-scale state or local government rebates and other miscellaneous financial incentives. Moreover, because many homeowners move every five to seven years, they might hesitate to make a long-term investment in a renewable energy system or energy efficiency improvements. However, PACE assessments are transferable, which leaves open the possibility for property owners to recoup their investment upon sale.
As mentioned, the pivotal innovation of PACE financing is the creation of energy efficiency or renewable energy assessments that are tied directly to the house or commercial property and repaid via the property owner’s tax bill. The assessment, which is secured by a senior lien on the property, does not require an up-front payment. The lien provides strong debt collateral in the event the property owner defaults on the assessment. Because the assessment and lien are tied directly to the property, they can be transferred upon sale. The basic flow of financing activity is shown in FIGURE 4-10 below (NREL 2010).
1 - 112

FIGURE 4-10. PACE FINANCING ILLUSTRATION
Source: NREL 2010
Once the project is complete, the property owner repays the assessment, usually over 15 to 20 years. During the repayment period, however, the property owner will enjoy reduced electric utility bills as a result of the energy investment. Not unlike a mortgage, homeowners receive a tax deduction for the interest on a PACE assessment, but not for the principal (NREL 2010).
A critical design element of the PACE financing model is the use of special tax districts known as clean energy assessment districts. These districts are regularly used in the financing of traditional local government projects (e.g., sewers and streetlights), and they provide two benefits for the localities. First, the special district shields the locality from risk, thereby ideally helping to protect its overall debt rating. Second, the special district allows the additional assessment to be placed only on property whose owners opt to participate in the program (NREL 2010).
4.5.3. PACE in California
At the local and regional level, cities and regional planning entities play an important role in implementing AB 32 through the adoption of climate action plans. In 2007, California amended the California Environmental Quality Act (CEQA) to require new regulations addressing mitigation for GHG emissions and impacts (SB 97). In response, the California Natural Resources Agency issued new CEQA guidelines in 2009 establishing review criteria for GHG emission reduction plans that can streamline CEQA review for individual projects consistent with those plans. Local governments responded by adopting climate action plans to address GHG impacts at the programmatic level, where there is a greater opportunity for flexibility in mitigation (Anders 2014).
Where the local government’s objective is to stabilize or reduce total GHG emissions, PACE programs can be an effective financing measure to reduce or offset GHG emissions from buildings through efficiency and renewable energy improvements. PACE financing programs serve as a market-based mechanism to supplement existing and former rooftop solar programs, such as the California Solar Initiative and the California Energy Commission’s New
1 - 113

Solar Homes Partnership.19 As these programs phase out over time, financing programs such as PACE can play an increasingly important role (Anders 2014).
4.5.3.1. Enabling Legislation
PACE financing programs for rooftop solar as well as the financing for energy efficiency or water efficiency investments can be established and administered under either of two different statutory frameworks: the Improvement Act of 1911 (Improvement Act) as amended by AB 811 or the Mello-Roos Act under a city’s charter authority or as amended under SB 555. Both the Improvement Act and Mello-Roos Act authorize creation of special tax districts, voluntary contractual agreements for financing between an authorized entity and the property owner, use of available funding from any source including existing bond issuing statutes and attachment of the assessment for payment of the assessment to the property (as opposed to the individual owner). Additionally, several programs were created by charter cities under their Mello-Roos Act authority before the passage of SB 555 (Anders 2014).20
There are several important statutory differences between the Mello-Roos Act and the Improvement Act as well as structural differences in the programs that operate under each.
Several Improvement Act programs operate under a joint powers authority (JPA) structure, mitigating administrative burden and cost barriers that would normally be associated with creation of an Improvement Act program.
Mello-Roos Act allows improvements on new commercial construction and new residential construction, when undertaken by the intended owner or occupant.
Mello-Roos Act, as amended, allows financing of improvements on publicly owned buildings so long as the properties are able to receive property tax bills under their assigned assessor parcel numbers.
Mello-Roos Act allows a leasehold interest to be used as collateral to secure the PACE financing.
Mello-Roos Act has less constitutional restrictions than the Improvement Act.
Improvement Act special tax assessment is not senior in status to prior existing special tax assessments.
Mello-Roos Act districts allow off-tax roll billing at the onset of the lien.
Improvement Act only allows assessments on single-family residences of 1-3 units and multifamily residences of five or more.
19 The California Solar Initiative set a goal of installing 3,000 MW of PV systems by 2016 through provision of financial incentives to offset a portion of the installed cost of a qualified system. The New Solar Homes Partnership provides financial incentives and other support to homebuilders that construct new, energy efficient solar homes. Anders, J. K. a. S. J. (2014). Residential and Commercial Property Assessed Clean Energy (PACE) Financing in California Rooftop Challenge Areas, Energy Policy Initiatives Center (EPIC), University of San Diego School of Law; Center for Sustainable Energy. 20 The City of San Francisco’s GreenFinanceSF still operates under this structure. The city is currently reviewing the viability of this mechanism in light of an August 1, 2014, Fourth California Appellate District ruling invalidating a charter city’s authority under Mello-Roos to levy a special tax under Government Code §53326 (landowner election) as well as the city’s charter authority. It is unclear whether this decision affects the alternative mechanism to create a Mello-Roos PACE district under Government Code §53328.1 (a)-(f).
1 - 114

In addition to the differences noted above, the City of San Diego has identified several nuanced advantages for Mello-Roos district programs when compared to Improvement Act districts in its October 8, 2012, Report to the City Council, Report No: 12-125. These include:
Minimum waiting period between placement of lien and bond issuance is shortened from 30 to 15 days.
Lien amount placed on property is only for annual repayment obligation, rather than all amortized future payments.
Public agency liability limited to district creation and operation rather than program creation and operation.
Payments may be billed off tax roll in all situations rather than only in some situations.
In California, several models exist to administer a PACE program. A city, county, or special district may administer their programs themselves, contract with a private third party, or join a public entity such as a JPA that may contract with a private third party. Each option offers advantages and disadvantages in the form of costs to a city or property owners, software, program funding limits, access to financing or capital providers, minimum project amounts, mortgage lender consent requirements, and varying degrees of transparency regarding fees charged by the program administrators and their partners. While program costs to the city and its citizens are an important factor when evaluating different approaches to administer a PACE program, cities and counties should also evaluate the customer service, ease of use, marketing, and property owner participation when comparing program administrators (Anders 2014).
4.5.3.2. Obstacles for Residential PACE
Residential PACE financing has faced opposition as early as 2009 from the Federal Housing Finance Agency (FHFA), which regulates Fannie Mae and Freddie Mac. On July 6, 2010, the FHFA issued a determination that PACE programs presented significant safety and soundness concerns to existing mortgages and therefore the entities that underwrite or insure those mortgages (FHFA Statement on Certain Energy Retrofit Loan Programs 2010). This concern was expressed in the wake of the residential housing finance bubble when FHFA became the conservator of Fannie Mae and Freddie Mac (Anders 2014).
The greatest concern expressed by FHFA about residential PACE programs stemmed from the fact that PACE assessments had a lien status superior to that of existing mortgages underwritten by Fannie Mae and Freddie Mac. In the event of default and forced sale, any outstanding PACE assessment would be paid before other liens such as a first deed of trust. The FHFA stated that the superior lien status of PACE assessments added, among other things, risk to lenders and secondary markets and altered valuation of mortgage-backed securities because of the uncertainty surrounding potential foreclosures, diminution in value at sale, increased risk of delinquency, and lack of uniform underwriting standards such as loan-to-value ratios, standard credit worthiness requirements (FICO) and total debt-to-income ratios. In addition, according to the FHFA, residential PACE assessments may violate the terms of a property owner’s mortgage because they can be characterized as loans rather than assessments. Specifically, the FHFA distinguished PACE programs from standard tax assessments because, in the FHFA’s view, they are voluntary, opt-in contractual arrangements with cities or counties, and because owners control the use of funds, hire contractors, own the fixtures, and bear the cost of repairs (FHFA Statement on Certain Energy Retrofit Loan Programs 2010, Anders 2014).
1 - 115

As a result of these concerns, Fannie Mae and Freddie Mac issued guidance letters to lenders stating that they would no longer purchase mortgage loans secured by a property with an outstanding PACE assessment originated after July 6, 2010, and a first lien priority. The letters also stated that PACE assessments would be treated like home equity loans for properties with PACE loans originated before July 6, 2010. To the extent a bank wishes to offer a conforming loan to a property owner, the bank must force the property owner to pay off the PACE assessment balance in full before selling or refinancing a conforming loan. Thus, a property owner with a Fannie Mae or Freddie Mac loan would not be able to transfer the PACE assessment to a new property owner.
The FHFA also issued a directive on February 28, 2011, affirming that Freddie Mac and Fannie Mae will no longer buy mortgage loans secured by properties with outstanding residential PACE obligations originating after July 6, 2010, and its authority to order such action under 12 U.S.C. §4617. This effectively stopped residential PACE finance programs in California and across the nation.
Following a March 19, 2013, ruling in the Ninth Circuit Court of Appeals, which found for the FHFA and dismissed litigation brought by Sonoma County, the State of California and other parties, there remains additional uncertainty in California regarding residential PACE—the full implications of which remain to be seen. Despite this uncertainty, some entities continued their residential PACE programs and other entities created new residential programs during the then pending litigation. Each of these entities has chosen to approach the FHFA issue differently and the full implication of these approaches remains unclear. Accordingly, a property owner may still risk violating the terms of a mortgage by having a PACE assessment.
The FHFA’s actions do not impact commercial mortgages, which are overseen by the Office of the Comptroller of the Currency (OCC). On the same day that FHFA issued its determination, the OCC issued Supervisory Guidance echoing the FHFA safety and soundness concerns and calling on national banks to “mitigate exposure and protect collateral positions” (Office of the Comptroller of the Currency 2010). The OCC has taken no other actions regarding PACE. Commercial PACE programs that require the affirmative acknowledgement or consent of the mortgage holder are considered to adequately mitigate risks to lenders.
In response to the concerns raised by the FHFA related to potential risks posed to first mortgage lien holders and their underwriters by PACE liens during foreclosure or forced sale, Governor Brown signed SB 96 on September 26, 2013, authorizing the California Alternative Energy and Advanced Transportation Financing Authority (CAEATFA) to create a residential PACE Loss Reserve Program. The loss reserve program was designed to increase the availability of PACE financing and mitigate risk to PACE lien holders in California.
The CAEATFA designed the loss reserve program to make first mortgage lenders whole for any losses caused by a PACE lien during a foreclosure or forced sale. The program provides payment for losses in two instances:
Foreclosure by first mortgage holder: Losses resulting from the first mortgage lender’s payment of a PACE assessment while in possession of the property subject to the PACE assessment. Losses may also include penalties and interest where they have accrued through no fault of the first mortgage lender.
1 - 116

Forced sale by county or city: In any forced sale for unpaid taxes or special assessment, losses incurred by the first mortgage lender resulting from overdue PACE assessments being paid first where the sale price is less than combined value of outstanding taxes and the first mortgage.
4.5.3.3. Case Studies
The following are PACE programs in California created under the Improvement Act as amended by AB 811:
4.5.3.3.1. Sonoma County Energy Independence Program (SCEIP)
The Sonoma County Energy Independence Program (SCEIP) was the first multijurisdictional PACE program under AB 811. As of August 2014, SCEIP has funded 2,029 residential and 61 commercial projects across all eligible project categories (including solar), disbursing $67,655,869 through its internal county financing measures. Approximately $9 million of this has been paid back to the county through early payoffs and is being used to fund new projects. Sonoma County is seeking long-term financing to make its PACE program sustainable. The program does not have additional funding for future PACE assessments beyond the $60 million authorized from the treasury pool. As such, the county seeks to pool existing assessments for sale as revenue bonds on the open market to replenish their initial funding supply to ensure continuous funding of the program (Anders 2014).
SCEIP has approved, financed, and seen the completion of 46 commercial solar projects totaling $5,036,838, and 1,255 residential solar projects totaling $40,759,091 as of June 2014. The solar projects average $32,477 for residential properties and $111,930 for commercial properties. The projects total 2.2 MW for commercial and 7.1 MW for residential in generational capacity, saving an estimated 16,770,508 kWh of electricity and 126,085 therms of gas.
Originally intended to be a statewide example and resource for PACE implementation, SCEIP was sidelined by then unresolved FHFA residential mortgage issues. SCEIP persevered through these challenges, creating exceptional resources and information for local governments, contractors, and property owners to understand PACE through its website and knowledgeable staff. The County of Sonoma administers SCEIP. The auditor-controller/treasurer-tax collector serves as the designated program administrator.
4.5.3.3.2. The HERO PACE Programs
The Western Riverside Council of Governments (WRCOG) administers the WRCOG and California HERO Programs and the San Bernardino Associated Governments (SANBAG) administers the SANBAG HERO Program. All three programs utilize services provided by Renovate America (residential) and Samas Capital (commercial). As of August 8, 2014, the WRCOG residential HERO program is approved and accepting applications in its 18-member jurisdictions within Western Riverside County. As of August 7, 2014, the SANBAG residential HERO program is approved in all 25 SANBAG jurisdictions with all 25 accepting applications. As of September 9, 2014, the residential California HERO program is approved in 139 jurisdictions statewide. The program is currently accepting applications in 96 of these jurisdictions and expects the other 43 to launch in November 2014.
Renovate America has successfully securitized $103 million in HERO bonds at an AA rating as well as securing $50 million in private equity investment capital and a $300 million credit facility. The residential HERO programs combined have funded over 14,000 projects totaling more than $360 million in all eligible improvement categories. The programs have approved 29,610 applications for a total of approximately $1,199,969,278 in improvements as of July 31, 2014. HERO program administrators report that there have been no defaults to date.
1 - 117

The programs total approximately 7,200 in approved solar projects since inception with approximately 3,600 of these projects financed and construction completed. Approximately 26 percent of all improvements funded through the HERO program are solar projects, accounting for approximately 35 percent of the total financed amount. The average amount financed for solar projects is approximately $25,000. These systems have an estimated capacity of 22 MW equating to an estimated electric efficiency savings of 5,300 kWH and gas efficiency savings of 50 therms per project.
4.5.3.3.3. CaliforniaFIRST
The CaliforniaFIRST program is part of the California Statewide Communities Development Authority (CSCDA), known as California Communities, a joint powers authority co-sponsored by the California State Association of Counties and the League of California Cities. CSCDA contracts with Renewable Funding to administer the CaliforniaFIRST program. The CaliforniaFIRST Program is structured for use statewide by all interested eligible government agencies.
CaliforniaFIRST has operated as a statewide commercial PACE program that uses an open-market approach to finance projects. Under the open-market approach, the commercial property owner may use a list of capital providers from CaliforniaFIRST to compare terms or may use their own capital provider. The financing transaction is run through CaliforniaFIRST in order to secure the PACE lien and corresponding benefits. Currently, the program operates its commercial program in 17 counties and more than 150 cities in California. CaliforniaFIRST’s commercial program is also pending approval in additional jurisdictions.
CSCDA elected to suspend CaliforniaFIRST’s residential PACE program due to FHFA issues, but reversed its decision after the establishment of the CAEATFA Residential PACE Loss Reserve Program. CaliforniaFIRST launched a full residential PACE program in September 2014. The residential PACE program is operating or pending approval in 138 jurisdictions.
To date, CaliforniaFIRST has approved financing on 55 commercial projects totaling $38,179,828. The solar project cost averages is approximately $67,663. Financing for these projects has not yet been secured to date.
4.5.3.3.4. Los Angeles County Commercial PACE Financing Program
In May 2010, the Los Angeles County Board of Supervisors approved the formation of an AB 811 Improvement Act PACE assessment district and the launch of both commercial and residential PACE programs. Cities within the county had to pass a resolution to opt into the county program in order to participate. To date, 80 of the 88 cities in Los Angeles County have opted into the program. In July 2010, however, the residential PACE program was placed on hold due to FHFA statements that PACE programs present safety and soundness concerns to the mortgage portfolios held by Fannie Mae, Freddie Mac, and the federal mortgage agencies.
Despite the residential program being put on hold, Los Angeles County’s Commercial PACE Program was launched in 2012, and began initiating loans for commercial properties in 2013. Thus far, it has funded $14.1 million in commercial energy upgrade projects with an additional $176 million in projects in the pipeline.
LA County’s Commercial PACE Program uses a similar open-market financing model as GreenFinanceSF and CaliforniaFIRST by which a property owner chooses an investor, negotiates financing rates and terms, and the county issues a bond that is purchased by a lender or third-party capital investor to fund the project. Notably, the primary difference between LA County and GreenFinanceSF is the statutory requirements and flexibilities set out by each program’s enabling statute, the Improvement Act as amended by AB 811 and the Mello-Roos Act, respectively.
1 - 118
Los Angeles County launchched a countywide residential PACE program in June 2015. On August 26, 2014, Los Angeles County released an RFP to begin the open and competitive process for hiring an administrator to launch and manage the County’s residential PACE financing program. Los Angeles County selected CaliforniaFIRST and HERO to begin administering the program.
4.5.3.3.5. California Enterprise Development Authority – Figtree PACE Financing Program
The California Enterprise Development Authority (CEDA) is a joint powers authority established by the California Association for Local Economic Development (CALED). CEDA currently has 40 city members and 21 county members. CEDA is the agency that forms assessment districts for the Figtree PACE financing program under the Improvement Act of 1911.
Figtree operates in 75 jurisdictions across the state. The program has financed and completed 23 projects. Of these projects, ten were solar projects totaling approximately $1 million in funding. The average amount financed per solar project is approximately $150,000. To date, Figtree has not seen any defaults.
Figtree’s residential PACE program will launch in 2015 and will feature many of the same elements found in its commercial PACE program. The program will utilize the same legal structure and management team. Figtree’s residential PACE program is authorized in more than 70 California cities. Cities and counties joining the Figtree program authorize CEDA to enroll both residential and commercial properties.
4.5.3.3.6. The City and County of San Francisco – GreenFinanceSF
GreenFinanceSF established a program using its charter authority to create a Mello-Roos community facilities district (CFD) prior to the passage of SB 555. San Francisco shut down its residential PACE program during the FHFA controversies but has since restarted its commercial PACE program. It should be noted that San Francisco is currently moving forward with a new multivendor residential PACE program at the time of this writing, and it is expected that financing will be available in 2015.
In October 2012, the City of San Francisco issued its first $1.4 million PACE bond to Clean Fund to finance a retrofit project of the Pier 1 property, which is owned by the Port of San Francisco. This project is unique in California because it financed the retrofit of a publicly owned building using the leasehold interest of the master tenant, Prologis, as collateral. Specifically, the Port of San Francisco created an agreement with Prologis under which the Port agreed to annex the property into the community facilities district (CFD) and for the lien securing the special taxes to be issued against Prologis’ 50-year master leasehold interest on the property. This agreement eliminates the Port’s liability. Additionally, the Port and Prologis agreed that should the leasehold interest be terminated, the port will identify a replacement leasehold interest that terminates no earlier than the final maturity of the bond. Prologis will also pass along the costs of the PACE financing to the other tenants of the property, which includes the offices of the Port of San Francisco, on a pro rata basis per square footage occupied.
The City of San Francisco used a qualified energy conversation bond (QECB) to support this financing. The city found that while this type of bond added additional complexity, it offered a significantly lower interest rate, less than 4 percent, and helped to accelerate the close of the financing arrangement and project approval because of hard deadlines that must be met under these types of tax-favored bonds.
GreenFinanceSF may demonstrate the advantages of using Mello-Roos and SB 555 for municipally operated open-market commercial PACE programs as compared to open-market models under AB 811, such as the Los Angeles County commercial PACE financing program.
1 - 119

4.5.3.3.7 City of Sacramento – Ygrene Clean Energy Sacramento Program
Currently, Ygrene operates commercial and residential programs under the SB 555 amendment to Mello-Roos in Butte County (commercial only), the City of Sacramento, Sacramento County, Yolo County, Coachella Valley, and City of Chula Vista. To date, these programs have financed 4 commercial and 128 solar projects, for a total of approximately $300,000 financed for commercial and $2.5 million financed for residential. Three additional commercial solar projects are approved but not financed and 24 residential solar projects are approved but not financed. Of the 128 approved residential projects, 20 are pending completion. Average costs per solar project equates to $400,000 per project for commercial and $20,000 per project for residential.
Ygrene Clean Energy Sacramento is the SB 555 program with the longest operational track record. Ygrene Energy Fund Inc. administers Sacramento’s program. Ygrene’s Clean Energy Sacramento is a privately funded and administered program, and the only operational program of this type in California, though Clean Energy San Diego is in the review process but faces additional steps before it becomes operational. Ygrene funding comes exclusively from private capital markets, which offer the potential to provide access to large amounts of financing for PACE programs.
PACE in Sacramento has undergone several transitions. The city originally authorized an AB 811 Improvement Act program under CaliforniaFIRST in January 2010. However, CSCDA later suspended its CaliforniaFIRST program because of then unresolved FHFA issues. In light of the suspension, the city decided to examine alternatives and solicited proposals through its RFP process from private companies interested in administering a similar program.
The City of Sacramento selected Ygrene Energy Fund California, LLC to administer its PACE program under the Improvement Act of 1911. The city then rescinded its CaliforniaFIRST program over its concerns with having two authorized Improvement Act programs in its jurisdiction. The city determined that its participation in the CaliforniaFIRST program was “no longer needed.” Specifically, Sacramento adopted Resolution No. 2012-205 on June 19, 2012, rescinding Resolution No. 2010-023 relating to the CaliforniaFIRST PACE program. Resolution No. 2012-205 acknowledged the uncertainty over residential PACE that led to CSCDA suspending its CaliforniaFIRST program for residential until issues raised by FHFA could be resolved.
After the passage of SB 555, Sacramento halted the creation of its Ygrene-administered AB 811 Improvement Act program and instead authorized the creation of a Ygrene-administered SB 555 Mello-Roos program. Sacramento originally sought a program administrator for a commercial-only program but chose to establish a SB 555 program out of the desire to include residential. To this end, Ygrene expanded eligibility for its program financing in July 2012 to include residential, commercial, new construction, and publicly owned buildings. This provides PACE financing to a greater number of properties than Improvement Act programs because of the Improvement Act restriction on financing only developed residential properties. The City of Sacramento also filed a lawsuit for judicial validation of its Mello-Roos program. The city completed the validation process and received a final court judgment validating the program.
The City of Sacramento has authorized Ygrene to finance up to $100 million in projects for its Clean Energy Sacramento PACE program. While Mello-Roos expressly allows for PACE financing on publicly owned buildings, the mechanisms by which to opt into paying a special tax assessment on a tax-exempt property (properties that are not part of existing tax rolls) remains an issue to be resolved. Because
1 - 120

government and other nonprofit properties are not part of existing tax rolls, there is no established process for recording and administering the assessment.
4.5.3.3.8 PACE Program Comparison
TABLE 4-2. PACE PROGRAM COMPARISON
Program SCEIP WRCOG
HERO California
HERO CaliforniaFIRST
LA County PACE
GreenFinanceSF Clean Energy
Sacramento
Figtree’s OnDemand
PACE
Gov’t Entity
County of Sonoma
Western Riverside Council of
Governments (WRCOG)
WRCOG
California Statewide
Communities Development
Authority (CSCDA)
County of Los
Angeles
City and County of San Francisco
Ygrene Energy Fund California,
LLC
(Issuing Entity)
California Enterprise
Development Authority (CEDA)
Program Admin.
Auditor-Controller Treasurer-
Tax Collector
WRCOG
Renovate America
(Residential)
Samas Capital (Commercial)
Renewable Funding
County of Los
Angeles
City and County of San Francisco (Department of the Environment and Controller’s Office of Public
Finance)
Ygrene Energy Fund California,
LLC.
Figtree Financing
Funding Source
Municipal Bonds
Renovate America
(Residential)
Samas Capital (Commercial)
Renovate America
(Residential)
Samas Capital (Commercial)
Program arranged capital
(Residential)
Revenue bonds through third-party lender
(Commercial)
Revenue Bonds sold to
investors
Revenue Bonds Local and regional banks
CEDA under the
Improvement Bond act of
1915
Program Funding
Limit $60 million
$900 million aggregate
$2 billion $17 billion Limited
by investors
$100 million No effective
total program limit
~$500 million
4.5.3.4. PACE in San Diego County
There are several different PACE programs current available to San Diego County residents and businesses. CaliforniaFIRST, California HERO and Figtree’s OnDemand program all offer PACE financing for commercial properties in San Diego County. In July 2014, HERO financing was extended to residential properties in the San Diego area. The HERO program has funded 206 residential projects worth $4.9
1 - 121

million—as of July 2014—in cities within San Diego County and shows signs of accelerating. It has received 1,200 loan applications from the area (Lee 2014) .
With respect to residential PACE, CaliforniaFIRST and the HERO program offer financing to homeowners across the unincorporated parts of San Diego County, the city of San Diego, and nearly all other local cities in the region. Further competition may be coming to residential PACE financing in San Diego through expansion of the Ygrene administered PACE program.
Clean Energy San Diego is a coalition of business leaders, environmentalists, and San Diego citizens working with Ygrene Energy Fund to create a PACE district in San Diego. Ygrene is already up and running within Chula Vista, where it had 50 projects worth $4.5 million completed or under construction at the end of 2014, but is still looking to expand into other jurisdictions. In January 2015, Ygrene announced that local governments can join its program in one efficient step that can take as little as 30 days, under a new arrangement with a local housing finance authority in Sacramento named Golden State. Ygrene is the only PACE lender in California offering 30-year solar loans to homeowners. The loan carries an interest rate of 8.49 percent. Ygrene’s interest rate on a five-year loan is 5.99 percent while a 20-year loan is 8.25 percent (Lee 2015).
4.5.3.5. Conclusion
PACE programs are an innovative financing mechanism that can be used to deploy a wide range of energy and water improvements, from rooftop solar energy systems to reflective “cool” rooftops, insulated windows, low-flow toilets, and desert-friendly landscaping to replace grass lawns, to mention a few. Unlike personal home equity loans, PACE obligations are attached to the property and designed to be passed along to the next owner when homes or commercial businesses are sold.
Despite the issues with FHFA over the lien priority of PACE assessments, PACE financing in the residential sector is experiencing a strong resurgence in California. Commercial PACE financing, not having faced the same hurdles, has continued to prove successful. The County currently has an opportunity to help educate residents about the availability of these programs and encourage participation as a means to help reduce the region’s electricity demand. Increased competition among the various PACE programs should result in better product offerings for County residents. As such, the County should explore how it might support efforts to create a PACE district in San Diego administered by Ygrene Energy Fund.
4.6. Bonds
4.6.1. Qualified Energy Conservation Bonds (QECBs)
A Qualified Energy Conservation Bond (QECB) is a bond that enables qualified state, tribal, and local government issuers to borrow money at attractive rates to fund energy conservation projects. A QECB is among the lowest-cost public financing tools because the U.S. Department of the Treasury subsidizes the issuer’s borrowing costs.
QECBs are taxable bonds, which means that investors must pay federal taxes on QECB interest they receive. Issuers may choose between structuring QECBs as tax credit bonds (bond investors receive cash rebates from the U.S. Department of the Treasury to subsidize borrowing costs). Most QECBs are expected to be issued as direct subsidy bonds due to the current lack of investor appetite for tax credit bonds.
QECB proceeds can be used to fund capital expenditures on a variety of projects including:
Reducing energy consumption in publically owned buildings
1 - 122

Implementing green community programs (including loans, grants, or other repayment mechanisms) such as efficient street lighting replacements and loan programs for residential energy efficiency improvements
Developing rural capacity, specifically involving the production of electricity from renewable energy resources
Supporting energy-related research facilities, research grants and research
Implementing mass commuting and related facilities that reduce energy consumption and pollution
Designing/running demonstration projects to promote the commercialization of energy-related technologies and processes
Launching public education campaigns to promote energy efficiency
The U.S. Congress authorized $3.2 billion of QECB issuance capacity, which has been allocated to states, local governments, and tribal governments based upon population.
4.6.2. Clean Renewable Energy Bonds (CREBs)
Clean Renewable Energy Bonds (CREBs) may be used by certain entities, primarily in the public sector, to finance renewable energy projects. CREBs may be issued by electric cooperatives, government entities (states, cities, and counties), and by certain lenders. The bondholder receives federal tax credits in lieu of a portion of the traditional bond interest, resulting in a lower effective interest rate for the borrower. The issuer remains responsible for repaying the principal on the bond.
The Energy Improvement and Extension Act of 2008 allocated $800 million for new CREBs. In February 2009, the American Recovery and Reinvestment Act of 2009 allocated an additional $1.6 billion for new CREBs, for a total new CREB allocation of $2.4 billion. With close to $1.4 billion in volume cap for new CREBs remaining, in February 2015, the IRS announced a March 5, 2015, opening of the rolling volume-cap application window for governments (2015).
Participation in the program is limited by the volume of bonds allocated by Congress for the program. Participants must first apply to the IRS for a CREBs allocation, and then issue the bonds within a specified time period. The new CREBs allocation totaling $1.4 billion does not have a defined expiration date under the law; however, the recent IRS solicitations for new applications require the bonds to be issued within three years after the applicant receives notification of an approved allocation (2015).
CREBs differ from traditional tax-exempt bonds in that the tax credits issued through CREBs are treated as taxable income for the bondholder. The tax credit may be taken each year the bondholder has a tax liability as long as the credit amount does not exceed the limits established by the federal Energy Policy Act of 2005.
In March 2015, the IRS solicited applications for the remaining nation volume for new CREBs. The County should consider pursuing an allocation.
4.6.3. Municipal Bonds
A municipal bond is a bond issued by a local government or their agencies. In the United States, interest income received by holders of municipal bonds is often exempt from federal income tax, and may be exempt from state income tax, although municipal bonds issued for certain purposes may not be tax exempt.
There are two basic types of municipal bonds: general obligation bonds and revenue bonds. With general obligation bonds, the principal and interest are secured by the full faith and credit of the issuer and usually supported by either the issuer’s unlimited or limited taxing power. Because of this, general obligation bonds typically have a lower
1 - 123

interest rate than revenue bonds. In many cases, general obligation bonds require voter assent. Revenue bonds, on the other hand, have the principal and interested secured by revenues derived from tolls, charges, or rents from the facility built with the proceeds of the bond issue. For example, water districts can issue revenue bonds secured by the revenues from ratepayers’ water bills. Revenue bonds typically do not require electorate assent.
In California, the Attorney General has opined that the borrowing of funds by a city, county, or school district to
implement an energy conservation project pursuant to the terms of Public Resources Code §25410-25421 does not require electoral assent under the provisions of Section 18 of article XVI of the California Constitution. See California Attorney General Opinion No. 84-306.
The County should investigate harnessing revenue bonds to help finance energy projects. In the context of renewable energy systems, revenue streams from the sale of electricity would be tied to the repayment of the bonds. In the context of energy efficiency, the bonds would be repaid via energy savings achieved through the project.
4.7. Crowdfunding
Over the past decade, crowdfunding and peer-to-peer (P2P) lending organizations have broadened the base from which capital for investments, loan repayment, and project funding can be sourced. These emerging financing mechanisms utilize the Internet to conduct their business in an easy, efficient, and low-cost manner with which larger financial institutions cannot compete.
Crowdfunded projects use large groups of people pledging money to their cause to reach a monetary goal, without the promise of repayment. Usually if the goal is reached, investors will receive products, free upgrades, or merchandise as thanks from the organization. P2P lending is geared towards individuals seeking financing for investments, loans, and new businesses, with the promise that the lenders will get their money paid back to them in a timely manner (Beesley 2012).
The two largest crowdfunding platforms, Kickstarter and Indiegogo have produced some staggering amounts of money in a very short period of time. One of the most successfully funded projects, “The Coolest Cooler” funded strictly through Kickstarter, raised $13,285,226, with an original goal of only $50,000. Indiegogo helped finance the Solar Roadways initiative, which had a goal of $1 million and ended up raising $2,200,591 in just three months from April to June 2014.
Even with all of the success of crowdfunding, P2P lending poses the larger threat to the banks, and could change the way Americans do small business. The two largest companies, Lending Club and Prosper, got their beginnings by offering individuals loans for small businesses or credit card/student loan repayment. They’ve been able to sustain and grow because they are able to finance loans that offer lenders a higher interest rate than putting their money into a bank, and also offer the borrower a lower rate by nearly 6 percent of what they are currently paying (Cohan 2014). Lending Club has financed over $4 billion in loans, more than all of its competitors, while Prosper has grown by 3,000 percent since its startup (Economist 2014). There seems to be exponential room for growth as these small banking companies continue to get recognized.
Companies like Lending Club and Prosper have opened the door for others with specific niches in the P2P environment. In 2009, a renewable P2P lending company named Mosaic was launched in Oakland, CA, and has since become the third largest renewable specific lender in the world, with an emphasis on solar funding. Since its public launch in 2013, Mosaic has helped finance $7 million for 20 projects with a combined capacity of 18 megawatts (Koch 2014).
1 - 124
Mosaic gets investments from people or companies who want to finance solar, and give that money to the borrowers who want to construct a project. The typical payback period to investors is 10 years with a 5 percent ROI. Abundance Generation (UK) and Windcentrale (NED) are similar companies operating outside of the US, financing wind and other renewable energy projects totaling €8 million and €14.3 million with ROIs of 7.25 and 7 percent respectively (Mishra 2014).
The County could explore a public-private partnership with Mosaic or a similar P2P lending entity to establish a renewable and energy efficiency specific P2P lending program. Such a program could harness distributed capital throughout the region while also allowing residents to have a sense of ownership in the region’s energy investments.
4.8. Qualitative Assessment
The portfolio of institutional arrangements and financial mechanisms has been individually examined through the lens of a comprehensive qualitative assessment. Specifically, the following five weighted metrics were considered:
Cost of borrowing
Budget personnel
Current legal authority
Magnitude of impact
Synergy (ability to leverage public/private partnerships)
Each institutional arrangement and/or financial mechanism was assigned a score for each metric, 1 through 10 (1 being weakest, and 10 being strongest) based on that particular instrument’s relative performance under that metric. For example, a score of “10” under the “cost of borrowing” metric would indicate a very low cost of borrowing whereas a score of “1” would indicate a very high cost of borrowing. Similarly, a score of “10” under the “budget personnel” metric would indicate a very low budget/personnel requirement whereas a score of “1” would indicate a very high budget/personnel requirement.
With respect to the “current legal authority” metric, a score of “10” would indicate that the requisite legal authority currently exists, whereas a score of “1” would indicate that new legislative action is required.
A score of “10” under the “magnitude of impact” metric would indicate a relatively large impact with respect to shifting the County’s energy portfolio from which its electricity is generated to a higher percentage of renewable resources, whereas a score of “1” would indicate the institutional arrangement and/or financial mechanism would have relatively little impact on shifting the County’s generation mix.
Finally, a score of “10” under the “synergy” metric would indicate that the institutional arrangement and/or financial mechanism has the ability to complement other institutional arrangements and/or financial mechanisms thereby amplifying the effect of each. For instance, a potential CCA program, depending on how it is structured, could also administer a PACE program along with other financial mechanisms. By serving as a hub for multiple mechanisms, a CCA program scores high on the “synergy” metric and could prove far more effective in advancing the deployment of energy efficiency and renewable energy than if each institutional arrangement and/or financial mechanism were pursued in isolation. Moreover, a potential CCA program might facilitate other energy-related public/private partnerships. Conversely, an institutional arrangement and/or financial mechanism that is limited in its ability to serve as a platform for multiple financial mechanisms/institutional arrangements and/or is unable to facilitate public/private partnerships would receive a low score under the “synergy” metric.
1 - 125

FIGURE 4-11. COMPARISON OF THE FINANCIAL MECHANISM OPPORTUNITY IMPACTS
Crowdsourcing: scored high marks for budget-personnel requirements and low marks for magnitude of impact, synergy, and current legal authority.
PACE Financing: scored high marks for current legal authority, existing political support, and budget-personnel requirements, and low marks for synergy.
Revenue Bonds: scored relatively high marks across the board, except low marks for the synergy component.
Sustainable Energy Utility (SEU): scored high marks in magnitude of impact, cost of borrowing, and synergy, but a very low mark in current legal authority to implement.
Direct Access: scored high marks in cost of borrowing, current legal authority, and existing political support, and very low marks in magnitude of impact and synergy.
Community Choice Aggregation (CCA): scored very high marks in cost of borrowing, magnitude of impact, and synergy, and relatively low marks in budget-personnel requirements.
5. Best Practices
5.1. An Introduction to Best Practices
The Comprehensive Renewable Energy Plan (CREP) could help build renewable energy markets while moving the County of San Diego beyond its historical roots in preservation and a piecemeal approach to renewable energy, to a more comprehensive focus on sustainability that can be driven by renewable energy. This is an important evolutionary step to take. Finding and implementing new energy programs, policies, and financial mechanisms
0 1 2 3 4 5 6 7 8 9
CCA
Direct Access
SEU
Revenue Bonds
PACE
Crowdsourcing
Comparison of the Financial Mechanism Opportunity Impacts
1 - 126
already tested and proven by other local governments will be critical to helping the County implement the ambitious scenarios laid out in this report, while also minimizing the risk associated with new actions.
This Best Practice chapter is designed to accompany, inform, and bolster the economic analysis that will be used to guide the County of San Diego in Phases I and II of the CREP. The information in this chapter comes principally from other local governments, and feeds new information into long-term economic projections and scenarios.
A Best Practices review generally involves looking at policies and programs, and financial mechanisms (both mandatory and voluntary) that have been effective in addressing similar issues in the past that could be applied to a current issue; and that have also been effective in stimulating a more vigorous level of economic opportunity. For the purpose of this report, a Best Practice is defined as a practice or policy that can be isolated, replicated, and implemented that achieves the goal of integrating more renewable energy into both County of San Diego operations and within the region. This includes unincorporated and incorporated regions of the County.
Despite the highly publicized cost declines within the solar and wind industries, these technologies continue to face formidable barriers to achieving scale within the County of San Diego. In addition to expiring Federal subsidies in 2016, uncertain permitting processes, the lack of trained employees, and restrictive traditional financing and underwriting criteria combine to constrain regional solar and wind growth. The Best Practices presented here help inform how these issues can be addressed by the County. In the public interest, the authors also kept in mind other larger goals of the CREP when selecting Best Practices, which included:
Protection of high quality habitat Creation of procedural improvements in County operations Helping the County meet the state goals such as the Renewable Portfolio Standard (RPS) of 33 percent by 2030 (and the Governor’s new possible target of 50 percent by 2030), and AB 32, the California Global Warming Solutions Act of 2006 Updating County policies and programs to match or exceed what other innovative jurisdictions are accomplishing in the renewables area Assisting the County with new Federal regulations and policy such as the U.S. Environmental Protection Agency (EPA) proposed regulations for cleaner power plants under Section III (D) of the Clean Air Act and others Enhancing the County’s ability to maintain a high-quality economic development momentum based on a larger economy-wide energy and economic productivity
A robust renewable energy market, enhanced by a complementary development of the energy efficiency potential in the region, can stimulate regional economic competiveness by inducing new private capital investments. It can help reduce energy imports and healthcare costs associated with other fuel sources, stabilize long-term energy prices, and act as a hedge against rising electricity rates. In addition, manufacturing firms are known to cluster in regions with abundant clean energy (Luecke, 2011).
As discussed elsewhere in this report, consumers and businesses within the County of San Diego will spend $9 billion to meet their total energy needs21 this year, and that number is certain to rise without significant changes in the way energy is produced and consumed in the region. The implementation of the Best Practices identified in the pages to follow can influence this $9 billion figure and, in some cases, radically alter the energy landscape within the County of San Diego.
21 Though over 60 percent of costs address transportation-related energy needs, this first report will not be addressing transportation and energy, with the exception of electric vehicles.
1 - 127
In addition to defining what a Best Practice is, it is also important to review a number of other issues before moving to the actual Best Practices, including:
Providing the important energy context within the County of San Diego that the Best Practices are expected to fit within; Describing where these Best Practices come from and how they were collected; Explaining the close relationship between sustainability, renewable energy, and energy efficiency, and why it is difficult (and inadvisable) to separate them within a Best Practice; Outlining what the County has already done in the energy and renewable energy areas; and Describing the four information categories used within each Best Practice template, and why this specific information is provided to the reader.
Again, the primary purpose of these Best Practices is to inform and educate County of San Diego officials about potential programs and policies that can later be adopted and implemented as part of the CREP.
The programs, policies, and financial mechanisms presented here are proven, innovative, and effective tools and strategies for supporting renewable energy and energy efficiency advancement at the local level. The Empower Devices team looked for Best Practices across the U.S. as well as in the County’s backyard. It is important to note that the County already has renewable energy practices worth highlighting, and potentially strengthening. For example, the County’s on-line solar permitting process is heralded across the State as an exemplary model, and the City of Chula Vista has been a long-time leader on climate and energy policies. Chula Vista’s 2009 “Solar Ready” Ordinance requires the installation of wiring conduit and plumbing for future installation of solar PV and solar hot water heating systems. The City of San Diego has a strong, action-oriented Climate Action Plan (CAP) underway with important consequences for solar and wind industries, and the general public. This type of local innovation should be remembered while looking at other domestic and international renewable energy Best Practices.
Best Practices can be divided any number of ways. An important distinction needs to be made early between internal government operations and practices, and external practices. Streamlined on-line solar permitting for homeowners is a good example of an external Best Practice, since it involves San Diego citizens outside of the government itself. A homeowner applies for a permit from outside government, and if done correctly, is issued one. A good example of an internal Best Practice is setting a goal to produce a set percentage of County government electricity (e.g. 20 percent by 2020) with solar energy use only in County buildings. Since the energy is produced for use within County government only, this is an internal Best Practice. The Best Practices presented in the following pages are both external and internal to the County. Combined together, these Best Practices give the County the opportunity to become a renewable energy hub in this 21st Century.
5.1.1. Site and Source Energy
Many of the Best Practices listed in this report involve renewable energy production and programs that reduce demand for energy on the customer’s side of the meter. It is important to point out that Best Practices can address energy generated at the site or energy used at the source. Site energy is the amount of energy produced or used at a site (e.g., a San Diego County building or a resident’s home), and source energy is the total amount of energy used to produce and transport energy to a site (e.g., the amount of energy produced from a power plant inside or outside of the County, and routed to a site within the County). Ultimately, the movement away from site energy to source energy (through renewables) will drive larger gains in economy-wide energy productivity.
It is important to point out the site versus source issue early to help bound the suite of alternatives available to the County in this report. Best Practices in the pages to follow may be as simple as installing new solar photovoltaic (PV) panels to a County building site to help increase the percentage of renewable energy used by the County, or as complex as a new “Community Solar” initiative created by the County that involves creating a “solar farm” on
1 - 128

County land that allows County residents to purchase the electricity generated from the solar farm. The County is interested in applying renewable energy technologies at both the site and source generally, therefore, the range of Best Practices considered is necessarily broad.
5.2. Best Practices Resources
Local governments have been implementing renewable energy (and energy efficiency) programs since the early 1970s, when oil overcharge funds were disbursed to the 50-plus State and territorial governments, who in turn doled out these dollars to local governments for these programs. Virtually all of this funding came through the U.S. Department of Energy’s Office of Energy Efficiency and Renewable Energy (known simply as EERE). In order to receive these oil overcharge funds, and later State Energy Conservation Program (SECP) funds from EERE, state governments were required to design and implement renewable energy programs. As a result, there is a large 40-year collection of diverse renewable energy programs spread across the country.22
Renewable energy Best Practices have grown in number and sophistication over the last four decades. Solar photovoltaic (PV) programs were often limited to small, individual applications in the 1970s and 1980s, whereas, recent programs often involve new financing vehicles such as power purchase agreements (PPAs) and innovative leasing arrangements, or the integration of multiple technologies within a microgrid.
The Best Practices presented here were collected through extensive research, document analysis, and expert interviews. Per guidance from County of San Diego staff, our team searched for Best Practices from Imperial, Los Angeles, San Francisco, Sonoma, Marin, and Santa Barbara Counties. However, our focus was clearly national, and not limited to California. The authors contacted the following organizations and solicited Best Practice expertise and advice from each:
The County of San Diego The National Association of Counties (NACO) The California State Association of Counties (CSAC) Public Technology Institute (PTI) The National League of Cities (NLC) The U.S. Department of Energy (Office of EERE, mentioned earlier) The National Association of Regional Councils (NARC) The Solar Foundation (TSF) The Database of State Incentives for Renewables and Efficiency (DSIRE, a 50 State Database) The California County Planning Directors Association (CCPDA) The Center for Biological Diversity (San Francisco)
5.2.1. Best Practices Organization
Many Best Practices documents are organized by sector, with programs and policies organized across the buildings, agricultural, transportation, and utility sectors, with some including an additional education and outreach section that often cuts across all sectors. Aside from electric vehicles, which are discussed in this section of the report, the transportation sector is largely reserved for later phases of the CREP.23
22 The State Energy Office (SEO) was/is usually the best place to find information about these programs, so the authors consulted SEOs as part of their quest for appropriate renewable energy Best Practices. 23 County of San Diego officials specifically requested that the transportation sector be avoided aside from a discussion of electric vehicles (EVs) in Phase I of the CREP, therefore this sector is intentionally not covered in this report.
1 - 129

For each Best Practice presented in this report, four categories of information are provided to help inform options for the next Phase (Phase II) of the CREP. These four categories include an Overview, Description of Benefits and Costs, Who Else is Doing It, and Where to Go For More Information. These four categories were selected from a much larger list of criteria, and were judged by our team to be the most appropriate given the more general purpose of this report for the Phase I CREP process.
5.2.2. Best Practices Topics
The following Best Practices were chosen for the County to consider as it moves into Phase II of developing the CREP.
5.3. Amend the General Plan by Adding an Energy Element
5.4. Establish a New Office of Sustainability/Office of Energy Resources
5.5. Establish an Institutional and Financing Capability
5.6. Establish a Sustainable Energy Workforce Development Initiative
5.7. Build an Energy Resilience Plan (ERP)
5.8. Increase the County’s Percentage of Energy Derived from Various Renewable Energy
Technologies
5.9. Establish a Renewable Energy Group Procurement Initiative
5.10. Participate in the Creation of a New Regional Energy Network (REN)
5.11. Create a Renewable Energy Overlay / Combining Zone
5.12. Establish Building Energy Disclosure policies
5.13. Promote More Aggressive Building Standards Including the Significant Retrofit of Existing
Buildings
5.14. Increase Renewable Energy Education and Outreach
5.15. Start a Community Solar Initiative
5.16. Establish a Microgrid and Develop Policies Related to Microgrids
5.17. Establish Electric Vehicle Programs
Transportation is very important, and responsible for more than 75 percent of the energy used in the County. Renewable energy applications within the transportation sector may be covered in later CREP Phases.
1 - 130

5.3. Amend the General Plan by Adding an Energy Element
5.3.1. Overview
5.3.1.1. Definition
The General Plan expresses the County’s development goals and embodies public policy relative to the distribution of future land uses, both public and private. The General Plan bridges the gap between community values, visions and objectives, and physical decisions such as large and distributed energy projects, subdivisions and public works initiatives. The County of San Diego’s General Plan was last updated in 2011.24 California cities and counties are required by the state to update their general plans every eight
24 There have been at least seven major amendments to the Plan since 2011.
CREP-Related Options for the County of San Diego
Introduce a new Energy Element to the General Plan
Approach the California Energy Commission (CEC) about funding CREP-related policy work in 2015, while working with the five counties that received 2013 funding from the CEC for renewable energy policy improvements, and evaluate their applicability in the County of San Diego
Note: Without the specificity mentioned above, the Energy Element is vague and relativelymeaningless. We advocate leaving that language (in the first bullet) alone.
The County of San Diego’s General Plan expresses the County’s development goals and embodies public policy relative to the distribution of future land uses, both public and private. California cities and counties are required by the state to update their general plans to conform to changes in state law and other legal requirements, and to reflect changes in land development patterns since the last general plan was adopted (Grattidge and Lawler 2003). Under state law, every local general plan must include seven elements, or sections: land use, circulation, housing, conservation, open-space, noise, and safety. The Governor’s Office of Planning and Research’s State of California General Plan Guidelines recommends inclusion of energy considerations in general plans in two of the seven elements required by state law: housing and conservation. Jurisdictions may also voluntarily adopt additional elements, such as energy, growth management, public health, and water resources among others to reflect policy priorities unique to them.
Done correctly, a new Energy Element can consolidate major energy production and consumption policies, supplement priorities in mandated chapters of the General Plan, and reflect a commitment to create and maintain social and economic well-being, managed economic growth, and responsible resource conservation.
Last updated in 2011, the County’s General Plan does not include an Energy Element.
1 - 131

to ten years (Housing Element updates must occur every five years) to conform to changes in state law and other legal requirements, and to reflect changes in land development patterns since the last general plan was adopted (Governor’s Office of Planning and Research, 2003).25 The state does not mandate a specific timetable for general plan updates, and many jurisdictions initiate the update process every decade or two depending upon economic and social developments.
Under state law, every local general plan must include seven elements, or sections: land use, circulation, housing, conservation, open space, noise, and safety. The Governor’s Office of Planning and Research’s State of California General Plan Guidelines recommends inclusion of energy considerations in general plans in two of the seven elements required by state law: housing and conservation.26 Since Elements such as an Energy Element are optional and are included in the General Plan at the discretion of the County, they can reinforce the County’s values and priorities.
Dozens of California local governments have added a separate Energy Element to their general plans in recent years, demonstrating their commitment to clean energy job creation and economic development, emission reductions, climate goals, and indigenous local energy supplies (i.e,. sunshine in Southern California). The County of San Diego does not have an Energy Element in its General Plan at this time.
5.3.1.2. Value Proposition & Benefits
The State of California considers local government general plans to be, “…a constitution for development, the foundation upon which all planning decisions in a city or county are to be based. It expresses community vision and values, and it embodies public policy relative to the distribution of future land use, both public and private” (Governor’s Office of Planning and Research, 2003). Given the very significant role that energy already plays within the County of San Diego, adopting an Energy Element to the General Plan that focuses on the short- and long-term opportunities for renewable energy technologies for County facilities and future community development is recommended. A new Energy Element in the San Diego General Plan sends a strong message to the public and industry that energy, and more specifically renewable energy, are new, important priorities for the County, and as a result, the County is organizing its business around these new issues.
Done correctly, a new Energy Element can consolidate major energy production and consumption policies, supplement priorities in mandated chapters of the General Plan, and reflect a commitment to create and maintain social and economic well-being, managed economic growth, and responsible resource conservation.
Adding a new Energy Element is much less time-consuming than weaving sustainability through an entire general plan, as Marin County did.27
25 General Plan Guidelines, 2003, Governor’s Office of Planning and Research. See page 33. The Office of Planning and Research (OPR) will send a letter of notification to cities and counties if their general plans have not been updated within eight years. If ten years pass since a general plan was updated, OPR must also notify the State Attorney General. 26 Since the last General Plan was passed in 2011, the cost of solar dropped drastically and land-use disputes in Eastern San Diego County have increased in number. Land-intensive commercial solar project developers have been pitted against proponents of small-scale solar photovoltaics (PV) atop existing rooftops in favor of leaving San Diego County’s land and associated habitat free of more construction. 27 Marin County planners in 2007 made sustainability a central environmental ethic across nearly every goal, objective and policy in their General Plan. Marin County’s General Plan emphasized “sustainable communities” and reflected strong concern about global climate change. The American Planning Association later gave Marin County a national award for excellence in planning implementation around this sustainability thread (T. Snellings, 2014; Marin County, 2007).
1 - 132
5.3.1.3. Function of an Energy Element
Typical goals, objectives and policies in the Energy Elements cited above include, but are not limited to, general public education on energy production and consumption, energy efficiency in municipal buildings, regional planning, workforce training, and promotion of specific renewable energy technologies.
An Energy Element effectively “paves the way’” for the rest of the renewable energy tools laid out in this report, such as streamlined permitting, renewable energy overlay zones, more flexible administrative requirements, and other energy policies (Snelling 2014). While the Energy Element does not specify what the County must do, it will at a minimum encourage their use with stated policies and objectives.
5.3.1.4. Structure and Budget (Costs)
Costs for adopting an Energy Element to the General Plan will vary depending on staff time committed to developing a proposal, expected time for public review and comment, and other actions stipulated for amendments to the General Plan. The California Energy Commission (CEC) awarded $3.3 million in renewable energy planning grants to five counties in 2013, suggesting that a comprehensive approach to this issue in San Diego County might require more funding. Importantly, these CEC grants involved much more than developing an Energy Element in each jurisdiction (CEC 2013).
5.3.2. Application to San Diego County (Recommendations)
5.3.2.1. Existing Context
There is a precedent for an Energy Element within the County of San Diego. The County of San Diego 1990 General Plan included an Energy Element. However, for unknown reasons the Energy Element was excluded from the comprehensive General Plan update of 2011.
In June 2013, the California Energy Commission (CEC) awarded “renewable energy planning” grants to five counties in recognition for their Energy Elements or their energy-related ordinance and policy development. Imperial, Inyo, and San Bernardino each received $700,000 for their Energy Element work, and San Luis Obispo and Los Angeles Counties each received roughly $600,000 for energy-related ordinance and policy development. These jurisdictions offer a wealth of information, since the awards were specifically tied to improving renewable energy development processes as part of their comprehensive General Plans. For example:
Imperial County is updating and amending the geothermal/alternative energy element of the county's general plan.
Inyo County is updating the county's renewable energy general plan amendment and preparing an environmental impact report (EIR).
San Bernardino County is creating a renewable energy and conservation element in the new general plan, while also making strategic changes to the county's regulatory system.
San Luis Obispo County is revising its policies and ordinances by creating a renewable energy streamlining program, where allowable land uses in areas identified as renewable energy combining zones will be eligible for renewable energy development over other land uses.
Los Angeles County is creating a renewable energy ordinance and a programmatic Environmental Impact Report (EIR) that will help mitigate development issues such as cumulative impacts. Having the ordinance and the EIR will help shorten the environmental review in Los Angeles County
1 - 133

because developers can use information from the EIR when seeking permits for individual projects (Douglas, 2013).
5.3.2.2. Next Steps
Local governments who have created Energy Elements maintain that early goal setting was one of the first key steps when adding an Energy Element to a general plan. The County can begin this by revisiting some of the goals in its original Energy Element:
Goal 1: Define and assure adequate energy supplies for San Diego County
Goal 2: Encourage the utilization of alternative passive and renewable energy resources
Goal 3: Maximize energy conservation and efficiency of utilization
Goal 4: Minimize environmental impact of energy sources
Goal 5: Minimize economic or social impacts of energy supply and demand
Goal 6: Minimize possibility of energy shortages and resulting hardships
Goal 7: Seek equitable sharing of both the benefits of energy consumption and the hardships of energy shortage
Goal 8: Encourage compatibility with national and state energy goals and city and community general plans/regional comprehensive plans
While all of these goals are worthy of revisiting in a new Energy Element, clearly, language related to renewable energy is missing. This can be remedied in part by adding the following goal:
Goal 9: Maximize the integration of renewable energy applications
The County of San Diego can incorporate an Energy Element based solely on renewable energy if it desires, while integrating existing energy efficiency programs, plans, and other important energy-related factors.
5.3.3. Who Else is Doing It?
Many California counties and cities have already adopted a separate, optional energy element.28 Scott Morgan with the California Office of Planning and Research noted that at least 25 jurisdictions have added an Energy Element into their general plan over the past 20 years, including Kern, Marin, Sacramento, and Santa Barbara Counties. Imperial County adopted a unique Geothermal/Alternative Energy and Transmission Element in 2006 (2014). These jurisdictions are listed below in TABLE 5-1 by chronological order.
28 Please note that these are only the jurisdictions that responded to the Governor’s Office of Planning and Research 2013 survey and specifically have an Energy Element. Many other jurisdictions have included energy in one of their required seven elements and are not included in this list. For example, Butte County includes energy issues in the Open Space and Conservation Element (Morgan, 2014).
1 - 134

TABLE 5-1. California Counties and Cities with Energy Elements
1980s 1990s 2000s 2010s
Santa Ana (1982) Lassen County (1993) Costa Mesa (2002) Dixon (2010)
Sacramento County (1993) Kern County (2004) Ontario (2010)
Siskiyou County (1993) Shasta County (2004) Rosemead (2010)
Santa Barbara County (1994) Banning (2006) San Luis Obispo (2010)
Ukiah (1995) Marin County (2007) Taft (2010)
Yucca Valley (1995) Riverside (2007) Yuba County (2011)
Sierra County (1996) Cathedral City (2009) Simi Valley (2012)
Sutter County (1996) Emeryville (2009) Tulare County (2012)
San Mateo County (2013)
It is helpful to review the reasons other jurisdictions incorporated an energy element. Please see TABLE 5-2 below for a summary of selected jurisdictions and the primary reasons they added an energy element.
Table 5-2. Reasons for Adding Energy Elements by CA Jurisdiction
Jurisdiction Primary Reasons for Adding an Energy Element
Sacramento County Energy Element was originally adopted in 1979 as part of a national response to the energy crisis
Kern County To manage and protect energy resources; environmental, public health, and safety standards; and promote energy development
Marin County Concern over impending climate change impacts. Incorporates GHG reduction plan. “Sustainability” a guiding principle for the entire General Plan
Santa Barbara 1981 General Plan amendments focused on energy conservation and incentives. Subsequent amendments address green building and incentives to exceed Title 24. Also encourages County to use and promote renewable energy where feasible, appropriate, and cost-effective
Imperial County Economic development by increasing transmission capacity and developing renewable energy resources
San Mateo County Long-term implementation of County’s Energy Efficiency Climate Action Plan
1 - 135

5.4. Establish A New Office of Sustainability / Office of Energy Resources
5.4.I. Overview
5.4.1.1 Definition
A local Office of Sustainability is a centralized authority responsible for developing and implementing sustainability programs and policies that advance energy, economic, and environmental priorities. An informal survey of 40 large counties in the U.S reveals that 16 counties (40 percent) have a formal Office of Sustainability and 12 counties (30 percent) have either a centralized authority or one person in charge of sustainability programs, including renewable energy and energy efficiency programs as opposed to sharing this responsibility among several full-time employees (FTEs).
5.4.1.2 Value Proposition & Benefits
Definition
A local Office of Sustainability is a centralized authority responsible for developing and implementing sustainability programs and policies that advance energy, economic, and environmental priorities. By consolidating efforts, a formal Office of Sustainability enables counties to more effectively and efficiently promote sustainability, government-wide. Additionally, the presence of an Office of Sustainability is now a prerequisite for many federal, state, and private funders, since many want to see full government participation in their (funded) initiatives (Colorado Energy Group, 2014).
CREP-Related Options for the County
Consolidate energy related programs within an Office of Sustainability. Three potential options to consider for the location of the new office are as follow:
o The Department of General Services, which is already responsible for facility maintenance, energy efficiency, and renewable energy projects for county buildings; and the (internally-focused) Strategic Energy Plan (SEP).
o The County’s Office of Planning and Development Services could also be home to the new office since so many building and code-related initiatives fall under their oversight.
o Create an Office within the County Executive’s Office, which would be independent of other departments, and also respond directly to elected officials. In several large cities, the Mayor or City Council have taken the lead in establishing an Office of Sustainability to demonstrate their respective approaches to achieving energy, economic, environmental, and sustainability success.
Consider an Office of Sustainability as a potential implementer of the CREP and Climate Action Plan (CAP)
Consider extending and transitioning the CREP Technical Advisory Committee (TAC) as a formal advisory body to a new Office.
1 - 136
By consolidating efforts, a formal Office of Sustainability enables counties to more effectively and efficiently promote sustainability government-wide. Additionally, the presence of an Office of Sustainability is now a prerequisite for many federal, state, and private funders, since many want to see full government participation in their (funded) initiatives (CEG 2014).
The benefits of having an Office of Sustainability can include:
A more visible public commitment to sustainability issues;
Demonstration of commitment to a thought out and comprehensive approach to responsible economic development.
A formal link between the county and the general public on the core values associated with sustainability programs, namely saving water and energy, recycling, and using more renewables (this link can be relied upon and used in the future to achieve county energy, water, recycling, and other goals);
More attention paid to energy-and water-saving and other sustainability programs inside of county government;
Economies of scale that follow with centralized data collection;
Consolidation and cost savings that accrue from centralizing energy education and outreach activities;
Potential cost savings from consolidation of existing sustainability programs;
Easier integration of existing sustainability programs into a common theme or primary message; and
Increased attention from funding entities nationally (whether governmental, foundations or large donors) that recognize the potential impacts and benefits associated with a centralized office
5.4.1.3. Functions of a Sustainability Office
Almost all large municipal Offices of Sustainability measure and report on the progress of their municipal government across a number of sustainability indicators, such as energy use, water use, greenhouse gas emissions, and vehicle miles traveled (VMT).
Most local government sustainability offices focus on a handful of key issues, including:
Providing the leadership to assure that programs are put in place to coordinate and achieve established energy-related goals such as those in a Climate Action Plan, Operations Plan, and/or regional initiatives.
Acquiring and implementing energy efficiency and renewable energy grants and programs for counties across the building, agricultural, transportation, utilities, and industrial sectors;
Representing the county on multiple local, regional, and statewide energy and environmental task forces, committees, energy-related collaboratives, and related groups (including lobbying the General Assembly and Public Utilities Commission);
Integrating the sustainability ethic and associated behaviors across departments, and sometimes across the seven (or more, including Optional) elements of the General Plan.
1 - 137

Providing leadership on green procurement policies, including paper use reduction and green fleet purchases;
Leading the implementation of clean energy-related education and outreach (E&O) programs to the public;
Managing in-house and external recycling, green building, and water reduction programs; and
Working with community groups, non-government organizations, and the local business community to develop successful renewable and energy efficiency programs.
The County has organized seven departments into a Land Use and Environment Group (LUEG) including the Air Pollution Control District, Environmental Health, and Planning and Development Services. An Office of Sustainability can identify a broad range of County programs and connect or align them to improve the effectiveness of meeting sustainability objectives. Creating an Office of Sustainability involves little to no programmatic changes within the County’s organizational structure.
An Office of Sustainability could be the County’s eyes and ears for sustainability issues and opportunities, such as by adding programs encouraging the production and consumption of local food sources to their agenda.29 Furthermore, it could instill a stronger ethic of sustainability among employees and express to the community that the County is committed to sustainability.
5.4.1.4. Budget & Structure (Costs)
Office of Sustainability budgets vary from jurisdiction to jurisdiction. Some have little to no budget and limited staff, as they focus largely on information gathering and sharing. Larger budgets reflect a mixture of allocations from the General Fund, local fees for services, grant funds, and/or (leftover) American Recovery and Reinvestment Act (ARRA) funds. According to the International Council of Local Environmental Initiatives (ICLEI), the average salary, including benefits, for mid-level county Sustainability Office staff range between $60,000 and $75,000 (2011).30
ICLEI surveyed 38 municipal Offices of Sustainability, and reported their various funding sources (2011):
55 percent were funded at least partially through their general funds;
37 percent were funded through special fees or rebates, such as solid waste fees;
29 percent used federal Energy Efficiency and Conservation Block Grant (EECBG) or other federal stimulus funding;
24 percent were funded through foundation grants and partnerships; and
16 percent were funded with the cost savings they helped achieve.
Budgets depend on:
29 The City of Atlanta, Georgia’s, Sustainability Office is responsible for bringing local food within 10 minutes of 75 percent of all residents by 2020 (Quarles, D., A. Bastian and R. Norton). (2014) "About the Office of Sustainability." from http://www.atlantaga.gov/index.aspx?page=153.
1 - 138
The number and type of programs (i.e., basic public education through traditional media and the county website, through more sophisticated energy management programs managed jointly with utilities and others);
New staff required or existing staff who have had their job descriptions modified to include new responsibilities; and
Whether the positions are funded directly by the county General Fund, and/or new or existing fee-for-service assessments, or via grants or other entities such as utilities or foundations.
5.4.2. Application to San Diego County (Recommendations)
5.4.2.1 Existing Context
Existing sustainability initiatives across the county include the Local Government Partnership Program between the County and SDG&E. With support from SDG&E, the County of San Diego has been able to train staff and run partnership programs together.31 The County has no Full Time Equivalents (FTEs) dedicated to renewables, energy efficiency programs, or sustainability. Currently, a few County staff members share management of these three program areas, with some consultant assistance. There is an Energy and Sustainability Manager position (not full-time) located in the General Services Department that is focused only on energy efficiency and conservation,.
Innovative renewable energy, energy efficiency, and climate programs are already underway within the County in cities such as Chula Vista, San Diego, and Carlsbad (many in place for more than a decade). These cities could offer a wealth of knowledge and support to the County. The City of Chula Vista, for example, has a Climate Change Working Group that develops recommendations to the City on actions to address climate change.
5.4.2.2. Possible Next Steps for the County
A sustainability office could institutionalize sustainability issues and potentially be responsible for implementing the CREP as well as the County’s Climate Action Plan (CAP). The CREP Technical Advisory Committee (TAC) could continue to exist as a formal advisory body to a new Office.
The County of San Diego could house an Office of Sustainability in several places.
The Department of General Services could be a potential home, since transportation is so fundamental to the County and to meeting greenhouse gas (GHG) reductions. Further, this department is already responsible for facility maintenance, energy efficiency, and renewable energy projects for county buildings; and the (internally-focused) Strategic Energy Plan (SEP).
The County’s Office of Planning and Development Services could also be home to the new office since so many building and code-related initiatives fall under its oversight.
Some jurisdictions have created an Office independent of other departments that respond directly to elected officials by being located within the County Executive’s Office. In several large cities,
31 Some examples of programming include the Smart Building Pilot Project at the South Bay Regional Center, the Energy Upgrade California Multi-family Building Program, and the further development of Zero Net Energy (ZNE) buildings in the County (County of San Diego, 2015). Additional work on buildings that exceed the minimum code is referred to as a “reach code” or “stretch code.”
1 - 139

the Mayor or City Council have taken the lead in establishing an Office of Sustainability to demonstrate their respective approaches to achieving energy, economic, environmental, and sustainability success.
The following table illustrates what a new fully staffed Office of Sustainability might require, based on information from other offices and using the existing County of San Diego pay scale (County of San Diego, 2012).32 (Note that the illustrative table has not been reviewed by County or Union staff yet.)
TABLE 5-3. Sample Office of Sustainability Staff
Potential Job Title Potential Annual Salary33
Chief Sustainability Officer $105,000
Manager, Climate and Sustainability Programs $100,000
Manager, Communications (Education and Outreach) $88,000
Program Coordinator $72,000
Program Manager $65,000
Program Manager $65,000
Administrative Assistant $50,000
Program Coordinator $50,000
TOTAL WAGES $595,000
32 Based on data provided by 2012 County data reported to State Controller (www.publicpay.ca.gov) for Department of Planning & Development Services. Yee, B. T. (2012). "Welcome to the Government Compensation in California (GCC) Website." from http://publicpay.ca.gov/. 33 Based on "Regular Pay" of similar position at PDS, but not exceeding their 2012 "current pay."
1 - 140

5.4.3. Who Else Is Doing It
The table below provides information on comparably sized counties (in terms of populations) by 2010 Census data, the name of the office, the programs it manages, and available budget.
1 - 141

TABLE 5-4. Comparable Offices of Sustainability
County, State (US Census 2010)
(1) Office Name (2) Organizational Location
Programs and Initiatives (1) Budget (2) FTEs
Los Angeles County, CA (9,818,605)
County Office of Sustainability Internal Services Department
Energy Upgrade California Environmental Service Centers Green Building SolarMap.LACounty.gov GreenLACounty.gov The Energy Network Southern California Regional Energy Center
$414,000 3.0 FTE (10.0 ARRA funded)
City of Los Angeles, CA (3,884,000)
Office of Sustainability Mayor’s Office of Budget & Innovation
City Sustainability Initiative Sustainability Plan by each Department GreenLA/SustainLA Green Building EV infrastructure Waste diversion
N/A 6.0 FTE
Miami-Dade County, FL (2,496,535)
Office of Sustainability Regulatory and Economic Resources
Greenprint Sustainability Plan Annual Progress Report, Sustainability Scorecard, Implementation Table Community Resources Website
$606,100 5.0 FTE
Clark County, NV (1,951,269)
Office of Sustainability Comprehensive Planning Department
County Eco-Initiative Serve as liaison with public and private entities Cultivate Funding Resources Create Strategic Marketing Plan Create website of Sustainability Efforts Promote Ongoing Conservation Efforts
N/A .75 FTE
Santa Clara County, CA (1,781,642)
Office of Sustainability County Executive Office
Energy Upgrade California Silicon Valley 2.0 Climate Action Plan for Operations and Facilities (2009) County Sustainability Policy (2010) Green Building Green Business
N/A 1.0 FTE
1 - 142

County, State (US Census 2010)
(1) Office Name (2) Organizational Location
Programs and Initiatives (1) Budget (2) FTEs
Broward County, FL (1,748,066)
Office of Energy and Sustainability Environmental Planning and Community Resilience
Climate Change Task Force County Seal of Sustainability County Sustainability Stewards STAR Sustainable Community Urban Land Enhancement Program GoSOLAR
N/A ~3.75 FTE
Philadelphia County, PA (1,526,006)
Office of Sustainability Mayor’s Office
Solar Energy in the City Local Food Tree Planting Energy Benchmarking EnergyWorks
N/A 4.0 FTE
Alameda County, CA (1,510,271)
Alameda County Sustainability General Services Agency
Regional Renewable Energy Procurement (R-REPP) Climate Action Plan Environmentally Preferable Purchasing Fleet Management and EVs Solar Energy Community Energy Program Business Energy Program Regional Purchasing Stopwaste.org
~$500,000 5.0 FTE
Sacramento County, CA (1,418,788)
No formal office/department Currently in Water Resources
Climate Action Plan for County Government Operations Sacramento Area Sustainable Business ProgramPublic EV Charging StationsGreen Sacramento County
N/A1.0 FTE
Hennepin County, MN (1,152,425)
(No formal office/department) Minneapolis (Hennepin Co.) & St. Paul (Ramsey Co.)
Environmental Coordinating Team (since 1994) Energy Innovation Corridors Annual Greenprint Progress Reports Sustainable St. Paul Electric Vehicle Deployment and Charging Stations Brownfield site development Light rail transit
N/A 1.0 (State of MN) 5.0 (St. Paul)
1 - 143

County, State (US Census 2010)
(1) Office Name (2) Organizational Location
Programs and Initiatives (1) Budget (2) FTEs
Contra Costa County, CA (1,049,025)
No formal office/department) Office of Conservation and Development
Environmental Action Programs for Schools East Coast Habitat Conservancy Home Energy Improvement incentives/rebates East Bay Energy Watch Weatherization Resources on green building
N/A 1.0 FTE
Travis County, TX (1,024,266)
City of Austin Office of Sustainability Sustainability Department
Climate Program Green purchasing, energy, water, environmental metrics reporting Rethink/ Mobile App Austin Green Business Leaders Positive Impact on Climate and Community (PICC) Sustainability Action Agenda EcoDistrict Initiative
N/A 6.0 FTE
Salt Lake County, UT (1,029,655)
(No formal office/department)
Salt Lake County Green County Sustainability Cabinet Sustainable Building and Business Program Energy Efficiency and Renewable Energy Open Space and Urban Farming Air Quality Water Quality Recycling
N/A3.0
Pima County, AZ (980,263)
Office of Sustainability and Conservation Public Works
Sustainable Action Plan for County Operations (2014) NZE Buildings Program LEED County Buildings Green Purchasing Land Conservation and Management Water Conservation and Management Renewable Energy and Energy Efficiency Health and Wellness
N/A N/A
1 - 144
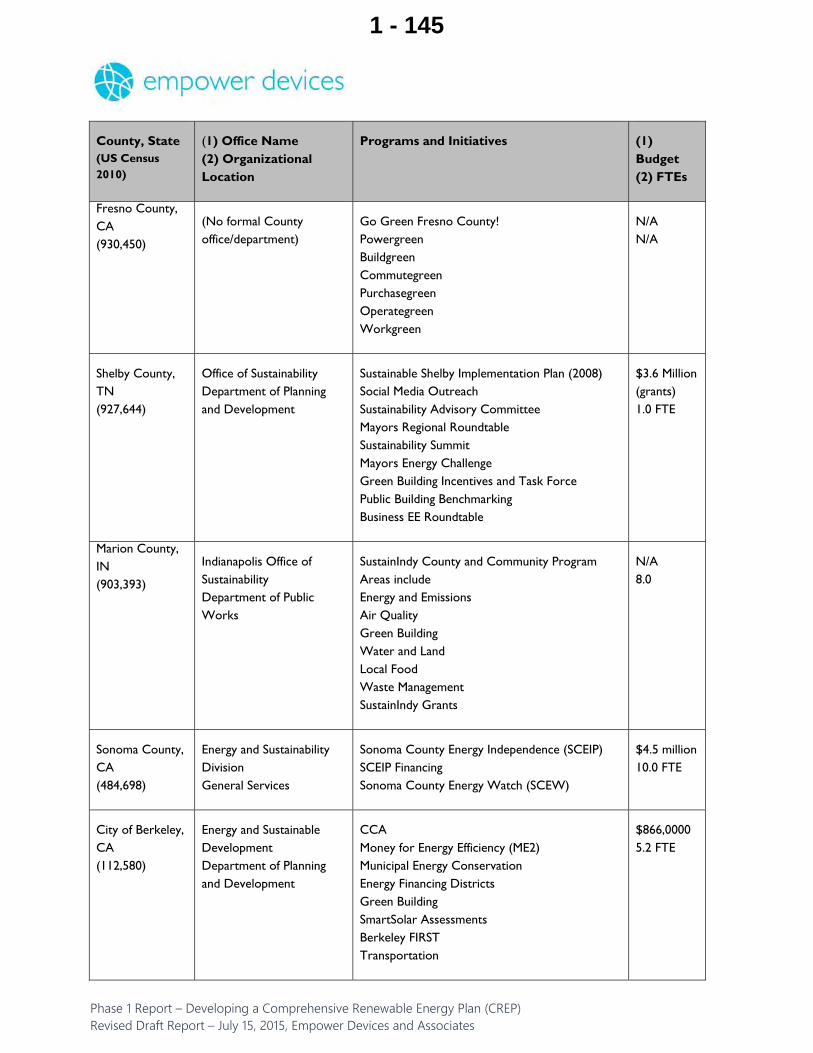
County, State (US Census 2010)
(1) Office Name (2) Organizational Location
Programs and Initiatives (1) Budget (2) FTEs
Fresno County, CA (930,450)
(No formal County office/department)
Go Green Fresno County! Powergreen Buildgreen Commutegreen Purchasegreen Operategreen Workgreen
N/A N/A
Shelby County, TN (927,644)
Office of Sustainability Department of Planning and Development
Sustainable Shelby Implementation Plan (2008) Social Media Outreach Sustainability Advisory Committee Mayors Regional Roundtable Sustainability Summit Mayors Energy Challenge Green Building Incentives and Task Force Public Building Benchmarking Business EE Roundtable
$3.6 Million (grants) 1.0 FTE
Marion County, IN (903,393)
Indianapolis Office of Sustainability Department of Public Works
SustainIndy County and Community Program Areas include Energy and Emissions Air Quality Green Building Water and Land Local Food Waste Management SustainIndy Grants
N/A 8.0
Sonoma County, CA (484,698)
Energy and Sustainability Division General Services
Sonoma County Energy Independence (SCEIP) SCEIP Financing Sonoma County Energy Watch (SCEW)
$4.5 million 10.0 FTE
City of Berkeley, CA (112,580)
Energy and Sustainable Development Department of Planning and Development
CCA Money for Energy Efficiency (ME2) Municipal Energy Conservation Energy Financing Districts Green Building SmartSolar Assessments Berkeley FIRST Transportation
$866,0000 5.2 FTE
1 - 145

5.5. Establish an Institutional and Financial Capacity
5.6. A Solar Energy Workforce Development Initiative
5.6.1. Overview
If the San Diego region is to become a hub for renewable energy production and associated job growth, the region will benefit from a clean energy workforce initiative. If prioritized, the County can increase the mere dozens of employees trained in the solar industry annually in the County to hundreds.
As the U.S. moves away from traditional fossil fuels to more solar- and wind-generated electricity, there is a concern that there will not be enough qualified solar and wind workers to meet the future demand. According to the National Association of Counties, the “skills gap” is one of the major concerns of counties in a recent national survey (NACO 2014). In contrast to an aging electric utility workforce nationwide, the San Diego region is known
CREP-related Options for the County of San Diego
Authorize the development of a CCA technical feasibility study
Support enhanced customer choice through an expanded Direct Access program
Explore the formation of a Sustainable Energy Utility “light” model similar to Sonoma County
Support the continued expansion of Property Assessed Clean Energy (PACE) financing programs and help educate the public about the potential advantages of PACE
Harness capital through federal bond programs and municipal bond issuance
Explore a public-private partnership with a peer-to-peer lending entity to establish a renewable and energy efficiency specific lending program
Refer to Section 4 for further information on CCA, Direct Access, and PACE financing.
Definition
If the County of San Diego is interested in transforming the region to a renewable energy jobs center, major changes will be needed that include new clean energy-sector strategies. A growing number of counties, including Los Angeles County, are pursuing sector-specific initiatives that integrate workforce and economic development strategies. Importantly, this is consistent with the reauthorization of the federal Workforce Investment Act (WIA), via the Workforce Innovation and Opportunity Act (WIOA) of 2014.
WIOA funds directed to the County of San Diego can be more valuable (and spent with full federal and state support) if the County directs them toward renewable energy jobs (and not just energy efficiency jobs) as part of new clean energy sector approach. The County can work with local partners on a major, sector-driven approach to workforce development that focuses on the needs of regional employers within the renewable energy industry. If prioritized, the County can increase the mere dozens of employees trained in solar annually in the County to hundreds.
1 - 146
for having a relatively young electric utility workforce (Laitner 2014). While this bodes well for the near future, the County must consider an active pipeline of renewable energy workers for the next 35 years in order to meet the planning horizon of 2050.
Without action, there will be 340,000 fewer new jobs in the County over the next 35 years (See economic analysis in Chapter 3). This same economic analysis shows that by adopting many of the Best Practices outlined in this report, committing to renewable energy across the region, and by choosing one of four scenarios, the County can help bring between 600 and 1,300 new jobs per year (on average) to the region between 2015 and 2050. Better trained workers through a new workforce initiative can help the County keep jobs, help the industry avoid this significant cost, and help the County meet the Governor’s call for 50 percent renewables by 2030.
5.6.1.1. Definition
Clean energy workforce development programs in the region are dominated by energy efficiency-related jobs (Clark 2014). Hundreds of job seekers are currently trained in the energy efficiency field, while a handful to dozens of the same are being trained for the solar field. While this is normal and based largely on supply and demand, if the County of San Diego is interested in transforming the region to a renewable energy jobs center, major changes will be needed that include new clean energy-sector strategies.
A growing number of counties, including Los Angeles County, are pursuing sector-specific initiatives that integrate workforce and economic development strategies. Importantly, this is consistent with the reauthorization of the federal Workforce Investment Act (WIA), via the Workforce Innovation and Opportunity Act (WIOA) of 2014. WIOA funds directed to the County of San Diego can be more valuable (and spent with full federal and state support) if the County directs them toward renewable energy jobs (and not just energy efficiency jobs) as part of a new clean energy sector approach. The County can work with local partners on a major, sector-driven approach to workforce development that focuses on the needs of regional employers within the renewable energy industry.
5.6.1.2. Structure and Budget (Costs)
With so much utility scale and residential solar PV expected in the region, it is worth noting what happens if the County does not spend time and effort on providing adequate solar training through a new workforce initiative. A March 2014 study on domestic residential rooftop solar installations estimated the cost of removal, repair, and reinstallation of poorly installed solar equipment at $2,500 to $9,500 each (Solar, Solar et al. 2014). If only 1 percent of the expected 500,000 residential installations in the U.S. over the next two years require such reinstallation, this translates to a potential $47 million financial burden on the solar industry. This financial impact can impact County of San Diego solar companies, solar job growth, and the associated emission reductions expected by the County (through the solar PV installations).
The costs of preparing a major renewable energy workforce initiative in the near-term are mostly related to the significant staff time required to generate support from existing and new foundational partners for the initiative. Once this network is in place, training program dollars become bigger budget items. Building support at the local, regional, state, and federal levels for redirecting money to the San Diego region for such an initiative can require months, and should not be undertaken without careful organizing.
Budgets for leading renewable energy workforce training programs range from $500,000 to $8.5 million.34 The organizations that implemented these programs include the following: National Association of Regional
34 The $8.5 million budget was for a three-year ARRA program that resulted in 500 newly trained solar (and energy efficiency) workers. The County should not expect the same magnitude of federal funding for stimulus purposes.
1 - 147

Councils (NARC) in Washington, D.C., the Center for Sustainable Energy (CSE), the California Workforce Association (CWA), the San Diego Workforce Partnership, SDG&E, and the California Workforce Investment Board (CWIB).35 Many of these organizations have extensive experience implementing renewable energy training programs since 2009, when literally billions of federal stimulus dollars were directed to state and local governments.
Implementation time for the programs run by the aforementioned organizations ranged from one year to three years, with average start-up times requiring three to six months. Budgets for these programs were generally divided among three categories with the following percentages:
Staff and overhead expense: 30 percent
Program dollar expenses: 50 percent
Equipment and miscellaneous expenses: 20 percent
Therefore, with a hypothetical, new $5 million solar workforce development program, the County can expect to spend $1.5 million on staff and overhead, $2.5 million on program dollars, and $1 million on training equipment and miscellaneous expenses. As a result, one workforce development expert predicts that more than 300 solar workers could be trained over a one-year period. (reference: Discussion with Fred Abousleman, former Executive Director of the National Association of Regional Councils (NARC), based on his experience with the 2009-2012 Pathways Out of Poverty Program, November 2014.)
5.6.2. Application to San Diego County
5.6.2.1. Existing Context
A well-developed, extensive workforce development infrastructure already exists within the San Diego region. For example, SDG&E works with the County and the nonprofit sector on a number of market-building and skill-building programs designed to help shape the clean energy market while also training workers with specific skills needed as part of a solar or energy efficiency career path in the future. Workforce development efforts for the County are led out of the County’s Office of Education, that works closely with trade schools, the community college network, and four-year colleges.
For now, there is no skills gap in the San Diego region when it comes to solar, since these jobs are usually taken by construction workers, according to Andy Hall, Vice President and Chief Programs Officer for the San Diego Workforce Partnership. However, Mr. Hall concedes that this is definitely a short-term phenomenon, and over the long term he recognizes that the infrastructure for a vibrant solar workforce that could help the County meet Governor Brown’s goal of 50 percent renewables by 2050 simply is not there. His organization is very interested in establishing new solar and wind training. Hall added, “The clean energy sector is one of our top priority areas, and the authors expect to devote significant resources and time to it in coming years. The County is an important partner” (Hall 2014).
One of the primary reasons for the lack of solar job growth in the San Diego region is the fact that solar companies are training their employees in-house and at out-of-state locations, and then bringing them in to
35 Experts within each of these organizations were contacted and asked how the average workforce development program budgets are structured and divided, what kind of implementation schedules are normal, and what types of total budget numbers the County of San Diego can expect with a major new renewable energy workforce initiative.
1 - 148

the region for short-term work as solar markets develop. Plus, firms like SolarCity, one of the fastest growing solar companies in the world are training employees only with company-specific job skills, which may not be portable to other companies and regions later. Solar City is known for its innovative leasing programs that dominate new solar installations; as much as 90 percent of recent solar installations in many states are set up as leasing structures (RAP 2013). Local utilities are generally not involved in solar training. The San Diego Gas and Electric (SDG&E) Company has no formal solar training programs (Brock 2014).
5.6.2.2. Recommendations
Best practices dictate collaborating with local workforce development agencies to maximize job training, partnerships with community groups, and workforce guidelines, including local hiring goals. Brandi Turner, the SDG&E Energy Innovations Center Manager of SDG&E Office of Customer Programs noted that long-term jobs on steady career paths are more likely to happen with multi-organizational collaboration (Turner 2015).
Phase II of the CREP could address the following questions:
Where will these jobs come from?
Where should the County focus its job training efforts?
What role does the military play in this equation?
What should a new renewable energy workforce initiative look like?
How do existing workforce programs figure into a new initiative?
5.6.2.2.1. Approach Industry to Figure out Their Workforce Needs via the CREP Process
The County of San Diego can apply an Industry Competency Model to help determine where future renewable energy job skills will be needed. The competency model graphic below shows the foundation, workplace, and technical competency areas required in an industry.36 The models can also be used as blueprints for developing curricula, performance standards, and the assessment instruments that measure the acquisition of knowledge and skills in the renewables area.
36 A competency is the capability to apply or use a set of related knowledge, skills, and abilities required to successfully perform “critical work functions” or tasks in a defined work setting. Competency should not be confused with competence, a competency describes a behavior, but does not attempt to describe a level of performance. For more information, see the Technical Assistance Guide for Developing and Using Competency Models: One Solution for the Workforce Development System (2012), as used by the U.S. Department of Labor, Employment and Training Administration (ETA)
1 - 149

FIGURE 5-1. INDUSTRY COMPETENCY MODEL (SOURCE: THE INTERSTATE RENEWABLE ENERGY COUNCIL (IREC))
In discussions with employers and workforce development professionals, County officials will need to gauge whether the industry-wide and industry-sector technical competencies outlined in this model are actually being applied in the San Diego region. If not, the County should consider evaluating which technical competencies will be needed by regional workers for the clean energy jobs of the future. Furthermore, an Industry Competency Model must also account for mobility within the renewable energy field for regional workers after they start.
Phase II of the CREP could address work force development through a collaborative effort with the San Diego County Office of Education.
5.6.2.2.2. Build Upon Existing Programs
The County could adopt an approach that integrates solar job training into existing energy efficiency programs so that stand-alone solar training does not fall with fluctuating markets. Laure-Jeanne Davignon of
1 - 150
the Interstate Renewable Energy Council (IREC)37 suggests new strategies in the County, such as making sure that workers primarily engaged in the Heating, Ventilation and Cooling (HVAC) business and electricians are also trained on renewable energy technologies along with their primary focus (Davignon 2014). This requires a major commitment to changing the ways things are done currently, since employers cannot be expected to provide this training, or part of this training, without some assurances that future jobs will be there in the renewables field. HVAC companies and others must be convinced that solar markets will be there before they dedicate funding and budgets to expected new solar opportunities. Via the CREP, the County can change policies and create a major new renewable energy workforce initiative to show the private sector that a real commitment has been made for the long term to build the renewable energy job base in the region.
5.6.2.2.3. Partner with Community Colleges
Working with community colleges on solar training programs is another strategy the County should consider, since 80 percent of community college students are more likely to stay in the area they attend school after they graduate as compared to students who attend four-year colleges, according to Joe Sarrubi, Manager of the U.S. Department of Energy’s Solar Instructor Training Network (Sarrubi 2014). Fortunately, community colleges in the San Diego region already work together through the San Diego and Imperial Counties Community Colleges Association (SDICCCA). This association can help operationalize a new regional effort involving solar and energy efficiency training efforts. New workforce development experts are actually being located in eastern San Diego County and in parts of Imperial County with the mandate to build joint County energy partnerships (Hall 2014). SDICCCA colleges are the region’s largest workforce preparation providers, conferring more than 10,000 degrees and certificates each year (SDICCCA 2011).
5.6.2.2.4. Start a New Initiative
Another solution to this challenge is to bring all of the workforce development players together and design a new, one-of-a-kind renewable energy initiative. The San Diego Workforce Partnership and Center for Sustainable Energy (CSE) are two interested, capable and ready partner organizations that can help the County lead a new renewables workforce initiative through the CREP.
With a hypothetical, new $5 million solar workforce development program the County can expect to spend $1.5 million on staff and overhead, $2.5 million on program dollars, and $1 million on training equipment and miscellaneous expenses.38
Any new renewable workforce initiative must also be cognizant of renewable projects in the pipeline. The larger the project, the larger the economic impact on the regional community generally. Most of the jobs created around a large renewable project are created on the developer (or vendor) side. According to J.W. Postal, Vice President of SunShare, a solar developer in Colorado, typically about one-third of the local non-vendor jobs will last longer than one year (Postal 2014). These roles include operations and
37 Interstate Renewable Energy Council (IREC) is the organization responsible for accrediting and credentialing the majority of solar workers in the U.S. 38 Breakdown of costs is based upon the information provided by the National Association of Regional Councils (NARC) in Washington, D.C., the Center for Sustainable Energy (CSE), the California Workforce Association (CWA), the San Diego Workforce Partnership, SDG&E, and the California Workforce Investment Board (CWIB) and their respective budgets for their workforce development programs.
1 - 151

maintenance, finance and accounting, and other support jobs. Local jobs (with vendors) that last less than a year are most often construction-based jobs, including labor and installation.
5.6.2.2.5. Collaborate with the Military
The County can help transition existing military technical training certifications to civilian solar opportunities. The County can also look to U.S. Department of Energy officials responsible for implementing the “Troops to Energy Jobs” initiative in 2014 for workforce-related renewable energy technical assistance.
The clean energy sector is well positioned to leverage the skills, talent, and experiences of approximately 250,000 individuals who nationally transition annually to civilian careers from active duty service (Sarrubi 2014).39 From 2012 to 2013, the solar workforce grew in size from 119,016 workers to 142,698 full-time professionals; that same year, the solar industry reported employing nearly 13,200 veterans, or 9.2 percent of its total (IREC 2014). Many energy companies recruit veterans because they already possess the foundational skills for energy-related job competency. In addition to their intangible skills, many transitioning service members and veterans have a technical skill set gained through military courses; making today’s U.S. military a highly technical force. Veterans often work with complex equipment that they were trained on and then entrusted to operate, maintain, and repair.
5.7. Build an Energy Assurance Plan (EAP)
39 There are also 1.1 million members of the National Guard and Reserve, who are engaged in their civilian careers at the same time they serve.
Definition
An Energy Assurance Plan (EAP) is an emergency management plan that ensures that key assets within the community will remain operational in the event of a power outage.
Generally, successful EAPs are components of an existing or are appendices to, or addendums of, Hazard Mitigation Plans (HMPs), Climate Action Plans (CAPs), Energy Emergency Plans (EEPs), or Continuity of Operations Plans (COOPs). Local government EAPs appeared for the first time in 2009.
An Energy Assurance Plan (EAP) in the County of San Diego will:
Ensure County “key assets” are functional when needed;
Build critical public-private partnerships before emergency energy incidents happen;
Gain awareness of energy dependencies and interdependencies within the County; and,
Take firm actions to move towards energy resiliency (that will also contribute to County Climate Action Plan and Strategic Energy Plan goals).
1 - 152

5.7.1. Overview
5.7.1.1. Definition
An Energy Resilience Plan (ERP) is an emergency management plan that focuses on energy and makes sure that key assets within the community during a power outage are operational. As policy tools, local government EAPs are relatively new, having first appeared in 2009 (Mosley 2014).
5.7.1.2. Value Proposition & Benefits
With the County of San Diego evaluating Community Choice Aggregation (CCA) and a more active role in the energy arena in the near future, an EAP can be a great tool to familiarize County staff with how energy is used across the County and to help the County mitigate the negative impacts of energy disruption on key County assets. Key assets could be as big as an entire building (i.e., Police or Fire Station) or as small as an element within a building (i.e., communications or an HVAC system). Further, an EAP will help the County discover ways to reduce its energy demand and make its energy supply more energy resilient.
Historically, the County has relied on its energy providers to meet energy demand. In some instances, this leaves the County in the position of having all of the responsibility to provide essential services, such as traffic lights and emergency power to wastewater and water treatment facilities, but having little-to-no control over the energy resources needed to provide the essential service. The EAP is intended to bridge this gap and foster a plan to identify ways to ensure availability of energy resources.
With an EAP, the County can assert more control over the energy supply it needs in an emergency. When the primary supply of energy is disrupted in the future, the County will be able to more closely manage its own energy supply until the primary supply of energy is restored. An EAP can help the County keep the power running to key services and assets internally, such as communication and IT equipment, so that the County’s role in keeping commerce moving externally is not compromised. This effectively allows the County and the region to stay insulated to a degree from man-made and natural disasters. For example, distributed generation resources that are located on County sites as part of an EAP provide an extra layer of energy security. An EAP can also help protect public health, by making sure that wastewater treatment plants continue to operate and filter waste during an emergency.
Many emergency managers will state that building partnerships after a disaster is too late. Attempting to identify who needs to be reached and working around potential obstacles to reach them (i.e., limited, or downed telecommunications equipment during a storm) will be difficult. Establishing these relationships through a CREP and an EAP in advance of an emergency will help the County anticipate actions and clarify
CREP-Related Options for the County of San Diego
Identify actions and renewable energy projects that can mitigate the negative impacts of energy disruption on the County’s key assets.
Continue working with SDG&E and others to identify all renewable energy generation opportunities with County facilities.
Make the EAP a major priority within any new Regional Energy Network (REN) that the County may join.
1 - 153
roles and responsibilities prior to events; thus increasing the likelihood of a successful and efficient response and recovery (Petrow and Mosley 2013).
5.7.1.3. Function of an Energy Assurance Plan (EAP)
Since Energy Assurance planning would be new to the County of San Diego and because there are so many variables, setting Energy Assurance priority areas is a good way to focus action and identify projects. Energy Assurance priority areas can take many forms. According to Ronda Mosley, the Deputy Executive Director for Research & Government Services at the Public Technology Institute (PTI), a 2014 review of local government EAPs funded by the Department of Energy included the following priority objectives:
Energy Efficiency
Renewable Energy
Energy Management
Energy Security
Most EAPs are appendices to, or addendums of, Hazard Mitigation Plans (HMPs), Climate Action Plans (CAPs), Energy Emergency Plans (EEPs), or Continuity of Operations Plans (COOPs). As such, it could be attached to a future County CREP40 or an existing County plan. Generally, successful EAPs are new components of another existing plan that the government already values (such as the SEP).
5.7.1.4. Structure and Budget (Costs)
The economic costs of preparing an EAP to the County are largely related to the staff time required to write a draft EAP and then to implement it. Based on experience with assisting more than 50 local governments across the country, the Public Technology Institute (PTI) suggests that it will take a County FTE six months to oversee and draft an EAP, along with minor consulting support (Burmeister, Mosley et al. 2011). Implementation of the EAP should be considered a long-term process, similar to an Emergency Management Plan or other County plan that annual or biannual updates. PTI suggests that the average cost for building a new County EAP for a county similar in size to San Diego County is $250,000, and is equally split between County staff and contractor support (Mosley 2014). Most of this cost is incurred in collecting energy-related data across the government, managing group meetings designed to achieve consensus around the EAP, and interacting with government staff from multiple departments.
5.7.2. Application to San Diego County (Recommendations)
5.7.2.1. Existing Context
The County of San Diego drafted an EAP in 2013 through a short-lived California Energy Commission CALEAP program, but decided at the time to wait until 2017 to codify it within an existing plan (X 2014). Since the draft was completed, a number of important game changers have occurred necessitating that a new EAP be drafted. Chief among these new developments is the County’s exploration of a CREP, as well
40 The link between a CREP and an EAP can be as simple as providing solar photovoltaic (PV) back-up power to a single wastewater pump that keeps sewage from backing up into the water supply during an energy emergency, or as complex as having the County develop a microgrid project that powers dozens of County buildings through the combined use of PV, fuel cells, energy efficiency, and combined heat and power (CHP). A CREP-driven EAP/microgrid project can supply primary power 24/7 as part of day-to-day operations, as well as provide power when traditional power sources from a major utility may be unavailable due to a storm or other issue.
1 - 154

as the drastic drop in solar prices (for emergency power needs), the role of electric vehicles, new battery and storage technologies, and the introduction of CCA into County energy planning scenarios. Therefore, the County should consider revisiting the draft EAP, taking into account these issues and many others.
5.7.2.2. Next Steps
The following graphic41 depicts an EAP development process that the County can use:
FIGURE 5-2. 4 Steps to Developing and Implementing an Energy Assurance Plan
Source: http://www.caleap.org
An EAP would help the County look at all energy services and uses in the County, including the providers and producers of energy supplies, the transportation or transmission of energy supplies, and the subsequent distribution of supplies to end users within the County (which are often categorized as commercial, industrial, transportation, and residential).
5.7.2.2.1. Identifying Key Assets
The first step in an EAP is usually to identify the key assets of the essential services in the community and determine their vulnerabilities. The “key assets” could be as big as an entire building (i.e., Police or Fire
41 http://www.caleap.org/. Note: Empower team member CEG helped create this diagram and the CaLEAP website, and provided in-depth EAP technical assistance to local governments between 2009 and 2013.
4. EAP Implementation& Maintenance
Training
Exercises
Review & Updatethe EAP
3. Finalize EAP
EAP Review
EAP Approval
Adopt &Disseminatethe EAP
2. Develop Your Energy Assurance Plan (EAP)
2a.UnderstandYour Situation
PresentCommunity ProfileOverview
Build CommunityEnergy Profile
Understand YourEnergyInterdependencies& Dependencies
Build Your AllHazards Profile
Understand YourEmergencyFramework
Identify Key Assets
2b.IdentifyGaps
Assess Threats& Hazards
DetermineVulnerabilities
Validate YourSituation (2a)
2c. AssembleActions &ProjectsDevelop SpecificEnergy AssuranceObjectives
Identify Actions& Projects
Identify Actions& ProjectsResources
Prioritize Actions& Projects
1. Form Your Team
Designate EAPCoordinator
Identify EAPWorking Group
Create EAPVision & Mission
Incorporate into and Leverage from Your Existing Plans
EAPUPDATES
1 - 155
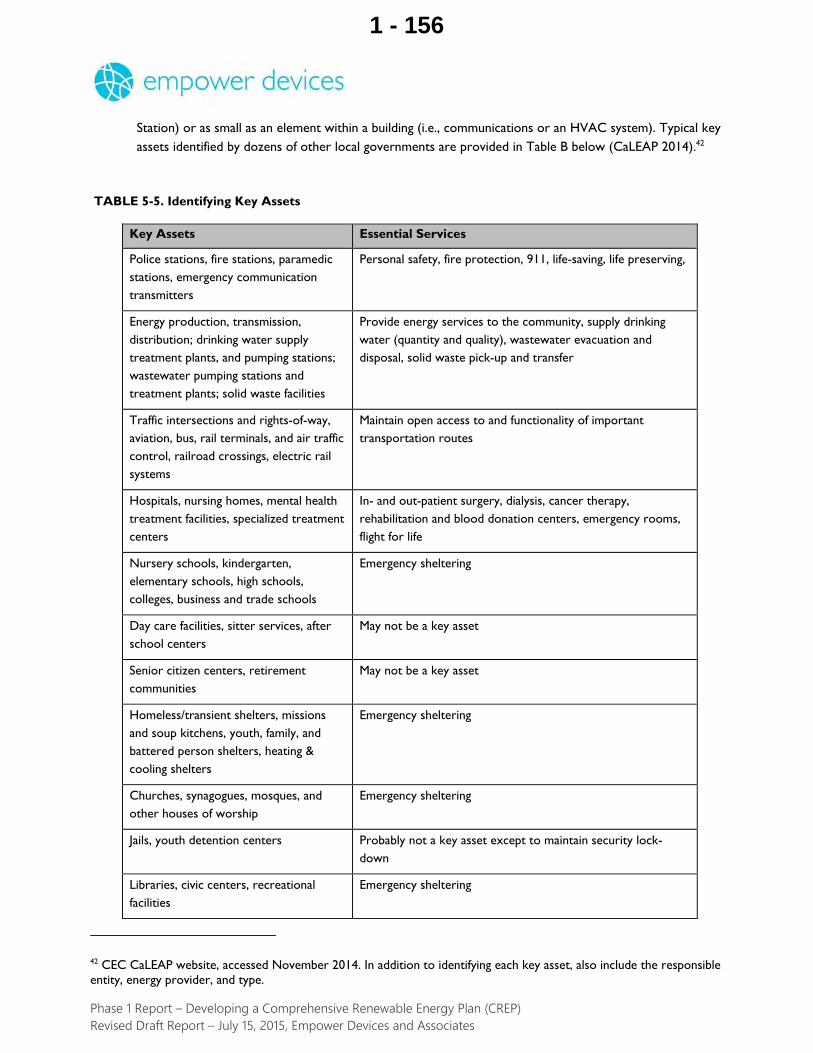
Station) or as small as an element within a building (i.e., communications or an HVAC system). Typical key assets identified by dozens of other local governments are provided in Table B below (CaLEAP 2014).42
TABLE 5-5. Identifying Key Assets
Key Assets Essential Services
Police stations, fire stations, paramedic stations, emergency communication transmitters
Personal safety, fire protection, 911, life-saving, life preserving,
Energy production, transmission, distribution; drinking water supply treatment plants, and pumping stations; wastewater pumping stations and treatment plants; solid waste facilities
Provide energy services to the community, supply drinking water (quantity and quality), wastewater evacuation and disposal, solid waste pick-up and transfer
Traffic intersections and rights-of-way, aviation, bus, rail terminals, and air traffic control, railroad crossings, electric rail systems
Maintain open access to and functionality of important transportation routes
Hospitals, nursing homes, mental health treatment facilities, specialized treatment centers
In- and out-patient surgery, dialysis, cancer therapy, rehabilitation and blood donation centers, emergency rooms, flight for life
Nursery schools, kindergarten, elementary schools, high schools, colleges, business and trade schools
Emergency sheltering
Day care facilities, sitter services, after school centers
May not be a key asset
Senior citizen centers, retirement communities
May not be a key asset
Homeless/transient shelters, missions and soup kitchens, youth, family, and battered person shelters, heating & cooling shelters
Emergency sheltering
Churches, synagogues, mosques, and other houses of worship
Emergency sheltering
Jails, youth detention centers Probably not a key asset except to maintain security lock-down
Libraries, civic centers, recreational facilities
Emergency sheltering
42 CEC CaLEAP website, accessed November 2014. In addition to identifying each key asset, also include the responsible entity, energy provider, and type.
1 - 156

Key Assets Essential Services
Sports stadiums, concert auditoriums, theaters, cinemas, shopping malls, conference centers, museums, art centers
Emergency sheltering
Hotels, motels, boarding houses Emergency sheltering
Mayor’s Office, Office of Emergency Management,
IT office
Communications with other political/elected/appointed leaders, access to Office of Emergencies management
Restaurants, grocery stores, supermarkets, food processing facilities
Hazardous material handling May not be a key asset except to guard against leakage, spillage, storage, and handing
Source: Local Government Energy Assurance Guidelines, Public Technology Institute, 2011.
5.7.2.2.2. Create EAP Coordinator Position (Full-time)
Building relationships between the County and energy suppliers and major energy users often requires a leader within the County, and can be the responsibility of one key employee, known as the EAP Coordinator. The EAP Coordinator is responsible for guiding and facilitating discussions with the planning team, and in some instances, with outside interest groups. The EAP Coordinator’s ability to explain, engage, motivate, and in some cases inspire, is critically important to the overall success of the EAP. It is recommended that they brief individuals on the proposed planning process and get them involved as soon as possible in the development of the EAP. The EAP Coordinator should have a specific set of skills that will allow them to build consensus, be the EAP’s primary architect, and become the internal and external champion/advocate of the EAP. Based on the expected role of the EAP Coordinator, an appropriate skill set would include the ability to:
Build strong relationships with planning teams and outside interest groups;
Understand and articulate complex technical energy issues;
Identify essential service and key assets;
Develop energy-focused projects; and
Apply energy assurance messaging across local government departments and industries.
The messaging of energy assurance as part of, and separate from, the CREP is vital. The EAP Coordinator must be able to customize the message so all see the value and relevance in their role in the community.43 While it is certainly a bonus, the EAP Coordinator does not have to be an expert in energy or emergency
43 For example, the head of a city water department with stationary water pumps and miles of underground pipeline has drastically different energy assurance concerns than the head of the city transportation department who oversees the traffic light system, above-ground fuel supply routes, and operation of city fleets.
1 - 157

response. It is more important that the EAP coordinator have a good understanding of the local government’s capabilities and its relationship with outside governments and organizations (i.e. DOE, Cal EMA, utilities).
5.7.2.2.3. Assemble a County of San Diego EAP Working Group
The EAP working group is responsible for the development and review of the EAP. The EAP working group should be made up of the members within the County who are directly or indirectly affected by an energy outage or play a role in response and/or recovery operations.44 The EAP working group should be kept at a manageable number.45
These groups often grow as the scope of the effort becomes clarified. To help manage the numbers, an EAP working group can grow and contract as necessary to address particular issues, as long as the “core” EAP working group remains intact. It is important to keep the continuity of the core EAP working group. Another option is to create EAP working group subcommittees. These subcommittees convene to discuss a particular issue and disband when the issue is resolved. The findings from the subcommittees are brought back to the core EAP working group. It is important to note that if you use this method, it is vital to provide some perspective on the EAP and allow the subcommittee to participate in the final review of the EAP.
5.7.3. Who Else Is Doing It
Chula Vista, San Jose, and Visalia were the first three California local governments to design an EAP as part of a $10 million U.S. Department of Energy-funded project that resulted in 43 new EAPs across the country since 2009.46 Chula Vista’s expertise in this area is noteworthy, and its staff expressed interest in assisting San Diego County with any subsequent efforts in this area. They should be considered resources to the County of San Diego. The following cities and counties, organized by state, have written Energy Assurance Plans since 2009 with DOE funding:
TABLE 5-6. Cities and Counties with Energy Assurance Plans
Phoenix, AZ Windham, CT Speedway, IN Wilmington, NC
Tucson, AZ Delray Beach, FL Manhattan, KS Newark, NJ
Chula Vista, CA Lake Worth, FL Louisville-Jefferson Co., KY Hamilton, OH
44 Historically, EAP working group members have included the following Departments: Emergency Management, Environment, General Services, Communications/Public Affairs, Fleet Management, Facilities Management, Fire Department, Police Department, Public Works, Health Services, Energy Management, Procurement, Electricity/Gas/Water Utilities, and Information Technology (IT). However, it can also be helpful to involve outside members to support your EAP working group. This could include CPUC or CEC staff, regional government leaders and some private sector organizations. It is also important to include decision-makers, subject matter experts (i.e., cyber security experts), or related personnel from relevant utilities. 45 While there is no set number, the EAP working group has to be large enough to allow representation from a diverse cross-section of the community, but not too large as to impede the ability of the group to complete its tasks. For example, the City of San Jose, California, for example, (population, 948,000) has 13 members represented on its EAP working group (R. Mosley, personal communication, June 2014). 46 This U.S. DOE funding was discontinued in 2013.
1 - 158

San Jose, CA Palm Beach Gardens, FL Baton Rouge, LA Portland, OR
Visalia, CA Roswell, GA Boston, MA Salem, OR
Aspen, CO Davenport, IA Baltimore, MD Philadelphia, PA
Aurora, CO Hailey, ID Flint, MI Heber, UT
City/County of Denver, CO
Chicago, IL Mayville, MI Salt Lake City, UT
Durango, CO Hoffman Estates, IL Columbia, MO Virginia Beach, VA
Lakewood, CO Peoria, IL Asheville, NC Casper, WY
Wheat Ridge, CO Fort Wayne, IN Raleigh, NC
In addition, a number of California cities and counties started EAPs through a California Energy Commission (CEC) “CALEAP” project in 2010. These jurisdictions are highlighted on the maps below.
1 - 159

FIGURE 5-3. MEMBER CITIES AND COUNTIES OF CEC CALEAP PROGRAM
SOURCE: CALEAP MEMBER GOVERNMENTS AND CONTACTS HTTP://WWW.CALEAP.ORG/INDEX.PHP/TGP1/INS/C10
1 - 160

5.8. Increase the County’s Percentage of Energy Derived from Various Renewable Energy Technologies
5.8.1. Overview of County Renewable Energy Goals Efforts on Renewable Energy Technologies
The County has already demonstrated success by surpassing 2009 Strategic Energy Plan (SEP) goals for the percentage of annual electricity usage through renewable energy systems. The County is capturing 2.3 percent of its annual electricity needs through a number of small PV systems at local parks and recreation centers as well as through a Power Purchase Agreement (PPA) completed in 2011 (County of San Diego, 2013).47 These achievements have helped achieve County SEP goals of controlling utility costs, accelerating distributed generation deployment, and reducing the region’s carbon footprint.
The 2013–2015 Strategic Energy Plan set a goal to “increase total energy consumed at County facilities provided by distributed generation systems from 2.5 percent to 10 percent by the end of FY 2014-2015.” The County may want to consider a higher goal of at least 25 percent by 2020.
Meeting County electricity needs through renewable energy systems addresses local, regional, state, and federal emissions targets, and is one of the most basic policy options available to the County. The San Diego County region spends approximately $23 billion on utility bills (CREP TAC Presentation # 2, January 2015). Increasing the use of renewable energy technologies in more public buildings and lands helps reduce these GHGs while contributing to meeting State directives to reduce GHG’s emissions economy-wide to 1990 levels by 2020, and to 80 percent below 1990 levels by 2050.
47 The original goal was for the County to provide at least 2 percent of its annual electricity usage through renewable energy systems by FY 2011-2012.
CREP-related Options for the County of San Diego
Analyze the long-term costs and benefits of increasing the County’s percentage of electricity derived from renewables to a higher percentage.
Investigate opportunities for small-scale wind energy projects at County facilities and in the community.
Work with the Center for Sustainable Energy (CSE) and other appropriate partners on a major new community renewable energy outreach program, aimed at meeting already published County and community goals. Involve associated national and regional industry associations and their local members in this effort to promote solar hot water work with the 29 approved solar thermal contractors that participated in the 2007-2009 pilot program, and incorporate lessons learned into the program design.
Review the current solar hot water heater permit process and considers ways to further streamline and expedite.
Work closely with the cities of Carlsbad and Chula Vista and discover how they were able to achieve success with solar thermal technology.
1 - 161
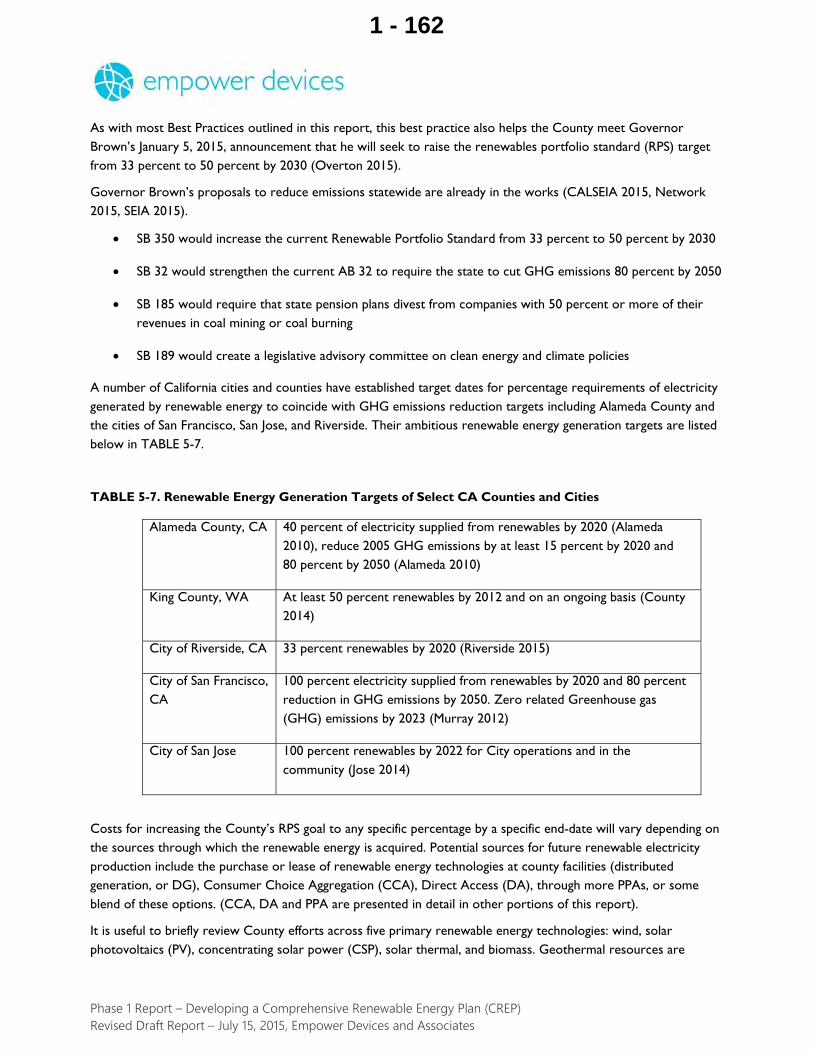
As with most Best Practices outlined in this report, this best practice also helps the County meet Governor Brown’s January 5, 2015, announcement that he will seek to raise the renewables portfolio standard (RPS) target from 33 percent to 50 percent by 2030 (Overton 2015).
Governor Brown’s proposals to reduce emissions statewide are already in the works (CALSEIA 2015, Network 2015, SEIA 2015).
SB 350 would increase the current Renewable Portfolio Standard from 33 percent to 50 percent by 2030
SB 32 would strengthen the current AB 32 to require the state to cut GHG emissions 80 percent by 2050
SB 185 would require that state pension plans divest from companies with 50 percent or more of their revenues in coal mining or coal burning
SB 189 would create a legislative advisory committee on clean energy and climate policies
A number of California cities and counties have established target dates for percentage requirements of electricity generated by renewable energy to coincide with GHG emissions reduction targets including Alameda County and the cities of San Francisco, San Jose, and Riverside. Their ambitious renewable energy generation targets are listed below in TABLE 5-7.
TABLE 5-7. Renewable Energy Generation Targets of Select CA Counties and Cities
Alameda County, CA 40 percent of electricity supplied from renewables by 2020 (Alameda 2010), reduce 2005 GHG emissions by at least 15 percent by 2020 and 80 percent by 2050 (Alameda 2010)
King County, WA At least 50 percent renewables by 2012 and on an ongoing basis (County 2014)
City of Riverside, CA 33 percent renewables by 2020 (Riverside 2015)
City of San Francisco, CA
100 percent electricity supplied from renewables by 2020 and 80 percent reduction in GHG emissions by 2050. Zero related Greenhouse gas (GHG) emissions by 2023 (Murray 2012)
City of San Jose 100 percent renewables by 2022 for City operations and in the community (Jose 2014)
Costs for increasing the County’s RPS goal to any specific percentage by a specific end-date will vary depending on the sources through which the renewable energy is acquired. Potential sources for future renewable electricity production include the purchase or lease of renewable energy technologies at county facilities (distributed generation, or DG), Consumer Choice Aggregation (CCA), Direct Access (DA), through more PPAs, or some blend of these options. (CCA, DA and PPA are presented in detail in other portions of this report).
It is useful to briefly review County efforts across five primary renewable energy technologies: wind, solar photovoltaics (PV), concentrating solar power (CSP), solar thermal, and biomass. Geothermal resources are
1 - 162

important but largely located outside of the County (in Mexico and Imperial County) (Meisen and Black 2010). Wave and tidal energy resources are outside the scope of this report.
5.8.2. County Efforts on Renewable Energy Technologies and Recommendations
5.8.2.1. Wind
While wind technology remains very cost-effective, much of the remaining prime wind resource areas in the state are facing strong and well-organized opposition. Approximately 50 MW is currently being generated in the County at the Kumeyaay Wind Farm (Campos Indian Reservation). Utility-scale projects on prime agricultural land have met opposition in some areas of the state including the County of San Diego.
5.8.2.1.1. Benefits and Costs
The California Wind Energy Association estimates that 5,812 MW of electricity (enough to meet the needs of two million homes) is now generated statewide and that the wind resource could contribute 20 percent of the state’s electricity supply by 2030 (CWEA 2014).
Installation costs of small residential turbines vary greatly depending on the specific turbine’s size and height as well as permitting costs. On average, a large residential system costs $30,000, but very small systems (less than 1 kW) cost as little as $4,000. Small systems (up to 10 kW) can have a payback period of 6 to 30 years depending on the specific turbine installed, electricity rates, and use by the consumer (Yeager 2014). These costs can be reduced substantially with the 30 percent federal income tax credit.
5.8.2.1.2. Existing Wind Policies and Programs
The County’s Wind Energy Ordinance adopted in 2013 (POD 10-007) amended the zoning code by categorizing wind turbines as small (less than 50 kW, up to 80 feet in height, and up to 3 towers permitted) and large (50kW and higher, height set during planning/permitting and multiple towers allowed). The ordinance also modified community plans in Boulevard and Borrego for development of wind. Community activitists subsequently filed a lawsuit against the County in June 2013 asserting the County, in part, failed to adequately comply with CEQA requirements. The case was last heard in April 2014…….. (Any insight on the status of this?). To date, that ordinance is on hold. While the State Superior Court upheld the County’s Wind Energy Ordinance and Boulevard Plan Amendment in 2014, it has been appealed and is currently before the Fourth District Court of Appeals.
The County has offered building permit fee waivers since 2008 for residential small wind turbine electrical system permits. During FYs 2010-2014, only one system has been permitted, questioning both the value and the amount of the fee waivers.
5.8.2.1.3. Wind Opportunities
Small wind energy systems (1 to 10kW) are a reliable and low-maintenance way to produce electricity when sited correctly and are ideal for off-grid use (California Wind Energy Collaborative, 2014). Combined with a microgrid, small wind turbines may have ancillary benefits to the County.
5.8.2.2. Solar Photovoltaics (PV)
Electricity from solar photovoltaic (PV) system installations in the County has grown tremendously in the last decade, and a corresponding decrease in system costs has made PVs a popular option for utilities and homeowners. Homes and businesses in particular have led the way with rooftop installations as they are
1 - 163
offered installation rebates and awarded credits to their bills through net metering policies. Some recent statistics on solar PV statewide and from within the County of San Diego:
California has enough installed solar PV capacity to power over 1 million homes; one-half of that capacity was installed in 2013 alone (CSE 2015).
The industry employs more than 50,000 in California (Heavner 2014).
The County has almost 200 MW of installed rooftop solar panels in homes and businesses (CEC 2015).
5.8.2.2.1. Existing PV Policies and Programs
The County has been offering building permit fee waivers for residential systems since 2001 and is offering online permitting for residential roof-mounted systems that do not require a meter upgrade. During the first four months of FY 2014-2015, the County issued 1,935 residential (more than 80 percent through Planning and Development Service’s (PDS’s) on-line system) and 18 commercial solar PV permits (EDC 2014).
In San Diego Gas and Electric’s territory, consumer demand for the state solar PV rebates (provided through the Center for Sustainable Energy) has been so strong that funds have been depleted and rebate applicants have been wait listed since April 2014 (CSE 2015).
The County has installed at least 16 solar PV systems on County facilities, including parks, recreation centers, and the County Operations Center (Diego 2012).
Most recently, the Board of Supervisors amended the County building code to make it easier and less expensive to install rooftop PV panels. Beginning July 1, 2015, new single-family homes are required to have conduit installed for future electrical connections to solar PV panels as well as have at least 250 square feet of south-facing roof space reserved for panel installations.
5.8.2.2.2. Benefits and Costs
Photovoltaic systems are cost-effective. According to research from Lawrence Berkeley National Laboratory, the costs of most programs that use solar photovoltaics to meet their demand are equivalent to less than 2 percent of retail rates in 17 states. Ten of those 17 states have estimated costs equivalent to less than 1 percent of retail rates.
The California Solar Initiative estimates that the typical rooftop solar PV system costs $34,800 (for a 4 kW system) and, depending on the electricity rate, consumers can expect 9 percent to 14 percent rates of return on their investment (California 2015). Customers taking advantage of the 30 percent federal income tax credit can decrease their final cost to $24,360.
5.8.2.2.3. PV Opportunities
There are still more opportunities for both the County and its residents to further increase the percentage of electricity generated from renewable energy. The County may want to consider increasing the number of solar PV installations at additional County facilities as well as leasing any available County land for a community solar, or group procurement initiative project (see the Community Solar Initiative and Renewable Energy Group Procurement Initative Best Practices discussed later in this report). Lastly, the County may want to consider expanding its consumption of electricity from solar PV through its Direct
1 - 164

Access agreements and Community Choice Aggregation, which are discussed in great detail earlier in this report.
5.8.2.3. Concentrating Solar Power (CSP)
The Global Energy Network Institute’s 2010 San Diego Plan for 100 percent Renewable Report (Meisen and Black 2010) relied on a local group of experts for their analysis, and discovered a 2.9 Gigawatt potential for CSP in the County (mostly in Borrego Springs). The authors in this 2010 report identified three primary CSP technologies: Parabolic Troughs; Linear Fresnel Systems; and Power Towers (Meisen and Black, 2010).
5.8.2.3.1. Benefits & Costs
Concentrating solar power costs enjoy a relatively low levelized cost of electricity (LCOE) versus other technologies (Soitec 2014).
5.8.2.4. Solar Thermal
Another opportunity for the County to use more renewables is to increase the use of solar thermal technology, specifically for solar hot water heating. Solar thermal technology uses the sun’s energy to heat water for homes or businesses, or to heat other fluids to produce steam for the generation of electricity. It can also power heating and cooling systems. Solar thermal systems differ from solar photovoltaic (PV) systems, which generate electricity rather than heat.
5.8.2.4.1. Benefits and Costs
Solar thermal systems can effectively reduce energy demand, primarily from burning natural gas, for residential and commercial hot water use. Solar thermal systems typically provide for around 60 percent of residential end-use demand for hot water, while saving homeowners 50 percent to 70 percent on water heating bills, and paying for themselves within 10 years in California (depending on the amount of hot water consumed and the cost of natural gas) (CPUC 2008, AMECO 2014, CSE 2015). A well-designed system can last 25 to 30 years.
The price of a solar hot water heating system depends largely upon the following variables:
Amount of hot water needed (usually determined by the number of people living in the home)
Size and brand of solar panel
Roof material where the panels are mounted
Orientation of panels
Building code and permitting requirements
In an average home, a person uses between 15 and 25 gallons of hot water a day, which can cost $5to $25 per person every month or between $384 and $1,200 per year (AMECO 2014). The cost of a residential solar water heater can vary from $4,000 to $8,000 in California (AMECO 2014). The typical residential system in San Diego County costs $7,300 before CSI incentives (CEC 2015). The cost for commercial systems varies widely depending on size and intended use(s).
5.8.2.4.2. Existing Solar Thermal Policies and Programs
Principal barriers to greater use of solar thermal within the County are the initial installation costs and low current natural gas rates. The County participated in a California Energy Commission solar hot water pilot
1 - 165

program between 2007 and 2009, which was administered by the California Center for Sustainable Energy (CCSE, now the CSE). The CSE remains interested in working with the County on ways to promote new solar water heating systems (Oliver 2014).
State legislation (AB 1470, 2007) authorized the creation of the California Solar Initiative (CSI) thermal incentive program and set a goal of installing 200,000 systems over ten years. Market penetration statewide over the first four years of the program was less than 5 percent (residential and multi-family/commercial sectors combined) of this goal (CPUC 2014).48
5.8.2.4.3. Upcoming Changes to Incentives (Effective May 2015)
Changes to the incentives and program structure were proposed by the California Solar Energy Industries Association and the CSI-Thermal Program Administrators, and were approved by the CPUC in January 2015. Under the new program the average rebate for a single-family home will increase from $2,170 to approximately $3,440, and is capped at $4,366. The impact of the new multifamily/commercial system rebates is harder to calculate because of variations in system size and use, but is expected to be approximately 30 percent higher, and the cap is increased within this sector from $500 to $800 (Sikkema 2015). Multi-family/commercial systems also benefit from accelerated depreciation schedules which offset the financial impact of an installation. Currently, the system must be rated by the Solar Rating and Certification Corporation (SRCC) to qualify for these tax benefits. Lastly, a new package of rebates will be available for pool heating systems that will provide up to 50 percent of total system costs.
These solar thermal programmatic and incentive changes are expected to take place in May 2015, and customers that requested rebates after July 23, 2014, (the date of the industry’s petition) will receive an additional rebate that will supplement their original rebate (Oliver 2015). After these incentives, customers can take advantage of the federal 30 percent income tax credit on the remaining installation costs. The federal tax credit is scheduled to expire on December 31, 2016, and CSI’s rebates for these systems run through December 31, 2017.
5.8.2.4.4. Solar Thermal Opportunities
The recent changes to the CSI-Thermal program mentioned earlier may increase interest in installations. Immediate solar thermal opportunities include:Consider amending the County ordinance adopted in March 2015 that requires the installation of the conduit in single-family homes for future PV panel installations to include a requirement for “pre-plumbing” of new homes for solar thermal installations as well.
Consider streamlining the solar thermal permitting process similar to what has already been implemented for solar PV installations.
Consult with contractors that participated in the 2007 – 2009 solar thermal pilot study about their experience and any recommendations they may have for implementing any additional programs within the County.
Work with builders to examine how solar thermal fits into a future County-led Zero Net Energy (ZNE) buildings initiative.
Encourage builders to incorporate solar thermal systems into new homes and evaluate related costs and benefits.
48 The California (CSI) statewide database of solar thermal systems identifies a total of 3,900 single family and multi-family/commercial installations across the three major investor-owned utility (SCE, SDG&E and PG&E) service areas.
1 - 166

Identify opportunities to install more solar thermal systems at County facilities
5.8.2.5. Biomass
Energy from biomass is produced by the burning or the decomposing of organic matter. Typical biomass resources include forest wood; construction waste; agricultural and food processing waste, and municipal solid waste; landfill gas-to-energy; waste water treatment; and animal and food waste digestion. It is no surprise that biomass energy has been developed much more in northern and central California due to available natural and agricultural resources in close proximity to population centers.
5.8.2.5.1. Biomass Activity in California
According to the California Energy Commission, a total of 82 biomass power plants are in operation in the state with a combined capacity of 1,117 megawatts (CEC 2015). Solid waste resources power over 40 percent of the aforementioned biomass power plants, the closest of which is the Greenleaf Desert View facility in Mecca in Riverside County.
5.8.2.5.2. Biomass Opportunities
Opportunities for biomass energy resources in the County of San Diego are limited to municipal solid waste-to-energy and landfill gas applications as there is little to no agricultural (crop or animal) waste resource. The Global Energy Network Institute suggested that the County of San Diego had 72 Megawatts of landfill gas capacity potential, 3 to 5 Megawatts of (limited) forestry wood waste capacity potential, 40 to 100 Megawatts of urban wood waste capacity potential, and negligible agricultural waste capacity potential (Meisen and Black 2010).
The County may want to consider collaborating with its incorporated cities to determine if construction and municipal solid waste facilities are an option for electricity generation. Likewise, the County may want to consider revisiting available biomass resources and biomass-to-energy plants.
A recent California Energy Commission report highlights a number of biomass plant issues including volatility of vehicle fuel costs for transportation, and whether generating plants can achieve long-term contracts with suppliers (CEC 2015). An earlier draft report estimated that in addition to the costs of transporting biomass fuel resources to a waste-to-energy and/or electricity generation facility, the costs of biomass applications are expected to rise between 2.5 to 6 ercent over the next decade entirely because as electricity generating facilities they would still need to purchase emissions credits as fossil-fueled power plants do (CEC 2014).
1 - 167

5.9. A Renewable Energy Group Procurement Initiative
5.9.1. Overview
California counties such as Santa Clara, Alameda, Contra Costa, and San Mateo and municipalities such as Cupertino, Menlo Park, Oakland, Berkeley, and Mountain View have successfully utilized GPI as a way to accelerate regional clean energy adoption.
The Silicon Valley Renewable Energy Project (SV-REP), led by the Joint Venture Silicon Valley Public Sector Task Force and Santa Clara County, was California’s first large-scale public renewable energy procurement initiative.49 It was built on the private sector’s pioneering Collaborative Solar Project (TCSP), and led by the World Resource Institute. The EPA Green Power Partnership endorsed the SV-REP as a model for increasing the country’s clean energy supply.
5.9.1.1. Definition
A renewable energy Group Procurement Initiative (GPI) is a regional, multi-agency collaborative purchase of renewable energy (such as rooftop solar PV panels) for public agency facilities (e.g., city halls, fire
49 Specific project details are included in the last section of this best practice.
CREP-Related Options for the County of San Diego:
Establish a relationship with government and private sector leaders of the Silicon Valley Renewable Energy Project (SV-REP) and research the costs and benefits and lessons learned from its Group Procurement Initiative experiences Conduct a feasibility study of a renewable energy Group Procurement Initiative under Community Choice Aggregation (CCA) scenarios Add a Group Procurement Initiative as an early potential project for the potential new Regional Energy Network (REN) under discussion Analyze how a Group Procurement Initiative would work within a County-led microgrid project Encourage SANDAG to pursue a Group Procurement Initiative for its member jurisdictions and local renewable energy industry leaders
Evaluate the feasibility of including Tribal members in a new County-led Group Procurement Initiative
Definition
A renewable energy Group Procurement Initiative (GPI) is a regional, multi-agency collaborative purchase of renewable energy equipment for public agency facilities (e.g., city halls, fire stations, libraries, community centers) such as rooftop solar photovoltaic (PV) panels.
Renewable energy procurement initiatives benefit participants through economies of scale; volume discounts, shared costs, and shared resources. Group procurement of renewable energy allows the County and other public entities to address the challenges facing renewable energy adoption, including resource limitations and lack of expertise, while leveraging collaborative procurement to lower costs and negotiate more competitive contract terms (World Resources Institute, 2011).
1 - 168
stations, libraries, community centers). Purchased in bulk, renewable energy technology is installed at numerous chosen installation sites (Heeter and McLaren 2012). The purpose of a GPI is to put more renewable energy power on the electricity grid. The GPI approach has been successfully adopted and advocated by numerous counties, municipalities, nonprofits, and for-profit entities (Donalds 2014).
5.9.1.2. Value Proposition & Benefits
One of the most obvious benefits of a new renewable energy procurement initiative is the ability to obtain significant discounts when purchasing products and services in bulk. Group purchasing can also lower transaction costs, staff time, organizational burden, and reduce the redundant efforts by multiple stakeholders.
A GPI maximizes the purchasing power of governmental entities for numerous installations, alleviating the need for negotiating (often smaller) projects on a case-by-case basis. Participating in a GPI lowers the risk and project costs for each participant. Large projects also tend to be more interesting to vendors, thereby attracting quality vendors that might not otherwise be interested in a smaller project. More competitive bids can also mean potentially better pricing. Also, depending on how the project is financed and the size of the project, the end users of the renewable energy can potentially benefit from lower energy costs and/or lower taxes.
According to the World Resource Institute’s 2011 study50 of SV-REP and TCSP, quantifiable benefits from utilizing a GPI included the following:
10 percent to 15 percent reduction in energy cost, in comparison to individual projects;
75 percent reduction in transaction and administrative time for GPI participants; and
More competitive contract terms.
California County staffs involved in GPIs maintain that renewable energy procurement initiatives are relatively inexpensive to start and generate significant economic benefits, including in some cases tens of millions of dollars in new local economic activity, hundreds of jobs, and reduced electricity costs.51
Larger projects will also have a bigger impact on the local economy through direct spending and economic stimulation, as well as workforce development. Larger projects also have a greater environmental impact, helping to reduce human-induced climate change and to meet community environmental goals.
5.9.1.3. Components of a Group Procurement Initiative
5.9.1.3.1. Ownership
Through a GPI, a third party generally owns the property. A third party private sector vendor typically constructs and owns the renewable technology, which is solar photovoltaics (PV) in most cases. In a GPI, government staff negotiates the terms of the energy supply with an energy provider.52 A government entity
50 For a more complete read of the two case studies, see WRI’s report Purchasing Power: Best Practices Guide to Collaborative Solar Procurement (2011). The report is complete with a 12-step process with detailed instructions and sample RFP and bid documents. 51 Matt’s TAC meeting comments, meeting number two. 52 A GPI is just one of several ways public entities can procure electricity from renewable energy technologies. With the Community Choice Aggregation (CCA) model, the CCA management team negotiates final project costs and implementation time tables.
1 - 169
will typically purchase the power produced from these sources. Some governments can install the technology directly on their own property and use the energy produced from it, while other local governments may not need the power but can sell it to those who do.
5.9.1.3.2. Participants and Internal Leadership
Establishing a new GPI requires a collaborative effort among numerous stakeholders and participants. In this approach, participants are defined as the public agencies buying the renewable energy technology. Participants in past projects have included counties, municipalities, and districts. Site hosts have included hospitals, community centers, libraries, fire stations, and schools. Because regional collaborative teams often become large, complex, and operate out of multiple locations, strong leadership and project management are imperative.
San Diego County can consider the three-tiered leadership team that Alameda County developed for its GPI project. The leadership team consisted of conveners, a lead agency, and a steering committee.
Conveners are responsible for coordinating the project and outreach to the outside stakeholders. Conveners bring the stakeholders together, facilitate communication, and protect the stakeholders’ interests. While it is recommended that the conveners have interests in renewable energy and economic development, generally it is advised that they should not have any financial interest in the project. Conveners are often renewable energy and economic development nonprofit organizations.
The lead agency is a participant that has the motivation and capability to purchase the renewable energy technology and sees benefit in both developing a collaborative project and taking a leadership role for its own financial benefit, as well as for the benefit of the region. The lead agency leads the procurement and purchasing process and acts as an intermediary between the conveners and the other participants.
The steering committee is a local leadership team that oversees the project and provides guidance and relevant regional input. The committee is comprised of municipal government staff, business development non-profits such as the local Economic Development Corporation, interested organizations, and people with renewable energy project experience.
Participants might also find it useful to employ technical, financial, and legal consultants if the team does not have certain needed skills or experience. Consultants have been used to assess technology and vendors, assess site feasibility and site bundling, analyze the project economics, design project financing, evaluate bids, manage procurement, and to manage the legal aspects of the project.
5.9.1.3.3. Vendors
Vendors are the for-profit companies providing, building, and installing the renewable energy technology.53 Large projects tend to attract more vendors, which can be beneficial for competitive bidding and for ensuring project quality. Large projects can also involve the participation of multiple vendors. Vendors can be selected and matched by installation type or site bundling. As a way to reduce vendor risk while employing both large national and small local vendors, the county can bundle the installation sites per
53 Examples of vendors in the County of San Diego include Solar City or Soitech for a solar PV projector and Vestas for a wind project.
1 - 170
vendor. Strategic site bundling is a process by which installations are grouped by size, installation characteristic, and proximity. This approach allows for the ideal vendor to be matched to the ideal installation project and site. Depending on the project, each bundle contains a certain number of installation sites, grouped accordingly. Past GPI projects have found value in using national vendors for their expertise and capability for the larger installations, and local vendors for the smaller installations (Bloede 2014). As part of this Best Practice, the lead agency will release a Request for Information (RFI), so vendors can market their benefits and strengths appropriately.
5.9.1.3.4. Workforce Development
Most of the jobs created around a large renewable project are created on the vendor side. Of the non-vendor jobs, typically about one-third of the local jobs will last longer than one year (Bloede 2014).These roles include operations and maintenance, finance and accounting, and other “back office” support jobs. Local jobs that last less than a year are most often construction-based jobs, including labor and installation. Andy Hall, Director of Adult Programs for the San Diego Workforce Partnership, reported recently that most short-term solar-related jobs are taken in the San Diego region by unemployed construction workers, effectively cancelling any skills gap that might occur otherwise, for now (Hall 2014).
5.9.1.4. Structure and Budget (Costs)
5.9.1.4.1. Cost of GPI Initiation and Coordination
While the cost of a GPI is contingent on the size and complexity of the project, initiating one can be relatively inexpensive for a county. The best estimate of initiating and coordinating a project is 1/2 FTE for the first three months, then 10 hours per month for the remaining one to three years (Bloede 2014). Without considering the technology capital costs and the time spent by county employees to implement a larger renewable energy GPI project, additional costs can include technical, financial, and legal consultants to ensure the success of the project and protect the interests of the county.
5.9.1.4.2. Financing A GPI Project
Aside from the County of San Diego owning the renewable energy technology outright, one of the most common ways to finance a larger renewable energy GPI project in the County is through a power purchase agreement (PPAs). A PPA is a funding mechanism in which a third-party developer finances, owns, operates, and maintains the renewable energy generating technology for the County. While the host (County) would not own the power generation, it benefits from a long-term, stable, low-cost, clean-energy contract. PPAs are ideal for cash-poor participants, as cash is not required upfront nor is the participant required to pay for operations and maintenance. The downside is not having the long-term economic benefit of ownership.
Other financing options were discussed in detail in this report (Section 4) and can include cash, low-interest loans (private and public), grants, and government issued bonds.
5.9.2. Application to San Diego County (Recommendations)
5.9.2.1. Existing Context
The GPI approach has been successfully adopted and advocated by numerous counties, municipalities, nonprofits, and for-profit entities (Donalds 2014).54 California counties such as Santa Clara, Alameda,
54 The Association of Bay Area Governments manages “ABAG POWER” (ABAG Publicly Owned Energy Resources), a separate joint powers agency that serves as a non-renewables GPI. ABAG POWER's primary goal in starting the program more than a decade ago was to conduct pooled purchasing of natural gas and electricity on behalf of local governments
1 - 171

Contra Costa, and San Mateo and municipalities such as Cupertino, Menlo Park, Oakland, Berkeley, and Mountain View have successfully utilized GPI as a way to accelerate regional clean energy adoption.
5.9.2.2. Next Steps
Executing a successful collaborative GPI is dependent on good leadership and regional support. Multiple organizations will have to step forward and lead the effort.
If the County participates in a Regional Energy Network (REN) in the future, the REN is an ideal convener for a GPI. These organizations will be required to have vision, dedication, and be willing to work hard to see the project through. Regionally, there must be a strong interest and commitment among all the participants in acquiring renewable energy.
It is crucial for the County to collaborate with local workforce development agencies to maximize job training partnerships with community colleges and related groups that focus on long-term career paths and industry-recognized, portable credentials.
5.9.3. Who Else Is Doing It
The following table outlines the counties and cities that have participated in a collaborative renewable energy GPI initiative. The Silicon Valley Renewable Energy Project (SV-REP), led by the Joint Venture Silicon Valley Public Sector Task Force and Santa Clara County, was California’s first large-scale public renewable energy procurement initiative. It was built on the private sector’s pioneering Collaborative Solar Project (TCSP), and led by the World Resource Institute. The EPA Green Power Partnership endorsed the SV-REP as a model for increasing the country’s clean energy supply. The Renewable Energy Procurement (R-REP) project that started later improved upon the lessons learned during SV-REP. The two projects, SV-REP and R-REP, are the largest multi-agency procurements of renewable energy in the country to date.55
and special districts that voluntarily join a Pool. ABAG POWER was principally interested in aggregating local government loads only. The Pool is currently purchasing natural gas for 39 local governments and special districts in the Bay Area. The goals of the natural gas purchasing pool are price stability and cost savings. The Program attempts to provide gas procurement services for less than the equivalent services provided by the default provider, the PG&E Company. ABAG POWER used to have an electric aggregation program. However, in September 2001 the California Public Utilities Commission (CPUC) suspended all new electric aggregation programs (ABAG). 55JVSV. (2015). "Renewable Energy Procurment (REP)." from http://www.jointventure.org/index.php?option=com_content&view=article&id=1108&Itemid=727.
1 - 172

TABLE 5-9. Renewable Energy Procurement Initiatives
Projects Participants Technology Mega Watts56
# Installation Sites
Economic Benefits
TCSP
The Collaborative Solar Project
(2008-09)
Hewlett Packard, Intel, Staples, Wal-Mart in California
Convener: World Resources Institute (private sector only collaborative)
Solar PV 6.2-8.0 MW
19 N/A
SV-REP
Silicon Valley Renewable Energy Project
(2009-12)
County of Santa Clara, Cities of Milpitas, Cupertino, Morgan Hill, Pacifica, Mountain View, Los Gatos, Santa Clara Valley Transportation, South Bayside Waste Management Authority, Convener: Joint Venture Silicon Valley Public Sector Task Force (reps from 50 Silicon Valley cities)
Solar PV 14.4 MW 70 $70M in local economic activity and 300 jobs created
R-REP
Regional Renewable Energy Procurement
(2011-14)
Counties of Alameda, Contra Costa, and San Mateo, Cities of Berkeley, Cupertino, Emeryville, Foster City, Fremont, Menlo Park, Mountain View, Oakland, Redwood City, Richmond, and Walnut Creek, Alameda County Fire Department, Castro Valley Sanitary District, Central Contra Costa Sanitary District, Hayward Area Recreation and Park District, Berkeley Area Recreation and Park District, Conveners: Joint Venture Silicon Valley and Contra Costa Economic Partnership
Solar PV, solar thermal, and fuel cell
20-50 MW
186 $200M plus in local economic activity and 839 jobs created
56 A megawatt is a unit of measuring power that is the equivalent of one million watts. One megawatt is equivalent to the energy produced by 10 automobile engines. A typical power plant can generate 1,000 megawatts CEA. (2010). "What is a Megawatt and a Megawatt-Hour." Solar Resources, from http://www.cleanenergyauthority.com/solar-energy-resources/what-is-a-megawatt-and-a-megawatt-hour/.
1 - 173

5.10. Participate in the Creation of a New Regional Energy Network (REN)
5.10.1 Overview
First introduced in California in 2012, Regional Energy Networks (RENs) were designed to give local governments more flexibility and independence in managing rate-payer funded energy efficiency programs. The CPUC requested proposals from local groups to submit applications for two pilot RENs in the state in May 2012. Proponents argued to the California Public Utilities Commission that RENs would lead to an increase in total energy savings by increasing the participation and influence of local governments, including those that have traditionally not participated in utility-sponsored programs.
The CPUC provided these groups with the opportunity to demonstrate their models of managing local energy programs beyond what they could traditionally do through Local Government Partnership (LGP) programs. The LGP is a statewide program funded through the CPUC, in which local governments sign contracts with their investor-owned utility to implement energy efficiency programs over this time period as part of the LGP.57 For 2013-2014, SDG&E provided more than $13 million in funding support for five Local Government Partnership programs, included the County of San Diego, City of San Diego, City of Chula Vista, the Port of San Diego, and the 16 additional municipalities that SANDAG offers services to (CPUC 2014).
Though San Diego does not have a REN, it is not a newcomer in regards to regional energy planning. San Diego had one of the first regional energy offices in the country, the San Diego Regional Energy Office. First formed in 1996,
57 Between 2009 and 2012, more than 3.1 billion in ratepayer funds were directed to energy efficiency programs, including the LGP. Report to the San Diego City Council: The CPUC Local Government Partnership Program, October 28, 2009.
CREP-Related Options for the County of San Diego
Approach the CPUC as a third pilot REN as planned with SANDAG as lead, but also evaluate opportunities for a new County-led renewable energy focus as supplement. When developing the REN, identify opportunities for the County to receive renewable energy program funds through the organization separately (while keeping with the spirit and intent of the new REN). Exclude specific renewable energy programs that the County is already pursuing from the REN (i.e., the County may want to lead on specific programs and this is one way to help guarantee that possibility). Continue to participate in REN development opportunities in the San Diego region.
Definition
A Regional Energy Network (REN) is a formal collaboration between local governments, in which they act as energy efficiency program administrators. A REN is eligible to design and implement energy efficiency programs, and can submit proposals directly to the California Public Utilities Commission (Local Government Commission, 2012). REN programs are designed to supplement, not supplant existing efforts of investor-owned utilities (IOU).
There are currently two official pilot RENs in the State of California, the BayREN and the SoCalREN.
1 - 174

the San Diego Regional Energy Office served primarily as the strategic energy planning arm of the San Diego Association of Governments (SANDAG). It later became the California Center for Sustainable Energy in 2007 to reflect a growing involvement throughout the state.58
5.10.1.1 Definition
A Regional Energy Network (REN) is a formal collaboration between local governments in which they act as energy efficiency program administrators. A REN can submit proposals directly to the California Public Utilities Commission (CPUC), and are eligible to design and implement energy efficiency programs (Local Government Commission, 2012). Importantly, in May 2012 the CPUC agreed to fund two pilot regional energy networks (RENs) in 2013-2014, the BayREN and the SoCalREN.
These REN pilot programs supplement (but do not replace) existing utility programs, and they are designed to do the following:
Leverage local and regional expertise and resources;
Serve as regional incubators for innovative programs;
Reach markets not covered by existing programs; and
Demonstrate their success for broader adoption in the future.
5.10.1.2. Value Proposition & Benefits
The national trend toward regional energy planning over the last two decades involved local governments attempting to gain more control of not only their energy generation sources but also the management of energy programs run by investor-owned utilities (IOUs) in their territory. The stakes are high: California’s three major IOUs spend nearly 1 billion dollars annually on energy efficiency programs (CPUC 2014).59
Both the SoCalREN and BayREN projected deeper energy efficiency savings through their programs as compared to IOU Local Government Partnership (LGP) programs. Higher savings projections were favorable in both RENS’ successful funding efforts as the CPUC is very interested in minimizing duplication with existing IOU energy efficiency programs. REN programs are designed to supplement, not supplant existing IOU efforts, which the County should keep in mind.
Regional energy organizations withstood a better chance of receiving local government federal stimulus dollars exceeding $3.2 billion distributed between 2008 and 2010 (Colorado Energy Group 2012).
The proposed benefits of a Regional Energy Network include the following:
Effective, formal platform for multiple local government energy programs that benefit from regional consistency and scale;
Potential for more renewable energy- and energy efficiency-related funding for the County;
58 The Center for Sustainable Energy dropped “California” from its name in 2014 to reflect an expanding role throughout the country in supporting the adoption of clean and renewable energy technology. 59 The CPUC approved $1.1 billion dollars for the 2013-2014 energy efficiency budgets of 5 four IOUs (SCE, SCG, PG&E, and SDG&E) and 2 RENs (SoCalREN and BayREN). Each utility presented its 2015 energy efficiency portfolio filings at Phase I of Rulemaking 13-11-005 Workshop on Program Administrators' Proposed 2015 Energy Efficiency Portfolios on March 17th, 2014. For individual presentations, visit www.cpuc.ca.gov.
1 - 175

Potential to raise energy funds outside of traditional IOU channels with greater ease;
More efficient use of County energy staff time (essentially requiring less hours for the same or greater impacts);
Future dividends from goodwill generated and peer exchange benefits;
Formalize the County’s commitment to energy-related goals and objectives related to important initiatives such as the CREP, the Strategic Energy Plan (SEP), and the Climate Action Plan (CAP) among others;
Bring more best practices and local innovation into the County from increased interaction with other local governments;
Carry an independent, strong voice that may be taken more seriously at the state or federal level;
Less duplication among jurisdictions and stretching limited energy-related dollars farther; and
County can help develop governing structure and goals through early, active involvement in REN establishment.
5.10.1.3. Function of a REN
The two pilot RENs are administered by regional planning agencies and council of governments (i.e., ABAG and SCAG).60 Like IOUs, RENs are subject to oversight by the CPUC in requesting authorization for their energy efficiency budgets. BayREN and SoCalREN will need to demonstrate cost-effectiveness in order for the CPUC to consider extending RENs beyond the pilot stage. RENs are increasingly involved in Climate Action Plan (CAP) and related program implementation, especially energy efficiency programs.
The 2012 CPUC decision advised that any proposed REN pilot proposal should meet the following criteria:
Demonstrate that any proposed REN represents a broad geographical area that encompasses a variety of demographic characteristics with a depth and breadth of coverage toward its energy efficiency program goals and objectives; and
Demonstrate that any proposed REN serves as a deep retrofit program that will achieve deep energy efficiency savings.
5.10.1.3.1 Further REN Criteria and Programming
The 2012 CPUC decision that created two pilot RENs specified five desirable energy efficiency program criteria to be included in a REN. All five of these criteria also could figure prominently in a CREP, and may be integral parts of a REN application:61
Leverage additional state and federal resources so that energy efficiency programs are offered at lower costs to ratepayers;
60 BayREN is set up with ABAG as the fiscal agent and contractor. The Coordinating Committee includes representatives from the nine counties that BayREN serves. Whereas the Coordinating Committee is strictly concerned with governance, the Technical Executive Committee is responsible for programmatic, regulatory, and reporting activities. These two committees are also a platform for sharing information and knowledge among the participant counties and cities of BayREN (BayREN, 2014). 61 The authors assume that any REN application will be led by SANDAG, and not the County.
1 - 176

Address the water/energy nexus;
Develop and deploy new and existing technologies;
Address workforce training issues; and
Address hard-to-reach customer segments, such as low- to moderate-income residential households and small- to medium-sized businesses. (Meis 2012)62
Programs run by the two California pilot RENs currently include:
Revolving (energy) loans;
Education and outreach programs;
Technical assistance;
Marketing support;
Energy code compliance;
Green building certification;
Low- and moderate-income energy efficiency;
Multifamily buildings;63
Bundled residential retrofit incentive programs; 64 and
Workforce training programs.
5.10.1.4. Structure & Budget (Costs)
To help County of San Diego officials with REN discussions, the budgets for both REN pilots are provided below.
TABLE 5-10. SoCalREN and BayREN Budgets (2013-2014)
SoCalREN Projected Totals of 4 Subprograms, by Calendar Year
2013 2014 Total
Admin ($) 1,954,945 1,954,945 3,909,890
General overhead ($) 0 0 0
Incentives ($) 118,039 118,039 236,078
62 Central California Local Government Partnership Presentation, “Regional Energy Network Overview,” Kate Meis, Local Government Commission, September 2012. 63 As of January 2015, the BayREN Multifamily program reported 8,384 completed units, totaling $6.2 million in rebates (BayREN, 2015). Visit www.BayREN.org for monthly program update reports. 64 BayREN administers the Energy Upgrade California Home Upgrade and the Advanced Home Upgrade Assessment across the nine counties of San Francisco Bay Area (BayREN, 2015).
1 - 177

Direct Install Non Incentives ($) 13,620,923 13,620,923 27,241,846
Marketing & Outreach ($) 2,706,256 2,706,256 5,412,512
Education & Training ($) 0 0 0
Total Budget 22,400,164 22,400,164 44,800,328
Source: (SoCalREN 2014)
BayREN Projected Totals of 4 Subprograms, by Calendar Year
2013 2014 Total
Admin ($) 786,502 793,528 1,580,030
General overhead ($) 0 0 0
Incentives ($) 1,650,450 6,248,250 7,898,700
Direct Install Non-Incentives ($) 5,489,429 6,652,011 12,141,440
Marketing and Outreach ($) 1,968,790 1,660,790 3,629,580
Education and Training ($) 656,643 661,357 1,318,000
Total Budget 10,551,813 16,015,937 26,567,750
SOURCE: (PG&E 2012)
5.10.1.4.1 Challenges to Creating a REN
Getting all members of the REN behind a new initiative can require extensive time and political capital.65 Pressure to join and/or participate in programs supported by other local jurisdictions is likely to be more intense, thus making it harder for the County to dissent without losing political capital. It will take significant time to develop program implementation plans that all parties, and the CPUC, agree to in the beginning. The SoCalREN was developed after two full years of collaboration between governments and others in the REN process. The BayREN and SoCalREN are pilots; there is no guarantee that they will be around in the future. Therefore, a huge amount of labor could be utilized setting up a REN only to have the CPUC decide to abandon the concept.
San Diego County would need to conduct comprehensive analysis of what the REN organizational and governing structure would be, as well as program areas and goals. If structured like the other two California RENs, renewable energy programs would be outside the focus of the organization. Existing RENs
65 Though the CPUC (“the Commission”) began accepting proposals in May 2012, the configuration of governments that formed BayREN originally coalesced for Energy Upgrade California in 2010. Funded by the American Reinvestment and Recovery Act (AARA) until March 2012, this coalition did not receive formal approval by the Commission until late 2012 (BayREN, 2014).
1 - 178
currently target only energy efficiency and do not address opportunities to advance renewable energy. An extra administrative burden can be expected for REN staff, since accountability to the CPUC for energy programs is likely to be more time-consuming and demanding than under the existing LGP. Showing the CPUC that REN programs are cost-effective and meet identified energy savings and emissions reductions will likely be a more labor-intensive process for municipal REN proponents (and/or SANDAG were it to house the REN) than that currently required by SDG&E through the LGP.
In the short term, existing multi-jurisdictional energy projects and programs would probably need to be reshuffled, and reorganized. This may result in delays, duplication, and/or indecision at times. Furthermore, the existing LGP program may be adversely impacted; the County should take steps to evaluate exactly what components of the LGP it wants to see remain (or emulated through the REN) after the new REN is established. The REN may slow down decision-making processes within the County in the long term, since an extra layer of bureaucracy has been created. A REN can be an extra buffer between citizens and government, perhaps providing an unnecessary extra layer of bureaucracy between the County and those it serves.
Perhaps most importantly, the proposed REN involving San Diego County would be the only one-county REN in the state. As a result, a substantial administrative or financial burden may be placed upon the County. Given the smaller proposed scale of this new REN proposal, the benefits and costs need to be carefully analyzed by the County.
5.10.2 Who Else Is Doing It
The BayREN is run by the Association of Bay Area Governments (ABAG) and consists of the nine San Francisco Bay Area counties (Alameda, Contra Costa, Marin, Napa, San Francisco, San Mateo, Santa Clara, Solano, and Sonoma). BayREN was awarded $26 million to expand the single-family Energy Upgrade California program, implement a comprehensive multi-family building energy efficiency program, and oversee programs for single and multi-family buildings, as well as provide codes, standards enforcement, and training programs.
The SoCalREN is run by the County of Los Angeles, and received $41 million to expand the Energy Upgrade California program and to develop energy efficiency financing programs, as well as to expand the existing Southern California Regional Energy Center (SoCalREC) Pilot to the entire region. The SoCalREN region includes Los Angeles, Orange, Ventura, Santa Barbara, Riverside, San Bernardino, Kern, Tulare, Inyo, and Mono counties.
Please note that these two RENs only manage IOU energy efficiency programs, and are not involved in IOU renewable energy programs typically.
1 - 179
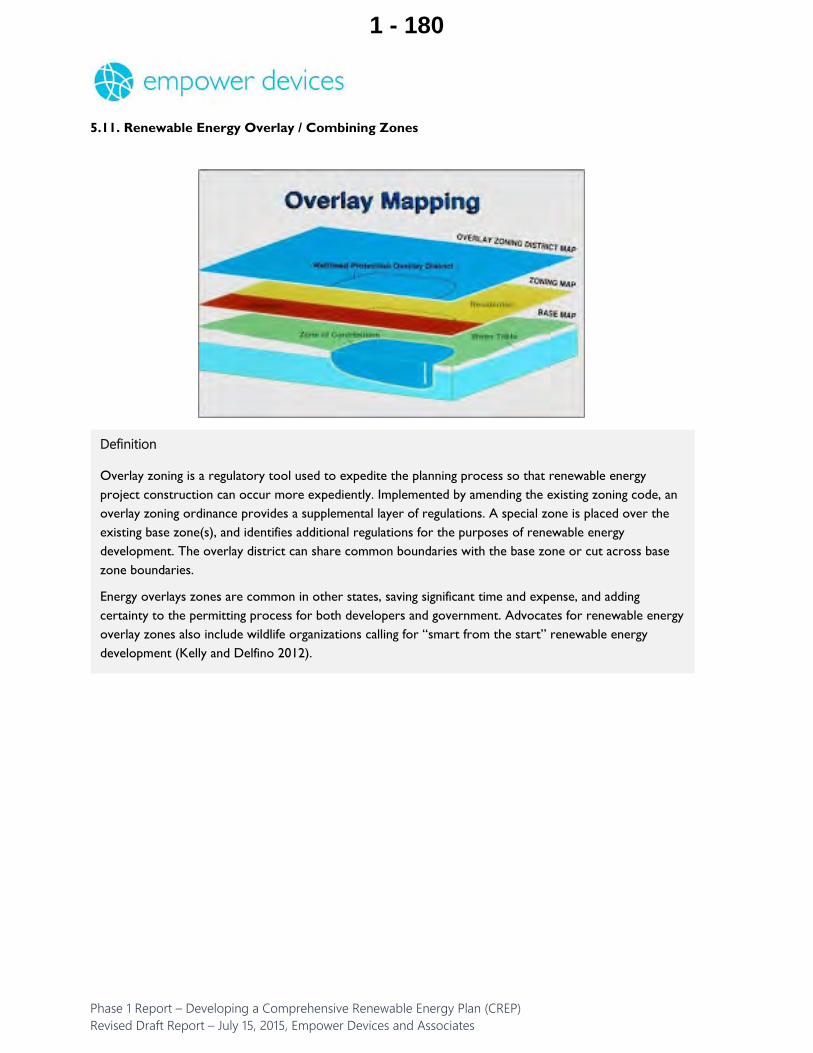
5.11. Renewable Energy Overlay / Combining Zones
Overlay zoning is a regulatory tool used to expedite the planning process so that renewable energy project construction can occur more expediently. Implemented by amending the existing zoning code, an overlay zoning ordinance provides a supplemental layer of regulations. A special zone is placed over the existing base zone(s), and identifies additional regulations for the purposes of renewable energy development. The overlay district can share common boundaries with the base zone or cut across base zone boundaries.
Energy overlays zones are common in other states, saving significant time and expense, and adding certainty to the permitting process for both developers and government. Advocates for renewable energy overlay zones also include wildlife organizations calling for “smart from the start” renewable energy development (Kelly and Delfino 2012).
1 - 180

5.11.I. Overview
5.11.1.1. Definition
While the concept of an overlay zone has been used for many years for a variety of land use planning activities, its use for renewable energy development planning is relatively recent (Commerce 2011).66 Overlay zoning is a regulatory tool used to expedite the planning process for renewable energy project construction.67 To be certain, overlay zones can help speed-up the permitting process by saving time for both developers and County staff. However, developers will still need assurance that their submittals meet requirements of underlying zones. Without this feedback, overlay zones can have the opposite effect on developers by creating more administrative requirements.
Implemented by amending the existing zoning code, an overlay zoning ordinance provides a supplemental layer of regulations. A special zone is placed over the existing base zone(s), and identifies additional regulations, in this case, for the purposes of renewable energy development. The overlay district can share common boundaries with the base zone or cut across base zone boundaries.
5.11.1.2. Benefits & Costs
Creating an overlay zoning amendment is an alternative to the existing piecemeal approach of re-writing the original zoning code to approve a specific use in a particular area; the existing method is costly in time and expenses for a municipality.
Imperial County is one of the few counties in California with an Energy Overlay Zone (Alex and Morgan 2012).68 Notably, the zone acts effectively as a holding zone pending69 future CEQA/Environmental Impact
66 California Government Code Section65850. 67 At the first CREP Technical Advisory Committee (TAC) meeting, three members expressed a strong interest in replicating a Renewable Energy Overlay/Combining Zone in some of the unincorporated portions of the County of San Diego through the CREP process. 68 Some of the interest in overlay zoning from the CREP TAC Committee was traced to recent overlay zoning efforts within Imperial County where there has been a significant push for renewable energy development opportunities in recent years. Imperial County received a California Energy Commission grant on July 15, 2013, to update the Renewable Energy and Transmission Element of its General Plan and to develop a Renewable Energy Ordinance to implement its policies and priorities. Funds were used to develop an inventory of baseline date, review opportunities for developing
Criteria for delineating a renewable energy overlay zone must be straightforward and align with the County’s various renewable energy and land use goals. The steps to develop a renewable overlay zone are:
Define the purpose of the overlay zone district (supporting renewable energy development);
Identify the areas that make up the overlay zone district; and
Develop specific rules that apply to the identified overlay zone district (specify the streamlined permitting process, if applicable, and expectations of the developers and the County).
1 - 181
Reports (EIRs). A very large majority (92.3 percent) of respondents to the California Office of Planning and Research’s (OPR) survey said the reason they have not pursued an energy overlay zone is because of lack of funding.70 Respondents also noted that the expected average cost of creating an Energy Overlay Zone was $100,000, with a maximum of $250,000.
Energy overlay zones are common in other states, saving significant time and expense, and adding certainty to the permitting process for both developers and government. A 2010 analysis of eight case studies in Washington State found that predefined mitigation through an energy overlay zone was estimated to have saved private developers between $8.8 million to $35.2 million, and public developers from $2.8 million to $11 million in opportunity costs (Commerce 2011).
Tim Snellings, Butte County Director of Development Services and former President of California County Planning Directors’ Association (CCPDA), commented:
An energy overlay provides an incentive by reducing planning process time and by providing more certainty to investors. It saves the developer and the government money, but how much is unclear. Regardless of how much it saves, it sends a signal to investors that the County wants to see solar photovoltaics in these locations (Snelling 2014).
Advocates for renewable energy overlay zones range from developers interested in saving time and money to wildlife organizations, such as the Washington, D.C.-based Defenders of Wildlife. Defenders of Wildlife advocate for establishing renewable energy combining or overlay zoning districts, or siting criteria to incentivize “smart-from-the-start” renewable energy development (Kelly and Delfino 2012). The organization supports overlay zones because the zones can be used to strike an important balance between addressing the near-term impact of industrial-scale renewable development on wildlife and wild lands, and the long-term impacts of climate change on biological diversity, fish and wildlife habitat, and prime agricultural lands. While Defenders of Wildlife’s 2012 report focuses on incentivizing the siting of renewable energy projects within the San Joaquin Valley, the information within the document can be broadly applied to renewable energy development within the County of San Diego.
5.11.1.3. Functions of an Overlay Zone
Through an overlay zone, the County could allow for renewable energy development projects in specific areas and effectively set minimum site requirements within the overlay zone while addressing concerns over agricultural lands, water, wildlife issues, transmission lines, and others. Public comment would still be required with an overlay zone, but the new process allows County officials and developers to avoid much of the economic uncertainties that characterized the process before an overlay zone existed.
5.11.2. Application to San Diego County (Recommendations)
5.11.2.1. Existing Context
While overlay zones can be regional or statewide, most overlay zones are used at the city or county levels (Miskowiak and Stoll 2005). Most local governments in California do not currently have zoning codes that
various renewable energy resources, develop an outreach program, prepare the revised ordinance and renewable energy overlay zone, and prepare the Project Environmental Impact Report (PEIR). 69 A holding zone is often used for an area going through a rezoning process. Such an area can temporarily be deemed a low-density zone until the final rezoning ruling has been made. (source: definitions.uslegal.com) 70 OPR reported an 87 percent overall survey response, but only 22 of 58 respondents answered this question.
1 - 182

are specific to renewable energy projects or facilities, and those that do, have enacted overlay zoning in many cases. Municipal governments still have to go through the process of adopting the overlay zone ordinance, which requires consistency with the General Plan, public hearings, and Program Level EIRs (Snelling 2014). Regulations and requirements specific to the overlay zone can address community priorities such as permitting, environmental protections (air, water, and wildlife), avoidance of prime agricultural lands, proximity to available utility infrastructure, and adjacency to distributed generation (DG) users.
5.11.2.2. Next Steps
Counties still need to amend their zoning ordinances to include the prescribed use of an overlay zone as well as address any impacts in its Program Level EIR.
The establishment of a renewable energy overlay zone requires three primary steps:
Define the purpose of the overlay zone district (supporting renewable energy development);
Identify the areas that make up the overlay zone district; and
Develop specific rules that apply to the identified overlay zone district (specify the streamlined permitting process, if applicable, and expectations of the developers and the County).
To be perceived as fair, all properties within the renewable energy overlay zone need to be treated equally, and the criteria for delineating the zone should be straightforward and aligned to County energy and land use goals.
5.11.3. Who Else Is Doing It
Much of the energy-related overlay zone activity in recent years has taken place in the southwestern United States, especially California and Arizona. Washington State is also known for its emphasis on energy overlay zones.
5.11.3.1. Gila Bend, Arizona
Gila Bend uses a Solar Field Overlay Zone (SFOZ), which the Planning Director characterizes as “soft zoning” (for utility scale solar power development) on top of existing “hard zoning” (of agricultural land which is no longer being utilized for farming). The County uses the SFOZ primarily for utility scale solar projects and benefits greatly from having interstate transmission line capacity nearby. Gila Bend officials state that the SFOZ shortens the permitting time by not requiring any general plan or comprehensive amendments, and not requiring duplicative environmental reviews. According to Gila Bend officials, the SFOZ is the, “fastest entitlement/engineering process in the nation,” with the turnaround from application submission to council approval in as little as four weeks (Fitzer and Smith).
5.11.3.2. Tucson, Arizona—Sonoran Model Overlay Ordinance (2013)
The Sonoran Model Overlay Ordinance serves a good example of how to address habitat issues around renewable energy projects. The Sonoran Institute drafted the Model Overlay Ordinance to help local jurisdictions in the Morongo Basin protect natural landscapes and wildlife habitat corridors, the boundaries of which do not necessarily follow the boundaries of existing zoning districts. Importantly, the Model Overlay Ordinance does not propose to change the existing permitted uses or development densities within a jurisdiction’s zoning districts. Rather, it sets forth design standards, construction requirements, best practices, and incentives to minimize habitat disturbance and reduce land fragmentation that results in adverse impacts to connectivity and habitat for treasured native desert species.
1 - 183

5.11.3.3. Sonoma County, California (2013)
In October 2013, the County of Sonoma, California, adopted changes to its zoning code. The changes implement the resource conservation policies of the County’s General Plan to provide for widespread use of renewable energy through distributed generation and increased opportunities for renewable energy power producers.71
5.11.3.4. Klickitat County, Washington (2005)
In 2005, Klickitat County in Washington State adopted an Energy Overlay Zone (EOZ) using a process modeled after the state’s Planned Action process for the Washington State Environmental Policy Act (SEPA)—the equivalent of the California Environmental Quality Act (CEQA). The process is clear and straightforward, and could work in the County of San Diego. It provides a fair amount of predictability for county elected officials and staff, citizens, developers, and investors.72 The Klickitat County EOZ process takes approximately six months and is processed administratively (although the developer is required to conduct one community meeting).73 The EOZ process appears to be more efficient and less costly overall in Klickitat County than the pre-existing licensing process with the state agency, Energy Facility Site Evaluation Council (EFSEC). It is worth noting that in Klickitat County there have been no applications requesting review through the EFSEC process rather than the local EOZ. This process has also allowed local control to remain with the county.
5.11.3.5. Inyo County, California (2010)
In Inyo County, California, a General Plan Overlay was developed and adjusted through an iterative process, based on input from interested parties (public officials, members of the public, alternative energy developers, public agencies, the U.S. Military, local tribes, and others) and a series of public outreach meetings. Through an extensive public engagement effort, General Plan Land Use Diagram Overlay maps were designed, refined, and updated iteratively. The General Plan Land Use Diagram Overlay maps now show areas where it may be appropriate to develop renewable wind and solar energy projects based on a more comprehensive set of criteria (Department).
As is currently the case in the County of San Diego, a variety of planning efforts led by State and Federal agencies, and directed at alternative energy development were already underway prior to the development of the Inyo County General Plan Overlay. These include, but are not limited to: the Renewable Energy Transmission Initiative (RETI); Desert Renewable Energy Conservation Plan (DRECP); Bureau of Land Management (BLM) Environmental Impact Statements for Wind, Geothermal, Energy Corridors, and Solar; and the State of Nevada’s Renewable Energy Transmission Access Advisory Committee.
71 This effort was funded in part by an American Recovery and Reinvestment Act (ARRA) grant from the U.S. Department of Energy. Metrics surrounding this initiative were requested, but were not provided by the County. 72 Klickitat County requires submittal of an expanded SEPA checklist, as well as site-specific studies for impacts to habitat and wildlife (including avian impacts), cultural resources, and a grading and storm water management plan. In addition, EOZ projects must meet established development, use, and construction standards, including specified setbacks and standards related to noise, air quality, vegetation and wildlife, storm water, geologic and flood hazards, water resources, cultural resources, visual resources, and public safety. For more information, read Energy Overlay Zones, A Report Prepared to Support the 2010/2012 State Energy Strategy, Department of Commerce, Washington State, October 2011. 73 According to the Energy Facility Site Evaluation Council (EFSEC), a state agency that coordinates all of the licensing and evaluation for major energy facilities, its review process takes a minimum of 14 months and requires a final decision by the Governor.
1 - 184

5.12. Building Energy Disclosure
5.12.1. Overview
Policies that drive energy efficiency improvements in buildings provide opportunities for the County of San Diego to make significant strides in greenhouse gas (GHG) reductions and to reduce electricity use. In 2012, approximately 10 percent of total US GHG emissions were generated from residential homes and businesses (EPA 2014). The
CREP Related Options for the County of San Diego
Incorporate building water efficiency data into potential disclosure policies Take inventory of the number and types of commercial buildings in the County and research the potential impact that incentives play in disclosure policies Start and maintain a database of public and private sector building energy performance to aid in identifying opportunities to cut GHG emissions Reward public disclosure of building energy consumption through a County-led contest Follow building disclosure developments in San Francisco and Berkeley
Definition
Building energy disclosure involves the analysis and documentation of a building’s energy performance as a way to drive improvements in energy efficiency and reduce energy use. One of the major goals of this policy is to incorporate a home or commercial building’s energy performance into its overall value.
There are three main types of building energy disclosures:
An asset rating is the most rigorous, transparent, and most expensive type of building energy disclosure. A building is assigned a performance index on computer simulations of its architectural and system characteristics combined with results from onsite diagnostic testing. Asset ratings use standardized weather and occupancy conditions so that a building’s energy performance is normalized and can be compared quantitatively with other buildings.
An operational rating uses metered energy and water use data to compare usage trends as well as consumption against other buildings, and compares this data via benchmarking. Benchmarking is a preferred method of disclosure for large multi-use residential and commercial buildings because acquiring an asset rating for these types of buildings can be expensive and complicated.
A Residential Energy Conservation Ordinance (RECO) requires a homeowner to achieve minimum residential energy and water efficiency requirements such as attic insulation, hot water heaters, appliances and air-conditioning systems when conducting an extensive remodeling project and/or before their home can be sold. Similarly, a Commercial Energy Conservation Ordinance (CECO) requires an energy analysis and disclosure of results.
1 - 185

California Air Resources Board estimates statewide emissions from the buildings sector to be 12 percent, a percentage point higher than GHG emissions from electricity generated in the state (EPA 2014).
5.12.1.1. Definition
Building energy disclosure involves the analysis and documentation of a building’s energy performance as a way to drive improvements in energy efficiency and reduce energy use. For large building owners (including the County), ongoing analysis allows them to “benchmark” energy use and compare their building to similar buildings and the use of other technologies. One of the major goals of this policy is to incorporate a home or commercial building’s energy performance into its overall value. Of all the energy efficiency policies available to the County of San Diego, building energy disclosure is already consistent with many existing policies, and is one of the best suited to leading by example.
5.12.1.2. Value Proposition & Benefits
Building owners, buyers, and sellers can benefit from greater transparency of building performance data. Wielding information of energy consumption-related costs, building owners can make more informed decisions on cost-effective improvements. Home sellers benefit by being able to distinguish themselves from similar homes on the market. A recent study in Portland, Oregon, found that homes with a home energy rating or efficiency certification (such as EPA Energy Star Home) commanded a price premium of 8 percent (Cluett and Amann 2013). Though premiums for commercial buildings have increased, they are harder to quantify because of the great range of sizes and uses.
A building’s energy efficiency can be reported or disclosed periodically or when rented or sold. Building energy disclosure is particularly beneficial in the commercial sector as building owners or renters whose energy costs affect their bottom line more adversely than others are more susceptible to long-term fluctuations in energy prices. Access to building performance data lends security when making financial decisions, and that extends not just to commercial building owners but also homebuyers with limited incomes. The Institute for Market Transformation reported that default risks are 32 percent lower on average on energy-efficient homes (Cluett and Amann 2013).
5.12.1.3 Types of Energy Disclosure Policies
5.12.1.3.1. Asset Ratings
The most rigorous, transparent, and most expensive type of building energy disclosure is an asset rating.74 An asset rating is the assignment of a performance index that is based on computer simulations of the architectural and system characteristics of the building, combined with results from onsite diagnostic testing. Asset ratings use standardized weather and occupancy conditions so that a building’s energy performance is normalized and can be compared quantitatively with other buildings.
For homes, the oldest and most widely used rating system is RESNET’s Home Energy Rating System (HERS). In 2010, Lawrence Berkeley National Laboratory developed the Department of Energy Home Energy Score (HES) in an attempt to create a simpler and more accurate rating system. The Department of Energy has also developed a free Building Energy Asset Score for commercial and multifamily buildings.
5.12.1.3.2. Operational Rating
74 The cities of Austin, Texas, Santa Fe, New Mexico, and Boulder, Colorado, all adopted asset rating disclosure policies and require the use of the HERS rating system.
1 - 186

An operational rating uses metered energy and water use data to compare usage trends, as well as consumption against other buildings, and compares this data via benchmarking. Benchmarking is a preferred method of disclosure for large multi-use residential and commercial buildings because acquiring an asset rating for these types of buildings can be expensive and complicated. The preferred software tool for operational ratings and benchmarking is EPA’s Portfolio Manager. A free resource for users, the tool is also the mostly widely used by local governments and industry. This tool is used for benchmarking in Boston, Cambridge, New York City, Washington D.C., Philadelphia, and Minneapolis. California also requires the use of Portfolio Manager for the Nonresidential Building Energy Disclosure Program described earlier.
A simpler operational rating is the disclosure of utility bills. This method is often employed in the residential sector, particularly at the time of a home sale or rental negotiation. Different programs vary on the timing of disclosing utility information. Utility bill disclosure is used in Alaska, New York, Hawaii, and in Chicago.
5.12.1.3.3. Energy Disclosure by Local Government Ordinance
A Residential Energy Conservation Ordinance (RECO) requires a homeowner to achieve minimum residential energy and water efficiency requirements such as attic insulation, hot water heaters, appliances and air-conditioning systems when conducting an extensive remodeling project and/or before their home can be sold.75 A RECO can be enforced two different ways:
a) Requiring a simple walk-through energy audit or assessment by the utility, a certified professional, or
b) Through the County’s building department inspection process.
A home energy rating by a state-certified professional that provides a numerical score for the home is strong proof of the improved energy efficiency of a building. Similarly, a Commercial Energy Conservation Ordinance (CECO) requires an energy analysis and disclosure of results.
5.12.1.4. Costs
Monitoring and verification (M&V) and other analysis can be quite expensive for the County. Depending on existing resources, hiring an outside consultant is recommended. The SDG&E Company is a valuable resource in M&V, and as such can help the County analyze the data after it is collected. Collecting the data can be time-consuming and costly. If the County decided to incent disclosure in the commercial sector, the budget needed is based on the amount of the incentive and the number of building owners who take advantage of the incentive. A $250 incentive payment to 500 building owners carries a $125,000 cost to the County.76 Even with free management tools like the U. S. Department of Energy’s Standard Energy Efficiency Database (SEED) and County staff dedicated to the effort, establishing a disclosure program requires significant time. Local government costs related to a building disclosure program also include
75 Adopted in Berkeley, San Francisco, and Boulder, Colorado, there have been mixed results in the implementation of RECOs. San Francisco adopted a RECO in 1982, and there are discussions underway now to expand the requirement to all of Alameda County (R. Schwartz, personal communication, Oct 2014). Berkeley, on the other hand, is considering replacing its RECO (adopted in 1992) with a Building Energy Savings Ordinance (BESO) after opposition from realtors and building owners over the increased time and cost of making retrofits. The BESO would remove the minimum energy and water efficiency measures that are to be installed at point of sale and instead require owners to perform and disclose energy and water efficiency assessments. (For more information, read the City of Berkeley Energy Commission’s BESO Staff Report, 2014). 76 This figure does not factor in the costs that building owners will incur to comply with the program.
1 - 187

public education and outreach expenses.77 At least one full-time employee is required for implementing a disclosure policy and providing ongoing program support (Group 2012).
The cost of a homeowner’s compliance with a County RECO mandate will vary widely and depends on the extent of the requirements and the size and age of the home. Costs can be significant to the homeowner if extensive upgrades are needed. A home energy rating typically ranges from $200 to $500, and energy audits typically range from $200 to $400 depending on the size of a home and the extent of analyses performed. The homeowner is responsible for this expense in most cases, although many programs subsidize this expense to help generate interest in energy efficiency improvements. Home energy ratings and audits within the County of San Diego are available through Energy Upgrade California.
For commercial and large multi-family buildings, building energy and water benchmarking costs fall on building owners and can range widely depending on building categorization (school, retail, hospital, etc.), varying energy demands, and hours of operation. In addition to the cost of improvements chosen, other costs include the energy audit, subsequent energy modeling, and the time spent by an energy expert developing recommendations.
5.12.2. Application to San Diego County (Recommendations)
5.12.2.1. Existing Context
California is already moving forward with a commercial building energy disclosure program. The California Energy Commission is in the process of finalizing regulations of the Nonresidential Building Energy Disclosure Program (CEC 2007). The program requires the owners of all nonresidential buildings above 5,000 square feet to determine their building’s energy and water use and provide that documentation to the California Energy Commission and to any prospective buyers prior to a sale of the building. It should be noted that the CEC has postponed reporting requirements for buildings above 50,000 square feet to July 1, 2016, to allow owners to adequately assess their facilities.
In 2008, the California Public Utilities Commission created the Long Term Energy Efficiency Strategic Plan as a roadmap to achieve bold goals for reduced building energy consumption. This plan set building disclosure-related goals such as:
All new residential construction will be Zero Net Energy in 2020.
All new commercial construction will be Zero Net Energy in 2030.
Heating, ventilation, and air-conditioning (HVAC) will be reshaped to ensure optimal performance for California’s climate resulting in a 50 percent improvement in efficiency in the HVAC sector by 2020.
Existing homes will use 20 percent less energy by 2015 and by 40 percent less by 2020 (CPUC 2014).
5.12.2.2. Next Steps: Building Energy Disclosure Policy Considerations
77 For a more in-depth report advising the City of Boston with its own building energy disclosure efforts, read Benchmarking and Disclosure: A Lesson from Leading Cities by a Better City and Meister Consulting Group (2012). Leading cities include New York, Washington D.C., Seattle, San Francisco, and Austin.
1 - 188

An important first step is to consider the number and age of existing buildings in the County, as well as projections for future development. Owners and potential buyers of existing residential and commercial buildings will benefit the most as those buildings were built to codes and standards less stringent than those of Title 24. While new commercial and residential buildings will certainly be more energy-efficient than older buildings, building energy performance disclosure is still an effective way to demonstrate the performance of homes built beyond minimum requirements.
There are a host of software programs and rating tools to analyze and document a building’s energy performance. As mentioned above, EPA’s ENERGY STAR Portfolio Manager is a common choice for analyzing commercial buildings and has become the standard tool recommended by state and local governments, including the State of California itself. The U.S. Department of Energy is also developing software that provides additional features for commercial building energy managers. The Standard Energy Efficiency Database (SEED) program will offer even more in-depth analysis of energy use data.78 A home energy rating performed by a certified rater is the most widely recognized when it comes to documenting the value of a home’s energy performance.
Whether for commercial or residential buildings, it is important for the County to use widely-recognized programs that provide cost information to consumers, and that is also easy to understand. County-generated information on disclosure can provide consumers with resources on available rebates and tax credits. Likewise, it would be beneficial for the County to consider energy performance analyses when buildings have been permitted for major retrofits.
The County can consider its own, and the State’s energy and GHG reduction goals when designing and implementing a performance rating and disclosure policy. These policies need to work in conjunction with existing rebate, retrofit, and energy efficiency programs. Disclosure work is best coordinated with all energy efficiency programs managed through the County, especially SDG&E Local Government Partnership programs. Linking new disclosure policies to these programs can help educate the public about energy efficiency opportunities.
Lastly, it is important to reach out to key stakeholders such as realtors, builders, contractors, and their respective associations.79 Chambers of Commerce can be instrumental in building support for disclosure policies. These groups provide industry insight and advocacy, and engaging them in the development stage can help build important stakeholder support early in the process. Some cities have built-in considerations for educating and assisting building owners with the transition, including having several benchmarking deadlines, only one of which is made public. With deadlines spaced far enough apart, building owners can make improvements before the second deadline (Meister Consulting Group 2014).
5.12.3. Who Else is Doing It
California state legislation (AB 1103) already requires commercial building owners to benchmark their building’s energy and water use, as well as greenhouse gas emissions beginning in 2016, and to disclose that data prior to the sale, lease, financing, or refinancing of the building. Additional major cities and counties across the country that require benchmarking for commercial buildings include San Francisco, New York City, Boston, Philadelphia,
78 More information can be found at Office of Energy Efficiency and Renewable Energy’s Energy.gov website (http://energy.gov/eere/buildings/standard-energy efficiency-data-platform). 79 After opposition from realtors and building owners over the increased time and cost of making retrofits, Berkeley is considering replacing its RECO (adopted in 1992) with a Building Energy Savings Ordinance (BESO).
1 - 189
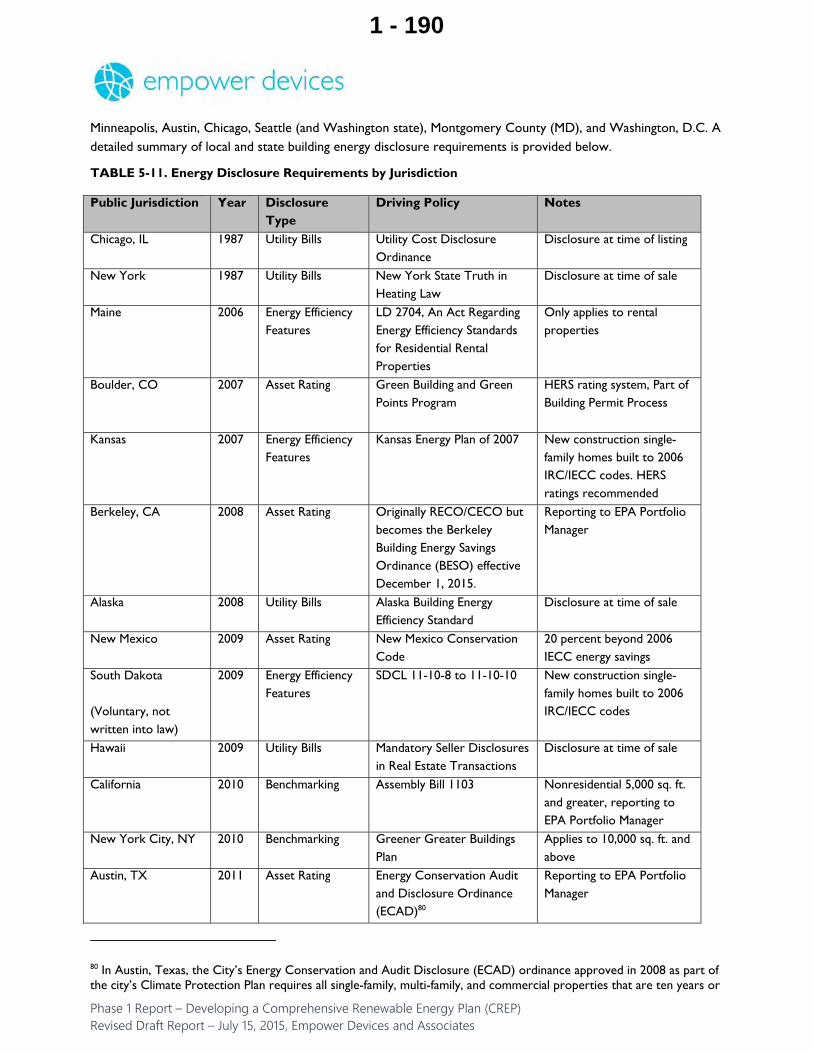
Minneapolis, Austin, Chicago, Seattle (and Washington state), Montgomery County (MD), and Washington, D.C. A detailed summary of local and state building energy disclosure requirements is provided below.
TABLE 5-11. Energy Disclosure Requirements by Jurisdiction
Public Jurisdiction Year Disclosure Type
Driving Policy Notes
Chicago, IL 1987 Utility Bills Utility Cost Disclosure Ordinance
Disclosure at time of listing
New York 1987 Utility Bills New York State Truth in Heating Law
Disclosure at time of sale
Maine 2006 Energy Efficiency Features
LD 2704, An Act Regarding Energy Efficiency Standards for Residential Rental Properties
Only applies to rental properties
Boulder, CO
2007 Asset Rating Green Building and Green Points Program
HERS rating system, Part of Building Permit Process
Kansas 2007 Energy Efficiency Features
Kansas Energy Plan of 2007 New construction single-family homes built to 2006 IRC/IECC codes. HERS ratings recommended
Berkeley, CA 2008 Asset Rating Originally RECO/CECO but becomes the Berkeley Building Energy Savings Ordinance (BESO) effective December 1, 2015.
Reporting to EPA Portfolio Manager
Alaska 2008 Utility Bills Alaska Building Energy Efficiency Standard
Disclosure at time of sale
New Mexico 2009 Asset Rating New Mexico Conservation Code
20 percent beyond 2006 IECC energy savings
South Dakota
(Voluntary, not written into law)
2009 Energy Efficiency Features
SDCL 11-10-8 to 11-10-10 New construction single-family homes built to 2006 IRC/IECC codes
Hawaii 2009 Utility Bills Mandatory Seller Disclosures in Real Estate Transactions
Disclosure at time of sale
California 2010 Benchmarking Assembly Bill 1103 Nonresidential 5,000 sq. ft. and greater, reporting to EPA Portfolio Manager
New York City, NY 2010 Benchmarking Greener Greater Buildings Plan
Applies to 10,000 sq. ft. and above
Austin, TX 2011 Asset Rating Energy Conservation Audit and Disclosure Ordinance (ECAD)80
Reporting to EPA Portfolio Manager
80 In Austin, Texas, the City’s Energy Conservation and Audit Disclosure (ECAD) ordinance approved in 2008 as part of the city’s Climate Protection Plan requires all single-family, multi-family, and commercial properties that are ten years or
1 - 190

Public Jurisdiction Year Disclosure Type
Driving Policy Notes
Washington 2011 Asset Rating Senate Bill 5854 Nonresidential above 10,000 sq. ft. Reporting to EPA Portfolio Manager
San Francisco, CA 2011 Benchmarking Existing Commercial Buildings Energy Performance Ordinance
Nonresidential 10,000 sq. ft. and greater, reporting to EPA Portfolio Manager
Seattle, WA 2011 Benchmarking Council Bill 116731 Applies only to large and medium size buildings, Uses EPA Portfolio Manager
Boston, MA 2013 Benchmarking Building Energy Reporting and Disclosure Ordinance (BERDO)
Applies only to large and medium size buildings
Minneapolis, MN 2013 Benchmarking Commercial Building Rating and Disclosure Ordinance
50,000 sq. ft. and above, uses EPA Portfolio Manager
Philadelphia, PA 2013 Benchmarking Bill No. 128420 50,000 sq. ft. and above, uses EPA Portfolio Manager
Cambridge, MA 2014 Benchmarking Building Energy Reporting and Disclosure Ordinance (BERDO)
Applies only to large and medium size buildings
older to undergo energy audits and present the results three days before the final sale of the home. The major goal of the ordinance is to make the City a national leader in reducing and reversing the negative impacts of global warming. Non-compliance with the code includes fines of $500 to $2000. Since 2009, 58 percent of single family homes and 76 percent of commercial properties have received energy audits and rating designations in Austin (For more information, read Austin City Code Update Report Presentation, 2013).
1 - 191

5.13. Promote More Aggressive Building Standards Including the Significant Retrofit of Existing Buildings
CREP-related Options for the County of San Diego
Create a new Zero Net Energy (ZNE) definition and policy for the County, which has firm goals around ZNE commercial and residential market penetration (e.g. 50 percent of all residential new construction should be ZNE by 2025 or a future date). Create a ZNE competition with architects for County, commercial, and residential buildings. Collaborate with the building industry through industry-specific training and limited financial incentives to achieve above-code energy efficiency levels or ZNE levels in a target segment of the market (e.g., existing homes in unincorporated San Diego County) Work with the San Diego Regional Electric Vehicle Infrastructure (REVI) Working Group and others to adopt/update language to include prewiring of residential and commercial buildings for electric vehicles
Portfolio of Building Standards
With buildings in the U.S. accounting for around one-third of the nation’s total energy use and two-thirds of total U.S. electricity use and corresponding air emissions, the adoption and implementation of building energy efficiency codes is critical to the County of San Diego from both an economic and environmental perspective (Database of State Incentives for Renewables and Efficiency, 2014).
Building energy efficiency standards in California are designed generally to ensure new and existing buildings achieve energy efficiency, and preserve outdoor and indoor environmental quality. Energy codes set minimum standards and define the least-efficient buildings (public and private) that should be constructed. The California Energy Commission (CEC) last updated the Energy Code, also known as Title 24, in 2013. Title 24 includes goals for Zero Net Energy (ZNE) buildings, in which a building produces as much energy onsite as it consumes on an annual basis.
The portfolio of more aggressive building standards for the County to consider may include the following:
Mandating the procurement of efficient equipment within County facilities and/or conduct a life-cycle analysis (LCA) of County-owned buildings.
Beyond code (“stretch” or “reach”) standards that exceed the minimum requirements of the Title 24 energy code.
Adding a requirement that new single family homes be “pre-plumbed” for solar thermal systems to existing County ordinance that requires “pre-wiring “ for solar PV panels in new single-family homes.
Since EVs both consume and produce electricity and “plug-in” to buildings, a portfolio of building standards would be incomplete without those concerning EV infrastructure.
1 - 192
5.13.1 Overview
5.13.1.1. California State Energy Policy Goals
Several State energy policy goals drive the design of the current building energy standards in the County:
The Governor’s new plan to increase the State’s Renewable Portfolio Standard (RPS) to 50 percent by 2030;
The “loading order,” which directs that California’s growing energy demand must first be met by electricity suppliers with cost-effective energy efficiency;
“Zero Net Energy” (ZNE) goals for new homes by 2020, and commercial buildings by 2030;
Governor Brown’s Executive Order on Green Buildings, which requires large state buildings to meet U.S. Green Building Council’s (USGBC’s) Leadership in Energy & Environmental Design (LEED) “Silver” certification, and sets ZNE targets for all future buildings;
The Green Building Standards Code (CALgreen); and
AB 32, which mandates that California reduce its greenhouse gas emissions to 1990 levels by 2020.
In addition to these, at least three other major factors come into play for the County when addressing new building energy efficiency standards:
The new (mandatory) 2013 Title 24 energy efficiency standards are aggressive and as noted below, incur new costs to County builders and consumers;
Title 24 is updated by the State every three years (the next one occurs in 2016) and the significant changes to Title 24 in 2013 mandate that all new residential buildings by 2020 and new commercial buildings by 2030 will be ZNE; and
A ZNE building produces as much energy onsite as it consumes on an annual basis.81 Therefore, solar photovoltaics (PV) as one of the proven, cost-effective technologies of choice for citizens and government in 2015, will likely be an important technology for the County in both the residential and commercial sectors going forward in the near term. As such, PV-related policy, building permitting, and processes will be increasingly important in the near future warranting attention.
5.13.1.2. Existing Building Standards in the County
Building standards can apply to residential, commercial, and the County’s own buildings. The County already has excellent building policies in place in both the renewables and energy efficiency areas, including its nationally recognized online solar permitting program. 82 In fiscal years 2010 through 2013, there was an
81 This site-focused definition is currently the most agreed upon nationally. Please note that the U.S. Department of Energy issued a request for ZNE definitions in December of 2014. While no national standard was implied as the result of comments received, mostly on the grounds of the need for consistency, our team believes that one will result from this U.S. DOE request. 82 California enacted legislation in 2007 requiring that solar-energy systems be installed on all state buildings and state parking facilities by January 1, 2009, where feasible. State law also requires the installation of solar-energy systems on all new state buildings constructed after January 1, 2008, if it is feasible and there are sufficient funds to do so. In addition, the state’s Green Building Action Plan aims to reduce grid-based energy use by 20 percent of 2003 levels by 2018 at major state-owned facilities.
1 - 193

average of 1,588 photovoltaic permits issued each year in the unincorporated area of San Diego County, with a 138 percent increase from 2011 to 2013 (County of San Diego 2013) This progress provides an excellent complement to future ZNE efforts. A partial list of some of the building-related accomplishments in both the renewables and energy efficiency areas is important to highlight here.
The County has offered permit fee waivers for residential solar PV electrical system permits since 2001
Permit fee waivers for residential small wind turbine electrical systems have been in effect since 2008
The County offers permit streamlining for residential roof-mounted solar PV projects, and a shortened administrative permit process including height and setback exceptions for use of on-premise energy systems (usually PV) that are smaller than 10 acres. On-bill financing and California Energy Commission (CEC) loans were authorized by the County to fund energy projects
A retro-commissioning (building tune-up) program was started, and the SDG&E Energy Initiative Partnership Program resulted in energy retrofits for many County facilities. As a result, energy use at County facilities has been reduced by an average 3.7 percent per year between 2009 and 2012.83
More than 800,000 square feet of County buildings have been designed to the USGBC LEED standards since 2009, and all new construction and major renovation projects have met or exceeded the LEED Certified rating since the same year. Significantly, since 2009, all new County construction projects are designed to exceed California Energy Code, Title 24 compliance by 20 percent. ZNE was made a requirement for the Alpine Library project after successful assistance through the SDG&E Direct Design Assistance program. Additionally, three other new facilities were identified where ZNE will be made a requirement once the projects start.84
Education and training of County staff has been a priority, with 15 facilities’ personnel having obtained Building Operator Certification and five project managers having achieved LEED accreditation. The County has a goal of retrofitting 15 percent of County buildings (Vista 2014). In 2011, the Board adopted amendments to building and energy codes incorporating the California Green Building Standards.
In 2009, the Board of Supervisors approved the County of San Diego’s participation in the California FIRST program, created to issue bonds to finance property assessed clean energy (PACE) improvements to help homeowners finance renewable energy systems and energy efficiency equipment.
The County operates a Green Building Incentive Program, which is designed to promote the use of resource-efficient construction materials, water conservation, and energy efficiency in new and remodeled residential and commercial buildings. The program offers incentives of reduced plan check turnaround time and a 7.5 percent reduction in plan check and building permit fees for projects meeting program requirements (standard for many California local governments at this time). Participation is minimal (less than 20 participants in 2013), but the program is important
83 Ibid. 84 Ibid.
1 - 194

since it represents a commitment to above-code construction, and it effectively constitutes an infrastructure for rewarding future ZNE projects.
5.13.1.3. Definition
New and existing buildings should be considered not only as energy consumers, but also as valuable electricity producers. The County may consider these individual producers of electricity as important to meet its energy security objectives as well as help the State meet its new Zero Net Energy (ZNE) goals and the Governor’s recent call for 50 percent renewables by 2030 (CEC , Governments 2008).
Building energy efficiency standards in California are designed generally to ensure new and existing buildings achieve energy efficiency, and preserve outdoor and indoor environmental quality. Building energy codes cover areas of construction, such as wall and ceiling insulation; window and door specifications; heating, ventilation and air-conditioning equipment efficiency; and lighting fixtures and controls. Energy codes set minimum standards and define the least-efficient buildings (public and private) that should be constructed. These measures are listed in the California Code of Regulations as Title 24, Part 6.
5.13.1.4. Benefits & Costs
California’s latest version of the Title 24 energy code (Commission 2013) continues to improve the energy efficiency of buildings.85 The 2013 version of the statewide standards are projected to reduce energy use by 25 percent for lighting, heating, cooling, and water heating compared to the 2008 standards. Additional upfront costs vary by climate zone, but statewide the standards add approximately $2,000 to the new residential building construction costs, which are more than offset by lower energy costs over the life of the home. Estimated energy savings to homeowners is more than $6,000 over 30 years. In other words, when factored into a 30-year mortgage, the energy efficiency standards will add approximately $11 per month for the average homeowner, but will save $27 on monthly heating, cooling, and lighting bills. For San Diego County, the standards add approximately $2,300 to the cost of constructing a new home, and are expected to save approximately that same amount in energy costs to the homeowner within the first 18 months of occupancy.
5.13.1.5. Potential New County Building Policies
By establishing a stronger suite of programs and policies for the design and construction of County buildings across all sectors, the County can cost-effectively prepare for future State ZNE, energy efficiency, or other regulated regulations and meet its own renewable energy goals. By continuing to adopt advanced energy standards for County facilities, as is already common practice by the County, the County will continue to lead by example by promoting more progressive building construction practices. Policies and standards the County could pursue for its own buildings to increase efficiency and work toward new local, or some of the state ZNE goals mentioned earlier include:
Attaining an even higher “green building” certification (USGBC LEED or other);
Achieving new energy-reduction goals;
Exceeding building code minimum efficiency requirements by more than the 20 percent already specified;
Mandating the procurement of efficient equipment within County facilities; and
85 The 2013 Title 24 standards went into effect July 1, 2014.
1 - 195

Performing a life-cycle cost analysis.
5.13.1.5.1. Lead by Example with County Buildings
The County already is committed to building to USGBC Leadership in Energy & Environmental Design (LEED) standards and energy reduction goals are part of the County’s Strategic Energy Plan (SEP). Going beyond these goals through a simple cost/benefit analysis can be relatively straightforward as part of a future CREP process. Many residents may likely expect the County to go beyond minimum efficiency standards so opposition to increasing the percentage above the base code can be expected to be minor (especially given the long expected life of County buildings, perhaps 75 years). Along with any mandate to procure efficient equipment, the County can revisit procurement processes and protocols to ensure that renewables and energy efficiency are treated fairly. The County should consider adopting a formal LCC policy.
Because many County buildings are expected to have a 75-year lifespan, the County can justify a substantial commitment to designing and building superior new structures. Furthermore, because of their size, office buildings and schools are particularly easier to achieve ZNE. The productivity benefits associated with a more comfortable, well-lit, and ventilated area are unarguable after 20 years of research on the subject (Fisk 2000, Kats, Alevantis et al. 2003). Single-digit increases in first costs are outweighed by the productivity benefits gained over the life of the employee. The City of Oakland determined that the integration of green building features into buildings can generate substantial energy, water, and material efficiencies, resulting in reduced operating costs of 20 to 80 percent over the life of the building (Edgerly 2006).
5.13.1.5.2. Beyond Codes
Beyond code (“stretch” or “reach”) programs are another voluntary way the County can tap into market forces and architectural and engineering creativity to develop, refine, and perfect the most promising ZNE solutions. Before considering the costs and savings for builders or the County going beyond the minimum Title 24 energy code voluntarily, the costs and savings of simply getting to the new code (which is updated every three years) needs to be considered. For San Diego County, the new (2013) standards added approximately $2,300 to the cost of constructing a new home, but are also expected to save approximately that same amount in energy costs to the homeowner within the first 18 months of occupancy (Schneider 2014). This type of analysis should be extended to any voluntary above-code program begun by the County. This allows builders to chart the specific path taken on any given project to get to the County’s new ZNE goal(s) while it will almost often result in lower costs than a prescriptive approach.
With respect to private construction (new residential construction), the County can set up a new stretch or reach program that rewards commercial or residential construction that exceeds Title 24 standards with financial incentives and faster turnaround times. Since 1999, this policy has proven to spur more energy efficient construction, and more than 120 local California governments offered these incentives to builders that built 30 percent above Title 24 energy standards in 2007 (Colorado Energy Group 2014).86 These incentives have proven to be important to builders since it helps distinguish them from others. The County can also create a competition for architects around building performance. Zero Net Energy (ZNE) goals can put pressure on architects, engineers, and builders to incorporate energy modeling from the very beginning, helping the County virtually guarantee emission and renewables goals. If the County embraced ZNE and incorporated related goals into existing regulations, it could promote and help lead building
86 Colorado Energy Group, Inc. managed the California IOU-funded statewide Community Energy Efficiency Program (CEEP).
1 - 196

training courses for regional builders who need to know how to combine solar and energy efficiency in existing and new construction. A joint project with the local Building Industry Association (BIA) would be a relatively easy action to take.
5.13.1.5.3. Solar Energy Building Requirements
New to Title 24 standards is the requirement that a minimum of 250 square feet of roof space be reserved for future solar PV or solar thermal panel installations. Also known as “solar ready roofs,” the requirements apply regardless of climate zone and do not require the installation of mounting hardware, electrical equipment, or any kind of pre-wiring for future use. However, on April 8, 2015, the County adopted a solar- and electric vehicle-ready ordinance that will require new homes to be installed with conduit and junction boxes for future PV and electric vehicle supply equipment beginning July 1, 2015.
5.13.1.5.4. Electric Vehicle Building Requirements
Since EVs both consume and produce electricity and “plug-in” to buildings, the County can consider (new) EV building standards through the CREP. By providing power to buildings, EVs can help the County meet new ZNE goals that ultimately address end-use efficiency in buildings. (For more information on EVs, please see the EV Best Practice in this report.)
San Diego County is at the forefront of plug-in electric vehicle (PEV) deployment with the second highest per capita amount of PEV purchases in the nation. As noted above, it just adopted an ordinance for all new homes to be installed with conduit for future installation of residential PEV chargers. There are 350 EV charging stations installed in the City of San Diego already (SANDAG 2013). This area is one of the most important for Phase II of the CREP.
James Avery, Senior Vice President of Power Supply, San Diego Gas & Electric, recently said,
In San Diego, an electric vehicle on the grid is roughly the equivalent to three-quarters of the electric load of the average home. Every home has one plus cars sitting in the driveway, and if you were to convert all of those vehicles over to electricity, there is potential to more than double the electric load on the grid (Bade 2015).
5.13.2. Who Else Is Doing It
A growing number of local governments, including Boulder, Colorado; Marin County, California; Austin, Texas; and San Francisco, California, have taken building codes a step further by requiring that certain commercial and/or residential construction meet sustainable building standards.87 Lancaster, Glendale, Los Angeles, and the City and County of San Francisco all implemented their own solar and energy efficiency requirements recently that exceed the minimum Title 24 requirements, and have been deemed energy cost-effective by the California Energy Commission (CEC). The County of San Diego joins Los Angeles and Lancaster in requiring builders to install equipment that readies a new home for solar energy. In addition to require pre-wiring for solar PV, the City of Chula Vista also requires pre-plumbing for solar thermal according to published guidelines.88
87 California became the first state to establish a set of green building standards that apply to commercial and residential construction in addition to state-owned buildings. The standards took effect on a voluntary basis in 2009 and became mandatory in January 2011. 88 Available through Chula Vista’s Sustainable Center.
1 - 197

Please see TABLE 5-12 below for a list of California jurisdictions and their (more aggressive) municipal building standards, and Table B for a list of California jurisdictions and their community reach codes.
TABLE 5-12. Selected Aggressive California Municipal Building Standards
CA Jurisdiction Municipal Building Standard
County of Alameda Ordinances adopted in 2003 require new County facilities to meet or exceed LEED-Silver rating.
County of Butte Climate Action Plan Implementation includes requiring new County buildings to meet CALGreen Tier 1 energy efficiency standards (2014)
City of Chula Vista New and renovated City buildings over 4,500 square feet must be at least 20 percent more efficient than state code, and all new buildings over 10,000 square feet to meet enhanced green building standards (2014).
City of Pasadena Amended CALGreen standards in 2013 to mandating minimum “cool roof’ requirements new municipal buildings and major renovations.
City of Monte Soreno General Plan requires all new public buildings to be LEED certified (2010).
County of Ventura The County’s 2010 Energy Action Plan directs the General Services Administration to pursue LEED Silver rating for new County buildings and those undergoing renovations (2012).
1 - 198

TABLE 5-13. California Jurisdictions and their Community Reach Codes
CA Jurisdiction Community “Reach Codes”
County of Alameda Ordinances adopted in 2003 require LEED or Build It Green certification for residential and commercial buildings (2009).
County of Butte Green Building Ordinance includes requirements that all new construction is 10 percent more efficient than Title 24, new commercial buildings must be LEED certified, and new large commercial and industrial buildings to use on-site renewable generation.
City of Calabasas Amends CALGreen to require new nonresidential buildings 500-5,000 square feet be LEED certified and larger buildings must achieve at minimum LEED Silver rating (2013).
City of Chula Vista City Council expected to complete a review by the end of 2015 of the cost-effectiveness of updating its 2009 “solar ready” ordinance (pre-wiring and pre-plumbing of homes for solar PV and solar hot water heating systems), a 2010 Energy Efficiency Ordinance or “reach” code (new residential and commercial buildings) to be at least 15 percent and 20 percent more efficient (in Climate Zones 7 and 10 respectively), and a 2012 “cool roof” ordinance requiring reflective roofs. The City Council will also consider an ordinance this year that would require all new residential and commercial buildings be installed with solar PV systems (2014).
City of Glendale The City’s 2014 Building and Safety Code exceeds 2013 Title 24 with radiant roof barrier requirements in concealed attic spaces for new residential buildings.
City of Lancaster City Ordinance 994 adopted in 2013 mandates the installation of rooftop solar PV system of at least 1 kW capacity on new homes.
City of Los Angeles “Cool Roof” Ordinance (2013) mandates minimum thermal emittance and solar reflectance values of roofing materials for new homes.
City of Monte Soreno
General Plan directs new and remodeled homes to exceed Title 24 standards by 25 percent (2010).
City of Pasadena Amended the local CALGreen standard in 2013 to mandate “cool roof” minimum thermal emittance and solar reflectance values of roofing materials and pre-wiring for electric vehicles and solar PV systems, and electric vehicle charging stations in new homes, commercial, and multi-family buildings (2013).
City and County of San Francisco
Amended Building Standards Code to require LEED or GreenPoint certifications for all new construction and renovations of homes, commercial and multi-family buildings (2013).
City of Santa Barbara
The City has Neighborhood Solar Access and Design Guidelines, and a Residential Built Green Program requirement, with stronger measures for homes over 4,000 square feet (2015).
1 - 199

5.14. Increase Renewable Energy Education and Outreach Efforts
CREP-Related Options for the County:
Update the County’s website and make it a more appealing gateway to renewable energy efforts underway in the County Set-up educational renewable energy kiosks at strategic locations across the County to educate employees Centralize all County energy-related E&O efforts in one office, such as a new Office of Sustainability recommended in this report Design a new E&O program for issues that have traction and meaning for County residents, such as electric vehicles or solar photovoltaics (PV) Use the County of San Diego’s County News Center for renewable energy education and outreach efforts, focusing on short video stories to begin Closely examine the sustainability portions and content of Alameda County and Sonoma County websites Consider creating a mobile phone app such as Green Oceanside (Oceanside, CA), or Rethink (Austin, TX), which provides updated sustainability-related information and resources to residents and links to social media. These two-way smart phone applications allow the County to educate the public, while also allowing the public to communicate with the County Collaborate with the Center for Sustainable Energy and SDG&E to leverage their marketing, education, and outreach capabilities
Definition
Education and Outreach (E&O) programs support and often enable technology-heavy renewable energy programs and policies by educating public policy makers and citizens about what is possible, thus resulting in more exposure (and sometimes more funding) for these practices. E&O efforts are often considered a separate, distinct program under the government operations area since they tend to cut across multiple sectors (e.g., buildings, utilities, transportation, and agricultural). This type of best practice is sometimes overlooked or incorrectly considered “soft,” since it is not technology-heavy and singularly focused like other best practices.
E&O programs vary considerably. They can be grouped into five primary categories:
Meetings and Special Events
General Renewable Energy Campaigns and Outreach Products
Internet-based Outreach
Publications
Technology and Issue-Specific Campaigns, Including Financing Information
1 - 200
5.14.1. Overview
5.14.1.1. Definition
Education and Outreach (E&O) efforts are often considered a separate, distinct program area since they tend to cut across multiple sectors (e.g., buildings, utilities, transportation, and agricultural). E&O programs are frequently buried within program budgets under information dissemination, marketing, or other categories. As a result, this best practice area is sometimes overlooked or incorrectly considered “soft,” since it is not technology-heavy and singularly focused like other best practices.
E&O programs vary considerably. They can be grouped into five primary categories:
Meetings and Special Events
General Renewable Energy Campaigns and Outreach Products
Internet-based Outreach
Publications
Technology- and Issue-Specific Campaigns, Including Financing Information
5.14.1.2. Value Proposition & Benefits
E&O programs support and often enable technology-heavy renewable energy programs and policies by educating public policy makers and citizens about what is possible, thus resulting in more exposure (and sometimes more funding) for these practices. They may be the most important renewable energy-related program dollars that the County can spend. The benefits of E&O programs are generally well documented, but often qualitative in nature. Greater awareness of renewable energy leads to greater customer uptake, and more renewable energy use, leading to more renewable energy projects, especially when it comes to rooftop solar applications.
5.14.1.2.1. Metrics
Metrics for these programs are surprisingly basic and usually include the number of attendees, number of participants who signed up onsite or via the Internet, or the number of online video views. Due to the prominence of new online E&O programs, Internet analytics are increasingly used to provide metrics to local governments. For example, the number of opened emails or “click-throughs” might be the major metric used for an Internet-based renewable energy outreach program to community businesses or citizens.
5.14.1.3. Types of Education and Outreach (E&O) Programs
E&O programs can be grouped into five different categories. An effective renewable E&O program will often include efforts across all five of these categories. The authors recommend that the County review the programs below to evaluate which ones could be important components of a new CREP-inspired renewable energy E&O strategy:89
89 A State Energy Office (SEO) provides extensive information on these programs. Our team consulted the National Association of State Energy Officials (NASEO) and their SEO members as part of our search for successful renewable energy E&O programs. Our Team looked at E&O programs inside of sustainability budgets of comparably sized counties
1 - 201

5.14.1.3.1. Meetings and Special Events
County Fairs
Traditional holiday events
County meetings
Piggybacking other County events such as Healthfairs
“Birthday parties” celebrating annual solar or wind project installation dates
Annual State of the County celebration
Renewable energy company ribbon cuttings
Energy-efficient and solar home tours
Chamber of Commerce events
5.14.1.3.2. General Renewable Energy Campaigns and Outreach Products
Posters, flyers, demonstration kits, interactive displays
Website presence and support
Prizes, rewards, and recognition within the County for renewable energy or energy efficiency-related leadership
Stand-alone interactive kiosks and interactive displays
Media outreach programs
Billboards (not traditional for a County, but appropriate at times)
Educational curricula, and onsite kits for grades K-12
Photovoltaic or wind displays at visitor centers, public agency lobbies, etc.
Combined fliers with customer water bills
Video production and distribution
Educational surveys that inform the consumer or businesses, and also give valuable feedback to the County
Utility bill stuffers (piggybacking invoices, and (especially) existing energy use statements sent out by SDG&E to residents)
Direct mail
Newspaper articles and ads
5.14.1.3.3. Internet-based Outreach
both in terms of population and budget, in California, and outside the State. Where possible, the authors isolated E&O dollars dedicated only to renewable energy to find general programs for the County’s benefit.
1 - 202

Renewable energy social media campaigns targeted at consumers and businesses
YouTube and other short videos for the public, segregated by markets (i.e. homeowners, millennials, retired residents, etc.)
Interactive new Apps that communicate the County’s and public’s energy use back-and-forth
Expanded use of Facebook and Twitter
Digital email newsletters and blasts
5.14.1.3.4. Publications
Renewable energy County of San Diego Consumer’s Guide
Feature stories for magazine articles
Renewable Best Practices Guides
5.14.1.3.5. Technology and Issue-Specific Campaigns, Including Financing
Solar, wind, biomass, and other demonstration and education programs
Outreach documents describing financing tools, or financing available, including available rebates and incentives for renewable technologies
Zero Net Energy (ZNE) residential and commercial background information for the public
5.14.1.4. Structure & Budget (Costs)
Varying substantially in cost, E&O programs can range from a $10,000 renewable energy kiosk in a public library, to a $1 million energy awareness project for local governments managed by California’s investor-owned utilities (IOUs). E&O program costs are sometimes contained in marketing or outreach budgets, and can amount to as much as 10 percent of total program costs on large multi-year renewable energy projects (Sikemma 2014).
The table below provides information on select California cities and counties with E&O programs and their most recent budgets.90
90 Our team reviewed California City and County websites and interviewed staff in more than two dozen jurisdictions, with guidance from staff at the California State Association of Counties (CSAC).90 Interviews took place between June 2014 and February 2015. CSAC staff Cara Martinson recommended counties with exemplary sustainability websites in June 2014. The Counties chosen for Table 1 were selected based on many factors, including the likelihood of the County of San Diego implementing similar programs, under comparable budgets.
1 - 203
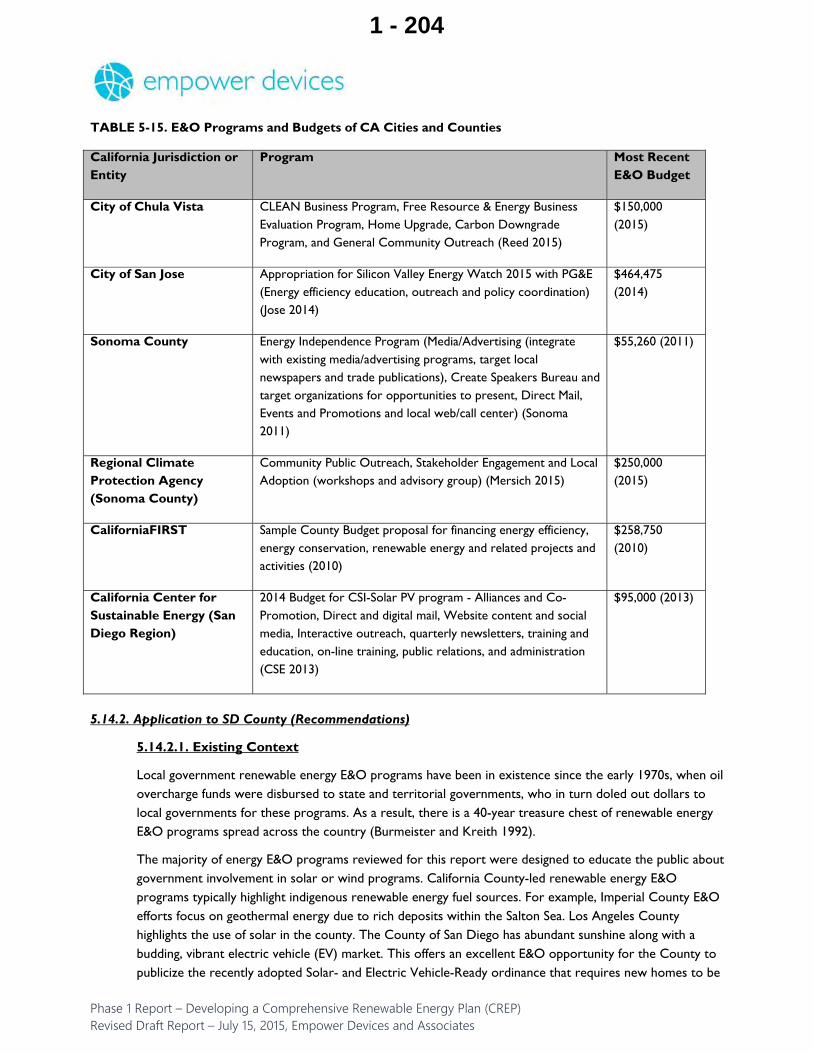
TABLE 5-15. E&O Programs and Budgets of CA Cities and Counties
California Jurisdiction or Entity
Program Most Recent E&O Budget
City of Chula Vista CLEAN Business Program, Free Resource & Energy Business Evaluation Program, Home Upgrade, Carbon Downgrade Program, and General Community Outreach (Reed 2015)
$150,000 (2015)
City of San Jose Appropriation for Silicon Valley Energy Watch 2015 with PG&E (Energy efficiency education, outreach and policy coordination) (Jose 2014)
$464,475 (2014)
Sonoma County Energy Independence Program (Media/Advertising (integrate with existing media/advertising programs, target local newspapers and trade publications), Create Speakers Bureau and target organizations for opportunities to present, Direct Mail, Events and Promotions and local web/call center) (Sonoma 2011)
$55,260 (2011)
Regional Climate Protection Agency (Sonoma County)
Community Public Outreach, Stakeholder Engagement and Local Adoption (workshops and advisory group) (Mersich 2015)
$250,000 (2015)
CaliforniaFIRST Sample County Budget proposal for financing energy efficiency, energy conservation, renewable energy and related projects and activities (2010)
$258,750 (2010)
California Center for Sustainable Energy (San Diego Region)
2014 Budget for CSI-Solar PV program - Alliances and Co-Promotion, Direct and digital mail, Website content and social media, Interactive outreach, quarterly newsletters, training and education, on-line training, public relations, and administration (CSE 2013)
$95,000 (2013)
5.14.2. Application to SD County (Recommendations)
5.14.2.1. Existing Context
Local government renewable energy E&O programs have been in existence since the early 1970s, when oil overcharge funds were disbursed to state and territorial governments, who in turn doled out dollars to local governments for these programs. As a result, there is a 40-year treasure chest of renewable energy E&O programs spread across the country (Burmeister and Kreith 1992).
The majority of energy E&O programs reviewed for this report were designed to educate the public about government involvement in solar or wind programs. California County-led renewable energy E&O programs typically highlight indigenous renewable energy fuel sources. For example, Imperial County E&O efforts focus on geothermal energy due to rich deposits within the Salton Sea. Los Angeles County highlights the use of solar in the county. The County of San Diego has abundant sunshine along with a budding, vibrant electric vehicle (EV) market. This offers an excellent E&O opportunity for the County to publicize the recently adopted Solar- and Electric Vehicle-Ready ordinance that requires new homes to be
1 - 204

pre-wired for future solar PV and electric vehicle charging systems. There is strong SDG&E interest in EV charging stations at this time and a substantial number of EVs in the County. Environment California announced in October of 2014 that California had more than 100,000 EVs on the road. Of those vehicles 20,000 are in San Diego County (CACSE 2012).
5.14.2.2. Next Steps
5.14.2.2.1. Website Opportunity
One of greatest underutilized assets the County owns is its website. An active website presence with renewables distinguishes most of the truly effective and nationally known E&O programs, including in Sonoma County, Los Angeles County, the City and County of San Francisco, and the Cities of Santa Monica, California; Boulder, Colorado; and Austin, Texas. The websites for these counties and cities and others like them invite participation in renewable energy (and sustainability) programs, while educating the public about the issues, usually through the liberal use of photos, graphics, and testimonials. Discussions with representatives from each of these governments indicate that their website drives participation in renewable energy programs; no formal program evaluations exist for the E&O programs mentioned here.
There is significant untapped potential for connecting constituents to the County of San Diego website. For example, when a reader types “County of San Diego Renewables”—a likely search phrase, into the browser on their computer -- the first link provided is to a DGS (Department of General Service) page which only provides information on the County’s PV installations at its four facilities..91 Also on the screen is a small picture of a solar panel. While the County should be commended for having the page in the first place, the authors also believe there is plenty of room for improvement in this area.
Regardless of the CREP, there remains a strong need for E&O programs in the County. The average San Diego County resident has little awareness of local renewable energy potential, that solar energy costs have dropped 80 percent since 2008, or that the region is a national leader in electric vehicle research and infrastructure development (Schneider 2014). The County has the opportunity to use the CREP to help create more educated consumers and businesses, which in turn can create more consumer demand for renewables.
5.14.2.2.2. Behavior Change Programs: Key E&O Opportunity for the County of San Diego
E&O programs are separated from traditional utility-funded resource programs in California generally, which are required to save a specific amount of energy that can be claimed by a utility or similar entity, and subsequently credited where necessary. However, E&O programs are considered important complements to utility-funded resource programs with energy-saving goals. As a “non-resource” program, E&O programs sometimes enjoy more flexibility as a result. New behavior change programs have been considered non-resource E&O programs in many cases, but their recent success is quickly changing this phenomenon.
Behavior change programs came to the surface around a decade ago and are revolutionizing the way utilities and communities deliver traditional energy efficiency and renewable energy programs. Here’s how they work. A third-party contractor with expertise in the energy behavior change area is hired by a utility, municipality, governement agency, nonprofit, etc., to influence the energy behavior of a group of energy consumers (i.e., a market segment). The third party designs a program and attempts to influence the energy behavior of this segment by using key messages that appeal to individuals, which in turn will cause them to
91 As of June 11, 2015.
1 - 205
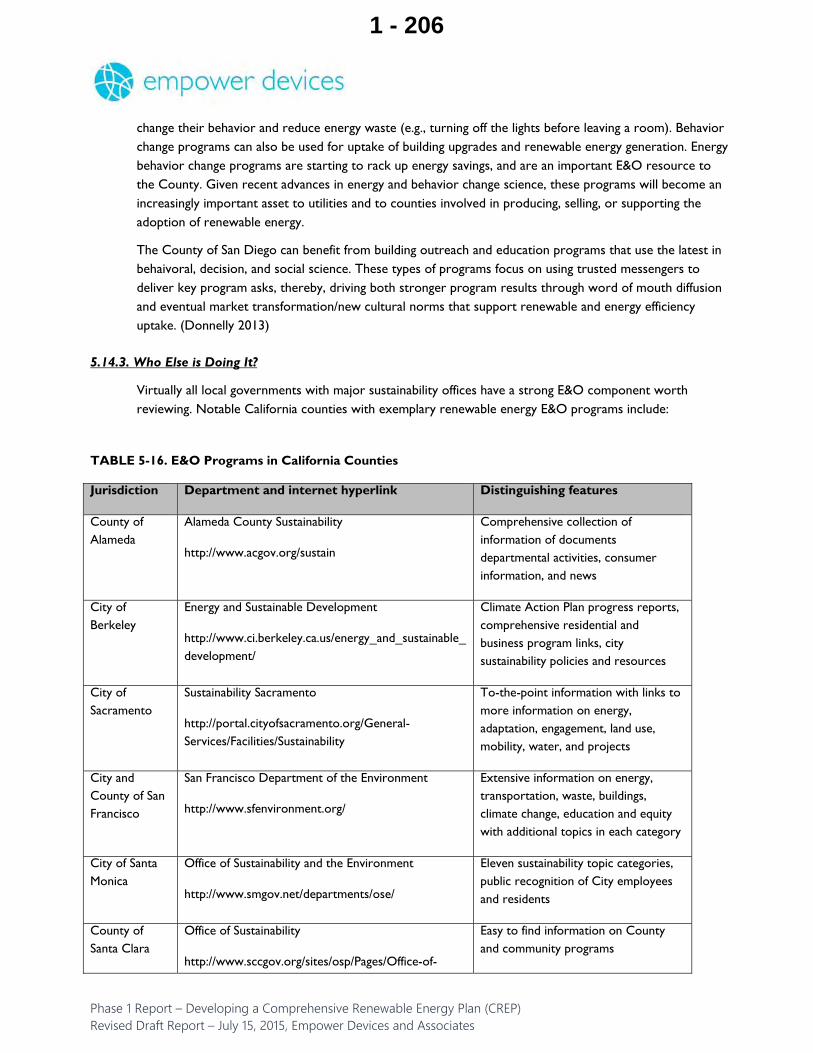
change their behavior and reduce energy waste (e.g., turning off the lights before leaving a room). Behavior change programs can also be used for uptake of building upgrades and renewable energy generation. Energy behavior change programs are starting to rack up energy savings, and are an important E&O resource to the County. Given recent advances in energy and behavior change science, these programs will become an increasingly important asset to utilities and to counties involved in producing, selling, or supporting the adoption of renewable energy.
The County of San Diego can benefit from building outreach and education programs that use the latest in behaivoral, decision, and social science. These types of programs focus on using trusted messengers to deliver key program asks, thereby, driving both stronger program results through word of mouth diffusion and eventual market transformation/new cultural norms that support renewable and energy efficiency uptake. (Donnelly 2013)
5.14.3. Who Else is Doing It?
Virtually all local governments with major sustainability offices have a strong E&O component worth reviewing. Notable California counties with exemplary renewable energy E&O programs include:
TABLE 5-16. E&O Programs in California Counties
Jurisdiction Department and internet hyperlink Distinguishing features
County of Alameda
Alameda County Sustainability
http://www.acgov.org/sustain
Comprehensive collection of information of documents departmental activities, consumer information, and news
City of Berkeley
Energy and Sustainable Development
http://www.ci.berkeley.ca.us/energy_and_sustainable_development/
Climate Action Plan progress reports, comprehensive residential and business program links, city sustainability policies and resources
City of Sacramento
Sustainability Sacramento
http://portal.cityofsacramento.org/General-Services/Facilities/Sustainability
To-the-point information with links to more information on energy, adaptation, engagement, land use, mobility, water, and projects
City and County of San Francisco
San Francisco Department of the Environment
http://www.sfenvironment.org/
Extensive information on energy, transportation, waste, buildings, climate change, education and equity with additional topics in each category
City of Santa Monica
Office of Sustainability and the Environment
http://www.smgov.net/departments/ose/
Eleven sustainability topic categories, public recognition of City employees and residents
County of Santa Clara
Office of Sustainability
http://www.sccgov.org/sites/osp/Pages/Office-of-
Easy to find information on County and community programs
1 - 206

Jurisdiction Department and internet hyperlink Distinguishing features
Sustainability-Home-Page.aspx
County of Sacramento
Green Sacramento County
http://www.green.saccounty.net/Pages/default.aspx
Slideshow of County sustainability achievements, easy-to-use links for community resources
County of Ventura
County of Ventura Sustainability
http://www.ventura.org/sustain/
Easy to identify information for employees, business and community; public recognition; sustainable food and healthy eating
1 - 207

5.15. Starting a Community Solar Initiative
5.15.1. Overview
5.15.1.1. Definition
Community Solar is recognized as an innovative approach to reducing greenhouse gas (GHG) emissions and lowering the cost of solar photovoltaics (PV) electricity through economies-of-scale. Community Solar helps avoid the traditionally high upfront costs of solar by spreading the investment among many players. Community Solar arrays range in size from those small enough to be installed on a building’s rooftop to larger ground-mounted systems that may be located on many acres of land.
Millions of Californians are not able to install solar PV systems on their rooftops because of poor rooftop solar orientation, limited or no space, financial restrictions, or an inability to install a system because they live in rental or multi-family housing units (Roth 2015). SDG&E estimates that less than 30 percent of its customers can take advantage of rooftop solar PV installations (SDG&E 2012). In February 2015 the California CPUC began implementation of the Green Tariff Shared Renewables program to expand access to renewable energy resources for consumers like these, and to encourage more community shared
• Encourage Community Solar electricity rates that are at or below the cost of similarly-sized residential solar PV systems
• Consider how the County can become a subscriber to a Community Solar system and how it could profit from managing Community Solar installations, such as through leasing county land/space to developers or investing in its own Community Solar PV installations
• Allocate/reserve a portion of any new Community Solar project to low-income customers (for example a 5 percent set-aside)
• Get involved in the implementation and regulations discussion stemming from SB 43 in the near future, looking for ways to make Community Solar work in the County
Definition
While California leads the nation in rooftop solar PV installations, many ratepayers are not able to install PV systems because they have limited solar access, they cannot afford the current price of solar with existing financing schemes, or they do not own the roof they live under (e.g., a renter in a multi-family apartment building).
Community Solar is recognized as an innovative approach to reducing greenhouse gas (GHG) emissions and lowering the cost of solar photovoltaics (PV) electricity through economies-of-scale. Community Solar helps avoid the traditionally high upfront costs of solar by spreading the investment among many players.
Community Solar is also sometimes referred to as community shared solar or solar gardens. Community Solar arrays range in size from those small enough to be installed on a building’s rooftop to larger ground-mounted systems that may be located on many acres of land. An average single-family home would offset 100 percent of its electricity usage with about 2 to 5 kilowatts of solar power.
1 - 208

renewables programs (CPUC 2015). Community Solar is also sometimes referred to as community shared solar or solar gardens.
5.15.1.2. Value Proposition & Benefits
While California leads the nation in rooftop solar PV installations, many ratepayers are not able to install PV systems because they have limited solar access, they cannot afford the current price of solar with existing financing schemes, or they do not own the roof they live under (for example, a renter in a multi-family apartment building). Apartment renters and businesses that rent or lease their space are often restricted from receiving the benefits of rooftop solar PV, even when they do have adequate space and orientation, and are willing to pay for it. Advocates of Community Solar note that since these same taxpayers and utility ratepayers already pay into solar incentive programs via their utility bills, they deserve access to solar opportunities.
Community Solar helps avoid the traditionally high upfront costs of solar by spreading the investment among many players. Additional benefits of Community Solar are that sites with high solar potential become more viable for development when multiple subscribers are sharing the costs (Postal 2014). It also supports the local solar industry, and can reduce utility transmission and distribution (T & D) costs when placed within the County. It should be noted that a Community Solar initiative can thrive as part of Consumer Choice Aggregation (CCA), and also without it.
5.15.1.3. How Community Solar Functions
A third party developer builds a solar photovoltaic array, and individual electric utility customers (“subscribers”) are able to purchase either a set number of panels or a specified amount of solar generated electricity from the third party. The third party works directly with the utility supplying electricity to the grid to coordinate all of the interconnection requirements and ensure that the individuals purchasing solar from the array (either via panels or in a specific amount of electricity generated) are credited appropriately for such purchase by their electric utility. What separates Community Solar from other solar programs is that the solar arrays are tied in to the existing utility grid but are usually not located on the subscriber’s property.
1 - 209

FIGURE 5-4. Shared Renewables Configuration of Participants
Source: CleanTechnica.com
Subscribers are able to receive their pro rata share of solar credits to their utility bill through multiple mechanisms. Depending upon the state involved, these mechanisms can include net metering,92 group billing, joint ownership or Virtual Net Metering (VNM). VNM is the California policy used for Community Solar. VNM is a tariff arrangement that traditionally is used to enable a property owner, such as an apartment building owner,to allocate a solar system's energy credits to other building’s residents. In the case of Community Solar, VNM (which is allowed by California regulators) is used instead by a developer of a solar project to allow multiple people to benefit from a solar system.93 Community Solar essentially expands the application of VNM beyond the traditional application on a single building. This also allows for larger projects, since they are not limited by the size of one building’s rooftop.
A Community Solar project in the County of San Diego can be proposed by a third party when the SDG&E Company issues a Request for Proposals (RFP) for a set amount of photovoltaic (PV) power. An RFP must take place for a Community Solar project; it formalizes the amount of power to be generated and purchased, and to whom that power can be sold to in the County. The third party that wins the RFP arranges for the construction of a solar array (for example, in rural, unincorporated eastern San Diego County) that meets the amount of PV power described in the RFP. The SDG&E Company may also offer Community Solar on its own without going through a third party. Again, Community Solar arrays range in size from those small enough to be installed on a building’s rooftop to larger ground-mounted systems that may be located on many acres of land. The power generated from this array can then be sold to people or organizations located away from the array (for example, in incorporated western San Diego County, if allowed by regulators).
5.15.1.4. Structure and Budget (Costs)
There are three generally recognized models for a Community Solar project: utility-owned, privately owned, and non-profit sponsored. Depending upon the final regulations following SB 43, all three of these
92 Please see the Financing section of this report for more details about net metering. Since Virtual Net Metering is not discussed in detail in the Financing Section, a short description of it is included in this Best Practice. 93 See http://www.cpuc.ca.gov/PUC/energy/DistGen/netmetering.htm.
1 - 210

models may be available to the County. Table A below provides details on their distinguishing factors.94 Each has its own set of advantages and disadvantages related to the allocation of costs and benefits, financial considerations, and other legal or regulatory issues. The most common projects are utility-owned and operated because of their existing industry expertise and motivation to meet relevant legislative or regulatory requirements, such as a renewable portfolio standard (RPS) and/or greenhouse gas (GHG) reductions. Municipal and rural electric cooperative utilities in particular are starting to build community solar projects to meet customer demand (Hunt 2014).
Community Solar agreements can be structured to own or lease. These agreements can be incorporated into the design of new developments and communities, and also into long-standing, existing communities. Depending upon the ultimate regulations of SB 43, the County could potentially participate both as an owner, and a purchaser, of solar powered electricity through Community Solar. The Community Solar construction phase creates jobs, as does the maintenance required after construction is complete.
Financial and time-saving permitting incentives can be structured specifically by the County to locate Community Solar projects in unincorporated communities, or elsewhere. People that buy into a Community Solar program tend to come from multi-family housing projects and from dense communities where access to solar has been traditionally limited. Community Solar projects keep energy dollars in the County, which is important to some. It is possible to continue to own one’s share in a Community Solar project after moving in some cases (Hunt 2014).
Officials with Sun Share, a for-profit company responsible for multiple Community Solar projects around the country, maintain that 66 construction jobs and 35 ongoing jobs are created for every 3 MW of Community Solar. These same officials say that this same 3 MW of new Community Solar is responsible for an additional $7-10 million in total estimated economic benefit during construction (Postal 2014).
In some projects, there has been a 1kW minimum subscription purchase. In Colorado, where there are many Community Solar projects, no single subscriber can be allocated more than 40 percent of a Community Solar project.95 Some developers have allocated 5 percent of a Community Solar project to low-income customers. Projects usually take less than a one year to install, depending upon the size (Hunt 2014).
94 This table is based on information provided in “A Guide to Community Shared Solar,” page 9, NREL, 2012.) 95 The Venetucci Farms Community Solar project in Colorado Springs is a good example of a typical project. It consists of 2,520 panels, with a capacity of 579 kW. It was made available to all customers of the local municipal utility, the Colorado Springs Utilities company. The PV panels cost $550 each and customers were required to lease a minimum of two panels each. The entire array was sold out in 10 weeks to 350 residential customers and two educational institutions. (Venetucci Farm, 2014; Fox News, 2011). Utilities are allowed to recover transmission and distribution costs for Community Solar projects in Colorado, which makes it more attractive to them.
1 - 211

TABLE 5-17. Three Dominant Models for Community Solar
Utility Private Investment Nonprofit Managed
Owned By Utility or third party Investors Nonprofit
Financed By Utility, grants, ratepayer subscriptions
Member investments, grants, incentives
Memberships, donor contributions, grants
Hosted By Utility or third party Third party Nonprofit
Subscriber Profile Electricity rate payers of the utility
Community investors Donors, members
Subscriber Motive Offset personal electricity use Return on investment; offset personal electricity use
Return on investment; philanthropy
Long-term Strategy of Sponsor [1]
- Offer solar options
- Add solar generation (possibly for Renewable Portfolio Standard)
- Sell system to host
- Retain for electricity production
Retain for electricity production for life of system
Examples - SMUD96
– SolarShares Program
- Tucson Electric Power – Bright Tucson Program (Tucson, AZ)
- University Park Community Solar, LLC (University Park, MD)
- Clean Energy Collective, LLC (Carbondale, CO)
- Island Community Solar, LLC (Coupeville, WA)
- SDCHC Hacienda Townhomes (San Diego Housing Corporation)
- Winthrop Community Solar Project (Winthrop, WA)
- Solar for Sakai (Bainbridge, WA)
Source: A Community Guide to Solar: Utility, Private, and Non-profit Project Development, National Renewable Energy Laboratory, DOE/GO-102011-3189, January 2011.
5.15.2. Application to SD County (Recommendations)
5.15.2.1. Existing Context
In California, Community Solar requirements are currently going through the CPUC rulemaking process (Renewables 2014). In 2013, California enacted the Green Tariff Shared Renewables Program (SB 43) to allow investor-owned utilities to administer a program that allows utility customers to voluntarily purchase electricity from renewable energy facilities such as a Community Solar installation.97 SB 43 directs the three largest investor-owned utilities of California, including SDG&E, to build 600 MW of renewables-generated electricity for subscribers, and earmarks 100 MW for disadvantaged communities. Community Solar
96 In the Sacramento Municipal Utility District (SMUD), customers can already meet 20-40 percent of their electricity use by purchasing .5kW shares in a Community Solar project. In return, the SMUD customer receives a credit on his/her monthly bill in relation to the quantity of output they subscribed to through the program. 97 Other states that have enacted Community Solar legislation include Colorado, Delaware, Massachusetts, Maine, Minnesota, New Hampshire, Vermont, Washington, and the District of Columbia.
1 - 212

projects could be as large as 20 megawatts (160 acres), which could power over 5,000 average homes. Final program requirements and implementation details are expected to be announced later this year.
The County of San Diego already has one notable Community Solar project. The San Diego Community Housing Corporation (SDCHC), a nonprofit organization partnered with a third party, Everyday Energy, to build and install a 20 kW system on a Hacienda Townhomes property. Everyday Energy installed and owns the system on the 52-unit apartment building, taking advantage of the tax benefits that are not available to the SDCHC. SDCHC signed a 20-year solar services agreement with Everyday Energy under which they will pay a flat fee to cover maintenance and electric services for the installation. An electric meter measures the energy flow directly to the grid, and the SDG&E Company credits the tenants and common areas as directed in the Virtual Net Metering (VNM) agreement. Residents are scheduled to save a projected 30 percent on their electric bills through this Community Solar project. The tenants pay their own electricity bills, and purchase their portion of solar through Everyday Energy on these same bills.
5.15.2.2. Next Steps
The County of San Diego may play a leading role in advancing Community Solar itself by subscribing to SDG&E’s Community Solar program once program design is finalized, thereby increasing its own percentage of renewable-generated electricity. The County may also consider a policy to require appropriately sized segments of land (or roof space) at future multi-family projects be dedicated for Community Solar installations. Notably, the County may consider how to lease some of its own land for Community Solar projects, or it may be able to design its own Community Solar program depending on future related CCA rules and regulations, should it decide to pursue CCA.
1 - 213
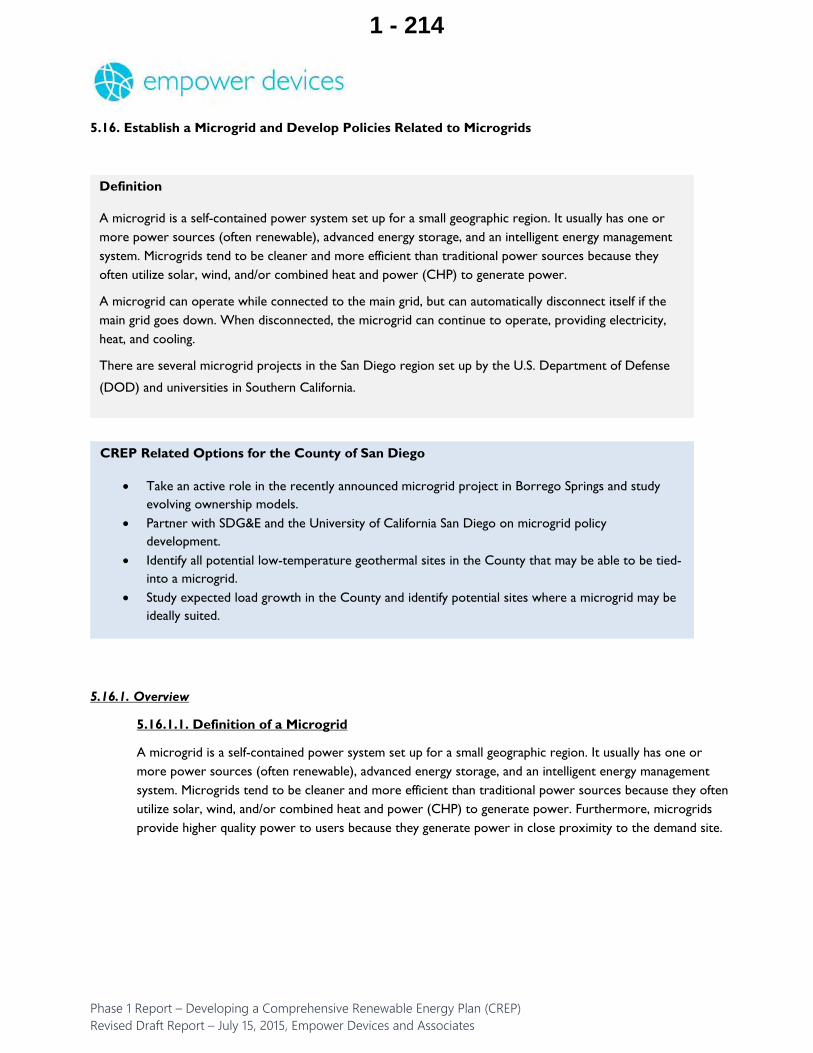
5.16. Establish a Microgrid and Develop Policies Related to Microgrids
5.16.1. Overview
5.16.1.1. Definition of a Microgrid
A microgrid is a self-contained power system set up for a small geographic region. It usually has one or more power sources (often renewable), advanced energy storage, and an intelligent energy management system. Microgrids tend to be cleaner and more efficient than traditional power sources because they often utilize solar, wind, and/or combined heat and power (CHP) to generate power. Furthermore, microgrids provide higher quality power to users because they generate power in close proximity to the demand site.
CREP Related Options for the County of San Diego
Take an active role in the recently announced microgrid project in Borrego Springs and study evolving ownership models. Partner with SDG&E and the University of California San Diego on microgrid policy development. Identify all potential low-temperature geothermal sites in the County that may be able to be tied-into a microgrid. Study expected load growth in the County and identify potential sites where a microgrid may be ideally suited.
Definition
A microgrid is a self-contained power system set up for a small geographic region. It usually has one or more power sources (often renewable), advanced energy storage, and an intelligent energy management system. Microgrids tend to be cleaner and more efficient than traditional power sources because they often utilize solar, wind, and/or combined heat and power (CHP) to generate power.
A microgrid can operate while connected to the main grid, but can automatically disconnect itself if the main grid goes down. When disconnected, the microgrid can continue to operate, providing electricity, heat, and cooling.
There are several microgrid projects in the San Diego region set up by the U.S. Department of Defense
(DOD) and universities in Southern California.
1 - 214
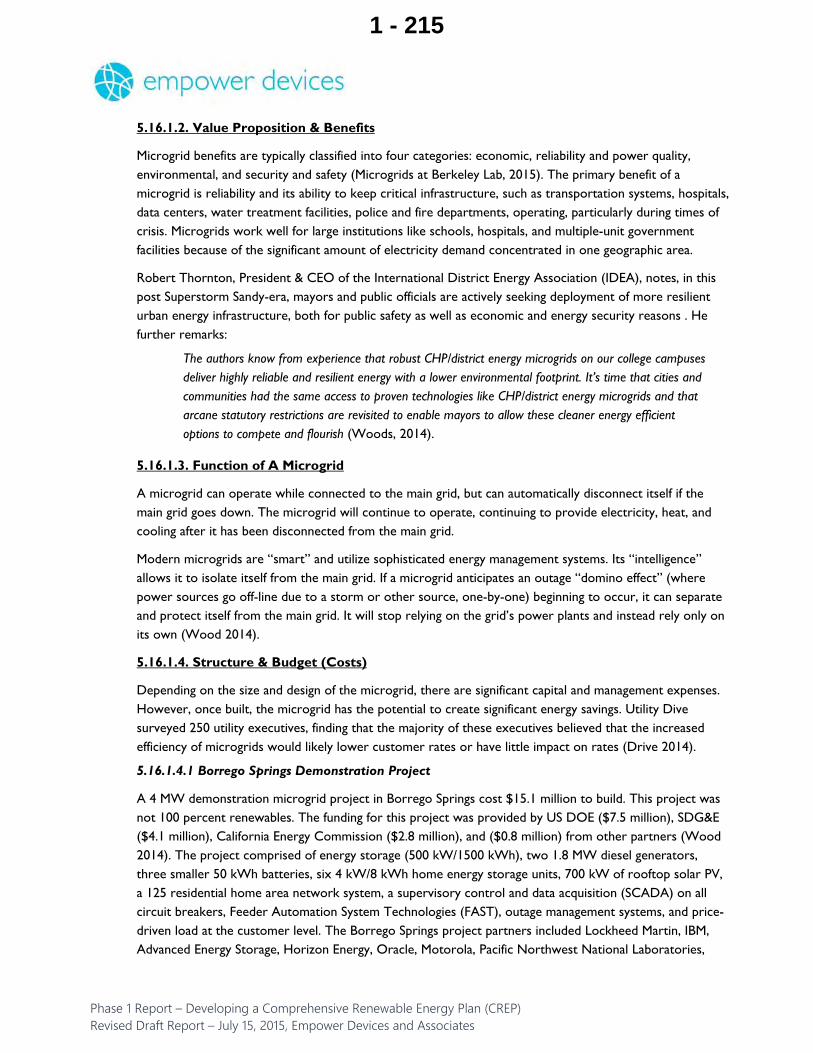
5.16.1.2. Value Proposition & Benefits
Microgrid benefits are typically classified into four categories: economic, reliability and power quality, environmental, and security and safety (Microgrids at Berkeley Lab, 2015). The primary benefit of a microgrid is reliability and its ability to keep critical infrastructure, such as transportation systems, hospitals, data centers, water treatment facilities, police and fire departments, operating, particularly during times of crisis. Microgrids work well for large institutions like schools, hospitals, and multiple-unit government facilities because of the significant amount of electricity demand concentrated in one geographic area.
Robert Thornton, President & CEO of the International District Energy Association (IDEA), notes, in this post Superstorm Sandy-era, mayors and public officials are actively seeking deployment of more resilient urban energy infrastructure, both for public safety as well as economic and energy security reasons . He further remarks:
The authors know from experience that robust CHP/district energy microgrids on our college campuses deliver highly reliable and resilient energy with a lower environmental footprint. It’s time that cities and communities had the same access to proven technologies like CHP/district energy microgrids and that arcane statutory restrictions are revisited to enable mayors to allow these cleaner energy efficient options to compete and flourish (Woods, 2014).
5.16.1.3. Function of A Microgrid
A microgrid can operate while connected to the main grid, but can automatically disconnect itself if the main grid goes down. The microgrid will continue to operate, continuing to provide electricity, heat, and cooling after it has been disconnected from the main grid.
Modern microgrids are “smart” and utilize sophisticated energy management systems. Its “intelligence” allows it to isolate itself from the main grid. If a microgrid anticipates an outage “domino effect” (where power sources go off-line due to a storm or other source, one-by-one) beginning to occur, it can separate and protect itself from the main grid. It will stop relying on the grid’s power plants and instead rely only on its own (Wood 2014).
5.16.1.4. Structure & Budget (Costs)
Depending on the size and design of the microgrid, there are significant capital and management expenses. However, once built, the microgrid has the potential to create significant energy savings. Utility Dive surveyed 250 utility executives, finding that the majority of these executives believed that the increased efficiency of microgrids would likely lower customer rates or have little impact on rates (Drive 2014).
5.16.1.4.1 Borrego Springs Demonstration Project
A 4 MW demonstration microgrid project in Borrego Springs cost $15.1 million to build. This project was not 100 percent renewables. The funding for this project was provided by US DOE ($7.5 million), SDG&E ($4.1 million), California Energy Commission ($2.8 million), and ($0.8 million) from other partners (Wood 2014). The project comprised of energy storage (500 kW/1500 kWh), two 1.8 MW diesel generators, three smaller 50 kWh batteries, six 4 kW/8 kWh home energy storage units, 700 kW of rooftop solar PV, a 125 residential home area network system, a supervisory control and data acquisition (SCADA) on all circuit breakers, Feeder Automation System Technologies (FAST), outage management systems, and price-driven load at the customer level. The Borrego Springs project partners included Lockheed Martin, IBM, Advanced Energy Storage, Horizon Energy, Oracle, Motorola, Pacific Northwest National Laboratories,
1 - 215

UCSD, SDG&E, California Energy Commission, and a variety of smaller partners (Microgrids at Berkeley Lab, 2015)
5.16.2. Application for County of San Diego (Recommendations)
5.16.2.1. Existing Context
There are several microgrid projects in the San Diego region set up by the U.S. Department of Defense (DOD) and universities in Southern California. The most recent microgrid project was announced in February 2015, also in Borrego Springs. This project, led by SDG&E, will be all renewables and tied into a 26 Megawatt Borrego solar facility, and ultimately linked to 2,800 individual Borrego Springs’ meters (Trabish 2015). The California Energy Commission provided $5 million to the project.
While the University of California, San Diego’s (UCSD) microgrid is a demonstration or proof-of-concept project, it is one of the larger, premier, state-of-the-art microgrid projects in the world. UCSD’s microgrid ensures reliable power to 45,000 people and 450 buildings. It generates 92 percent of the campuses electricity and 95 percent of the heating and cooling requirements. It also saves the university approximately $850,000 per month or $10.2 million per year in retail energy costs. From an energy security perspective, UCSD is SDG&E’s biggest demand response customer. UCSD has the ability to shed up to 10 MW of demand when called upon by SDG&E. The University has 4,000 thermostats under remote control (Paulos 2014). Microgrids work well for large institutions like schools, hospitals, and multiple-unit government facilities because of the significant amount of electricity demand concentrated in one geographic area.
5.16.2.2. Next Steps
If the County were to pursue a similar size project, in addition to the capital costs, the County would need to allocate one FTE project manager for up to two years. The position would likely drop to a third or half-time in the third year.
Notably, low-temperature geothermal resources can be tied into microgrids where these sites exist in the County. The County may want to identify these geothermal resources as part of the CREP.
5.16.3. Who Else Is Doing It
In February 2014, Governor Christie announced the creation of a $200 million New Jersey Energy Resilience Bank to fund projects that would ensure a highly reliable power supply to critical public facilities such as water and wastewater treatment plants, hospitals, shelters, and emergency response networks in the event the main grid fails (News 2014).
Microgrids and renewable energy have also become a major part of the U.S. Department of Defense’s (DOD) energy strategy. Increasing energy costs, greenhouse gas emissions, energy security, and critical response times are major risks that the DOD needs to mitigate (Marqusee 2012). In 2011, DOD facilities used $4.1 billion worth of energy and were responsible for 40 percent off DOD’s GHG emissions. Additionally, with the fragility of the commercial grid, relying on it and/or diesel generators while executing critical missions is seen as an unacceptable risk.
In 2012 and 2013, DOD installed microgrids at 29 Palms Marine Base and at Camp Pendleton. DOD, the Department of Energy (DOE), and the Department of Homeland Security (DHS) are also running three microgrid
1 - 216
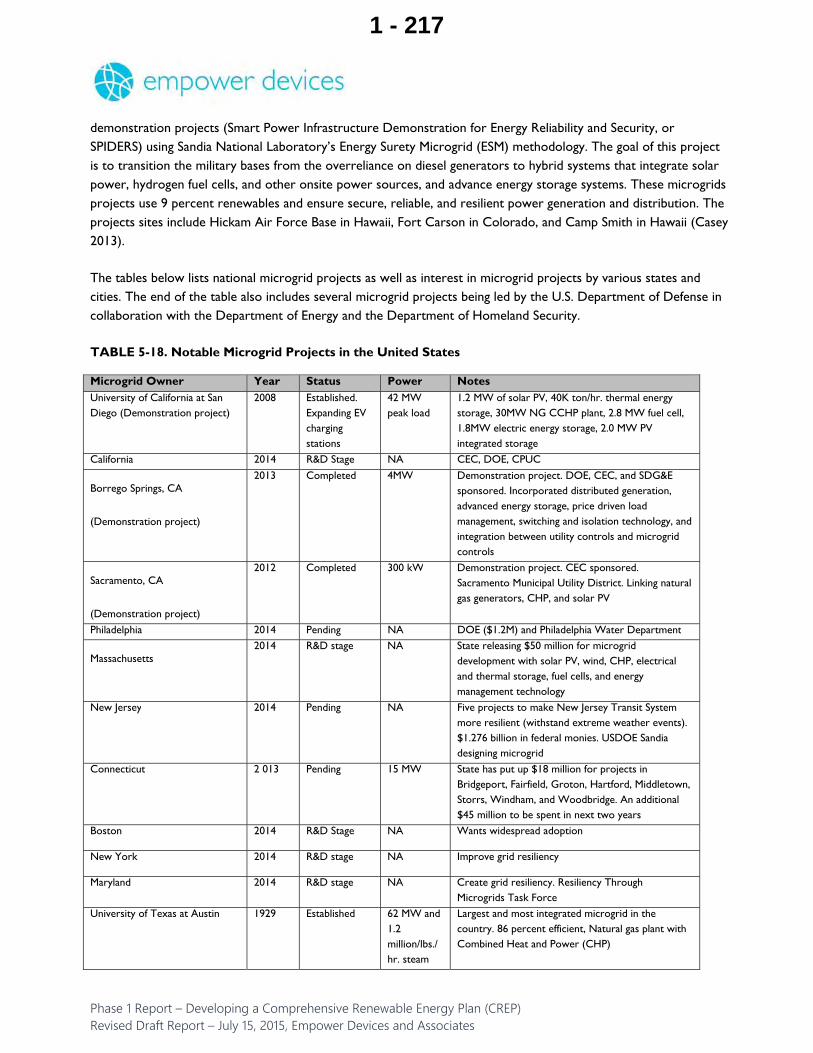
demonstration projects (Smart Power Infrastructure Demonstration for Energy Reliability and Security, or SPIDERS) using Sandia National Laboratory’s Energy Surety Microgrid (ESM) methodology. The goal of this project is to transition the military bases from the overreliance on diesel generators to hybrid systems that integrate solar power, hydrogen fuel cells, and other onsite power sources, and advance energy storage systems. These microgrids projects use 9 percent renewables and ensure secure, reliable, and resilient power generation and distribution. The projects sites include Hickam Air Force Base in Hawaii, Fort Carson in Colorado, and Camp Smith in Hawaii (Casey 2013).
The tables below lists national microgrid projects as well as interest in microgrid projects by various states and cities. The end of the table also includes several microgrid projects being led by the U.S. Department of Defense in collaboration with the Department of Energy and the Department of Homeland Security.
TABLE 5-18. Notable Microgrid Projects in the United States
Microgrid Owner Year Status Power Notes University of California at San Diego (Demonstration project)
2008 Established. Expanding EV charging stations
42 MW peak load
1.2 MW of solar PV, 40K ton/hr. thermal energy storage, 30MW NG CCHP plant, 2.8 MW fuel cell, 1.8MW electric energy storage, 2.0 MW PV integrated storage
California 2014 R&D Stage NA CEC, DOE, CPUC
Borrego Springs, CA
(Demonstration project)
2013 Completed 4MW Demonstration project. DOE, CEC, and SDG&E sponsored. Incorporated distributed generation, advanced energy storage, price driven load management, switching and isolation technology, and integration between utility controls and microgrid controls
Sacramento, CA
(Demonstration project)
2012 Completed 300 kW Demonstration project. CEC sponsored. Sacramento Municipal Utility District. Linking natural gas generators, CHP, and solar PV
Philadelphia 2014 Pending NA DOE ($1.2M) and Philadelphia Water Department
Massachusetts 2014 R&D stage NA State releasing $50 million for microgrid
development with solar PV, wind, CHP, electrical and thermal storage, fuel cells, and energy management technology
New Jersey 2014 Pending NA Five projects to make New Jersey Transit System more resilient (withstand extreme weather events). $1.276 billion in federal monies. USDOE Sandia designing microgrid
Connecticut 2 013 Pending 15 MW State has put up $18 million for projects in Bridgeport, Fairfield, Groton, Hartford, Middletown, Storrs, Windham, and Woodbridge. An additional $45 million to be spent in next two years
Boston 2014 R&D Stage NA Wants widespread adoption
New York 2014 R&D stage NA Improve grid resiliency
Maryland 2014 R&D stage NA Create grid resiliency. Resiliency Through Microgrids Task Force
University of Texas at Austin
1929 Established 62 MW and 1.2 million/lbs./hr. steam
Largest and most integrated microgrid in the country. 86 percent efficient, Natural gas plant with Combined Heat and Power (CHP)
1 - 217

TABLE 5-19. U.S. Department of Defense Microgrid Projects in Collaboration with the Department of Energy and the Department of Homeland Security
Public Jurisdiction Year Status Power Notes 29 Palms Marine Base, CA (Demonstration project)
2012 Completed NA Demonstration project. DoD and ESTCP sponsored. Cogen and solar PV
Camp Pendleton, CA (Demonstration project)
2013 Completed NA CEC, DoD, DOE Sandia, Contractor sponsored. Incorporates solar PV, energy efficiency, and energy storage technology. $2.8 million project
Demonstration project between DoE, DoD, DHS Joint Base Peal Harbor-Hickman, HI (DOE Sandia’s SPIDERS Microgrid project)
2013 Completed 146 kW Solar PV, 50 kW Wind
Demonstration project between DoE, DoD, DHS
(DOE Sandia’s SPIDERS Microgrid project)
2014 Pending 2 MW Solar PV
Demonstration project between DoE, DoD, DHS Camp H.M. Smith
(DOE Sandia’s SPIDERS Microgrid project)
2014 Pending 5 MW Solar PV and diesel
Demonstration project between DoE, DoD, DHS
1 - 218

5.17. Establish Electric Vehicle Programs (as the first step toward integrating a more complete review of broader transportation services )
In 2014, more than 47,000 plug-in vehicles (PEVs) were sold in California – a 30 percent increase over 2013 sales – with cumulative statewide sales exceeding 118,000 since 2010. California PEV sales represent more than 40 percent of the national market (CACSE 2012). The market for plug-in electric vehicles is growing every month – and with it, the need for more places to charge. Utilities estimate that 80 to 90 percent of PEV charging occurs at home (California Plug-in Electric Vehicle Collaborative, 2015). With the potential to use as much as 75 percent of the electrical load that the typical home in San Diego County imposes on the grid, EVs are one of the biggest game changers of the last 100 years.
Electric Vehicles (EVs) both consume and produce electricity. As such, they are also potential sources of intermittent power, just like a solar photovoltaic (PV) panel, and also a place to store electric power (via batteries). SDG&E is evaluating the interaction of EVs and batteries in their power mix (SDG&E, 2015). EV initiatives and programs can further help the County meet CAP-related and other greenhouse gas (GHG) emission reduction goals, as well as reduce its fuel use and costs as traditional fossil fuels are replaced in the fleet (CaCSE 2012).
EV planning objectives are grouped into four categories for this Best Practice:
Infrastructure Fleets PermittingStorage
1 - 219

5.17.1. Overview
California accounts for about 40 percent of all plug-in cars sold in the country, with more than 100,000 units sold through August 2014 (Bloomberg News, 2014). Twenty thousand of those vehicles are in San Diego County. According to a 2015 report, worldwide revenue from electric vehicle charging services is expected to grow from $152.6 million annually in 2015 to $2.9 billion by 2023, while sales of EV charging systems are expected to grow steadily in the coming years, surpassing 2.5 million by 2023 (Navigant Research, 2015). This has important implications for the County as both a user of EVs and as a potential future supplier of renewable-generated electricity.
The County of San Diego already has an extensive EV network in place. Southern California utilities are aggressively pursuing EV development, so local EVs continue to gain market share. In 2012, Governor Brown issued an executive order that established the goal of getting 1.5 million zero-emission vehicles (ZEVs) on California roads by 2025.
In 2012, SANDAG established a Regional Electric Vehicle Infrastructure (REVI) Working Group which published a Regional Plug-In Vehicle Readiness Plan in January 2014 (SANDAG 2014). This final report includes an overview of planning and siting issues and typical barriers encountered by EV proponents including:
A general lack of knowledge of PEVs and EVSE issues
The need for ongoing regional collaboration for public Electric Vehicle Supply Equipment (EVSE) siting
Few PEVs in government fleets
CREP-Related Options for the County of San Diego
EV Infrastructure
Promote the benefits of the solar- and Electric Vehicle-ready ordinance
Consider public EV charging stations as a future source of revenue generation, and analyze this possibility in Phase II of the CREP
Work closely with SDG&E on the optimum future locations for public EV charging stations Create and adopt a formal PEV program working with the REVI and SANDAG Encourage new multi-family buildings to include pre-wiring for Level 2 EVSE as a percentage of total spaces
Encourage businesses to install Level 2 EVSE charging systems for their employees.
County fleet
Increase the number of light duty EVs in the County fleet
Permitting
Work with incorporated towns and cities to develop standardized permitting and inspection processes as well as installation procedures for builders and contractors.
Storage
Work with SDG&E on its recently revealed (informal) plans to start energy storage training classes in the future, as a workforce development opportunity.
1 - 220

Lack of EVSE infrastructure and installations
EVSE permitting/inspection protocols lacking
Few EVSE at multi-unit dwellings
Limited commercial and workplace charging
New zoning and parking rules
Updating building codes to accommodate EVs
Training and education for municipal staff and electrical contractors
On-peak charging and TOU utility rates98
The County has done well in addressing many of these barriers, namely installation of EVSE charging stations for County and public use, plans for additional charging station installations, the planned addition of more EVs to the County fleet, and the recently-adopted Solar PV- and EV-Ready ordinance.
5.17.1.1. The Case for Electric Vehicles
Electric vehicles (EVs) can play a very important role in San Diego County’s path towards a clean energy economy.99 Electric vehicles are potential sources of intermittent power, just like a solar photovoltaic (PV) panel, and also a place to store electric power (via batteries). SDG&E is evaluating the interaction of EVs and batteries in its power mix (SDG&E, 2015).100 Not only do EVs both consume and produce electricity, transportation plays a large role in the County of San Diego from an emissions and healthcare perspective. With the potential to use as much as 75 percent of the electrical load that the typical home in San Diego County imposes on the grid, EVs are one of the biggest game changers of the last 100 years.101
The benefits of PEVs include improved air quality, reduced greenhouse gas emissions, less reliance on petroleum, significant fuel savings to drivers, and benefits to the local economy. In addition, consumers are beginning to realize that PEVs are fun to drive and can satisfy a large percentage of their daily transportation needs (CEC 2012).
The availability of new vehicle models, greater driving range from improved battery technology, increased availability of charging infrastructure, along with incentives such as carpool lane access, federal tax credits, and state and air district rebates have contributed to an expanding market for PEVs (CaCSE 2012). New
98 SDG&E offers customers two EV TOU rates: 1) EV TOU 2 combines all electricity consumed by a household on a single meter; all PEV and household electricity would use the same meter and benefit from high electricity usage during off-peak hours, and 2) EV TOU allows households to install a separate meter for their PEV, tracking PEV electricity usage separately from the rest of the home. The following figure reflects SDG&E’s TOU rates as of September 1, 2013. For further information, read the Read-in Plug-in Vehicle Readiness Plan. 99 Due to the scope of work designed by the County, electric vehicles (EVs) are the only transportation-related Best Practice to be considered as part of Phase One of the CREP. 100 As reported in late February 2015, SDG&E submitted plans to bid a combination of EVs and storage facilities (batteries) as one energy source to the California Independent System Operator's (CAISO) energy markets. 101 http://www.utilitydive.com/news/6-thought-leaders-on-the-future-of-utility-business-models-regulation/357635/, quote by SDG&E’s Chairman, James Avery, February 2015.
1 - 221

PEVs in California are now available at prices of $13,000 after incentives.102 Many PEVs in 2013 were less expensive than the average new vehicle, at $31,000. Some potential buyers, however, may not have the tax liability to take all of the federal tax credit (CCSE 2012).
Rebate statistics for San Diego County (including all incorporated) from the Center for Sustainable Energy are posted below (CEC, 2013). Please note: BEV is a 100 percent battery-powered electric vehicle and PHEV is a Plug-in Hybrid Electric Vehicle that can also run on gasoline.
TABLE 5-20. Rebates (issued and Reserved) March 2010-February 2015
Rebate Type Quantity Funding
BEV 4,993 $13,283,966
PHEV 2,546 $3,815,817
Other 49 $47,800
Total 7,588 $17,147,583
5.17.1.2. EV Planning at the State and Regional Level
As part of California’s strategy to reduce GHG emissions, the California Energy Commission is developing a statewide Plug-In Electric Vehicle Infrastructure Plan that will provide guidance to local government regarding public infrastructure planning. In addition to Governor Brown’s Executive Order B-16-2012 that directs the state government to help expand the zero-emission vehicle market in California. He also signed Executive Order B-18-2012 that directs state agencies to “identify and pursue opportunities to provide electric vehicle charging stations and accommodate future changing infrastructure demand” (CSE 2015).
In order to enlist the help of local governments with these goals, the U.S. Department of Energy awarded the California Center for Sustainable Energy (CCSE then, now known as the Center for Sustainable Energy (CSE)) funding to assess regional electric vehicle supply equipment (EVSE) and prepare regional stakeholders for accelerated PEV adoption. As a phase one step, the CCSE in 2012 convened a Regional Electric Vehicle Infrastructure (REVI) Working Group. It published a “San Diego Regional Plug-In Electric Vehicle (PEV) Readiness Plan” in January 2014 which includes a host of recommendations and tools for municipalities to implement to address future planning needs (CaPEV 2014).
The second phase of the project was funded by the California Energy Commission and awarded to the San Diego Association of Governments (SANDAG) and CCSE. The goal of the second phase was to establish the San Diego Regional Electric Vehicle Infrastructure (REVI) Working Group, comprised of representatives from local governments, public agencies, utilities, industry, and nonprofits. The goal of REVI is to facilitate the implementation of the recommendations made in the readiness plan (CaCSE 2012). The
102 At market launch in 2011, PEVs initially faced a significant barrier of high cost, with MSRPs ranging from $29,000 - $40,000. Price reductions in 2013 lowered prices to MSRPs of $23,000 - $35,000, with Federal and State incentives reducing this cost by approximately $9,000 - $10,000.
1 - 222

County of San Diego is currently an advisory member of the REVI working group (County of San Diego 2012).
According to the San Diego Regional Plug-In Electric Vehicle (PEV) Readiness Plan, written in 2012 by the Center for Sustainable Energy, some of the benefits and considerations of implementing a PEV program include the following:
Public Health and Environment
Lower greenhouse gas (GHG) emissions
Lower particulate pollution
Lower carcinogens
Improved energy security
Improved resilience
Extra energy storage (in batteries)
Significant annual fuel savings
County PEV initiatives help it meet CAP-related and other greenhouse gas (GHG) emission reduction goals, as well as reduce its fuel use and costs as traditional fossil fuels are replaced in the fleet (CaPEV 2014).103 A 2014 RFP sought qualified companies to install an estimated 30 Level 2 or higher (DC Fast Charging) charging stations for public and County use at 10 County facilities. Six charging stations were installed in December 2014 at a parking garage at Waterfront Park.104
5.17.1.2.1 Forthcoming Changes (2015)
The CPUC approves an annual credit against utility bills or a one-time vehicle rebate (San Diego Union Urban Tribune 2014). Each utility is considering which incentive to provide before they become effective later in 2015. SDG&E reportedly intends to provide an annual bill credit to customers. The Decision (14-12-083) issued December 23, 2014, directs electric IOUs to “allocate Low Carbon Fuel Standard (LCFS) credit revenue to plug-in electric vehicle (PEV) customers by reducing the purchased cost of a PEV or applying the revenue as a credit against the customer’s electric bill annually” (CPUC, 2014).
5.17.2. Components of EV Planning and Developments in San Diego
5.17.2.1. EV Infrastructure: Charging Stations
Whereas more drivers can purchase electric vehicles with the help of tax credits and rebates, the presence of EV infrastructure is just as critical to ensuring further adoption across the region. The market for plug-in electric vehicles is growing every month – and with it, the need for more places to charge. EV demand is
103 EVs relate to Goal #4 and #7 of the County of San Diego’s Strategic Energy Plan 2013-2015. Goal #4 – Transportation and Land Use: “reduce petroleum demand through reduced vehicle demand and vehicle miles traveled, and by encouraging deployment of alternative fuel vehicles;” and Goal #7 – Fleet Fuel Efficiency and Utilization: “manage County fleet vehicle procurement, maintenance, and utilization to increase fuel efficiency, reduce vehicle emissions, and decrease the impact on the environment. ‘ 104 http://www.countynewscenter.com/video?v=155740
1 - 223

likely to increase in multi-family buildings. Utilities estimate that 80 to 90 percent of PEV charging occurs at home (CaPEV 2014). To date, much has been done to accelerate installations of charging equipment in single-family homes. However, less progress has been made in multi-unit dwellings (MUDs), where 34 percent of Californians reside (CaPEV 2014).105
Two EVSE projects were identified in the City of San Diego that demonstrate what some property owners have already done to meet demand. CityFront Terrace has 320 residents and installed 20 Level 2 EVSE chargers that are metered so that drivers pay directly for use. It costs approximately $4,000 for each of the EV parking spaces (CaPEV 2014). Also, the Towers at Costa Verde has more than 590 residents, with 10 chargers installed and 10 more pre-wired, at a total cost of $21,000 (SDG&E 2011). As the County continues to grow, demand for EVSE installations at smaller complexes will certainly increase as well. Los Angeles and Palo Alto ordinances require new multi-family and commercial buildings to pre-wire a percentage of parking spaces and install a minimum number of operable Level 2 charging stations.
Charging stations beyond residential buildings complete the network of EV infrastructure. EV research dollars have recently been injected into the County. The CEC’s Alternative and Renewable Fuel and Vehicle Technology Program, which has also been providing funding to the UC San Diego vehicle charging program (see text box below), invested approximately $90 million in 2013 to encourage the development and use of new technologies, and alternative and renewable fuels, to help the state meet its climate change goals (CEC 2013). According to Commission Chair Weisenmiller,
These investments in charging infrastructure are crucial to fulfilling the Governor's executive order to significantly expand the market for zero emission vehicles in California. In addition, they will improve air quality, reduce petroleum use and create jobs (CEC 2013).
Many new jobs and new opportunities are said to be coming to California through the UC San Diego microgrid and electric vehicle charging projects, which are further explained below (Paulos, 2014).
105 The U.S. Green Building Council issues LEED points toward certification when charging equipment is installed in a multi-family home.
1 - 224

5.17.2.2. Electric Vehicle Fleets
In addition to providing charging opportunities through infrastructure, encouraging the use of electric vehicles in public and private fleets is another important pillar of EV planning. The Port of San Diego began adding electric vehicles to its fleet in 2008 and the University of California, San Diego (UCSD) has more than 300 electric vehicles of various sizes for use on campus..106 Federal Express and Frito Lay are integrating all-electric delivery trucks into their San Diego fleets and elsewhere across the country.
The large rise in Plug-In Electric Vehicle (PEV) adoption in 2011 can partly be attributed to the launch of the rental company, car2go and its fleet of all-electric car sharing vehicles. Now nationwide, the car2go program was launched in San Diego in 2011. The program offers members access to more than 300 two-passenger, all-electric vehicles across 30 square miles of San Diego, with the ability to locate available cars and charging stations through its SmartPhone application. Users pay a one-time registraion fee of $35 and usage rates of $0.41 per mile (max of $14.99 per hour) or no more than $84.99 per day. If the County of
106 The San Diego region was also part of the U.S Department of Energy’s EV Project, which installed 435 nonresidential AC Level 2 PEV charging stations as well as four DCFC units in the San Diego Metropolitan Statistical Area (MSA) (CSE, 2012).
Lessons to Learn:
University of California, San Diego EV Stations
The University of California, San Diego, with support from the California Energy Commission (CEC), is on course to create the largest, most diverse range of electric vehicle charging stations at any university in the world. As of June 2013, the university installed 54 charging outlets, with more than 70 percent of them available for public use – the most of any university in the world (Margoni 2013).
Additional CEC funding will be used to enhance the vehicle-charging network at UC San Diego. Level 2 electric vehicle charging systems are expected to become the most commonly used charging systems. They use 208-240 volt power and typically provide 10 to 20 miles of range for each hour of charging for a passenger vehicle. Level 1 charging systems use 110 volt power, standard in most households, and typically provide 2 to 5 miles of range for each hour of charging. DC fast-charging systems are emerging as a much faster way to charge PEVs, typically providing 60 to 80 miles of range in just 20 minutes of charging. UC San Diego also recently installed “high IQ” chargers with Daimler and RWE that adjusts charging rates based on customers’ needs, grid needs, and dynamic pricing.
Electric vehicles are obviously part of the campus plan as well. The university has been phasing in a new plan with Daimler. Students, staff, and faculty are able to lease an electric smart car for only $115 a month, with a plan for on-campus charging. Almost half of UC San Diego’s fleet of more than 800 vehicles has been converted to near zero-emission vehicles. Diesel fuel has been replaced with ultra-low sulfur biodiesel, and many buses, street sweepers, cars, and trucks have been converted to compressed natural gas. The fleet also includes five Nissan Leafs and more than 50 hybrid-electric vehicles. The university's "green fleet" was ranked 14th overall in the nation and received the highest ranking of any university by Government Green Fleet in 2012.
1 - 225

San Diego elects to expand its own fleet of electric vehicles, the aforementioned entities could be seen as potential partners with experience to learn from.
5.17.2.2.1 Value Proposition and Benefits
Continuing to expand its own EV fleet vehicle presence can be fiscally and environmentally beneficial to the County.
The City of Indianapolis’s EV project provides one example of quantifiable benefits. This one program107 is projected to save the City approximately $8.7 million between 2016 and 2026. The first 14 plug-in hybrids deployed in Indianapolis’ Freedom Fleet have each saved an average of 53 gallons of gasoline per month. Each of the 500 EVs deployed by the beginning of 2016 will save at least 550-600 gallons of gas annually. Each Freedom Fleet vehicle is expected to save taxpayers about $12,000 per vehicle over the 10-year life cycle of the car.108 Over the next 10 years, the City of Indianapolis is expected to avoid consuming 2.2 million gallons of expensive gasoline.
Vehicle incentives and rebates exist that the County of San Diego can participate in.
Local governments and public agencies can take advantage of PEV rebates offered by the Clean Vehicle Rebate Project for up to 20 vehicles per year
The California Hybrid Truck and Bus Voucher Incentive Program is available to public entities purchasing a hybrid or electric truck or bus. (http://www.californiahvip.org/).
5.17.2.3. Storage Developments
The U.S. Department of Defense, as well as PEV adopters like UCSD are testing PEVs as an energy resource in their renewable energy and energy security strategy. Battery and PEV manufacturers are also teaming with utilities and state governments in an attempt to lower the cost of batteries and create viable storage technologies, long considered the “holy grail” for renewable energy, since the energy produced by solar, wind, and other renewables can be generated, stored, and released when it is the most profitable to do so.
5.17.2.4. Permitting
The Regional Plug-in Electric Vehicle Readiness Plan notes that the region currently has many local permitting processes, which have limited EVSE installations. Adopting a common standard permitting and
107 In May 2014, the Cities of Indianapolis and Sacramento signed a Memorandum of Understanding (MOU) to work together and share resources to advance each city’s PEV fleet conversion, install public PEV charging stations, promote technologies that improve efficiency and reduce the dependence on fossil fuels, promote economic development in the alternative fuels industries, promote energy efficiency programs, install smart meters, incorporate grid technologies, install renewable energy technology, and promote sustainability policies and programs (Indianapolis, C. o. (2012). "The City Fleet and Energy Security." from http://www.indy.gov/egov/mayor/initiatives/pages/indyenergysecurity.aspx. The County of San Diego can entertain a similar MOU with a number of EV-smart county governments. With no EVs in the current fleet, there is room for advancement.
108 Fuel costs for the new EVs will be about one-third of the old gas vehicles’ costs as a result. Each gasoline-powered sedan in Indianapolis’s fleet would have cost taxpayers approximately $9,000 per year over the next decade, including purchase, fuel, maintenance and insurance (Ayre, 2014). Indianapolis is also planning on leading the nation with the adoption of police vehicles that get 40-50 miles per gallon and meet all the power, safety, range, and size needs of a traditional police car. The city anticipates that a transition to this new police fleet could save the city $10 million per year.
1 - 226

inspection process and checklist of requirements will streamline the installation of EVSE systems in residential, commercial, public, and workplace settings even further. Examples provided in the Readiness Plan include items such as electrical load calculations, and manufacturer information.
5.17.3. Next Steps
Based on energy programs included in the County of San Diego Strategic Energy Plan 2013-2015, the adoption of a formal PEV program is a logical next step for the County of San Diego. A successful program will involve guiding the adoption of land use policies (siting charging stations, PEV parking), operations policies (county fleet, employee commuting), PEV incentive policies (rebates), public infrastructure development (PEV charging stations), and ordinances (CALGreen). In order to implement such a program, the County will likely need at least one, possibly two, FTEs to manage the program (Rabago 2014). The purchasing of County PEV fleet vehicles and County charging facilities and public PEV charging stations are capital expenditures that must be budgeted based on technology and implementation costs.
In order to nurture the PEV market, the County, local and regional governments, and public agencies can develop land use policies and transportation plans that incorporate EVSE, specifically 1,500 public charging stations into San Diego’s public infrastructure network. Initially, these groups must employ the best methods to determine the location of these optimal PEV charging sites. These charging sites can be located on public sites with the most regional benefits, be in a location that reduces driver anxiety, and be optimally located in an inter-regional network that will also include future charging stations (CCSE 2012).
One potential solution for the County of San Diego is leasing, as manufacturers can take the incentives and offer a more attractive lease offer. The majority of California EV owners are leasing, using the $2,500 California rebate to contribute to the down payment. Lease payments of as low as $200 per month can also facilitate significant gas savings. Future strategies now being considered by vehicle makers include separate financing of the battery, which can be structured with the electricity payment as a “bundled solution” that is still less than the price of gasoline. This strategy is now deployed in Europe (by Renault) and in China. Over the next several years, battery prices are also expected to decline, with DOE projecting price-parity with internal combustion engine vehicles by 2022, based on battery pricing dropping from the current range of $500 - $600 per kWh of capacity to approximately $250/kWh, as well as advances in lightweight design and materials (Schorske, Chiacos et al. 2014).
The County’s Interim Fleet Acquistions Coordinator reported that the County does not own or lease any fully dedicated electric vehicles. He did report that the County has one hybrid-electric Ford Fusion (Northup 2015).
The table below lists notable EV projects across the U.S. with time frames and additional notes.
1 - 227

TABLE 5-21. EV Projects in the United States
EV Project Year Notes California As of 2014 5,965 public electric charging stations
University of California San Diego (UCSD)
Largest and most diverse range of charging stations at an university in the world
LA Air Force Base 2014 First federal facility to replace its entire fleet with EVs (Vehicle to grid demonstration project)
San Diego, CA 2011-2013 DOE EV Project participant and Car2go Los Angeles, CA 2010-2013 DOE EV Project participant
Bay Area and Monterey Bay Plan 2014-2024 CEC Regional Plan Ventura, Santa Barbara, and San
Luis Obispo Counties Plan 2014-2024 CEC Regional Plan
Southern California Plan 2014-2024 CEC Regional Plan Sacramento Regional 2014-2024 CEC Regional Plan
San Diego Regional Plan 2014-2024 CEC Regional Plan San Joaquin Valley Plan 2014-2024 CEC Regional Plan
Indianapolis, IN 2012-2016 City of Indianapolis municipal vehicles. Project will save $8.7 million over 10 years. 500 EV or PHEV non-police vehicles. Also nation’s largest EV car sharing program, BlueIndy & Ballore, with 500 PEVs and 1,000 charging stations.
Sacramento, CA Sacramento signed an MOU with Indianapolis to work together and share resources to convert cities fleet to PEV
Salem, OR 2010-2013 DOE EV Project participant Corvallis, OR 2010-2013 DOE EV Project participant Eugene, OR 2010-2013 DOE EV Project participant
Portland, OR 2010-2013 DOE EV Project participant and Car2go Seattle, WA 2010-2013 DOE EV Project participant
Vancouver, BC 2011 Car2go Phoenix, AZ 2010-2013 DOE EV Project participant
Tucson 2010-2013 DOE EV Project participant Dallas, TX 2010-2013 DOE EV Project participant
Fort Worth, TX 2010-2013 DOE EV Project participant Houston, TX 2010-2013 DOE EV Project participant Nashville, TN 2010-2013 DOE EV Project participant Knoxville, TN 2010-2013 DOE EV Project participant
Chattanooga, TN 2010-2013 DOE EV Project participant Washington, DC 2010-2013 DOE EV Project participant
Austin, TX 2010 Car2go
1 - 228

6. Findings, Conclusions, and Recommendations
The Comprehensive Renewable Energy Plan (CREP) was initiated as a major first step to build renewable energy markets while moving the County of San Diego beyond its historical roots in preservation and a piecemeal approach to renewable energy. The intent was a comprehensive focus on sustainability as it might be driven by the productive use of renewable energy technologies. Yet, there are a half-dozen other critical elements that will thrust energy to the forefront of the County’s economic development initiatives.
The first is evidence of a lagging economy that may generate fewer new jobs over the next decades compared to the recent historical trends. This was discussed in Section III of this report. Perhaps even more immediately crucial are the severe water problems now confronting California. In early April 2015, Governor Edmund G. Brown, Jr. directed the first ever statewide mandatory water reductions that will have a dramatic impact on the County.109 At the same time, evidence of a rapidly changing climate prompted former Governor Arnold Schwarzenegger to issue an executive order that established a 2050 statewide greenhouse gas emissions reduction target of 80 percent below 1990 levels.110 In addition, the U.S. Environmental Protection Agency’s (EPA) Clean Power Plan is designed to build on clean energy policies that states and local governments across the country have adopted and refined, including policies to develop renewable energy, such as a State Renewable Portfolio Standard (RPS). With California already on track to meet its goal of getting 33 percent of its electricity from renewable sources by 2020, Governor Brown announced in January 2015 that he would seek to raise the state RPS target to 50 percent by 2030. All of these initiatives place new responsibilities on the County. The productive use of materials, water, and especially zero-carbon or renewable energy resources can provide a highly effective response to these burdens.
Yet, there are other concerns and uncertainties that may delay immediate actions. These include an aging and outdated transportation infrastructure that requires significant upgrades,111 even as there are emerging and potentially volatile markets for a variety of new and untested technologies. Some of these new technologies may take hold in significant ways, but others may either peak in very small ways, or they may fizzle altogether.112 Adding to growing uncertainties about an evolving renewables market, there are also many proposals for new electric utility business models that focus more on providing value-added services rather than the traditional sale of commodities.113 In the case of energy utilities, for example, rather than limit earnings to the sale of kilowatt-hours of electricity or therms of natural gas, the new, disruptive business models may pull revenues from a varied stream of services—whether leasing in-home technologies that will provide clean on-site energy, or assisting in the financing and construction of new renewable generation technologies located outside of a normal utility service territory.
Fortunately, a smart planning foundation can weave these varied elements into a foundation for a more robust and sustainable economy, while also minimizing the risk associated with new County actions. Risk is always present with any new direction pursued. However, it can be minimized for the County through the introduction of successful and proven renewable technologies, policies, and practices.
The usual presumption among local businesses and municipal agencies is that, given time and the right set of incentives, the economy will swing back to a normal pattern of market activity and job creation. Officials assume
109 Executive Order B-29-15 [http://gov.ca.gov/news.php?id=18910]. 110 Executive Order S-3-05 [http://gov.ca.gov/news.php?id=1861]. 111 See the related infrastructure discussion in Section 3-2 of this report. 112 The Box I insert on emerging energy technologies in Section 3-3 highlights this point. 113 The Box IV insert on business models in Section 4 provides a short background on this topic.
1 - 229

that what has worked in the past will likely work in the future, too. However, the discussion surrounding Figure 3-2 suggests the very strong possibility for a different outcome for San Diego County. The County is in new territory. Indeed, compared to the historical rates of job creation within the County, there may be 125,000 to 175,000 fewer jobs, on average each year, over the next several decades. By the year 2040, the employment demand may mean 280,000 to 380,000 fewer new jobs annually compared to the historical rate of development. Clearly, a new level of effort may be required than is normally assumed. Moreover, that new effort may be complicated further by having to simultaneously manage the development of a burgeoning renewable energy market while also confronting the very real issues of water shortages and climate change.
FIGURE 6-1 provides another context in which to understand the level of effort that may be required to ensure a robust and sustainable San Diego regional economy. For purposes of this analysis, the authors limit the discussion to the job creation process along with the need for sharp reductions in greenhouse gas emissions. In this graphic illustration, the dashed red line represents the minimum level of performance needed to meet the desired levels of new jobs as well as to achieve the 80 percent reduction in GHG emissions target by 2050.
FIGURE 6-1. Understanding the Economy-Wide Sustainability Context
Of the four Innovation Scenarios reviewed in Section 3 of this report, and displayed in Figure 6-1, Scenario III is listed as “almost there;” only Scenario IV surpasses the minimum level of performance to ensure a more robust and sustainable economy. Scenario IV is the only Scenario that exceeds the 80 percent reduction in GHG emissions by
2050. It is also the biggest job creation scenario. One important note is that Figure 6-1 highlights not just
114 It is beyond the scope of this analysis, but to comply with Executive Order S-3-05, the actual reduction target would need to be 80 percent below the 1990 level rather than the 2050 level of emissions. It can be done, but it would mean that, following the more productive use of energy, renewable energy technologies or some other zero-carbon energy
1 - 230

Innovation Scenario IV, but Scenario IV+. The labeling of Scenario “IV+” reflects the need to extend the comprehensive energy planning efforts well beyond the transition for electricity and natural gas. Please recall that all of the Innovation Scenarios only deal with 35 percent of total energy usage (only the unincorporated areas of the County).
In addition, while Scenario IV works through a 100 percent transition to renewable energy technologies for the production of electricity, natural gas consumption continues to generate a small but significant amount of carbon dioxide emissions. Hence, the need to displace natural gas with low-carbon, renewable energy resources to provide heat, hot water, and cooking in area homes and local businesses. On the other hand, energy consumption for transportation services remains the very big elephant in the room; it is so big that it cannot be ignored. This is especially the case with the accelerated transition to electric vehicles, or even the possibility of future transition to hydrogen fuel-cell cars.
Notwithstanding the moderated scale of total energy use reflected in the four Innovation Scenarios, the data still suggest a sufficient impact to warrant immediate steps to secure the first set of benefits. Not only would those first steps help prime the sustainable economy pump, but they would also serve as a useful example of what might be possible—at scale—in other areas of the County, and indeed, throughout the U.S. economy.
To summarize, and looking at key data from FIGURE 3-6 on Innovation Scenario IV, the County must plan for total investments, in constant 2012 dollars, on the order of $3.7 billion over the period 2015 through 2050. That is an average of more than $100 million per year (again in constant 2012 dollars). At the same time, however, this can deliver a cumulative energy bill savings of about $6.9 billion (a net benefit ratio of 1.9), and promote an average net
gain of about 1,800 new jobs, or as shown in TABLE 3-9, a net gain of 5,300 net jobs by the year 2050. To get to this new level of economic productivity, job creation, and emissions reductions, incremental wholesale change is required and made possible by key elements of the Comprehensive Renewable Energy Plan (CREP).
6.1. The Key Elements of the Comprehensive Renewable Energy Plan
Long-term capacity building will be a critical element for San Diego County if it is to ensure the development of a robust and sustainable economy. This includes a steady long-term job creation process and greenhouse gas emissions reduction targets through the year 2050. Section 4 on Institutional Arrangements and Financing Mechanisms, and Section 5 on the set of Best Practices that are available to the County, provide a broad mapping of critical next steps. Here the authors summarize five primary recommendations for critical next steps in the Comprehensive Renewable Energy Plan. While the first three recommendations provide the larger economic context, the two remaining elements focus on implementation, and administrative and long-term planning functions.
First, the County should acknowledge the scale and scope of the transition that will be necessary to ensure the long-term well-being of the economy. In other words, the County should make clear that success will depend on large-scale and more productive investments in the regional energy infrastructure. Here the authors are talking about billons rather than millions of both private and public sector dollars to reinvigorate the County’s infrastructure over the next several decades;
resource would have to substitute for a natural gas energy usage in addition to the displacement of conventional electricity generation. 115 Again, if done at this level throughout all sectors and energy uses across the entire San Diego County, and estimating the full productivity benefits, the net job creation might be more like 70,000 annual average new jobs within the County.
1 - 231
Second, the County should seek to immediately integrate transportation services within the comprehensive renewable energy plan; Third, the County should seek the development of opportunities outlined in this report using what the authors refer to as an open architecture system. Box IV highlights the critical perspectives that support the idea of an open architecture system. Through this new system, the County can research and encourage the development of technologies, markets, and institutions with three principal attributes: as multifunctional, as modular, and as decadal assets rather than necessarily long-lived ones; Fourth, the County should seize a number of near-term opportunities identified in this report, described here as foundational components (because they provide an important foundation for the future). These opportunities are deemed higher priority, shorter-term items given the status of renewables in the County today and where the County states it wants to go tomorrow; and Fifth, the County needs to consider and prioritize the integration of other longer-term planning elements identified in this report. These elements, which include proven policies and programs in other jurisdictions, are to be considered the modular additions that may be added later to the foundational elements.
FIGURE 6-2, on the following page, provides a graphical illustration of the needed synergy and interactions among each of these five key planning elements.
1 - 232

FIGURE 6-2. Planning Elements for a Robust and Sustainable San Diego County
Looking at FIGURE 6-2 from the bottom up, the implication is that the County acknowledges the next steps in the comprehensive renewable energy plan as they might be anchored by an increasing emphasis on the productive use of all resources—whether materials, water, and especially energy. The Figure then provides four immediate foundational components. Administrative components are necessarily first in order, since a new administrative system is needed to scale new programs and policies to the level required for wholesale change in the way the County approaches renewable energy. The implementation components are the top priority items recommended for immediate action, based on achieving County goals espoused in the CREP and elsewhere. These recommendations include:
• Administrative Priority #1: Adding a new energy element to the San Diego County General Plan (see Section 5.3 for a more complete discussion of this component);
• Administrative Priority #2: From among current activities and resources, create an Office of Sustainability or Energy Resources to motivate, manage, and support staffing, funding, and other resource needs (Section 5.4);
• Implementation Priority #1: Engage and/or develop the Community Choice Aggregation model along with other major investment and program capacity mechanisms (Section 5.5); and
• Implementation Priority #2: Ensure a proactive workforce development strategy integrated with County renewables and energy efficiency programs (Section 5.6).
1 - 233

Once these four foundational administrative and implementation priorities are in place, the County will be in a much better position to pursue the longer-term Best Practices identified in this report. To be certain, other administrative and implementation priorities can be pursued simultaneously or ahead of these suggestions. However, the authors believe that pursuing this list first will position the County for stronger economic growth over the long-term.
Box IV. Open Architecture and the San Diego County Energy Economy
1 - 234

6.2. Long-Term Best Practice and Planning Elements
With the administrative and initial program capacity in place, and with the functional perspective of an open architecture system (see Box IV), the next steps suggested in FIGURE 6-2 include the integration of the Best Practices highlighted in Sections 5.7 through 5.17. These range from building a new energy resilience plan (ERP) and increasing the County’s percentage of energy derived from various renewable energy technologies, to promote the more efficient use of energy through more aggressive building standards (including the significant retrofit of existing buildings), to establishing a more formal Electric Vehicle program (as the first step toward integration of a more complete review of transportation services more broadly).
With the economic imperative of a smart transition to a more productive energy infrastructure anchored by large-scale investments in renewable energy technologies, the County of San Diego cannot afford to wait for future development. Both the urgency and the speed of market transitions require a sooner than later response. FIGURE 6-3 shows the key steps required to build what the authors think of as a truly “Comprehensive” Renewable Energy Plan –referred to here as a Comprehensive Energy & Sustainability Plan (CESP). With the Energy Element and the Office of Sustainability or Energy Resources in place, in Phase II of the CREP the County can develop fiscal notes and plans to ensure the productive and coordinated implementation of other Best Practices, and likely (slowly) bring in each of the remaining Best Practices.
FIGURE 6-3. Steps to Implementing a Comprehensive Renewable Energy Plan
Derived from http://www.caleap.org
If the County is to achieve true scale with renewables and greater energy productivity in the near future, new administrative options need to be considered. These should be collaborative in nature and designed to help the County department or office coordinate the implementation of future energy-related initiatives. Centralizing the
1 - 235

renewable energy efforts within a single County entity is one solution to what many local external stakeholders commented to our team is now a piecemeal approach to not only renewables, but to energy in general.
1 - 236

7. Appendices
A-1. Key Economic and Technology Assumptions
As described in the main part of the comprehensive renewable energy plan, the economic assessment is really an examination of how changed behaviors and investment flows might enable a more productive energy and economic future for San Diego County. The first question that business leaders and policymakers might ask about an alternative energy future is what it might cost. For very understandable reasons they worry that any implied transition will end up costing more. On the other hand, if the authors properly assess all system costs there are many scenarios or alternative futures that may—on a net basis— be able to produce a greater set of benefits than is generally understood.
In a format consistent with a number of other past studies that inform this assessment (see, for example, (Laitner, Ehrhardt-Martinez et al. 2009, Busch, Laitner et al. 2012, Rifkin, Lebot et al. 2013, Laitner and McDonnell 2014, Laitner 2015), this appendix highlights the analytical assumptions that support the assessment described in the main part of the narrative.
The assumptions generally fall into four major categories: (i) energy quantities such as kilowatt-hours (kWh) of electricity or therms of natural gas, (ii) the price of those different quantities, (iii) the needed investment flows to drive a more productive outcome, and (iv) the modeling necessary to evaluate the jobs, income, and other economic impacts. The analytical tool used to evaluate the energy and economic development impacts is the Excel-based DEEPER Modeling System, which is described next. This is then followed by an explanation of the key reference case assumptions that underpin the results summarized in the main body of the report.
The DEEPER Modeling System
The Dynamic Energy Efficiency Policy Evaluation Routine (DEEPER) is a proprietary-based analytical tool first developed by John A. “Skip” Laitner in 1990. It is a compact 15-sector quasi-dynamic input-output model of a given regional economy.116 It is essentially a recipe of how the different sectors of the economy buy and sell to each other. Setting up that economic recipe is a first step in exploring the expected future income and job impacts of shifting economic activity and investments toward more productive activities.
The DEEPER model has been used to evaluate the net employment impacts of a comprehensive energy plan for an industrial region of four million people in northeastern France, and for proposed automobile fuel economy standards within the United States.117 It is most often used to evaluate the macroeconomic impacts of a variety of
116 There are two points that might be worth noting here. First, the model solves recursively. That is, the current year set of prices and quantities is dependent on the previous years’ results. As the model moves through time, there are both secular and price-quantity adjustments to key elasticities and coefficients within the model. Second, there is nothing particularly special about this number of sectors. The problem is to provide sufficient detail to show key negative and positive impacts while maintaining a model of manageable size. If the analyst chooses to reflect a different mix of sectors and stay within the 15 x 15 matrix, that can be easily accomplished. Expanding the number of sectors will require some minor programming changes and adjustments to handle the larger matrix.
117 Nord-Pas de Calais Third Industrial Revolution Master Plan – 2013, by Jeremy Rifkin, Benoit Prunel, Solenne Bastie, Francis Hinterman, John Laitner and Shawn Moorhead. Bethesda, MD: TIR Consulting Group LLC. 2013. See also, Gearing Up: Smart Standards Create Good Jobs Building Cleaner Cars, by Chris Busch, John Laitner, Rob McCulloch, and Ivana Stosic, Washington, D.C.: BlueGreen Alliance, 2012. Based on this analysis and other evidence, President Barack Obama signed into effect the proposed 54.5 mile-per-gallon fuel economy standards in August 2012.
1 - 237

energy efficiency, renewable energy, and climate policies at the regional, state, and national level. The timeframe of the model for evaluating energy efficiency and renewable energy technology policies and investments is 2012 (the base year of the model) through 2050.
As the authors chose to implement it for this analysis, the model maps the changed spending and investment patterns over the period 2016 through 2050. It then compares that changed spending pattern to the employment and other economic impacts that may be assumed within a standard reference case. The DEEPER Model includes a representation of energy-related CO2 emissions but it focuses, in particular, on the use of energy in all parts of the economy as well as the prices, the policies, and the programs or best practices necessary to achieve some desired level of economic impacts. Figure A-1 on the following page contains a block diagram of the model that highlights many of the key features discussed in this appendix.
FIGURE A-1. Diagram of the DEEPER Policy Analysis System
The model outcomes are driven primarily by the demands for energy services and alternative investment patterns as they are shaped by changes in policies and prices. A key feature of the model is one that also allows consumer behaviors to also adjust to changing preferences. This follows the logic outlined in (Laitner, DeCanio et al. 2000), and fits within the framework outlined by (Ehrhardt-Martinez 2008). The changes are implemented in what the authors call a price-preference ratio following (Ehrhardt-Martinez and Laitner 2009, Hanson and Laitner 2009, Laitner 2009). The functional form of the price-preference ratio is computed as an index of price divided by the consumer’s implicit discount rate. This is a rate that reflects a desired return on investment. For example, if a consumer chooses not to adopt a technology, for whatever reason, unless it pays for itself over a 2-year period, that suggests a 50 percent discount rate; or said differently, a desire to earn at least a 50 percent return on his or her investment in a set of energy efficiency and/or renewable energy technologies. All else being equal, either a
1 - 238

doubling of prices or a 50 percent reduction in the implicit discount rate (or some equivalent combination of the two) will have the same impact on the various elasticities within the model.118
Although the DEEPER Model is not a general equilibrium model, it does provide sufficient accounting detail to match import-adjusted changes in investments and expenditures within one sector of the economy and balance them against changes in other sectors.119 As shown in the block diagram above, the demand for energy-related services is the starting point for policy-induced changes. Both price and non-price policies—including energy efficiency or renewable energy portfolio standards, technical assistance programs, financial incentives, research and development (R&D), or general information and labeling programs (e.g., the EPA and DOE ENERGY STAR programs)—can shift consumer preferences and stimulate the availability of alternative technologies. Implementation of these policies, in turn, can induce an array of energy price changes, investments, and expenditures. These changes include program costs and incentives that might be needed to shift behaviors and investments so that some desired energy targets are satisfied. As changing demands confront a shifting mix of investments in different energy resources, overall energy prices (in constant dollars per kilowatt-hour of electricity or per therms of natural gas) are likely to change in response. The combination of new policies, new investments and changed consumer or energy producer behaviors drive the final results that emerge from application of the DEEPER Model.120 With this preliminary characterization of the model, the sections that follow describe the three major modules within DEEPER.
Energy Module: The DEEPER Model is benchmarked to both the historical record and the most current versions of the Woods and Poole econometric forecasts for San Diego County (Woods and Poole 2014), the California Energy Commission projections for both California and for the San Diego Gas & Electric Company service territory (Kavalec, Fugate et al. 2014), and the Annual Energy Outlook projections for the Pacific West (Energy Information Administration 2014), which now extends out through 2040. Based on data available from other sources like the Energy Policy Initiatives Center (Gordon, Silva-Send et al. 2013), which enables estimates of energy use and greenhouse gas emissions for any of the 19 jurisdictions in the San Diego region (including the unincorporated areas of the county), the authors make a reasoned estimate of how the local economy might grow through the year 2050 in a Reference Case scenario, and how that will consequently affect energy use, energy prices, and carbon-dioxide emissions. The key benchmark data for the Reference Case of the unincorporated areas of San Diego County are highlighted in Table A-1, below.
TABLE A-1. Reference Case Data for unincorporated areas of San Diego County
118 One nice feature of this functional form is that it is less important to determine the “right” starting implicit discount rate as it is to show what a shift in the size of that rate might matter. 119 When both equilibrium and dynamic input-output models use the same technology assumptions, both models should generate a reasonably comparable set of outcomes. For a diagnostic assessment of this conclusion, see, “Tripling the Nation’s Clean Energy Technologies: A Case Study in Evaluating the Performance of Energy Policy Models,” Donald A. Hanson and John A. “Skip” Laitner, Proceedings of the 2005 ACEEE Summer Study on Energy Efficiency in Industry, American Council for an Energy Efficient Economy, Washington, D.C., July 2005.
120 As noted in Hanson and Laitner (2004), a combination of price and non-price policies can generally produce a much more cost-effective policy resolution than either type of policies would induce by itself. The resulting deployment of new technologies depends on the assumed effectiveness of programs that might be implemented and the incentives being offered. Implementation of these policies—along with the resulting deployment of new technologies—strengthens the ability of the market to respond to the price signal. In this context, prices act as a signal for necessary changes, rather than as a punishment for consumers and producers.
1 - 239

Indicator 2012 2025 2050
Average Annual Growth Rate
2012-2050
Total Population (Thousands) 504.7 591.9 772.1 1.1%
Total Employment (Thousands) 295.4 359.0 519.5 1.5%
Earnings (Millions of 2012 Dollars) 18,216 25,364 47,429 2.6%
Gross Regional Product (Millions of 2012 Dollars) 29,137 40,919 76,397 2.6%
Electricity Consumption (Million kWh) 3,284 3,908 5,579 1.4%
Average Electricity Price (2012 $/kWh) 0.153 0.190 0.249 1.3%
Total Electricity Expenditures (Millions of 2012 Dollars) 503.8 741.8 1,390.9 2.7%
Natural Gas Consumption (Million Therms) 59.7 62.3 71.0 0.5%
Average Natural Gas Price (2012 $/Therm) 0.670 1.260 2.197 3.2%
Total Natural Gas Expenditures (Millions of 2012 Dollars) 40.0 78.5 155.9 3.6%
Total Energy Expenditures (Millions of 2012 Dollars) 543.8 820.3 1,546.8 2.8%
The main Reference Case assumptions shown in the above table are for the key benchmark years of 2012, 2025, and 2050. As measured by Gross Regional Product (GRP), in constant 2012 dollars, the economy is expected to grow at a rate of about 2.6 percent annually. Rising average annual energy prices (with all values also in 2012 dollars) are projected to increase at a rate of about 1.3 percent and 3.2 percent for electricity and natural gas, respectively. Total electricity and natural gas expenditures are estimated to increase 2.8 percent per year. It is the reference case to which the authors compare each of the four Energy Innovation Scenarios. Presumably the scenarios will show a smaller level of energy expenditures and other costs as well as more jobs and income than is suggested in the reference case.
1 - 240

TABLE A-2. Employment Impacts by Sector for San Diego County 2012
Employment Coefficients (Jobs per $MM)
Economic Sector Direct Jobs Total Jobs
Agriculture 6.7 11.3
Oil & Gas Extraction 3.7 9.2
Mining 5.2 10.1
Electric Utilities 1.1 4.4
Natural Gas Utilities 0.9 3.0
Transportation and Other Utilities 7.7 13.6
Construction 7.0 12.4
Manufacturing 2.3 6.1
Wholesale and Retail Trade 9.1 14.7
Services 8.0 13.6
Finance 5.2 10.3
Government 8.8 15.1
Macroeconomic Module: This part of the model contains the “production recipe” for the San Diego County economy for a given “base year.” For this assessment, the base year of the model was 2012, the latest data available for this analysis. The input-output data, or sometimes referred to as the I-O data, currently purchased from the IMPLAN Group (IMPLAN 2014), is essentially a set of economic accounts that specifies how the different sectors of the economy buy (or purchase inputs) from and sell (or deliver outputs) to each other. Further details on this set of linkages can be found in Busch et al. (2012) and Hanson and Laitner (2009).
For this assessment, the model was run to evaluate impacts of the selected policies upon 14 different sectors, including: Agriculture, Oil and Gas Extraction, Mining, Electric Utilities, Natural Gas Distribution, Transportation and Other Public Utilities (including water and sewage), Construction, Manufacturing, Wholesale and Retail Trade, Services, Finance, Government, and Households.121 To provide the reader with a sense of economic impact for these major sectors in San Diego County, Table A-2, above, provides estimates of both the direct and the total number of jobs per million dollars of sales or revenue generated within each sector. Direct jobs are those employed within a given sector. Total jobs also include the supply-chain impacts and the additional employed induced by the spending of sector revenues within San Diego County.
121 While there are only 14 sectors shown in the table above, there does not appear to be any coal mining activity in the county, and household spending is allocated to each of the sectors using the personal consumption expenditure data provided with the IMPLAN data set.
1 - 241
The principal energy-related sectors of the U.S. economy are not especially job-intensive. It turns out, for example, that the electric utility industry in 2012 supported only 1.1 direct jobs and 4.4 total jobs for every one million dollars of revenue received in the form of annual utility bill payments. The rest of the economy, on the other hand, supports about 6.8 direct jobs and 12.1 total jobs per million dollars of receipts. Thus, any productive investment in energy efficiency or renewable energy technologies that pays for itself over a short period of time will generate a net energy bill savings that can be spent for the purchase of goods and services other than energy. The impact of a one million dollar energy bill savings suggests there may be a net gain of about 7.7 jobs (that is, 12.1 total jobs supported by a more typical set of consumer purchases compared to the 4.4 jobs supported by the electric utilities). Depending on the sectorial interactions, however, this difference may widen or close as the changed pattern of spending works its way through the model, and as changes in labor productivity changes the number of jobs needed in each sector over a period of time.122
Based on the scenario data mapped into the energy elements of the DEEPER modeling system, the macroeconomic module translates the selected energy policies into an annual array of physical energy impacts, investment flows, and energy expenditures over the desired period of analysis. Using appropriate technology cost and performance characterization as it fits into the investment stream algorithm discussed below, DEEPER estimates the needed investment path for an alternative mix of energy efficiency and renewable energy technologies. It also evaluates the impacts of avoided or reduced investments and expenditures otherwise required by the electric generation sector. These quantities and expenditures feed directly into the final demand worksheet of the module. The final demand worksheet provides the detailed accounting that is needed to generate the implied net changes in sector spending. Once the mix of positive and negative changes in spending and investments have been established and adjusted to reflect changes in prices within the other modules of DEEPER, the net spending changes in each year of the model are converted into sector-specific changes in final demand. This then drives the input-output model according to the following predictive model:
X = (I-A)-1 * Y
where:
X = total industry output or sales for each sector of the economy
I = an identity matrix consisting of a series of 0’s and 1’s in a row and column format for each sector (with the 1’s organized along the diagonal of the matrix)
A = the matrix of production coefficients for each row and column within the matrix (in effect, how each column buys products from other sectors and how each row sells products to all other sectors)
Y = final demand, which is a column of net changes in spending by each sector as that spending pattern is affected by the policy case assumptions (changes in energy prices, energy consumption, investments, etc.)
This set of relationships can also be interpreted as
X = (I-A)-1 * Y
122 As the authors will see later in this appendix, DEEPER does capture sector trends in labor productivity. That means the number of jobs needed per million dollars of revenue will decline over time.
1 - 242

which reads, a change in total sector output equals the expression (I-A)-1 times a change in final demand for each sector.123 Employment quantities are adjusted annually according to exogenous assumptions about labor productivity in each of the sectors within the DEEPER Modeling System (Bureau of Labor Statistics 2005). From a more operational standpoint, the macroeconomic module of the DEEPER Model traces how each set of changes in spending will work or ripple its way through the regional economy in each year of the assessment period. The end result is a net change in jobs, income, and GDP (or value-added).
For each year of the analytical time horizon (i.e., 2012 to 2050 for the innovation scenarios evaluated in this report), the model copies each set of results into this module in a way that can also be exported to a separate report. For purposes of this separate report, and absent any anomalous outcomes in the intervening years, the authors highlight the five-year impacts in order to focus attention on the differences in results emerging from various alternative policy assumptions. For a review of how an I-O framework might be integrated into other kinds of modeling activities (Hanson and Laitner 2009). While the DEEPER Model is not an equilibrium model, the authors borrow some key concepts of mapping technology representation for DEEPER, and use the general scheme outlined in Laitner and Hanson 2006. Among other things, this includes an economic accounting to ensure resources are sufficiently available to meet the expected consumer and other final demands reflected in different policies.
FIGURE A-2 on the following page offers a diagram that illustrates the way DEEPER tracks changes in expenditures to evaluate the macroeconomic impacts of policy. In this case, the example is drawn from a typical diagnostic run of Innovation Scenario IV for the years 2012 through 2050 for the unincorporated areas of San Diego County. The average annual Reference Case energy expenditures for those years are estimated to be $990 million (in constant 2012 dollars) over that 38 year period. The enhanced energy efficiency and renewable energy investments require an average outlay of $128 million in combined energy efficiency and renewable energy investments together with payments to the market for borrowing the necessary funds. The entire case is driven by an estimated $11 million per year in various public and private program spending to catalyze those investments. The economy-wide energy bill savings are estimated to be $343 million in those years. The bottom line is a net reduction from the Reference Case energy bill expenditures so that businesses and consumers are paying only $786 million for energy as a result of the improved efficiency and renewable energy upgrades. That is an average net savings of $204 million per year over the period 2012 through 2050. For reasons described below, and in the main part of the report, that changed pattern of investment and spending will drive an average annual net gain of 2,000 jobs in the unincorporated areas of the County.124
123 Perhaps one way to understand the notation (I-A)-1 is to think of this as the positive or negative impact multiplier depending on whether the change in spending is positive or negative for a given sector within a given year. 124 Many readers might think that a net gain of just 2,000 jobs is not an especially significant impact. In a hopefully useful thought experiment, if the authors were to expand the suggested Innovation Scenario IV to include the entire region of San Diego County (in other words, looking at impacts across 3.2 million people rather than just one-sixth that size), and if the authors were to include transportation and all other fuels rather than looking only at electricity and natural gas, the average number of jobs might swell to more than 32,000 rather than just 2,000 net new jobs.
1 - 243

FIGURE A-2. Changes in the Average Annual Energy Resource Costs for the unincorporated areas of San Diego County (2012-2050)
Conventional Energy Prices
The authors generally follow the expected pricing pattern as suggested by Cook 2013, the California Energy Commission (Kavalec et al. 2014a, 2014b), and the Energy Information Administration (2014). The electricity and natural gas prices are typically shaped by the change in demand for energy and any potential cost of both energy efficiency and renewable energy upgrades. As reported in Table A-1, in the 2012 base year dollars of the DEEPER model, the compound average growth rate (CAGR) of electricity prices is projected to be 1.1 percent per year while natural gas prices are projected to be 2.4 percent per year. By 2050, electricity prices are about 50 percent higher than today while natural gas prices are slightly more than doubled.
Technology Investment Streams
In many ways the economic assessment follows the analytical exercises undertaken for the studies, “California’s Energy Future: The View to 2050” (California Council on Science and Technology 2011) and “A roadmap for repowering California for all purposes with wind, water, and sunlight” (Jacobson, Delucchi et al. 2014). There are some important differences, however. These relate primarily to estimating technology costs as they evolve over time. Here, investment costs are estimated for two distinct categories of future energy resources options: energy efficiency investments and renewable energy supply technologies. Depending on the mix of these resources, and their impact on conventional energy supply (whether electricity or natural gas) that will change the average cost of energy services over time. For example, as greater levels of renewables and energy efficiency penetrate the market, that may drive down the cost of conventional resources in addition to delivering lower-cost energy services more broadly. In this assessment, however, the authors focus on the anticipated technology costs of renewables and
1 - 244

energy efficiency more directly rather than integrate their potential impact on the prices of conventional energy supply. The key set of assumptions for each of these two major sources of investment flows is summarized below.
Energy Efficiency
One critical piece of information needed to evaluate the impact of these different Innovation Scenarios is the cost of investment in energy efficiency technologies. An extensive review of energy efficiency programs across the country by the Lawrence Berkeley National Laboratory, for example, found that the U.S. average total resource cost of saved energy, weighted by energy savings, was $0.044 per kilowatt-hour (kWh) for the period 2009 to 2013 (Hoffman, Rybka et al. 2014). On the other hand, an examination of 45 different utility energy efficiency programs by the American Council for an Energy-Efficient Economy found similar levels of cost-effectiveness. More critically, the ACEEE analysis reported that the total resource cost test (an economy-wide benefit-cost ratio) for long-term savings scenarios ranged from 1.4 to 2.5 with a weighted average (based on annual savings) of 1.8. In other words, for every dollar of program cost, incentives, and other investments, the energy efficiency programs saved an average of $1.80 (Neubauer 2014).
To derive similar information in this current assessment, the authors adapt the structure of the Long-Term Industrial Energy Forecast (or LIEF) model as described in Cleetus, Bernow et al. 2003. The same logic was followed in Rifkin et al. (2013) and Laitner et al. (2012). Indeed, among the earliest use of the LIEF model was for a 1995 assessment for Southern California Gas Company (Mowris, Ross and Kent 1995). The key relationship in this model is the current gap between average and best energy efficiency technology or the best efficiency practice. In this case, the authors “bundle” energy efficiency as an aggregate investment stream so as not to pick winners or emphasize a particular set of technologies at this point in time.
The assumption in the LIEF model is that as a sector moves closer and closer to best practice or best technology (sometimes referred to as the production frontier), the cost of efficiency investment per unit of energy saved will increase. The rate of that potential cost increase depends on the energy prices, the elasticity of the efficiency supply curve, and the discount rate. It also depends on how innovations and R&D policies might shift the best technology or best practice frontier. As used in this exercise, the investment cost is shown as:
Investment per Unit Energy Savings =
where:
P = price of energy in the base year
C = capital recovery factor (CRF) or sector implicit discount rate for the given year
A = an elasticity that reflects the magnitude of investment in response to changes in price levels or the capital recovery factor
S = percent of sector energy savings in current year compared to base year consumption
G0 = the energy intensity gap, or the difference between best and average practice
In many ways this can be thought of as the energy savings that should be economically viable in the base year, but which have not yet been realized.
CP
SG A)/1(
0
11
1 - 245

By way of example, based on the California Energy Commission (CEC) report which suggests an additional achievable energy efficiency (AAEE) beyond the normal rate of improvement (Kavalec et al. 2014b), the data might suggest that today there is a current energy intensity gap of 14 percent based on the potential for long-term efficiency gains through the year 2014. Following Rifkin et al. (2013) and Laitner et al. (2012) who both document potential primary energy savings of 50 percent by 2050, the authors suggest an efficiency gap of only 25 percent for electricity use in San Diego County, also by 2050. With an energy efficiency gap now established, the authors then look to estimate the rate over time by which homes and businesses might substitute more energy efficiency for the more conventional use of energy. In this case, the assumption for a “substation elasticity” of 0.6, and an implicit discount rate of 20 percent. 125 If energy prices of a given sector are, by way of example, $0.15 per kilowatt-hour in 2015, these assumptions suggest an average payback of about 3.7 years for a 10 percent efficiency gain based on prices in 2012. This rises to a 10-year payback for a 50 percent efficiency gain by 2050. These results are broadly consistent with results summarized in Hanson and Laitner 2004, Laitner, Nadel et al. 2012.126
Using estimates from Laitner, Partridge et al. 2012, McKinsey & Company (Granade 2009), among others, each of the cost curve functions was adjusted by sector to reflect both the current and anticipated technology costs and performance reflected in those various studies. In the modeling characterized in this assessment for San Diego County, the payback periods typically begin at about 2.5 to 3 years in 2015, and depending on the individual scenarios and how quickly efficiency is “used up,” the payback periods in 2050 might range from 5 to 9 years. On the other hand, to the extent that that are innovations and economies of scale and scope that tend to lower technology costs, the authors might expect to see paybacks that remain closer to five years. For this working assessment, however, the authors generally allow DEEPER to move toward the higher technology costs since the authors are more interested in highlighting the potential of energy efficiency rather than evaluating a specific set of policies over time. In this regard the authors are then maintaining a conservative (i.e., higher cost) focus in completing this particular assessment for 2050.
Renewable Energy Technologies
Again, in the spirit of not choosing a particular bundle of renewable energy technologies, the DEEPER Model characterizes an aggregate to provide insight rather than precision (Huntington, Weyant et al. 1982). That is to say, rather than integrate different class of renewable technologies – whether utility-scale photovoltaics, residential-scale PV systems, and wind or geothermal energy systems, the authors characterize them here as a bundle. In general the authors look broadly to the current extensive deployment of renewable energy technologies – especially geothermal, wind, and both utility-scale and rooftop PV systems in Imperial County and San Diego County. An historical review of 136,000 data points of photovoltaic installations in California over the period 2007 through mid-
125 This adaptation of the LIEF equation ignores the autonomous time trend component. In other words, as used here, the assumption of an efficiency gap remains static and there is only movement toward best practice or best technology rather than improvement in the base year representation of best practice or best technology. As the historical record suggests, the gap may actually grow to 35 to 50 percent—if the U.S. as a whole chooses to invest in greater innovation and energy productivity improvements. Hence, the use of a fixed 25 percent gap for purposes of estimating investment costs will tend to overstate the cost of the new efficiency gains. See, Rifkin’s book, Zero Marginal Cost Society, for a good discussion on greater rates of innovation and lower technology costs over time (Rifkin 2014). 126 Although this is not emphasized in either the report or appendix, DEEPER also can explore changes in costs needed to drive a final result. For example, as it is now configured, if investments cost 20 percent less than now projected for the year 2050, the net gain in jobs shown in the main report increase by about 3.5 percent. On the other hand, if the investments run about 50 percent more than now suggested, the net increase in jobs might decline by about 9 percent. But this would continue to be a highly positive net gain in 2050. The significance of this finding is that the Innovation Scenarios—especially if they include a greater emphasis on energy productivity benefits—is likely to generate a robust outcome for the San Diego economy for all the reasons described earlier in the report.
1 - 246

2014 showed that installation costs (in nominal dollars) declined by more than half over that period of time (Laitner 2015).
The authors conservatively assume a bundled renewable energy investment cost of $3,000 per kW in 2012 dollars (which is, again, the base year of the model). Lazard suggests that wind resources are in the range of $1,400 to $1,800 per kW, utility scale PV resources range from $1,500 to $1,750 per kW, commercial and industrial rooftop systems are $2,500 to $3,000 per kW, and finally, residential rooftop systems are from $3,500 to $4,500 per kW (Lazard 2014). At the same time, the authors integrate findings from studies as Lazard (2014), Jacobson et al. (2014), the Electricity Reliability Council of Texas, and others, which suggest a cost function that will decline by perhaps one-half or better as the result of new materials, electronics, and design (Faeth 2014). In the assessment here, that rate of decline depends on the growth of renewable energy systems and the larger market dynamics over the years 2015 through 2050, which the authors capture as:
Cost2050 = $3000/kW2015 × (total GWh2050/Initial GWh2015)–0.6 = $/kW in 2050
Depending on the growth of total sales or production of renewables-powered electricity by 2050, this cost function suggests that new systems may decline by one-half. But to this the authors must add costs of distribution and storage as well as an assumption of what percentage of time these systems operate over the year. Here the authors assume an initial capacity factor of 20 percent in 2015 that increases slowly to 30 percent by 2050. This means that, based on an average of 8,760 hours in the year, such systems will operate a total of 1,752 hours in 2015 and slowly increase to 2,628 hours by 2050. Finally, both storage and distribution costs to each MWh of electricity generated by renewable energy systems, starting at $25 per MWh in 2015 and declining to $15 per MWh by 2050. This set of assumptions provides costs that begin at about $205 per MWh in 2015 and then decline to perhaps $120 per MWh or lower by 2050. This, of course depends on the continued rate of market dynamics, technology innovation, and other policy drivers and incentives. One further note merits attention. Based on a series of ongoing assessments in the need to upgrade the nation’s infrastructure from a very low score of D up to a grade of B, the American Society of Civil Engineers has suggested the United States will have to spend as much as $3.6 trillion over the period 2012 through 2020, and there may be a shortfall in funding of as much as $1.6 trillion. Laitner and Keller have developed a working memo suggesting that for San Diego County to move its infrastructure from a somewhat better initial grade of C to also a B level by 2020, San Diego County may face a funding shortfall of $16 billion to $26 billion by 2020. Presumably many of the infrastructure upgrades envisioned in this Comprehensive Renewable Energy Assessment will be made as part of the larger upgrade to improve the quality of the regional infrastructure (Laitner and Keller 2015).
Policy and Program Costs
One of the key working assumptions in this assessment is that that policies, programs, and best practices are needed to drive the requisite investments in the different innovation scenarios. In short, a dedicated workforce is needed to plan, promote, and carry out programs to ensure the desired technology deployment. Staff are also needed to ensure the training of people who will install and maintain the new technology systems as well as evaluate the actual success of the next policies and programs. To generate an estimate of what these incremental program costs might look like, the authors borrow from a variety of studies including Wolfe and Brown 2000, Laitner and McDonnell 2012, Hoffman, Rybka et al. 2014. In this analysis the authors assume that program and policy expenditures might require about 15 percent of the scale of technology investment beginning today, but declining to just 8 percent by 2050.
1 - 247

A-2. Bibliography
Borrego Springs. Microgrids, Berkeley Lab.
(2002). Electrical restructuring: aggregation. Public Utilities Code Section 366.2.
(2010). A Resolution of the City Council of the City of Coronado, California Authorizing Sacramento County to Apply for State Energy Program Funds on Behalf of the City of Coronado. City of Coronado: 6.
(2011). Charles McGlashan Community Choice Aggregation Act. Public Utilities Code Section 366.2, 331.1, 365.1, 381.1, 395.5, 396.5, 707.
(2014). Climate Action Plan. City of San Diego, City of San Diego.
(2015). "Clean Renewable Energy Bonds (CREBs) | Department of Energy." from http://energy.gov/savings/clean-renewable-energy-bonds-crebs.
(2015). "IRS to Allocate Nearly $1.4 Billion in New CREBs Volume Cap." from http://www.mcguirewoods.com/Client-Resources/Alerts/2015/2/IRS-Allocate-New-CREBs-Volume-Cap.aspx.
(2015). "NetGreen." Retrieved February 15, 2015, 2015, from http://sonomacleanpower.org/netgreen/.
(2015). "ProFIT Program." Retrieved February 15, 2015, 2015, from http://sonomacleanpower.org/profit/.
Abt Associates (2013). User’s Manual for the Co-Benefits Risk Assessment (COBRA) Screening Model. Washington, DC, U.S. Environmental Protection Agency.
Aghassi, S. (2014). Options to Amend the County Building Code to Support Energy Efficiences and Green Building Technology, County of San Diego.
Alameda, County of (2010). Alameda County Cliamte Action Plan: 187.
Alameda, County of (2010). Resolution of the Board of Supervisors of the County of Alameda Adopting Commitments to Climate Protection, Climate Action Plan, and Greenhouse Gas Emissions Reduction Targets for Government Services and Operations. A. County Board of Supervisors, State of California: 3.
Alex, K. and S. Morgan (2012). Annual Planning Survey Results, Governor's Office of Planning and Research: 382.
AMECO. (2014). "Solar Hot Water FAQs." from http://solarexpert.com/solar-education/solar-faqs/solar-hot-water/.
American Society of Civil Engineers (2012). California Infrastructure Report Card: A Citizen’s Guide - 2012. Reston, VA, American Society of Civil Engineers.
American Society of Civil Engineers (2013). Report Card for America’s Infrastructure 2013. Reston, VA, American Society of Civil Engineers.
Anders, J. K. a. S. J. (2014). Residential and Commercial Property Assessed Clean Energy (PACE) Financing in California Rooftop Challenge Areas, Energy Policy Initiatives Center (EPIC), University of San Diego School of Law; Center for Sustainable Energy.
1 - 248

ASCE San Diego Section (2012). San Diego County Infrastructure Report Card 2012. El Cajon, CA, American Society of Civil Engineers San Diego Section.
Ayres, R. U. and B. Warr (2009). The Economic Growth Engine: How Energy and Work Drive Material Prosperity. Northampton, MA, Edward Elgar Publishing, Inc.
Bade, G. (2015). "6 thought leaders on the future of utility business models & regulation." from http://www.utilitydive.com/news/6-thought-leaders-on-the-future-of-utility-business-models-regulation/357635/.
Bloede, C. (2014). Sustainability Program Manager. County of Alameda. G. Burmeister.
Brock, J. (2014). San Diego Gas & Electric. G. Burmeister.
Bruce Kaneshiro, S. L.-U., Tim Drew, Rajan Mutialu, Dorris Chow, Paula Gruendling, Taaru Chawla, Jennifer Caron, Alan Meck (2013). Lessons Learned From Summer 2012 Southern California Investor Owned Utilities' Demand Response Programs, California Public Utilities Commission.
Bureau of Labor Statistics (2005). Employment and Output by Industry, 1994, 2004, and Projected 2014. Washington, D.C., Department of Labor.
Burmeister, G. and F. Kreith (1992). Energy Management and Conservation, National Conference of State Legislatures.
Burmeister, G., R. Mosley and S. Foute (2011). Local Government Energy Assurance Guidelines, Public Technologies Institute.
Busch, C., J. A. S. Laitner, R. McCulloch and I. Stosic (2012). Gearing Up: Smart Standards Create Good Jobs Building Cleaner Cars. Washington, D.C., American Council for an Energy-Efficient Economy.
Byrne, J. C., Martinez (2009). Delaware's Sustainble Energy Utility. Delaware Lawyer.
CACSE (2012). California Plug-in Electric Vehicle Owner Survey, CaCSE Air Resources Board: 15.
CaCSE (2012). San Joaquin Valley: Plug-In Electric Vehicle (PEV) Readiness Plan, CaCSE: 48.
CaLEAP. (2014). "California Local Energy Assurance Planning." from http://caleap.org/.
California Council on Science and Technology (2011). California’s Energy Future: The View to 2050. Sacramento, CA, California Council on Science and Technology.
California, G. S. (2015). "Net Energy Metering in California." Retrieved February 3, 2015, 2015, from http://www.gosolarcalifornia.ca.gov/solar_basics/net_metering.php.
CALSEIA. (2015). "California's Solar Industry Job Growth Outpaces Rest of State." from http://www.calseia.org/index.php?option=com_content&view=article&id=231:california-s-solar-industry-job-growth-outpaces-rest-of-state.
Campbell, N., L. Ryan, V. Rozite, E. Lees and G. Heffner (2014). Capturing the Multiple Benefits of Energy Efficiency. Paris, France, International Energy Agency.
CaPEV (2014). California Plug-In Electric Vehicle Collaborative 2014 Annual Report, CaPEV: 6.
1 - 249

CaPEV (2014). Charging Plug-In Electric Vehicles at Multi-unit Dwellings, California PEV Collaborative.
Cart, J. (2015). Gov. Brown's renewable energy plan could boost solar, wind industries. Los Angeles Times, @latimes.
Casey, T. (2013). "In First Test, U.S. Military's SPIDERS Microgrid Uses 90% Renewable Energy." Power, from http://cleantechnica.com/2013/02/12/u-s-militarys-new-spiders-renewable-energy-microgrid/.
CEA. (2010). "What is a Megawatt and a Megawatt-Hour." Solar Resources, from http://www.cleanenergyauthority.com/solar-energy-resources/what-is-a-megawatt-and-a-megawatt-hour/.
CEC California's 2030 Climate Commitment: Renewable Resources for half of the State's Electricity by 2030, California Energy Commission.
CEC. (2007). "Nonresidential Building Energy Use Disclosure Program (AB 1103)." from http://www.energy.ca.gov/ab1103/.
CEC (2013). Energy Commission Awards More Than $3 Million in Renewable Energy Grants to Five Counties, California Energy Commission: 1.
CEC. (2014). "Waste to Energy & Biomass in California." Biomass, from http://www.energy.ca.gov/biomass.
CEC. (2015). "California Biomass and Waste-To-Energy Statistics & Data." Energy Almanac, from http://energyalmanac.ca.gov/renewables/biomass/index.php.
CEC, C. (2013). Appendix A. Concurrent Policy Activities Relevant to ZNE Goals, California Energy Commission, California Public Utilities Commission: 35.
CEC, C. (2013). (DRAFT) CA: Energy Efficiency Strategic Plan, New Residential Zero Net Energy Action Plan 2014-2020, California Energy Commission, California Public Utilities Commission: 44.
CEC, C. (2015). "Welcome to California Solar Statistics." from http://www.californiasolarstatistics.ca.gov/.
CEG. (2014). "Colorado Energy Group." from http://www.coloradoenergygroup.com./.
Clark, J. (2014). Center for Sustainable Energy. G. Burmeister.
Cleetus, R., S. Bernow, R. N. Elliott, A. Shipley and E. Brown (2003). Explorations with the LIEF 2002 Model. 2003 ACEEE Summer Study on Energy Efficiency in Industry. Asilomar, CA, American Council for an Energy-Efficient Economy.
Cluett, R. and J. Amann (2013). Residential Energy Use Disclosure: A Review of Existing Policies, American Council for an Energy-Efficient Economy: 59.
Cohan, W. D. (2014). "Bypassing the Bankers." Business, 2015, from http://www.theatlantic.com/magazine/archive/2014/09/bypassing-the-bankers/375068/.
Colorado Energy Group, I. (2014). Community Energy Efficiency Program. G. Burmeister.
Commerce, Department of (2011). Energy Overlay Zones, A Report Prepared to Support the 2010/2012 State Energy Strategy, Washington State.
1 - 250

Commission, California Energy (2013). Local Ordinances Exceeding the 2013 Building Energy Efficiency Standards. ca.gov, California Energy Commission.
Commission, California Public Utilities (2015). "Renewable Energy Credits." Retrieved February 15, 2015, 2015, from http://www.cpuc.ca.gov/PUC/energy/Renewables/FAQs/05REcertificates.htm.
Cook, J. (2013). The Future of Electricity Prices in California: Understanding Market Drivers and Forecasting Prices to 2040. Davis, CA, UC Davis Energy Efficiency Center.
County, K. (2014). "Renewable Fuel Production." Energy, from http://www.kingcounty.gov/environment/wastewater/ResourceRecovery/Energy/Renewable.aspx.
County of San Diego (2013). County of San Diego Strategic Energy Plan 2013-2015. San Diego, CA, County of San Diego.
County, San Diego (2012). Climate Action Plan.
County, San Diego (2013). Strategic Energy Plan.
CPUC (2008). CSI-Thermal Program Energy Division Staff Proposal for Solar Water Heating Program, CPUC: 80.
CPUC (2014). Decision Adopting Low Carbon Fuel Standard Revenue Allocation Methodology for the Investor-Owned Electric and Natural Gas Utilities. 14-12-083. CPUC, CPUC. 11-03-012: 55.
CPUC (2014). Review of the Incentive Levels and Progress of the California Solar Initiative-Thermal Program, CPUC: 21.
CPUC (2015). Decision Approving Green Tariff Shared Renewables Program for San Diego Gas & Electric Company, Pacific Gas and Electric Company, and Southern California Edison Company Pursuant to Senate Bill 43, California Public Utilities Commission: 185.
CPUC, C. (2014). Promoting Efficiency for the Long Term. Energy in California.
CSE. (2015). "Clean Vehicle Rebate Project." from https://energycenter.org/clean-vehicle-rebate-project.
CSE. (2015). "Solar Electric for Homeowner." from https://energycenter.org/california-solar-initiative/homeowners.
CWEA. (2014). "Wind in the Big Picture." from http://www.calwea.org/bigPicture.html.
Davignon, L.-J. (2014). Interstate Renewable Energy Council. G. Burmeister.
Department, I. C. P. Summary of Inyo County Renewable Solar and Wind Energy General Plan Land Use Diagram Overlay Department.
Diego, County of San (2012). County of San Diego Climate Action Plan: 73.
Domagalski, J. (2014). "Potential New Opportunity for California Direct Access." Retrieved February 16, 2015, 2015, from http://blogs.constellation.com/energy4business/2013/03/04/potential-new-opportunity-for-california-direct-access/.
1 - 251

Donalds, S. (2014). "A Model of Collaborative Solar Purchasing: The Alameda County Renewable Energy Procurement Project." from http://www.cesa.org/projects/states-advancing-solar/solar-resource-library/resource/a-model-of-collaborative-solar-purchasing-the-alameda-county-renewable-energy-procurement-project.
Drive, U. (2014). 2014 Survey: The Utility View of Microgrids, D Utility Drive.
Dunn, J. (2014). Petaluma joins Sonoma Clean Power. The North Bay Business Journal.
Dunn, J. (2014). Sonoma Clean Power plugs in big geothermal, solar deals. The North Bay Business Journal.
Economist, T. (2014). "Without the banks' baggage, shadow banks find it easier to oblige customers." News, from http://www.economist.com/news/special-report/21601625-without-banks-baggage-shadow-banks-find-it-easier-oblige-customers-we-try-harder.
EDC, S. D. R. (2014). 2014 Economic Outlook.
Edgerly, D. (2006). 2006 Annual Report on Sustainability Programs, City of Oakland: 17.
Ehrhardt-Martinez, K. (2008). Behavior, Energy, and Climate Change: Policy Directions, Program Innovations, and Research Paths, American Council for an Energy-Efficient Economy: 72.
Ehrhardt-Martinez, K. and J. A. S. Laitner (2009). Breaking Out of the Economic Box: Energy Efficiency, Social Rationality and Noneconomic Drivers of Behavioral Change. ECEEE 2009 Summer Study: Act! Innovate! Deliver! Reducing Energy Demand Sustainably, La Colle sur Loup, France, European Council for an Energy-Efficient Economy.
Energy Information Administration (2014). Annual Energy Outlook 2014 With Projections to 2040. Washington, D.C., U.S. Department of Energy.
EPA. (2014). "Sources of Greenhouse Gas Emissions." Commercial and Residential, from http://www.epa.gov/climatechange/ghgemissions/sources/commercialresidential.html.
EPA, C. (2014). "California Greenhouse Gas Emission Inventory." from http://www.arb.ca.gov/cc/inventory/inventory_current.htm.
Faeth, P. (2014). Solar Capital Costs Assumed by the Electricity Reliability Council of Texas. J. A. S. Laitner. Arlington, VA, CNA Institute for Public Policy Research.
FHFA Statement on Certain Energy Retrofit Loan Programs (2010).
Fisk, W. J. (2000). "Health and productivity gains from better indoor environments and their relationships with building energy efficiency." Annual Review of Energy and the Environment 25: 30.
Fitzer, E. and T. Smith. Gila Bend Planning and Economic Development Office. G. Burmeister.
Golding, S. (2014). Discussion regarding City of San Diego CCA Feasibility Analysis. M. McDonnell.
Gordon, C., N. Silva-Send and S. J. Anders (2013). Community-Scale Greenhouse Gas Emissions Model: San Diego Region: Technical Documentation and Methodology Version 1.0. San Diego, CA, University of San Diego Energy Policy Initiatives Center.
Gordon, M. (2014). CCA and Microgrids: Community Driven, Private Enterprise Models for Smart Grid Innovation.
1 - 252
Governments, San Diego Association of (2008). 2030 Regional Growth Forecast Update: Process and Model Documentation, SANDAG: 118.
Granade, H. C. (2009). Unlocking Energy Efficency in the U.S. Economy, McKinsey & Company.
Grattidge, B. and A. Lawler (2003). State of California General Plan Guidelines. State of California, Governor's Office of Planning and Research: 290.
Group, M. C. (2012). Benchmarking and Disclosure: Lessons from Leading Cities, Boston Green Ribbon Commission's Commercial Real Estate Working Group: 16.
Hall, A. (2014). San Diego Workforce Partenership. G. Burmeister.
Hanson, D. A. and J. A. S. Laitner (2004). "An Integrated Analysis of Policies that Increase Investments in Advanced Energy-Efficient/Low-Carbon Technologies." Energy Economics 26(4): 739-755.
Hanson, D. A. and J. A. S. Laitner (2009). Input-Output Equations Embedded within Climate and Energy Policy Analysis Models. Input-Output Economics for Industrial Ecology. S. Suh. Dordrecht, Netherlands, Springer.
Heavner, B. (2014). California Solar Energy Industries Association. Policy Director. G. Burmeister.
Heeter, J. and J. McLaren (2012). Innovations in Voluntary Renewable Energy Procurement: Methods for Expanding Access and Lowering Cost for Communities, Governments, and Businesses, NREL, DOE: 35.
Hoffman, I. M., G. Rybka, G. Leventis, C. A. Goldman, L. Schwartz, M. Billingsley and S. Schiller (2014). Customer-Funded Energy Efficiency Programs: National, Sector- and Program-Level Estimates and Issues. L. B. N. Laboratory. Berkeley, CA.
Houck, J. a. R., Wilson (2009). "The Sustainable Energy Utility (SEU) Model for Energy Service Delivery." Bulletin of Science, Technology & Society 29(2).
Hunt, T. (2014). Director of Research & Government Affairs, Clean Energy Collective.
Huntington, H. G., J. P. Weyant and J. L. Sweeney (1982). "Modeling for Insights, Not Numbers: The Experiences of the Energy Modeling Forum." Omega: The International Journal of Management Science 10(5): 449-462.
IMPLAN (2014). IMPLAN Data for California 2012. Huntersville, NC, IMPLAN Group LLC.
Indianapolis, City of (2012). "The City Fleet and Energy Security." from http://www.indy.gov/egov/mayor/initiatives/pages/indyenergysecurity.aspx.
IREC. (2014). "Interstate Renewable Energy Council." from http://www.irecusa.org/.
Jacobson, M. Z., M. A. Delucchi, A. R. Ingraffea, R. W. Howarth, Guillaume Bazouin, B. Bridgeland, K. Burkart, M. Chang, N. Chowdhury, R. Cook, G. Escher, M. Galka, L. Han, C. Heavey, A. Hernandez, D. F. Jacobson, Dionna S. Jacobson, B. Miranda, Gavin Novotny, M. Pellat, P. Quach, A. Romano, D. Stewart, L. Vogel, S. Wang, H. Wang, L. Willman and T. Yeskoo (2014). "A roadmap for repowering California for all purposes with wind, water, and sunlight." Energy 73(14 August 2014): 875-889.
Jose, City of San (2014). "Reports & Publications." from http://www.sanjoseca.gov/index.aspx?NID=2839.
1 - 253

JVSV. (2015). "Renewable Energy Procurment (REP)." from http://www.jointventure.org/index.php?option=com_content&view=article&id=1108&Itemid=727.
Kats, G., L. Alevantis, A. Berman, E. Mills and J. Perlman (2003). The Costs and Financial Benefits of Green Buildings: 120.
Kavalec, C., N. Fugate, B. Alcorn, M. Ciminelli, A. Gautam, K. Sullivan and M. Weng-Gutierrez (2014). California Energy Demand 2014 2024 Final Forecast Volume 2: Electricity Demand by Utility Planning Area. Sacramento, CA, California Energy Commission.
Kavalec, C., N. Fugate, B. Alcorn, M. Ciminelli, A. Gautam, K. Sullivan and M. Weng-Gutierrez (2014). California Energy Demand 2014 2024 Final Forecast, Volume 1: Statewide Electricity Demand, End User Natural Gas Demand, and Energy Efficiency. Sacramento, CA, California Energy Commission.
Keller, R. and J. A. Laitner (2014). Photon-Enhanced Thermionic Emission, Economic and Human Dimensions Research Associates.
Keller, R. and J. A. Laitner (2014). Pumped Heat Electricity Storage (PHES), Economic and Human Dimensions Research Associates.
Keller, R. and J. A. Laitner (2014). Solar Roadways, Economic and Human Dimensions Research Associates.
Keller, R. and J. A. Laitner (2015). The Emergence of Energy Harvesting Technologies, Economic and Human Dimensions Research Associates.
Kelly, K. and K. Delfino (2012). Smart from the Start: Responsible Renewable Energy Development in the Southern San Joaquin Valley. Central Valley Renewable Energy Project, Defenders of Wildlife: 16.
Koch, W. (2014). "U.S. Solar Projects get left from online tool." Money, 2015, from http://www.usatoday.com/story/money/business/2014/06/17/web-tool-crowdfunds-community-solar-projects/10658629/.
Kümmel, R. (2011). The Second Law of Economics: Energy, Entropy, and the Origins of Wealth. New York, NY, Springer.
Kümmel, R. (2013). "Why energy’s economic weight is much larger than its cost share." Environmental Innovation and Societal Transitions 2013(9): 33-37.
Lagos, J. C. a. M. (2014). Mayor Lee proposes gutting CleanPowerSF energy program. SFGate.
Laitner, J. A. S. (2009). The Positive Economics of Climate Change Policies: What the Historical Evidence Can Tell Us. Washington, D.C., American Council for an Energy-Efficient Economy.
Laitner, J. A. S. (2014). "Climate and Economic Storms of Our Grandchildren." Journal of Environmental Studies and Sciences 14(4): 99-109.
Laitner, J. A. S. (2014). The Link between Energy Efficiency, Useful Work, and a Robust Economy. Green Energy Economies: The Search for Clean and Renewable Energy. J. Byrne and Y.-D. Wang. New Brunswick, NJ, Transaction Publishers.
1 - 254

Laitner, J. A. S. (2014). "Linking energy efficiency to economic productivity: recommendations for improving the robustness of the U.S. economy." Wiley Interdisciplinary Reviews: Energy and Environment.
Laitner, J. A. S. (2015). Working Assessment of the Cost of Photovoltaic Systems in California 2007-2014. Tucson, AZ, Economic and Human Dimensions Research Associates.
Laitner, J. A. S., ", S. J. DeCanio and I. Peters (2000). Incorporating Behavioral, Social, and Organizational Phenomena in the Assessment of Climate Change Mitigation Options. Society, behavior, and climate change mitigation. E. Jochem, J. Sathaye and D. Bouille. Dordrecht, The Netherlands, Kluwer Academic Press. 8: 1-64.
Laitner, J. A. S., K. Ehrhardt-Martinez and V. McKinney (2009). Examining the Scale of the Behaviour Energy Efficiency Continuum. ECEEE 2009 Summer Study: Act! Innovate! Deliver! Reducing Energy Demand Sustainably, La Colle sur Loup, France, European Council for an Energy-Efficient Economy.
Laitner, J. A. S. and D. A. Hanson (2006). "Modeling Detailed Energy Efficiency Technologies and Technology Policies within a CGE Framework." Energy Journal Special Edition, Hybrid Modeling of Energy-Environment Policies: Reconciling Bottom-Up and Top-Down: 151-169.
Laitner, J. A. S. and R. Keller (2015). A Note on the Needed Infrastructure Costs in San Diego County. Tucson, AZ, Economic and Human Dimensions Research Associates.
Laitner, J. A. S. and M. T. McDonnell (2012). Securing Nebraska's Energy and Economic Future: Creating Jobs, New Economic Opportunities and Health Benefits through Productive Investments in Wind Energy and Energy Efficiency. S. Club. Lincoln, NE.
Laitner, J. A. S. and M. T. McDonnell (2014). Energy Efficiency as a Pollution Control Technology and a Net Job Creator under Section 111(d) Carbon Pollution Standards for Existing Power Plants. Washington, D.C., Environmental Defense Fund.
Laitner, J. A. S., S. Nadel, R. N. Elliott, H. Sachs and A. S. Khan (2012). The Long-Term Energy Efficiency Potential: What the Evidence Suggests. Washington, D.C., American Council for an Energy-Efficient Economy.
Laitner, J. A. S., B. Partridge and V. Vittore (2012). Measuring the Energy Reduction Impact of Selected Broadband-Enabled Activities within Households. Washington, D.C., American Council for an Energy-Efficient Economy.
Laitner, S. (2014). Economic and Human Dimensions Research Associates. G. Burmeister.
Lazard (2014). Levelized Cost of Energy Analysis: Version 8.0. New York, NY, Lazard.
Lee, M. (2014). Borrowing from taxman to buy solar. San Diego Union-Tribune.
Lee, M. (2015). Solar loan competition heats up in Southern California. San Diego Union-Tribune.
Margoni, L. (2013). "California Energy Commission Awards More Than $1.8 Million for UC San Diego Microgrid Projects." from http://ucsdnews.ucsd.edu/pressrelease/california_energy_commission_awards_more_than_1.8_million_for_uc_san_diego.
Marqusee, J. (2012). Microgrids and DoD Facilities, SERDP/ESTCP.
1 - 255

Marshall, S. (2014). Community Choice Aggregation: A Local Energy Model to Green the Grid, Boost Local Economics and Offer Consumers a Choice. CSAC Annual Conference.
McHale, C. and S. Leurig (2012). Stormy Future for U.S. Property/Casualty Insurer: The Growing Costs and Risks of Extreme Weather Events. Boston, MA, Ceres.
Meis, K. (2012). Regional Energy Network Overview.
Meisen, P. and J. Black (2010). San Diego Regional Plan for 100% Renewable Energy, GENI: 33.
Mersich, M. (2015). Clmate Action Planner, Regional Climate Protection Agency. RCAP. G. Burmeister.
Mieux, Y. M. L. (2014). Direct Testimony on behalf of San Diego Gas & Electric Company. CPUC, Sempra Energy.
Mishra, A. (2014). "TOP 5 Renewable Energy Crowdfunding Platforms." 2015, from http://www.solarplaza.com/article/top-5-renewable-energy-crowdfunding-platforms.
Miskowiak, D. and L. Stoll (2005). Planning Implementation Tools: Overlay Zoning, Center for Land Use Education: 5.
Morgan, S. (2014). Office of Planning Reserch. G. Burmeister.
Mosley, R. (2014). Public Technology Institute. G. Burmeister.
Murray, D. (2012). San Francisco Mayor's Renewable Energy Task Force Recommendations Report, San Francisco Department of Environment: 90.
NACO (2014). A Workforce that Works: County Innovations in Workforce Development, National Association of Counties: 16.
Navigant, C. (2005). Community Choice Aggregation, Base Case Feasibility Evaluation. County of San Diego, County of San Diego.
Network, B. A. R. E. (2015). Program Update Report | Jan 2015, Bay REN.
Neubauer, M. (2014). Cracking the TEAPOT: Technical, Economic, and Achievable Energy Efficiency Potential Studies. Washington, D.C., American Council for an Energy-Efficient Economy.
News, M. (2014). "NJ Transit Receives Federal Funding for Microgrid Project," from http://microgridnews.com/nj-transit-receives-federal-funding-for-microgrid-project/.
Northup, B. (2015). San Diego County Interim Fleet Acquisitions Coordinator. G. Burmeister.
NREL (2010). Property-Assessed Clean Energy (PACE) Financing of Renewables and Efficiency, NREL.
Office of the Comptroller of the Currency (2010). Supervisory Guidance: Property Assessed Clean Energy (PACE) Programs. Department of the Treasury.
Oliver, N. (2014). The Center For Sustainable Energy. G. Burmeister.
Oliver, N. (2015). Center For Sustainable Energy. G. Burmeister.
Opalka, B. (2013) "How the unheralded water heater is on the cutting-edge of demand response." Utility Dive.
1 - 256

Overton, T. (2015). "California Governor Wants to Raise State's RPS Target to 50%." Renewables, from http://www.powermag.com/california-governor-wants-to-raise-states-2030-rps-target-to-50/.
Paulos, B. (2014). "UC San Diego Is Building the 'Motel 6' of Microgrids." Grid, from http://www.greentechmedia.com/articles/read/byrom-washom-master-of-the-microgrid.
Petrow, A. and R. Mosley (2013). California Local Energy Assurance Planning, California Local Energy Assurance Planning: 2.
PG&E (2012). Appendix A: Motion for Consideration of the San Francisco Bay Area Regional Energy Network: 129.
Postal, J. (2014). Sun Share. Vice President. G. Burmeister.
Quarles, D., A. Bastian and R. Norton. (2014). "About the Office of Sustainability." from http://www.atlantaga.gov/index.aspx?page=153.
Rabago, K. (2014). G. Burmeister.
RAP (2013). G. Burmeister, Regulatory Assistance Project.
Reed, B. (2015). Chula Vista Environmental Resourse Manager. G. Burmeister.
Renewables, S. (2014). "States with Shared Renewable Policy." from http://www.sharedrenewables.org/.
Rifkin, J. (2011). The Third Industrial Revolution: How Lateral Power Is Transforming Energy, the Economy, and the World. New York, NY, Palgrave MacMillan.
Rifkin, J., B. Lebot, J. A. S. Laitner, S. Bastie, F. Hinterman and S. Moorhead (2013). Third Industrial Revolution Master Plan Nord-Pas de Calais, France. Bethesda, MD, TIR Consulting.
Riverside, County of (2015). "Green Action Plan." from http://www.greenriverside.com/about-green-riverside/green-action-plan.
Roth, S. (2015). "New Policy to help renters, apartment dwellers go solar." USA Today, from http://www.desertsun.com/story/tech/science/energy/2015/01/14/new-policy-help-renters-apartment-dwellers-go-solar/21783551/.
Sabatini, J. (2015). CleanPowerSF back on track with anticipated job creation, mayor support. San Francisco Examiner.
Sabatini, J. (2015). CleanPowerSF supporters demand aggressive launch schedule. San Francisco Examiner.
SANDAG (2013). San Diego Regional Plug-In Electric Vehicle (PEV) Readiness Plan: Appendix A: 26.
SANDAG (2014). San Diego Regional: Plug-In Electric Vehicle (PEV) Readiness Plan, California Center for Sustainable Energy: 37.
Sarrubi, J. (2014). U.S. Department of Energy's Solar Instructor Training Network (SITN). G. Burmeister.
Schneider, M. (2014). G. Burmeister.
1 - 257
Schorske, R., M. Chiacos, S. Cowen, A. A. Genet, M. Guise, R. Tan and M. Pearson (2014). Electric Vehicle Readiness Plan for Ventura, Santa Barbara, and San Luis Obispo Counties (Central Coast), EV Communities Alliance: 171.
SDG&;E. (2015). "Notice of Intent | San Diego Gas & Electric." Retrieved February 15, 2015, from http://www.sdge.com/customer-choice/electricity/notice-intent.
SDG&E (2011). Prepping for Plug-In Vehicles, SDG&E.
SDG&E (2012). SDG&E To Expand Local Solar Market, Increase Customer Access, SDG&E.
SDICCCA (2011). San Diego and Imperial Counties Community Colleges Association, SDICCCA: 151.
SEIA. (2015). "California Leaders Press Forward on Climate Action." News, from http://www.seia.org/news/california-leaders-press-forward-climate-action.
Sikkema, E. (2015). G. Burmeister.
Snelling, T. (2014). Butte County California Planning Director. G. Burmeister.
SoCalREN (2014). 2013-2014 Energy Efficiency Portfolio, Southern California Regional Energy Network: 266.
Soitec. (2014). "Soitec CPV Advantages." from http://www.soitec.com/en/markets/solar-energy/cpv-advantages/.
Solar, C., H. Solar, O. S. Racking, Q. M. PV and S. M. Group (2014). Solar Panels Last 25 Years - But Will They Stay Safely Attached to Your Roof? The Importance of Reliable Solar Mounting Systems, Cinnamon Solar, Solar Marketing Group LLC: 25.
Sonoma, C. o. (2011). Sonoma County Energy Independence Program: Marketing Education and Outreach (MEO) Plan, Nonresidential, County of Sonoma.
Sonoma County Water Agency, County of Sonoma G. S., Dalessi Managment Consulting LLC, MRW & Associates (2011). Report on the Feasibility of Community Choice Aggregation in Sonoma County.
Stoner, P. (2007). Community Choice Aggregation, Local Government Commission.
Trabish, H. K. (2015). "SDG&E lands $5M grant to expand all-renewables microgrid." News, 2015, from http://www.utilitydive.com/news/sdge-lands-5m-grant-to-expand-all-renewables-microgrid/365802/.
Turner, B. (2015). SDG&E Energy Innovations Center Manager. G. Burmeister.
Vista, C. o. C. (2014). 2014 CAP Update - Energy Sector Planning Matrix. CCWG, chulavista.gov.
Wolfe, A. and M. Brown (2000). Estimates of Administrative Costs for Energy Efficiency Policies and Programs. Scenarios for a Clean Energy Future. M. Brown, W. Short and M. Levine. Oak Ridge, TN, Oak Ridge National Laboratory.
Wood, E. (2014). "Microgrids 101: A Non-geek Definition of Microgrid." from http://microgridknowledge.com/microgrids-101-non-geek-definition-microgrid/.
Wood, E. (2014). "Of Mice and Microgrids: A Profile of the US' Largest Microgrid." from http://microgridknowledge.com/mice-microgrids-profile-one-us-largest-microgrids/.
1 - 258

Woods and Poole (2014). Economic Projections Data for the United States, California, and San Diego County. Washington D.C., Woods and Poole Economics LLC.
Yeager, L. (2014). Sonoma County Energy and Sustainablility Division. E. Sikkema.
Yee, B. T. (2012). "Welcome to the Government Compensation in California (GCC) Website." from http://publicpay.ca.gov/.
1 - 259

Attachment D – Executive Summary Report (Ascent 2016)
1 - 260

1 - 261

1 - 262

1 - 263

County of San Diego Planning & Development Services
Phase I Comprehensive Renewable Energy Plan
Executive Summary Report
PREPARED FOR
CCounty of San Diego Planning & Development Services
5510 Overland Ave., Suite 310 San Diego, CA 92123
Contact: Laurel G. Lees 619.346.2333
PREPARED BY
Ascent Environmental, Inc. 555 W. Beech Street, Suite 302
San Diego, CA 92101 Contacts: Poonam Boparai/Heidi Gen Kuong
858.354.4151/916.444.7301 [email protected]/[email protected]
September 2016
1 - 264

1 - 265

1 - 266

Executive Summary Report Ascent Environmental
County of San Diego Planning & Development Services ii Phase I Comprehensive Renewable Energy Plan
Tables Table 2-1 List of Renewable Energy Systems at County Facilities Installed Since 2009 ......................... 12
Table 4-1 BMP #1: Amend the General Plan and add an Energy Element ............................................... 23 Table 4-2 BMP #2: Establish a New Office of Sustainability ...................................................................... 24
Table 4-3 BMP #3: Establish an Institutional and Financing Capability .................................................... 25
Table 4-4 BMP #4: Establish an Institutional and Financing Capability .................................................... 27 Table 4-5 BMP #5: Establish a Solar Energy Workforce Development Initiative ...................................... 29
Table 4-6 BMP #6: Build an Energy Assurance Plan (EAP) ........................................................................ 30 Table 4-7 BMP #7: Increase the County’s Percentage of Energy Derived from Various
Renewable Energy Technologies ................................................................................................. 31
Table 4-8 BMP #8: Establish a Renewable Energy Group Procurement Initiative (GPI) .......................... 32
Table 4-9 BMP #9: Participate in the Creation of a New Regional Energy Network (REN) ...................... 33 Table 4-10 BMP #10: Create a Renewable Energy Overlay / Combining Zone .......................................... 34
Table 4-11 BMP #11: Establish Building Energy Disclosure Policies .......................................................... 35 Table 4-12 BMP #12: Promote More Aggressive Building Standards Including the Significant
Retrofit of Existing Buildings ........................................................................................................ 36
Table 4-13 BMP #13: Increase Renewable Energy Education and Outreach ............................................. 37 Table 4-14 BMP #14: Start a Community Solar Initiative ............................................................................. 38
Table 4-15 BMP #15: Establish a Microgrid and Develop Policies Related to Microgrids ......................... 39
Table 4-16 BMP #16: Establish Electric Vehicle (EV) and Charging Programs ........................................... 40 Table 4-17 BMP #17: Develop a Legislative Strategy to Support Renewable Energy Programs ............... 41
Table 5-1 Summary of Energy Expenditures in 2012 ................................................................................. 42 Table 5-2 Energy Bill Expenditures in the Unincorporated County (2015-2050) ..................................... 43
Table 5-3 Annual Average and Cumulative Economic Impacts of Innovation Scenarios ......................... 44
Table 5-4 Environmental Benefits of Innovation Scenarios ....................................................................... 44 Table 6-1 Summary of CREP BMPs .............................................................................................................. 45
1 - 267

Ascent Environmental Executive Summary Report
County of San Diego Planning & Development Services Phase I Comprehensive Renewable Energy Plan iii
ACRONYMS AND ABBREVIATIONS
AFV Alternative fuel vehicle
ARB California Air Resources Board
BMP Best management practices
Board County of San Diego Board of Supervisors
CALGreen California Green Building Standards
CAP Climate Action Plan
CCA Consumer Choice Aggregation
CEC California Energy Commission
CO2 Carbon dioxide
County County of San Diego
CREB Clean Renewable Energy Bond
CREP Phase I Comprehensive Renewable Energy Plan
DA Direct Access
DOE Department of Energy
DRECP Desert Renewable Energy Conservation Plan
EAP Energy Assurance Plan
ECR Enhanced Community Renewables
Empower Report Phase I Comprehensive Renewable Energy Plan Report
EPAct Energy Policy Act of 1992
EPAct 2005 Energy Policy Act of 2005
ESP Electric service provider
ESCo Energy Service Company
EVSE EV supply equipment
FHFA Federal Housing Finance Agency
FIT Feed-in-Tariff
GHG Greenhouse gas
GTSR Green Tariff Shared Renewables
HERO California Home Energy Renovation Opportunity
IEPR Integrated Energy Policy Report
IOU Investor-owned utility
kW Kilowatt
kWh Kilowatt per hour
1 - 268

Executive Summary Report Ascent Environmental
County of San Diego Planning & Development Services iv Phase I Comprehensive Renewable Energy Plan
LCE Lancaster Choice Energy
MCE Marin Clean Energy
MW Megawatts
NEM Net energy metering
OPR Governor’s Office of Planning and Research
P2P Peer-to-peer
PACE Property Assessed Clean Energy
PG&E Pacific Gas and Electric
PPA Power Purchase Agreement
PTC Production tax credit
QECB Qualified Energy Conservation Bond
REN Regional energy network
SCE Southern California Edison
SCEF Sonoma County Efficiency Financing
SCP Sonoma Clean Power
SDG&E San Diego Gas and Electric
SEU Sustainable Energy Utility
TAC Technical Advisory Committee
WIOA Workforce Innovation and Opportunity Act
ZEV Zero-emission vehicles
ZNE Zero net energy
1 - 269

1 - 270

Executive Summary Report Ascent Environmental
County of San Diego Planning & Development Services 2 Phase I Comprehensive Renewable Energy Plan
economic, and political factors. For more information on how rankings were determined, see Section 4 of this summary report.
� FFocus on BMPs with Medium or High Return on Investment Rankings. While all of the BMPs can arguably provide value and promote more renewable energy development in the County, it is important for the County to focus on the BMPs that will provide the highest return on investment, or the most benefit for the money spent. The summary tables and analyses in Sections 4 and 6 of this report provide an initial ranking of the cost and benefits. For further consideration in the CREP process, the County should focus on the BMPs that have medium or high return on investment rankings.
� Top BMP Recommendations for Phase II of the CREP. Based on an assessment of cost, financing options, advantages, disadvantages, and overall opportunity to increase renewable energy development, the following four BMPs have been identified as the top recommendations for the County to pursue in Phase II of the CREP.
� Develop a CCA Feasibility Study (BMP #3). Compared to other alternative energy models proposed (i.e., Direct Access (DA), Sustainable Energy Utility (SEU)), pursuing development of a CCA through a feasibility study would be the best use of County resources. Given current restrictions, the ability for a DA program to increase renewable energy development is limited. The County could lobby both the California Public Utilities Commission (CPUC) and/or the State legislature to open up DA beyond its current limits, but this could be time extensive and results are not guaranteed. Regarding an SEU, a CCA could provide a similar energy integrator role and financing opportunities. The County could explore developing an SEU if it doesn’t choose to pursue a CCA program, but it is important to keep in mind that SEUs still require legislative action in order to implement.
There are a number environmental, economic, and administrative advantages to creating a CCA. Given the significant amount of investment, resources, and staffing needed to establish, run, and operate a CCA, it is important that the County conduct a feasibility study before arriving at a decision. However, to avoid duplicated efforts and to ensure more unified results, the County should consider other CCA feasibility studies being prepared in the region before drafting its own study. The City of Solana Beach recently completed a feasibility study in April 2016. Also, the City of San Diego is in the beginning stages of drafting a citywide CCA feasibility study. The County should coordinate and work with the City of San Diego on these efforts to determine ways to supplement information on a county-wide level.
The County’s feasibility study should be clear in its objectives for the program, sources of funding, and economic viability. The study should consider San Diego Gas and Electric (SDG&E) load data and renewable resource assessments to identify potential projects; assess the potential size of the program in terms of number of customers and electricity sales; develop a financial and cash-flow model; predict the overall return on investment; quantify the jobs created under various procurement scenarios; and outline how start-up costs would be financed. If the feasibility study finds that a CCA program would be viable for the County, the benefits could well outweigh the costs.
� Create a Renewable Energy Overlay (BMP #10). By reducing planning process time and by providing more certainty to investors, a renewable energy overlay zone can save both the developer and the government money. It also sends a signal to investors that the County wants to see renewable energy in specific locations in the County. While it may be difficult to secure funding for an overlay zone, the potential benefits for creating an overlay zone are worth considering. The County could better direct renewable energy development and identify opportunity areas that consider current and proposed land uses and environmental conditions.
� Track Community Solar Initiative Legislation (BMP #14). Because many people are not able to install solar photovoltaic (PV) systems on their rooftops for a number of reasons (i.e., limited or no space, financial restrictions, living in a rental or multi-family unit, or poor rooftop solar orientation), Community Solar can help consumers gain access to solar opportunities. It also minimizes the usual
1 - 271

Ascent Environmental Executive Summary Report
County of San Diego Planning & Development Services Phase I Comprehensive Renewable Energy Plan 3
high upfront solar costs and supports the local solar industry. Community Solar could also promote the development of more solar developments in the County. The County should be involved in tracking the regulatory decisions established by Senate Bill (SB) 43 and consider how it could implement a Community Solar initiative in the future. The county should also look to other cities that have implemented Community Solar (e.g., City of Carlsbad).
� Establish a Microgrid and Develop Policies Related to Microgrids (BMP #15). Microgrids, which are self-contained power systems that have on or more power sources (often renewable), offer a number of economic, environmental, power quality, and security benefits. The primary benefit of a microgrid is reliability and its ability to keep critical infrastructure, such as transportation systems, hospitals, data centers, water treatments facilities, police and fire departments, operating, particularly during times of crisis. As an example, Borrego Springs was funded through a variety of agencies and partners (i.e., Department of Energy [DOE], SDG&E, California Energy Commission [CEC], IBM, Motorola), suggesting that microgrids are an important asset and worth investing in. The County could begin by partnering with SDG&E and University of California San Diego (UCSD) on microgrid policies and identifying potential sites in the County where microgrids would be ideally suited.
� Additional Recommendations with a Medium or High Return on Investment Ranking. A high return on investment ranking, was given to BMPs that the County could most feasibly finance and gain support on at a political or organizational level. BMPs that had a clear path to implementation, or clear action items to determine feasibility, were also given a high ranking. Finally, BMPs with the highest potential to increase renewable energy opportunities in the County, were given a higher ranking, even if associated costs were high. A medium return on investment ranking was given to BMPs where some uncertainty existed as to whether the County could feasibly finance and gain support at a political or organizational level. BMPs with high start-up costs, and/or with less certain potential to increase renewable opportunities, were also given a medium ranking.
The following BMPs with a medium or high return on investment ranking should also be considered by the County:
� BMP #4: Establish Financing Capacity (i.e., Property Assessed Clean Energy [PACE] and Bonds)
� BMP #5: Develop a Solar Energy Workforce Development Initiative
� BMP #7: Increase the County’s Percentage of Energy Derived from Various Renewable Energy Technologies
� BMP #13: Increase Renewable Energy Education and Outreach
� BMP #16: Establish Electric Vehicle Programs
� BMP #17: Develop a Legislative Strategy to Support Renewable Energy Programs
� Avoid Costly BMPs That Require Too Many Existing Resources or New Staffing. A low return on investment ranking was given to BMPs that had more disadvantages than advantages and/or required a significant amount of additional research to determine feasibility of implementation. BMPs that were costly (or costs were undetermined) and had low potential to increase renewable energy opportunities in the County were also given a low ranking. A number of BMPs presented in this summary were ultimately given a low return on investment rating due to the level of new and existing staff time and resources needed for implementation and execution. These include:
� BMP #2: Establish a New Office of Sustainability
� BMP #8: Establish a Renewable Energy Group Procurement Initiative
1 - 272
Executive Summary Report Ascent Environmental
County of San Diego Planning & Development Services 4 Phase I Comprehensive Renewable Energy Plan
� BMP #9: Participate in the Creation of a New Regional Energy Network
� BMP #11: Develop a Building Energy Disclosure Program
A number of these BMPs are administrative in nature and also require large operating budgets that may prove difficult to fund. For example, the expenditures required to keep an Office of Sustainability (BMP #2) in operation are extensive and would put additional pressure on existing staff and resources that oversee it. Not only is a significant amount of research needed to determine whether a Group Procurement Initiative (GPI) would be feasible for the County (BMP #8), it may not be the best use of current staff time and resources due to the high level of coordination needed to implement a GPI. The same is true for creating a new regional energy network (REN) (BMP #9); the administrative burden placed on current staff as a result of extensive coordination and time needed to get a REN up and running makes it a less desirable option for the County to pursue. Finally, the actual coordination and manpower needed to create, implement, and oversee a Building Energy Disclosure Program (BMP #11) is quite high for the overall end gain.
� SSome BMPs are Better Addressed in the County’s CAP. A number of the BMPs address ways the County can increase renewable energy opportunities by creating additional planning documents. While plans help to consolidate policies and convey a unified approach to an issue, they can also be costly and hard to finance (i.e., unless the County can secure grant money). Because the County is already working on a CAP, the same objectives proposed in certain BMPs can be addressed in the CAP. For example, rather than prepare an Energy Element for the County’s General Plan (BMP #1), it would be better to align renewable energy directives with the upcoming CAP and to ensure its consistency with the General Plan. While an Energy Assurance Plan (EAP) addresses energy security (BMP #6), other planning documents (e.g. Hazard Mitigation Plan and the County’s CAP) may be better positioned to begin to outline key assets and ways to increase energy supply resiliency.
Additionally, certain policy and program BMPs should be addressed in the CAP to ensure their implementation and GHG reduction potential. The advantages associated with increasing the renewable energy mix in the County are important environmentally and will also help towards achieving legislative targets. Because the County is currently using a relatively small amount of renewable energy, there is an opportunity to increase this percentage mix by implementing changes (BMP #7). The exact percentage reduction should be aligned with Renewable Portfolio Standard (RPS) requirements and should also help achieve GHG reduction targets identified in the CAP. Also, the establishment of additional Electric Vehicle (EV) programs (BMP #16) have important implications to the reductions of GHGs in the County. Programs should be included in the County’s CAP to quantify their GHG reduction potential.
� Focus on Partnership and Collaborations. Some BMP programs would be more effective if the County chose to partner and collaborate with other agencies, entities, and organizations. Identifying appropriate partnership and collaboration opportunities will not only help implementation of certain BMPs, but strengthen existing programs that currently exist. The County should continue to support PACE programs (BMP #4) and help educate residents about the availability of these programs and encourage participation as a means to help reduce the region’s electricity demand. The County should also explore how it might support efforts to create a PACE district in San Diego administered by the Ygrene Energy Fund or a similar entity. Regarding whether the County should develop a Solar Energy Workforce Development Initiative (BMP #5), there are already a number of other organizations providing workforce development in the County. Rather than developing an entirely new initiative, it may be more beneficial to build upon existing programs and partner with other agencies and organizations who are already offering similar services. Furthermore, the County could also look to partner with other agencies and organizations that are already focused on renewable energy education and outreach to further success with BMP #13. Finally, the County could take advantage of legislation that supports renewable energy programs by working with the Office of Strategy and Intergovernmental Affairs (OSIA) to develop a legislative strategy that builds upon their existing legislative review process (BMP #17).
1 - 273

1 - 274

1 - 275

Ascent Environmental Executive Summary Report
County of San Diego Planning & Development Services Phase I Comprehensive Renewable Energy Plan 7
accompany SB 32 and establishes new statutory directions, including creating a six-member Joint Legislative Committee on Climate Change Policies to make recommendations to the Legislature. ARB is required to appear before this committee annually to present information on sectors covered by the Scoping Plan. AB 197 also requires ARB to consider social costs when adopting emission reduction rules and policies; prioritize direct emission reductions at large stationary sources and mobile sources; and identify ranges of GHG and air pollution reductions for every emissions reduction measure identified in subsequent Scoping Plan updates.
ADVANCED CLEAN CARS PROGRAM In January 2012, ARB approved the Advanced Clean Cars program which combines the control of GHG emissions and criteria air pollutants, as well as requirements for greater numbers of zero-emission vehicles (ZEV), into a single package of standards for vehicle model years 2017 through 2025. The new rules strengthen the GHG standard for 2017 models and beyond. This will be achieved through existing technologies, the use of stronger and lighter materials, and more efficient drivetrains and engines. The program’s ZEV regulation requires battery, fuel cell, and/or plug-in hybrid electric vehicles to account for up to 15 percent of California's new vehicle sales by 2025. The program also includes a clean fuels outlet regulation designed to support the commercialization of zero-emission hydrogen fuel cell vehicles planned by vehicle manufacturers by 2015 by requiring increased numbers of hydrogen fueling stations throughout the state. The number of stations will grow as vehicle manufacturers sell more fuel cell vehicles. By 2025, when the rules will be fully implemented, the statewide fleet of new cars and light trucks will emit 34 percent fewer GHG emissions and 75 percent fewer smog-forming emissions than the statewide fleet in 2016 (ARB 2011).
SENATE BILL 1389, INTEGRATED ENERGY POLICY REPORTS SB 1389 requires CEC to prepare a biennial integrated energy policy report that contains an assessment of major energy trends and issues facing the state’s electricity, natural gas, and transportation fuel sectors and provides policy recommendations to conserve resources; protect the environment; ensure reliable, secure, and diverse energy supplies; enhance the state’s economy; and protect public health and safety (Public Resources Code § 25301[a]). The CEC prepares these assessments and associated policy recommendations every two years, with updates in alternate years, as part of the Integrated Energy Policy Report (IEPR). Preparation of the IEPR involves close collaboration with federal, state, and local agencies and a wide variety of stakeholders in an extensive public process to identify critical energy issues and develop strategies to address those issues. (CEC 2012a).
ENERGY IMPROVEMENT AND EXTENSION ACT OF 2008 The Energy Improvement and Extension Act of 2008 provides a one-year extension of the production tax credit (PTC) for wind energy, keeping the credit in effect through 2009. The bill also provides a two-year PTC extension, through 2010, for electricity produced from geothermal, biomass, and solar energy facilities, as well as trash-to-energy facilities, small hydropower facilities using irrigation water, capacity additions to existing hydropower plants, and hydropower facilities added to existing dams. In addition, the bill creates a new PTC for electricity produced by marine and hydrokinetic renewable energy systems (also called advanced water power systems) with a rated capacity of at least 150 kilowatt (kW) and placed in service by 2011. To help on the financing end, the bill authorizes $800 million in new Clean Renewable Energy Bonds for all of the above technologies.
CALIFORNIA LONG-TERM ENERGY EFFICIENCY STRATEGIC PLAN On Sept. 18, 2008, the CPUC adopted California’s first Long Term Energy Efficiency Strategic Plan, presenting a single roadmap to achieve maximum energy savings across all major groups and sectors in California. This comprehensive Plan for 2009 to 2020 is the state’s first integrated framework of goals and strategies for saving energy, covering government, utility, and private sector actions, and holds energy
1 - 276
Executive Summary Report Ascent Environmental
County of San Diego Planning & Development Services 8 Phase I Comprehensive Renewable Energy Plan
efficiency to its role as the highest priority resource in meeting California’s energy needs. The plan was updated in January 2011 to include a lighting chapter.
CALIFORNIA BUILDING ENERGY EFFICIENCY STANDARDS (TITLE 24, PART 6) Buildings in California are required to comply with California’s Energy Efficiency Standards for Residential and Nonresidential Buildings (i.e., Title 24, Part 6 of the California Code of Regulations), established by the CEC to institutionalize energy conservation standards. The standards were first adopted in 1978 and are updated approximately every three years. All buildings for which a building permit is submitted on or after July 1, 2014 must follow the 2013 standards (CEC 2012b). The CEC Impact Analysis for California’s 2013 Building Energy Efficiency Standards estimates that the 2013 Standards are 23.3 percent more efficient than the previous 2008 standards for multi-family residential construction and 21.8 percent more efficient for non-residential construction (CEC 2013:3). CEC adopted the 2016 Building Energy Efficiency Standards in 2015. The 2016 Title 24 standards will go into effect on January 1, 2017. For single-family residences, the 2016 Title 24 standards will result in about 28 percent less energy use for lighting, heating, cooling, ventilation and water heating than the 2013 Title 24 standards (CEC 2015a). For non-residential land uses, the 2016 standards would result in 5 percent less energy use than those built to 2013 standards (CEC 2015b).
CALIFORNIA GREEN BUILDING STANDARDS (TITLE 24, PART 11) The California Green Building Standards (CALGreen) feature regulations for energy efficiency, water efficiency and conservation, material conservation and resource efficiency, and environmental quality. CALGreen has mandatory provisions for commercial, residential, and public school buildings, along with appendices with voluntary provisions. Mandatory provisions for nonresidential buildings require that buildings facilitate future installation of EV supply equipment (EVSE), by including the proper wiring and electrical components needed for EV charging stations. Provisions further dictate the number of required EV charging spaces that are required, based on number of actual parking spaces.
CALIFORNIA ZERO NET ENERGY BUILDING GOALS In 2007, the CPUC set a goal that all new residential construction in California will be zero net energy (ZNE) by 2020, and all new commercial construction will be ZNE by 2030. The CPUC reiterated its commitments to these goals when it adopted the California Long Term Energy Efficiency Strategic Plan in 2008. The California Energy Commission adopted the goal to achieve zero net energy building standards by 2020 for homes and 2030 for commercial buildings in its 2007 Integrated Energy Policy Report (IEPR), and reaffirmed that goal in its 2011 IEPR. The Zero Net Energy Building goals have also been supported in the California Energy Action Plan, the AB 32 Scoping Plan, the Governor’s Clean Energy Jobs Plan, and the Clean Energy Futures Vision. In order to effectively implement each of the California Long Term Energy Efficiency Strategic Plan's goals, the CPUC has initiated individual goal area Action Plan efforts to create work plans and to continue the stakeholder engagement process that was used in the strategic plan. In 2011, the CPUC launched a ZNE Commercial Building Action Plan, which is designed to help commercial building owners in the state take advantage of the latest technologies and financial incentives to help reduce building energy use to “net-zero” through greater efficiency and on-site clean energy production. CPUC and CEC drafted the Zero Net Energy Action Plan in June 2015 specifically for new residential construction. The Action Plan provides a foundation for the development of a robust and self-sustaining ZNE market for new homes over the next five years, supports future codes and standards for ZNE, and inspires voluntary actions to meet California’s goal.
ASSEMBLY BILL 758, COMPREHENSIVE ENERGY EFFICIENCY PLAN FOR EXISTING BUILDINGS AB 758 (Skinner, Chapter 470, Statutes 2009) requires the CEC, in collaboration with the CPUC and stakeholders, to develop a comprehensive program to achieve greater energy efficiency in the state’s existing buildings. The Existing Buildings Energy Efficiency Action (EBEE) Plan was released in 2015 and provides a 10-year framework to focus state and local governments, the building, contracting industries, and
1 - 277
Ascent Environmental Executive Summary Report
County of San Diego Planning & Development Services Phase I Comprehensive Renewable Energy Plan 9
real estate industries, financial market actors, and other key stakeholders on achieving much greater energy and water efficiency in existing residential, commercial, and public buildings. The EBEE Action Plan covers all existing buildings in the single-family, multifamily, commercial, and public buildings sectors
SENATE BILL X1-2, THE CALIFORNIA RENEWABLE ENERGY PORTFOLIO STANDARD SB X1-2 of 2011 requires all California utilities to generate 33 percent of their electricity supply (portfolio) from renewables by 2020. SB X1-2 sets a three-stage compliance period requiring all California utilities, including independently owned utilities, energy service providers, and community choice aggregators, to generate 20 percent of their electricity from renewables by December 31, 2013; 25 percent by December 31, 2016; and 33 percent by December 31, 2020. SB X1-2 also requires the renewable electricity standard to be met increasingly with renewable energy that is supplied to the California grid from sources within, or directly proximate to, California. SB X1-2 mandates that renewables from these sources make up at least 50 percent of the total renewable energy for the 2011-2013 compliance period, at least 65 percent for the 2014-2016 compliance period, and at least 75 percent for 2016 and beyond. The CPUC and the CEC jointly implement the statewide RPS program through rulemakings and monitoring the activities of electric energy utilities in the state.
SENATE BILL 350, THE CLEAN ENERGY AND POLLUTION REDUCTION ACT OF 2015 In consideration of the approaching expiration of SB X1-2 goals, SB 350 of 2015 calls for 1) a new objective for procure 50 percent of the state’s electricity from renewables by 2030 and 2) a doubling of statewide energy efficiency savings in electricity and natural gas final end uses of retail customers by January 1, 2030 with annual targets established by the CEC.
CALIFORNIA QUALIFYING FACILITY AND COMBINED HEAT AND POWER PROGRAM SETTLEMENT In December 2010, the CPUC approved California’s Qualifying Facility and Combined Heat and Power (CHP) Program Settlement, which established a CHP framework for the state’s investor-owned utilities. The settlement established a near-term target of 3,000 megawatts (MW) of CHP for entities under the jurisdiction of the CPUC, although this target includes not just new CHP, but capacity from renewal of contracts due to expire in the next three years. The CPUC has also adopted a settlement agreement that includes reforms to the Electric Rule 21 interconnection process to provide a clear, predictable path to interconnection of distributed generation while maintaining the safety and reliability of the grid. Electric Rule 21 is a tariff that describes the interconnection, operating, and metering requirements for generation facilities to be connected to a utility’s distribution system, over which the CPUC has jurisdiction (CEC 2013).
ALTERNATIVE AND RENEWABLE FUEL AND VEHICLE TECHNOLOGY PROGRAM AB 118 (Statues of 2007) created the CEC’s Alternative and Renewable Fuel and Vehicle Technology Program. The statute, subsequently amended by AB 109 (Statutes of 2008), authorizes the CEC to develop and deploy alternative and renewable fuels and advanced transportation technologies to help attain the state’s climate change policies. The statute allows the CEC to use grants, loans, loan guarantees, revolving loans, and other appropriate measures. Eligible recipients include: public agencies, private businesses, public-private partnerships, vehicle and technology consortia, workforce training partnerships and collaboratives, fleet owners, consumers, recreational boaters, and academic institutions. The CEC must prepare and adopt an Investment Plan and convene an Advisory Committee to assist in preparing the Investment Plan.
SENATE BILL 43, THE GREEN TARIFF SHARED RENEWABLES PROGRAM SB 43, passed in 2013, directed the CPUC to implement the Green Tariff Shared Renewables (GTSR) program to expand customer access to “all eligible renewable energy resources to all ratepayers who are
1 - 278

Executive Summary Report Ascent Environmental
County of San Diego Planning & Development Services 10 Phase I Comprehensive Renewable Energy Plan
currently unable to access the benefits of onsite generation.” The law sets a sunset date of January 1, 2019 for the GTSR program, unless extended. The GTSR program applies to the three largest IOUs (i.e., Pacific Gas and Electric [PG&E], Southern California Edison [SCE], and SDG&E) and mandates that they administer the GTSR program in their service territory. The GTSR program allows both a Green Tariff Option and Enhanced Community Renewables (ECR) option to facilitate shared solar in California. SB 43 does not mandate how procurement should be divided between the Green Tariff and ECR programs. In 2015, the CPUC approved GTSR programs for SDG&E, PG&E, and SCE (EPIC 2015).
SAN DIEGO GAS & ELECTRIC INDEPENDENT MARKETING DIVISION COMPLIANCE PLAN (CPUC RESOLUTION E-4874) In July 2016, the CPUC approved SDG&E’s proposal to form an Independent Marketing Division (IMD) to lobby or market against CCAs. Under SB 790 (signed in 2011), the CPUC was required to create a Code of Conduct, which prohibited utilities from lobbying against CCAs, unless it forms an IMD that is funded exclusively by its shareholders. The IMD must also be functionally and physically separate from ratepayer divisions. SDG&E chose to house its IMD inside an already existing affiliate, Sempra Services Corporation (SSC). SDG&E is the first utility in the state to apply for approval from the CPUC for such a division (CPUC 2016a).
GUIDANCE FOR INITIAL ENERGY EFFICIENCY ROLLING PORTFOLIO BUSINESS PLAN FILINGS (CPUC DECISION 16-08-019) In August 2016, the CPUC passed a decision addressing next steps for RENs, the appropriate baselines to be used to measure energy savings for specific programs and measures, transition for statewide and third-party programs, and changes to the evaluation and shareholder incentive frameworks. The decision states that RENs will retain their designation status as pilots and are requested to submit business plans in coordination with the other energy efficiency program administrators. REN proposals will also need to be vetted through the stakeholder process at the California Energy Efficiency Coordinating Committee (CAEECC) prior to submission to the CPUC. REN programs, and therefore administrative expenses, will only be funded to the extent that they are determined by the CPUC to provide value (or the promise of value) to ratepayers in terms of energy savings and/or market transformation results for energy efficiency (CPUC 2016b).
2.1.3 Local
SAN DIEGO COUNTY GENERAL PLAN The Conservation Element of the San Diego County General Plan (2011) contains policies related to energy efficiency and renewable energy development. Policies range from encouraging development projects to use renewable energy (COS-14.7); requiring County facilities to meet “green building” programs (COS-15.3), requiring development to meet Title 24 Energy Standards (COS-15.4); encouraging energy efficiency audits (COS-15.5); incentivizing low- and zero- emission vehicles and equipment (COS-16.3); and exploring the development of alternative fuel sources (COS-16.4).
SAN DIEGO COUNTY STRATEGIC ENERGY PLAN The Strategic Energy Plan provides high-level energy and sustainability objectives and goals in the areas of energy and water conservation and efficiency, sustainable design, energy supply, distributed generation, vehicular transportation, energy and sustainability education and outreach, energy consumer choice, recycling and landfill diversion, and GHG emissions reductions. The Strategic Energy Plan applies to County municipal operations only and is based on a three to five-year cycle with updated plans developed to address regulatory, technical, economic and societal changes. The latest Strategic Energy Plan was released in 2015 and covers priorities for 2015-2020.
1 - 279
1 - 280

Executive Summary Report Ascent Environmental
County of San Diego Planning & Development Services 12 Phase I Comprehensive Renewable Energy Plan
Table 2-1 shows the list of renewable energy systems at County facilities installed since 2009.
Table 2-1 List of Renewable Energy Systems at County Facilities Installed Since 2009 Facility City/Community Completed Nominal Output (kW) Annual Output (kWh)
Spring Valley Community Center Spring Valley 2009 10 15,000
Lakeside Community Center Lakeside 2010 45 67,500
Fallbrook Community Center Fallbrook 2010 25 37,500
Ramona Library Ramona 2011 50 75,000
Sheriff Crime Lab San Diego 2011 45 67,500
Wilderness Gardens Preserve Pala 2012 5 6,750
Sweetwater Regional Park Bonita 2012 185 277,500
Guajome Regional Park Oceanside 2013 100 150,000
Lincoln Acres Lincoln Acres 2013 30 45,000
COC Conference Center San Diego 2013 18 26,400
Alpine ZNE Library1 Alpine 2016 N/A N/A
Imperial Beach ZNE Library2 Imperial Beach 2016 N/A N/A
Older Systems (pre-2009) 285 427,500
SSub--TTotal 6661 9916,500
PPhotovoltaic System Power Purchase Agreement
East Mesa Detention Facility-Juvenile Detention San Diego 2011 1,000 1,500,00
TTOTAL SYSTEMS SERVING COUNTY FACILITIES 11,661 22,416,500
Hosting SDG&E PV System
COC Parking Structure A San Diego 2011 425 637,500
OOwned Solar Thermal Systems
COC Conference Center San Diego 2012 1,0503
Notes: kW = kilowatt, kWh = kilowatt-hour, PV = photovoltaic, ZNE = zero net energy, N/A = Not Available
1 In 2016 construction was completed on the new Alpine Library, the County’s first zero net energy building. As a zero net energy building, the total amount of energy used by the Alpine Library on an annual basis is roughly equal to the amount of renewable energy created on the site.
2 The Imperial Beach Library is currently under construction to be the next zero net energy County facility.
3 Amount reported is in therms.
Source: San Diego County (2009)
2.2.2 Non-County Owned Facilities
From fiscal years 2014 to 2016, there was an average of 6,555 PV permits issued each year in the unincorporated area of the County, with a 90 percent increase from 2014 to 2016. In 2015 the County Board of Supervisors approved ordinances amending County Building Code to promote photovoltaic, wind energy and electric vehicle charging systems and to streamline processing of small, residential, rooftop solar energy permits. The County has permitted more than 189 Mega Watts of renewable energy in the unincorporated area, saving approximately 133 Metric Tons of greenhouse gas emissions from entering the atmosphere
1 - 281
1 - 282

Executive Summary Report Ascent Environmental
County of San Diego Planning & Development Services 14 Phase I Comprehensive Renewable Energy Plan
� EEconomic Benefits. An entity could enjoy significant economic benefits due to the reduction in electricity consumption and a resource mix that drives down costs on electricity services. These savings could also lead to job creation in renewable energy for the region.
� Increased Choices. CCAs increases customer choice, by allowing the option to receive electricity from a CCA or an IOU.
� Centralized Energy Services. Through public-private partnerships, a CCA can leverage private capital and coordinate efforts of third-party programs for more centralized community energy services.
� Reduced GHGs. CCAs can substantially reduce GHGs associated with electricity consumption.
� Rate Stability. By increasing the amount of power obtained from long-term contracts or self-owned generation facilities, a CCA program may be able to lock-in electricity prices and provide improved stability to its customers.
DISADVANTAGES OF COMMUNITY CHOICE AGGREGATION Despite the number of advantages that a CCA program provides, there are also risks associated with CCA program development. Risks can be divided into the following three categories:
� Planning and Implementation Risks. Establishing a CCA requires a number of political, engineering, legal, and financial steps. A detailed implementation plan, which often requires technical consultants, also needs to be submitted and certified by the CPUC. Start-up costs could range between $1 to $3 million. Funds expended from these start-up costs are not always recoverable.
� Operational Risks. If CCA energy costs exceed that of IOU rates, customers may choose to opt out of the program. If this occurs, there is a risk that the CCA will have contracted more electricity than it can sell to residents, and will have to sell excess electricity to a third party at a loss. Furthermore, customer rates are subject to the prevailing market price of electricity, but if the CCA has locked in electricity prices, customers could end up paying higher rates than what the market dictates. Changes in rules and tariffs administered by the CPUC could also adversely affect rates.
� Regulatory Oversight Risks. In contrast to the high-degree of regulatory oversight that IOUs face, the CPUC has limited oversight of CCA programs. Rather than have rate increases determined at a CPUC proceeding, CCAs rely on a Board of Directors to make such decisions. Therefore, it is critical that the CCA Board be made up of knowledgeable professionals that will conduct CCA-related matters in an open and transparent way.
STATEWIDE USE Since its passing in 2002, a number of CCA programs have been proposed in the State, including programs in San Francisco (CleanPowerSF), the East Bay (Oakland, Berkeley, and Emeryville), and the San Joaquin Valley (San Joaquin Valley Power Authority). The first CCA program to operate in California, Marin Clean Energy (MCE), was formed in Marin County and began serving customers in May 2010. Sonoma County launched Sonoma Clean Power in 2014 and the City of Lancaster, through Lancaster Choice Energy (LCE), began offering service to select customers in May 2015, with broad public enrollment in late 2015.
REGIONAL USE Locally, the cities of San Diego, Encinitas, Del Mar, Solana Beach, and Carlsbad are considering the formation of a CCA to provide an alternative energy source than what is provided by SDG&E. For Del Mar, the option to join a CCA is an option outlined in its CAP, which was adopted by City Council in June 2016 (Del Mar 2016). Also, the City of San Diego CAP has a goal to achieve 100 percent renewable electricity by 2035
1 - 283
Ascent Environmental Executive Summary Report
County of San Diego Planning & Development Services Phase I Comprehensive Renewable Energy Plan 15
city-wide, with a commitment to complete a city-wide CCA Feasibility Study (City of San Diego 2014). The City is currently in the beginning stages of drafting a feasibility study. Solana Beach in April 2016 completed a technical report analyzing the feasibility of a CCA. The report concluded that a CCA could be feasible, but that additional research is needed if the City decides to pursue a CCA (Solana Beach 2016). Most recently, the CPUC approved SDG&E’s proposal to form an independent district to lobby or market against CCAs. Under State law, utilities are prohibited from lobbying against CCAs unless it forms an independent district that is funded by shareholders, not ratepayers. SDG&E is the first utility in the State to apply for approval from the CPUC (KPBS 2016).
Summaries of the most prominent CCAs currently operating in California are provided below. For a more extensive review of CCA examples, see Section 4.2.7 of the Empower Report.
Marin Clean Energy MCE offers its customers three different product offerings: Light Green, Deep Green, and Local Sol. Customers in the MCE service territory are automatically enrolled in Light Green, which provides customers with 50 percent renewable energy from sources such as solar, wind, bioenergy, geothermal, and small hydroelectric power facilities. In addition to the three product offerings, MCE also serves as a platform for several local energy programs that encourage the development of distributed energy resources, which are described below:
� NNet Energy Metering. Net energy metering (NEM) is a billing arrangement that provides credit to customers with solar PV systems for the full retail value of the electricity their system generates. Under NEM, the customer’s electric meter keeps track of how much electricity is consumed by the customer and how much excess electricity is generated and sent back to the utility grid. MCE pays its customers a $0.01/kWh premium over the retail rate paid by the local IOU, PG&E.
� Feed-in-Tariff. The Feed-in-Tariff (FIT) program is a wholesale renewable energy purchase program designed to provide competitive, predictable energy prices for local small-scale renewable energy developers over a 20-yr contract term. This standard agreement provides a high level of certainty with respect to the revenue stream generated by the project and eliminates the need for contract negotiations, keeping transaction costs low. MCE’s first FIT-supported project was at the San Rafael Airport in October 2012. This project created three new locally-based full-time employees, used materials manufactured in the area, and was financed locally.
� Energy Efficiency Programs. MCE manages energy efficiency programs for residential and commercial customers, integrating diverse program offerings under one umbrella. These programs are designed to maximize investments in a property, reducing energy use, water use, and GHGs. They also provide participants with a single point of contact from initial contact to project completion. Rebates and financing options are also available.
� Workforce Development Program. MCE’s workforce development program provides workers, including those in disadvantaged communities, with a broad spectrum of transferrable skills to work in a variety of “green” jobs. MCE also works with local experts to align, leverage, and influence existing training programs and markets in the MCE service territory.
Sonoma Clean Power Sonoma Clean Power (SCP) participants include the cities of Windsor, Cotati, Sebastopol, Santa Rosa, Sonoma, Cloverdale, Rohnert Park, Petaluma, and the unincorporated area of Sonoma County. As of December 2014, service is provided for 20,000 commercial customers and 200,000 residential customers, with an 89 percent retention rate.
SCP provides two product offerings to its customers: CleanStart and EverGreen. CleanStart is SCP’s default service and provides 33 percent renewable power from sources such as geothermal, solar, and wind. EverGreen is 100 percent local renewable energy initially comprised of geothermal power sourced from
1 - 284

Executive Summary Report Ascent Environmental
County of San Diego Planning & Development Services 16 Phase I Comprehensive Renewable Energy Plan
facilities in northeastern Sonoma County. By 2018, 23 percent of SCP’s resource portfolio will come from geothermal power. To help stimulate local energy projects and use, SCP offers NetGreen, which is a NEM program that is structured similarly to MCE’S NEM program. ProFIT is SCP’s feed-in tariff renewable energy purchasing program which sets the rules and price for SCP to purchase electricity from small-scale wholesale renewable electricity projects within SCP’s service territory. Similar to MCE’s feed-in tariff program, standard 10- or 20-year contracts are offered to keep costs low.
Lancaster Choice Energy LCE is the latest CCA program in California starting May 7, 2015. Phase one of the program roll-out encompassed more than 850 accounts including all municipal accounts as well as residents and businesses that have elected to enroll early in the program. Phase two began in November 2015 with small commercial accounts joining the program, with the remaining customers enrolling in Early Spring 2016. Lancaster’s City Council will oversee the program and be responsible for various elements of the program, including rate setting. Customers still receive their bills from SCE. Under LCE’s default program, Clear Choice offers customers 35 percent renewable energy and an on average 3 percent savings on their monthly bill. LCE’s Smart Choice rate plan offers customers the option of choosing a 100 percent renewable energy option. Currently, renewable energy generated is from wind sources, but LCE has plans to add solar and hydroelectric into their renewable energy mix (City of Lancaster 2016).
3.1.2 Direct Access
Through DA, eligible retail customers have the choice to purchase electric power directly from an independent electric service provider (ESP) rather than through an IOU exclusively. While similar to a CCA program, DA is different in that it is: (1) not available to residential customers; and (2) by law (i.e., SB 695) is capped to a set number of gigawatt-hour (GWh) ESPs from which an individual commercial or industrial customer can purchase its power. This limits the County’s ability to ensure that a DA program could deliver increased levels of renewable energy and energy efficiency, as well as reduced levels of GHGs. The County currently participates in a DA program, in which it contracts with a third party to provide electricity on the open market. The County’s contractor provides the cheapest electricity, which may not always include renewable energy. To date, DA has saved the County approximately $3 million, freeing up Department of General Service (DGS) funds for use in other energy-related projects.
REGULATORY BACKGROUND DA was first instituted as an option for retail electric service in 1998, as part of an electric industry restructuring program to bring retail competition to the California electricity market. However, in 2001 DA transactions were suspended due to the electricity crisis. Subsequently, in 2009, SB 695 was signed into law, reauthorizing the DA program. This allowed only individual retail non-residential end-use customers to acquire electric service from other providers in each electrical corporation’s (i.e., all providers) distribution service territory, up to a maximum allowable total kWh annual limit. This limit, or cap, is currently managed through a wait list process by the CPUC that is reset each calendar year. The CPUC also currently sets rates for DA (SDG&E 2016).
ADVANTAGES OF DIRECT ACCESS There are a number of advantages to a DA program, which include, but are not limited to the following:
� CCustomer Savings. Through a DA program, participating customers have an opportunity to save money by procuring electricity from an ESP instead of through a bundled IOU. Between 2009 and 2012, the County saved $3.7 million, or approximately 9 percent, average savings for County facilities over bundled service from SDG&E using DA electricity procurement.
1 - 285

Ascent Environmental Executive Summary Report
County of San Diego Planning & Development Services Phase I Comprehensive Renewable Energy Plan 17
� IIncreased Choice. DA programs offer participating customers more choices for their energy sources.
� Reduced GHGs. DA programs can reduce GHGs associated with electricity consumption by providing renewable energy options.
DISADVANTAGES OF DIRECT ACCESS While DA programs offer more choice and savings to customers, there are a number of downsides that are described below:
� Limited Customers. Currently DA is only available to nonresidential customers and due to current caps, the number of customers that can participate is limited.
� Small Portion of Electricity Consumption. Given current restrictions, DA accounts for a relatively small portion of electricity consumption. The capped load allowance only permits ESPs to serve approximately 13 percent of the total IOU load in California.
� Less Certain Focus on Renewables. Current restrictions provide little incentive to drive investment in renewable energy and energy efficiency.
3.1.3 Sustainable Energy Utility
An SEU is an independent and financially self-sufficient entity responsible for delivering energy efficiency, energy conservation, and customer-sited renewable energy to end users. SEUs target all sectors and fuels, including electricity, transportation, and heating. Through an SEU, energy users throughout a city or state can build a relationship with a single organization whose direct interest is to help residents and businesses use less energy and generate their own clean energy. As a nonprofit umbrella entity at a city, county, or state level, an SEU relies on a third-party management model, competitive contracting, and performance incentives to deliver sustainable energy services across all sectors and customer classes. As such, an SEU is publicly accountable and can be financially self-sufficient. It also has access to a range of potential funding sources and revenue streams, and can achieve energy savings without raising taxes or utility rates.
A typical SEU would capitalize a fund with relatively low-interest state or municipal bonds and use that capital to contract with private Energy Service Companies (ESCos) to conduct energy audits and perform building energy efficiency and renewable energy upgrades. Once the project is completed, the energy customer would share the savings resulting from lower energy costs with the SEU to repay the bond and to fund the SEU’s activities. Because it can aggregate a large amount of demand for ESCo services, the SEU can help lower costs further by standardizing offerings, negotiating bulk discounts, and otherwise streamlining the process of identifying and executing cost-effective energy efficiency and renewable energy upgrades
REGULATORY BACKGROUND The State of Delaware first adopted the SEU model along with bond financing structure in 2007 as an independent, non-profit organization to foster a sustainable energy future. Development of the SEU model began in 2006. In 2011, Delaware’s SEU issued the Energy Efficiency Bond Series. This financing created over $145 million in guaranteed dollar savings to enable a host of state buildings and higher education facilities.
ADVANTAGES OF SUSTAINABLE ENERGY UTILITY There are a number of advantages to an SEU program, which include, but are not limited to the following:
1 - 286

Executive Summary Report Ascent Environmental
County of San Diego Planning & Development Services 18 Phase I Comprehensive Renewable Energy Plan
� CCentral Coordination. An SEU provides a single point-of-contact for efficiency and self-generation in the same way that conventional utilities are the point of contact for energy supply.
� Comprehensive Programs. Programs target efficiency, conservation, and renewable energy across all fuels (e.g., electricity, heating, transportation) and customer classes (e.g., low-income, government, industrial, commercial, residential), regardless of utility service territory.
� Flexible Incentives. Sustainable energy services are not constrained by strict programmatic criteria that might exclude, or inadequately serve, certain customer groups.
� Financial Self-Sufficiency. A financing plan ensures long-term self-sufficiency by generating revenue through the supply of customer-sited sustainable energy services.
� Competitive Procurement. A governance system is based on competitive contracting of independent management services.
� Job Creation. An SEU can facilitate increased investments in energy efficiency and customer-sited renewable systems, which in turn, can help facilitate a more robust regional economy. The Delaware SEU created nearly 980 jobs in construction, project engineering, and building management.
� Economic Growth. The SEU model can continuously organize investments, creating significant potential for the model to meaningfully impact the regional energy economy. At the same time, an SEU keeps value in the local economy due to the employment of local contractors and its emphasis on local production of the equipment used to meet energy needs.
DISADVANTAGES OF SUSTAINABLE ENERGY UTILITY While there are a number of advantages to starting an SEU program, there are also some disadvantages to consider:
� Legislative Action Needed. Forming an SEU requires legislative action in order to implement, which can require a large amount of time, money, and resources to build political consensus and support.
� Few SEU Examples. Since few SEUs have been established since the Delaware SEU was created in 2007, there are not a lot of examples of SEUs to consider for BMPs.
� High Costs. Start-up and implementation costs to create an SEU program could be high and may not be recovered (Katz 2011).
STATEWIDE USE
Sonoma County Efficiency Financing Program The Sonoma County Water Agency partnered with the Foundation for Renewable Energy & Environment to develop the Sonoma County Efficiency Financing (SCEF) Program. The SCEF is a scaled-down model that does not require legislative action and under this program participating organizations contract with a private ESCo to complete energy and water conservation measures. Improvements can include street lighting, building lighting, system controls, water pumps, heating, ventilation and air condition (HVAC) systems; boilers, chillers, and others. The participating organizations receive substantial utility cost-savings, including a contractual guarantee sufficient to cover the full cost of all retrofit work. The program uses tax-exempt bonds to finance projects. For more details on financing a SCEF, see Section 4.4.3.5 of the Empower Report.
1 - 287

1 - 288

Executive Summary Report Ascent Environmental
County of San Diego Planning & Development Services 20 Phase I Comprehensive Renewable Energy Plan
only recently have programs begun offering residential financing again. For more information regarding the obstacles facing residential PACE financing, see Section 4.5.3.2 of the Empower Report.
PACE IN SAN DIEGO COUNTY There are several different PACE programs currently available to the County residents and businesses, which are determined by the County’s Finance and General Government Group. In 2013, The County Board of Supervisors approved the expansion of the County’s commercial PACE Program. CaliforniaFIRST, California Home Energy Renovation Opportunity (HERO), and Figtree’s OnDemand program all offer PACE financing for commercial properties in the County. In July 2014, HERO financing was extended to residential properties in the San Diego area. As of July 2014, the HERO program has funded 206 residential projects, worth $4.9 million, in cities within the County. The program continues to show signs of accelerating and has received over 1,200 loan applications from the area since inception.
Clean Energy San Diego is a coalition of business leaders, environmentalists, and San Diego citizens working with Ygrene Energy Fund to create a PACE district in San Diego. Ygrene is already operating in Chula Vista, with 50 projects worth $4.5 million completed or under construction in 2014. In January 2015, Ygrene announced that local governments can join its program in as little as 30 days, under a new arrangement with a local housing finance authority in Sacramento named Golden State. Ygrene is the only PACE lender in California offering 30-year solar loans to homeowners at this time. The loan carries an interest rate of 8.49 percent. Ygrene’s interest rate on a five-year loan is 5.99 percent while that on a 20-year loan is 8.25 percent.
3.2.2 Bonds
QUALIFIED ENERGY CONSERVATION BONDS A Qualified Energy Conservation Bond (QECB) is a bond that enables qualified state, tribal, and local government issuers to borrow money at attractive rates to fund energy conservation projects. QECBs are taxable bonds, which means investors must pay federal taxes on QECB interest they receive. Most QECBs are issued as direct subsidy bonds and are among the lowest-cost public financing tool because the U.S. Department of the Treasury subsidizes the issuer’s borrowing costs. The U.S. Congress authorized $3.2 billion of QECB issuance capacity, which has been allocated to jurisdictions based on population.
CLEAN RENEWABLE ENERGY BONDS Clean Renewable Energy Bonds (CREBs) are primarily used in the public sector to finance renewable energy projects. The bondholder receives federal tax credits in lieu of a portion of the traditional bond interest, resulting in lower effective interest rate for the borrower. The issuer remains responsible for repaying the principal on the bond. CREBs differ from traditional tax-exempt bonds in that the tax credits issued through CREBs are treated as taxable income for the bondholder. The tax credit may be taken each year the bondholder has a tax liability as long as the credit amount does not exceed the limits established by the federal Energy Policy Act of 2005.
Through allocations by the Energy Improvement and Extension Act of 2008 and the American Recovery and Reinvestment Act of 2009, $2.4 billion are available for CREBs. With close to $1.4 billion in volume cap for new CREBs remaining, in February 2015, the IRS announced a March 5, 2015 opening of the rolling volume-cap application window for governments.
1 - 289
Ascent Environmental Executive Summary Report
County of San Diego Planning & Development Services Phase I Comprehensive Renewable Energy Plan 21
MUNICIPAL BONDS A municipal bond is issued by a local government or its agencies. There are two basic types of municipal bonds: General Obligation Bonds and Revenue Bonds. General obligation bonds often require voter assent and tend to have lower interest rates than revenue bonds. This is because the principal and interest are secured by the credit of the issuer and usually supported by the issuer’s taxing power. With revenue bonds, the principal and interest is secured by revenues derived from tolls, charges, or rents from the facility built with the proceeds of the bond issuance. Revenue bonds typically do not require electorate assent.
3.2.3 Peer-to-Peer Lending/Crowdfunding
Over the past ten years, Crowdfunding and peer-to-peer (P2P) lending organizations have emerged as financing mechanisms that offer easy, efficient, and low-cost sources for capital investments, loan repayment, and project funding. Crowdfunded projects use large groups of people pledging money to their cause to reach a monetary goal, without the promise of repayment. P2P lending is geared towards individuals seeking financing for investments, loans, and new businesses, with the promise that the lenders will get their money paid back to them in a timely manner.
Everybody Solar was created in Santa Cruz in 2011 to help nonprofits use solar energy to lower their operating costs. Everybody Solar is involved from the beginning stages of raising funds to the installation of the solar panels (through a partnership with a nonprofit solar installer). Everybody Solar, which uses a crowdfunding model, solicits donations online. While donations can come from anywhere, much of the fundraising outreach is focused in the communities where projects are proposed. Besides protecting the environment, Everybody Solar provides additional benefits. By lowering nonprofits operating expenses those organizations have more resources to put towards meeting their stated objectives (Mosaic 2012). In 2009, a renewable P2P lending company named Mosaic was launched in Oakland and has since become the third largest renewable specific lender in the world. Since its public launch in 2013, Mosaic has helped finance $7 million for 20 solar energy projects with a combined capacity of 18 MW. Mosaic gets investments from people or companies who want to finance solar energy projects, and give that money to the borrowers who want to construct a project. The typical payback period to investors is 10 years with a 5 percent return on investment.
1 - 290

1 - 291

1 - 292

1 - 293
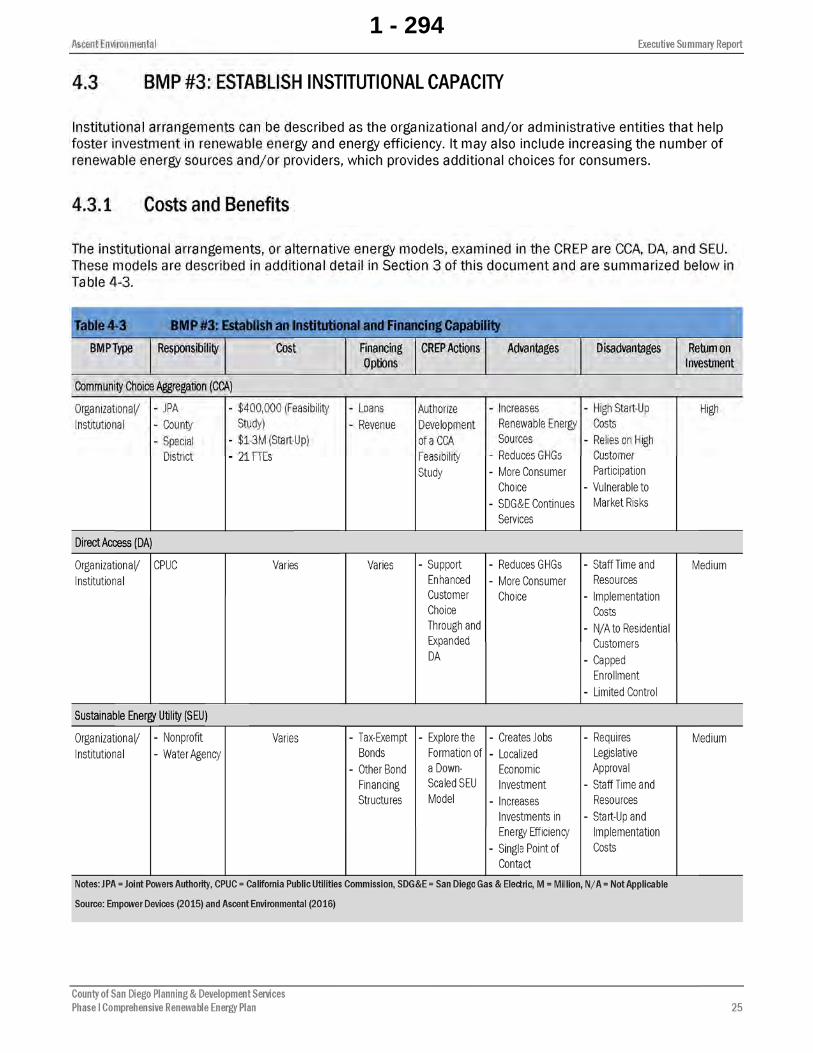
1 - 294

Executive Summary Report Ascent Environmental
County of San Diego Planning & Development Services 26 Phase I Comprehensive Renewable Energy Plan
4.3.2 County Actions and Recommendations
CCCA. As outlined in Section 3 of this summary and in Table 4-3 above, there are a number of environmental, economic, and administrative advantages to creating a CCA. Given the significant amount of investment, resources, and staffing needed to establish and operate a CCA, it is important that the County conduct a feasibility study before arriving at a decision. However, to avoid duplicated efforts and to ensure more unified results, the County should consider other CCA feasibility studies being prepared in the region before starting to draft their own. The City of Solana Beach recently completed a feasibility study in April 2016. Also, the City of San Diego is in the beginning stages of drafting a citywide CCA feasibility study. The County should coordinate and work with the City of San Diego on these efforts to determine ways to supplement information on a county-wide level.
This feasibility study should be clear in its objectives for the program, sources of funding, and economic viability. The study should also use SDG&E load data and renewable resource assessments to identify potential projects; assess the potential size of the program in terms of number of customers and electricity sales; develop a financial and cash-flow model; predict the overall return on investment; quantify the jobs created under various procurement scenarios; and outline how start-up costs would be financed. The plan could also determine staffing requirements and examine the risks associated with establishing a CCA and how those risks would be mitigated. Feasibility studies could cost about $400,000 to complete. If the feasibility study finds that a CCA program would be viable for the County, the benefits could very well outweigh the costs.
DA. Given current restrictions, DA accounts for a small percentage of the electricity consumed in the County (i.e., 3 percent) and the ability for customers to participate is limited. The County could consider lobbying both the CPUC and/or the State legislature to open up the DA beyond its current limits.
SEU. Although a CCA program could provide a similar energy integrator role and financing opportunities, the County may wish to further explore how an SEU model can help it attain its climate goals, particularly if the County does not pursue the formation of a CCA program. Because forming an SEU requires legislative action in order to implement, The County may wish to replicate a scaled-down version of an SEU (e.g., SCEF).
1 - 295

1 - 296

Executive Summary Report Ascent Environmental
County of San Diego Planning & Development Services 28 Phase I Comprehensive Renewable Energy Plan
BBonds. The County should investigate harnessing revenue bonds to help finance energy projects. In the context of renewable energy systems, revenue streams from the sale of electricity would be tied to the repayment of the bonds. In the context of energy efficiency, the bonds would be repaid via energy savings achieved through the project.
P2P and Crowdfunding. Given that P2P and Crowdfunding are relatively new, and most examples are focused on solar energy, successful models for all types of renewable energy are still uncertain. Continued research is needed to identify additional applications of Crowdfunding and P2P renewable energy projects to help determine County feasibility and its role in the process. In regards to P2P, the County could explore a public-private partnership with Mosaic, or a similar P2P lending entity, to establish a renewable and energy efficiency specific P2P lending program. Such a program could harness distributed capital throughout the region while also allowing residents to have a sense of ownership in the region’s energy investments. The County could also explore a partnership with Everybody Solar, to help crowdfund solar projects in the County.
1 - 297

1 - 298

1 - 299

1 - 300

1 - 301
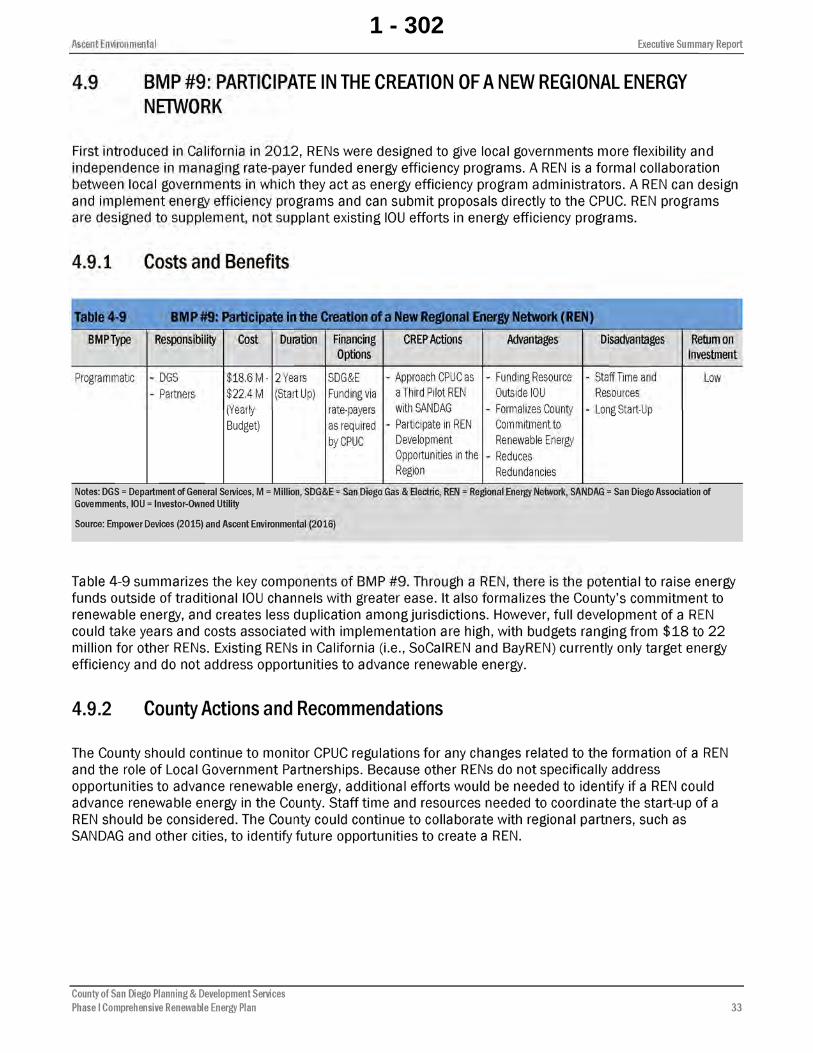
1 - 302
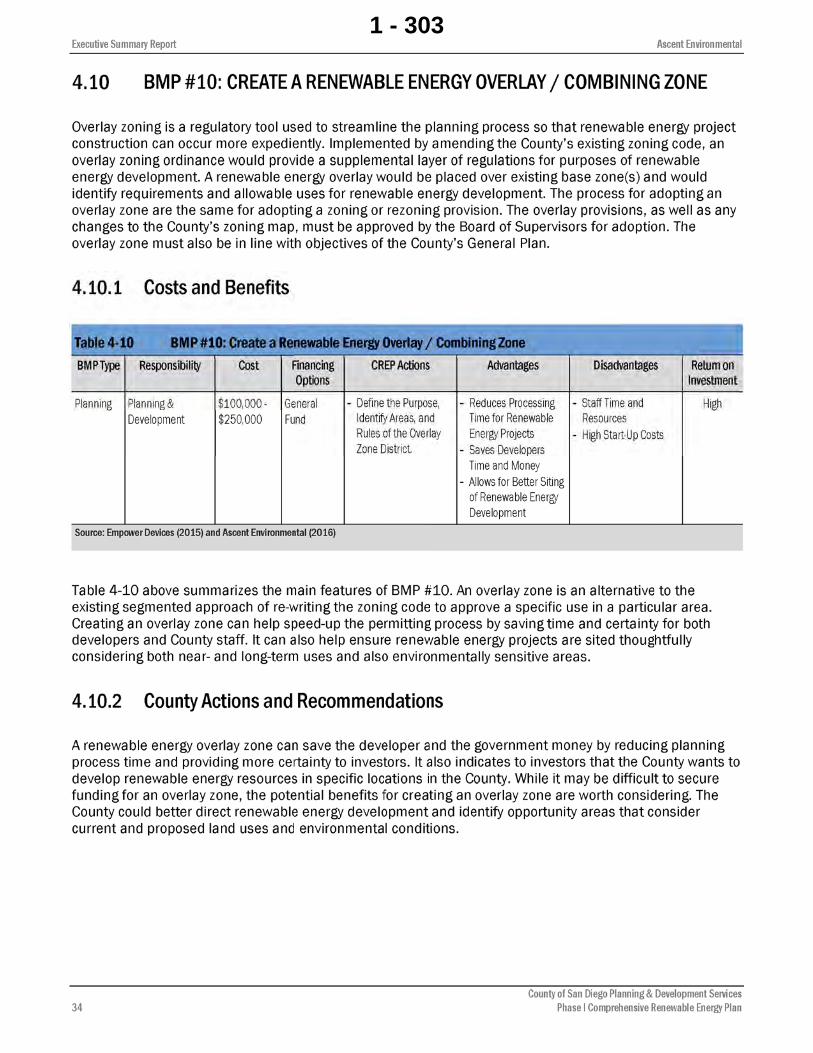
1 - 303

1 - 304
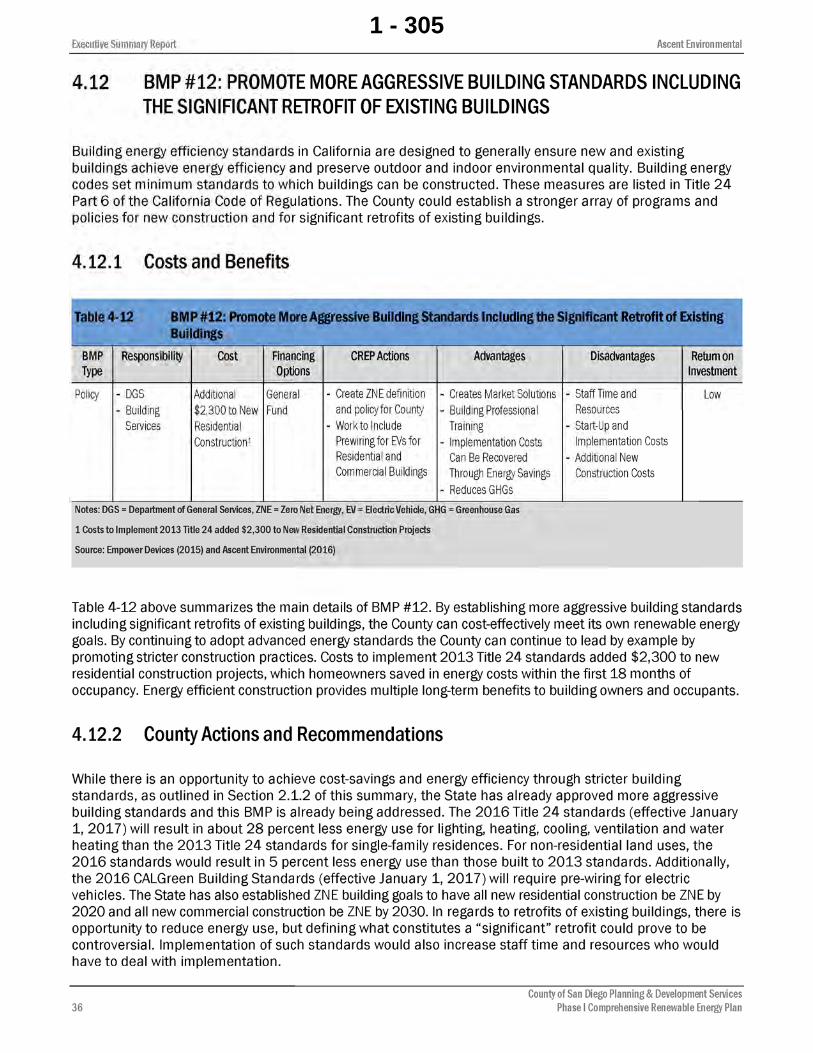
1 - 305

1 - 306

1 - 307
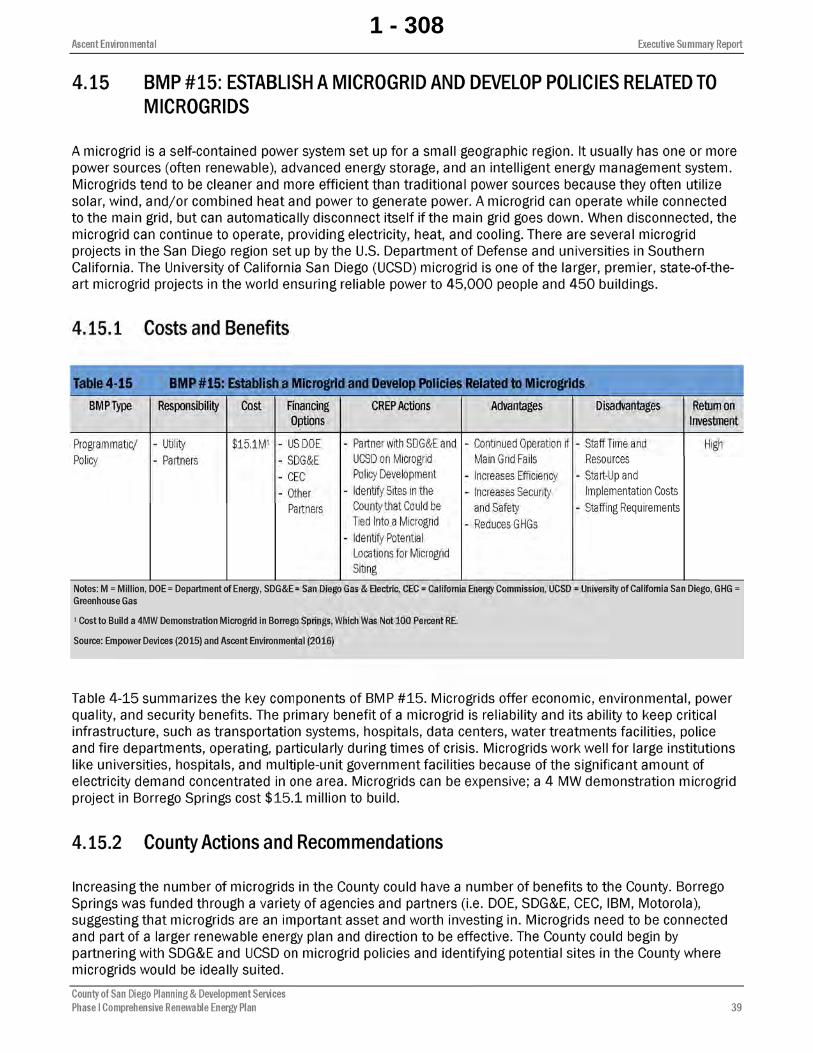
1 - 308

1 - 309

1 - 310

1 - 311

1 - 312

Executive Summary Report Ascent Environmental
County of San Diego Planning & Development Services 44 Phase I Comprehensive Renewable Energy Plan
Table 5-3 below summarizes the key economic impacts for each Innovation Scenario, in terms of annual average and cumulative costs and savings. The analysis weighs the costs of each Innovation Scenario, with the economic benefits that each scenario provides. Costs include policies or programs needed to implement each scenario, along with technological investments needed to increase energy efficiency and create more renewable energy options. Economic benefits include net energy savings and net job creation. Scenario I offers the highest benefit-cost ratio of 5.3, with minimal investment and program costs, for potential average energy savings of $53 million a year. Compared to the Reference Case, this activity supports an average annual gain of 600 jobs for the County. As the mix of renewable energy increases in the scenarios, so do costs associate with program development and technological investments. This does, however, translate to larger net energy savings (e.g., Scenario IV net energy savings is three times that of Scenario I) and more jobs created.
For more detailed analysis, including specific breakdown of economic impacts by 5-year increments, refer to Section 3.3.2.2 of the Empower Report.
Table 5-3 Annual Average and Cumulative Economic Impacts of Innovation Scenarios
Benefit-Cost Ratio
ANNUAL AVERAGE1 CUMULATIVE1 Program/Policy
Costs Technological Investments2
Energy Bill Savings3
Net Energy Savings4
Net Job Creation
Investments Energy Bill Savings
Scenario I 5.3 $2 M $17 M $71 M $53 M 600 $500 M $2,600 M
Scenario II 2.3 $5 M $45 M $120 M $99 M 1,000 $1,900 M $4,300 M
Scenario III 1.9 $9 M $84 M $167 M $137 M 1,500 $3,100 M $6,000 M
Scenario IV 1.9 $11 M $103 M $192 M $161 M 1,800 $3,700 M $6,900 M Notes: Numbers may not add up due to rounding. For more detailed analysis, see Empower Report. M = Millions 1 Annual and cumulative numbers are presented as 2012 dollars 2 Technological investments include investments that promote energy efficiency and renewable energy 3 Energy bill savings include savings from the industrial, residential, and commercial sectors 4 Net Energy savings subtract policy/program costs (1st column) with technological investments (2nd column). Source: Empower Devices (2015)
5.3.2 Environmental Benefits
In addition to economic benefits, reducing energy waste and converting to a larger mix of renewable energy sources, would have environmental benefits to consider as well. As shown in Table 5-4, implementation of each Innovation Scenario would result in reduced carbon dioxide (CO2) emissions.
Table 5-4 Environmental Benefits of Innovation Scenarios CO2 Emissions as Percent of 2050 Reference Case (%)
Scenario I 75
Scenario II 61
Scenario III 35
Scenario IV 19 Notes: Source: Empower Devices (2015)
The combination of renewable energy and energy efficiency technologies would equate to emissions reduction of 0.45 million metric tons of C02 by 2050, which is 75 percent of the Reference Case. Scenario IV, would reduce emissions by 1.34 million metric tons of C02 by 2050, which is 19 percent of the Reference Case. For additional environmental benefits for Scenario IV, see Table 3-5 of the Empower Report.
1 - 313

1 - 314
1 - 315

Ascent Environmental Executive Summary Report
County of San Diego Planning & Development Services Phase I Comprehensive Renewable Energy Plan 47
Kats, Greg. 2011 (October). Energy Efficiency Financing – Models and Strategies. Prepared by Capital E for the Energy Foundation. http://newbuildings.org/sites/default/files/EnergyEfficiencyFinancing_ModelsStrategies201110.pdf. Accessed September 2, 2016.
KPBS. 2016 (June). SDG&E Gets OK to Market on Alternative Energy Program. Available: http://www.kpbs.org/news/2016/jun/16/sdge-gets-ok-market-alternative-energy-program/. Accessed September 23, 2016.
Lancaster, City of. 2016. Community Choice Aggregation. Available; http://www.cityoflancasterca.org/residents/lancaster-choice-energy. Accessed August 23, 2016.
Mosaic. 2012 (December). Solar Crowdfunding in California: Part 2, Everybody Solar. Available: https://joinmosaic.com/blog/solar-crowdfunding-california-part-2-everybody-solar/. Accessed September 23, 2016.
San Diego, City of. 2014 (September). City of San Diego Climate Action Plan. Available: https://www.sandiego.gov/sites/default/files/legacy/mayor/pdf/2014/climateactionplan2014.pdf. Accessed August 20, 2016.
San Diego, County of. 2009. County of San Diego Strategic Energy Plan. Available: http://www.sandiegocounty.gov/reusable_components/images/dgs/Documents/Energy_StrategicEnergyPlan.pdf. Accessed August 20, 2016
San Diego Gas and Electric. 2016 (September). Direct Access FAQ. Available: http://www.sdge.com/customer-choice/electricity/direct-access-faq. Accessed September 22, 2016.
Solana Beach, City of. 2016 (April). City of Solana Beach: Community Choice Aggregation Technical Analysis. Available: http://solana-beach.hdso.net/docs/CAC/CAC-SB-CCA.pdf. Accessed September 20, 2016.
1 - 316
Attachment E – Technical Advisory Committee Approved Meeting Minutes for August 17, 2016, January 9, 2015, and October 2, 2014 and Draft
Meeting Minutes for September 21, 2016
1 - 317

Page 1 of 8
COMPREHENSIVE RENEWABLE ENERGY PLAN
TECHNICAL ADVISORY COMMITTEE APPROVED MEETING MINUTES
August 17, 2016, 8:00 AM 5520 Overland Avenue, Campus Center Chambers
San Diego, California
A. Call Meeting to Order at 8:10 AM
TAC members: Jason Anderson Craig Benedetto Peder Norby John Reaves Corinne Lytle Bonine
County of San Diego:
Stephanie Smith Darren Gretler Mary Kopaskie Joseph Farace Noah Alvey Laurel Lees Bulmaro Canseco Emma Schoppe Kelsie Holman
Members of the public:
Poonam Boparai Jeff Hoyos Anna Lowe Erika Morgan Donna Tisdale Jim Whalen
(TAC member Corinne Lytle Bonine attended via conference call. TAC members Richard Caputo, Ken Parks and Douglas Kot did not attend.) B. Business
1. The January 9, 2015 Technical Advisory Committee (TAC) Meeting Minutes were approved, with no members opposed.
C. Comprehensive Renewable Energy Plan Development
1. County staff provided an overview of the County’s sustainability initiatives, CREP background including the direction from the Board of Supervisors direction from September 2013, TAC history, CREP Draft Phase I Report, and next steps.
1 - 318

Page 2 of 8
2. County staff presented the sixteen recommendations included in the CREP Draft Phase I Report. TAC members asked questions on each measure and provided additional considerations (Agenda Item 4). TAC members provided the following inputThe following comments were provided by TAC members, but do not indicate consensus:
(1) Amend the General Plan by Adding an Energy Element o As a regional leader, the County should incorporate an Energy
Element into the General Plan. o The County should consider the unintended consequences of
adding a potentially duplicative or redundant Energy Element. o An Energy Element may be a low priority tool because it may
provide little benefit. o An alternative to an Energy Element is to incorporate and
consolidate the energy policies into the County’s Climate Action Plan (CAP) to ensure implementation.
(2) Establish a New Office of Sustainability o A sustainability office can be a community resource or a “one stop
shop” for the public to learn about sustainability information and programs; the County should provide a consolidated group of individuals with one point of contact for the public.
o The County should consider the financial implications of creating a new, separate office outside the County’s existing organizational framework.
o The sustainability office should be able to work across different County departments while allowing specialists to be efficient and effective in their fields.
o PDS staff would be best suited for implementing a sustainability group instead of an additional, separate bureaucratic process.
o The County should consider the City of San Diego’s new office of sustainability as a model.
(3) Establish Institutional Capacity (Community Choice Aggregation [CCA], Direct Access [DA], and Sustainability Energy Utility [SEU])
o The County should consider waiting for the City of San Diego’s CCA feasibility study before pursuing a separate County-funded study.
o The County should research existing CCAs and the success rates. o Support CCA but the County needs to proceed cautiously while the
uncertainty around local and regional CCAs grows. o CCAs may provide consumer confusion. o The structure and layout of a CCA is not well understood. o The County should consider the risks to the General Fund from
administering a CCA, and ways to mitigate the risk. o The County should partner with other jurisdictions on CCA
feasibility studies to minimize costs. o DA is a good tool to promote renewable energy; the County
currently participates in Direct Access for County facilities and operations, but it is not available for residential consumers.
o SEUs do not provide a significant return on investment. (4) Establish Financial Capacity (PACE, Bonds, Lending/Crowdfunding)
1 - 319

Page 3 of 8
o Supporting financial mechanisms is a high priority measure, which should be implemented right away.
o The Board of Supervisors has authorized PACE in the County, but the programs are run by private companies.
o The County does not have a PACE program that is run and funded by County departments.
o The County should research examples of crowdfunding efforts related to renewable energy.
o Information about existing financial mechanisms can be distributed by the new sustainability office/group.
(5) Develop a Solar Energy Workforce Development Initiative o Several other groups are already providing these resources; as
such, the County should not duplicate those efforts. o The County should focus on regional collaboration and leveraging
existing efforts instead of leading a renewable energy workforce training program.
o The new sustainability office/group could support existing non-governmental organizations that provide job trainings for local workers to construct renewable energy projects.
o Information about existing training opportunities can be distributed by the new sustainability office/group.
o The County should consider permit streamlining for projects that use local construction workers.
(6) Build an Energy Assurance Plan o This initiative recommends an “Energy Security Plan”, which is
something that SDG&E is responsible for, not the County. o Energy assurance is a security issue, and not a tool that promotes
renewable energy directly. o The County should avoid duplication of existing efforts.
(7) Increase the County’s Percentage of Energy Derived from Various Renewable Energy Technologies
o This measure is related to the County’s Strategic Energy Plan, and can be used to inform the CAP analysis.
o The County should be a regional leader by using renewable energy such as solar and wind at County facilities.
o The County should increase the percentage from 2.3% considering other agencies that may use a much higher percentage such as 33%.
o The energy efficiency in County facilities should meet the State’s net zero building requirements.
o The County should avoid duplicating efforts with the Center for Sustainable Energy.
(8) Establish a Renewable Energy Group Procurement Initiative o This measure is a good tool to promote renewable energy if
implemented in conjunction with other measures such as a CCA feasibility study, Regional Energy Network, County-led microgrid projects, and existing regional collaboration efforts.
o This stand-alone tool is not a high priority measure; implementation of CAP measures is a high priority.
(9) Participate in the Creation of a New Regional Energy Network (REN)
1 - 320

Page 4 of 8
o This measure is a long-term collaborative effort that merits continued attention.
o The County should continue working with regional partners to identify opportunities for a REN and funding for renewable energy projects and programs.
(10) Develop a Renewable Energy Overlay Zone o This measure may include a “pipelining provision” for existing
projects. o This is a high priority measure with a high return on investment,
which the County should pursue and incorporate into the CAP analysis as a high yield greenhouse gas reduction measure.
o Overlay zones help the County identify priority areas and streamline the permitting process of renewable energy projects, which will reduce costs.
o An overlay zone will help provide guidelines and framework for developers, which provides the community with predictable development scenarios.
o An overlay zone will help SDG&E locate equipment. o The County should identify environmental impacts during the
planning phase. o This measure will be highly controversial with some communities,
and will require extensive outreach and public input during the planning phase.
(11) Develop a Building Energy Disclosure Program o This information is not readily available for residents in apartment
complexes who do not control their energy sources; there is an unequal playing field.
o This measure should be implemented at the State level and not locally; the County should consider lobbying for the state to take a leadership role.
o This is a low priority measure, but may be more informed through the development of the CAP analysis.
(12) Promote More Aggressive Building Standards Including the Significant Retrofit of Existing Buildings o Consider the City of San Diego’s CAP as a model. o Take into consideration the added cost to new development when
implementing building restrictions that are more stringent than Title 24, particularly with the housing shortage in San Diego.
o Concentrate on cost savings efforts for existing buildings. o Renewable energy should be used to electrify the transportation
system and not as much for buildings; transportation-related measures yield higher return on investment than measures that address energy in buildings.
o Don’t pre-wire, but do require that conduits be installed to allow for EV charging and solar panels.
o This measure may disproportionately affect retail and commercial property owners.
1 - 321

Page 5 of 8
o The County should work with the PACE finance program to achieve the desired outcome.
(13) Increase Renewable Energy Education and Outreach o Several organizations are already providing education and
outreach. o The County should not duplicate education and outreach efforts;
instead the County should coordinate and partner with those organizations.
o The new sustainability office/group could “tell the story better” by doing better with what we have, and by being a point of contact for the public.
o It is difficult to quantify the return on investment for outreach activities – have similar efforts in Sonoma or Alameda been effective in promoting renewable energy?
(14) Starting a Community Solar Initiative o This measure should not be limited to solar; expand the initiative to
include wind power. o The County should consider the rate structure compared to the
investor-owned utility. o The County should research and be aware of the legislation, which
dictates what utilities and agencies can or cannot do. (15) Establish a Microgrid and Develop Policies Related to Microgrids
o Microgrids are an expensive frontier. o The County should partner with UCSD to explore successes and
lessons learned. o The County should consider limiting their role to removing
obstacles, and not being directly involved with the development of microgrids.
o Not all microgrids are solar/renewable; there are also natural gas microgrids.
o The County should research if the microgrids would be connected to an overall system, or if they can be a tool for onsite generation.
o This measure may supplement the County’s hazard mitigation plan or other regional energy assurance plans.
o The County should consider this measure for County facilities. (16) Establish Electric Vehicle Programs
o This measure should be refined to include EV Charging Infrastructure Programs that include charging stations that are powered by renewable energy.
o This is a high priority recommendation, as it offsets greenhouse gas emissions significantly; this measure should inform the CAP analysis.
o The County is a car-centric region without mass transit to help reduce vehicle miles traveled and greenhouse gas emissions.
o The County should consider the higher yield of electrifying the transportation system versus energy efficiency in buildings.
o The County should consider prioritizing car share parking, and provide flexibility in meeting the parking standards (i.e., instead of requiring parking, replace some spaces with EV charging stations.)
1 - 322

Page 6 of 8
o The County should consider requiring homes to be pre-wired to accommodate EV charging stations.
o The County should identify which actions are duplicative with other efforts, and collaborate with regional partners to leverage existing resources.
o This measure is an opportunity to position the County to obtain additional grant funding, which will provide a greater yield for the economy.
o The County should consider the unintended consequences associated with property owner concerns.
3. The TAC members were asked to consider the sixteen measures provided in the CREP Draft Phase I Report, including a seventeeth measure added during Agenda Item C2 (see Agenda Item C4). The TAC was asked to identify those measures that are most effective in promoting renewable energy in the county. The TAC members were provided with five sticky dots they could use to identify the priority measures. Each member was restricted to providing up to two dots per measure.
� The TAC members identified the following seven measures as high priority for consideration (2 dots or more):
(10) Renewable Energy Overlay Zone (17) Added Item: Legislative Outreach (see Agenda Item C4) (7) Increase County’s Renewable Energy Use (4) Financial Capacity - PACE, Bonds, Lending, Crowdfunding (2) Establish a New Office of Sustainability (9) Regional Energy Network (16) EV and Charging Programs
� The TAC members identified the following three measures as a medium priority for consideration (1 dot):
(3) Institutional Capacity - CCA, DA, SEU (12) Aggressive Building Standards and Retrofits (14) Community Solar Initiative
� No dots were provided on the other seven measures.
4. During Agenda Item C2, TAC members provided the following additional considerations:
� Add “Legislative Outreach” as a seventeenth measure, primarily focused on Renewable Energy and EV education, funding, net metering and priority programs related to these initiatives.
� The “Legislative Outreach” measure should include a strategy of informing the OSIA to encourage legislation that promotes renewable energy programs, projects and funding.
� Prioritization of renewable energy should focus on residential and non-residential rooftops, parking lots, and disturbed lands.
1 - 323

Page 7 of 8
D. Public Comment The public provided the following comments:
� Some communities will oppose overlay zones � There is concern with water use of large scale wind and solar projects � There is concern with environmental justice and the disproportional impact
on low income communities � The County needs to understand the financial risks associated with CCA
as it relates to the County’s General Fund � The County can work with independent non-profits to administer a CCA,
which would mitigate for potential financial impacts to the General Fund � The County should prepare a CCA Feasibility Study � The San Diego Energy District supports a CCA � The County should pursue a CCA with caution � EVs are more important in the County than the City of San Diego as the
County is car-centric with no mass transit � The County should be a regional leader and consider the electricity
systems of the future such as CCAs and Microgrids � Keep CREP as a separate plan from the CAP, but renewable energy
measures should inform the CAP � Renewable energy measures are also resiliency tools � Consider microgrids as not only a tool to promote renewable energy, but
as a hazard mitigation measure within the Hazard Mitigation Plan and a climate change resiliency measure in CAP
� A sustainability office can be effective; the City of San Diego has benefitted from this initiative and it has opened the door for additional funding
� The sustainability office should be a consolidated team, group or person to coordinate sustainability-related activities that are implemented in various County departments, and can be a point of contact for the public
During Agenda Item C3, the public attendees participated in the same dot exercise as the TAC, but used different boards.
� The public attendees identified the following seven measures as high priority for consideration (2 dots or more):
(2) Establish a New Office of Sustainability (3) Institutional Capacity - CCA, DA, SEU (7) Increase County’s Renewable Energy Use (6) Build an Energy Assurance Plan (10) Renewable Energy Overlay Zone (13) Renewable Energy Education and Outreach (15) Establish a Microgrid and Microgrid Policies
� The public attendees identified the following three measures as a medium priority for consideration (1 dot):
(17) Added Item: Legislative Outreach (see Agenda Item C4) (4) Financial Capacity - PACE, Bonds, Lending, Crowdfunding (9) Regional Energy Network
� No dots were provided on the other seven measures.
1 - 324

Page 8 of 8
E. Meeting Adjourned at 10:25 AM
1 - 325

COMPREHENSIVE RENEWABLE ENERGY PLAN TECHNICAL ADVISORY COMMITTEE
MEETING MINUTES January 9, 2015, 1:00 PM
5510 Overland Avenue, Third Floor, Drake Conference Room San Diego, California
A. Call Meeting to Order
TAC members: Jason Anderson Craig Benedetto Corinne Lytle Bonine Douglas Kot Peder Norby Ken Parks John Reaves
County of San Diego (CSD):
Noah Alvey Joseph Farace Darren Gretler Andy Hamilton Stephanie Smith Andrew Spurgin Melanie Tylke Mark Wardlaw
Empower Devices (ED): Erin Malcolm Brandt George Burmeister Kat A. Donnelly Skip Laitner
Members of the public: Susan Freedman Anna Lowe Cesar Rios Ian Stewart Donna Tisdale Jim Whalen
(TAC member Richard Caputo attended via conference call.) B. Business
1. October 2, 2014 Technical Advisory Committee Meeting Minutes were approved, with no members opposed.
2. Technical Advisory Committee By-laws were approved, with no members opposed. 3. Rosenberg’s Rules of Order were approved, with no members opposed.
C. Comprehensive Renewable Energy Plan Development County staff provided an overview of direction from the Board of Supervisors
1. ED staff provided a summary of the October 2, 2014 TAC Meeting 2. ED staff presented the Economic Methodology. TAC members provided the following input:
Provide realistic but ambitious goals/targets Show the triple-bottom-line benefits on key, strategic topics Present technical information in layman’s terms Provide land use impacts of the CREP, including encumbering by generation and transmission Describe how the pace of investment impacts cost/benefit (for example on PV and fueling costs) Provide a business model approach to loading order of the scenarios Address demand response (cost of consumption aspect) Include information on the Governor’s goals appears that Scenarios 2 and 3 reflect Governor’s renewable energy goals - Scenario 1 may not be innovative Consider increase in electricity as future fuel source Summarize the CREP goal as an investment in energy efficiency and renewable energy to reduce operating costs and greenhouse gas emissions
1 - 326

3. ED staff presented on Opportunities for Increasing Renewable Energy and Energy Efficiency in San Diego County. TAC members provided the following input:
Address Community Choice Aggregation (CCA) and the percent of customers leaving investor owned utilities Discuss the reliability of CCA Provide the advantages and disadvantages of CCAs (Start-up costs, Financial risk to partners, Duplication of services, Rate stability/unequal benefits, Success rate, Funding source, Legislative barriers) Provide consistency in data sets for public presentation Consider Mark Jacobson study on California Energy Use and Renewables
4. ED staff presented on Best Practices Evaluation. TAC members provided the following input: Consider Regional Energy Networks as a possible funding opportunity Consider best practices from Center of Sustainable Energy, SANDAG, City of Chula Vista, and the City of San Diego Consider increasing costs of renewables Account for yearly increase in rate of return by San Diego Gas & Electric (SDG&E) Suggest a menu of options, illustrating a weighting/ranking of options to help reach the overall targets (i.e. initiatives) Consider technical and economic feasibility Consider start-up costs, capital intensities, longevity of resources Consider end-user costs if available Consider indirect benefits Give Board all the options to consider (with cost benefit presented to the customer). Concern about cost implications and reliability of renewables, consider price predictability for budget purposes Concern over using BAU (Business as usual) as a public facing term, consider using ‘current situation’, ‘current targets’, ‘status quo’ as alternatives.
5. County staff presented Summary and Next Steps
D. Public Comment The public provide comment on the following Items: C.3 Economic Development
A reduction of large scale renewables in the backcountry may not be the consensus of those residing in the County. The benefits of greenhouse gas reductions are not direct benefits of the CREP. The CREP should provide air modeling benefits and potential health impacts of implementing the CREP. The CREP should show the year 2030 as a mid-point to align with the Governor’s renewable energy goals. CREP should consider the greenhouse gas impacts from truck trips to renewable energy sites in the County Include the borrowing payback periods
C.4 Opportunities for Increasing Renewable Energy and Energy Efficiency in San Diego County Is 100% renewable energy attainable? What are the options besides CCAs and Direct Access?
C.5 Best Practices Evaluation Large scale renewable projects do not benefit communities where they are located Address the big picture to provide reason to support this county administered system Consider quality of life
1 - 327
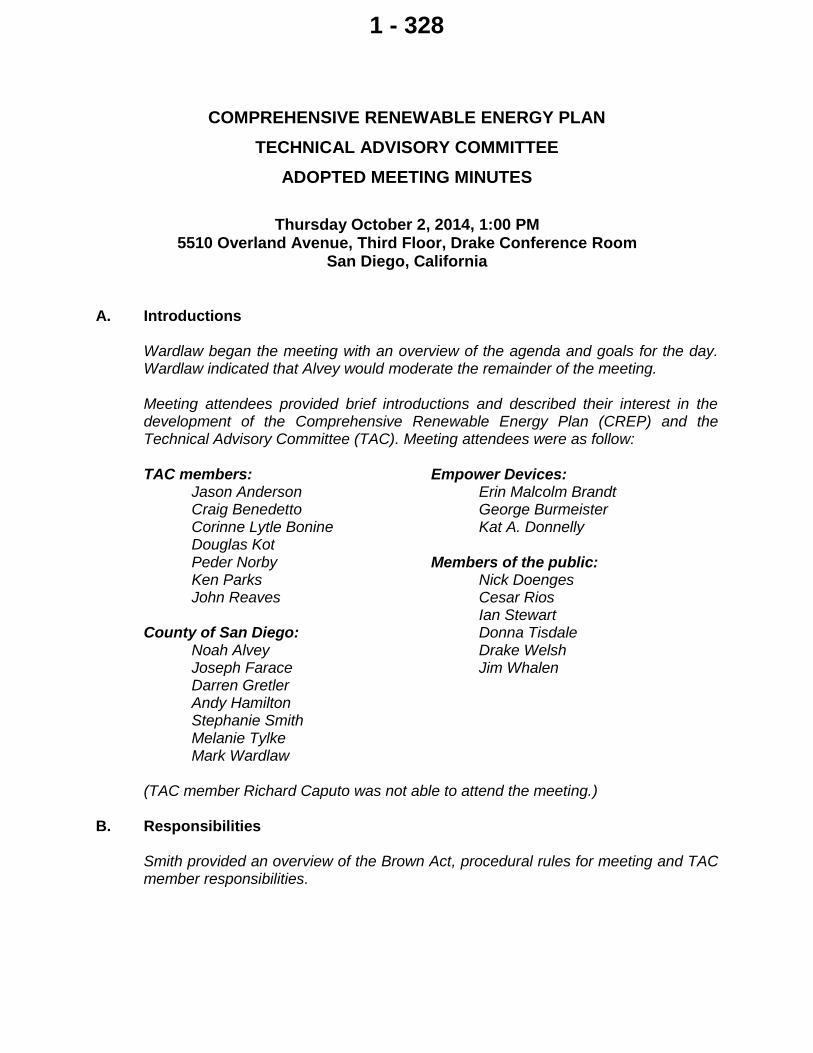
COMPREHENSIVE RENEWABLE ENERGY PLAN
TECHNICAL ADVISORY COMMITTEE ADOPTED MEETING MINUTES
Thursday October 2, 2014, 1:00 PM 5510 Overland Avenue, Third Floor, Drake Conference Room
San Diego, California
A. Introductions
Wardlaw began the meeting with an overview of the agenda and goals for the day. Wardlaw indicated that Alvey would moderate the remainder of the meeting. Meeting attendees provided brief introductions and described their interest in the development of the Comprehensive Renewable Energy Plan (CREP) and the Technical Advisory Committee (TAC). Meeting attendees were as follow: TAC members:
Jason Anderson Craig Benedetto Corinne Lytle Bonine Douglas Kot Peder Norby Ken Parks John Reaves
County of San Diego:
Noah Alvey Joseph Farace Darren Gretler Andy Hamilton Stephanie Smith Melanie Tylke Mark Wardlaw
Empower Devices: Erin Malcolm Brandt George Burmeister Kat A. Donnelly
Members of the public: Nick Doenges Cesar Rios Ian Stewart Donna Tisdale Drake Welsh Jim Whalen
(TAC member Richard Caputo was not able to attend the meeting.) B. Responsibilities
Smith provided an overview of the Brown Act, procedural rules for meeting and TAC member responsibilities.
1 - 328

C. Comprehensive Renewable Energy Plan
Alvey provided an overview of actions by the Board of Supervisors resulting in the creation of the TAC.
Brandt introduced the Empower team members, qualifications, and experience. Brandt then summarized the tasks associated with plan development including economics, best management practices, financial and regulatory analysis. Burmeister summarized the approach to research by discussing the methodology, multidisciplinary framing, and “Open Architecture” approach to plan development. Burmeister then reviewed the economic trends and potential scenarios, best practices evaluation criteria, and best practices sources.
Brandt requested that the TAC provide written input regarding the approach to research and distributed a survey. Alvey allocated time to complete the written survey. After the written surveys were gathered, Alvey requested verbal input from the TAC and other meeting attendees.
Present TAC members provided the following input:
� Establish an appropriate baseline � Include geothermal energy production options � Address energy production reliability � Evaluate stored energy alternatives � Consider SDG&E pre-existing contracts � Assess the impact of power purchase agreements � Evaluate utility scale energy and rooftop solar and identify an appropriate
balance, if feasible � Encourage implementing energy efficiencies rather than new infrastructure � Facilitate the streamlining of development of renewable energies in minimally
impacted areas � Create guiding documents for implementation � Address impacts to all of Southern California, not just San Diego � Pipeline renewable energy projects in process, so that they are not impacted
by the CREP � Create a plan that can be implemented and is legally feasible � Identify best practices from other Counties � Coordinate with adjacent Counties � Identify locations where renewable energy will work the best � Recognize the California Public Utility Commission’s regulatory authority � Consider opportunities for Natural Gas � Property Assessed Clean Energy (PACE) should be analyzed � Identify opportunities for renewable energy sources/generation within the
public right-of-way � Address grid isolation and production
1 - 329

� Reliability and resiliency will be essential for success � Evaluate cultural and natural impacts � Consider all stakeholders from the small scale residential consumers to larger
commercial and industrial consumers � Address financial impacts to the business community � Promote sustainability from a green economy standpoint � Evaluate and address Community Choice Aggregation � Promote strategic guidelines and policy initiatives
Additional input from meeting attendees:
� Consider wildlife and wildlife monitoring tools in relation to implementing renewable energy projects
� Work with wildlife agencies to streamline the review process � Evaluate the impacts of renewable energy sources over time � Consider strategies to facilitate low cost energy upgrades in low income
areas � Concerns regarding energy billing/usage disclosure on a commercial owner
and residential owner basis � Consider the recent Desert Renewable Energy Conservation Plan (DRECP) � Consider the costs of transmission (i.e. lines and other infrastructure aspects)
Evaluate water use for transmission lines and project impacts in groundwater dependent areas
� Understand where jobs are created and recognize local job creation � Address the life cycle costs of projects
D. Appoint Chair and Vice Chair
Alvey indicated that Norby had expressed interest in being the Chair for the committee. TAC members discussed Norby acting as the Chair for the committee. Benedetto volunteered to act as the Vice Chair. Norby was elected to the position of Chair and Benedetto was elected as Vice Chair by a unanimous vote of present TAC members.
E. Schedule Next Meeting
Alvey indicated that the next TAC meeting was tentatively scheduled for the beginning of December and indicated that a Doodle poll would be sent out in order to identify an acceptable date.
F. Public Comment
No public comment was received. Alvey thanked everyone for attending and the meeting was adjourned.
1 - 330

1 - 331
1 - 332

1 - 333

Attachment F – Valley Center Community Planning Group Preliminary Meeting Minutes for
September 12, 2016
1 - 334
Valley Center Community Planning Group Preliminary Minutes of the 12 September 2016 Meeting
Chair: Oliver Smith; Vice Chair: Ann Quinley; Secretary: Steve Hutchison 7:00 pm at the Valley Center Community Hall; 28246 Lilac Road, Valley Center CA 92082
A=Absent/Abstain BOS=Board of Supervisors PDS=Department of Planning & Development Services DPW=Department of Public Works DRB=Valley Center Design Review Board GP= County General Plan N=Nay P=Present PC=County Planning Commission R=Recused SC=Subcommittee TBD=To
Be Determined VCCPG=Valley Center Community Planning Group VC= Valley Center VCPRD=Valley Center Parks & Recreation District Y=Yea Forwarded to Members: 29 September 2016 Approved:
A Call to Order and Roll Call by Seat #: 7:02 PM 1 2 3 4 5 6 7 8 9 10 11 12 13 14 15
M I L L E R
O’ C O N N O R
J A N I S C H
H U T C H I S O N
B R I T S C H
P L O T N E R
Q U I N L E Y
F A J A R D O
B O U L O S
N O R W O O D
S M I T H
V I C K
S T I E D E M A N N
G A R R I T S O N
V A C A N T
P A P P A P P P P P A P P P Notes: O’Connor arrives 7.15 pm; Quinley presides in absence of Smith Quorum Established: 11 present
B Pledge of Allegiance C Approval of Minutes:
Motion: Move to approve the minutes of 8 August 2016 as corrected Maker/Second: Hutchison/Vick Carries: 11-0-0 (Y-N-A); Voice
D Public Communication/Open Forum: Hutchison asks for consideration of allowing him to approach the County Library regarding
storage of VCCPG records which are accumulating at his house.
Dave Ross, audience, reporting for the Valley Roadrunner, inquires if there are any candidates running in the November election who would like to participate in a series of planned VC candidate interviews to be published in the paper. Those interested can contact him at the paper’s offices.
E Action Items [VCCPG advisory vote may be taken on the following items]:
E1 Presentation on county Renewable Energy Plan by Emma Shoppe http://www.sandiegocounty.gov/content/dam/sdc/pds/advance/CREP/2016-08-17-crep-tac-presentation.pdf (Quinley)
Discussion: Quinley introduces Emma Shoppe, PDS, who presents the County’s comprehensive renewable energy plan with a handout. Her presentation is an update of the plan and an opportunity for feedback from local communities. The plan originated as a result of BOS direction with linkage to the countywide sustainability project. The BOS approved the work plan that aims at energy efficiencies, best management practices [BMPs], recommendations, etc. The work plan to date is a draft phase I report [April 2016]. Shoppe and her colleagues are working in conjunction with the Climate Action Plan [CAP] for 2017. Additional opportunities to participate in developing the renewable energy plan will occur through October. The BOS will consider BMP recommendations in December 2016. The handout presented is a BMP workbook. Shoppe offers a superficial overview of the workbook contents. More information on the renewable energy plan can be found at the website www.sandiegocounty.gov/pds/advance/CREP.html
Garritson asks about the cost of developing the plan. Shoppe says that phase I has cost about $300K. Janisch asks why only the unincorporated areas are included and she wonders if this kind of action is taken in incorporated areas as well. Shoppe affirms that the plan is being applied throughout the County. Will Rogers, audience, asks about the various kinds of renewable sources of energy. Shoppe says the different types of
1 - 335

renewable energy are not specifically called out in the plan. Glavinic asks about power storage options. He suggests creating potential energy by the storage of water or some other medium that can be elevated during the day with solar power and then released during the nighttime. Shoppe agrees that such a scheme could be an option. Janisch inquires whether this plan will necessitate changes to the County’s General Plan. Shoppe says one possible goal would be to add an energy element to the General Plan. She says the County has reached out to the public on how to revise the CAP so that it comports with the goals and requirements of the state. Rogers, audience, asks if there are centers for energy conservation that would fast track approval of projects if they comply? Yes, says Shoppe. Plotner asks if the County is considering reducing energy requirements through the use of roof gardens and landscaping techniques. Shoppe says the plan is not addressing the heat island effect of cities. However, Shoppe says that such considerations are possible above and beyond the scope of this plan. Janisch asks about small-scale wind projects and what qualifies as small scale. Shoppe says that is an aspect that will be considered in the next step of the plan. Garritson asks about additional costs of retrofitting older buildings and constructing new buildings under this plan. Quinley injects that energy cost reductions would offset increased building costs. Shoppe says an economic feasibility study is part of phase I, and it will address such costs. Hutchison asks about the impacts to the plan from large projects such as Lilac Hills Ranch [LHR], which will add considerable Vehicle Miles Traveled [VMT] that could be drastically reduced if such projects were more properly located in proximity to existing infrastructure and job centers. Shoppe says VMT is part of the calculus of the CAP and will fold into this plan. Vick challenges the purpose of the plan to provide options for energy savings and how projects like LHR will change the General Plan to avoid California Environmental Quality Act and Assembly Bill AB-32 Green House Gas requirements. Joe Farace, PDS, says other discretionary actions will be in place to address that kind of issue even if Measure B is adopted in November. Farace is not sure how the Measure B initiative will impact GHG and CAP. Janisch cites renewable energy item 8 in the workbook and a Silicon Valley project, and asks if we will emulate such projects or not? Shoppe demurs, saying it is only an example.
Motion: None, information only
E2 Valley Center Parks & Recreation District presentation on Star Valley Park made by Larry Glavinic, Vice Chair of the Board of VCPRD (Vick).
Discussion: Larry Glavinic presents. He indicates that he is here to create a great legacy. He notes that VC can still make useful progress. He wants to enlist VCCPG in creating public interest in parks and recreation. He is challenging the community to continue a great parks legacy for VC. He observes that VCPRD continues to lack funds for maintenance of existing facilities. He wants support to create new funding. VCPRD will offer Star Valley Park workshops in September and October. He notes that the Park Land Dedication Ordinance [PLDO] fund is one source of present funding, but it cannot be used for maintenance. VCPRD is able to generate income by renting facilities, such as the ball fields and community center. VCPRD has received about 500 surveys so far, but wants more [VC has a 20K population]. He observes that community-gathering space is insufficient, as are senior facilities and others. VCPRD is under-funded and has current budget shortfalls. The courts, fields, pool, buildings, and restrooms are not adequately maintained. Staffing is also inadequate. Facility supervision is inadequate. The park space for VC is below the state Quimby Act requirement. There are 42-acres today, but the present need is for 200-acres. He cites that VC is taxed less for parks than surrounding communities. VC is presently taxed $22 per year per parcel. The current facilities were largely built by volunteers, but VCPRD can’t maintain them with volunteers. He also notes that the available level land in the town center is diminishing.
Glavinic says according to surveys, people are willing to pay more [$30-$120 per year] for new facilities and are not satisfied with the present facilities. The new facilities desired are: playgrounds, picnic areas, and sports fields, an emergency evacuation center, fitness center, and a new community center. Glavinic contends that the Star Valley Park [SVP] proposal responds with an amenity list that conforms to desires expressed in surveys. Star Valley Park will be a phased build out. VCPRD is looking at an early 2017 assessment vote, 2018 ground breaking, followed by purchase of the remainder of the project site. Garritson asks about the cost of the mail-in balloting proposed. $6K says Glavinic. Glavinic describes the SVP site with a 3-D animation. Glavinic says improving what is presently owned will cost each parcel owner $20 to $40 per year. The rest of the procurement of the site will raise the cost to $120 per year. With a fitness center, the cost could rise to $175 per year. O’Connor asks about the provision of parking, especially for large events. Glavinic says parking for large
1 - 336

events can be accommodated on the playing fields, and there will be other less extensive permanent parking. Glavinic says expansion with SVP will allow for a larger VCPRD staff. Will Rogers injects that it would allow after school programs and will include a splash park as well. An audience member adds that a central location is needed for several activities. Vick asks about what parents presently do for kids’ activities. An audience member says they go outside of VC for many activities presently. Vick says we are pushing people away from VC because of lack of facilities. A small payment is worth having attractive facilities.
Norwood says now is the time to do this. Vick reminds we presently pay $22 per year per parcel. He summarizes the lack of facilities and the impacts. Garritson revisits his concerns about the cost of the project. O’Connor rejoins that we are not paying enough as a community for parks. He observes that governments provide safety, water, sewer, and parks, and we are not paying enough for parks. Garritson disagrees. He suggests private funding as an alternative. However, Glavinic warns that with private/public financing, the community would loose use of the park for half the year while private groups [soccer, baseball, etc.] commanded the space. A discussion of soccer fees that could support development of parks ensues.
Motion: None
E3 Presentation and discussion by Valley Center Parks and Recreation about planning for public parks located in private projects in Valley Center. (Norwood)
Discussion: Norwood introduces Vick who passes it off to Larry Glavinic, Vice Chairman, VCPRD. Glavinic leads a discussion of the parks in private developments. Large private developments either provide dedicated land or PLDO funds to satisfy the state/county requirement for parklands. However, PLDO funds don’t come to VCPRD if a developer builds a park or if the development has over 50 Equivalent Dwelling Units. Typical problems of such privately developed parks include lack of parking, restrooms etc., and pocket parks are insufficient for entire community’s needs. He says the current PLDO ordinance needs to be changed to benefit VCPRD better. He adds that the community needs flexibility of uses within parks.
Vick wants VCCPG to be aware of projects that propose public parks that won’t really benefit the public. He says the Park Circle public park was rejected by VCPRD for some of the reasons cited for privately developed parks. PLDO is for development not for maintenance of parks. The Park Circle park will mostly serve residents, not the public. Plotner asks about the PLDO contribution per house, how much comes back to the community. Glavinic says all that is collected is available to VCPRD. Garritson notes that PLDO is still only for capital improvement. O’Connor suggests Garritson write a letter to state Assemblywoman Marie Waldren to change state law governing PLDO funds.
Motion: None
E4 Discussion and mandatory vote on Chair's submitted VCCPG recommendations regarding the 7 alternatives presented by county staff for changing the Marijuana Collective Ordinances. (Quinley, O'Connor).
Discussion: Letter sent by Smith presented for ratification [appended below]. Motion by Vick to ratify. No comments or questions.
Motion: Move to ratify the letter sent by Smith regarding the Marijuana Collective Ordinances alternatives.
Maker/Second: Vick/miller Carries: 12-0-0 [Y-N-A]; Voice
E5 Discussion and possible vote on PDS 2016-STP-16-006-- Nelson Way, Phase II, located at 8530 Nelson Way and old HWY 395.Project is a cultivation facility serving an adjacent medical marijuana dispensary.
1 - 337

The Proposed structure is a 1 story made-of-wood framing and stucco. The project is ground up and has no grading required. Owner is T and M holdings at 609-802-23011. Applicant and contact person is Darren Machulsky at 609-462- 4234 or [email protected]. PDS project manager is Michelle Conners at 858-2636. (O'Connor).
Discussion: O’Connor presents. He observes that the applicant is not present. He advises that the applicant still desires a cultivation facility along with the dispensary, but the plans are on hold at the County offices. The County is attempting to clarify the requirements for such facilities, but likely won’t have definition until after a particular initiative is voted in November. There has been no contact with the DRB regarding the boundary fence for the neighbor. O’Connor says the neighbor is elderly and won’t feel safe with such a facility next door. He suggests that a chainlink fence would likely suffice. Quinley asks about recreational marijuana sales at this facility. O’Connor says that is uncertain but possible. Garritson says likely.
Motion: None
F Group Business F1 Resignation of Mark Jackson from seat number 15 of the Planning Group effective August 9, 2016;
Thanks to him for his service
Discussion: Quinley notes the resignation of Mark Jackson from the VCCPG 9 August 2016, creating a vacancy in seat 15. She observes that the community owes Jackson a debt of gratitude for his years of effort on behalf of the community. Jackson was chair of the Mobility SC and an engaged member of the VCCPG. He will be missed.
Miller comments on the South Village SC meetings. He announces he return of Tractor Supply and Park Circle at end of the year, possibly after the road 19 issues have been addressed.
Quinley announces the resubmittal of Lilac Plaza.
Motion: None
F2 Discussion and Vote on the Appointment of Jon Vick as Chair of the Mobility Subcommittee.
Discussion: Quinley nominates Vick to replace Jackson as chair of the Mobility SC.
Motion: Move to appoint Jon Vick to the vacant chair of the Mobility SC.
Maker/Second: Quinley/O’Connor Carries: 11-0-1 [Y-N-A]; Voice; Vick abstains out of modesty
F3 Next regular meeting scheduled for 10 October 2016
G Motion to Adjourn 8.37 pm
Maker/Second: Miller/ O’Connor Carries12-0-0 [Y-N-A]; Voice Subcommittees of the Valley Center Community Planning Group
a) Mobility – Mark Jackson, Chair b) Community Plan Update – Mark Jackson, Chair c) Nominations – Hans Britsch, Chair d) Northern Village – Ann Quinley, Chair e) Parks & Recreation –LaVonne Norwood, Chair f) Southern Village –Bill Miller, Chair g) Tribal Liaison – Claire Plotner, Chair h) Website – Jeana Boulos, Chair i) Lilac Hills Ranch – Steve Hutchison, Chair j) Solar – Oliver Smith, Chair
1 - 338

k) Ad Hoc Committee on Handbook Update and Member Training – Ann Quinley, Chair l) Lilac Plaza – Ann Quinley, Chair
Correspondence Received for the Meeting:
1) PDS2015-ERer-15-08-021; APN 1880250-19 Valley Center Rite Aid. First iteration review of Technical Studies which indicates changes that are required to the Plot Plan, compliance with Design Guidelines, Landscaping, Sewer, Access to the project, Traffic Impact Study, Preliminary Grading Plan, Stormwater Quality Management Plan, Among other issues. Chris Peto is project manager. (Quinley)
2) Discretionary permit for Rezone PDS2015-REZ-15-004. Lilac Plaza Development located at corner of Valley Center Road and Lilac Road. The project requests a general plan amendment to review for commercial buildings including parking area and appurtenant uses. The site is 7.0 acres. The Owner Applicant is Lilac Plaza LLC, P.O. Box 420130, San Diego, CA 92172 . Telephone is 619-279-2472 PL. The PDS Planner is Benjamin Mills at 858-495-5234 or Benjamin .Mills@sdcounty .ca.gov. (Quinley)
3) Gorial ABC Permit; PDS2015-ABC-16-007 renewal of an alcohol sales license (#533733) at an existing market located at 27455 Valley Center Road; Owner and applicant is Thaier Gorial, at 619-795-6632. The project manager is Don Kraft at 858-694-3856. (Miller)
4) Park Circle Major Use Permit. PDS 2015-TM-5603 located at Mirar de Valle and Valley Center Road. Owner is Konyn Reality Investment Company; developer is Touchstone Communities at 858-586-0414. Submittal contains Plot Plan, Trails and Recreation Plan, Landscape, Walls and Fence plan. The project area is 73.93 acres with 368 lots and 318 dwelling units. Minimum size of residential lots is 2,200 SF. (Miller)
Appended material for item E4: [next page]
1 - 339

TO: Joseph Farace September 1, 2016 Group Program Manager, Advance Planning County of San Diego Planning & Development Services
SUBJECT: Comments on amending the Zoning Ordinance section pertaining to Medical Marijuana Collective Facilities (MMCF).
Joseph, Thank you for the opportunity for the Valley Center Community Planning Group to review the proposed amendments the Zoning Ordinance section pertaining to Medical Marijuana Collective Facilities (MMCF). As the county input needs to be received by September 5, 2016 and the next VCCPG meeting is scheduled for September 12, 2016, this response was written by the Chair and will be validated at our next meeting. 1) Some of the options presented appear to be non-viable. For instance, it is our
understanding that changing the separation requirement from residential zoned to residential occupied reduced to number of available locations to near zero.
2) Is it common for a cultivation facility to be co-located with a dispensary/co-op like the one proposed at the VCCPG? Dispensaries had a very noticeable impact on the amount of loitering and traffic in an area like Santa Cruz/San Francisco. This was usually caused by dispensary rules about the number of people allowed in at one time, how far away someone had to wait (typically a few blocks), and the presence of a "bouncer" at the door. Before deciding on the exact buffer around a school/park/residence, it would be helpful to see how restrictive that would be on the number of parcels available for cultivation facilities.
3) Does the county offer any data regarding safety and crime around cultivation facilities without nearby dispensaries?
4) Limiting the number of facilities to the point where hot spots are created is also not desirable. Limiting the number per district and perhaps having a mile radius around each park/church/school/etc. creates hot spots upon which the entire county would descend. It may be preferable to see several spaced out small ones than a handful of large facilities, with more restrictive spacing between facilities.
5) What would requiring a MUP allow in the review process? Would it let the county and community groups take more site specific considerations into account before allowing the cultivation facility?
6) A city boundary offset does not appear to makes sense, especially if it's just 1000 ft, unless the goal is to eliminate cultivation facilities. If the ordinance is adopted, presumably there would be benefits (tax?) to the city housing the facility and few areas where they could be built. Placing a facility on the boundary would not make much difference over placing one 1000 ft away. However, the ordinance options to call out that the schools/parks/churches exclusion zone applies to schools/parks/churches in adjacent cities as well, so that seems restrictive enough.
Regards, Oliver Smith Chair, VCCPG cc: [email protected] [email protected] [email protected] [email protected] [email protected]
1 - 340
Attachment G – Sample of Boulevard and Jacumba Community Comment Letters Received
in September through October 2016
1 - 341

1 - 342

Attachment H - Campo Lake Morena Community Planning Group Meeting Agenda and Comment
Letter for September 26, 2016
1 - 343

County of San Diego Campo Lake Morena Planning Group
Mountain Empire Community Center, 976 Sheridan Road Campo, CA 91906
7 p.m., Monday, September 26, 2016 Final Agenda
The public is encouraged to attend and participate in the meetings of the Campo Lake Morena Planning Group, which is the county-sponsored link between the community and San Diego County dealing with planning and land use. Members of the public will be given the opportunity to speak regarding any item on the agenda. In addition, during public discussion, members of the community will be given the opportunity to address other matters pertaining to land use issues in our area. No action or vote may be taken on items not on the agenda. The final agenda will be posted 72 hours prior to the meeting and may be found at the Campo branch of the U.S. Post Office, the Campo branch of the San Diego County Library and the Lake Morena Market bulletin board. Preliminary agendas are published around mid-month in The Alpine Sun. 1. CALL TO ORDER 2. PLEDGE OF ALLEGIANCE 3. ROLL CALL: 1-Joe Carmody 4-Linda McCoy 7- Christine Sperrazzo Lepley 2- Lynn Correa 5-John Clarke 3-Billie Jo Jannen 6-Steve Biddle 4. APPROVAL OF MINUTES: July 6, 2016, July 25, 2016 5. PUBLIC DISCUSSION: At this time, the public is invited to speak on any item that does not appear on the agenda. Public speakers will be limited to 2 minutes. Action Items 6. NEW BUSINESS:
a. Review proposed letter for Comprehensive Renewable Energy Program report. The report proposes the creation of an energy development overlay, which would drastically change the general plan and community plans in Mountain Empire It also does not mention doing an full appraisal of the effects of the overlay on greenhouse gas emissions. Discussion and vote.
b. Review proposed letter of support for the Mountain Health and Community Services
Senior and Disabled transportation program. This is for the company’s annual grant application to SANDAG. Esther Matos will present. Discussion and vote
c. Captain Hank Turner of the SDC Sheriff’s Office will discuss the community’s requests
and comments about local deputies’ handling of resident calls, including, but not limited to, the Border Fire. Discussion and vote.
7. OLD BUSINESS:
1 - 344

a. Jenn Maldonado of Congressman Juan Vargas’ office will report on efforts to
work with the military to keep low-flying helicopters from presenting risk and noise to residents and public facilities. In addition, Vargas’s office is taking an interest in the community’s efforts to get San Diego City to allow Lake Morena water levels to rise before before further draining is done. Discussion and vote.
b. Brooke V. Emery of the California Department of Transportation has requested
time to provide the community with a brief update on the bridge repairs at Forrest Gate on Highway 94. Information only
c. Standing Subcommittee reports:
1. Groundwater, John Clarke. 2. Sewer and Septic, Joe Carmody 3. Community Economic Impacts, Steven Biddle 4. Traffic and Public Safety, Steven Biddle 8. CORRESPONDENCE AND ANNOUNCEMENTS
a. The Star Ranch vesting and landscape architecture maps have been updated and are available, both at meetings and by appointment with the CLMPG chairman. Staff has delayed release of the EIR until it can figure out what type of greenhouse gas analysis large projects should include. Guidance for developers was posted sometime in August. When asked, assigned planner Mark Slovick has been vague and uninformative about the status of the project, but says it is still in process.
b. Notice of September 9 meeting of the county Traffic Advisory Committee. No items of
interest to our area. Sent to group.
c. The Registrar of Voters says there will be no election for the planning group because the number of candidates is equal to the number of seats available. Rob Romero will be joining us in Seat 5 in January 2017.
d. From the August 20 chairman’s meeting/CAP visioning session: Several follow-up
emails containing information gathered during the session. One speaks directly to questions about including soil sequestration calculations in plan documents. They say they don’t know how to calculate this, meaning that the CAP and energy overlay will be done with no information about real impacts on greenhouse gases. Forwarded to group.
e. Notice of public workshops on California Environmental Screening. This state project
identifies communities that are impacted by poverty and other factors to determine where Cap and Trade economic benefits should be directed. Forwarded to group.
f. Notice of Transportation Grant Cycle for FYI: 2018: From the notice: “Caltrans will
offer approximately $2.8 million for the FTA 5304 portion of the grant that only MPOs and RTPAs can apply for. The remaining $5 million in State Highway Account funds will be
1 - 345

set aside for Cities, Counties, Transit Agencies, and Tribal Governments to apply for directly. The goals of the Sustainable Communities grant are to identify and address mobility deficiencies in the multimodal transportation system including the mobility needs of environmental justice and disadvantaged communities, encourage stakeholder collaboration, involve active public engagement, integrate Smart Mobility 2010 concepts, and ultimately result in programmed system improvements.” Forwarded to group.
g. Letter from Remnant Electric to the planning group enquiring about the status of the
Lake Morena cell tower application we heard in January. I called him back and reported that the project was approved, but the status is uncertain, according to the county planner. Hard copy only. Available on request.
h. Another chairman meeting is planned for Saturday, October 8, from 9 a.m. to 12 p.m.
Topics covered will include the County’s Park Lands Dedication Ordinance, Strategic Plan on Waste Reduction, and Comprehensive Renewable Energy Plan, among others. We look forward to sharing information and hearing your input on the first three items at the next meeting. Forwarded to group.
i. San Diego County Housing and Community Development Services is seeking grant
proposals for the County’s share of federal Community Development Block Grant funds. The CDBG program funds improvements to local youth and senior centers, parks, streets and sidewalks, drainage systems, and fire facilities in the unincorporated areas of the county. Residents and non-profits in the unincorporated area may propose projects that benefit low- and moderate-income persons and align with the County’s Consolidated Plan. The deadline to submit applications for CDBG funding is 5 p.m. Friday, October 28. Forwarded to group.
j. Jacumba Hot Springs is holding it’s annual Fall Festival and Swapmeet on Saturday,
October 1 at the Jacumba Hot Springs Park, 44635 Old Highway 80 . Events include food service all day, live music by Bill Moffett and the Ghost Riders, multiple raffle drawings and sales booth spots for only $10. Forwarded to group.
9. EXPENSES a. Please report any valid expenses for group approval. 10. UPDATES AND POTENTIAL ACTION ITEMS 11. REQUEST FOR AGENDA ITEMS FOR UPCOMING AGENDAS: All requests for placement of agenda items must be to the planning group chairman by the third Tuesday of each month.
Next regular meeting, October 24, 2016 at Mountain Empire Community Center. If you wish to appear on the agenda, please contact CLMPG Chairman Billie Jo Jannen, 28736 Highway 94, Unit 1, Campo, CA 91906, [email protected] or call 619-415-6298. Agendas are posted 72 hours prior to meeting.
1 - 346

From: Billie Jo Jannen, Chairman, Campo Lake Morena Community Planning Group
To: Emma Schoppe, Land Use/Environmental Planner, San Diego County Planning & Development Services
September 26, 2016
Re: Missing elements, initial draft of proposed San Diego County Comprehensive Renewable Energy Plan Report
Dear: Ms. Schoppe:
The Campo Lake Morena Community Planning Group has reviewed the initial draft of the proposed Comprehensive Renewable Energy Plan Report. The report has serious shortcomings in its treatment of greenhouse gas releases and fails to even acknowledge the disproportionate share of energy cost to the backcountry communities that would be sacrificed under the proposed overlay.
No project, especially high-impact industrial-scale renewable projects, should be approved without a complete cradle-to-grave review of greenhouse gas release. County staff assigned to both CREP and the proposed Climate Action Plan have eschewed any mention of the gases released from soil when vegetation is removed and soil is disturbed during construction.
Also ignored are the releases in manufacturing, transporting and building the facilities. The concrete and metal fabrication for a single project releases thousands of tons of GHGs. The Newhall Ranch decision states the expectation that development should consider the broader picture when assessing projects -- and the worldwide impact of renewable energy projects is very large. The fact that GHG is generated in China or Malaysia doesn't make it non-germane to California if California is mandating the use of those materials.
The overlay proposed in the report will most assuredly result in massive releases of greenhouse gas – whether in California or elsewhere -- yet it is suggested with no acknowledgement whatsoever of these releases.
According to research on sequestration in arid biomes, soil sequestration – and not surface vegetation -- is the greater part of greenhouse gas-holding capacity (please see attached references). Therefore, the permanent greenhouse gas release resulting from construction and continuing use on large project footprints needs to be accurately counted in order to honestly assess whether the public and private expense, as well as the local loss of scenic and property values, should be undertaken at all.
Both the CREP and the CAP ignore soil releases altogether and fail to provide would-be builders of large projects with any methodology for even estimating, let alone
1 - 347

calculating, the magnitude of GHG release for either the proposed energy overlay or project building standards.
You cannot mitigate what you have not quantified, so you cannot demonstrate that you have achieved the greenhouse gas savings required by state law.
Staff assigned to the CAP project has informed us that soil sequestration is too new a concept to allow it to be included in GHG calculations, so only surface vegetation is counted in the assessment tool provided by the state. We reject this reasoning. The fact that the ponderous state process has failed to provide a complete tool, is no reason for County staff to neglect consulting with the scientists who have been working for years on soil sequestration accounting (see references). Some of these researchers are located right here in San Diego County.
If retention of GHGs is substantial enough, natural sequestration may actually be a more economical route to achieve a solid reduction in atmospheric GHGs than sacrificing that capacity for the sake of hundreds or thousands of acres of expensive industrial-scale renewables. This information is well worth having and should be covered in detail in the CREP report, the CAP and in project EIRs.
Economic issues The economic analysis of impacts on the unincorporated area (section 3.3) ignores the cost of propane, the only gas energy available to rural communities, and doesn’t even mention indirect costs to local residents and ratepayers under the proposed overlay.
Contrary to the report writers’ assertion, the amount of propane used, as well as the cost to businesses and residents, would be very simple to glean from our two or three local propane suppliers. There is no reason not to include this substantial rural expense.
Furthermore, the indirect costs of energy from industrial-scale wind and solar is borne almost exclusively by the communities in which these facilities are built. Unlike the more compact installations for natural gas and nuclear generators, wind and solar generators require vast tracts of land. They are visible for great distances, and in the case of wind turbines, are also audible over great distances. This affects home values, quality of life, and as demonstrated by the Manzanita health study, can cause increased health care costs for local families and their insurance providers.
None of these factors are considered in the economic analysis, but certainly should be, given the potential for high financial penalties to local residents. In fact, we would recommend that no overlay be approved without a thorough review of the economic impacts to the communities located under it.
These impacts force a disproportionate share of the region’s skyrocketing energy costs on a population that is already known for housing generally lower-income residents than the communities that would be “benefiting” from the energy output. Under no circumstances should these costs be ignored in the County’s energy math.
1 - 348

The report never even mentions transmission losses, which can be substantial – as much as 40 percent – and could render pointless the vast amounts of money, greenhouse gas releases, and relentless rate increases associated with industrial-scale renewables. When generation is located miles from the majority of end users, it adds millions to the cost of providing electricity. Placing an energy overlay on distant sites guarantees that this waste will continue and increase, when we should be decreasing energy waste.
The report should offer better analysis on local generation in areas where it will minimize both transmission losses and destruction of sequestration in currently undisturbed areas. The capacity for small-scale solar and wind generation in cities and suburban sites hasn’t even begun to be tapped. This has been largely ignored in favor of preserving a business model of energy generation and distribution that hasn’t changed since it was established in the late 1800s.
These protectionist practices do the taxpayer and ratepayer a terrible disservice. Very few businesses receive this kind of protection and promotion from government at all levels. Most businesses that cling to outdated business practices eventually go out of business in the natural course of events. It is time for power companies to adapt to modern needs and for municipalities to stop enabling their obsolete business model.
Placement of this overlay does little beyond helping private companies to maintain a monopoly. Worse, it forces electricity users to support an outdated, expensive and illogical approach to electricity distribution.
San Diego County should be taking the lead in using modern approaches to funding and distributing electricity instead of perpetuating a wasteful model that is, more clearly every day, directly harming the millions of people the County is supposed to represent.
Sincerely,
Billie Jo Jannen (619) 415-6298
cc: Supervisor Dianne Jacob, San Diego County Board of Supervisors Chairman Michael Beck, San Diego County Planning Commission Project Manager Bulmaro Canseco, San Diego County Climate Action Plan
1 - 349

Supporting Information
Every industrial renewable project we have seen sports vast tracts of desertified soils that have lost their ability to hold carbon and nitrogen. Researchers have been reporting for over a decade on the long-misunderstood capacity of arid and semi-arid systems to hold on to nitrogen- and carbon-based gases. In fact, semi-arid soils can hold substantial carbon and nitrogen – often more than the surface vegetation. www.californiachaparral.com/images/Luo_et_al_Chaparral_as_carbon_sink_2007.pdfhttp://ag.arizona.edu/oals/ALN/aln49/lal.html#desertification
Soil microbes and vegetation substantially increase the amount of carbon that arid soil holds onto in response to increased amounts of carbon. http://phys.org/news/2014-04-arid-areas-absorb-unexpected-amounts.html
Unimpaired natural systems will not only hold the carbon they have, but will hold even more in future, making them an irreplaceable GHG-buffering resource. www.currentscience.ac.in/Volumes/106/10/1357.pdf
Once degraded, soil is unlikely to regain its ability to sequester GHGs. (http://onlinelibrary.wiley.com/doi/10.1111/gcb.12957/abstract)
Wind and water erosion on compacted and stripped off lands removes the finer particles needed for effective sequestration. http://citeseerx.ist.psu.edu/viewdoc/download;jsessionid=D4A41F4B3C9A972A5610DACD64AECA27?doi=10.1.1.493.3931&rep=rep1&type=pdf
Developments usually use rated (nameplate) capacity, rather than efficiency capacity, to describe their projects. However, projects will never produce to nameplate capacity. The public is given the impression that it's receiving (for example) 10 megawatts, when in reality, it's getting 3, and the other 7 are coming from a fossil fuel peaker plant: https://www.eia.gov/tools/faqs/faq.cfm?id=101&t=3www.eia.gov/totalenergy/data/annual/pdf/sec17.pdf
Explanation and calculations for transmission and distribution losses can be found on several websites. For example: http://electrical-engineering-portal.com/total-losses-in-power-distribution-and-transmission-lines-1https://www.eia.gov/tools/faqs/faq.cfm?id=105&t=3
The greenhouse gases and dirty pollutants released in mining, smelting, transport and casting the materials for turbines and solar panels measures in thousands of tons, while rare earths mining and processing is outright catastrophic: http://web.mit.edu/12.000/www/m2016/finalwebsite/problems/environment.htmlhttp://e360.yale.edu/feature/boom_in_mining_rare_earths_poses_mounting_toxic_risks/2614/
1 - 350
Related Documents


