R esearch T he Term Breech Trial was a large multicentre, inter- national randomized controlled trial that was con- ducted to determine whether planned cesarean was safer than planned vaginal birth for the delivery of the sin- gleton fetus in frank or complete breech presentation at term. The study involved 2088 women from 121 centres in 26 countries. Participants were randomly assigned to either planned cesarean or planned vaginal birth. Data were re- ceived for 2083 women. Of the 1041 women assigned to the planned cesarean group, 941 (90.4%) actually delivered by cesarean; of the 1042 women assigned to the planned vagi- nal birth group, 591 (56.7%) delivered vaginally. The study’s main findings were that the combined outcome of perinatal or neonatal death and serious neonatal morbidity, excluding lethal congenital anomalies, was significantly lower in the planned cesarean group than in the planned vaginal birth group (17/1039 [1.6%] v. 52/1039 [5.0%], relative risk [RR] 0.33, 95% confidence interval [CI] 0.19–0.56), and that there were no statistically significant differences between the groups in terms of maternal rates of death or serious maternal morbidity (41/1041 [3.9%] v. 33/1042 [3.2%], RR 1.24, 95% CI 0.79–1.95). 1 In this study we sought to determine whether a policy of planned cesarean section in the event of breech presentation is more or less expensive than a policy of planned vaginal birth. We report the estimated cost of each management strategy and discuss the economic and policy implications of our findings. Methods A detailed description of the Term Breech Trial and its find- ings can be found elsewhere. 1,2 In brief, the study involved women with a singleton live fetus in a frank or complete breech presentation at term. Women were excluded if there was evidence of fetopelvic disproportion, if the fetus was judged to be clinically large or to have an estimated fetal CMAJ • April 11, 2006 • 174(8) | Online-1 © 2006 CMA Media Inc. or its licensors DOI:10.1503/cmaj.050796 Roberto Palencia, Amiram Gafni, Mary E. Hannah, Susan Ross, Andrew R. Willan, Sheila Hewson, Darren McKay, Walter Hannah, Hilary Whyte, Kofi Amankwah, Mary Cheng, Patricia Guselle, Michael Helewa, Ellen D. Hodnett, Eileen K. Hutton, Rose Kung, Saroj Saigal for the Term Breech Trial Collaborative Group An abridged version of this article appeared in the Apr. 11, 2006, issue of CMAJ. The costs of planned cesarean versus planned vaginal birth in the Term Breech Trial Background: The Term Breech Trial compared the safety of planned cesarean and planned vaginal birth for breech pre- sentations at term. The combined outcome of perinatal or neonatal death and serious neonatal morbidity was found to be significantly lower among babies delivered by planned cesarean section. In this study we conducted a cost analysis of the 2 approaches to breech presentations at delivery. Methods: We used a third-party–payer (i.e., Ministry of Health) perspective. We included all costs for physician serv- ices and all hospital-related costs incurred by both the mother and the infant. We collected health care utilization and outcomes for all study participants during the trial. We used only the utilization data from countries with low na- tional rates of perinatal death (≤ 20/1000). Seven hospitals across Canada (4 teaching and 3 community centres) were selected for unit cost calculations. Results: The estimated mean cost of a planned cesarean was significantly lower than that of a planned vaginal birth ($7165 v. $8042 per mother and infant; mean difference –$877, 95% credible interval –$1286 to –$473). The estimated mean cost of a planned cesarean was lower than that of a planned vagi- nal birth for both women having a first birth ($7255 v. $8440) and women having had at least one prior birth ($7071 v. $7559). Although the treatment effect was largest in the sub- group of women having their first child, there was no statisti- cally significant interaction between treatment and parity since the 95% credible intervals for difference in treatment ef- fects between parity equalling zero and parity of one or greater all include zero. Interpretation: Planned cesarean section was found to be less costly than planned vaginal birth for the singleton fetus in a breech presentation at term in the Term Breech Trial. Abstract Cite this article as CMAJ 2006;174(8). DOI:10.1503/cmaj.050796

Welcome message from author
This document is posted to help you gain knowledge. Please leave a comment to let me know what you think about it! Share it to your friends and learn new things together.
Transcript

Research
The Term Breech Trial was a large multicentre, inter-national randomized controlled trial that was con-ducted to determine whether planned cesarean was
safer than planned vaginal birth for the delivery of the sin-gleton fetus in frank or complete breech presentation atterm. The study involved 2088 women from 121 centres in26 countries. Participants were randomly assigned to eitherplanned cesarean or planned vaginal birth. Data were re-ceived for 2083 women. Of the 1041 women assigned to theplanned cesarean group, 941 (90.4%) actually delivered bycesarean; of the 1042 women assigned to the planned vagi-nal birth group, 591 (56.7%) delivered vaginally. The study’smain findings were that the combined outcome of perinatalor neonatal death and serious neonatal morbidity, excludinglethal congenital anomalies, was significantly lower in theplanned cesarean group than in the planned vaginal birthgroup (17/1039 [1.6%] v. 52/1039 [5.0%], relative risk [RR]0.33, 95% confidence interval [CI] 0.19–0.56), and thatthere were no statistically significant differences betweenthe groups in terms of maternal rates of death or seriousmaternal morbidity (41/1041 [3.9%] v. 33/1042 [3.2%], RR1.24, 95% CI 0.79–1.95).1
In this study we sought to determine whether a policy ofplanned cesarean section in the event of breech presentationis more or less expensive than a policy of planned vaginalbirth. We report the estimated cost of each managementstrategy and discuss the economic and policy implications ofour findings.
Methods
A detailed description of the Term Breech Trial and its find-ings can be found elsewhere.1,2 In brief, the study involvedwomen with a singleton live fetus in a frank or completebreech presentation at term. Women were excluded if therewas evidence of fetopelvic disproportion, if the fetus wasjudged to be clinically large or to have an estimated fetal
CMAJ • April 11, 2006 • 174(8) | Online-1© 2006 CMA Media Inc. or its licensors
DO
I:10
.150
3/cm
aj.0
5079
6
Roberto Palencia, Amiram Gafni, Mary E. Hannah, Susan Ross, Andrew R. Willan, Sheila Hewson,Darren McKay, Walter Hannah, Hilary Whyte, Kofi Amankwah, Mary Cheng, Patricia Guselle,Michael Helewa, Ellen D. Hodnett, Eileen K. Hutton, Rose Kung, Saroj Saigal for the Term BreechTrial Collaborative Group
An abridged version of this article appeared in the Apr. 11, 2006, issue of CMAJ.
The costs of planned cesarean versus planned vaginal birthin the Term Breech Trial
Background: The Term Breech Trial compared the safety ofplanned cesarean and planned vaginal birth for breech pre-sentations at term. The combined outcome of perinatal orneonatal death and serious neonatal morbidity was found tobe significantly lower among babies delivered by plannedcesarean section. In this study we conducted a cost analysisof the 2 approaches to breech presentations at delivery.
Methods: We used a third-party–payer (i.e., Ministry ofHealth) perspective. We included all costs for physician serv-ices and all hospital-related costs incurred by both themother and the infant. We collected health care utilizationand outcomes for all study participants during the trial. Weused only the utilization data from countries with low na-tional rates of perinatal death (≤ 20/1000). Seven hospitalsacross Canada (4 teaching and 3 community centres) wereselected for unit cost calculations.
Results: The estimated mean cost of a planned cesarean wassignificantly lower than that of a planned vaginal birth ($7165v. $8042 per mother and infant; mean difference –$877, 95%credible interval –$1286 to –$473). The estimated mean costof a planned cesarean was lower than that of a planned vagi-nal birth for both women having a first birth ($7255 v. $8440)and women having had at least one prior birth ($7071 v.$7559). Although the treatment effect was largest in the sub-group of women having their first child, there was no statisti-cally significant interaction between treatment and paritysince the 95% credible intervals for difference in treatment ef-fects between parity equalling zero and parity of one orgreater all include zero.
Interpretation: Planned cesarean section was found to beless costly than planned vaginal birth for the singleton fetusin a breech presentation at term in the Term Breech Trial.
Abstract
Cite this article as CMAJ 2006;174(8). DOI:10.1503/cmaj.050796
weight of 4000 g or more, if there was hyperextension of thefetal head, if the clinician judged there to be a fetal anomalyor condition that might cause a mechanical problem at deliv-ery (such as hydrocephalus), or if there was a contraindica-tion to either labour or vaginal delivery (such as placenta pre-via). Women were also excluded if there was a known lethalfetal congenital anomaly.
The study (including the economic component) was ap-proved by the research ethics committees of all participatingcentres, and the women who participated gave informed con-sent before enrolling in the trial. For women assigned to theplanned cesarean group, a cesarean section was scheduled for38 weeks’ gestation or later. If the woman was in labour at thetime of randomization, the cesarean was undertaken as soonas possible. If the patient was assigned to the planned vaginalbirth group, management was expectant until spontaneouslabour began, unless an indication to induce labour or to un-dertake a cesarean developed. If fetal heart-rate abnormalitiesor lack of progress in labour occurred, a cesarean was under-taken; otherwise labour was allowed to progress and the babywas delivered vaginally. Vaginal breech deliveries were under-
taken by experienced clinicians, who were identified a prioriand who were defined as those who considered themselves tobe skilled and experienced at vaginal breech delivery, as con-firmed by their respective heads of departments.
The cost analysis was undertaken from the perspective of athird-party payer (e.g., Ministry of Health). Costing hospitalservices involved determining health care resource use andassociated unit costs. Health care resource use was collectedfor all women and infants who participated in the trial, butfor this analysis we used only the resources used by womenand infants recruited from countries with low (≤ 20/1000)national rates of perinatal death, as reported in 1996 by theWorld Health Organization.3 This was done to increase thelikelihood that the results would be applicable to the Cana-dian system. These countries are Australia, Canada, Chile,Denmark, Finland, Germany, Israel, Netherlands, NewZealand, Poland, Portugal, Romania, Switzerland, the UK,the United States and Yugoslavia.3
When planning the trial, it was anticipated that costs in-curred during hospital stays would depend on 2 principal fac-tors: lengths of stay of mothers and infants in the different loca-
CMAJ • April 11, 2006 • 174(8) | Online-2
Research
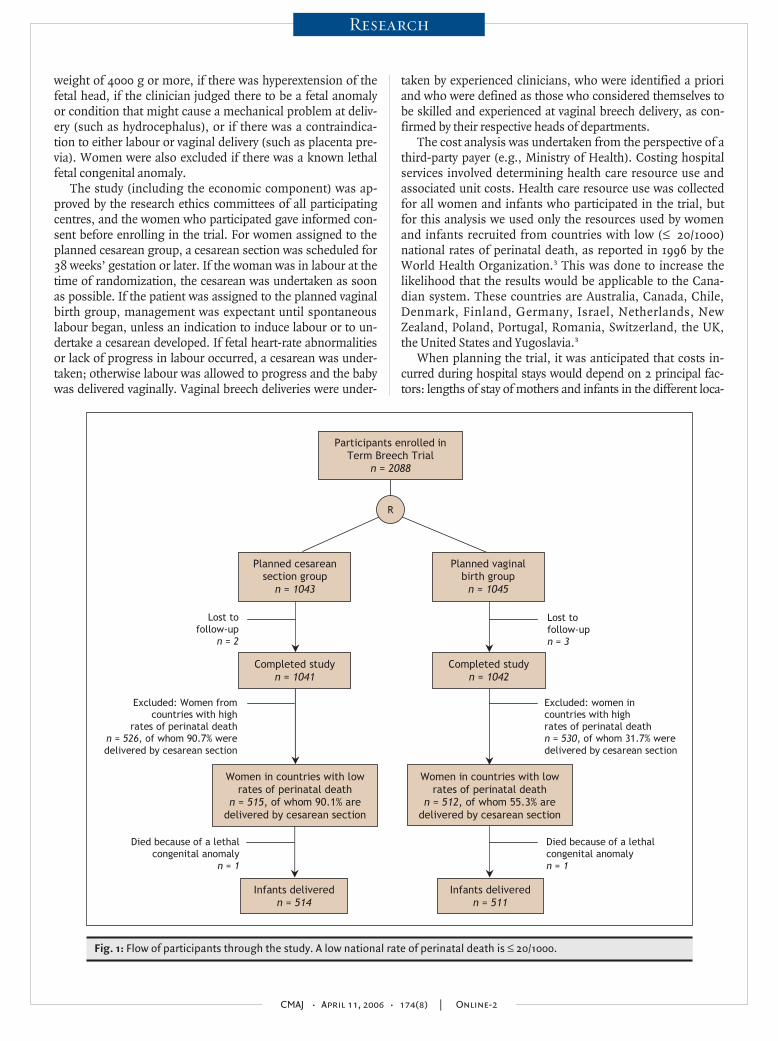
Fig. 1: Flow of participants through the study. A low national rate of perinatal death is ≤ 20/1000.
Participants enrolled inTerm Breech Trial
n = 2088
Planned cesarean section group
n = 1043
Planned vaginal birth group
n = 1045
Lost to follow-up
n = 2
Died because of a lethal congenital anomaly
n = 1
Excluded: Women fromcountries with high
rates of perinatal death n = 526, of whom 90.7% were delivered by cesarean section
Women in countries with low rates of perinatal death
n = 512, of whom 55.3% are delivered by cesarean section
Infants delivered n = 511
Lost to follow-up n = 3
Died because of a lethal congenital anomaly n = 1
Excluded: women in countries with high rates of perinatal death n = 530, of whom 31.7% were delivered by cesarean section
Completed study n = 1041
Completed study n = 1042
R
Women in countries with low rates of perinatal death
n = 515, of whom 90.1% are delivered by cesarean section
Infants delivered n = 514
tions within the hospital (i.e., representing different levels of in-tensity of care) and visits and procedures provided by physi-cians. Information on health care utilization up to 6 weeks post-partum was collected from the case report forms for all mothersand infants. The information included dates and times of ad-mission to hospital, admission to the labour and delivery ward,admission to the operating room and discharge from the oper-ating room as well as the date and time of birth. The date andtime of discharge from hospital was also collected for mothersand infants, along with the time that the infant spent in a neona-tal intermediate care unit or neonatal intensive care unit.
The length of stay in the antenatal ward was defined as thenumber of hours from admission to hospital or randomization— whichever was later — to admission to the labour and deliv-
ery ward or operating room — whichever was sooner. Thelength of stay in the labour and delivery ward for women hav-ing a vaginal birth was defined as the time from admission tothe labour and delivery ward or randomization — whicheverwas later — to the time of delivery, plus one extra hour to ac-count for the time for initial post-delivery recovery. For womenhaving a cesarean section, the length of stay in the labour anddelivery ward was defined as the time from admission to thelabour and delivery ward or randomization — whichever waslater — to the time of admission to the operating room, plusone extra hour to account for the time for initial post-cesareanrecovery. The length of stay in the operating room was definedas the time from admission to the operating room or random-ization — whichever was later — to the time of discharge from
CMAJ • April 11, 2006 • 174(8) | Online-3
Research
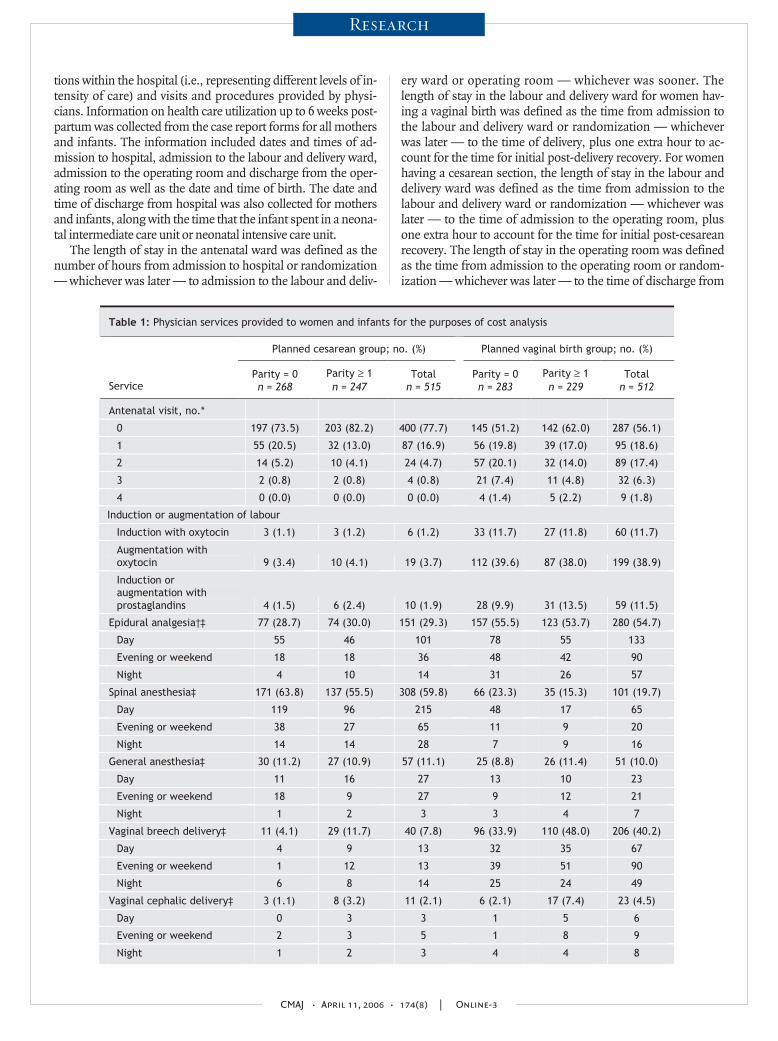
Table 1: Physician services provided to women and infants for the purposes of cost analysis
Planned cesarean group; no. (%) Planned vaginal birth group; no. (%)
Service Parity = 0 n = 268
Parity ≥ 1n = 247
Total n = 515
Parity = 0 n = 283
Parity ≥ 1n = 229
Total n = 512
Antenatal visit, no.*
0 197 (73.5) 203 (82.2) 400 (77.7) 145 (51.2) 142 (62.0) 287 (56.1)
1 55 (20.5) 32 (13.0) 87 (16.9) 56 (19.8) 39 (17.0) 95 (18.6)
2 14 (5.2) 10 (4.1) 24 (4.7) 57 (20.1) 32 (14.0) 89 (17.4)
3 2 (0.8) 2 (0.8) 4 (0.8) 21 (7.4) 11 (4.8) 32 (6.3)
4 0 (0.0) 0 (0.0) 0 (0.0) 4 (1.4) 5 (2.2) 9 (1.8)
Induction or augmentation of labour
Induction with oxytocin 3 (1.1) 3 (1.2) 6 (1.2) 33 (11.7) 27 (11.8) 60 (11.7)
Augmentation with oxytocin 9 (3.4) 10 (4.1) 19 (3.7) 112 (39.6) 87 (38.0) 199 (38.9)
Induction or augmentation with prostaglandins 4 (1.5) 6 (2.4) 10 (1.9) 28 (9.9) 31 (13.5) 59 (11.5)
Epidural analgesia†‡ 77 (28.7) 74 (30.0) 151 (29.3) 157 (55.5) 123 (53.7) 280 (54.7)
Day 55 46 101 78 55 133
Evening or weekend 18 18 36 48 42 90
Night 4 10 14 31 26 57
Spinal anesthesia‡ 171 (63.8) 137 (55.5) 308 (59.8) 66 (23.3) 35 (15.3) 101 (19.7)
Day 119 96 215 48 17 65
Evening or weekend 38 27 65 11 9 20
Night 14 14 28 7 9 16
General anesthesia‡ 30 (11.2) 27 (10.9) 57 (11.1) 25 (8.8) 26 (11.4) 51 (10.0)
Day 11 16 27 13 10 23
Evening or weekend 18 9 27 9 12 21
Night 1 2 3 3 4 7
Vaginal breech delivery‡ 11 (4.1) 29 (11.7) 40 (7.8) 96 (33.9) 110 (48.0) 206 (40.2)
Day 4 9 13 32 35 67
Evening or weekend 1 12 13 39 51 90
Night 6 8 14 25 24 49
Vaginal cephalic delivery‡ 3 (1.1) 8 (3.2) 11 (2.1) 6 (2.1) 17 (7.4) 23 (4.5)
Day 0 3 3 1 5 6
Evening or weekend 2 3 5 1 8 9
Night 1 2 3 4 4 8

the operating room. The length of time in the postpartum wardwas defined as starting at delivery for women having a vaginalbirth, or at discharge from the operating room for women hav-ing a cesarean section, to the time of discharge from the hospi-tal, minus one hour that was attributed to initial post-deliveryrecovery time spent in the labour and delivery ward.
Procedures and visits provided by physicians includedweekly antenatal visits; induction or augmentation of labouror both with oxytocin or prostaglandins or both; analgesia oranesthesia or both; attendance at vaginal delivery or at ce-sarean section; and the provision of care for neonates in anormal nursery, neonatal intermediate care unit or neonatalintensive care unit. We classified the deliveries as vaginalbreech, vaginal cephalic, prelabour cesarean or cesarean inlabour, and because of the fee structure they were also catego-
rized according to the time and day that they took place as fol-lows: deliveries during the day (i.e., Monday to Friday from0700 until 1700), deliveries during the evening or weekend(i.e., Saturday or Sunday from 0700 until 2400 or Monday toFriday from 1700 until 2400) and deliveries during the night(i.e., any day of the week between 0000 and 0700).
The provision of analgesia and anesthesia was categorizedaccording to the time and day when it was started and its dura-tion. The duration of anesthetic care for women having epiduralanesthesia was calculated from the time when it was started un-til the time of delivery if the delivery was vaginal, or until 30minutes after discharge from the operating room for cesareansections. The duration of anesthetic care for women having aspinal or a general anesthetic was calculated either from thetime when it was started (if recorded) or 15 minutes after admis-
CMAJ • April 11, 2006 • 174(8) | Online-4
Research
Table 1: continued
Planned cesarean group; no. (%) Planned vaginal birth group; no. (%)
Service Parity = 0 n = 268
Parity ≥ 1n = 247
Total n = 515
Parity = 0 n = 283
Parity ≥ 1n = 229
Total n = 512
Prelabour cesarean‡ 169 (63.1) 133 (53.9) 302 (58.6) 47 (16.6) 16 (7.0) 63 (12.3)
Day 132 105 237 39 11 50
Evening or weekend 32 25 57 6 5 11
Night 5 3 8 2 0 2
Cesarean in labour‡ 85 (31.7) 77 (31.2) 162 (31.5) 134 (47.4) 86 (37.6) 220 (43.0)
Day 26 37 63 51 36 87
Evening or weekend 44 25 69 57 30 87
Night 15 15 30 26 20 46
Normal newborn examination§ 248 (92.9)** 231 (93.5) 479 (93.2)** 241 (85.5)** 194 (84.7) 435 (85.1)**
Consultation for admission to neonatal intermediate or intensive care unit¶‡ 19 (7.1)** 15 (6.1) 34 (6.6)** 39 (13.8)** 34 (14.9) 73 (14.3)**
Day 8 9 17 12 15 27
Evening or weekend 6 4 10 17 15 32
Night 5 2 7 10 4 14
Care in neonatal intermediate care unit 18 (6.7)** 13 (5.3) 31 (6.0)** 35 (12.4)** 25 (10.9) 60 (11.7)**
≤ 1 d 5 3 8 14 10 24
> 1 d and ≤ 10 d 12 10 22 20 13 33
> 10 d 1 0 1 1 2 3
Care in neonatal intensive care unit 3 (1.1)** 5 (2.0) 8 (1.6)** 11 (3.9)** 13 (5.7) 24 (4.7)**
≤ 1 d 2 2 4 3 3 6
> 1 d and ≤ 10 d 1 3 4 8 9 17
> 10 d 0 0 0 0 1 1
*It was assumed that women would have 1 antenatal visit every 7 days after randomization and before admission to hospital. †Includes 2 women having combined epidural analgesia and spinal anesthesia (1 in each group). ‡Day fees were applied for procedures performed from 0700 until 1700, evening or weekend fees were applied for procedures performed from 1700 until 2400 on Mondays to Fridays and from 0700 until 2400 on Saturdays or Sundays, and night fees were applied for procedures performed from 0000 until 0700 on all days. §All liveborn newborns not needing admission to intermediate or intensive care received an initial normal newborn examination. ¶All newborns admitted to intermediate or intensive care were assumed to have received an initial consultation for intermediate or intensive care. **One baby with lethal anomalies was excluded.
sion into the operating room (if not recorded) until 30 minutesafter discharge from the operating room. We also assumed thatwhen more than one anesthetic was provided they were given
one at a time. However, for the few cases when both epiduraland spinal anesthesia were given to a woman having a vaginaldelivery, it was assumed that this was combined spinal–epidural
CMAJ • April 11, 2006 • 174(8) | Online-5
Research
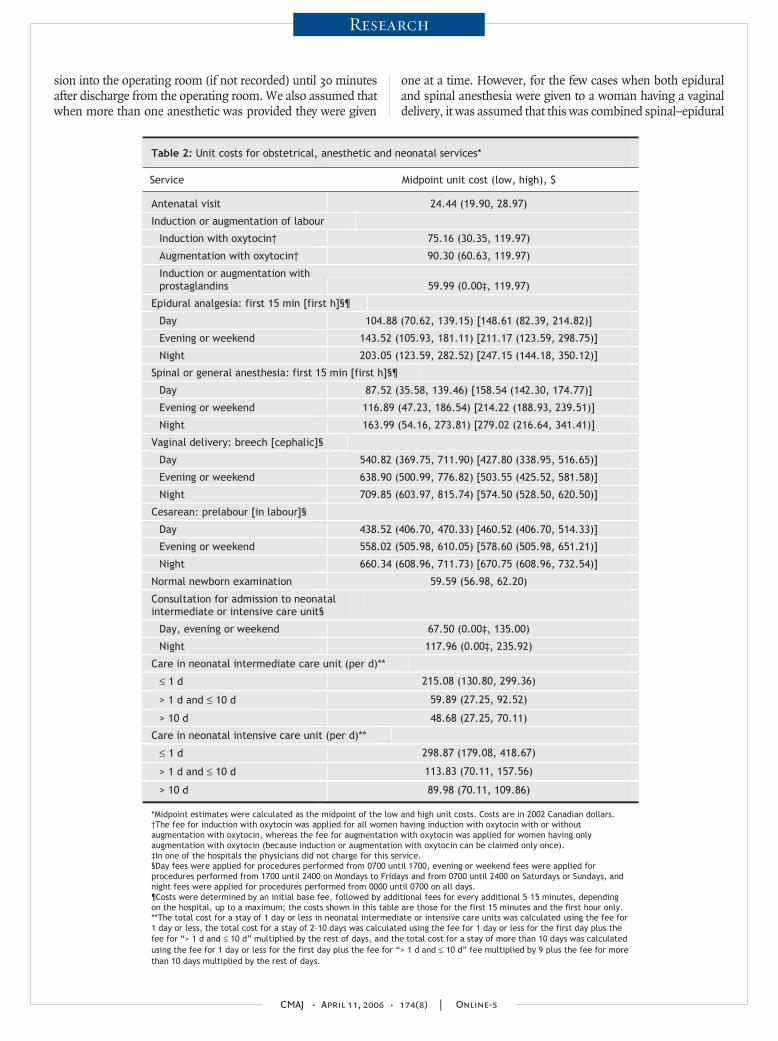
Table 2: Unit costs for obstetrical, anesthetic and neonatal services*
Service Midpoint unit cost (low, high), $
Antenatal visit 24.44 (19.90, 28.97)
Induction or augmentation of labour
Induction with oxytocin† 75.16 (30.35, 119.97)
Augmentation with oxytocin† 90.30 (60.63, 119.97)
Induction or augmentation with prostaglandins 59.99 (0.00‡, 119.97)
Epidural analgesia: first 15 min [first h]§¶
Day 104.88 (70.62, 139.15) [148.61 (82.39, 214.82)]
Evening or weekend 143.52 (105.93, 181.11) [211.17 (123.59, 298.75)]
Night 203.05 (123.59, 282.52) [247.15 (144.18, 350.12)]
Spinal or general anesthesia: first 15 min [first h]§¶
Day 87.52 (35.58, 139.46) [158.54 (142.30, 174.77)]
Evening or weekend 116.89 (47.23, 186.54) [214.22 (188.93, 239.51)]
Night 163.99 (54.16, 273.81) [279.02 (216.64, 341.41)]
Vaginal delivery: breech [cephalic]§
Day 540.82 (369.75, 711.90) [427.80 (338.95, 516.65)]
Evening or weekend 638.90 (500.99, 776.82) [503.55 (425.52, 581.58)]
Night 709.85 (603.97, 815.74) [574.50 (528.50, 620.50)]
Cesarean: prelabour [in labour]§
Day 438.52 (406.70, 470.33) [460.52 (406.70, 514.33)]
Evening or weekend 558.02 (505.98, 610.05) [578.60 (505.98, 651.21)]
Night 660.34 (608.96, 711.73) [670.75 (608.96, 732.54)]
Normal newborn examination 59.59 (56.98, 62.20)
Consultation for admission to neonatal intermediate or intensive care unit§
Day, evening or weekend 67.50 (0.00‡, 135.00)
Night 117.96 (0.00‡, 235.92)
Care in neonatal intermediate care unit (per d)**
≤ 1 d 215.08 (130.80, 299.36)
> 1 d and ≤ 10 d 59.89 (27.25, 92.52)
> 10 d 48.68 (27.25, 70.11)
Care in neonatal intensive care unit (per d)**
≤ 1 d 298.87 (179.08, 418.67)
> 1 d and ≤ 10 d 113.83 (70.11, 157.56)
> 10 d 89.98 (70.11, 109.86)
*Midpoint estimates were calculated as the midpoint of the low and high unit costs. Costs are in 2002 Canadian dollars. †The fee for induction with oxytocin was applied for all women having induction with oxytocin with or without augmentation with oxytocin, whereas the fee for augmentation with oxytocin was applied for women having only augmentation with oxytocin (because induction or augmentation with oxytocin can be claimed only once). ‡In one of the hospitals the physicians did not charge for this service. §Day fees were applied for procedures performed from 0700 until 1700, evening or weekend fees were applied for procedures performed from 1700 until 2400 on Mondays to Fridays and from 0700 until 2400 on Saturdays or Sundays, and night fees were applied for procedures performed from 0000 until 0700 on all days. ¶Costs were determined by an initial base fee, followed by additional fees for every additional 5–15 minutes, depending on the hospital, up to a maximum; the costs shown in this table are those for the first 15 minutes and the first hour only. **The total cost for a stay of 1 day or less in neonatal intermediate or intensive care units was calculated using the fee for 1 day or less, the total cost for a stay of 2–10 days was calculated using the fee for 1 day or less for the first day plus the fee for “> 1 d and ≤ 10 d” multiplied by the rest of days, and the total cost for a stay of more than 10 days was calculated using the fee for 1 day or less for the first day plus the fee for “> 1 d and ≤ 10 d” fee multiplied by 9 plus the fee for more than 10 days multiplied by the rest of days.

anesthesia and was treated as epidural anesthesia.Although the use of health care resources was recorded in
the trial, the associated unit costs were collected after the trialfor the fiscal year 2002–2003. Reliable unit costs for healthcare services were not readily available and had to be calcu-lated using financial and statistical reports provided by eachhospital. We obtained reports from 4 teaching hospitals and3 community hospitals in 3 provinces (British Columbia, Al-berta and Ontario). The hospitals were chosen because oftheir accessibility and quality of financial information.4 Physi-cian fees for the services were obtained from the respective
provincial fee schedules.5–7 We contacted health care expertsand clinicians from each province to assist us with the identi-fication and interpretation of the most appropriate fees. Foreach service provided by a physician we took into considera-tion the time of day when these services were provided.
To determine unit costs for services provided in the hospi-tal, a cost model of each participating hospital was devel-oped. First, we identified in each hospital a group of womenand infants who presented with similar characteristics tothose who participated in the Term Breech Trial. To do so, weused the International statistical classification of diseases and
CMAJ • April 11, 2006 • 174(8) | Online-6
Research
Table 3: Length of stay (hours) in different wards and rooms of the hospital
Planned cesarean group; mean (SD) [midpoint] Planned vaginal birth group; mean (SD) [midpoint]
Hospital ward or room
Parity = 0 n = 268
Parity ≥ 1n = 247
Total n = 515
Parity = 0 n = 283
Parity ≥ 1n = 229
Total n = 512
Antenatal ward* 6.8 (15.8) [0.0] 10.5 (39.2) [0.0] 8.6 (29.5) [0.0] 10.8 (26.0) [0.0] 9.4 (33.4) [0.0] 10.2 (29.5) [0.0]
CS 6.9 (15.8) [0.0] 11.3 (40.4) [1.3] 8.9 (29.7) [0.8] 11.6 (26.0) [0.0] 15.3 (47.5) [0.0] 12.9 (35.2) [0.0]
VD 4.2 (15.2) [0.0] 6.0 (31.5) [0.0] 5.5 (27.8) [0.0] 9.4 (26.1) [0.0] 4.8 (12.8) [0.0] 6.8 (19.9) [0.0]
Labour and delivery room† 2.7 (2.7) [1.8] 3.2 (6.3) [1.5] 3.0 (4.8) [1.7] 8.7 (7.5) [7.1] 7.3 (8.3) [5.2] 8.1 (7.9) [6.1]
CS 2.4 (2.1) [1.8] 2.8 (6.4) [1.3] 2.6 (4.6) [1.5] 8.7 (8.6) [6.0] 8.4 (11.3) [6.0] 8.6 (9.7) [6.0]
VD 7.7 (6.0) [6.1] 5.9 (4.5) [4.0] 6.4 (5.0) [4.4] 8.7 (4.8) [7.8] 6.4 (4.4) [5.1] 7.4 (4.7) [6.2]
Operating room‡ 1.2 (0.5) [1.2] 1.1 (0.6) [1.2] 1.2 (0.6) [1.2] 0.8 (0.7) [0.9] 0.6 (0.7) [0.0] 0.7 (0.7) [0.8]
CS 1.3 (0.5) [1.3] 1.3 (0.4) [1.3] 1.3 (0.4) [1.3] 1.3 (0.5) [1.2] 1.3 (0.5) [1.3] 1.3 (0.5) [1.2]
VD 0.0 (0.0) [0.0] 0.1 (0.2) [0.0] 0.0 (0.2) [0.0] 0.0 (0.0) [0.0] 0.0 (0.0) [0.0] 0.0 (0.0) [0.0]
Postnatal ward§ 100.7 (37.6) [95.5] 90.8 (38.1) [90.3] 96.0 (38.1) [93.4] 92.1 (41.7) [87.8] 77.9 (51.3) [67.8] 85.8 (46.7) [80.3]
CS 102.7 (36.8) [95.9] 97.3 (34.7) [94.5] 100.3 (35.9) [95.2] 103.8 (39.7) [95.5] 97.8 (36.1) [88.5] 101.7 (38.5) [93.7]
VD 65.1 (33.7) [50.5] 53.9 (36.0) [46.8] 57.0 (35.4) [46.8] 71.4 (36.8) [66.8] 61.9 (56.1) [49.8] 66.1 (48.6) [59.2]
Regular nursery¶** 98.1 (39.7) [95.8] 90.9 (59.2) [88.7] 94.7 (50.1) [93.5] 87.0 (45.9) [84.1] 70.9 (41.6) [66.9] 79.8 (44.7) [74.3]
CS 99.9 (39.2) [96.1] 97.3 (59.7) [94.0] 98.7 (49.5) [95.3] 99.9 (43.8) [96.0] 93.9 (38.1) [88.6] 97.7 (41.9) [93.1]
VD 65.3 (34.6) [51.5] 55.0 (41.3) [45.9] 57.8 (39.5) [46.6] 64.3 (40.6) [64.7] 52.4 (34.7) [48.6] 57.7 (37.8) [53.8]
Neonatal intermediate care unit** 4.5 (23.6) [0.0] 4.1 (22.1) [0.0] 4.3 (22.9) [0.0] 8.4 (37.9) [0.0] 9.5 (56.2) [0.0] 8.9 (47.0) [0.0]
CS 4.7 (24.2) [0.0] 4.4 (23.6) [0.0] 4.5 (23.9) [0.0] 6.4 (25.0) [0.0] 7.3 (28.5) [0.0] 6.7 (26.3) [0.0]
VD 0.8 (2.1) [0.0] 2.6 (11.0) [0.0] 2.1 (9.4) [0.0] 11.8 (53.7) [0.0] 11.3 (71.1) [0.0] 11.5 (63.8) [0.0]
Neonatal intensive care unit** 0.3 (3.2) [0.0] 1.3 (12.3) [0.0] 0.8 (8.8) [0.0] 2.3 (14.8) [0.0] 5.9 (39.9) [0.0] 3.9 (28.9) [0.0]
CS 0.3 (3.3) [0.0] 1.4 (13.3) [0.0] 0.8 (9.3) [0.0] 1.1 (8.4 ) [0.0] 3.5 (22.0) [0.0] 2.0 (14.9) [0.0]
VD 0.0 (0.0) [0.0] 0.6 (3.6) [0.0] 0.4 (3.1) [0.0] 4.4 (21.8) [0.0] 7.7 (49.9) [0.0] 6.2 (39.9) [0.0]
Note: CS = cesarean section, VD = vaginal delivery. *Length of stay in antenatal ward was calculated as the time from admission to hospital or randomization (whichever was later) to the time of admission to the labour or delivery room or operating room (whichever was earlier). †Length of stay in the labour or delivery room was calculated as the time of admission to the labour or delivery room or randomization (whichever was later) to the time of admission to the operating room or to the time of delivery (whichever was earlier) plus 1 hour of recovery time. ‡Length of stay in the operating room was calculated as the time of admission to the operating room or randomization (whichever was later) to the time of discharge from the operating room.§Length of stay in the postnatal ward was calculated as the time from delivery or discharge from the operating room (whichever was later) to the time of maternal discharge to home minus 1 hour to account for the recovery time in the labour or delivery room. ¶Length of stay in the regular nursery was calculated as the time from birth to the time of the infant’s discharge home minus the time spent in intermediate or intensive care. **Two babies with lethal anomalies were excluded (1 from each group).

related health problems (ICD-10)8 codes Z37.0 (single livebirth) and O32.10 (maternal care for breech presentation) orO64.10 (obstructed labour due to breech presentation), clas-sified according to Case Mix Groups (CMGs)9 601–4 (cesare-ans and repeat cesareans with or without a complicating di-agnosis), 607–11 (vaginal births before or after cesarean withor without minor procedures or a complicating diagnosis orboth), 627–28 (neonates 1000–1499 g in weight with or with-out a catastrophic diagnosis), 630–32 (neonates 1500–1999 gin weight with or without problems or a catastrophic diagno-sis or both), 637–40 (neonates 2000–2499 g in weight with orwithout problems or a catastrophic diagnosis), 643–45(neonates > 2500 g in weight with a catastrophic diagnosis ormajor or moderate problems), 646 (neonates > 2500 g inweight born by cesarean) and 647–48 (neonates > 2500 g inweight with or without minor problems). Hospitals providedall direct and indirect (i.e., overhead) costs for these mothersand infants related to their length of stay at the hospital. Weassumed that postpartum ward costs would be used as aproxy for antenatal ward costs because the nurse-to-patientratio and intensity of care were similar in both locations.
Second, because we had very few vaginal breech cases andvery few admissions to the neonatal intensive care unit, weadded a data set of cephalic vaginal deliveries in 6 of the 7hospitals. These we identified by ICD-10 code Z37.0 withoutO32.10 or O64.10, classified according to CMGs 607–11,627–28, 630–32, 637–40, 643–45 and 647–48.
Third, each hospital provided us with the duration of stayof the women and infants in the different wards or rooms ofthe hospital, and we allocated the costs of different services to
these wards or rooms. The cost of each service that was allo-cated to each ward or room of the hospital was then dividedby the total length of stay in that ward or room to obtain theper-hour cost of each service. To find the total per-hour unitcost for each ward or room, we added the per-hour costs ofall of the services that occurred in that ward or room.
Fourth, because unit cost estimates varied across the 7hospitals and physician fees varied between the differentprovinces, we used the unit cost at the midpoint between thehigh and low unit cost estimates for the analysis.
All of the results were analyzed according to the intentionto treat approach. Unit costs of individual patient serviceswere applied to health care utilization data. The total costs formothers and infants of each arm of the trial were not ob-served to be normally distributed. Therefore, assuming agamma distribution and a vague prior, the mean cost, stan-dard error, difference of means of both arms of the trial, anda 95% credible interval were estimated using a BayesianMarkov chain Monte Carlo (MCMC) simulation approach im-plemented in WinBUGS software.10
To check for potential effect of parity, we estimated thetreatment effect and 95% credible intervals for each paritysubgroup (0, ≥ 1). In addition, to examine for a treatment-by-parity interaction, the difference in treatment effects and 95%credible intervals were estimated.
The above analysis captures only differences in resourceutilization patterns and thus calls for the use of sensitivityanalysis to explore the robustness of the results over alterna-tive unit cost values. For the analyses of all women, those withparity equalling zero and those with parity of one or greater,
CMAJ • April 11, 2006 • 174(8) | Online-7
Research
Table 4: Midpoint and actual unit costs per hour of services by hospital ward or room at participating hospitals*
Teaching hospital; unit cost, $ Community hospital; unit cost, $
Hospital ward or room Midpoint
unit cost, $ 1† 2 3 4 1 2 3
Antenatal ward
CS 26.44 15.85 28.95 37.04 19.15 20.22 22.01 17.98
VD 25.71 17.55 34.43 27.10 16.99 21.73 20.24 19.10
Labour and delivery room
CS 233.34 238.78 196.16 228.64 163.54 223.65 320.59 146.10
VD 177.17 218.87 133.64 220.70 158.08 139.26 149.09 139.44
Operating room 821.37 150.01 429.38 1492.72 584.34 744.50 814.62 877.48
Postnatal ward
CS 26.44 15.85 28.95 37.04 19.15 20.22 22.01 17.98
VD 25.71 17.55 34.43 27.10 16.99 21.73 20.24 19.10
Regular nursery 17.20 17.67 25.03 20.61 14.06 21.36 24.50 9.36
Neonatal intermediate care unit 45.76 36.61 37.99 NA 35.92 55.60 42.66 46.55
Neonatal intensive care unit 88.80 58.22 65.14 119.37 73.26 NA NA NA
Note: CS = cesarean section, VD = vaginal delivery, NA = not applicable. *Midpoint estimates were calculated as the midpoint of the low and high unit costs. Costs are expressed in 2002 Canadian dollars. To obtain hospital costs, we identified all deliveries at 37 weeks' gestation or later having the following ICD-10 codes: Z37.0 (single live birth) and O32.10 (maternal care for breech presentation) or O64.10 (obstructed labour due to breech presentation) and Case Mix Groups 601, 602, 603 and 604 for deliveries by cesarean section, and Z37.0 (single live birth) and Case Mix Groups 607, 608, 609, 610 and 611 for vaginal deliveries. The ICD-10 codes were selected from reference 8, and the Case Mix Groups were selected from reference 9. †Costs from this hospital were for women having a cesarean or a vaginal breech delivery only.
we used the midpoint, low and high unit costs in the analysisto check whether the results were sensitive to the set of unitcosts chosen.
To demonstrate which specific services were more costly,depending on the management strategy, we also calculatedthe average cost per patient for each service provided, bytreatment arm, by dividing the total costs of each service bythe total number of patients in each treatment arm.
Results
The total number of participants from countries with low na-tional perinatal rates of death was 515 mothers and 514 in-fants in the planned cesarean group and 512 mothers and 511infants in the planned vaginal birth group (Fig. 1).
Table 1 shows the physician services provided to womenand infants in each arm of the trial. Women in the plannedvaginal birth group had more antenatal visits, inductions oraugmentations of labour or both with oxytocin, inductions oraugmentations of labour or both with prostaglandins, andepidural anesthesia than women in the planned cesareangroup. More spinal anesthesia was given in the planned ce-sarean group. As expected, there were more cesareans in theplanned cesarean group and more vaginal breech andcephalic deliveries in the planned vaginal birth group. How-ever, there were more cesareans in labour in the planned vagi-nal birth group than in the planned cesarean group. Infantsin the planned cesarean group were less likely to receive carein the neonatal intermediate care unit or neonatal intensivecare unit and more likely to have normal newborn examina-tions than infants in the planned vaginal birth group.
Table 2 presents physician fees (midpoint, low and high)for obstetrical, anesthetic and neonatal services (2002 Cana-dian dollars). The unit costs of epidural analgesia and spinaland general anesthetic are time dependent. In Table 2 we in-clude only the unit costs at 15 minutes and at the first hour.However, these costs usually rose when the length of timewhen analgesia or anesthesia were required increased. Wefurther observe that the physician fees for a vaginal breech de-livery were higher than for a vaginal cephalic delivery, andthat the fees were also higher for a cesarean in labour than aprelabour cesarean. However, the physician fees for a vaginalbreech delivery were higher than for either a prelabour ce-sarean or a cesarean in labour. The variability in unit costs(reflected in the range between low and high estimates) wassubstantial for high-cost services, such as types of delivery,and was even more substantial for both types of vaginal deliv-ery. Costs were also highly variable for analgesia and anesthe-sia, and for care provided to infants in the neonatal interme-diate care unit and the neonatal intensive care unit.
Table 3 shows the lengths of stay in different wards orrooms in the hospital. Women in the planned cesarean groupspent, on average, less time in the antenatal ward and in thelabour and delivery room than women in the planned vaginalbirth group. The mean lengths of stay of women in theplanned cesarean group in the operating room and in thepostnatal ward were longer than those of the women in theplanned vaginal birth group. Infants in the planned cesareangroup had a shorter length of stay in the neonatal intermedi-ate and neonatal intensive care units and a longer length ofstay in the regular nursery than those in the planned vaginalbirth group.
CMAJ • April 11, 2006 • 174(8) | Online-8
Research
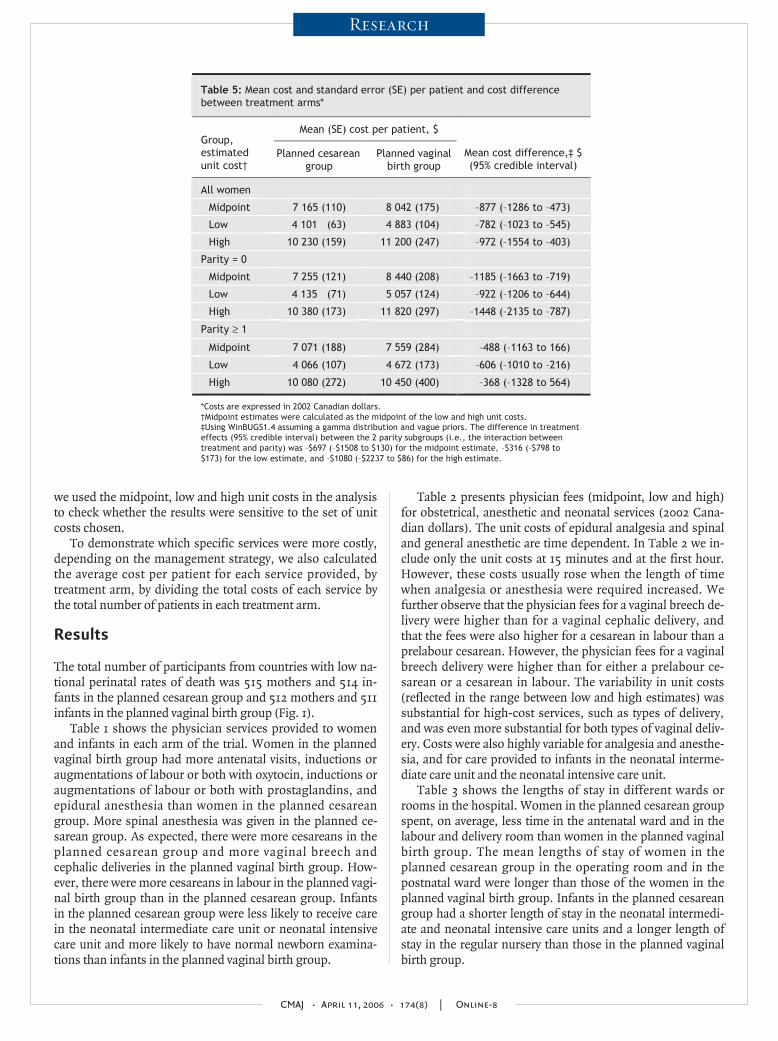
Table 5: Mean cost and standard error (SE) per patient and cost difference between treatment arms*
Mean (SE) cost per patient, $Group, estimated unit cost†
Planned cesarean group
Planned vaginal birth group
Mean cost difference,‡ $(95% credible interval)
All women
Midpoint 7 165 (110) 8 042 (175) –877 (–1286 to –473)
Low 4 101 (63) 4 883 (104) –782 (–1023 to –545)
High 10 230 (159) 11 200 (247) –972 (–1554 to –403)
Parity = 0
Midpoint 7 255 (121) 8 440 (208) –1185 (–1663 to –719)
Low 4 135 (71) 5 057 (124) –922 (–1206 to –644)
High 10 380 (173) 11 820 (297) –1448 (–2135 to –787)
Parity ≥ 1
Midpoint 7 071 (188) 7 559 (284) –488 (–1163 to 166)
Low 4 066 (107) 4 672 (173) –606 (–1010 to –216)
High 10 080 (272) 10 450 (400) –368 (–1328 to 564)
*Costs are expressed in 2002 Canadian dollars. †Midpoint estimates were calculated as the midpoint of the low and high unit costs. ‡Using WinBUGS1.4 assuming a gamma distribution and vague priors. The difference in treatment effects (95% credible interval) between the 2 parity subgroups (i.e., the interaction between treatment and parity) was –$697 (–$1508 to $130) for the midpoint estimate, –$316 (–$798 to $173) for the low estimate, and –$1080 (–$2237 to $86) for the high estimate.
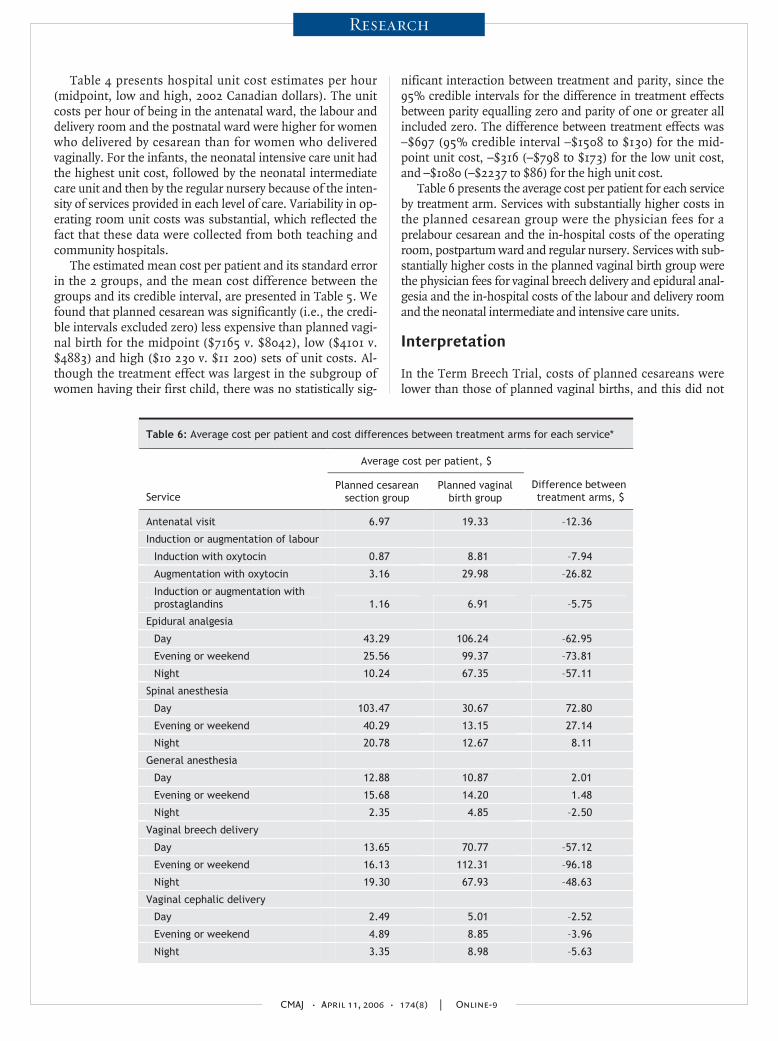
Table 4 presents hospital unit cost estimates per hour(midpoint, low and high, 2002 Canadian dollars). The unitcosts per hour of being in the antenatal ward, the labour anddelivery room and the postnatal ward were higher for womenwho delivered by cesarean than for women who deliveredvaginally. For the infants, the neonatal intensive care unit hadthe highest unit cost, followed by the neonatal intermediatecare unit and then by the regular nursery because of the inten-sity of services provided in each level of care. Variability in op-erating room unit costs was substantial, which reflected thefact that these data were collected from both teaching andcommunity hospitals.
The estimated mean cost per patient and its standard errorin the 2 groups, and the mean cost difference between thegroups and its credible interval, are presented in Table 5. Wefound that planned cesarean was significantly (i.e., the credi-ble intervals excluded zero) less expensive than planned vagi-nal birth for the midpoint ($7165 v. $8042), low ($4101 v.$4883) and high ($10 230 v. $11 200) sets of unit costs. Al-though the treatment effect was largest in the subgroup ofwomen having their first child, there was no statistically sig-
nificant interaction between treatment and parity, since the95% credible intervals for the difference in treatment effectsbetween parity equalling zero and parity of one or greater allincluded zero. The difference between treatment effects was–$697 (95% credible interval –$1508 to $130) for the mid-point unit cost, –$316 (–$798 to $173) for the low unit cost,and –$1080 (–$2237 to $86) for the high unit cost.
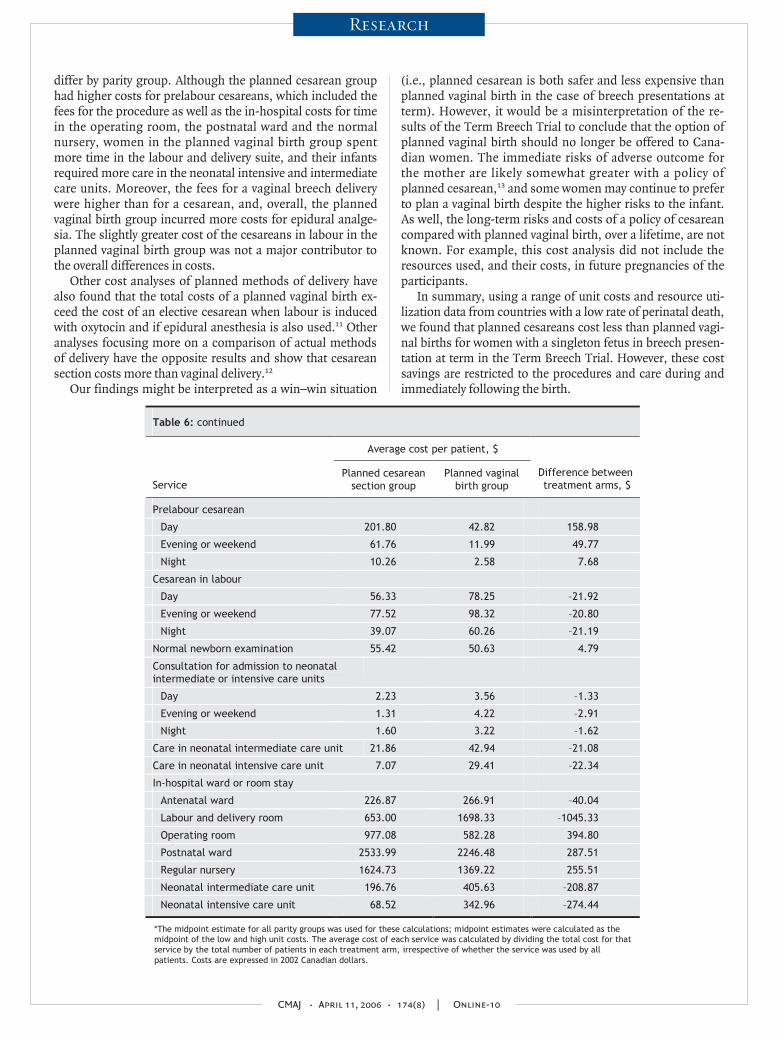
Table 6 presents the average cost per patient for each serviceby treatment arm. Services with substantially higher costs inthe planned cesarean group were the physician fees for aprelabour cesarean and the in-hospital costs of the operatingroom, postpartum ward and regular nursery. Services with sub-stantially higher costs in the planned vaginal birth group werethe physician fees for vaginal breech delivery and epidural anal-gesia and the in-hospital costs of the labour and delivery roomand the neonatal intermediate and intensive care units.
Interpretation
In the Term Breech Trial, costs of planned cesareans werelower than those of planned vaginal births, and this did not
CMAJ • April 11, 2006 • 174(8) | Online-9
Research
Table 6: Average cost per patient and cost differences between treatment arms for each service*
Average cost per patient, $
Service Planned cesarean
section group Planned vaginal
birth group Difference between treatment arms, $
Antenatal visit 6.97 19.33 –12.36
Induction or augmentation of labour
Induction with oxytocin 0.87 8.81 –7.94
Augmentation with oxytocin 3.16 29.98 –26.82
Induction or augmentation with prostaglandins 1.16 6.91 –5.75
Epidural analgesia
Day 43.29 106.24 –62.95
Evening or weekend 25.56 99.37 –73.81
Night 10.24 67.35 –57.11
Spinal anesthesia
Day 103.47 30.67 72.80
Evening or weekend 40.29 13.15 27.14
Night 20.78 12.67 8.11
General anesthesia
Day 12.88 10.87 2.01
Evening or weekend 15.68 14.20 1.48
Night 2.35 4.85 –2.50
Vaginal breech delivery
Day 13.65 70.77 –57.12
Evening or weekend 16.13 112.31 –96.18
Night 19.30 67.93 –48.63
Vaginal cephalic delivery
Day 2.49 5.01 –2.52
Evening or weekend 4.89 8.85 –3.96
Night 3.35 8.98 –5.63
differ by parity group. Although the planned cesarean grouphad higher costs for prelabour cesareans, which included thefees for the procedure as well as the in-hospital costs for timein the operating room, the postnatal ward and the normalnursery, women in the planned vaginal birth group spentmore time in the labour and delivery suite, and their infantsrequired more care in the neonatal intensive and intermediatecare units. Moreover, the fees for a vaginal breech deliverywere higher than for a cesarean, and, overall, the plannedvaginal birth group incurred more costs for epidural analge-sia. The slightly greater cost of the cesareans in labour in theplanned vaginal birth group was not a major contributor tothe overall differences in costs.
Other cost analyses of planned methods of delivery havealso found that the total costs of a planned vaginal birth ex-ceed the cost of an elective cesarean when labour is inducedwith oxytocin and if epidural anesthesia is also used.11 Otheranalyses focusing more on a comparison of actual methodsof delivery have the opposite results and show that cesareansection costs more than vaginal delivery.12
Our findings might be interpreted as a win–win situation
(i.e., planned cesarean is both safer and less expensive thanplanned vaginal birth in the case of breech presentations atterm). However, it would be a misinterpretation of the re-sults of the Term Breech Trial to conclude that the option ofplanned vaginal birth should no longer be offered to Cana-dian women. The immediate risks of adverse outcome forthe mother are likely somewhat greater with a policy ofplanned cesarean,13 and some women may continue to preferto plan a vaginal birth despite the higher risks to the infant.As well, the long-term risks and costs of a policy of cesareancompared with planned vaginal birth, over a lifetime, are notknown. For example, this cost analysis did not include theresources used, and their costs, in future pregnancies of theparticipants.
In summary, using a range of unit costs and resource uti-lization data from countries with a low rate of perinatal death,we found that planned cesareans cost less than planned vagi-nal births for women with a singleton fetus in breech presen-tation at term in the Term Breech Trial. However, these costsavings are restricted to the procedures and care during andimmediately following the birth.
CMAJ • April 11, 2006 • 174(8) | Online-10
Research
Table 6: continued
Average cost per patient, $
Service Planned cesarean
section group Planned vaginal
birth group Difference between treatment arms, $
Prelabour cesarean
Day 201.80 42.82 158.98
Evening or weekend 61.76 11.99 49.77
Night 10.26 2.58 7.68
Cesarean in labour
Day 56.33 78.25 –21.92
Evening or weekend 77.52 98.32 –20.80
Night 39.07 60.26 –21.19
Normal newborn examination 55.42 50.63 4.79
Consultation for admission to neonatal intermediate or intensive care units
Day 2.23 3.56 –1.33
Evening or weekend 1.31 4.22 –2.91
Night 1.60 3.22 –1.62
Care in neonatal intermediate care unit 21.86 42.94 –21.08
Care in neonatal intensive care unit 7.07 29.41 –22.34
In-hospital ward or room stay
Antenatal ward 226.87 266.91 –40.04
Labour and delivery room 653.00 1698.33 –1045.33
Operating room 977.08 582.28 394.80
Postnatal ward 2533.99 2246.48 287.51
Regular nursery 1624.73 1369.22 255.51
Neonatal intermediate care unit 196.76 405.63 –208.87
Neonatal intensive care unit 68.52 342.96 –274.44
*The midpoint estimate for all parity groups was used for these calculations; midpoint estimates were calculated as the midpoint of the low and high unit costs. The average cost of each service was calculated by dividing the total cost for that service by the total number of patients in each treatment arm, irrespective of whether the service was used by all patients. Costs are expressed in 2002 Canadian dollars.

REFERENCES1. Hannah ME, Hannah WJ, Hewson SA, et al. Planned caesarean section versus
planned vaginal birth for breech presentation at term: a randomised multicentretrial. Lancet 2000;356:1375-83.
2. Hewson SA, Weston J, Hannah ME. Crossing international boundaries: implica-tions for the Term Breech Trial Data Coordinating Centre. Control Clin Trials2002;23:67-73.
3. World Health Organization. Perinatal mortality: a listing of available information.WHO/FRH/MSM/96.7. Geneva: The Organization; 1996.
4. Goeree R, Gafni A, Hannah M, et al. Hospital selection for unit cost estimates inmulticentre economic evaluations, does the choice of hospitals make a difference?Pharmacoeconomics 1999;15:561-72.
5. Ontario Ministry of Health and Long-Term Care. Schedule of benefits, physicianservices under the Health Insurance Act. Toronto; 2003.
6. Alberta Health and Wellness. Alberta Health Care Insurance Plan, medical proce-dure list. Edmonton; 2003.
7. British Columbia Medical Association. BC Medical Association guide to fees. Van-couver; 2003.
8. World Health Organization. International statistical classification of diseases andrelated health problems. 10th ed. Geneva; The Organization; 1992–1994.
9. Canadian Institute for Health Information. CMG/Plx Directory, ICD-10-CA/CCIVersion, 2003. Ottawa; November 2003.
10. Spiegelhalter DJ, Thomas A, Best NG. WinBUGS Version 1.4. User Manual. Cam-bridge: MRC Biostatistics Unit; 2000.
11. Bost BW. Caesarean delivery on demand: what will it cost? Am J Obstet Gynecol2003;188:1418-23.
12. Henderson J, McCandlish R, Kumiega L, et al. Systematic review of economic as-pects of alternative modes of delivery. Br J Obstet Gynaecol 2001;108:149-57.
13. Hofmeyr J, Hannah ME. Planned cesarean section for breech delivery [Cochranereview]. In: The Cochrane Library, Issue 1, 2005. Oxford: Update Software.
CMAJ • April 11, 2006 • 174(8) | Online-11
Research
Contributors:: Roberto Palencia contributed substantially to the study’s concep-tion and design and to the acquisition, analysis and interpretation of the dataand drafted the article. Amiram Gafni, Mary E. Hannah and Sue Ross con-tributed substantially to the study’s conception and design and to the acquisi-tion, analysis and interpretation of the data and revised the article critically forimportant intellectual content. Andrew R. Willan contributed substantially tothe study’s conception and design and to the analysis and interpretation of thedata and revised the article for important intellectual content. Sheila Hewsonand Darren McKay contributed substantially to the acquisition, analysis and in-terpretation of the data and revised the article critically for important intellec-tual content. Walter Hannah, Hilary Whyte, Kofi Amankwah, Mary Cheng, Pa-tricia Guselle, Michael Helewa, Ellen D. Hodnett, Eileen K. Hutton, Rose Kungand Saroj Saigal contributed substantially to the study’s conception and designand revised the article critically for important intellectual content. All of the au-thors gave final approval of the version to be published.
Competing interests: None declared.
Correspondence to: Dr. Amiram Gafni, Department of ClinicalEpidemiology and Biostatistics (HSC-3H29), McMaster University,1200 Main St. W., Hamilton ON L8N 3Z5; fax 905 546-5211;[email protected]
This article has been peer reviewed.
From the Maternal, Infant and Reproductive Health Research Unit at The Cen-tre for Research in Women's Health (Palencia, Hewson, McKay, Guselle), theDepartment of Public Health Sciences (Willan), the Department of Health Pol-icy Management and Evaluation (Whyte) and the Faculty of Nursing (Hodnett),University of Toronto; the Department of Obstetrics and Gynecology (Hannah,Kung), Sunnybrook and Women's College Health Sciences Centre and Pro-gram in Population Health Sciences (Willan) and Department of Pediatrics(Whyte), Hospital for Sick Children, University of Toronto, Toronto, Ont.; theCentre for Health Economics and Policy Analysis and Department of ClinicalEpidemiology and Biostatistics (Gafni) and the Department of Pediatrics (Sai-gal) McMaster University, Hamilton, Ont.; the Department of Obstetrics andGynecology (Ross), University of Calgary, Calgary, Alta.; the Department of Ob-stetrics and Gynecology, School of Medicine (Amankwah), Southern IllinoisUniversity, Springfield, Ill.; the Department of Obstetrics and Gynecology, Cen-tenary Hospital (Cheng), Scarborough, Ont.; the Department of Obstetrics andGynecology (Helewa), St. Boniface Hospital, University of Manitoba, Win-nipeg, Man.; the Department of Family Practice, Division of Midwifery (Hut-ton), University of British Columbia, Vancouver, BC. Members of the TermBreech Trial Collaborative Group are listed in Lancet 2000;356:1375-83.
Acknowledgements: We thank Elizabeth Asztalos, Jon Barrett, SharonBeynon, Peter von Dadleszen, Michèle Dekker, Suzanne Dionne, Joanne Dou-glas, Linda Greensword, Jean Kronberg, Rosemarie Lourenco, Mark Pearson,Pauline Robertson, Kelly Ross, Peter Rymkiewicz and Filomena Travassos fortheir assistance with data retrieval and interpretation.
This study was supported by grants from the Canadian Institutes ofHealth Research (grant numbers MT-13884, MT-37415). The Data Co-ordina-tion Centre was supported by grants from The Centre for Research inWomen’s Health, Sunnybrook and Women’s College Health Sciences Centre,and the Department of Obstetrics and Gynaecology at the University ofToronto, Toronto, Ont.
Related Documents