The Costs of Networked Learning Telematics in Education Research Group on behalf of the Virtual Campus Programme and School of Computing and Management Sciences Paul Bacsich, Charlotte Ash, Kim Boniwell, Leon Kaplan with the assistance of Jane Mardell and Andrew Caven-Atack October 1999 – reissued June 2015

Welcome message from author
This document is posted to help you gain knowledge. Please leave a comment to let me know what you think about it! Share it to your friends and learn new things together.
Transcript
The Costs of Networked Learning
Telematics in Education Research Group
on behalf of the
Virtual Campus Programme
and School of Computing and Management Sciences
Paul Bacsich, Charlotte Ash, Kim Boniwell, Leon Kaplan with the assistance of
Jane Mardell and Andrew Caven-Atack
October 1999 – reissued June 2015


Costs of Networked Learning
Bacsich et al. i
“The classic report on costs of e-learning, online learning and distance learning”
Bacsich et al. ii
Further information:
Professor Paul Bacsich
Sero Consulting Ltd and Matic Media Ltd
Sheffield Technology Parks
Cooper Buildings
Arundel Street
Sheffield
S1 2NS
United Kingdom
email: [email protected]
URL:
© Sheffield Hallam University 1999
The copyright of all materials delivered by this project remains with Sheffield Hallam
University. Under the agreement with JISC extant at the time of writing, materials
may, of course, be freely used within UK Higher Education, provided that the original
authors/owners are acknowledged. Outside this community, anyone wishing to utilise
these materials for profit should contact the lead author.
CALT, the Committee on Awareness, Liaison and Training, was a subcommittee of the
Joint Information Systems Committee of the Higher Education and Research Funding
Councils. (CALT was later renamed JCALT; JISC is now Jisc.)

Costs of Networked Learning
Bacsich et al. iii
Foreword
This study has been an exciting “six month” piece of work - even allowing for the fact
that we managed to stop the clock and take just over 8 months from the official start
date of 1 December 1998 till we delivered the final draft in early August.
We cannot deny that many of our professional colleagues around the world felt that it
would be impossible to do the subject justice in such a short and modestly funded
study, given the confusion in the field and lack of earlier authoritative (or, at least,
generally accepted) work relevant to the UK HE sector. Whether we have done or not,
you, the readers, must be the judge.
We could be criticised by those who say that much remains to be done, but we
contend that what remains to be done is detail, consensus-building, and training, not
fundamental theory.
If asked to distil our conclusions to the utter minimum, I would say that in order to
understand the “true” costs of Networked Learning, the only way forward is to have a
framework to understand the costs of teaching and learning, and in turn, the costs of
universities, together with costs falling on the wider society of stakeholders. That may
show what a tall order the task is.
The good news is that we believe that the problem can be analysed not by educators
inventing a new vocabulary for finance and planning (as some have effectively tried
to do over many years), nor by their denying the need for such tools (as others have
often tried), but by using the tools that are (slowly) being used in universities to solve
more general financial and management problems.
The key comes from the earlier (and still ongoing) debates about finance and planning
for Information Technology. It is for educators (not planners or finance staff) to imbue
and enliven financial and planning tools with a modern educational viewpoint, so as
to facilitate the creative dialogue between pedagogues and planners that will be so
necessary in universities in the next millennium.
Dr Paul Bacsich, Professor of Telematics
Head of the Virtual Campus Programme
Sheffield Hallam University
October 1999

“The classic report on costs of e-learning, online learning and distance learning”
Bacsich et al. iv

Costs of Networked Learning
Bacsich et al. v
Table of Contents
0. Executive Summary .......................................................................................................... 1
0.1 Conclusions ................................................................................................................. 1
0.2 Planning Document and Financial Schema.................................................................. 2
0.3 Recommendations ....................................................................................................... 2
0.4 Recommendations for further work ............................................................................. 2
1. Introduction ..................................................................................................................... 3
1.1 Networked Learning .................................................................................................... 3
1.2 Hidden Costs ............................................................................................................... 4
1.3 Project overview .......................................................................................................... 5
1.4 Project financing .......................................................................................................... 6
2. Methodology .................................................................................................................... 7
2.1 Introduction ................................................................................................................. 7
2.2 Literature review ......................................................................................................... 7
2.3 Sectoral survey ............................................................................................................ 8
2.4 Student questionnaire .................................................................................................. 9
2.5 Case Study reports ....................................................................................................... 9
2.6 Consultation .............................................................................................................. 10
3. Literature Review........................................................................................................... 11
3.1 Introduction .............................................................................................................. 11
3.2 Costs to stakeholders ................................................................................................. 11
3.3 Lifecycle - development of a model .......................................................................... 16
4. Sectoral Survey Analysis ................................................................................................ 19
4.1 Introduction ............................................................................................................... 19
4.2 Quantitative analysis of Sectoral Survey ................................................................... 20
4.3 Qualitative analysis of Sectoral Survey ..................................................................... 24
4.4 Conclusion ................................................................................................................. 27
5. Case Studies ................................................................................................................... 28
5.1 Introduction ............................................................................................................... 28
5.2 Discussion ................................................................................................................. 28
5.3 Conclusions ............................................................................................................... 33
6. Student Questionnaire .................................................................................................... 34
6.1 Introduction ............................................................................................................... 34
6.2 Student profile ........................................................................................................... 34
6.3 Student routine .......................................................................................................... 35
6.4 Computer issues ........................................................................................................ 36
6.5 Networked Learning .................................................................................................. 37
6.6 Costs .......................................................................................................................... 37
“The classic report on costs of e-learning, online learning and distance learning”
Bacsich et al. vi
6.7 Conclusions ............................................................................................................... 38
7. Evolution of the Model ................................................................................................... 39
7.1 Introduction ............................................................................................................... 39
7.2 Reminder of the five-phase model ............................................................................. 39
7.3 Test group one - site visits ......................................................................................... 39
7.4 Test group two - experts’ workshop .......................................................................... 40
7.5 Re-analysis of five-phase model ................................................................................ 41
7.6 Confirmation from the literature ................................................................................ 42
7.7 Three scenarios .......................................................................................................... 44
7.8 Conclusions ............................................................................................................... 45
8. Financial Schemas ......................................................................................................... 46
8.1 Existing schemas ....................................................................................................... 46
8.2 Conclusions ............................................................................................................... 58
9. The Planning Document ................................................................................................ 59
9.1 Introduction ............................................................................................................... 59
9.2 Planning Framework ................................................................................................. 59
9.3 Input from the literature ............................................................................................. 60
9.4 HEFCE work ............................................................................................................. 62
9.5 A worked example ..................................................................................................... 66
9.6 Summary ................................................................................................................... 69
10. Dissemination ................................................................................................................ 70
10.1 Final Report ............................................................................................................... 70
10.2 Conferences ............................................................................................................... 70
10.3 Journals ..................................................................................................................... 72
10.4 Project Web site ......................................................................................................... 72
10.5 Informal dissemination ............................................................................................. 72
10.6 The listserv ................................................................................................................ 72
11. Project Management ...................................................................................................... 73
12. Conclusions and Recommendations ............................................................................... 75
12.1 Conclusions ............................................................................................................... 75
12.2 Project recommendations .......................................................................................... 77
12.3 Recommendations for further work ........................................................................... 77
References .............................................................................................................................. 79
Appendices ............................................................................................................................. 83
A1 Full bibliography ........................................................................................................... 84
A2 Questionnaire to UK HEIs ............................................................................................. 91
A3 Student Representative Survey ....................................................................................... 95
A4 Conference Reports........................................................................................................ 97

Costs of Networked Learning
Bacsich et al. 1
0. Executive Summary
The main aim of this Joint Information Systems Committee (JISC) funded project was
to identify the unrecorded or “hidden” costs involved in Networked Learning and to
produce a Planning Document and Financial Schema using which a complete picture
of the actual costs of Networked Learning can be reached.
This Final Report comprises 12 chapters plus a small number of Appendices. It details
the activities of the Study Team during the six-month study. These activities ranged
from a Sectoral Survey to gain an overview of the extent of Networked Learning in
UK Higher Education Institutions (HEIs), a collection of in-depth studies based on
interviews at seven Institutions, a literature review of over 100 sources and analysis of
a survey which focused on the student perceived costs of Networked Learning.
0.1 Conclusions
1. The literature search established that the past literature is confinable, with a slow
rate of accretion. The literature from the training field is relevant.
2. Earlier UK work on costing innovative learning systems in HE was of little use.
More general costing work, such as the KPMG Costings Guidelines (1997), has
been helpful. The Flashlight (Delinger et al., 1999) work on costing is likely to be
of great relevance.
3. The Sectoral Survey established that the costs of Networked Learning are little
considered at this stage, with problems of scope and inconsistent information.
4. The site visits confirmed that Networked Learning is prevalent in all types of HEI,
but that cost analysis of Networked Learning is not currently on the agenda
(although HEIs are aware that it is firmly on the Funding Councils’ agenda).
5. The site visits also proved that student concerns and behaviour are neither well
understood nor seen as being strategic.
6. Both the survey and the site visits confirmed that there are organisational barriers
to accurate costing. The “cost of costing” issue was raised.
7. Institutions did identify a useful set of Hidden Costs to complement those
uncovered in the literature.
8. Institutions felt that more compelling pedagogical evidence of the benefits of
Networked Learning was needed. Organisational, quality and software issues were
also considered as barriers.
9. The study has uncovered costs being absorbed by academic staff which were
previously hidden. Staff overtime was highlighted as an issue.
10. The student survey showed that there is a disjunct between student beliefs - in
essence, students believe that Networked Learning increases costs to them - and
student behaviour - time has an opportunity cost to them.
“The classic report on costs of e-learning, online learning and distance learning”
Bacsich et al. 2
0.2 Planning Document and Financial Schema
We propose a Planning Document and Financial Schema with the following features:
1. It can operate at the level of a whole Institution; a department or faculty; a course;
or a unit (module) within a course.
2. It takes account of the costs incurred (or saved) by the additional stakeholders in
the learning process other than the Institution. The most important of these
additional stakeholders are Students and Staff (own time and resources).
3. It takes account of the division of academic time into Research, Teaching and
Other (including administration).
4. It takes account of the activities within the course development process and
proposes a three-phase model for these if there is no existing relevant model.
5. It is flexible in terms of the methods of allocation of overheads.
Though it is possible to propose the nucleus of a Planning Document and Financial
Schema in six months, more development and testing is needed to prove its value.
0.3 Recommendations
1. We support the centrally initiated drive towards coherence in university
accounting procedures.
2. Conventional teaching and learning must be costed via the same methodology.
3. There is a need to locate and evaluate finance software suitable for the “new era”
of Activity Based Costing in HEIs.
4. A co-ordinated “mega-survey” approach is needed, including recognised
procedures by which figures are collated.
0.4 Recommendations for further work
1. The study should be extended to include the Further Education (FE) sector. The
FE report should also include issues relevant to the University for Industry.
2. Collaboration with Australia may be profitable, especially in the light of the
current CVCP/HEFCE research project “The Business of Borderless Education”.
3. Evidence suggests that the next area ripe for treatment, in terms of costing
education, is the UK schools sector.
4. The Study Team is happy to work with the HE and FE Funding Councils to look
at specific issues relevant to the constituent countries of the UK.
5. We recommend a study into the benefits, overt and hidden, for all stakeholders, of
Networked Learning. Without such a study, the cost issues are seen in isolation.

Costs of Networked Learning
Bacsich et al. 3
1. Introduction
“If we don’t understand and measure the costs, how can we make informed
decisions?”
Tony Bates, keynote address - Ed-Media99
This document is the Final Report for the “Costs of Networked Learning” project,
funded by the Joint Information Systems Committee (JISC) and run by Sheffield
Hallam University. The main aims of the project were to identify the unrecorded or
Hidden Costs involved in Networked Learning for the benefit of policy makers,
course providers and students, and to produce a Planning Document and Financial
Schema which together would accurately record the costs of Networked Learning.
Below is an excerpt taken from the original JISC circular:
“Many of the costs of developing and supporting Networked Learning are
hidden; unrecorded academic staff time, increased demands on technical
support, more complex administration, additional telephone costs, etc.
CALT wishes to fund a study that will more accurately document the costs of
a number of different approaches to Networked Learning. CALT wishes to
see the study lead to a planning checklist for Networked Learning and a
schema for estimating costs”.
JISC Circular 9/98
When Sheffield Hallam University reviewed previous work on costing innovative
learning systems we concluded that no one body of work encompassed all of the
issues or travelled sufficiently far towards reaching operational conclusions,
especially in a manner convincing to Finance Departments.
Jef Moonen (1997) identified four reasons why costs are difficult to quantify:
There is disagreement about which costs should be taken into account.
Reliable data is unavailable because it is not collected in a systematic manner.
Recorded costs are unstable and evolving.
Some data is perceived as confidential and may not be made publicly available.
In order for the project to reach a useable conclusion, these barriers had to be
surmounted. In addition, we found a larger barrier intrinsic to the UK Higher
Education sector:
Each previous costings approach used a different vocabulary, and these have to be
“standardised” before they can be understood.
1.1 Networked Learning
The term ‘Networked Learning’ was used by JISC in the above-mentioned circular
and is generally taken throughout this project to be synonymous with ‘Online
Learning’, ‘Technology Enhanced Learning’ and such like terms. The actual
definition used by the team is detailed overleaf:
“The classic report on costs of e-learning, online learning and distance learning”
Bacsich et al. 4
“using a networked computer for the purposes of learning,
blurring the boundaries between on-campus, distance and
flexible learning”
Networked Learning can be most successfully identified by the degree to which
technology is used in place of, or to enhance, the tutor. The following scenarios
illustrate the range of substitution possible.
Scenario One
A conventional lecture and tutorial-based undergraduate degree in English Literature
encourages students to keep abreast of international news stories using the Internet in
order to prepare a group presentation on the power of propaganda.
Scenario Two
A BEng in Materials Engineering posts lecture slides, notes and forthcoming
assignments on the course Web site to allow students a continuous reference to the
materials. The Web site is also a gateway to relevant Internet-based resources and is
home to the electronic conferencing system through which students are encouraged to
discuss their work.
Scenario Three
A three year course in Primary Education with QTS (Qualified Teaching Status)
provides all of the above to aid students currently on placement. But it also provides
completely online modules which are available to students who prefer not to attend
the University during the short units between placements which form part of the
otherwise conventional course. The learning material and environment can be either
bought-in or internally developed, thus resulting in a mixed-mode delivery system.
Scenario Four
A fully online MBA in Business Studies which students can study locally or at a
distance, with online learning materials, collaborative conferencing and the email
submission of assignments. The learning material and environment can be either
bought-in or internally developed.
1.2 Hidden Costs
The issue of Hidden Costs is one that, although used quite extensively in other fields,
has not yet been applied in an educational context. It encompasses costs which are
both fundamentally unrecorded, such as academic staff overtime, and those which are
generally absorbed into larger budgets, and therefore cannot then be attributed to an
individual activity or even genre of activity. This project has identified that the main
area of Hidden Costs not previously appreciated is that borne by academic staff;
student Hidden Costs were covered in the 1996 NUS Hidden Course Costs survey.
Examples of Hidden Costs include: the time, inconvenience and extra costs incurred
by staff away from home on business, such as presenting at a conference or attending
a project meeting; student-purchased ink cartridges to use on their home PC to print
tutorial notes or multiple copies of assignments to submit; or a networked PC in a

Costs of Networked Learning
Bacsich et al. 5
open access laboratory being used by students for social email and Internet surfing
while students trying to do assignments are turned away.
1.3 Project overview
Chapter 2 describes our overall approach to the project during its various stages.
Chapter 3 covers our literature review. The information collected from the literature
considered was used to form a structured list of currently considered costs. The next
step was to allocate these identified costs in a structured way under headings, and then
as new costs become apparent they too were added to the structure. This chapter
therefore details the first iteration of the working model.
Chapter 4 reveals the conclusions of a sector-wide survey into the application of
Networked Learning and the related costs. The survey questioned the IT capability
and structure of the Institution, availability of student allocated machines, the
permeation of Networked Learning into the Institution’s teaching and learning and
how the costs of these activities were recorded, if at all.
The data collected from the survey also helped the team to decide which Institutions
to visit. These “Case Studies” are discussed in Chapter 5. Interviews were conducted
at seven Institutions - members of the Study Team met top-level management through
to course facilitators to discover what they perceive to be the Costs of Networked
Learning.
Chapter 6 outlines the results of a student-centred survey, analysed in conjunction
with a focus group meeting with the Student Union Executive Committee at Sheffield
Hallam University and the 1996 National Union of Students study on “Hidden Course
Costs”. This was not foreseen in the early study plans but was embarked upon when it
became clear that student views were very important and were not in our view being
adequately represented via Universities’ management. A similar study is needed
which concentrates specifically on staff-related Hidden Costs but it was felt this was
beyond the resources of the team within the project time scale.
Chapter 7 returns to the provisional model outlined at the end of Chapter 3 and
documents the evolution of the model in light of the further research and consultation
undertaken by the Study Team. This chapter animates the use of the model using
worked examples.
Chapter 8 presents the analysis of existing models for costing innovative learning
systems and illustrates how these methodologies, including the 1997 KPMG work and
the more recent Flashlight economic model, were mapped onto our model, thus
producing the Activity Based Costing approach adopted by the team for the Financial
Schema.
Chapter 9 concludes the main body of the report with the Planning Document. This is
based on recent “investment appraisal” work from HEFCE (1999) but rewritten in the
language of course planning. This chapter ends with a brief illustration of how the
Planning Document and Financial Schema work in tandem as the Planning
Framework.
“The classic report on costs of e-learning, online learning and distance learning”
Bacsich et al. 6
Chapter 10 covers dissemination, including a brief report on the conference “The
Business Case for Online Learning” and the Study Team’s plans for conference
presentations during the remainder of 1999. The project Web site and forthcoming
dissemination activities are also detailed here.
Chapter 11 outlines the project management approach, including how the Study Team
surmounted problems, and the results of Advisory Group meetings.
Chapter 12 details the conclusions and recommendations, both for the project and in a
wider context.
The main report is followed by a list of key references used in the text of the report,
and a small number of Appendices.
There are planned to be three separate publicly available Annexes available on request
from late Autumn 1999 onwards:
a Hidden Costs Encyclopaedia
full Versions of the Seven Case Study Reports
the Planning Document and Financial Schema with worked examples.
1.4 Project financing
The project was funded by the Committee for Awareness, Liaison and Training
(CALT) of the Joint Information Systems Committee (JISC), now known as JCALT,
of the UK Higher Education and Research Funding Councils. Funding was for a six-
month period ending in July 1999. Additional support was provided by the Sheffield
Hallam University Virtual Campus Programme and the School of Computing and
Management Sciences.
Costs of Networked Learning
Bacsich et al. 7
2. Methodology
“…research methodology aims to ensure that knowledge progresses.”
Laurillard (1993).
2.1 Introduction
This study aims to accurately document the costs of Networked Learning for the
benefit of policy makers, course providers and students. The study has two main
objectives:
to document the overall cost factors, with special reference to unrecorded or
Hidden Costs
to incorporate the cost analyses within a general planning framework which
permits an estimate of the actual costs of different approaches to Networked
Learning.
The methodology used in this study was varied. It began with a detailed literature
review, continuing throughout the project. This was followed by a Sectoral Survey to
the 173 UK Higher Education Institutions, to establish their approach to developing
materials, dissemination and recording costs. After this the study narrowed to focus
in-depth on seven Case Study Institutions to allow for a more precise level of
information to be extracted.
Initial investigations revealed that many of the Hidden Costs of Networked Learning
were being absorbed by students. To address this issue a focus group activity was set
up between members of the Study Team and the Executive Committee at the Sheffield
Hallam University Union of Students. This was followed by an extensive
questionnaire to students at the University.
Consultation with experts formed a major part of this study. These discussions were
ongoing, but focused specifically on the Experts Workshop, held at Sheffield Hallam
University in April 1999, and the Flexible Learning on the Information
SuperHighway conference (FLISH99) held at the University in May 1999.
2.2 Literature review
The literature search and review constituted an important element of this project. The
search aimed to build a resource base of previous writings on the subject from which
methodologies, cost categories and approaches could be extracted and used to guide
the team towards producing a schema to determine the Costs of Networked Learning.
Resources were identified using a number of different methods which varied in their
effectiveness. At first, searches were undertaken, using defined keywords, of both the
University OPAC system and resident electronic catalogues. To widen the
investigation, a series of Internet searches took place using a variety of search engines
but the same set of keywords. The International Centre for Distance Learning at the
Open University was also visited and a large number of sources gathered. Using the
bibliographies provided by the initial sources, a number of further references were
identified. Various conference proceedings were also collected where papers claiming

“The classic report on costs of e-learning, online learning and distance learning”
Bacsich et al. 8
to be about costs were presented. Through this extensive process, a large number of
possible sources were revealed, but many were not followed up due to the short time
span of this project. The main difficulty encountered during this exercise was one of
deciding which sources were relevant, worthwhile, or academically sound, and those
which were not. Therefore the data was prioritised through the presence of keywords
and the authority of the author.
In total, 110 sources from books, journals, conference proceedings, previous project
reports, unpublished material and Web sites were selected. Each source was
summarised and reviewed and its review entered into an MS Access database which
also contains all the bibliographic information. Each review paid particular attention
to the models currently suggested for planning and costing innovative learning
systems and whether the author mentions the subject of Hidden Costs.
2.3 Sectoral survey
The aim of the Sectoral Survey was firstly to establish a representative view of the
approach to and extent of Networked Learning activity in the UK Higher Education
sector and secondly to assess how the costs of these activities are recorded, if at all.
The list of Institutions was taken from the Higher Education Statistics Agency Web
site at http://www.hesa.ac.uk. These numbered 173 in total, a mixture of traditional
and new universities, and university colleges.
The survey was written within the first few weeks of the study and was based on work
in progress. The team consulted a number of stakeholders to ensure the validity and
clarity of the survey: these included the Sheffield Hallam University Virtual Campus
Team, which comprises staff from several academic disciplines and Institutional
support services. The survey was addressed to the Vice-Chancellor or equivalent at
each Institution with a request for it to be passed on to whoever would be most
appropriate to complete it. The Study Team recognised that each Institution has a
different structure and therefore it would be difficult, if not impossible, to identify the
most appropriate person externally; by addressing the letter to the Vice-Chancellor or
equivalent, the team not only had more of a chance of reaching the right person but
also raised the profile of the project. The accompanying letter also contained a full
definition of Networked Learning and a description of what the study hoped to
achieve.
Due to time pressures, the team commissioned a third party to lay out, post and collate
the results of the survey. The data was then checked by our own team and analysed
with further figures taken from the Universities and Colleges Information Systems
Association (UCISA) Statistical Returns, plus Noble’s Higher Education Financial
Yearbook. It should be kept in mind that with self-completion questionnaires a margin
of error is always possible due to respondents misinterpreting questions or
instructions, or the data sources not being individually reliable or consistent across the
sample group. In this instance two returns were discounted due to the inconsistency of
data given and the misinterpretation of questions.
Costs of Networked Learning
Bacsich et al. 9
2.4 Student questionnaire
The objective of the student questionnaire was to investigate student views about the
Costs of Networked Learning. Early research showed that student activities were little
documented; this included their attitude towards Networked Learning and the
associated costs. Our research also identified the existing view held by some that costs
are being passed onto the students; indeed the 1996 NUS survey found that students
were paying an average of £571 per year towards their education costs that had not
been made apparent to them at the beginning of their courses.
Initially the Study Team met with the Executive Committee at Sheffield Hallam
University Union of Students to discuss issues such as computer ownership, the
introduction of Networked Learning to some courses and what students perceived as
the greatest cost of this modified learning paradigm. The Committee believed that
students should be approached directly to express their views on these issues and
offered to post a questionnaire to all registered course representatives (450 in total).
To extend this sample group, as the expected response rate from students was quite
low due to end of year deadlines and examinations, the team produced a further 300
surveys which were placed in School offices for students to pick up at random. This
maintained the cross-section of student profiles, with the opportunity of entry into a
Prize Draw used to encourage response.
As with the Sectoral Survey, this self-completion questionnaire should be treated with
a degree of caution but in this instance only one return was disallowed due to the
inconsistency of the answers. Students did have the option of remaining anonymous
but email addresses were a prerequisite for entry into the Prize Draw.
2.5 Case Study reports
The Institutions chosen for this exercise were selected to represent the Higher
Education sector. Therefore Oxford, Cambridge and the Open University were
discounted as atypical. Of those who returned a questionnaire, six Institutions were
selected to fulfil the following criteria:
representative of all countries in the United Kingdom
representative of both traditional and new Universities
at various stages of Networked Learning development.
The seventh Institution was Sheffield Hallam University.
Each Institution was approached with a letter to the Vice-Chancellor, which was
copied to the staff member who had completed the questionnaire, thanking them for
their response and asking if they would be willing to participate in the next stage of
the project, additionally indicating which people we would like to see should they be
agreeable. Once assent was given, the Study Team arranged to meet a range of staff,
from Pro-Vice Chancellors to working academics, over a two or three day period.
Only one Institution declined and a suitable substitute was soon found.
In preparation for the field trips, the Study Team compiled a profile of each Institution
from publicly available reports and the Institutional Web site. A series of 44 interview
questions was prepared for the visits.
“The classic report on costs of e-learning, online learning and distance learning”
Bacsich et al. 10
This was done by identifying the main areas of enquiry, namely: Networked Learning,
Costs, Activities, Issues, and the Model. In advance of the visits, individual
Institutions received a briefing pack for each staff member to be interviewed this
included a copy of the Interim Report of the project, the question guide, and a
provisional model for tracking the costs of Networked Learning.
The first iteration of the Case Study reports involved writing up the interview notes
under each of the original questions. The first page of each report was a description of
the Institution and who the team saw. All positions, figures and titles were generalised
to maintain anonymity. These draft Case Study reports were edited internally for
consistency and then sent to the Institutions for comment and approval. After only
minor alterations they were accepted and now appear in full as an annex.
2.6 Consultation
Consultation during this project has been far reaching - the team are now in contact
world wide with most of the current projects and experts in this field. This ability to
exchange thoughts and information has meant that a large proportion of work has
been successfully completed in a short space of time.
During the project, one formal - and a number of informal - Advisory Group meetings
took place with the CALT nominated representatives, Jonathan Darby and Robin
Mason. These discussions were always informative and worthwhile.
Additional consultation was invited at a one-day workshop that five experts (some
from education and others from finance) from Higher Education and Industry
attended. The workshop was held to assess the progress of the project and provide a
critical review of the findings. Experts engaged productively with the Study Team on
issues relating to scope, accounting methodology, the opportunity cost of staff and
student time, and proposed revisions to the working model.
A considerable amount of first-hand information and opinion was gathered at the
Flexible Learning on the Information SuperHighway conference (FLISH99), held at
the University in May 1999 on “The Business Case for Online Learning”. A detailed
report of this event and its impact on the project can be found in Appendix 4.

Costs of Networked Learning
Bacsich et al. 11
3. Literature Review
“Most educational technology introduced over the past 50 years has
supplemented and often enhanced - but not supplanted - traditional
classroom instruction, thus adding to its cost, not reducing it.”
The College Board (1999)
3.1 Introduction
In 110 sources reviewed by the Study Team, explicit use of the term “hidden cost” or
“intangible cost” was confined to only a handful of references, including Tonks and
Long (1989); Hermann et al (1991); Robertshaw (1993); Beaton (1995); Canale and
Wills (1995); Temple (1995); Moonen (1997); HEFCE (1997); Alexander et al
(1998); Bates (1998); CRE (1998); Delinger et al (in press); and Oliver et al (1999).
Additionally there was reference, by implication, in the works of: Orivel (1987),
Rumble (1989), Yenbamrung (1993), Massy and Zemsky (1995), Thomas et al
(1998), Draper and Foubister (1998), and Mardell (1998).
Several more general studies have also been consulted to widen the understanding of
the difficulties in accurately costing educational technologies. Rumble (1997 and
1999) incorporates several years worth of work on costing open and distance learning.
Likewise Bates (1995) has examined the costs of various media over a number of
years. Case studies from Australia (NBEET, 1994 and Alexander et al, 1998), North
America (Arizona Learning Systems, 1998) and Canada (Bates, 1998) provided an
important international perspective.
The review of these sources has been organised in this chapter around a number of
themes. To begin with, there is a discussion inspired by the literature centred on the
costs to each of the major stakeholders in Higher Education - the Institution, Staff and
Students - as identified by Alexander et al (1998). This is followed by a brief
illustration of the working model, arrived at through the literature analysis.
Previous studies examining the costing of Higher Education in the UK - together with
a number of financial models developed for costing innovative learning systems - are
analysed later in this report, where they are used as reference points to outline a
methodology for costing Networked Learning (see Chapter 7).
3.2 Costs to stakeholders
In an Australian study of the costs and benefits of information technologies in
learning and teaching the authors identified multiple stakeholders who, “... are
affected by the development and use of information technologies: students, staff,
departments, Institutions and society itself.” Further, the authors argued, “Each of
these can be said to incur a cost, as well as potentially receiving benefits” (Alexander
et al, 1998).
Using this approach (the team regards departments as part of Institutions and society
to extend beyond the scope of this study) the literature is reviewed here under three
sections: costs to the Institution, Staff and Students.

“The classic report on costs of e-learning, online learning and distance learning”
Bacsich et al. 12
3.2.1 Institutional costs
Palfreyman (1991) could have been referring to Networked Learning when he said the
costing of a project “is rarely a matter of simple and mechanistic accounting”.
The 1997 Information Technology Assisted Teaching and Learning (ITATL) report
concluded that there were no robust mechanisms for determining the costs of
developing courses and related delivery costs (HEFCE, 1997). This lack of data is due
to the difficulty Institutions have in identifying the total cost for Communications and
Information Technology (C&IT) and distinguishing the cost of C&IT-enhanced
teaching and learning in a networked environment (HEFCE, in press). Moreover, in
the UK Higher Education sector, budgets are devolved directly to academic
departments. Therefore without a centrally imposed recording methodology, which
operates at highly granular level, the centre will never be able to ascertain what is
being spent on Networked Learning.
One of the main expenses for Institutions embarking upon Web-based or other
electronic delivery courses is that of investment in infrastructure, such as IT-equipped
lecture theatres and computer laboratories (Alexander et al, 1998) and course
development. These start-up costs can amount to five years of a lecturer’s salary
(Arizona Learning Systems, 1998). These costs have to be amortised over a long
period of time or significant economies of scale reached to provide a shrewd
investment.
Another study highlights the need for increased technical support with regard to
online learning programmes (CRE, 1998). This is not only for academic staff during
the development stages but continuous assistance for both staff and students during
the delivery of the programme.
Although developments in Networked Learning should reduce the need for
Institutions to invest in property, Sefton (1998) warns of the considerable cost of
refurbishing rooms for Problem Based Learning tutorials. Institutions will save in
terms of space requirements if Networked Learning is offered to students wishing to
remain at home, but this reduction in the requirement for buildings must be supported
by serious financial investment in secure and reliable networks. A study by the
Association of European Universities noted, “Another hidden cost overlooked until
now…. is that of down-time or the time when the computer network is failing and all
computer activity is interrupted” (CRE, 1998). This leaves the Institution with
unproductive staff and students.
An additional and often overlooked cost to any Institution encouraging Networked
Learning was identified by the ITATL study. Staff and students perceive Internet
charges via the Institutional server at zero cost. Whether ‘surfing’ is for work or
pleasure, Institutions pay these charges. Given present Institutional accounting
procedures, it is difficult to devolve these costs to individual programmes and they
therefore constitute a large hidden cost absorbed by the Institution.
The same study noted, “... many development costs are hidden, or are excluded from
direct calculation, and thus their true extent may not be traceable, under-budgeted, or
honoured only in the breach” (HEFCE, 1997). Development is a huge hidden cost in
Institutional terms: both the time of staff to develop resources and the additional
Costs of Networked Learning
Bacsich et al. 13
technical support and related training costs are generally not accounted for and so are
absorbed into existing budgets for staff development and academic planning.
3.2.2 Staff costs
Rumble (1997) points out the difficulty of assessing academic staff costs in an
environment where staff pay is not directly related to the time they spend working on
activities, and where their time can not be attributed to different activities. He notes
the dangers of assuming that staff will always put in long, unpaid-for hours - both in
terms of stress if they do and because of political changes in the acceptability of such
practices.
The long, unpaid hours of academic staff are not just prevalent in the UK. Kirkpatrick
and Jakupec reported that, “Most teaching staff [in Australia] are prepared to go ‘beyond
the call of duty’ but this can only be sustained up to a point. The current educational
environment where staff are facing heavier teaching loads, larger classes and increased
pressure to attract external funding and to publish challenges the commitment of most
professionals” (Kirkpatrick and Jakupec in Tait and Mills, 1999). Further to this, Dolton
(1994) studied the use of computing on academic courses in Higher Education. He
repeated a conclusion from a review by the Computers in Teaching Initiative, “… the
amount of human resources to mount software, write it, service courses, give courses and
teach computing to staff and students is huge and should not be underestimated.”
Increased student-to-tutor communication in online learning programmes is
extensively documented. Arizona Learning Systems (1998) report that faculty spend
more time communicating with students (from 30 minutes to 4 hours per student per
week) than they would have done for a traditional classroom lecture with associated
follow-up time.
In addition, Rumble (1999) feels that the biggest and the least costed aspect of on-line
learning is the cost of learner support. Tutors at the UK Open University consistently
suggest that they are spending more time supporting learners on-line than was the case
when they supported them through correspondence and telephone contact. Like
academic staff in other Higher Education Institutions, they are not being paid, or
recognised, for this increased workload.
The hidden cost of time invested by academic staff was noted by the Association of
European Universities in terms of: familiarisation with new technologies; integration
of computer-based learning materials in teaching; and the development of course
material for technology-enabled learning “which is not taken into account in cost
analyses” (CRE, 1998).
Meanwhile the ITATL study stated, “The significant quantities of time allocated by
academic and technical staff to ITATL development within Institutions were …
allocated a zero or minute cost value” by the Institution (HEFCE, 1997). Institutions
are encouraging academic staff to develop electronic learning materials to enhance
and extend the reach of their courses but are unwilling to relieve them of additional
teaching and departmental responsibilities, thus resulting in the ever lengthening
academic working day. In an Australian study of university IT projects (Alexander et
“The classic report on costs of e-learning, online learning and distance learning”
Bacsich et al. 14
al, 1998), nearly three-quarters of the projects reported that time for project
development was greater than expected.
The above report also noted that staff incurred a high personal cost “in terms of time,
resulting in a loss of research and personal time” (Alexander et al, 1998). This can
also be extended to include loss of tenure and promotion as well as increased work-
related stress and is often categorised as an opportunity cost (HEFCE, 1997).
Networked Learning is seen as carrying a price in terms of opportunities foregone in
other areas of activity, for both Institutions and for individual academic staff.
Tonks and Long (1989), in their study of the Hidden Costs of simulation software
concluded that: “timetable hours for staff and for students become a poor measure of
effort and of contact when using simulations”. This illustrates that even ten years ago
it was being noted that teaching hours were not an accurate measure of academic
workload when teaching material and communication with tutors was in an electronic
format.
In 1997, a study by management accountants KPMG and the Higher Education
Funding Councils noted the lack of a consistent, detailed and acceptable method of
recording staff time and effort and assigning it to different activities. The study
identified the ‘cultural’ difficulties in getting academic staff to accurately complete an
activity-based time sheet. Two years earlier, Temple (1995) found that employers
focussed on the direct costs of the training programmes and were “unaccustomed to
identifying the indirect costs that the project was encouraging them to do”.
Despite Tonks and Long’s statement of 1989 and the KPMG study of 1997, a realistic
and workable method of recording and then assigning staff time to activity has still
not been found. In the ‘Guide to Costing and Pricing in Higher Education’ the Joint
Costing and Pricing Steering Group states: “… in estimating the time spent by
academic staff on teaching, research and other direct activities, some HEIs use
workload models for planning and monitoring academic activities; some use estimates
of staff time prepared by programme managers or by staff themselves; others conduct
diary or timesheet exercises on either a one-off or a recurring basis” (JCPSG, 1999a).
3.2.3 Costs to students
A number of references are made in the literature about the transference of costs to
students with the development of electronic learning environments. According to the
report of the latest (US) Campus Computing study, significant numbers of students in
the USA are being charged separately for computing facilities - at an average cost of
$120 per year (Green, 1999).
Moonen states in Collis (1996) that to reduce costs in the long run some costs must be
shifted to students, who must also take more responsibility for their own study and
expect less personal contact with instructors. Similarly, O’Rourke, examining the
Canadian experience, comments, “ … shifts in responsibility for obtaining and paying
for access may not just be the outcome of a particular technology, but may represent a
fundamental shift in perspective” of who is responsible for the cost of education
(O’Rourke in Tait and Mills, 1999).
Costs of Networked Learning
Bacsich et al. 15
Rumble (1997) declares that a successful online learning community must eventually
rely on student ownership. The 1997 Dearing report proposed 100% student
ownership of personal computers by the year 2005/06 (NICHE, 1997) but as a
forthcoming HEFCE report points out, this transfers the costs-not only of purchase,
but also of maintenance, insurance and running costs to the student and does not
substantially reduce the cost of IT provision to the Institution (HEFCE, in press).
The National Union of Students conducted a survey of Hidden Course Costs in 1996.
Three years later this data was used in a consultation document about top-up fees. It
was found that students were being charged for: printing, photocopying, art materials,
year abroad costs, IT costs, laboratory equipment, studio levies, compulsory field
trips, hand outs, equipment hire and study packs (NUS, 1999). In over 80% of cases,
those students who were being charged extra course costs had not been informed of
such costs before entry to the Institution, despite Dearing stating that “students will
need information about the adequacy of an Institution’s provision of equipment for
their use and must know in advance of study what expectations there are of students
providing their own access” and therefore, implicitly, the associated costs (NICHE,
1997).
Notably, when Crabb (1990) developed a methodology for costing open learning, he
included a cost to the learner of fees, materials, incidental expenses (travel) and
equipment. The Australian study considered it important to value student time, the
cost to students of the time they spend on education-related activities, i.e., time spent
learning, travelling, seeking resources, etc. (Alexander et al, 1998).
3.2.4 Conclusion
The relative scarcity of literature specifically relating to Hidden Costs is clear from
the above. However, the literature does outline a number of Hidden Cost issues
relating to all three stakeholder groups.
Institutional Hidden Costs are mainly related to those which are absorbed under
different budgets. Therefore, with a suitable accounting methodology these should
become apparent, and activities, such as Networked Learning, could then be
successfully costed on an individual basis.
In addition, Institutions must find a suitable method for dealing with staff-related
Hidden Costs. Some of these fall into the above category but others, such as overtime,
increased work loads and additional training needs, are currently overlooked by
Institutions and therefore, in most cases, the cost is borne by the individual and
remain unrecorded.
The other major area of Hidden Costs concerns the growing price students are paying
for education in a previously free system. The cost of technology is being passed onto
students, directly in the USA and (so far), less so, in the UK (Harvey et al., 1998, in
Delinger et al., 1999). Students however appear unaware of the potential savings and
possible increased benefits of learning with technology, such as reduced travel
expenses and more productive use of their time (Delinger et al., 1999).
“The classic report on costs of e-learning, online learning and distance learning”
Bacsich et al. 16
A report by the Association of European Universities giving guidance to universities
on the strategy for incorporating new technologies suggests, “The integration of …
Hidden Costs could make for a more accurate assessment of cost-effectiveness”
(CRE, 1998).
Peebles (1997) regarded as most significant the decision at Indiana University to
institute a form of Activity Based Costing (ABC). This allows the derivation of a
notion of “unit costs” for the delivery of services. Rumble (1997) also advocates
Activity Based Costing. With no Activity Based Costing mechanism in place, there is
ignorance of the unit of costs for various transactions, ignorance of the value-added of
each transaction, ignorance of the impact of cost reduction efforts, ignorance of how
to respond to fall/growth in student numbers, and transaction costs cannot be attached
to individual/different kinds of students.
Oberlin (1996) notes that at present the demand for, and costs of, Networked Learning
are rising, but in the future Institutions can expect “solutions that support future cost
avoidance rather than actual cost reduction”. So whilst current investment is high,
future results should be measured against cost savings and increased benefits. It is the
informed inclusion of all costs that is required to assess the cost-effectiveness of
Networked Learning.
3.3 Lifecycle - development of a model
During the literature review process each cost category or cost item mentioned was
extracted and a list of such terms constructed. A report was also written analysing
currently available models which attempted to provide a framework or methodology
for recording the costs of technology-enhanced learning systems. On the basis of the
abstract list of costs and the report on current models, the team met with academics
from the University to develop a working model to be tested during the research
stages of the project, and then finalised as the basis for the Planning Document and
Financial Schema.
Almost 100 cost categories and items were identified at the half-way stage of
reviewing the literature. These will appear later as an Annex to this Report.
A short report was complied to analyse the currently available models for costing
educational practice. The team had already discussed at length the inappropriateness
of traditional financial management accounting procedures, which are not suited to
exposing the Hidden Costs of Networked Learning. A number of experts in the field
of costing open and distance learning have proposed frameworks under which costs
can be categorised.
1. Rumble (1989) believes costs can be classified by type as: human resource costs;
costs of developing, producing and delivering; capital equipment costs;
consumables and expenses; and space and accommodation costs.
2. Moonen (1997) summarises costs as: personnel costs; equipment costs; facilities
costs; material costs and other costs, calculated in a ‘costs per activity phase’
breakdown of a) development phase, and b) delivery, operation and maintenance
phase.
Costs of Networked Learning
Bacsich et al. 17
3. Cukier (1997) follows a similar vein by categorising the costs of educational
technology as: human resources; general administration; development; production
and delivery; capital equipment and start-up; consumables and expenses and space
and accommodation.
4. Orivel (1987) states that the most common classifications of costs associated with
educational media are: administration costs; production costs; diffusion costs; and
reception centres.
5. Crabb (1990) used headings of: human resources; premises-related costs;
equipment; consumables and expenses; central resources; and overheads; in the
two stages of development and delivery costs.
There appears to be a general consensus about what cost categories should be used, if
not about their terminology. If one were to combine all five of the above models it
would look something like this:
Human Resource Costs
Production and Delivery Costs
Development Costs
Equipment Costs
Consumable Costs
Facilities Costs
Administration Costs.
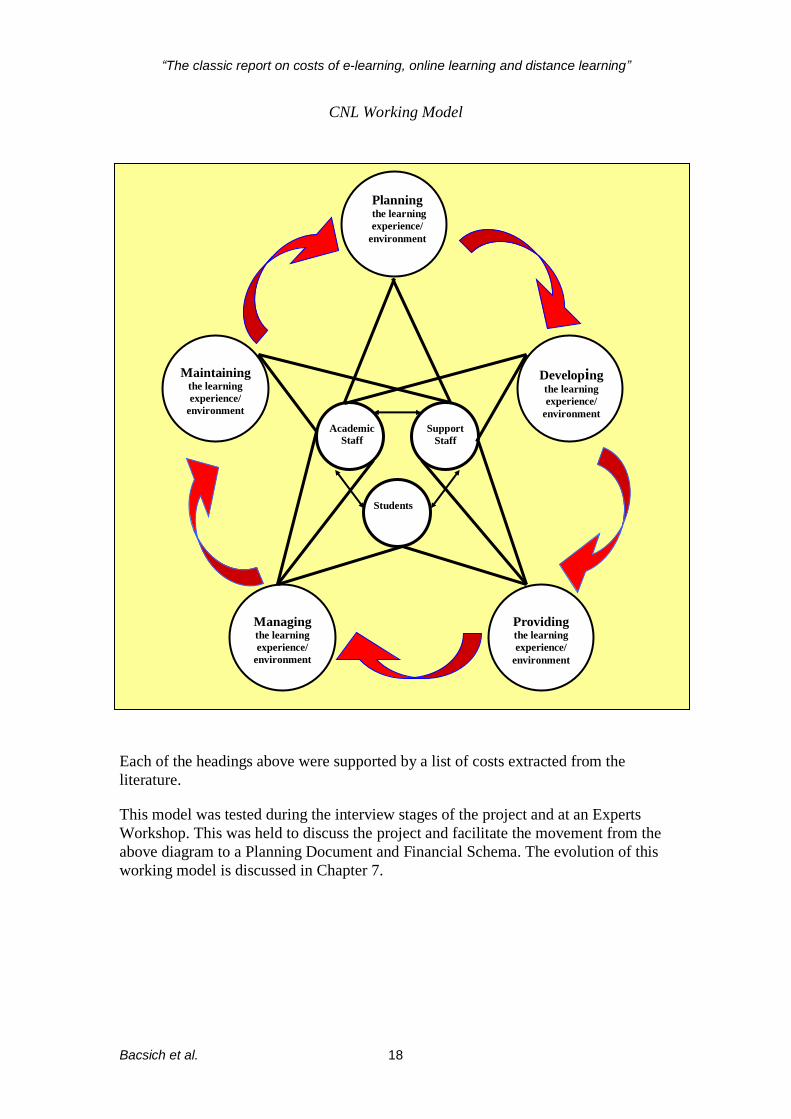
The team held a series of short consultative meetings with a number of academics
about the lifecycle of course development and delivery, then proposed a three-unit
human resource model of academic staff, support staff and students and a five-phase
cyclic model which encompassed providing both the learning experience and the
learning environment. The model aimed to show the relationship between people and
activities and therefore expose possible areas of Hidden Costs.
“The classic report on costs of e-learning, online learning and distance learning”
Bacsich et al. 18
CNL Working Model
Each of the headings above were supported by a list of costs extracted from the
literature.
This model was tested during the interview stages of the project and at an Experts
Workshop. This was held to discuss the project and facilitate the movement from the
above diagram to a Planning Document and Financial Schema. The evolution of this
working model is discussed in Chapter 7.
Planning the learning
experience/
environment
Maintaining the learning
experience/
environment
Developing the learning
experience/
environment
Managing the learning
experience/
environment
Providing the learning
experience/
environment
Academic
Staff
Support
Staff
Students

Costs of Networked Learning
Bacsich et al. 19
4. Sectoral Survey Analysis
“Although cost of equipment, maintenance and replacement costs are, in
principle, relatively easily identified, Institutions were not generally able to
provide accurate figures on infrastructure and access costs, nor any of the
less tangible cost concepts...”
HEFCE (1997)
4.1 Introduction
This postal survey aimed to establish the current extent of Networked Learning within
the UK Higher Education sector. The questionnaire was sent to each Institution
detailed on the Higher Education Statistics Agency Web site, http://www.hesa.ac.uk.
It questioned the provision of computing facilities, the permeation of Networked
Learning activities and how the costs of these activities were recorded, if at all.
The analysis of the Sectoral Survey is separated into quantitative and qualitative
sections. The qualitative section separately addresses both recorded and unrecorded
costs, with all analysis stemming from respondents’ comments regarding their
personal perception of recorded and Hidden Costs with respect to their own
Institution.
As with all self-completion questionnaires, it is necessary to treat the results with
some caution. Responses are treated as being representative of Institutions. However,
it must be remembered that questionnaires were completed by individuals within
Institutions and that - especially with qualitative data - responses may not match
views held by other members of the same Institution or the general Institutional
viewpoint. Personal bias - however accidental - is almost inevitable within such
surveys. Respondents may inadvertently provide false answers through
misinterpretation of questions or by failing to follow instructions verbatim. Despite
these limitations it is nevertheless possible to draw some tentative conclusions based
upon the responses provided.
The graphs in the first section of this chapter are ordered from left to right according
to student Full Time Equivalent (FTE) figures taken from the Noble Higher Education
Financial Yearbook (1999), therefore on all graphs Institutions with small student
populations are shown on the left rising to those with large student populations on the
right. No Institution is mentioned by name to maintain anonymity. Not all Institutions
who returned the survey are included on each graph as some did not provide answers
to individual questions.
4.1.1 Response rate
The timing and subject matter of this questionnaire appear fitting to the Higher
Education sector at this time, as the high response rate indicates. A total of 104 valid
questionnaires were returned from an Institution population of 173, giving a response
rate just exceeding 60%. This in itself might be viewed as being indicative of a high
interest in the Costs of Networked Learning throughout the UK Higher Education
sector.
“The classic report on costs of e-learning, online learning and distance learning”
Bacsich et al. 20
4.2 Quantitative analysis of Sectoral Survey
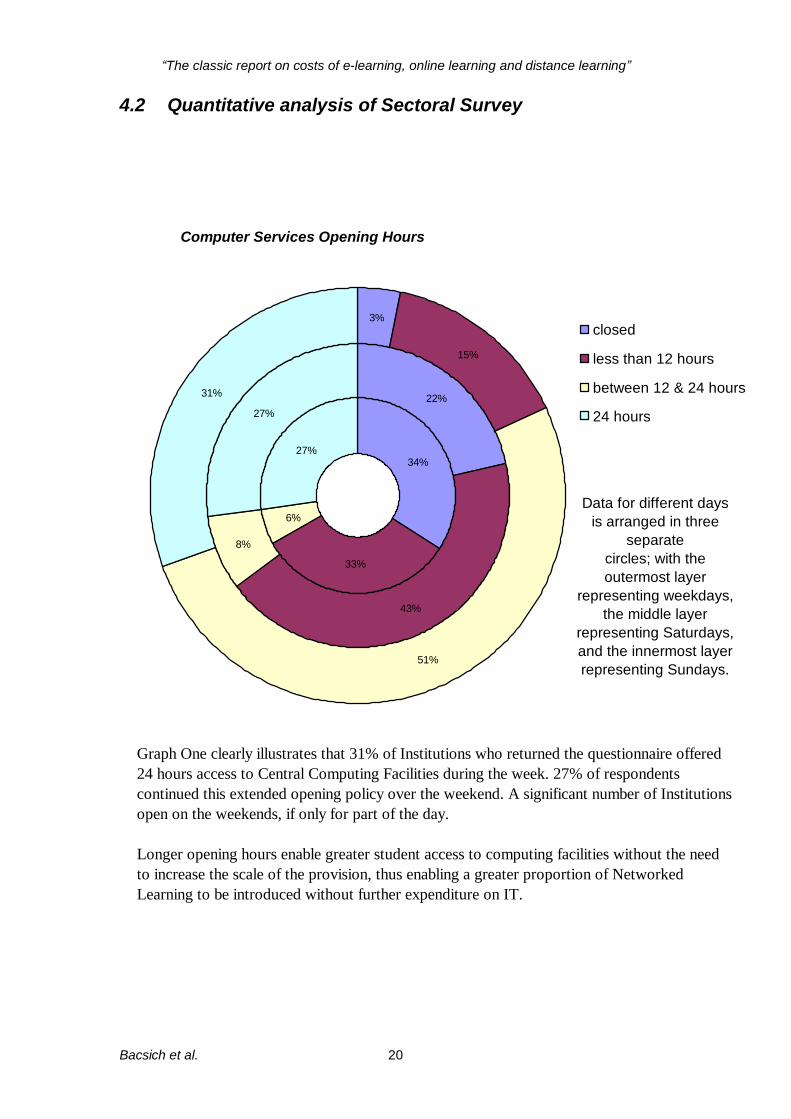
Computer Services Opening Hours
34%
33%
6%
27%
22%
43%
8%
27%
3%
15%
51%
31%
closed
less than 12 hours
between 12 & 24 hours
24 hours
Data for different days
is arranged in three
separate
circles; with the
outermost layer
representing weekdays,
the middle layer
representing Saturdays,
and the innermost layer
representing Sundays.
Graph One clearly illustrates that 31% of Institutions who returned the questionnaire offered
24 hours access to Central Computing Facilities during the week. 27% of respondents
continued this extended opening policy over the weekend. A significant number of Institutions
open on the weekends, if only for part of the day.
Longer opening hours enable greater student access to computing facilities without the need
to increase the scale of the provision, thus enabling a greater proportion of Networked
Learning to be introduced without further expenditure on IT.
Costs of Networked Learning
Bacsich et al. 21
0 10 20 30 40 50 60 70
1:1
2:1
3:1
4:1
5:1
6:1
7:1
8:1
9:1
10:1
11:1 - 14:1
15:1 - 19:1
20:1 - 50:1
Rati
o o
f S
taff
/Stu
den
ts t
o C
om
pu
ters
Number of Institutions
Students
Staff
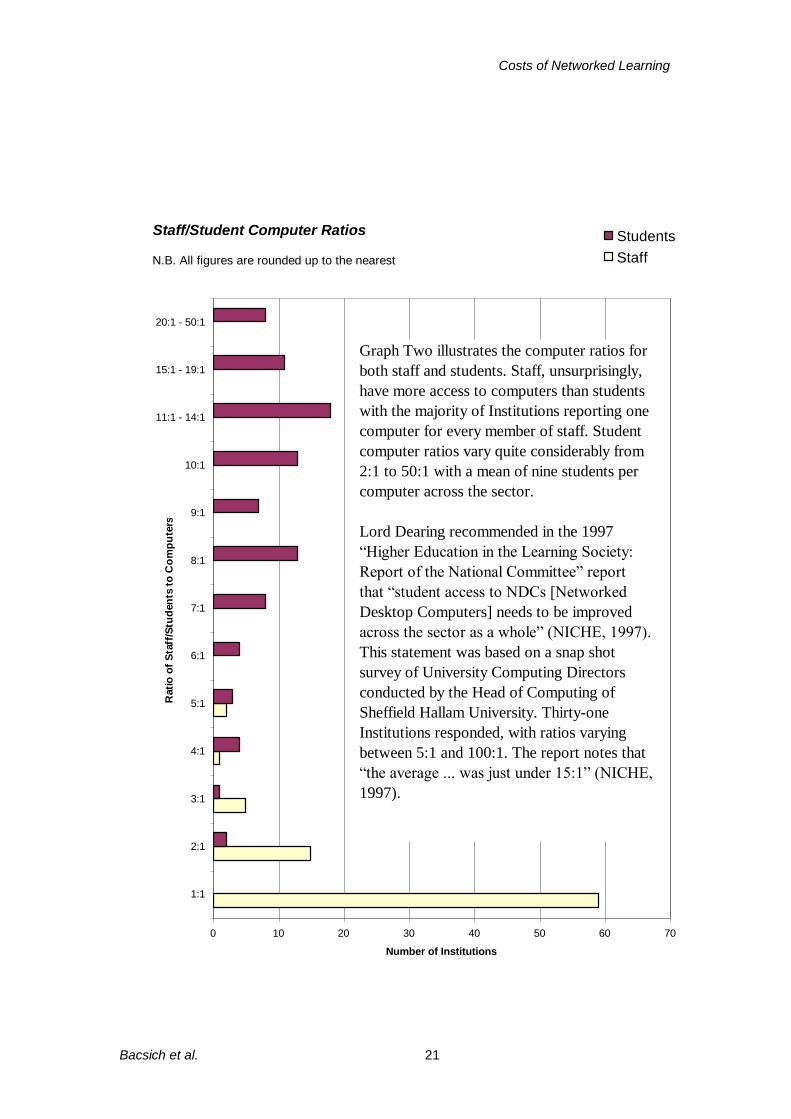
Staff/Student Computer Ratios
Graph Two illustrates the computer ratios for
both staff and students. Staff, unsurprisingly,
have more access to computers than students
with the majority of Institutions reporting one
computer for every member of staff. Student
computer ratios vary quite considerably from
2:1 to 50:1 with a mean of nine students per
computer across the sector.
Lord Dearing recommended in the 1997
“Higher Education in the Learning Society:
Report of the National Committee” report
that “student access to NDCs [Networked
Desktop Computers] needs to be improved
across the sector as a whole” (NICHE, 1997).
This statement was based on a snap shot
survey of University Computing Directors
conducted by the Head of Computing of
Sheffield Hallam University. Thirty-one
Institutions responded, with ratios varying
between 5:1 and 100:1. The report notes that
“the average ... was just under 15:1” (NICHE,
1997).
N.B. All figures are rounded up to the nearest
“The classic report on costs of e-learning, online learning and distance learning”
Bacsich et al. 22
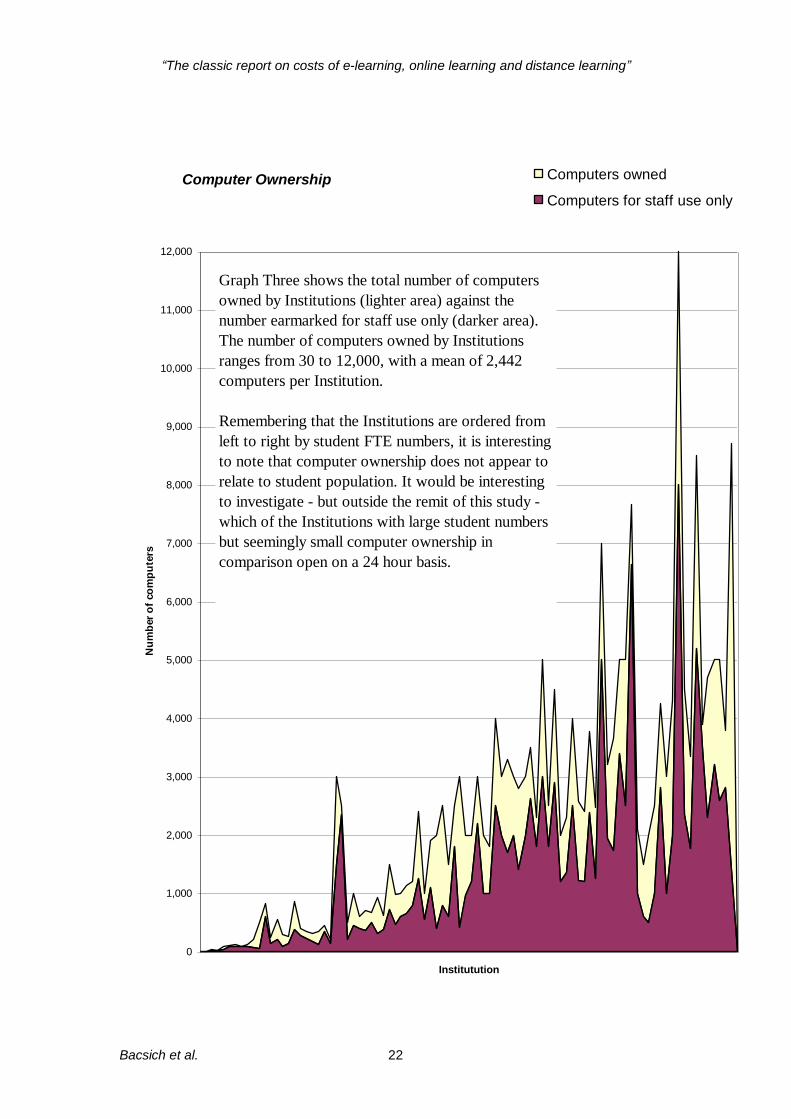
Computer Ownership
0
1,000
2,000
3,000
4,000
5,000
6,000
7,000
8,000
9,000
10,000
11,000
12,000
Institutution
Nu
mb
er
of
co
mp
ute
rs
Computers owned
Computers for staff use only
Graph Three shows the total number of computers
owned by Institutions (lighter area) against the
number earmarked for staff use only (darker area).
The number of computers owned by Institutions
ranges from 30 to 12,000, with a mean of 2,442
computers per Institution.
Remembering that the Institutions are ordered from
left to right by student FTE numbers, it is interesting
to note that computer ownership does not appear to
relate to student population. It would be interesting
to investigate - but outside the remit of this study -
which of the Institutions with large student numbers
but seemingly small computer ownership in
comparison open on a 24 hour basis.
Costs of Networked Learning
Bacsich et al. 23
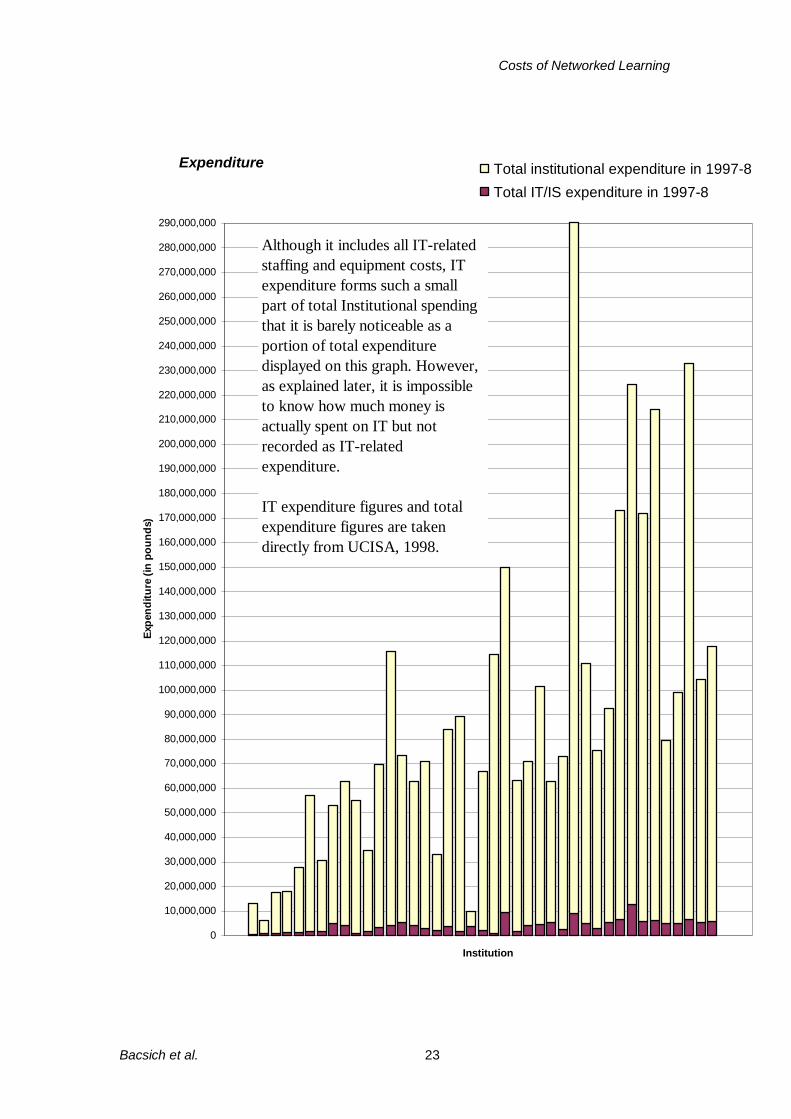
Expenditure
0
10,000,000
20,000,000
30,000,000
40,000,000
50,000,000
60,000,000
70,000,000
80,000,000
90,000,000
100,000,000
110,000,000
120,000,000
130,000,000
140,000,000
150,000,000
160,000,000
170,000,000
180,000,000
190,000,000
200,000,000
210,000,000
220,000,000
230,000,000
240,000,000
250,000,000
260,000,000
270,000,000
280,000,000
290,000,000
Institution
Exp
en
dit
ure
(in
po
un
ds)
Total institutional expenditure in 1997-8
Total IT/IS expenditure in 1997-8
Although it includes all IT-related
staffing and equipment costs, IT
expenditure forms such a small
part of total Institutional spending
that it is barely noticeable as a
portion of total expenditure
displayed on this graph. However,
as explained later, it is impossible
to know how much money is
actually spent on IT but not
recorded as IT-related
expenditure.
IT expenditure figures and total
expenditure figures are taken
directly from UCISA, 1998.
“The classic report on costs of e-learning, online learning and distance learning”
Bacsich et al. 24
4.3 Qualitative analysis of Sectoral Survey
Questions 17 and 19, within the questionnaire, asked for qualitative rather than
quantitative information about recorded and unrecorded costs respectively. Answers
provided to these questions plus analysis of any additional comments made are
discussed below.
As previously mentioned, it is necessary to treat qualitative results with special
caution because all qualitative comments are intrinsically subjective. Nevertheless, a
great deal can be gleaned from their analysis.
4.3.1 Recorded costs
Only two Institutions make any claims about being organised in terms of costing: “Ah
- this is entirely co-ordinated and budgeted actually” and; “costs of all university
computing services is known” followed by “no attempt is made to cost…[sic]”. Many
comments are fairly vague; indicating that even where costing is considered, costs
have not been thoroughly recorded. It is also apparent, from the huge diversity of
reactions towards costing issues, that there is no generally accepted approach towards
what should be included, where costing should take place, or even if specific (as
opposed to general) costing is necessary.
Before we look at what was recorded and how it was recorded, it is useful to see what
was not recorded. 12 Institutions reported that the costs of Networked Learning
activities are not recorded. A further eight Institutions revealed that only some costs
are recorded, indicating that these costs are known about but not acted upon. 26
Institutions did not provide any answer to this question. Such responses (or lack of
them) highlight the imprecision currently adopted towards detailing specific costs.
Some Institutions report that they are not yet tracking costs but are considering or
moving towards costing. Stated otherwise, costing is not yet considered imperative
but is viewed as being something worth doing at a future date. Other Institutions
highlight the variety of costs and the consequent difficulty of cataloguing individual
costs. This issue of categorisation is at the core of all costing problems. Everyone
knows costs exist, they just don’t know how to identify them. And because they do
not know which costs they are recording, they do not know what costs go unrecorded
(for further analysis of Hidden Costs, see below).
Cost categorisation is a problem of defining what costs to record and where to record
them. Different Institutions - and even different departments and faculties within the
same Institution - are currently recording costs in many different ways. This makes it
impossible to compare like with like. Due to the tremendous overlap between costs,
this problem is presently proving difficult to solve. This overlap is revealed in the
responses relating to recorded costs.
Very few Institutions specifically record Networked Learning costs. The majority of
Institutions indicate that Networked Learning costs are not differentiated from other
costs but are ‘subsumed’ within other areas and therefore recorded elsewhere. Those
Institutions adopting a centralised approach include Networked Learning costs either
within a central Institutional budget, or within a central IT budget. Those Institutions
adopting a devolved approach include Networked Learning costs within budgets for
Costs of Networked Learning
Bacsich et al. 25
individual units/departments/schools, or sometimes within budgets for individual
projects, activities or initiatives.
In recording costs centrally, Institutions are adopting a general, overall approach
towards costing. This is highly problematic for defining the Hidden Costs. For
example, recording total staffing costs (or total IT staffing costs) centrally prevents
any estimation of how much staff time should be attributed to Networked Learning. A
more positive approach, in terms of costing Networked Learning, is a devolved
method allowing Activity Based Costing (ABC) to be introduced. Although neither
central nor devolved budgeting tends to include Networked Learning at the moment,
Hidden Costs could far more easily be identified using an ABC approach.
We now turn from where costs are recorded to the similar question of what costs are
recorded. Staffing costs, especially in the role of support, receive frequent mention.
Equipment also receives much attention. However, both these broad categories remain
very vaguely defined. For example, different Institutions adopt different equipment
costing categories: one Institution divides hardware costs into infrastructure and
delivery platform; another records the costs of network usage and computer provision;
whereas another divides equipment costs into capital and recurring costs. Other
Institutions combined staff and equipment costs in the figure given on the survey
return. Although there seems to be little consensus presently over what costs are
specifically recorded, a greater degree of precision would obviously be beneficial to
identifying the Hidden Costs.
4.3.2 Unrecorded costs
Because they are not properly categorised, costs may easily be overlooked and
therefore remain hidden. Institutions display only a vague awareness of these hidden,
or unrecorded costs. Answers to the question of whether important costs remain
unrecorded range from, “Yes, lots” to, “Not really applicable - not recorded anyway.”
The first reply is of interest because it acknowledges that a costing problem exists but
does not offer any clues as to how this problem might be solved. The second response
fails even to acknowledge that Hidden Costs are of any relevance: by failing to
perceive that there is a problem, the chances of overcoming this obstacle are made
insurmountable.
The majority of respondents provide examples of important but unrecorded costs.
Analyses of these comments are grouped together below. Other more general costing
issues mentioned in survey responses, not specifically related to Networked Learning,
are not included here.
As with recorded costs, there is huge emphasis upon staff costs, with respondents
highlighting academic staff costs above all other Hidden Costs. Time spent providing
support- mainly technical support - to students also receives frequent mention. The
provision of security staff also tends to remain a hidden cost. This issue is most
crucial to Institutions keeping computing facilities open for 24 hours. It is interesting
to note that longer opening hours are not commented on in terms of extra costs
involved, neither as a recorded nor as an unrecorded cost.

“The classic report on costs of e-learning, online learning and distance learning”
Bacsich et al. 26
Costs arising from the development and modification of technology-based learning
materials are sometimes recorded; at other times, the extra effort (and time) required
of staff to produce this material is not recorded at all.
Other important but hidden support staff costs include counselling, extra laboratory
support and site visits. The unstructured nature of such support (in person and by
telephone) is obviously difficult to record accurately. This issue is further complicated
by the constantly changing nature of IT, requiring academic (and other) staff to
undergo constant awareness raising and skill development. Regardless of any ensuing
benefits, staff time devoted to these activities is not recorded separately and is
therefore definitely a hidden cost (though possibly also a hidden benefit).
It is important to stress here that although staff development activities generally take
place during the working day and therefore staff are paid for their time spent on the
course, the opportunity cost of their time is significant and more often than not staff
make up for lost work during their own time (which is not paid for). An opportunity
cost is also incurred by Institutions paying high wages to teaching staff for time spent
training other staff. Whether this opportunity cost is offset by resultant benefits
remains to be seen. The difficulties surrounding the calculation of these and other
hidden staff costs such as movement (internal and external), course reorganisation and
short-term contracts should be obvious. And even if cost categories could be agreed
upon, there will be constant need for revision as advances in technology necessitate
new categories in which to record costs.
Those Institutions that commented on connection costs (for Internet access) all stated
that connection costs are not recorded separately, either in terms of connection and
dial-up time, or in terms of line rental/fee. It is therefore impossible to distinguish
connection costs incurred through Networked Learning from more general connection
costs.
Unforeseen costs such as those associated with Year 2000 compliance are generally
not recorded. Depreciation of equipment tends also to remain individually
uncalculated. Time lost in unscheduled glitches, whereby systems or resources may
become unavailable - such as the failure of the network or any delays incurred
accessing networked information - remain unrecorded; similarly, no record is kept of
the time lost through the use of unproductive, out-of-date equipment. So the costs of
new investments (plus subsequent benefits) are not fully recorded and neither are the
future costs of not investing. It is therefore hard to compare the costs and benefits of
investing with the consequences of failing to invest.
Student time and equipment costs are listed as being “hidden” in several responses.
The student reaction to this issue is explored elsewhere in this report (see Chapter 6).
It is important to note here that Institutions display an awareness of passing costs onto
students. Specific mention is made of the transfer of printing costs onto students;
students spend money and time printing Web pages rather than simply receiving staff-
photocopied notes. Interestingly, only one Institution reports charging students a
subscription fee to access the Institution network from halls of residence.
The main reasons for not recording costs seem to revolve around difficulties in the
quantification and categorisation of these costs. Institutions frequently stated that the
costing questionnaire was difficult to answer. This lack of readily available answers to
Costs of Networked Learning
Bacsich et al. 27
simple costing questions is itself illustrative of the need for more thorough analysis of
costing issues. Currently, information about costing is neither available nor easily
accessible.
4.4 Conclusion
There are positive conclusions to be drawn from the survey about the present
condition within Higher Educational Institutions with regard to Networked Learning.
Firstly, the sector owns a great number of computers already. The ratio of computers
to staff is very nearly 1:1, though closer investigation is needed to see whether this
figure is reported accurately in the survey returns. On the whole this bodes well for
Networked Learning. Where Institutions are currently failing is in the provision of
computers for students. In some instances the need for future investment could be
alleviated by opening longer hours to improve the student:computer ratio towards the
levels recommended by Dearing in 1997.
Secondly, Institutions have achieved this excellent situation with regard to staff PCs
despite relatively small IT expenditure (when compared with overall Institutional
expenditure).
Currently, there appears to be little awareness of specific costing issues. Further, there
is little uniformity of costing approaches between Institutions, and in some cases
within the same Institution.
We are left with the strong feeling that there is much need for greater emphasis to be
placed upon accurate and specific recording of costs. Only when a universal costing
framework - at least for courses, but perhaps more generally - has been accepted
throughout Higher Education can people begin in earnest to compare the real costs of
Networked Learning.
“The classic report on costs of e-learning, online learning and distance learning”
Bacsich et al. 28
5. Case Studies
“Case studies are ‘a step to action’. They begin in a world of action
and contribute to it. Their insights may be directly interpreted and
put to use...”
Adelmann et al (1980), quoted by Bassey (1999)
5.1 Introduction
Following the postal questionnaire which focused on a broad overview of several
areas the Study Team selected six Institutions (plus Sheffield Hallam University) in
which to conduct in-depth interviews with a range of staff. The data collected in these
interviews formed the basis for seven Case Study reports. (The full versions are in a
separate Annex.) These findings are discussed here thematically. They illustrate the
approach, depth and variety of Networked Learning activities, and how they are
planned and costed. The sector’s opinions of the working model developed by the
Study Team can be found in Chapter 7.
The purposes of the interviews were to:
reinforce, expand, check and follow up the survey results
engage in dialogue with stakeholders
act as field visits to observe Networked Learning activity
explore the importance and perception of costs
identify hidden and recorded cost areas
explore the working model.
5.2 Discussion
One aim of this exercise was to assess the extent of Networked Learning in the sector.
The Case Studies undertaken for this project show that in all cases where Networked
Learning is taking place, it is mainly instigated and delivered by a small number of
enthusiasts in each Institution. Networked Learning is becoming more widely
accepted by students and utilised by staff. In most cases it was indicated that these
small pockets of innovation in Teaching and Learning were beginning to influence
other staff members. In some Institutions the management were starting to develop a
clear strategic path for the development of Networked Learning activities. On the
whole, these individual activities were considered to be very successful. In one
Institution, the Head of Computing reported that Networked Learning was key to the
mission of the University and that it was now unusual to find a course which did not
include a component of Networked Learning.
Institutions are moving towards Networked Learning for very similar reasons - such
as improving quality and access without increasing the costs to the Institution. Most
Institutions were interested in taking the technology beyond just posting lecture notes
on the World Wide Web, all the way to using computer conferencing systems and
encouraging the use of technology in the production of assignments and project work.
On the whole, the view that Networked Learning has the potential to enhance the
learning experience was supported. However, the caveat was widely expressed that
Costs of Networked Learning
Bacsich et al. 29
this was only if embedded into existing paradigms, not as a replacement of
conventional undergraduate teaching. (This may be a view disappointing to experts in
the field).
5.2.1 Force-field analysis
Through this general positive atmosphere there were many forces said to be inhibiting
the wider introduction of Networked Learning activities. Using a force-field analysis
(Lewin, 1951) of driving and restraining forces, the following barriers were identified
in the Case Study Reports:
lack of training in new technologies
the amount of time needed before staff were able to use the technology effectively
lack of transparent tools for the development of materials
lack of pedagogical evidence to support a move to Networked Learning
cost of development - time, opportunity cost, and scalability
lack of a “water-proof” (that is, highly reliable) computer network
the debatable quality of some off-the-shelf Computer Assisted Learning materials
lack of standards in courseware and technologies.
On the other hand driving forces were said to be:
individual enthusiastic members of staff
additional dynamism from members of the senior management team
project champions (thought to be essential to success in innovation)
large numbers of students and decreasing budgets.
Interestingly, one academic felt that if the benefits of Networked Learning could be
quantified then this could also be considered a driving force.
5.2.2 Costs
Alongside the extent of Networked Learning taking place in the UK HE sector, this
investigation looked at the costs involved and what the sector thought about their
quantity and recording. Most Institutions believed that costing Networked Learning
was a positive activity - many believed that more investment was needed but were
unwilling to do this when the monies can quite easily be lost track of and so easily
spent elsewhere. So in this instance a costing methodology would help to track the
costs of learning, both conventional and innovative, and encourage the correct
allocation of costs. Other respondents thought that a costings framework would make
people more aware of the costs of both approaches to learning (Networked and
Traditional) and allow individual departments to set their own agendas.
On the other hand, some interviewees expressed the belief that costing Networked
Learning was a negative activity - it would stifle the small pockets of creative activity,
and in any case academics do not want to know how much their teaching costs.
Almost all Institutions stated quite categorically that their financial regimes would not
adapt to an Activity Based Costing framework: “this Institution operates a highly
devolved accounting system which would make an activity of this nature very
difficult”. Opportunity costs - in terms of research and promotion - and staff
development costs were considered to be key factors militating against the
introduction of Networked Learning on a larger scale.
“The classic report on costs of e-learning, online learning and distance learning”
Bacsich et al. 30
Two interviewees questioned the relevance of our study in light of the current work
by the Funding Councils to analyse spending (specifically the “Transparency Review
of Research”, published by JCPSG in July 1999 - which we have now incorporated
into our thinking) but it was pointed out by another interviewee that earlier efforts in
this direction had been “intellectually weak”.
Many interviewees pointed out that there was the larger “cost of costing” issue to
consider in this exercise. One Head of Computing said “there are larger costs in
unearthing the costs than just the unearthing costs” - and the general thought seemed
to be that once the costs were identified, Institutions would be forced to deal with
them, and this in itself was costly. One Deputy Head of Finance stated that the key
was to strike a balance and provide value for money. It was pointed out that a danger
of this exercise was to find out the “cost of everything and the value of nothing”. One
interviewee expressed the view that University accounting systems were not designed
to treat costs on this level and that an experienced financial manager would be needed
in each department to make a costings framework of this nature succeed.
A view was expressed that no separate effort should be made to cost Networked
Learning “against” conventional learning. However, several other interviewees
thought that the imminent sectoral research costings guidelines (JCPSG, 1999) would
give more consistent financial data on research which would by subtraction from total
budgets give the cost of teaching and learning.
On the whole, Hidden Costs were not considered to be a major constraint on the
Institutions with regard to the development of Networked Learning - but it was noted
that this is only true while they were hidden and that once they had been revealed they
may become a major barrier. One senior academic noted: “Innovation has Hidden
Costs, by definition”. Many Hidden Costs discussed during the interviews were time-
based - such as the time spent on development, reading email, and administration.
Many Hidden Costs were personally incurred by staff such as the time cost of the
extended office working day and time spent working from home. Other Hidden Costs
discussed included updating software, under-utilisation of hardware, viruses, “mail
storms”, and the social use of email by students. One academic reported that he had
overcome one hidden cost of the conventional system by using some Networked
Learning - the cost of unscheduled student/staff contact time.
5.2.3 Institutions
On an Institutional level there was much discussion as to whether Networked
Learning was an important issue in research-led Institutions. Many reported that the
pressures on staff time were different, and that the research standing of traditional
universities was ingrained in their culture and of paramount interest to the
management. Teaching and learning was often seen as a secondary activity as the
Institutions believed they attracted a higher calibre of student more able to learn
independently. While time and lack of incentive at one Institution were said to be
barriers, another interviewee suggested that if staff developed Networked Learning
materials that saved them time in teaching, then they could spend more time on
research.

Costs of Networked Learning
Bacsich et al. 31
The success of Networked Learning on its current small scale was said to be largely
due to the collaboration between central departments within Institutions. In one
instance the Library and Computing Centre merged to provide a uniform information
provision service. In another the Computing Centre were working in close
collaboration with the Finance Department to fund computers for all staff. In yet
another Institution a centrally directed programme was providing seminars enabling
staff to move towards Networked Learning in small steps.
5.2.4 Staff
In all Institutions the issue of staff ownership of home computers for work was
discussed. It was said that considerable costs are off-loaded onto staff, most of whom
have purchased a home computer and pay for Internet connect time and colour
printing. Between 20% and 90% of staff were thought to have PCs at home that they
use for work. The reasons given were: to extend the working hours of the day; to
assist the development of new materials; marking and feedback; and general
administration (which was said to have increased dramatically over the years). In
some cases, the interoperability of these machines with those in offices was thought to
be a barrier to the introduction of Networked Learning - as was the speed of change,
which meant that students often had more powerful machines and more up to date
software than the staff.
Time was considered to be a major cost item as far as staff were concerned. This was
encountered in two forms: firstly, the lack of time for staff training and development
of materials, and secondly, the lack of recognition that materials development was an
activity that needed extra time aside from current (conventional) teaching and
research time. In theory, staff in one Institution were supposed to spend one third of
their time on each of administration, teaching and research but this did not allow for
the development of new materials which may save teaching time in the future. On the
whole, staff time was costed only for commercial activities, and then generally under
duress. In most cases, Networked Learning had been embarked upon with little
consideration for the time needed to develop and then run courses. Efficient use of
staff time was considered by some to be a driving factor towards Networked
Learning. Many managers interviewed believed that academics spent time, mostly
their own, on developing Networked Learning activities because they were interested
or particularly keen - however, academic staff believed this work was done not on a
good-will basis and should therefore be rewarded. A concern was expressed in several
Institutions that if a move were made towards Networked Learning then this would
give staff even more teaching duties as it would blur the boundary between course
administration and teaching. If Networked Learning were to save time, many
academics felt they would be given another hour of face-to-face teaching to replace
the time saved by introducing Networked Learning. Staff time is seen to be the last
unmonitored resource in Institutions - but in most cases academics would like this to
remain the case.
In many instances the development of Networked Learning materials, and associated
time, was done by academics on a good-will basis - there were no rewards or
incentives to do this. Staff in some Institutions reported that staff training in Web page
creation and such like was practically non-existent - in one example the courses were
available but release time needed to be negotiated on an individual level. Others felt

“The classic report on costs of e-learning, online learning and distance learning”
Bacsich et al. 32
that the training and IT support were available but not fully utilised. Some academics
stated that they did not believe that courses on the pedagogy of Networked Learning
were even in existence. A substantial number of academics interviewed still believed
that Networked Learning was a “con” as it would make more demands on their
already stretched time.
Only at one Institution did the academic staff believe that their time should be costed
to activities. The overall impression was that staff time could not be categorised on a
long-term basis - in particular, academic staff were resistant to all attempts to do this,
due to the negative stigma attached to time sheets. One administrator pointed out that
the amount of work needed to support a staff time-sheet activity would outweigh the
benefits of installing one. Several alternatives were suggested such as: to complete a
time sheet for one week at different times of the year to get a general balance of
effort; occasional costing of small activities; diary exercises; sensible estimates
arising from a pilot study; a retrospective system which requires staff to decide what
percentage of their time in the previous year was spent under six categories. One Pro-
Vice Chancellor pointed out that while he did not believe that time sheets as such
were appropriate in an academic environment, he did anticipate some system of
recording staff time would soon become mandatory. It was generally assumed that a
form of “lightweight” time sheet would be proposed for research by the Transparency
Review (this is now the case, see JCPSG, 1999), which could then be applied to
teaching. One interviewee pointed out that it was too early to gauge the impact of the
new Institute for Learning and Teaching on this issue but that to succeed any method
of time recording must be based on reality rather than ideals (http://www.ilt.ac.uk/).
5.2.5 Students
It was generally believed that approximately 50% of students had access to a
computer outside of the Institution, but it was noted by one Head of Computing that a
much smaller percentage actually had access to the Internet from home. It was
thought, by one Institution, that in the near future all students would need a home
computer, and in one Institution it was thought that this would advance the take-up of
Networked Learning. In view of this, one Institution stated that in their case there
would be no further investment in large clusters of PCs on campus.
On the other hand all Institutions believed that students were becoming more
demanding, especially in terms of IT provision and support. One Institution noted that
students came to university expecting to use computers, since they have been
encouraged to do so in school and now wish to extend their skills at university. This
pressure may be due (as one Institution suggested) to the introduction of tuition fees,
or it may be because students are becoming more proactive in their approach to
Higher Education in the light of the changing employment market.
The student view of Networked Learning, as reported by academics in the interviewed
Institutions, was generally mixed. On one hand, students seem keen on the potential
of Networked Learning - especially regarding group discussion, information gathering
and assessment. In contrast, Institutions reported a wide variation in the skill base of
new students, some of whom were (still) quite technophobic; thus a diverse training
programme in IT was still needed. Several academic staff expressed the view that
Costs of Networked Learning
Bacsich et al. 33
students were wary of Networked Learning since they felt it would reduce the amount
of contact time with tutors.
On the whole, students paid for printing in the Institutions visited (although in some a
free quota was given) - this was said to be discouraging some academics from posting
course material on the Web. Institutions are conscious of shifting the costs of learning
to students but feel that it is inevitable. In one Institution it was felt that their students
were sufficiently well-off to bear the costs of their learning experience. The attitude in
some Institutions was that, as long as the money was visibly used to improve service
and provision, then students did not mind paying - and paying was said to reduce the
amount of abuse by students. Another successful approach to charging students was to
make students aware of the additional costs before they commence the course - this
would give them the information to come to an opinion based on total cost. However,
in all cases Institutions agreed that the costs must be justifiable in terms of future
employability, contact time, quality of material and improvement of skills base.
5.3 Conclusions
Networked Learning is taking place - but mainly as small pockets of innovation,
driven by individual members of staff, rather than large-scale strategic activity. The
main reason given by our interviewees as to why this is happening is that it is aimed at
improving access and quality without increasing the cost to the Institution. The
interviews illustrated that there are many forces inhibiting the take-up of Networked
Learning, although these are not necessarily cost-related. One very clear point made
was the lack of evidence (in the eyes of the interviewees) justifying the pedagogical
benefits of innovative learning systems.
Institutions were very concerned about related cost issues such as the “cost of costing”
and the cost of dealing with the costs once revealed. The general feeling was that a
costing methodology would help to track the costs of learning, both conventional and
innovative methods; but that too rigid a framework would stifle creative innovation.
There was also concern expressed about how a new costing methodology will
integrate with existing financial management systems. On the whole it was thought
that the work of the Research Transparency Review (JPCSG 1999) would supersede
any framework devised just for Networked Learning. The importance of Networked
Learning to research-led Institutions was also questioned.
The issue of recording staff time appeared to be a highly contentious issue. The
development of Networked Learning materials has usually been done on a goodwill
basis rather than on Institutional time and resources. For this and other purposes a
majority of staff have PCs at home that they often use for work.
Institutions also note that the majority of students have access to computers off
campus, but that students (the same ones?) are demanding more IT support and
facilities on campus. On the whole, Institutions reported that students were generally
keen on Networked Learning, but not willing to lose the face-to-face contact of
conventional methods.
Institutions also recognise that students are being asked to fund more and more of
their education as Institutional budgets (per student) decrease.

“The classic report on costs of e-learning, online learning and distance learning”
Bacsich et al. 34
6. Student Questionnaire
“Each University should know each student in the same way
as each parent knows its child.”
Cardinal Newman, 1852, in ‘The Idea of a University’ as quoted by Tim O’Shea, Master of Birkbeck
College, at the 1999 Teaching and Learning Conference, Sunderland University.
6.1 Introduction
This survey was conducted to meet the need for more information about student
participation in, and feelings towards, Networked Learning. It became apparent during
earlier research that student views were not well documented and that many of the
Hidden Costs being identified were actually being absorbed by students. In short, the
earlier data confirmed that most students feel Networked Learning is increasing the
cost of learning but that this is offset by the general view that it is also enhancing their
experiences, making learning more positive and therefore enjoyable and profitable.
As the exercise was entered into at a late stage of the project it was not possible to
conduct a wide-ranging survey involving students from different Institutions;
therefore the decision was taken to concentrate purely on the student body of
Sheffield Hallam University. The Union of Students offered to co-ordinate this
activity after the Study Team met with them to discuss student issues - notes from this
meeting are included in the analysis. 450 questionnaires were sent to student/course
representatives. A further 300 questionnaires were sent in batches of 25 to each of the
University’s 12 academic Schools for collection by any student interested. In order to
motivate students, returning the questionnaire with an email address guaranteed entry
into a prize draw and a chance to win one of five £10 music vouchers.
The final response rate was 11%. A more statistically sound sample group and higher
response rate would be desirable before definitive conclusions could be made using
this data - therefore caution is recommended. However, due to the timescale of the
project, time of the year (after exams) and nature of the sample group it was not
possible to do better. However, our results do correlate closely with the National
Union of Students (NUS) submission to the Department for Education and
Employment in March 1999.
6.2 Student profile
Sheffield Hallam University has just under 20,000 student FTEs, with 84% of these
studying at undergraduate level. 38% of respondents to this questionnaire were
between 18-21 years old, 27% between 22-26, and 35% over 26. 92% were
undergraduates. The majority of respondents were female.
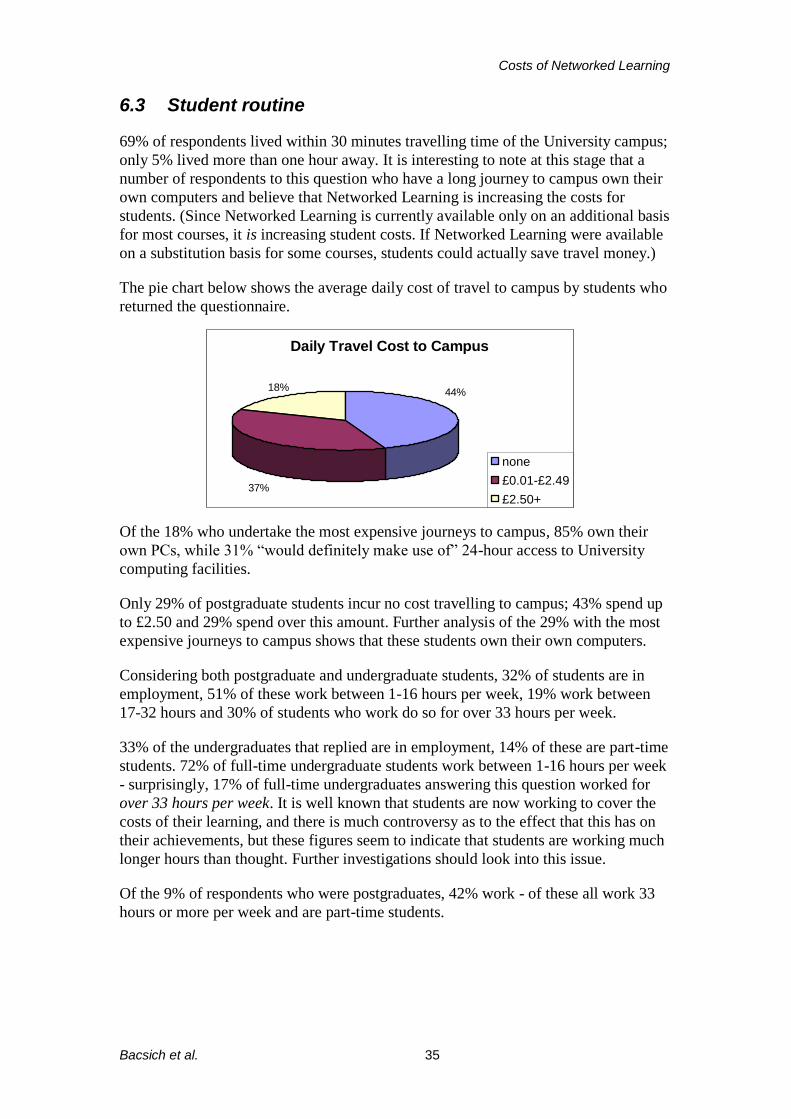
Costs of Networked Learning
Bacsich et al. 35
6.3 Student routine
69% of respondents lived within 30 minutes travelling time of the University campus;
only 5% lived more than one hour away. It is interesting to note at this stage that a
number of respondents to this question who have a long journey to campus own their
own computers and believe that Networked Learning is increasing the costs for
students. (Since Networked Learning is currently available only on an additional basis
for most courses, it is increasing student costs. If Networked Learning were available
on a substitution basis for some courses, students could actually save travel money.)
The pie chart below shows the average daily cost of travel to campus by students who
returned the questionnaire.
Of the 18% who undertake the most expensive journeys to campus, 85% own their
own PCs, while 31% “would definitely make use of” 24-hour access to University
computing facilities.
Only 29% of postgraduate students incur no cost travelling to campus; 43% spend up
to £2.50 and 29% spend over this amount. Further analysis of the 29% with the most
expensive journeys to campus shows that these students own their own computers.
Considering both postgraduate and undergraduate students, 32% of students are in
employment, 51% of these work between 1-16 hours per week, 19% work between
17-32 hours and 30% of students who work do so for over 33 hours per week.
33% of the undergraduates that replied are in employment, 14% of these are part-time
students. 72% of full-time undergraduate students work between 1-16 hours per week
- surprisingly, 17% of full-time undergraduates answering this question worked for
over 33 hours per week. It is well known that students are now working to cover the
costs of their learning, and there is much controversy as to the effect that this has on
their achievements, but these figures seem to indicate that students are working much
longer hours than thought. Further investigations should look into this issue.
Of the 9% of respondents who were postgraduates, 42% work - of these all work 33
hours or more per week and are part-time students.
Daily Travel Cost to Campus
none
£0.01-£2.49
£2.50+
44%
37%
18%
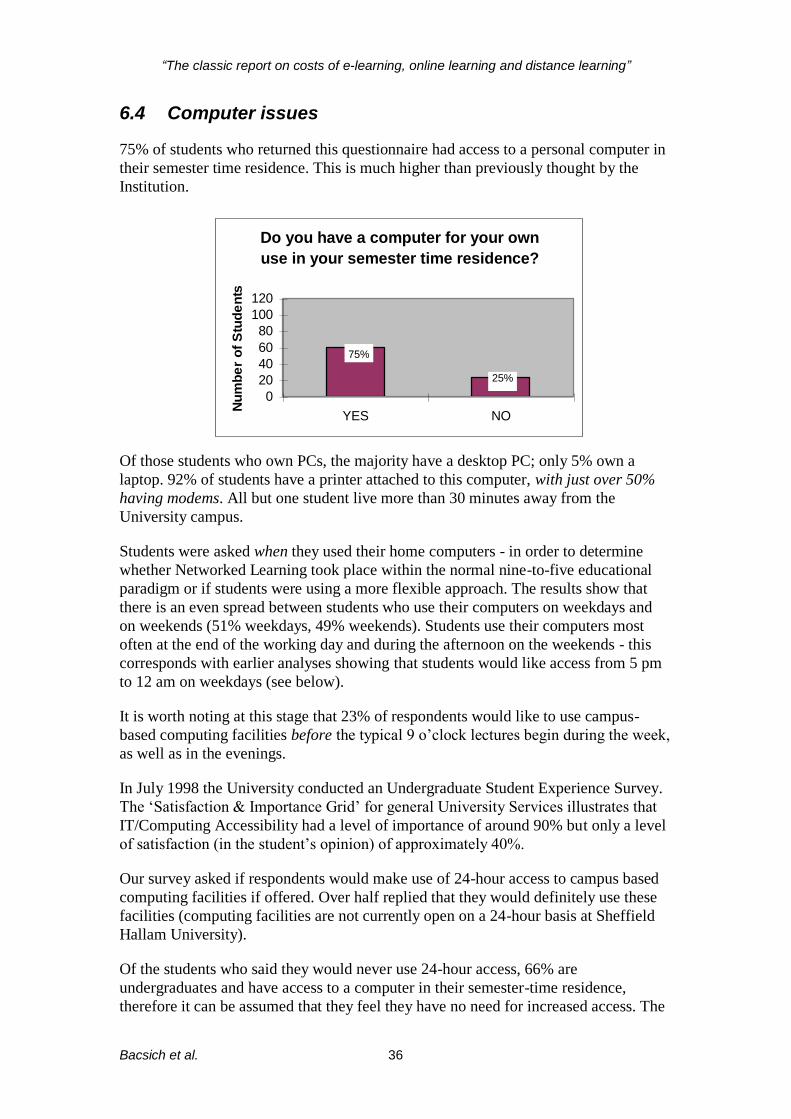
“The classic report on costs of e-learning, online learning and distance learning”
Bacsich et al. 36
6.4 Computer issues
75% of students who returned this questionnaire had access to a personal computer in
their semester time residence. This is much higher than previously thought by the
Institution.
Of those students who own PCs, the majority have a desktop PC; only 5% own a
laptop. 92% of students have a printer attached to this computer, with just over 50%
having modems. All but one student live more than 30 minutes away from the
University campus.
Students were asked when they used their home computers - in order to determine
whether Networked Learning took place within the normal nine-to-five educational
paradigm or if students were using a more flexible approach. The results show that
there is an even spread between students who use their computers on weekdays and
on weekends (51% weekdays, 49% weekends). Students use their computers most
often at the end of the working day and during the afternoon on the weekends - this
corresponds with earlier analyses showing that students would like access from 5 pm
to 12 am on weekdays (see below).
It is worth noting at this stage that 23% of respondents would like to use campus-
based computing facilities before the typical 9 o’clock lectures begin during the week,
as well as in the evenings.
In July 1998 the University conducted an Undergraduate Student Experience Survey.
The ‘Satisfaction & Importance Grid’ for general University Services illustrates that
IT/Computing Accessibility had a level of importance of around 90% but only a level
of satisfaction (in the student’s opinion) of approximately 40%.
Our survey asked if respondents would make use of 24-hour access to campus based
computing facilities if offered. Over half replied that they would definitely use these
facilities (computing facilities are not currently open on a 24-hour basis at Sheffield
Hallam University).
Of the students who said they would never use 24-hour access, 66% are
undergraduates and have access to a computer in their semester-time residence,
therefore it can be assumed that they feel they have no need for increased access. The
Do you have a computer for your own
use in your semester time residence?
0
20
40
60
80
100
120
YES NO
Nu
mb
er
of
Stu
de
nts
25%
75%

Costs of Networked Learning
Bacsich et al. 37
postgraduate students who answered this question negatively lived over an hour from
campus and were all part-time students. One can reasonably understand that they
would not benefit from increased access, and in some cases these students had access
to a personal computer in the home or workplace.
6.5 Networked Learning
Student comments regarding Networked Learning varied. Some felt that face-to-face
interaction was most suitable and that electronic learning packages reinforced this, but
could not replace it without a detrimental effect on the process; others felt that
Networked Learning would be more flexible and essential for some courses and
groups of students.
On the whole, as the graph above illustrates, students felt that Networked Learning
had a positive effect on their learning.
The extent to which Networked Learning is integrated into the students’ courses
varies across the departments. Students were asked how they felt about Networked
Learning replacing part of their degree course, the answers form almost an even
distribution, just slightly more positive than negative.
6.6 Costs
According to the 1996 NUS survey (NUS, 1999), the average student spent £89 on
computer software and hardware per annum - the main reason is said to be the fear
that marks would be lost if assignments were not typed.
Many respondents to our survey did not answer our question on costs, but of those
who did, the majority spent between £50-£100 per year on consumables. The
maximum spent on consumables was £260, the minimum was £30 and the average
expenditure was £81. Most students (51%) purchased their home computers for
between £1000-£1500; only 14% paid over this amount.
37% of students responding to our survey reported that they spent between £20-£40
on their telephone bill per month; 13% of students spent between £80-£100.
0
10
20
30
What effect has Networked Learning
had on your learning experience?
Positive Negative

“The classic report on costs of e-learning, online learning and distance learning”
Bacsich et al. 38
During a focus group meeting, the Students Union Executive Committee stated that
they believed that costs were being passed to students and that students unwittingly
perceived them as normal. The Students Union representatives felt that “time to get to
grips with IT” was a large issue among students - this correlates with our results.
The Students Union also mentioned childcare as a growing cost among students,
especially given the number of students at the University with young families. More
Networked Learning across the University would certainly save money in the long
term for those with children to care for.
The large majority of students believed that their costs are increasing.
Of those who believed that Networked Learning was increasing the cost of learning,
96% are undergraduates. 75% own their own PCs and 40% of those with PCs have
use of a modem.
Students reported that the main cost to them was time: including time to gain
familiarisation with software, time delays at log on, time queuing for printing, and
time lost due to system crashes. The telephone bill, hardware and software were next
most important - other items such as insurance were fairly low on the list.
6.7 Conclusions
From this small study it appears that students are aware of the increased costs of
Networked Learning but are unaware of the potential savings. These include reduced
book purchase, savings in transport costs, and the reduction of time spent on activities
such as attendance at lectures. From the student comments at the end of the
questionnaire (32% commented), the following came through strongly (similar
comments came via our site visits):
On-campus facilities are perceived as inadequate.
Printing is perceived as expensive, when tutors expect two copies of assignments.
Time is perceived as the largest cost and largest cause of frustration.
One said: “Without computers things would be cheaper - but they are very useful!”
This seems to sum up the common student view across the sector.
Is Networked Learning Increasing the
Costs for Students?
0
10
20
30
40
50
60
Yes No Did not say
68%
19% 13%

Costs of Networked Learning
Bacsich et al. 39
7. Evolution of the Model
“It is potentially straightforward to record a comprehensive list of the
costs associated with all phases of ITATL development, adoption and
maintenance. In practice, however, experience to date indicates that
institutions have not been required to identify costs on such a basis, and
there has been widespread failure to appreciate the true costs burden
either of conventional teaching materials creation or of ITATL
alternatives”.
HEFCE (1997)
7.1 Introduction
At the end of Chapter 3 a working model was arrived at through the analysis of the
literature and consultation with colleagues. This working model was tested during the
interviews for the Case Study reports and also during a workshop attended by five
experts (some in costing, some in online learning) from both Industry and Education.
The results of these discussions are detailed below. After this the model was
redesigned in light of these suggestions to form the three-phase model used as the
basis of the Planning Document and Financial Schema outlined later in this Report.
7.2 Reminder of the five-phase model
The original model comprised a five-phase “cyclic” model which encompassed both
the learning environment and the student experience, under the headings of Planning,
Developing, Providing, Managing and Maintaining. The model had three inner units
for Academic Staff, Support Staff and Students.
7.3 Test group one - site visits
Interviewees at the seven Institutions were shown a copy of the working model and
asked to comment on several aspects. One clear point was that of omissions. Staff in
HEIs thought that Senior Management (Deans and above) and Evaluation should be
included in the cyclic framework. Others thought that more general issues such as
Flexibility and Sustainability should be included. Still others believed that additional
stakeholders such as Employers and Parents should be incorporated.
Yet on the whole, the response to the working model was positive. Staff were pleased
to see Course Maintenance and Support Staff being properly recognised in an
educational setting. The “life cycle” approach to the issue was also commended. One
interviewee expressed the view that simple methods had more impact on non-
financially aware academics - however another thought that even in its simplest form
the model would need serious staff training and “hearts and minds buy-in” at a grass-
roots level in order to succeed.
Some academic staff interviewed were concerned that a framework of this nature may
be too rigid, since organisational change is slower than the pace of technology.
Another believed that scenarios would be a good way of illustrating its function.
Interestingly, on further analysis it seems as though most academics are negative

“The classic report on costs of e-learning, online learning and distance learning”
Bacsich et al. 40
about the idea of a framework to document the costs of Networked Learning, while
senior management were in favour of a methodology which would help record the
costs of any learning system.
Much concern was expressed about whether the model could stifle creativity and
innovation, thus hindering the development of Networked Learning.
7.4 Test group two - experts’ workshop
At the experts’ workshop, the experts agreed, without contention, that the model - in
whatever form it finally takes - should be equally as appropriate for costing
conventional teaching systems as for costing Networked Learning. If the model did
not also apply for alternative systems then no fair comparisons could be made and the
sector would be no closer to determining whether Networked Learning is more cost-
effective than conventional teaching and learning, an issue which was agreed to be
more important than the issue of whether Networked Learning costs less.
During the workshop there was much discussion about the staff aspect of the model.
Should the staff role be renamed to “learning facilitator” to include how staff might
operate in a Computer Based Training situation or an integrated learning
environment? Also under which bubble did managerial staff play a role? It was
suggested that all staff should be categorised under one heading as the boundaries
between traditional staff groups were now beginning to fade. However, experts from
universities argued that although this may happen in time there will still be a specific
distinction between a cleaner and Vice Chancellor, so it was decided that a less
controversial way of dealing with this was to rename Support Staff as Non-Academic
staff, a phrase which they thought sounded more encompassing.
Strategic Planning was notably missing, but on discussion it was resolved to take
place outside of the existing model. Quality Assurance and Evaluation were also
noted to be missing and it was decided that these two aspects definitely needed
inclusion in the main model.
One expert, from a financial background, was concerned that the model did not make
distinctions between staff versus non-staff costs and capital versus recurrent costs. It
was explained that the model should just be a diagrammatic representation of
underlying spreadsheets - these would break costs down to a level where the hidden or
misallocated costs are visible. (See Chapter 8.)
Further discussion on the model revealed that the industry-based experts were actually
not comfortable with the five-phase working model. They proposed a helical Business
Reengineering (BPR) Model which revolved through the following aspects: Develop,
Market, Provide, and Assure. However, when the identified costs were categorised
under these headings it was found that some categories were quite sparse (Assure)
while others (Provide) would need to be broken down into more than one
subcategory. When the aim of the exercise is to categorise costs in an understandable
way to policy makers, academics and financial managers and to also do this at a level
that does not allow for the hiding of Hidden Costs, the above suggestion did not work,
and therefore was rejected as unsuitable for this purpose.

Costs of Networked Learning
Bacsich et al. 41
One valuable suggestion made was to break the costs down firstly by who incurs them
and then by activity; therefore costs can be categorised by Student-incurred costs;
Staff-incurred costs; and Institution-incurred costs. Most costs, of course, are incurred
by the Institution as the service provider but many Hidden Costs are borne by students
and staff. Since this suggestion matched our input from the literature, and our own
interim conclusions, we decided to follow it.
7.5 Re-analysis of five-phase model
Both test groups noted that there were omissions from the working model:
Additional Stakeholders Management
Evaluation
Strategic Planning
Quality Assurance
Flexibility
Sustainability
Another vital comment was that simple methods have more impact with academic
staff especially when they impact on costs, time and workload. It was decided by the
team that a five-phase model was too complex and that the four-phase BPR model
proposed by the majority of the workshop attendees would not resonate with the UK
Higher Education sector, or make apparent the Hidden Costs we were trying to
identify, so therefore a three-phase model was proposed.
The new model includes Evaluation and Quality Assurance but assumes that Strategic
Planning takes place on the periphery. (One could argue that this is a valid assumption
from the viewpoint of the “working academic”.) Staff and Students have been
removed from the model as now their place as stakeholders is secure.
Planning and
Development
Production
and
Delivery
Maintenance
and
Evaluation
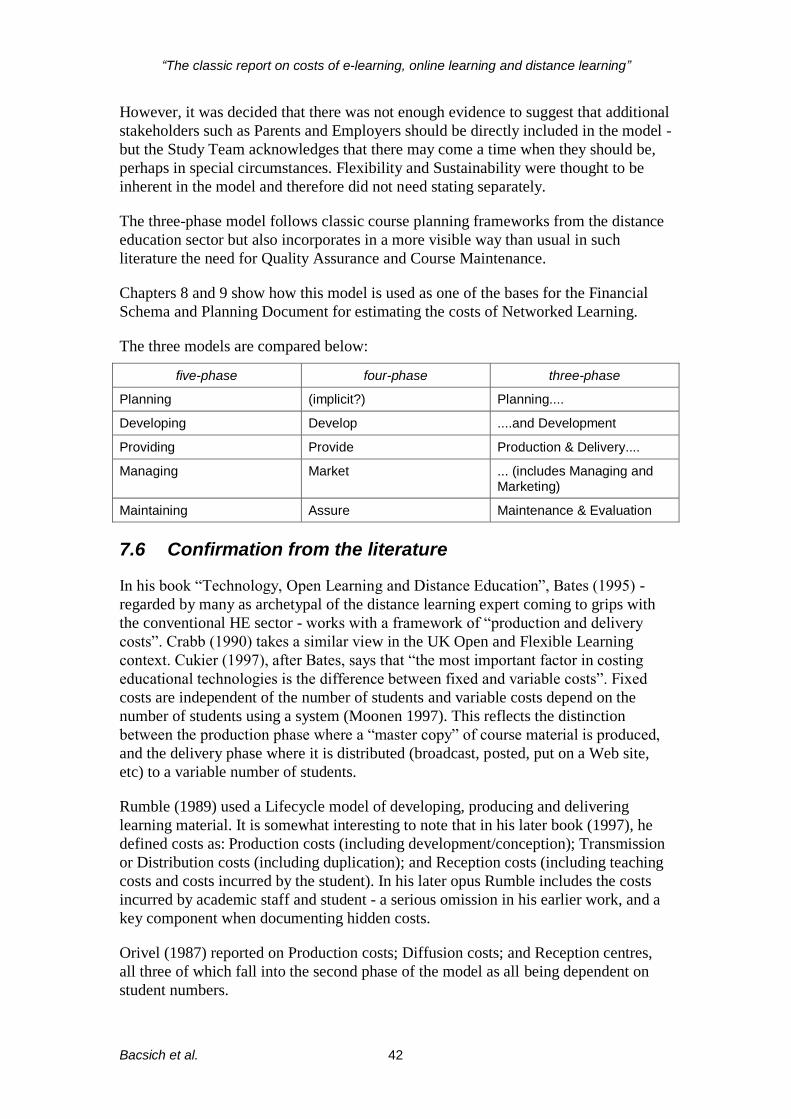
“The classic report on costs of e-learning, online learning and distance learning”
Bacsich et al. 42
However, it was decided that there was not enough evidence to suggest that additional
stakeholders such as Parents and Employers should be directly included in the model -
but the Study Team acknowledges that there may come a time when they should be,
perhaps in special circumstances. Flexibility and Sustainability were thought to be
inherent in the model and therefore did not need stating separately.
The three-phase model follows classic course planning frameworks from the distance
education sector but also incorporates in a more visible way than usual in such
literature the need for Quality Assurance and Course Maintenance.
Chapters 8 and 9 show how this model is used as one of the bases for the Financial
Schema and Planning Document for estimating the costs of Networked Learning.
The three models are compared below:
five-phase four-phase three-phase
Planning (implicit?) Planning....
Developing Develop ....and Development
Providing Provide Production & Delivery....
Managing Market ... (includes Managing and Marketing)
Maintaining Assure Maintenance & Evaluation
7.6 Confirmation from the literature
In his book “Technology, Open Learning and Distance Education”, Bates (1995) -
regarded by many as archetypal of the distance learning expert coming to grips with
the conventional HE sector - works with a framework of “production and delivery
costs”. Crabb (1990) takes a similar view in the UK Open and Flexible Learning
context. Cukier (1997), after Bates, says that “the most important factor in costing
educational technologies is the difference between fixed and variable costs”. Fixed
costs are independent of the number of students and variable costs depend on the
number of students using a system (Moonen 1997). This reflects the distinction
between the production phase where a “master copy” of course material is produced,
and the delivery phase where it is distributed (broadcast, posted, put on a Web site,
etc) to a variable number of students.
Rumble (1989) used a Lifecycle model of developing, producing and delivering
learning material. It is somewhat interesting to note that in his later book (1997), he
defined costs as: Production costs (including development/conception); Transmission
or Distribution costs (including duplication); and Reception costs (including teaching
costs and costs incurred by the student). In his later opus Rumble includes the costs
incurred by academic staff and student - a serious omission in his earlier work, and a
key component when documenting hidden costs.
Orivel (1987) reported on Production costs; Diffusion costs; and Reception centres,
all three of which fall into the second phase of the model as all being dependent on
student numbers.
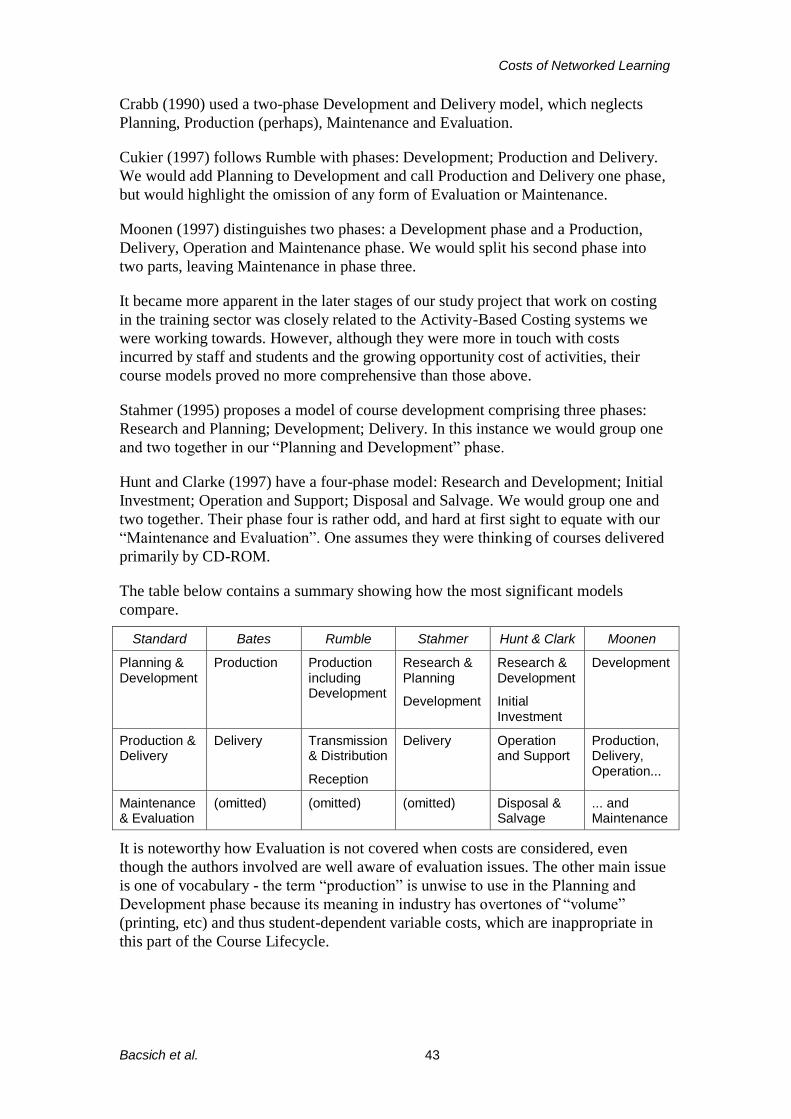
Costs of Networked Learning
Bacsich et al. 43
Crabb (1990) used a two-phase Development and Delivery model, which neglects
Planning, Production (perhaps), Maintenance and Evaluation.
Cukier (1997) follows Rumble with phases: Development; Production and Delivery.
We would add Planning to Development and call Production and Delivery one phase,
but would highlight the omission of any form of Evaluation or Maintenance.
Moonen (1997) distinguishes two phases: a Development phase and a Production,
Delivery, Operation and Maintenance phase. We would split his second phase into
two parts, leaving Maintenance in phase three.
It became more apparent in the later stages of our study project that work on costing
in the training sector was closely related to the Activity-Based Costing systems we
were working towards. However, although they were more in touch with costs
incurred by staff and students and the growing opportunity cost of activities, their
course models proved no more comprehensive than those above.
Stahmer (1995) proposes a model of course development comprising three phases:
Research and Planning; Development; Delivery. In this instance we would group one
and two together in our “Planning and Development” phase.
Hunt and Clarke (1997) have a four-phase model: Research and Development; Initial
Investment; Operation and Support; Disposal and Salvage. We would group one and
two together. Their phase four is rather odd, and hard at first sight to equate with our
“Maintenance and Evaluation”. One assumes they were thinking of courses delivered
primarily by CD-ROM.
The table below contains a summary showing how the most significant models
compare.
Standard Bates Rumble Stahmer Hunt & Clark Moonen
Planning & Development
Production Production including Development
Research & Planning
Development
Research & Development
Initial Investment
Development
Production & Delivery
Delivery Transmission & Distribution
Reception
Delivery Operation and Support
Production, Delivery, Operation...
Maintenance & Evaluation
(omitted) (omitted) (omitted) Disposal & Salvage
... and Maintenance
It is noteworthy how Evaluation is not covered when costs are considered, even
though the authors involved are well aware of evaluation issues. The other main issue
is one of vocabulary - the term “production” is unwise to use in the Planning and
Development phase because its meaning in industry has overtones of “volume”
(printing, etc) and thus student-dependent variable costs, which are inappropriate in
this part of the Course Lifecycle.

“The classic report on costs of e-learning, online learning and distance learning”
Bacsich et al. 44
7.7 Three scenarios
As a reality check, we look at three extreme scenarios:
1. a fully conventional course (though not quite as conventional as you might think)
2. a traditional distance learning course (Open University model)
3. a “totally online” Masters course (post-Fordist OU-like model).
7.7.1 Fully conventional course
Dr Albrecht of the University of Tynebridge was asked last year to teach a new final
year course on Post-deconstructionism this academic year for one semester. It
followed the standard form in his Institution of a 1-hour lecture and 1-hour discussion
group each week. His lecture notes consisted of a topic list and a list of readings. The
discussion group was lightly moderated by him and needed little preparation. He had
to mark two essays per student during the course. The class size was 15.
Phase Types of task
Planning & Development
Read the latest works on the topic, listen to a new radio series, create lecture notes (in Word), set essay topics. Adapt his own research articles to be suitable to final year students.
Production & Delivery
Give lectures, get lecture notes copied, moderate discussion groups, mark essays.
Maintenance & Evaluation
Students complained about his handwriting - so he will have to use OHPs next year. He has heard that OU is putting on a similar course - perhaps he could use the videos? RAE pressures mean that he would like to get his RA to work as a TA to moderate the discussions. A particularly bright disabled student has asked to attend next year’s course “online” - what to do?
7.7.2 Traditional distance learning course
Dr Birtwright is the Course Team Chair for the new Open University course on Post-
Deconstructionism. This is a course with 8 TV programmes and an optional CD-ROM
thanks to a generous US grant.
Phase Types of task
Planning & Development
(Team effort.) Review related work. Write course units and related print material, work with BBC on TV programmes, acquire content for CD-ROM. End up with an electronic master copy of all the course units, videotapes of each TV programme, and 600 Mb of data on hard disc ready to be pressed on the CD-ROM.
Production & Delivery
Print and post course units and all supplementary material. Broadcast the TV programmes, send CD-ROM to pressing plant and post to students.
Maintenance & Evaluation
US funders require a full evaluation by educational technologists.
Online version of the course must be delivered in two years time for global market - must transform course material to Web format and set up computer conferences, using the OU’s existing conferencing system.

Costs of Networked Learning
Bacsich et al. 45
7.7.2 Totally online course
Sensing a gap in the market, now that many Arts graduates (e.g. at the BBC) have PCs
and are on the Internet, Dr Carter at the University of Rother Bridge has got approval
to mount a totally online course on Post-Deconstructionism as part of her new
distance learning MA on “Radical Philosophies”.
Phase Types of task
Planning & Development
Read the latest works on the topic, listen to a new radio series, create lecture notes, set essay topics. Adapt her own research articles on “deconstructing gender - where next?” to be suitable to final year students. Put all this on the course Web site.
Ask the Computing Service to set up a Bulletin Board System. (They want to charge for doing this. She refuses, citing the departmental overhead.)
Production & Delivery
Make more material available on Web, such as topical items on Philosophy, moderate discussion groups online, receive and mark essays sent in by email. Set up “real” office hours for those students who live nearby.
Maintenance & Evaluation
Students want some “synchronous” online events; so must get technician to find out about RealAudio and record some lectures for next year. Also worried about the new OU global course in this area; how can she differentiate her course? (What about her students at the BBC?) Can she write something about this in a journal and count it for the next RAE?
7.8 Conclusions
We have proposed a three-phase model of the Course Lifecycle:
Planning & Development
Production & Delivery
Maintenance & Evaluation.
This has been checked against our earlier course models, the literature and some test
scenarios. We believe that it has stood up to these tests and we shall use it as one of
the bases for the Planning Document and Financial Schema.
We shall return to scenarios, especially ones similar to the third one, in Chapter 9.
“The classic report on costs of e-learning, online learning and distance learning”
Bacsich et al. 46
8. Financial Schemas
“Too often there is a gap in understanding and in working practice between
these two groups [academics and finance staff] which may lead to outcomes
that are not optimal for the institution.”
KPMG, 1997:foreword
In this chapter we describe the main conclusions of the study as it affects the “schema
for estimating costs”, as proposed in the original bid. In the next chapter we construct
an outline planning checklist.
Our conclusions are that the “traditional” planning model which underpins University,
department, and course planning is defective in at least four ways:
1. It takes no account of the costs incurred (or saved) by the additional stakeholders
in the learning process other than the Institution - in other words, it treats the
Institution as a closed system. The most important of these additional stakeholders
are Students and Staff (own time and resources), but there are others in certain
cases - in particular, Parents and (current) Employers.
2. It assumes a crude allocation of overheads (e.g. by simple cost drivers such as
staff numbers or space occupied) rather than an approach based on amount of use
(e.g. number of online student hours per year).
3. It takes little account of the division of academic time into research, teaching and
administration, beyond some work planning models which are suspect even in the
classroom situation and make less and less sense the further one moves from that.
4. It takes no account of the activities within the course development process.
Interestingly, as one moves away from internally-resourced development into
externally-funded activities (research and teaching), the demands of funding agencies,
especially the European Commission have forced attention on points 3 and 4; but
there has been little evidence until recently that points 1 and 2 have been covered.
All of these conclusions are still essentially negative, saying what is wrong with the
past. What do we propose that is positive?
8.1 Existing schemas
One of the main problems has been a lack of a concise, usable Financial Schema
which is flexible enough to apply to a number of different learning situations relevant
to Networked Learning.
We have looked at around 10 different schemas. These include the KPMG schema for
university financial planning and the US Flashlight schema (rapidly gaining
popularity in US HE), as well as a number of more traditional schemas, as well as
some from the training sector.
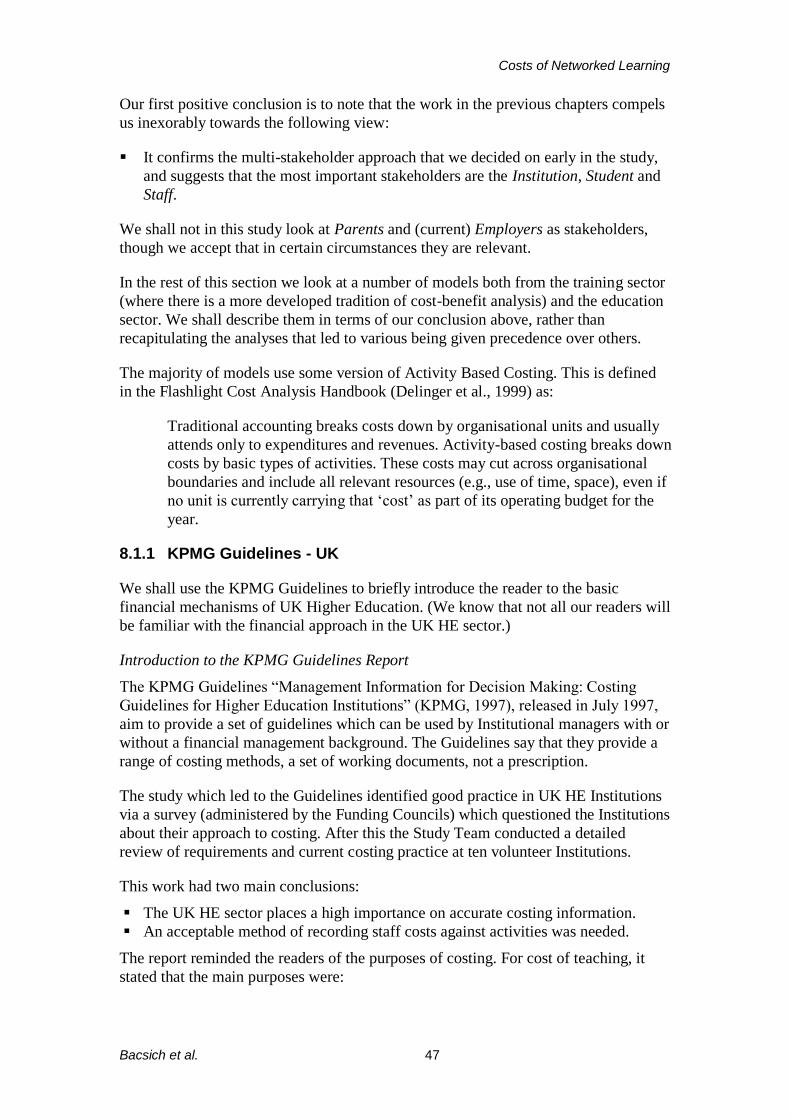
Costs of Networked Learning
Bacsich et al. 47
Our first positive conclusion is to note that the work in the previous chapters compels
us inexorably towards the following view:
It confirms the multi-stakeholder approach that we decided on early in the study,
and suggests that the most important stakeholders are the Institution, Student and
Staff.
We shall not in this study look at Parents and (current) Employers as stakeholders,
though we accept that in certain circumstances they are relevant.
In the rest of this section we look at a number of models both from the training sector
(where there is a more developed tradition of cost-benefit analysis) and the education
sector. We shall describe them in terms of our conclusion above, rather than
recapitulating the analyses that led to various being given precedence over others.
The majority of models use some version of Activity Based Costing. This is defined
in the Flashlight Cost Analysis Handbook (Delinger et al., 1999) as:
Traditional accounting breaks costs down by organisational units and usually
attends only to expenditures and revenues. Activity-based costing breaks down
costs by basic types of activities. These costs may cut across organisational
boundaries and include all relevant resources (e.g., use of time, space), even if
no unit is currently carrying that ‘cost’ as part of its operating budget for the
year.
8.1.1 KPMG Guidelines - UK
We shall use the KPMG Guidelines to briefly introduce the reader to the basic
financial mechanisms of UK Higher Education. (We know that not all our readers will
be familiar with the financial approach in the UK HE sector.)
Introduction to the KPMG Guidelines Report
The KPMG Guidelines “Management Information for Decision Making: Costing
Guidelines for Higher Education Institutions” (KPMG, 1997), released in July 1997,
aim to provide a set of guidelines which can be used by Institutional managers with or
without a financial management background. The Guidelines say that they provide a
range of costing methods, a set of working documents, not a prescription.
The study which led to the Guidelines identified good practice in UK HE Institutions
via a survey (administered by the Funding Councils) which questioned the Institutions
about their approach to costing. After this the Study Team conducted a detailed
review of requirements and current costing practice at ten volunteer Institutions.
This work had two main conclusions:
The UK HE sector places a high importance on accurate costing information.
An acceptable method of recording staff costs against activities was needed.
The report reminded the readers of the purposes of costing. For cost of teaching, it
stated that the main purposes were:

“The classic report on costs of e-learning, online learning and distance learning”
Bacsich et al. 48
To assist in pricing courses.
To assess the economic viability of courses.
To determine the cost-effectiveness of different methods of teaching.
But several other purposes that the Guidelines raise are relevant to Networked
Learning (we have added our comments in italics):
To assist in the use of staff and other resources for courses.
To support bids for external funding - e.g. UfI, Adapt - to mount courses.
To provide measurements for business process improvements, benchmarking or
value for money studies concerned with courses.
To allow comparison of costs with prices of courses e.g. at Masters level.
To inform internal recharging e.g. for Computing Centre support.
To assist in outsourcing decisions e.g. buying online curriculum material.
The UK HE sector financial regime
A typical UK University “Consolidated Income and Expenditure Account” will have
the following top-level categories for Income (the categories are fixed but the balance
between them varies widely between Institutions):
Funding Council grants
Academic Fees and Support Grants
Research Grants (not just RAE research) and Contracts
Other Operating Income (e.g. Catering, Conferences)
Endowment Income and Interest Receivable
The Expenditure part of the Consolidated Income and Expenditure Account contains
the following short list of “real” categories (we have ignored Interest Payable):
Staff costs
Depreciation (for capital equipment)
Other operating expenses
However, so that the schema can operate at any level within the Institution, we shall
add a further line, the one so easy to misunderstand:
Overhead
We shall use these top-level categories for all our analyses and comparisons.
Note that within conventional “closed-system” accounting conventions, the Overhead
item at the Institution level is defined to be zero. However, if one steps up to level -1,
that of the Funding Council, one sees that it is an example of a hidden cost. Not all the
money that a Funding Council gets is passed to its Institutions. Some of it goes to pay
for a central secretariat, some goes to JISC, etc.
If we link the stakeholder categories to the expenditure categories we get a matrix as
follows:
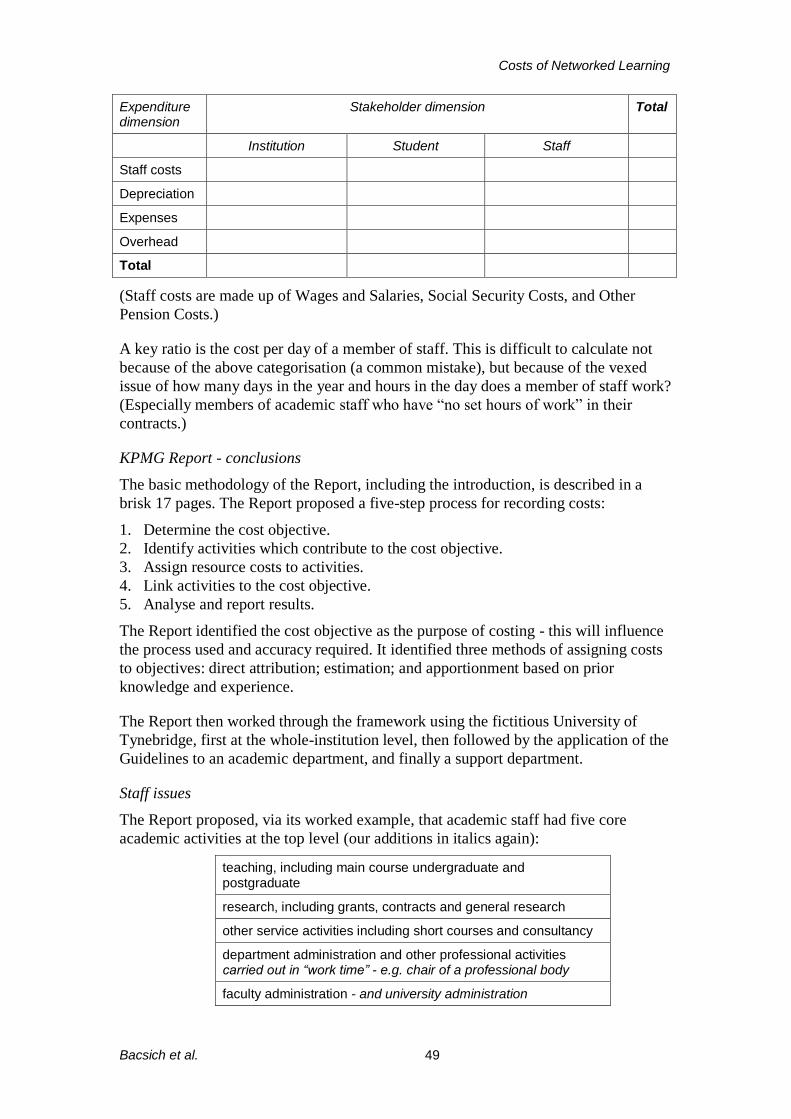
Costs of Networked Learning
Bacsich et al. 49
Expenditure dimension
Stakeholder dimension Total
Institution Student Staff
Staff costs
Depreciation
Expenses
Overhead
Total
(Staff costs are made up of Wages and Salaries, Social Security Costs, and Other
Pension Costs.)
A key ratio is the cost per day of a member of staff. This is difficult to calculate not
because of the above categorisation (a common mistake), but because of the vexed
issue of how many days in the year and hours in the day does a member of staff work?
(Especially members of academic staff who have “no set hours of work” in their
contracts.)
KPMG Report - conclusions
The basic methodology of the Report, including the introduction, is described in a
brisk 17 pages. The Report proposed a five-step process for recording costs:
1. Determine the cost objective.
2. Identify activities which contribute to the cost objective.
3. Assign resource costs to activities.
4. Link activities to the cost objective.
5. Analyse and report results.
The Report identified the cost objective as the purpose of costing - this will influence
the process used and accuracy required. It identified three methods of assigning costs
to objectives: direct attribution; estimation; and apportionment based on prior
knowledge and experience.
The Report then worked through the framework using the fictitious University of
Tynebridge, first at the whole-institution level, then followed by the application of the
Guidelines to an academic department, and finally a support department.
Staff issues
The Report proposed, via its worked example, that academic staff had five core
academic activities at the top level (our additions in italics again):
teaching, including main course undergraduate and postgraduate
research, including grants, contracts and general research
other service activities including short courses and consultancy
department administration and other professional activities carried out in “work time” - e.g. chair of a professional body
faculty administration - and university administration
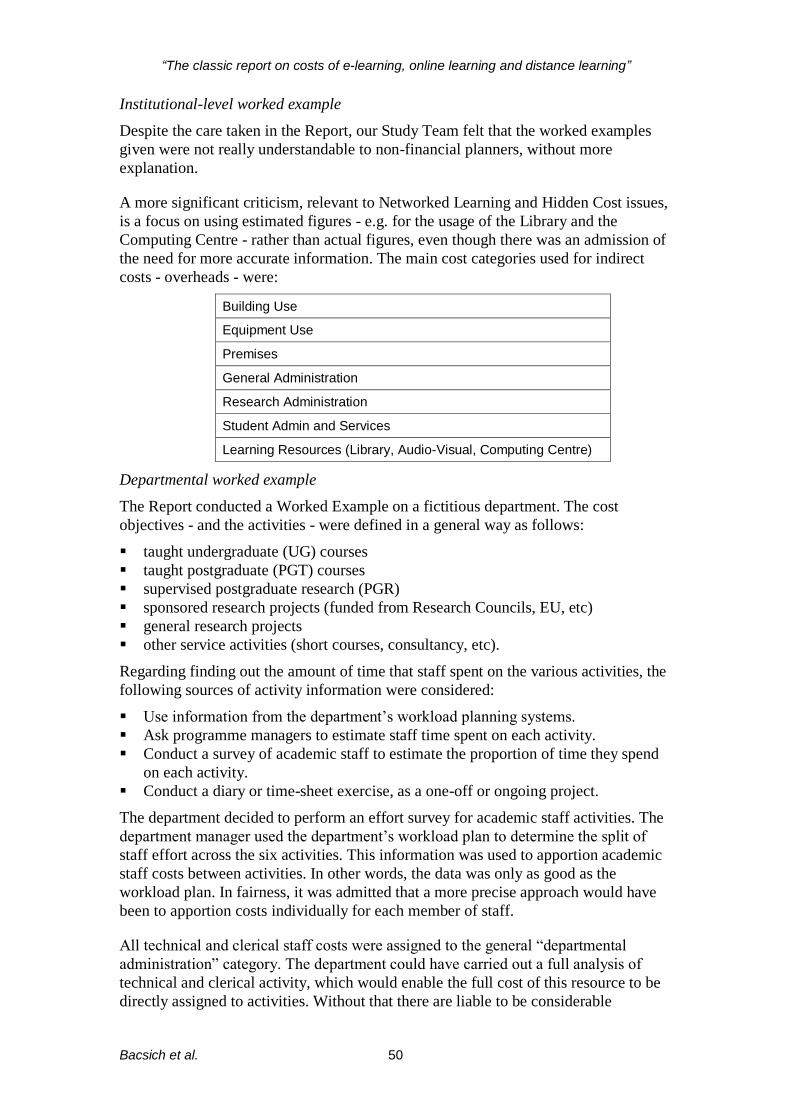
“The classic report on costs of e-learning, online learning and distance learning”
Bacsich et al. 50
Institutional-level worked example
Despite the care taken in the Report, our Study Team felt that the worked examples
given were not really understandable to non-financial planners, without more
explanation.
A more significant criticism, relevant to Networked Learning and Hidden Cost issues,
is a focus on using estimated figures - e.g. for the usage of the Library and the
Computing Centre - rather than actual figures, even though there was an admission of
the need for more accurate information. The main cost categories used for indirect
costs - overheads - were:
Building Use
Equipment Use
Premises
General Administration
Research Administration
Student Admin and Services
Learning Resources (Library, Audio-Visual, Computing Centre)
Departmental worked example
The Report conducted a Worked Example on a fictitious department. The cost
objectives - and the activities - were defined in a general way as follows:
taught undergraduate (UG) courses
taught postgraduate (PGT) courses
supervised postgraduate research (PGR)
sponsored research projects (funded from Research Councils, EU, etc)
general research projects
other service activities (short courses, consultancy, etc).
Regarding finding out the amount of time that staff spent on the various activities, the
following sources of activity information were considered:
Use information from the department’s workload planning systems.
Ask programme managers to estimate staff time spent on each activity.
Conduct a survey of academic staff to estimate the proportion of time they spend
on each activity.
Conduct a diary or time-sheet exercise, as a one-off or ongoing project.
The department decided to perform an effort survey for academic staff activities. The
department manager used the department’s workload plan to determine the split of
staff effort across the six activities. This information was used to apportion academic
staff costs between activities. In other words, the data was only as good as the
workload plan. In fairness, it was admitted that a more precise approach would have
been to apportion costs individually for each member of staff.
All technical and clerical staff costs were assigned to the general “departmental
administration” category. The department could have carried out a full analysis of
technical and clerical activity, which would enable the full cost of this resource to be
directly assigned to activities. Without that there are liable to be considerable

Costs of Networked Learning
Bacsich et al. 51
distortions between courses making heavy use of technical support - e.g. Networked
Learning courses - and courses making light use. A similar procedural weakness
affected the calculation of operating expenses including Computer Centre use.
Overall conclusions
This Report made useful progress on non-staff issues, and we shall use it as the basis
for future work - see later in the chapter.
However, it clouded over some important issues especially in the staff area and in the
area of overhead allocation. Implicitly, it took a conventional view both of teaching
and learning and of IT support. Note that it was completed before the Dearing
Committee reported.
8.1.2 Flashlight - US
The Study Team had been aware of the Flashlight project in general terms for some
time, and knew they were working on a costing methodology, but it came as a surprise
mid-way through the project when one of our advisors notified us that the release was
imminent. We contacted Flashlight immediately and after the usual negotiations,
gained access to a draft copy. (We now believe that this has been updated and slight
changes made, but do not believe the fundamental ideas to have changed.)
The Flashlight Cost Analysis Handbook claims that it has been created to help users
better understand the cost issues involved in incorporating new technologies into
teaching and learning, and that it hopes to promote the appropriate use of technology.
The Handbook provides a process for building an Economic Model which should help
readers to focus on the crucial, and “sometimes hidden”, uses of resources by
describing patterns between the use of resources such as time, money and space.
The Economic Model explores the relationship between the resources, units and
outputs (products or services) in terms of Activity Based Costing. Thus at that
strategic level it is totally consistent with our views.
The Handbook encourages readers to consult the publications of the (US) National
Association of College and University Business Officers (NACUBO), most recently
Jenny (1996) “A Cost Accounting Handbook for Colleges and Universities”. It also
refers to the KPMG report. It criticises the weakness of some other previous models.
It notes that there are many difficulties in accessing costs in Higher Education
including the various accounting methods used by different Institutions at different
stages, and the issues of hidden subsidies such as external funding.
Like the KPMG Guidelines, the Handbook uses examples and pilot projects in order
“to breathe life into the myriad of decisions that must be made in implementing and
evaluating an innovation”.
The Economic Model is completed in eight steps:
1. Identify the question of interest.
2. Identify the outputs.
3. Identify the activities completed to produce your outputs.
4. Identify the faculty/staff workload.

“The classic report on costs of e-learning, online learning and distance learning”
Bacsich et al. 52
5. Identify the resources consumed in the activities.
6. Identify the metrics/performance measures.
7. Calculate costs for each activity.
8. Aggregate the total cost and calculate the metric/performance measure.
The Handbook addresses each step in turn using the pilot project to illustrate
difficulties or specific examples of usage. This includes in Step 4 a breakdown of the
use of staff time as six categories: teaching, research/scholarship, professional growth,
administration, consulting/freelance work and “other”.
In Step 5, resources are put under three headings: Compensation (employee salaries
and benefits), Direct Non-Personnel Services (e.g. consumables), and Hidden Costs -
which are deemed to be depreciation, buildings costs, utilities etc. Delinger states:
For now, there are three types of Hidden Costs to consider: (1) administrative
overhead; (2) physical plant; and (3) activity-based costs related to a specific
course, but which might not get picked up in looking at a departmental balance
sheet.
The Flashlight Sample Model
Part three of the Handbook (Delinger et al., 1999) constructs a sample model using
examples from the pilot projects. It key point is that “one of the most critical steps in
cost analysis involves the process of defining activities and breaking these up into
tasks”.
Analysis
The eight-step methodology of Flashlight can be mapped into the five-step
methodology of KPMG as follows:
KPMG Flashlight
Determine the cost objective Identify the question of interest
Identify the outputs
Identify activities which contribute to the cost objective
Identify the activities completed to produce your outputs
Assign resource costs to activities Identify the resources consumed in the activities
Identify the faculty/staff workload
Identify the metrics/performance measures
Link activities to the cost objective
Analyse and report results Calculate costs for each activity
Aggregate the total cost and calculate the metric/performance measure
Academic staff time (Step 4) splits as follows:

Costs of Networked Learning
Bacsich et al. 53
KPMG Flashlight
Teaching, including main course undergraduate and postgraduate
Teaching
Research, including grants, contracts and general research
Research/scholarship, professional growth
Other service activities including short courses and consultancy
Consulting/freelance work
Department administration and other professional activities
Administration
Other
Faculty administration - and university administration
Administration
There is an interesting point about academic hours. In the UK, freelance work would
not usually be done within “work time”. Perhaps the Handbook recognises that in
some Institutions, freelance work can be carried on via the Institution as “paid
overtime”.
In Step 5, the resources classification fits the standard model as follows. Note that
Hidden Costs had to be split.
Standard Flashlight
Staff costs Compensation (employee salaries and benefits)
Depreciation Hidden Costs (depreciation)
Other operating expenses Direct, Non-Personnel Services (e.g. consumables)
Overhead Hidden Costs (not depreciation) - buildings costs and utilities etc.
Regarding Step 8, the idea of encouraging the developer to think of the Economic
Model as “a pyramid of linked spreadsheets, the first spreadsheet contains data on
total costs while those cells are linked to totals and sub totals on lower levels which
break the total and sub total costs down to individual cost categories for selected
activities and tasks” is a nice theory and a good analogy but mind-blowing in practical
application.
8.1.3 Rumble - world-wide (distance education oriented)
Rumble (1997) is in many ways the seminal textbook in this area; and as such
impossible to summarise. His suggested classification of costs maps into the standard
schema as follows (overleaf):
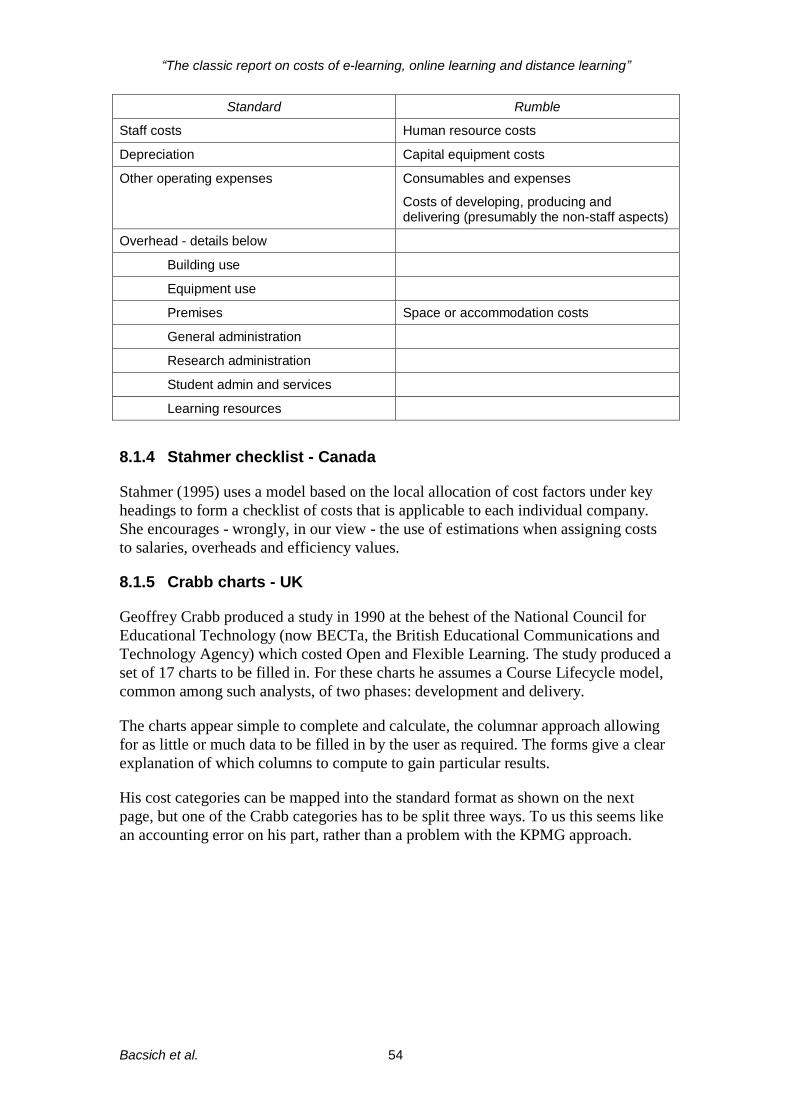
“The classic report on costs of e-learning, online learning and distance learning”
Bacsich et al. 54
Standard Rumble
Staff costs Human resource costs
Depreciation Capital equipment costs
Other operating expenses Consumables and expenses
Costs of developing, producing and delivering (presumably the non-staff aspects)
Overhead - details below
Building use
Equipment use
Premises Space or accommodation costs
General administration
Research administration
Student admin and services
Learning resources
8.1.4 Stahmer checklist - Canada
Stahmer (1995) uses a model based on the local allocation of cost factors under key
headings to form a checklist of costs that is applicable to each individual company.
She encourages - wrongly, in our view - the use of estimations when assigning costs
to salaries, overheads and efficiency values.
8.1.5 Crabb charts - UK
Geoffrey Crabb produced a study in 1990 at the behest of the National Council for
Educational Technology (now BECTa, the British Educational Communications and
Technology Agency) which costed Open and Flexible Learning. The study produced a
set of 17 charts to be filled in. For these charts he assumes a Course Lifecycle model,
common among such analysts, of two phases: development and delivery.
The charts appear simple to complete and calculate, the columnar approach allowing
for as little or much data to be filled in by the user as required. The forms give a clear
explanation of which columns to compute to gain particular results.
His cost categories can be mapped into the standard format as shown on the next
page, but one of the Crabb categories has to be split three ways. To us this seems like
an accounting error on his part, rather than a problem with the KPMG approach.
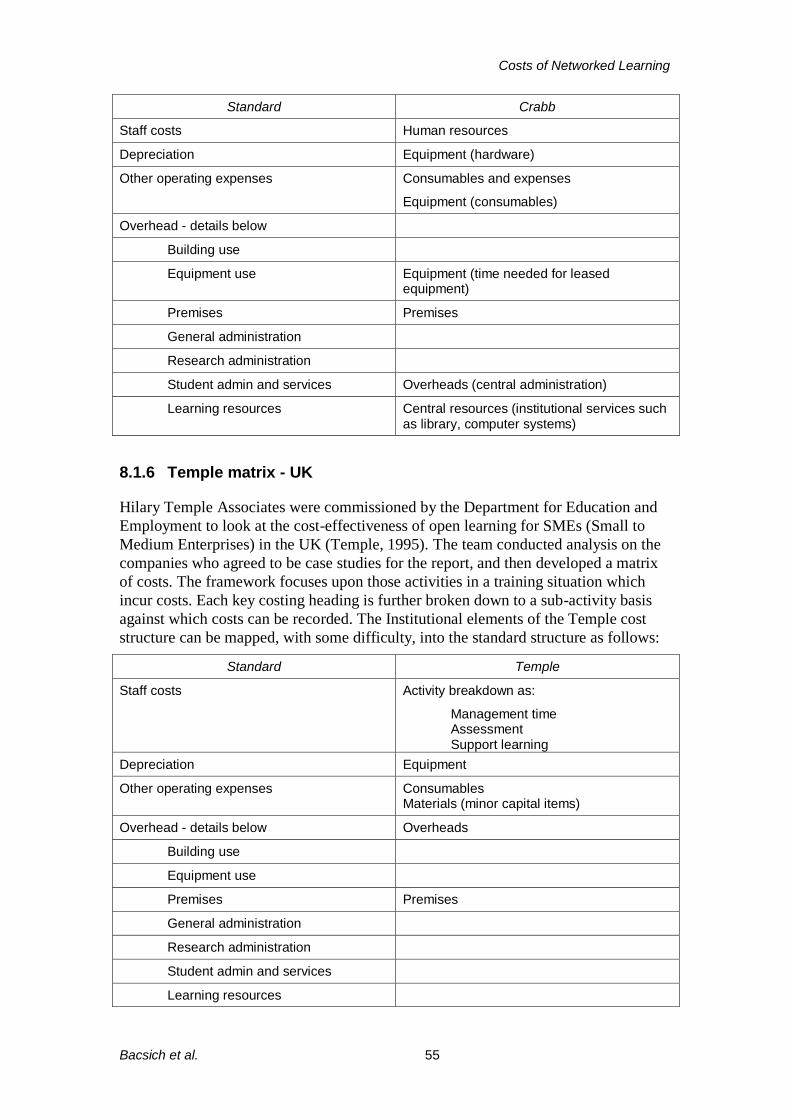
Costs of Networked Learning
Bacsich et al. 55
Standard Crabb
Staff costs Human resources
Depreciation Equipment (hardware)
Other operating expenses Consumables and expenses
Equipment (consumables)
Overhead - details below
Building use
Equipment use Equipment (time needed for leased equipment)
Premises Premises
General administration
Research administration
Student admin and services Overheads (central administration)
Learning resources Central resources (institutional services such as library, computer systems)
8.1.6 Temple matrix - UK
Hilary Temple Associates were commissioned by the Department for Education and
Employment to look at the cost-effectiveness of open learning for SMEs (Small to
Medium Enterprises) in the UK (Temple, 1995). The team conducted analysis on the
companies who agreed to be case studies for the report, and then developed a matrix
of costs. The framework focuses upon those activities in a training situation which
incur costs. Each key costing heading is further broken down to a sub-activity basis
against which costs can be recorded. The Institutional elements of the Temple cost
structure can be mapped, with some difficulty, into the standard structure as follows:
Standard Temple
Staff costs Activity breakdown as:
Management time Assessment Support learning
Depreciation Equipment
Other operating expenses Consumables Materials (minor capital items)
Overhead - details below Overheads
Building use
Equipment use
Premises Premises
General administration
Research administration
Student admin and services
Learning resources

“The classic report on costs of e-learning, online learning and distance learning”
Bacsich et al. 56
8.1.7 Jewett’s “Bridge” model - US
The above schemas have been paper-based. Computational models allow the user to
input a series of figures, view the result and then change the parameters to allow for
different scenarios to be pursued.
The Bridge model (Jewett, 1998) was developed by Frank Jewett of the California
State University as part of the project “Case Studies in Evaluating the Benefits and
Costs of Mediated Instruction and Distributed Learning”. The model was programmed
using Microsoft Visual Basic 5.0 and Excel 6.0. It is different from the previous
models in that it operates only at the Institutional level.
The model graphically compares the operating and capital costs of two campuses over
30 years. The first is a campus using traditional methods of course delivery - this is
represented on the graph as a constant line, presuming that these costs will remain
unchanged. The second campus is increasingly adopting a “distributed learning”
approach and can have its costs simulated and represented graphically. The user is
able to increase or decrease certain cost categories for both broadcast and
asynchronous courses and to see the effects of these changes instantaneously
represented graphically. The user also has the option to show operating, capital or
total costs on the graph, and to access the underlying spreadsheets.
The four main cost drivers are: Final Enrolment Distribution, Mediated Course
Enrolment, Broadcast Course Specifications, and Asynchronous Course
Specifications.
Although highly detailed and conceptually interesting this model provides no concrete
help to those engaged in developing just one Networked Learning course in part of an
Institution.
8.1.8 Shepherd’s “Cost-Benefit Calculator” - UK
The Cost-Benefit Calculator was produced by Clive Shepherd (1998) for the EPIC
Group, UK. It is a tool allowing one to view both tabular and graphical
representations of both the costs and the benefits of Intranet-based training. The
author realises that many will doubt the feasibility of a generic calculator but he
assures potential users that much consultation, experience and testing went into
development of the tool.
The data used to drive the tool is collected in three phases:
Set-up - collects information about the user, the organisation and the proposed
uses of the Intranet.
Costs - collects information about capital and revenue costs.
Benefits - collects data about the possible benefits that could be experienced.
Initially each field contains default data (based on his research) - but even the smallest
alteration of this data can lead to dramatic results in the reporting stages.
Four individual reports are available in both tabular and graphical form. The first two
are simple summaries of the costs and benefits, the third shows the costs and benefits
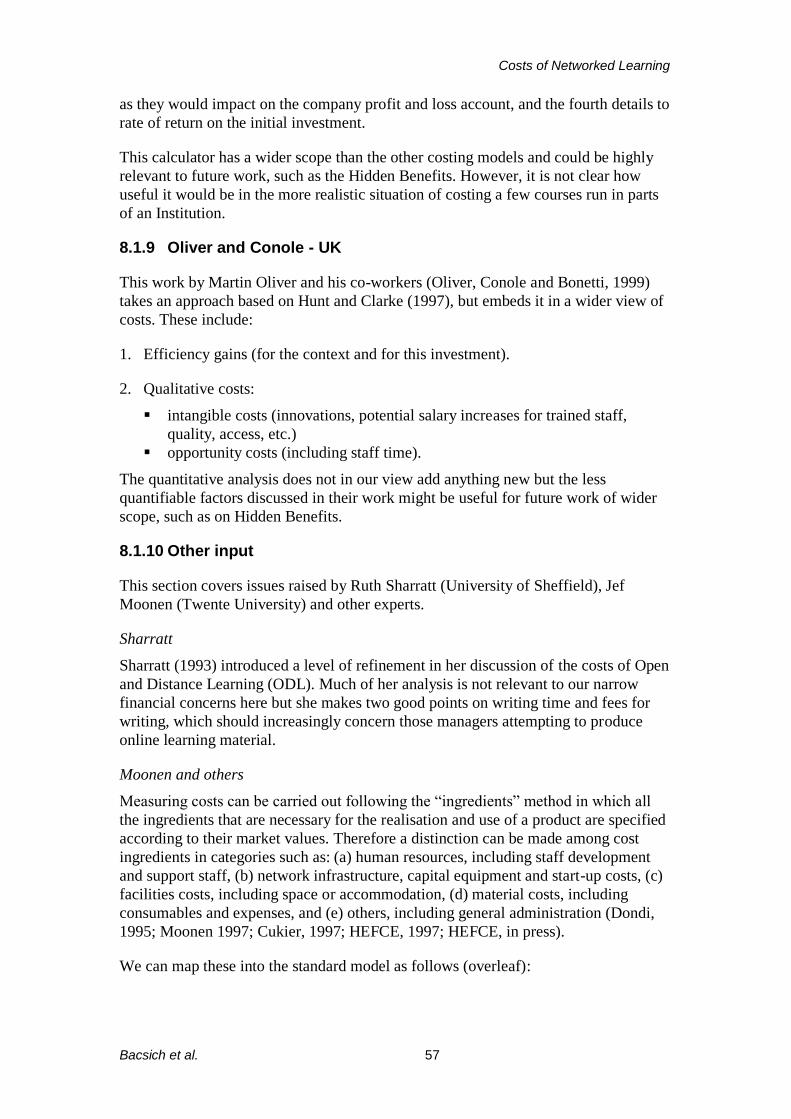
Costs of Networked Learning
Bacsich et al. 57
as they would impact on the company profit and loss account, and the fourth details to
rate of return on the initial investment.
This calculator has a wider scope than the other costing models and could be highly
relevant to future work, such as the Hidden Benefits. However, it is not clear how
useful it would be in the more realistic situation of costing a few courses run in parts
of an Institution.
8.1.9 Oliver and Conole - UK
This work by Martin Oliver and his co-workers (Oliver, Conole and Bonetti, 1999)
takes an approach based on Hunt and Clarke (1997), but embeds it in a wider view of
costs. These include:
1. Efficiency gains (for the context and for this investment).
2. Qualitative costs:
intangible costs (innovations, potential salary increases for trained staff,
quality, access, etc.)
opportunity costs (including staff time).
The quantitative analysis does not in our view add anything new but the less
quantifiable factors discussed in their work might be useful for future work of wider
scope, such as on Hidden Benefits.
8.1.10 Other input
This section covers issues raised by Ruth Sharratt (University of Sheffield), Jef
Moonen (Twente University) and other experts.
Sharratt
Sharratt (1993) introduced a level of refinement in her discussion of the costs of Open
and Distance Learning (ODL). Much of her analysis is not relevant to our narrow
financial concerns here but she makes two good points on writing time and fees for
writing, which should increasingly concern those managers attempting to produce
online learning material.
Moonen and others
Measuring costs can be carried out following the “ingredients” method in which all
the ingredients that are necessary for the realisation and use of a product are specified
according to their market values. Therefore a distinction can be made among cost
ingredients in categories such as: (a) human resources, including staff development
and support staff, (b) network infrastructure, capital equipment and start-up costs, (c)
facilities costs, including space or accommodation, (d) material costs, including
consumables and expenses, and (e) others, including general administration (Dondi,
1995; Moonen 1997; Cukier, 1997; HEFCE, 1997; HEFCE, in press).
We can map these into the standard model as follows (overleaf):
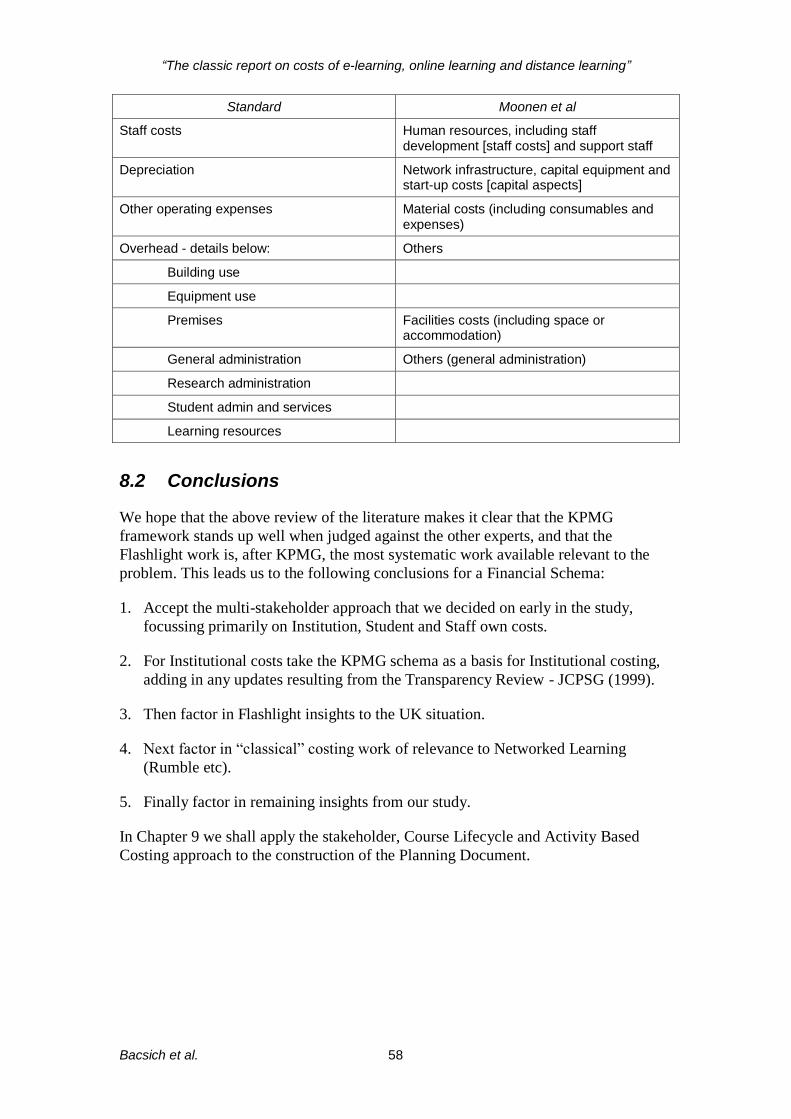
“The classic report on costs of e-learning, online learning and distance learning”
Bacsich et al. 58
Standard Moonen et al
Staff costs Human resources, including staff development [staff costs] and support staff
Depreciation Network infrastructure, capital equipment and start-up costs [capital aspects]
Other operating expenses Material costs (including consumables and expenses)
Overhead - details below: Others
Building use
Equipment use
Premises Facilities costs (including space or accommodation)
General administration Others (general administration)
Research administration
Student admin and services
Learning resources
8.2 Conclusions
We hope that the above review of the literature makes it clear that the KPMG
framework stands up well when judged against the other experts, and that the
Flashlight work is, after KPMG, the most systematic work available relevant to the
problem. This leads us to the following conclusions for a Financial Schema:
1. Accept the multi-stakeholder approach that we decided on early in the study,
focussing primarily on Institution, Student and Staff own costs.
2. For Institutional costs take the KPMG schema as a basis for Institutional costing,
adding in any updates resulting from the Transparency Review - JCPSG (1999).
3. Then factor in Flashlight insights to the UK situation.
4. Next factor in “classical” costing work of relevance to Networked Learning
(Rumble etc).
5. Finally factor in remaining insights from our study.
In Chapter 9 we shall apply the stakeholder, Course Lifecycle and Activity Based
Costing approach to the construction of the Planning Document.
Costs of Networked Learning
Bacsich et al. 59
9. The Planning Document
“A key component of this new attitude is activity-based costing, where the
allocation of an overhead department’s costs to products is made on the
basis of the cause/effect relationship between the product and the activity
levels it causes in the department. Thus the costs of a quality control
function may depend as much on the complexity of the product, as on the
volume produced.”
Howson & Mitchell (1995)
9.1 Introduction
The final outcome of this project is a Planning Document, which used in conjunction
with the accompanying Financial Schema, as described in the last chapter, can help to
record and understand the “true costs” of Networked Learning. Together the Planning
Document and Financial Schema form a Planning Framework.
This chapter describes a proposed Planning Document, which is then demonstrated
through a brief worked example.
However, the Planning Document and Financial Schema will need a considerable
amount of further work and consultation - and staff training - before they can be used
routinely by the HE sector.
9.2 Planning Framework
Any proposed Planning Framework needs to resonate with financial managers,
planners, administrative staff and academic staff, and therefore needs to be
understandable and usable with the minimum amount of guidance. The Framework
also needs to be based on tried and accepted methods. The Framework is expected to
be relevant to different approaches to Networked Learning and make especially
apparent which costs should be recorded and where, thus eliminating Hidden Costs.
Similar to our proposals for the Financial Schema, we propose a Planning Document
with the following features:
1. It can operate at the level of a whole Institution; a department or faculty; a course;
or a unit (module) within a course.
2. It takes account of the costs incurred (or saved) by the additional stakeholders in
the learning process other than the Institution - in other words, it does not treat the
Institution as a closed system. The three Primary Stakeholders, identified in
Chapter 3, are the Institution, Staff and Students.
3. It is based on Activity Based Costing (following KPMG work) as described in
Chapter 8.
4. It takes account of the division of academic time into Research, Teaching and
Administration.

“The classic report on costs of e-learning, online learning and distance learning”
Bacsich et al. 60
5. It takes account of the Activities within the course development process and
proposes a model for these, the three-phase model, if there is no existing model
relevant. The three-phase Course Lifecycle model involves both the learning
experience and student environment, through Planning and Development;
Production and Delivery; and Maintenance and Evaluation.
6. It is flexible in terms of allocation of overheads, with an orientation to overheads
based on actual usage rather than estimation.
7. This implies that it will require some kind of recording of academic effort spent
on activities.
The challenge is: can we find an existing framework to adapt, or do we have to create
a brand new one?
9.3 Input from the literature
The Study Team has surveyed the research literature produced by major academic
authorities which is relevant to the area of planning and decision-making in the use of
Information and Communications technology for teaching in Higher Education. With
one exception, there is in our view relatively little in this literature of value to
planners and finance staff. The exception is the work by Bates (1995).
Tony Bates
In his book “Technology, Open Learning and Distance Education”, Bates (1995)
devotes a great deal of attention to the planning process, or as he calls it, “Building a
framework for decision-making”.
His rationale requires a framework to have the following features:
1. It will work in a variety of contexts.
2. It allows decisions to be taken at both a strategic or Institution-wide level, and at a
tactical or instructional level.
3. It gives equal attention to instructional and operational issues.
4. It will identify crucial differences between different technologies, thus enabling an
appropriate mix of technologies to be chosen for any given context.
5. It will accommodate new developments in technology.
This resonates closely with our concerns. However, he does not state explicitly
(though we believe it to be implicit in his work) that the framework should
accommodate conventional teaching and learning solutions.
His framework has received a great deal of attention around the world. It is called
ACTIONS - which stands for:

Costs of Networked Learning
Bacsich et al. 61
Access How accessible is a particular technology for learners? How flexible is it for a particular target group?
Costs What is the cost structure of each technology? What is the unit cost per learner?
Teaching and
Learning What kinds of learning are needed? What instructional approaches will best meet this need? What are the best technologies for supporting this teaching and learning?
Organisational
issues What are the organisational requirements and the barriers to be removed, before this technology can be used successfully? What changes in organisation can be made?
Novelty How new is this technology?
Speed How quickly can courses be mounted with this technology? How quickly can materials be changed?
Though the ACTIONS framework is popular with educational technologists and
theorists of online learning, there are some concerns that we have with the particular
presentation of his approach. The main one is that as the scale of use of
Communications and Information Technology grows, decisions on courses that make
use of it are likely to have to be taken at a high level in Institutions. These senior
management levels are on the whole comfortable with financial decision-making and
the language in which this is articulated, and with the general educational context, but
less comfortable with the subtleties of the language of educational technology. (A
similar worry is often expressed about decision-making concerning IT systems).
There are also some threats to the status quo, and those who uphold it, in the
framework that Bates proposes, with his focus on Organisational issues and its
overtones of re-engineering. And though Bates himself says that Novelty is a “two-
edged sword”, it could be thought surprising that it rates as one of the top six decision
criteria.
Our conclusion is that we like the framework but are concerned about the vocabulary
and the apparent over-importance of some of the criteria.
Sir John Daniel
Daniel (1996) in his magisterial “Mega-universities and Knowledge Media”, does not
deal specifically with the planning process, despite the thoroughness with which the
Open University plans its courses. However, he recommends the “excellent guide
provided by Bates”, namely the ACTIONS methodology, as the way to proceed, once
a technology strategy is in place.
Diana Laurillard
In “Rethinking University Teaching” (Laurillard, 1993), the index does not mention
‘strategy’, ‘plan’, ‘decision-making’ or any similar terms. However, there is a
planning procedure implicit in the book. Chapter 10 “Designing Teaching Materials”,
gives the following procedure for doing so, based on the ‘conversational framework’:
1. Define learning objectives.
2. Identify students’ needs.
3. Design the learning activities.
4. Consider the interface implications (of the systems).
5. Consider the comparative development costs.
“The classic report on costs of e-learning, online learning and distance learning”
Bacsich et al. 62
Greville Rumble
Rumble’s masterwork “The Costs and Economics of Open and Distance Learning”
(1997) contains, as expected, a great deal on costing, but not much on planning and
strategy.
Other authors
The other authors that we have analysed have given us useful input on the Course
Lifecycle and in some cases, in particular Delinger et al. (1999), on the Financial
Schemas, but do not shed much light on an appropriate planning model to use.
Conclusion
Inasmuch as there is a consensus from the educational technology and distance
education authorities, the work of Bates seems to set the benchmark. Our main
objection is that this framework does not use the language and concepts familiar to
financial planners in UK universities. But this objection is fixable.
9.4 HEFCE work
HEFCE (1999) has recently looked again at the planning process, in the HEFCE
Guide 99/21 of March 1999, “Appraising investment decisions”. At first sight it looks
like another weighty document of interest only to Estates and Finance Departments;
however, the methodology can be used more generally - and indeed in one of its
annexes (Annex C) it actually outlines how the methodology can be used to decide on
a teaching and learning issue - with even a hint of Networked Learning!
The key is in a quote from the introduction to the document:
It sets out a framework for the appraisal process which Institutions can use for
all kinds of decision making. The details may vary but the same principles
apply across a whole range of decisions. They are as valid for a decision about
setting up a new course as for one about property options, and Institutions can
tailor the process to suit their individual circumstances.
As an exercise one of the Study Team rewrote the HEFCE document to reposition it
fully to the development of courses, and in the team’s view the result is surprisingly
convincing.
What the HEFCE document lacks is the educational framework. We recommend that
this is added from the authoritative work of Bates.
To summarise, instead of trying (as several have done) to transform educators’
attempts at course planning into planners’ language, we propose to transform
planners’ attempts at planning into educators’ language. This has the additional
advantage in that as decisions about Networked Learning begin to impact on the
Estates Strategy (e.g. by substituting home-based learning for lecturing or by
providing video lecturing to remote sites), at least both sides of the debate will speak
the same language.

Costs of Networked Learning
Bacsich et al. 63
9.4.1 HEFCE planning with educational modifications
In the next few paragraphs we outline our approach. Paragraph numbers reference the
HEFCE report. Bold capital letters are from the ACTIONS methodology of Bates.
The following steps are the main steps in the appraisal process (¶13):
1. Define the objectives.
2. Consider the options.
3. Identify, quantify and where possible value the costs, benefits, risks and
uncertainties associated with each option.
4. Analyse the information.
5. Present the results.
This process should be done at least twice: first for an outline business case, then
refining the most plausible of the options into a full business case (¶ 16).
Establishing the outline business case is broken down as follows (¶ 18). After each
point we make some brief remarks which are our interpretations of the key points to
consider - for these we follow the Bates approach.
1. Define the objectives:
Identify the need or problem.
What is the learning need? Where can it be satisfied (campus, home,
workplace)?
Consider the strategic context.
Consider the C&IT strategy - Technology Strategy in the terms of Daniel
(1996) - the Teaching and Learning strategy, the Estates strategy (especially if
there is a move to reduce or change the type of accommodation needed for
teaching), and other relevant policy documents.
Decide objectives.
What is the content - learning activities which the course will be expected to
provide, and the context - the facilities or services needed to carry out these
activities? What are the time, cost and quality aspects? Do not over-specify
these (especially with C&IT).
2. Identify the options.
Consider a wide range of options, including the “do nothing” option. Be open-
minded and rethink university teaching (Laurillard, 1993), change organisational
aspects (Bates, 1995), or even re-engineer (Bacsich, 1998).
3. Assess outline costs and benefits.
This is the point to consider the other stakeholders. What are the costs to students?
Are you making assumptions about staff overtime or staff use of their own
equipment? The Institution may be getting funds for the course from an outside
agency - what are their views?

“The classic report on costs of e-learning, online learning and distance learning”
Bacsich et al. 64
4. Analyse the information:
Select a preferred solution.
Make sure that it is viable - there is no point in recommending the “best of a bad
lot”.
Initial assessment of affordability.
The preferred solution may be unaffordable, and the second-best should then be
considered.
5. Present the results.
Each Institution has its own procedure for “signing off” a course - this may
involve several steps (and iterations).
Developing a full business case involves the following additional aspects (¶ 34):
1. Confirm assumptions of outline business case.
The parameters might have changed just because of the passage of time. In
particular, many more students might now have Internet access.
2. Consider procurement routes.
It may be that consultant writers should be hired or specialist content bought in,
rather than just hiring more academic staff.
3. Assess financing options.
This is especially important if the expenditure reaches a “risky” fraction of the
departmental budget.
4. Reassess and select preferred solution.
Risk and uncertainty analysis should be carried out, especially if Novelty of
technology is an issue (Bates).
9.4.2 Some issues raised by this process
Appraising non-financial aspects
Appraisals will have to handle non-financial aspects differently, depending on how
easily they can be measured. They can be categorised as (¶ 51):
1. Benefits which can be valued.
2. Benefits which can be measured in some other way.
3. Benefits which cannot be measured at all in conventional terms.
Alternatives may offer different levels of satisfaction (from ¶ 55):
the contribution to an Institution’s long-term strategy
political acceptability, e.g. of charging students even implicitly for C&IT
enhancement of the Institution’s academic image
protecting an Institution’s market position as lifelong learning takes off.
Valuing risk and handling uncertainty
Risk analysis can be handled by standard techniques (¶ 85-89). Uncertainty analysis is
also crucial - one should test the effects of altering key assumptions by sensitivity

Costs of Networked Learning
Bacsich et al. 65
analysis (¶ 90-94). There are many obscurities in the educational process. Some
topical examples under the Bates themes are:
Access - how many students have good Internet connections?
Teaching and Learning - how effective, in detail, are new methods? (The literature
is full of controversy - the “no significant difference” issue.)
Interaction - how well will students learn a new Web-based email system?
Organisational - can our Computing Service really move to 24x7 working to
support students in all time zones for a global course?
Novelty - is streaming video really going to work well enough to be educationally
effective?
Speed - and how soon will it work, soon enough for our course to thrive
financially as well as educationally?
9.4.3 Presenting the results
The results of an appraisal should be set out in a report covering (¶ 101):
the strategic context
the objectives
the options considered
the results obtained, in both financial and non-financial terms
the preferred option(s)
how the preferred option(s) compare with the alternatives
how the risks have been evaluated
the sensitivities of the preferred option(s) to variations in key assumptions
the impact on the department’s financial position
how and when the project will be monitored and evaluated.
9.4.4 An appraisal checklist
We have reworked Annex A of the HEFCE report into the language of teaching and
learning as follows:
Specifying the objectives
How does this appraisal relate to the strategic aims of the department?
Is the teaching and learning requirement clearly defined?
Are the objectives supported by a strategic plan?
Identifying the options
Has a sufficiently wide range of options been considered?
Has the ‘do nothing’ or ‘do minimum’ option been explicitly considered?
Have all realistic procurement options been appraised (including innovative
forms of procurement such as buy-in of content, use of consultant writers)?

“The classic report on costs of e-learning, online learning and distance learning”
Bacsich et al. 66
Valuing costs, benefits, timing, risks and uncertainties
Has account been taken of all the direct costs and benefits accruing to the
department?
Are there any wider considerations?
Have all relevant costs, income streams and benefits (over the life of the
course) been included?
Has allowance been made for running costs over the life of the course?
In particular, have course maintenance (including running update) costs over
the life of the course been taken into account?
Does the appraisal take account of assets that are already owned (opportunity
costs)?
Is there any double-counting of costs and benefits?
What allowance has been made for non-financial aspects?
Have uncertainties in key assumptions been identified and tested?
Have risks been assessed and valued?
Assessing affordability
Has the impact on the department’s overall financial position been assessed?
Can the department accept the best and worst case scenarios?
Presentation of results
How does the chosen option compare with the alternatives?
Are the results set out clearly, in an appraisal report, in a logical order and
with all relevant assumptions made clear?
Are tables available showing the details of costs and benefits for all options?
Do they show the effects of risks?
Do they show the influence of sensitivities?
Is the overall financial impact clear?
Monitoring and evaluation
Is provision made for monitoring throughout the Course Lifecycle?
Are proposals included in the appraisal report for evaluating the course once
implemented?
Is the timescale for evaluation defined?
9.5 A worked example
In the interests of space, we have given this worked example in narrative form -
however, it covers most of the issues raised by our Planning Framework. It is planned
for there to be an Annex giving a full Planning Document and Financial Schema for
this example.
The University of Rother Bridge is concerned to ensure that it makes a good impact
on its local region. Regional development is now high on the local agenda. The
University has a thriving Department of Regional Development, but most of its work
has been done in far-away regions including outside the UK. The local region has
identified a shortage of regional development experts.
Idea: Develop a Masters programme in Regional Development!

Costs of Networked Learning
Bacsich et al. 67
Define the objectives
To teach a Masters Programme in Regional Development oriented to students in the
region. The strategic context is clear: this is consistent with university and
departmental strategy. The department has the expertise.
Consider the options
The crucial option choice is: Full-time or part-time?
Identify, quantify and where possible value the costs, benefits, risks and uncertainties
associated with each option
The following conclusions come from market research with current employers.
Students going straight from a first degree through a full-time Masters will be
regarded in the region as “wet behind the ears”. Releasing existing regional
development staff for a 1-year full-time course is infeasible - there are already staff
shortages in the region. Thus it must be a part-time course. Employers will pay,
something, towards a suitable course for their staff.
Analyse the information
Find out the numbers of potential students in the region. Is it as high as regional
enthusiasts say it is?
Present the results
The outline business plan recommends a part-time Masters course oriented to staff
currently in employment in the region. Doing nothing is not an option - there is a high
risk that the university in the adjacent region will fulfil the need.
Full business case
The sub-options to consider are the mode of part-time course. These include:
1. Day-release
2. Evening class
3. Weekend courses
4. Distance learning, workplace-based
5. Distance learning, home-based.
Mode 1 is a non-starter. Mode 5 seems boring - they have too many books and reports
to read already. Mode 2 looks promising until department staff analyse the lifestyle of
potential students - the region is too dispersed and potential students have too much
travel in the week and too many late meetings. Modes 3 and 4 look the best. Mode 4
fits the EU agenda; but starts to fall foul of the chaotic and stressful nature of office
life and PC usage in the typical regional development department. Mode 3 seems the
best choice but is not popular with the students or their families (they want to relax at
the weekends). Mode 3 is not popular with the academic staff until they realise that a
suitable package can be negotiated for weekend working including the feature that
teaching hours can be “burned off” quickly, leaving more weeks free for research.
Mode 5 is revisited - a pedagogic expert is brought in and suggests that the course is
constructed to be experience- and evidence-based, concentrating on the kind of books
and reports that such staff have to master anyway, and using online group discussion
over the Internet.

“The classic report on costs of e-learning, online learning and distance learning”
Bacsich et al. 68
In the end, for pedagogic reasons, the course is articulated as mixed mode (Modes 5
and 3) - with minor elements of Mode 4 added for political reasons (including
attracting funding).
Market research establishes that many potential students, including those most
interested in the course, have PC and Internet at home - some for family reasons,
others because they use them for work. It is decided that such a constituency will form
the initial basis for the course. (It was accepted with reluctance that some students
would thus be left out, at least initially.) There was some student reluctance to use the
Internet even more than they do already. (There was no cable operator in the region
offering really cheap Internet telephone calls.) However, it was pointed out that unlike
many other students doing distance education, students on this course would not incur
any travel costs or travel time, other than for the occasional weekend events.
Unusually, quite a lot of the online learning work is planned to be oriented to the
weekends, rather than the evenings (due to the lifestyle of potential students).
There was a brief flurry of technology-driven interest in using videoconferencing on
the course, which died away when market research showed that none of the main
employers for potential students had videoconferencing systems.
The staff position is considered. Is the course likely to impact on staff own time and
resources? The time element at weekends has been negotiated - but it is realised that
staff will have to teach online in the evenings and this is added to contact hours
allocations in the work plan (Rother Bridge is a post-1992 university).
The staff resource element has so far been ignored (not unusually). It is agreed that
the core staff teaching on-line on the course will be loaned a PC to use at home, or a
laptop to use while travelling (if they have a PC at home). Since laptops have been in
traditional short supply in the department, this scheme seems to motivate staff.
The debate now moves to the amount of online material that must be created. Is the
course to be in the popular Open University tradition of being resource-rich, allowing
less online teaching? Or will it be teaching-rich? Lobbying from the Multimedia
Centre is resisted, on the grounds that the development costs for multimedia material
would be a large fraction of the departmental non-staff budget - too risky. There is
also the Speed issue to be considered - multimedia is felt to take too long to develop
and this course has to be delivered soon to hit the EU regional agenda. The
compromise chosen is to make the course material Web-based, professionally but not
over-excitingly designed. Staff hours to develop content are allocated, on a “pseudo-
contact hours” basis (using a tradition taken from some other departments at Rother
Bridge who have developed print-based distance learning for some years).
An argument builds up about teaching hours. One of the staff works part-time for the
Open University and is aware of the issue that online teaching is said to take more
time than face to face. The Head of Department agrees to put in a “fudge factor” of
1.2 compared with the face to face system (staff asked for 1.5). This is easily covered
from the income projections for the course.
The plan also assumes external consultants are brought in to do the course Web
design and to train staff to teach online. This is the first course that the Department
Costs of Networked Learning
Bacsich et al. 69
has taught online, so this is regarded as an acceptable once-off cost. Provided that the
course enrolments are as predicted (40 in the first year), this start-up cost can be
absorbed.
There are some other minor costs for software licenses but not significant in the
business plan. There is an argument with the Computer Centre over what exactly the
departmental overhead charged by them entitles the department to.
Endless discussions take place about whether subsidies to students should be built into
the business plan. (EU funding rules allow a course oriented to “minorities” to attract
subsidies in some cases.) In the end it is decided to ignore such subsidies for the
purposes of the business plan, thus regarding any such subsidy as a bonus.
The initial budget for the course assumed that the course would run unchanged for 5
years. After consulting with potential students and their employers, it became clear
that the course material would go out of date much more quickly - thus the final
budget assumed that 25% of the course material would be rewritten each year.
Non-financial benefits of the course are seen as:
Contributing to the university’s involvement with the region.
Pushing forward the university’s lifelong learning agenda (while quietly making
an operating surplus on the course).
Protecting the university’s reputation as an innovator.
Maintaining the university’s reputation for relevant research since the
department’s research results can now be deployed in service of the region.
The presentation of the results is written up in the approved format. Spreadsheets are
included but are not allowed to dominate the report. A PowerPoint presentation of the
business and educational case is also produced by the course team for use at course
planning and regional meetings.
9.6 Summary
It is impossible to test as well as develop a methodology of this nature in six months.
However it is hoped that this chapter gives a flavour of how the Planning Document
would be used in reality. The Study Team are planning to continue work on the
Document after the project has officially finished and a Handbook, with real (not
hypothetical) examples, will be made available as an Annex to this Final Report in the
near future.
“The classic report on costs of e-learning, online learning and distance learning”
Bacsich et al. 70
10. Dissemination
“It is a very sad thing that nowadays there is so little useless
information.”
Oscar Wilde (1854-1900)
Although this project has been small, in terms of both funding and length, it is
expected that its impact will be extensive. Therefore a number of dissemination
activities have already taken place and several are planned for the future. These are
detailed at length below.
10.1 Final Report
The Final Report is a key dissemination activity of this project. When approved, it
will be sent to all Institutions who completed the questionnaire and participated in the
interview process. It will also be sent to all key agencies. All speakers and delegates
of the FLISH conference, who request it, will also be sent a complimentary copy of
the Final Report, as will the other major costing-related projects around the world.
The report will also be available on request via the project Web site, and will be
posted there as a pdf file after 12 months.
10.2 Conferences
A short report on conferences attended by the Study Team to disseminate the project
can be found in Appendix 4.
The 1999 “Flexible Learning on the Information SuperHighway” conference
(FLISH99) was organised by the Virtual Campus team at Sheffield Hallam University
specifically to disseminate the interim findings of the project and to bring together
costings experts to advise and further the ideas of the Study Team. Both Paul Bacsich
and Charlotte Ash, from here on referred to as the dissemination team, made
presentations at the conference and all team members reported on the informal
discussions conducted during refreshments and social events.
In June 1999, the dissemination team travelled to Seattle, USA, to present a work-in-
progress paper at ED-MEDIA99. This was a worthwhile event and much interest in
the project was shown by other delegates, both in the presentation and informally.
During this period, Kim Boniwell and Leon Kaplan presented at the Sheffield Hallam
University internal Teaching and Learning conference. The paper concentrated on the
student issues identified during the project and the reception was generally in
approval, but attendees were cautious of the results due to the small size of the sample
group.
On 1 July 1999, the dissemination team presented a paper on the project at the
Teaching and Learning Conference at Sunderland University. Again this activity
evoked much interest from both academics and senior level management who
attended.

Costs of Networked Learning
Bacsich et al. 71
In early September 1999 Paul Bacsich presented a paper at the 1999 International
Meeting of University Administrators (IMUA) at Edinburgh University. The paper
concentrated on the study’s impact on this particular segment of university staff as it
is believed that without the support of administrators the Planning Framework is
unlikely to succeed.
The study was also represented at the Association for Learning Technology
Conference (ALT-C) at the University of Bristol in September 1999. In line with the
conference theme a paper was presented entitled “Costing the Lifecycle of Networked
Learning - From Conception to Completion”.
Paul Bacsich has been invited to Israel in October to present a paper at the Euro-Med
conference “Technology in Learning Environments: The Learning Citizen”. The
paper is entitled “Planning and Costing Virtual Universities” and will draw upon the
work undertaken in this project to update his earlier work on Virtual Universities.
Charlotte Ash has been invited to participate in a panel discussion - with Dennis Jones
(of the National Centre for Higher Education Management Systems) and Robin
Zuniga (from the TLT Group, currently working on the Flashlight Cost Analysis
Handbook with Stephen Ehrmann) - at the Western Co-operative for Educational
Telecommunications conference in Portland, Oregon, in November 1999. The session
is entitled “Weighing Air: Measuring the Costs of Technology in Courses”.
Paul Bacsich will be presenting in Canada to the Telelearning NCE ’99 conference in
November 1999. This paper will concentrate on the main costing issues of the project
and will discuss how the ideas can transfer across to the Canadian situation.
Charlotte Ash will give the opening presentation at the 1999 “Evaluation of Learning
Technology” conference to be held at the University of North London. The paper is
entitled “Evaluation meets Costing: Fight or flight” and hopes to bridge the gap
between costing and evaluation to ensure a harmonious future for both.
Both Paul Bacsich and Charlotte Ash will be attending the Online Educa 99
conference in Berlin in November 1999 to disseminate the findings of the project.
Paul Bacsich is organising and chairing a plenary session on the costs of online
learning at which he will also present the main project conclusions - other speakers
include Frank Jewett (California State University) on the “Bridge” model, Clive
Shepherd on his recent costings work for the DfEE, and Lou Van Wyk (South Africa).
Paul Bacsich and Charlotte Ash have submitted a paper to the 1999 Australian Society
for Computers in Learning in Tertiary Education (ASCILITE) conference, in
Brisbane, December 1999.
This blanket strategy ensures that practitioners in all main continents are aware of the
JISC-funded “Costs of Networked Learning” project and its findings, within six
months of project completion.
“The classic report on costs of e-learning, online learning and distance learning”
Bacsich et al. 72
10.3 Journals
A number of journals have been selected during the project and assessed for the
likelihood of publishing a paper on this subject. Over the coming months, papers will
be written and submitted to further disseminate the study to the sector.
10.4 Project Web site
The project Web site - http://www.shu.ac.uk/virtual_campus/cnl/ - has been active
throughout the last six months and will be updated and extended to reflect the findings
and conclusions of the study. The site will host copies of presentations made by the
Study Team and copies of or links to accepted papers, and will also contain a facility
to request a copy of the report. After 12 months it will also host a downloadable pdf
copy of the report.
10.5 Informal dissemination
Informal discussion and dissemination has been taking place throughout the project.
Contact has been made with almost all other costings studies around the world and
ideas discussed. Personal contacts in the field have also been regularly consulted and
updated.
10.6 The listserv
The Study Team have been monitoring existing listservs throughout the project and
have identified a gap in the provision. We have therefore recently set up a listserv on
the subject of costing via the UK Mailbase listserv facility.
See http://www.mailbase.ac.uk/lists/costs-of-networked-learning/ for the listserv.
The plan is to encourage an online community of interest, discussion with members of
other costings projects, and international participation.
Costs of Networked Learning
Bacsich et al. 73
11. Project Management
Project management “involves managing the cost, effort, priority and
timing of project deliverables, tracking of the process of change, planning
ahead, managing risk, scheduling equipment and technology, helping
people to perform their best and maximising their rewards.”
Canale and Wills (1995)
Overall, we feel that the management of this project has been successful. In terms of
personnel, the project has been directed by Paul Bacsich, managed by Charlotte Ash,
and contributed to by two full-time research assistants employed with the project
funding, plus a number of temporary staff and consultants. The project has also
benefited from the expertise and assistance of a number of Sheffield Hallam
University staff. It is unlikely that the project could have been so successful without
the active support of the Assistant Principal for Teaching and Learning, Professor
Dianne Willcocks, now Principal of the University College of Ripon and York St
John.
As the project did not include other Institutions there are no issues on collaboration to
report. When other Institutions were asked to participate in the study for the in-depth
interviews they were on the whole willing to make themselves available, and for this
we are most thankful.
The Study Team held two Advisory Group meetings during the study. The first
meeting, held in January 1999, was attended by Jonathan Darby, from Oxford
University, and Robin Mason, from the Open University, both of whom were
nominated by CALT - and by Alice Colban, from the CALT Secretariat. In this
meeting, a revised plan and time structure were discussed in detail, including how the
Study Team (then only Paul Bacsich and Charlotte Ash) would manage until staff
could be employed, and the various intricacies of the project not detailed in the
original proposal.
The second meeting was of more of an informal nature and was held in conjunction
with the FLISH99 conference, where only Robin Mason was able to attend. There
have also been a number of informal conversations taking place between Robin
Mason and the Study Team.
However no project runs without problems. Although they were minimal, they are
briefly outlined below, detailing what they were and how the Study Team solved
them.
The first problem encountered was one of late notification of the successful proposal
by JISC. At the time of notification, Paul Bacsich and Charlotte Ash were travelling
to a European conference in the run-up to the Christmas Holidays. This posed several
problems for both staff employment and the postal survey. Moving as fast as possible,
advertisements were placed on the Web and in the local and national press before
Christmas, and interviews held in mid January - but the two research assistants did not
start work until the beginning of February, two months after the project officially was
supposed to start.

“The classic report on costs of e-learning, online learning and distance learning”
Bacsich et al. 74
The postal questionnaire needed to be sent before Christmas in order to be answered
and returned in January. The survey was written at speed - luckily it could be based
upon several previous studies written by the team. However the short time span forced
the team to contract the printing, postal and data collection responsibilities to a third
party. Unfortunately this resulted in many errors, including the mis-copying and mis-
sending of questionnaires, and incorrect data input. When the problems were
identified a temporary data entry clerk was hired to re-input the raw data and
complete the analysis.
The Study Team were lucky to have the help of additional Sheffield Hallam staff over
short time spans, although when these staff returned to their normal work, additional
pressure was put upon the core team to continue at the heightened level of
productivity.
The site visits and interviews required much co-ordination by the project manager:
relationships needed to be established and interviews arranged by telephone and
email, working through an intermediary and all within a tight schedule. The logistics
for these visits were also time-consuming, which posed a major problem given the
tight time scale of the project. This activity would have been much easier to co-
ordinate if the project had run over a longer period.
The student survey, which was only identified as a necessary activity halfway through
the project, also posed a management problem due to the timing of the survey needed
to receive and analyse the data before the end of the project. This coincided with end
of year coursework deadlines and some examinations. It was decided that the returned
quota, from the first mailing, was not sufficient to base adequate conclusions on -
therefore the decision was taken to produce a second group which were available via
school offices. This strategy increased the number of responses to an adequate level.
The FLISH conference was organised as a consultation and dissemination event for
the project, and was very beneficial to the project. The conference was financed at no
cost to the JISC budget. However, Paul Bacsich and Charlotte Ash were on the
Organising Committee, as well as speakers, and therefore the possible operational
impact of the conference could have been considerable. This was kept under control
until the two weeks leading up to the conference - at that point a temporary research
clerk was employed to assist the Study Team during the project director and project
manager’s absence.
The employment of this clerk was continued after the conference to aid the team in
consolidating and producing the Final Report and Appendices.
In the final 6 weeks of the project study period, the Study Team had to cope with a
high dissemination load, staff holidays and unavoidable absence, and the impact of
late-breaking but vital information, in particular the Transparency Review of Research
(JCPSG, 1999).
Funding for the project ceased at the end of July 1999. Liaison with CALT, minor
updates and the publication of the Final Report, along with a substantial amount of
dissemination, has taken place outside of the JISC funding period.

Costs of Networked Learning
Bacsich et al. 75
12. Conclusions and Recommendations
“Until the business case is quantified and verified, the promise of using
information technologies to realise the anticipated benefits will remain just
that - a promise.”
Oberlin (1996)
This chapter is divided into three sections - conclusions, project recommendations and
recommendations for further work.
12.1 Conclusions
The literature search established that the past literature is confinable, with a slow rate
of accretion. The sources are diverse, with only a small proportion of direct relevance
and high quality. There are some useful bibliographies. The literature from the
training field is relevant in view of the convergence of the two sectors.
Earlier UK work on costing innovative learning systems in Higher Education was
found to be of little use. However, more general costing work, such as the KPMG
Costings Guidelines, has been helpful. The recently released Flashlight work on
costing is, we feel, likely to be of great relevance. We have also been privy to a
number of other studies conducted internationally within this field.
The Sectoral Survey established that the costs of Networked Learning (overt and
hidden) are little considered at this stage. We also encountered problems of scope,
such as “What is Networked Learning?”, and that of inconsistent information - indeed
there is little correlation between the replies to different surveys, as there is not a
uniform method for asking the questions and recording the answers.
The site visits confirmed that Networked Learning is prevalent in all types of HEI, but
that cost analysis of Networked Learning is not currently on the agenda (although
HEIs are aware that cost analysis is firmly on the Funding Councils’ agenda). The site
visits also proved that student concerns and behaviour are neither well understood nor
seen (yet) as being strategic.
Both the survey and site visits confirmed that there are organisational barriers to
accurate costing: such as the reluctance to consider any form of timesheet; reluctance
to acknowledge that staff work “overtime”; and the inconsistency and non-granularity
of internal accounting. A general move towards costing activities was thought to be a
good idea, although some suspect that this may inhibit innovation and also that simple
methods may have more impact. The larger “cost of costing” issue was raised as the
negative side of this issue.
Institutions did identify a useful set of Hidden Costs to complement those we
uncovered in the literature: including the hidden cost of innovation; the costs of
collaboration; the cost and complexity of monitoring informal staff-student contact;
and the cost of copyright compliance.
“The classic report on costs of e-learning, online learning and distance learning”
Bacsich et al. 76
Institutions felt that more compelling pedagogical evidence for the benefits of
Networked Learning was badly needed before strategic moves towards Networked
Learning could be taken. The development of Networked Learning activities needs to
be both top-down and bottom-up to succeed. The quality of materials need to be
assessable before academics will trust the innovations; therefore criteria must be
established against which standards can be evaluated. Simple, transparent tools,
templates and users guides need to be developed and evaluated.
The study has uncovered the costs being absorbed by academic staff which were
previously hidden. Many academic staff have purchased computers privately for use
at home, and increasingly these are being used to counteract the shortfall in the
working day. Staff overtime, development time and materials were highlighted as
issues in need of redress.
The student survey showed that there is a disjunct between student beliefs - in
essence, students believe that Networked Learning increases costs to them - and
student behaviour - that coming to campus (and the time and cost it takes) is less and
less attractive. Students seem to believe that, and act as if, time has an opportunity
cost to them. In particular, students undertake more paid work and own a greater
number of personal computers than is generally recognised. Our survey, supported by
the national work in this area, shows that students feel Networked Learning is having
a positive effect on their learning but that it is also raising the cost of learning, mainly
because it is currently mostly on an additional not a substitution basis.
Planning Framework
We have proposed a Planning Document and Financial Schema with the following
features:
1. It can operate at the level of a whole Institution; a department or faculty; a course;
or a unit (module) within a course.
2. It takes account of the costs incurred (or saved) by the additional stakeholders in
the learning process other than the Institution - in other words, it does not treat the
Institution as a closed system. The three primary stakeholders, identified in
Chapter 3, are the Institution, Staff and Students.
3. It is based on Activity Based Costing (following KPMG work) as described in
Chapter 8.
4. It takes account of the division of academic time into Research, Teaching and
Administration. There are some detailed issues on classification but in general
terms we would follow the guidelines from KPMG (1997) and JCPSG (1999).
5. It takes account of the Activities within the course development process and
proposes a model for these, the three-phase model, if there is no existing model
relevant. The three-phase Course Lifecycle model involves both the learning
experience and student environment, through Planning and Development;
Production and Delivery; and Maintenance and Evaluation.
Costs of Networked Learning
Bacsich et al. 77
6. It is flexible in terms of allocation of overheads, with an orientation to overheads
based on actual usage rather than estimation.
7. This implies that it will require some kind of recording of academic effort spent
on activities. (JCPSG (1999b) outlines some of the problems with this.)
8. The planning aspects are based on HEFCE (1999) work, but re-positioned to
course development issues.
Though it is possible to propose the nucleus of a Planning Document and Financial
Schema in six months, much development and testing is needed to prove its viability
and worth.
12.2 Project recommendations
1. We support the centrally initiated drive towards coherence which is needed to
counteract problems created by the current lack of uniformity in university
accounting procedures.
2. Conventional teaching and learning must also be costed by the same methodology
as we have proposed, in order for comparisons of the costs and benefits to be
drawn.
3. Now that many HEIs are thinking of changing their finance systems, and in the
light of the recommendations from JCPSG, let alone our work; there is a need to
locate and evaluate finance software suitable for the “new era” of Activity Based
Costing in HEIs.
4. There is evidence that the UK HE sector is “tired of surveys” (although the
response to our particular survey was very good), and the responses given in
national surveys are not consistent or indeed based in reality. A co-ordinated
“mega-survey” approach is needed, including recognised procedures by which
figures are collated.
12.3 Recommendations for further work
1. Now that Further Education is joining JISC, the study should be extended to
include FE. The easiest way of doing this is to start from the existing HE report
(which included one University College in its site visits) and rerun the current
methodology with the FE sector, updated in the light of experience, to ensure that
specific FE concerns and vocabulary are taken into account. We suggest that the
Study Team works in conjunction with an FE provider of suitable skill to produce
an FE version of the report (not a unified HE-FE report). The FE report should
also include issues relevant to the University for Industry.
2. The Study Team has had several discussions about international collaboration
with other relevant projects, and links are in place with them already; most closely
with Canadian, US and EU researchers. The diversity of the HE sector across the
world makes it unlikely that a world-wide study would have great relevance to
JISC or indeed the Funding Councils, but two issues are of immediate interest:
“The classic report on costs of e-learning, online learning and distance learning”
Bacsich et al. 78
Collaboration with Australia may be profitable, especially in the light of the
current CVCP/HEFCE research project, “The Business of Borderless
Education”. The Study Team is hoping to present a paper at the ASCILITE
conference in Queensland in December 1999 and there is the possibility of
extending this trip to encompass a ‘mini’ version of the study.
Informal discussions with EU sources have suggested that an EU-wide study
would be of interest and an embryo consortium is in existence (including a
Canadian partner). Due to the diversity of the HE sector across Europe, it is
possible that such a study would focus more on student and staff (own) costs
than on proposing a uniform regime on Institutional costing.
3. Evidence from a recent Canadian report - and a strand of US activity over some
years - suggests that the next area ripe for treatment, in terms of costing education,
is the UK schools sector. We are not aware of any strategic UK work in this area
and recommend to the DfEE that the issue of such work is considered.
4. The Study Team is happy to work with the HE and FE Funding Councils to look
at specific issues relevant to the constituent countries of the UK. This is why -
despite the severe restrictions on the number of site visits - we included a Scottish
and a Welsh HE Institution in our site visits. If appropriate, the FE studies referred
to in point 1 could be conducted on a country-by-country basis.
5. We recommend a study into the benefits - overt and hidden, for all stakeholders -
of Networked Learning. (We note the DfEE’s recent Call for Expressions of
Interest related to this area.) Without such a study, the cost issues are seen too
much in isolation.
Costs of Networked Learning
Bacsich et al. 79
References
This lists contains reference to all sources cited in the main text of this Final Report.
A full bibliographic list can be found in Appendix 1.
Alexander, S., Mckenzie, J. and Geissinger, H. (1998), An Evaluation of Information
Technology Projects for University Learning, Australia, Committee for University
Teaching and Staff Development (CUTSD).
Arizona Learning Systems (1998), Preliminary Cost Methodology for Distance
Learning, Report dated 21 August 1998, Arizona Learning Systems and the State
Board of Directors for Community Colleges of Arizona.
Bacsich, P. (1998), ‘Re-engineering the campus - the view after one year. Did the
theory work?’, in Vision and Reality of IT in Education: First Glimpses: Proceedings
of the Fourth Hong Kong Web Symposium, 1998 Hong Kong, Open Learning
Institute.
Bassey, M. (1999), Case Study Research in Educational Settings, Buckingham, Open
University Press.
Bates, A.W. (ed.) (1990), Media and Technology in European Distance Education,
Milton Keynes, Open University.
Bates, A. W. (1995), Technology, Open Learning and Distance Education, London,
Routledge.
Bates, A.W. (1998), Assessing the Costs and Benefits of Telelearning, A Case Study
from the University of British Columbia. URL: http://research.cstudies.ubc.ca
Beaton, D. for Ernst and Young (1995), The Cost-Effectiveness of Open and Flexible
Learning for TECs, Research Series No. 53, Sheffield, Employment Department.
Canale, R. and Wills, S. (1995), ‘Producing professional interactive multimedia:
project management issues’, in British Journal of Educational Technology, vol. 26,
no. 2, pp. 84-93.
Collis, B. (1996), Tele-Learning in a Digital World: The Future of Distance Learning,
London, International Thompson Computer Press.
Crabb, G. (ed.) (1990), Costing Open and Flexible Learning, Coventry, NCET.
CRE (1998), Restructuring the University: New Technologies for Teaching and
Learning: Guidance to Universities on Strategy, CRE Guide No. 1, Geneva,
Association of European Universities.
Cukier, J (1997), ‘Cost-benefit Analysis of Telelearning: Developing a methodology
framework’, in Distance Education, vol. 18, no. 1, pp. 137-152.
Daniel, J.S. (1996), Mega-Universities and Knowledge Media - Technology Strategies
for Higher Education, London, Kogan Page.

“The classic report on costs of e-learning, online learning and distance learning”
Bacsich et al. 80
Delinger, L., Ehrmann, S.C. and Milam, J.H. (1999), Flashlight Cost Analysis
Handbook Version 1.0: Modeling resource use in teaching and learning with
technology. Unpublished draft provided by Ehrmann.
Dolton, P., Douglass Klein J. and Weir, I. (1994), ‘The Economic Evaluation of Peer
Counselling in Facilitating Computer Use in Higher Education’, in Education
Economics, vol. 2, no. 3, pp. 313-326.
Draper, S.W. and Foubister, S.P. (1998), ‘Cost Benefit Analysis of Remote
Collaborative Tutorial Teaching’ in Oliver, M (ed.) 1998, Innovation in the
Evaluation of Learning Technology, London, University of North London.
Green, K. C. (1999), Campus Computing 1998: The Ninth National Survey of
Desktop Computing and Information Technology in Higher Education, California,
The Campus Computing Project.
HEFCE (1997), Information assisted Teaching and Learning in Higher Education,
HEFCE Research Series, Bristol, HEFCE.
HEFCE (1999), Appraising Investment Decisions, HEFCE Guide 99/21, March 1999,
Bristol, HEFCE.
HEFCE (in press), Communications and Information Technology Audit: Delivering
Enhanced Learning A study of the use of C&IT materials in teaching and learning in
Higher and Further Education in the UK, Chapter 9: ‘Financial Issues’, Unpublished
draft provided by John Fielden.
Herrmann, A., Cameron, J. and Davidson, G. (1991), ‘On-campus requirements in
remote area Australian distance education’, in Open Learning, vol. 6, no. 2, pp. 21-27.
Howson, J. and Mitchell, M. (1995), ‘Course costing in devolved Institutions:
perspectives from an academic department’, in Higher Education Review, vol. 27, no.
2, pp. 64-68.
Hunt, M. and Clarke, A. (1997), A Guide to the Cost Effectiveness of Technology-
Based Training, Coventry, NCET.
Jewett, F. (1998), A Simulation Model for Comparing the Costs of Expanding a
Campus using Distributed Instruction versus Classroom Instruction California State
University. URL - http://www.calstate.edu/special_projects/mediated_instr/
JCPSG (1999a), Costing and Pricing for Decision Makers in Higher Education: User
Guide, Bristol, HEFCE.
JCPSG (1999b), Transparency Review of Research, July 1999, Bristol, HEFCE.
Kirkpatrick, D. and Jakupec, V. (1999), Chapter 5, ‘Becoming flexible: what does it
mean?’ in Tait, A. and Mills, R (eds.), The Convergence of Distance and
Conventional Education: Patterns of Flexibility for the Individual Learner, New York,
Routledge.
KPMG Management Consulting and Joint Funding Councils (1997), Management
Information for Decision Making: Costing Guidelines for Higher Education
Institutions, Bristol, HEFCE.
Costs of Networked Learning
Bacsich et al. 81
Laurillard, D. (1993), Rethinking University Teaching - A Framework for the
Effective Use of Education, London, Routledge.
Lewin, K. (1951), Field Theory in Social Science, New York, Harper Bros.
Markowitz Jr., H. (1987). ‘Financial Decision Making - calculating the costs of
distance education’, in Distance Education, vol. 8, no. 2, pp. 147-161.
Mardell, J. (1998), ‘Evaluating Costs and Effectiveness of Changes to Teaching
Models, with references to New Learning Technologies’ in Oliver, M. (ed.) (1998),
Innovation in the Evaluation of Learning Technology, London, University of North
London.
Moonen, J. (1997), ‘The Efficiency of Telelearning’, in Journal of Asynchronous
Learning Networks, vol. 1, no. 2. URL -
http://www.aln.org/alnweb/journal/issue2/moonen.htm
NBEET (1994), Costs and Quality in Resource-Based Learning On- and Off-Campus,
Commissioned Report No. 33. URL -
http://www.detya.gov.au/nbeet/publications/cr33/jevcom.html
NUS (1999), Consultation on Section 28 of the Teaching and Higher Education Act:
National Union of Students’ submission to DfEE.
NCIHE (1997), Higher Education in the Learning Society, London, HMSO.
Noble (1998), Noble’s Higher Education Financial Yearbook 1998: A comprehensive
financial guide to universities and colleges in the UK’s higher education sector,
Edinburgh, Noble Group Limited.
Noble (1999), Noble’s Higher Education Financial Yearbook 1999: A comprehensive
financial guide to universities and colleges in the UK’s higher education sector,
Edinburgh, Noble Group Limited.
Oberlin, J.L. (1996), ‘The Financial Mythology of Information Technology: The New
Economics’, in CAUSE/EFFECT, vol. 19, no. 1, pp. 21-29.
Oliver, M., Conole, G., and Bonetti, L. (1999), The Hidden Costs of Change:
Evaluating the impact of moving to on-line delivery. Paper presented at the FLISH99
Conference, URL - http://www.shu.ac.uk/flish/oliverp.htm
O’Rourke, J. (1999), Chapter 8, ‘Canaries in the mine? Women’s experience and new
learning technologies’, in Tait, A. and Mills, R. The Convergence of Distance and
Conventional Education: Patters of Flexibility for the Individual Learner, London,
Routledge.
Orivel, F. (1987), Analysing Costs in Distance Education Systems: A Methodological
Approach, IREDU, Dijon, Université de Bourgogne.
Palfreyman, D. (1991), ‘The Art of Costing and the Politics of Pricing’, in Promoting
Education, no. 2, pp. 26-27.
Peebles, C. S. (1997), Cost, Quality and Value: Assessing the Networked Information
Value Chain at Indiana University. URL - http://www.cni.org/regconfs/1997/ukoln-
content/repor-24.html

“The classic report on costs of e-learning, online learning and distance learning”
Bacsich et al. 82
Robertshaw, M. (1993), ‘The Importation and Adaption of Distance Education
Courses: Is it an expensive option?’, in Economics of Distance Education:
Proceedings of the Asian Association of Open Universities (AAOU) VIIth annual
conference 1993, Hong Kong, 21-25 November, Hong Kong, Open Learning Institute.
Rumble, G. (1989), ‘Online Costs: Interactivity at a Price’, in Mason, R. and Kaye, A.
(eds.) Mindweave: Communication, Computers and Distance Education, Oxford,
Permagon Press.
Rumble, G. (1992), ‘The competitive vulnerability of distance teaching universities’,
in Open Learning, vol. 7, no. 2, pp. 31-45.
Rumble, G. (1997), The Costs and Economics of Open and Distance Learning,
London, Kogan Page.
Rumble, G. (1999), The Costs of Networked Learning: What have we learnt? Paper
presented at the FLISH99 Conference, URL - http://www.shu.ac.uk/flish/rumblep.htm
Sefton A.J. (1997), ‘From a Traditional to a Problem-based Curriculum - estimating
staff time and resources’, in Education for Health, vol. 10, no. 2, pp. 165-178.
Sharratt, R. (1993), ‘Costing of Open and Distance Learning (ODL) - is it worth it?’,
in Economics of Distance Education: Proceedings of the Asian Association of Open
Universities (AAOU) VIIth annual conference 1993, Hong Kong, 21-25 November,
Hong Kong, Open Learning Institute.
Shepherd, C. (1998), The Cost-Benefit Tool, URL - http://www.intranet-
cafe.co.uk/cost_benefit_tool.htm
Stahmer, A. (1995), Assessing Costs, Benefits, and Return on Investment for
Technology-based Training: Tools for decision makers, Paper presented at Online
Educa Berlin, 1st International Conference on Technology Supported Learning.
Temple, H. (1995), Cost-effectiveness of Open Learning for Small Firms: A study of
first experiences of open learning, Research Paper, Sheffield, DfEE.
The College Board (1999), The Virtual University & Educational Opportunity: Issues
of equity and access for the next generation, URL - http://ww.collegeboard.org
Tonks, D. and Long, G. (1989), ‘The Hidden Costs of Marketing Simulations’, in
Simulation/Games for Learning, vol. 19, no. 1, pp. 24-34.
UCISA (1998), UCISA Statistics 1997 Volume 1, Statistics Returns, Oxford, UCISA.
UCISA (1999), UCISA Statistics 1998, URL -
http://www.ucisa.ac.uk/docs/statsur/stats98.htm
Walker, A. and Lincoln I. (1996), ‘An Evaluation of Schemes for Funding Higher
Education in the UK’, in Higher Education Review, vol. 28, no.3, pp. 7-32.
Yenbamrung, P. (1993), ‘The Emerging Electronic University: A study of student
cost-effectiveness’, in Economics of Distance Education: Proceedings of the Asian
Association of Open Universities (AAOU) VIIth annual conference 1993, Hong
Kong, 21-25 November, Hong Kong, Open Learning Institute.

Costs of Networked Learning
Bacsich et al. 83
Appendices
“The classic report on costs of e-learning, online learning and distance learning”
Bacsich et al. 84
A1 Full bibliography
This list contains reference to all sources reviewed by the Study Team in the course of this
project.
Ahumada, M. M. (1992), ‘U.S. methods for costing in higher education: taking the
technology abroad’, in Higher Education, vol. 24, no. 3, pp. 363-377.
Alexander, S., Mckenzie, J. and Geissinger, H. (1998), An Evaluation of Information
Technology Projects for University Learning, Australia, Committee for University Teaching
and Staff Development (CUTSD)
Arizona Learning Systems (1998), Preliminary Cost Methodology for Distance Learning,
Report dated 21 August 1998, Arizona Learning Systems and the State Board of Directors for
Community Colleges of Arizona.
Bacsich, P. (1998), ‘Re-engineering the campus - the view after one year. Did the theory
work?’, in Vision and Reality of IT in Education: First Glimpses: Proceedings of the Fourth
Hong Kong Web Symposium, 1998 Hong Kong, Open Learning Institute.
Bassey, M. (1999), Case Study Research in Educational Settings, Buckingham, Open
University Press.
Bates, A. W. (1984), Broadcasting in Education: an Evaluation, London, Constable and
Company Ltd.
Bates, A.W. (ed.) (1990), Media and Technology in European Distance Education, Milton
Keynes, Open University.
Bates, A. W. (1995), Technology, Open Learning and Distance Education, London,
Routledge.
Bates, A. W. (1997), ‘The Impact of Technological Change on Open and Distance Learning’,
in Distance Education, vol. 18, no. 1, pp. 93-109.
Bates, A. W. (1997), ‘The Future of Educational Technology’, in Centre for Curriculum,
Transfer & Technology (CCTT) Learning Quarterly, vol. 1, no. 2, URL - http://www.
ctt.bc.ca/lq/maytoc.html#centre
Bates, A.W. (1997), Restructuring the University for Technological Change URL -
http://bates.cstudies.ubc.ca/carnegie/carnegie.html
Bates, A.W. (1998), Assessing the Costs and Benefits of Telelearning, A Case Study from the
University of British Columbia URL - http://research.cstudies.ubc.ca
Beaton, D. for Ernst and Young (1995), The Cost-Effectiveness of Open and Flexible
Learning for TECs, Research Series No. 53, Sheffield, Employment Department.
Berge, Z.L. and Schrum, L. (1998), ‘Linking Strategic Planning with Program
Implementation for Distance Education’, in CAUSE/EFFECT, vol. 21, no. 3 URL -
http://www.educause.edu/ir/library/html/cem9836.html
Bottomley, J. and Calvert, J. (1993), Dimensions of Value: Estimating the Benefits of Higher
and Distance Education Programs, Hong Kong, Open Learning Institute.
Bourne, M. (1993), ‘Caveat Emptor: Some aspects of cost analysis in universities’, in Higher
Education Policy, vol. 6, no. 3, pp. 10-18.
Broomfield, C. (1993), ‘The Importance of Mature, Part-time Students to Higher Education in
the UK’, in Higher Education, vol. 25, no. 2, pp. 189-205.
Costs of Networked Learning
Bacsich et al. 85
Brown, S. and Smith, B. (eds.) (1996), Resourse-Based Learning, Staff and Educational
Development Series (SEDA), London, Kogan Page.
Bull, J. (undated), Approaches to Learning Technology URL -
http://www.luton.ac.uk/sdu/academicstaff/helparticle2.html
Canale, R. and Wills, S. (1995), ‘Producing Professional Interactive Multimedia: Project
management issues’, in British Journal of Educational Technology, vol. 26, no. 2, pp. 84-93.
Collis, B. (1996), Tele-Learning in a Digital World: The future of distance learning, London,
International Thompson Computer Press.
Crabb, G. (ed.) (1990), Costing Open and Flexible Learning, Coventry, NCET.
CRE, (1998), Restructuring the University: New Technologies for Teaching and Learning:
Guidance to universities on strategy, CRE Guide No. 1, Geneva, Association of European
Universities.
Cronin, B. (1998), ‘The Electronic Academy Revisited’, in Aslib Proceedings, vol 50, no. 9,
pp. 241-254.
Cukier, J (1997), ‘Cost-benefit Analysis of Telelearning: Developing a methodology
framework’, in Distance Education, vol. 18, no. 1, pp. 137-152.
Curran, C. (1990), ‘Factors Affecting the Costs of Media in Distance Education’, in Bates
(ed.) Media and Technology in European Distance Education, Proceedings of the European
Association of Distance Teaching Universities workshop on Media, Methods and
Technology, Heerlen, EADTU.
Curran, C. (1993), Scale, Cost and Quality in Small Distance Teaching Universities, COSTEL
Workshop: Organisation, Technology and Economics of Education, Copenhagen, January 11-
12.
Daniel, J.S. (1996), Mega-Universities and Knowledge Media - Technology Strategies for
Higher Education, London, Kogan Page.
Delinger, L., Ehrmann, S.C. and Milam, J.H. (1999), Flashlight Cost Analysis Handbook
Version 1.0: Modeling Resource Use in Teaching and Learning with Technology.
Unpublished draft provided by Ehrmann.
Dolton, P., Douglass Klein J. and Weir, I. (1994), ‘The Economic Evaluation of Peer
Counselling in Facilitating Computer Use in Higher Education’, in Education Economics, vol.
2, no. 3, pp. 313-326.
Dondi, C. (1995), Increased Quality at Decreased Cost: Dream or Reality?, Paper presented at
Online Educa Berlin, 1st International Conference on Technology Supported Learning.
Doughty, G. (1998), ‘Evaluating Costs and Benefit of Investments in Learning Technology
for Technology Students’ in Oliver, M (ed.) (1998), Innovation in the Evaluation of Learning
Technology, London, University of North London.
Draper, S.W. and Foubister, S.P. (1998), ‘Cost Benefit Analysis of Remote Collaborative
Tutorial Teaching’ in Oliver, M (ed.) (1998), Innovation in the Evaluation of Learning
Technology, London, University of North London.
Ehrmann, S. C. (1997), Asking the Right Questions: What does research tell us about
technology and higher learning?, The Annenberg/CPB Projects URL -
http://www.learner.org/edtech/rscheval/rightquestion.html
Faulhaber, C.B. (1996), ‘Distance Learning and Digital Libraries: Two sides of a single coin’,
in Journal of the American Society for Information Science, vol. 47, no. 11, pp. 954-856.
“The classic report on costs of e-learning, online learning and distance learning”
Bacsich et al. 86
Geith, C. and Cometa, M. (1999), Cost Analysis Results - Comparing Distance Learning and
On-Campus Courses, Rochester Institute of Technology, Fall 1997- Fall 1998, Final Report.
Green, K. C. (1999), Campus Computing 1998: The ninth national survey of desktop
computing and information technology in higher education, California, The Campus
Computing Project.
Hammond, N., Gardner, N., Heath, S., Kibby, M., Mayes, T., Mcaleese, R., Mullings, C. and
Trapp, A. (1992), ‘Blocks to the Effective Use of Information Technology in Higher-
Education’, in Computers & Education, vol. 18, no. 1-3, pp. 155-162.
Hawkridge, D. (1998), ‘Cost-effective Support for University Students Learning via the
Web?’, in Alt-J, vol. 6, no. 3, pp. 24-29.
HEFCE (1997), Information assisted Teaching and Learning in Higher Education, HEFCE
Research Series, Bristol, HEFCE.
HEFCE, (1998), Information Systems and Technology Management Value for Money Study,
National Report, Bristol, HEFCE.
HEFCE, (1998), Information Systems and Technology Management Value for Money Study,
Management Review Guide, Bristol, HEFCE.
HEFCE (1999), Appraising Investment Decisions, HEFCE Guide 99/21, March 1999, Bristol,
HEFCE.
HEFCE (in press), Communications and Information Technology Audit: Delivering Enhanced
Learning A study of the use of C&IT materials in teaching and learning in Higher and Further
Education in the UK, Chapter 9: ‘Financial Issues’, Unpublished draft provided by John
Fielden.
Henderson, T. and Brown, G. (1999), A Cost/benefit Analysis of Three Technology
Development Strategies in Higher Education using the Flashlight Economic Model, Draft
Report, Washington State University.
Herrmann, A., Cameron, J. and Davidson, G. (1991), ‘On-campus Requirements in Remote
Area Australian Distance Education’, in Open Learning, vol. 6, no. 2, pp. 21-27.
Holland, M. P. (1996), ‘Collaborative Technologies in Inter-University Instruction’, in
Journal of the American Society for Information Science, vol. 47 no. 11, pp. 857-862.
Howson, J. and Mitchell, M (1995). ‘Course Costing in Devolved Institutions: Perspectives
from an academic department’, in Higher Education Review, vol. 27, no. 2, pp. 64-68.
Hunt, M. and Clarke, A. (1997), A Guide to the Cost Effectiveness of Technology-Based
Training, Coventry, NCET.
Jacobs, G. and Rodgers, C. (1998), ‘ISDN-based Distance Learning: Tangible costs,
intangible benefits’, in Computers & Education, 1998, vol. 31, no.1, pp. 41-53.
Jarmon, C. (1993), SUNY by Satellite: A cost-effective educational model for the 21st
century, Hong Kong, Open Learning Institute.
Jewett, F. (1998), A Simulation Model for Comparing the Costs of Expanding a Campus
using Distributed Instruction versus Classroom Instruction, California State University URL -
http://www.calstate.edu/special_projects/mediated_instr/
JCPSG (1999a), Costing and Pricing for Decision Makers in Higher Education: User Guide,
Bristol, HEFCE.
JCPSG (1999b), Transparency Review of Research, July 1999, Bristol, HEFCE.

Costs of Networked Learning
Bacsich et al. 87
KPMG Management Consulting and Joint Funding Councils (1997), Management
Information for Decision Making: Costing Guidelines for Higher Education Institutions,
Bristol, HEFCE.
Keegan, D. (1990), Foundations of Distance Education, London, Routledge.
Keegan, D. (1994), ‘The Competitive Advantages of Distance Teaching Universities’, in
Open Learning, vol. 9, no. 2, pp. 36-39.
Kelly, M. (1987), ‘The High Cost of “Efficiency and Effectiveness” in Australia’, in Open
Learning, vol. 2, no. 3, pp. 19-24.
Kirkpatrick, D. and Jakupec, V. (1999), Chapter 5, ‘Becoming Flexible: What does it mean?’
in Tait, A. and Mills, R (eds.) (1999), The Convergence of Distance and Conventional
Education: Patterns of flexibility for the individual learner, New York, Routledge.
Kirkwood, A. and Ismail, N. (1993), ‘Personal Computing: Transferring the costs of learning
at home’, in Economics of Distance Education: Proceedings of the Asian Association of Open
Universities (AAOU) VIIth annual conference 1993, Hong Kong, 21-25 November, Hong
Kong, Open Learning Institute.
Koch, J.V. and Fisher, J.L. (1998), ‘Higher Education and Total Quality Management’, in
TQM, vol. 9, no. 8, pp. 659-668.
Laurillard, D. (1993), Rethinking University Teaching: A framework for the effective use of
educational technology, London and New York, Routledge.
Lewin, K. (1951), Field Theory in Social Science, Harper Bros, New York.
Ma, W. (1987), ‘The Graduates of China’s Television Universities: Two pilot studies’, in
International Journal of Educational Development, vol. 7, no. 4, pp. 285-287.
Mardell, J. (1998), ‘Evaluating Costs and Effectiveness of Changes to Teaching Models, with
References to New Learning Technologies’ in Oliver, M. (ed.) (1998), Innovation in the
Evaluation of Learning Technology, London, University of North London.
Markowitz Jr., H. (1987), ‘Financial Decision Making - Calculating the Costs of Distance
Education’, in Distance Education, vol. 8, no. 2, pp. 147-161.
Mason, R. and Kaye, A. (eds.) (1989), Mindweave: Communication, Computers and Distance
Education, Oxford, Permagon Press.
Mason, R. (1995), Using Communication Media in Open and Flexible Learning, London,
Kogan Page.
Massy, W.F. and Zemsky, R. (1995), Using Information Technology to Enhance Academic
Productivity, Report from an Educom Roundtable URL -
http://www.educause.edu/nlii/keydocs/massy.html
Mcclure, C. R. and Lopata, C. (1996), ‘Assessing The Academic Networked Environment’, in
Journal of Academic Librarianship, vol. 22, no. 4, pp. 285-288.
Means, B., Blando, J., Olson, K., Middleton, T., Morocco, C.C., Remz, A.R., and Zorfass, J.
(1993), Using Technology to Support Educational Reform, Report for U.S. Department of
Education, Office of Educational Research and Improvement URL -
http://www.ed.gov/pubs/EdReformStudies/TechReforms/
Melmed, A. (ed.) (1995), The Costs and Effectiveness of Educational Technology:
Proceedings of a workshop, URL -http://www.ed.gov/Technology/Plan/RAND/Costs/
“The classic report on costs of e-learning, online learning and distance learning”
Bacsich et al. 88
Milam, J. (1999), George Mason University’s Cost Assessment Methodology - Andrew W
Mellon Foundation Grant Project on Cost-Effective Uses of Technology in Teaching, Draft
Report, University of Virginia.
Moonen, J. (1995), Visions Versus Reality: Some evidence about costs from Europe-wide
flexible and distance learning projects, Paper provided by Moonen.
Moonen, J. and Collis, B. (1997), Cost of Flexible and Distance Learning, London, Plenum
Press.
Moonen, J. (1997), ‘The Efficiency of Telelearning’, in Journal of Asynchronous Learning
Networks, vol. 1, no. 2 URL -http://www.aln.org/alnweb/journal/issue2/moonen.htm
Moonen, J. (1998), ‘The Cost-effectiveness of Flexible Delivery’, in Van der Wende, M. (ed.)
Virtual Mobility: New technologies and the internationalization of higher education, Nuffic
Papers, no. 9, The Hague, Organisation for International Cooperation in Higher Education.
Muta, H. and Saito, T. (1994), ‘Comprehensive Cost Analysis of the University of the Air of
Japan’, in Higher Education, vol. 28, no. 3, pp. 325-353.
NBEET (1994), Costs and Quality in Resource-Based Learning On- and Off-Campus,
Commissioned Report No. 33 URL -
http://www.detya.gov.au/nbeet/publications/cr33/jevcom.html
NUS (1999), Consultation on Section 28 of the Teaching and Higher Education Act: National
Union of Students’, Submission to DfEE.
NCIHE (1997), Higher Education in the Learning Society, London, HMSO.
NIACE Telematics Policy Group (1997), Adult Learning in an Information Society: A policy
discussion paper, URL - http://www.niace.org.uk/Research/telepap.htm
Noble (1998), Noble’s Higher Education Financial Yearbook 1998: A comprehensive
financial guide to universities and colleges in the UK’s higher education sector, Edinburgh,
Noble Group Limited.
Noble (1999), Noble’s Higher Education Financial Yearbook 1999: A comprehensive
financial guide to universities and colleges in the UK’s higher education sector, Edinburgh,
Noble Group Limited.
Oberlin, J.L. (1996), ‘The Financial Mythology of Information Technology: The new
economics’, in CAUSE/EFFECT, vol. 19, no. 1, pp. 21-29.
Oliver, M., Conole, G., and Bonetti, L. (1999), The Hidden Costs of Change: Evaluating the
impact of moving to on-line delivery. Paper presented at the FLISH99 Conference URL -
http://www.shu.ac.uk/flish/oliverp.htm
OPAS (1998), Effectiveness of Learning Technologies: The costs and effectiveness of
technology-based approaches to teaching and learning, A Report for the Office of Learning
Technologies and The Ministry of Education and Training, Canada, URL - http://olt-bta.hrdc-
drhc.gc.ca/download/Opas.pdf
Orivel, F. (1987), Analysing Costs in Distance Education Systems: A methodological
approach, IREDU, Dijon, Université de Bourgogne.
O’Rourke, J. (1999), Chapter 8, ‘Canaries in the mine? Women’s experience and new
learning technologies’, in Tait, A. and Mills, R. (1999), The Convergence of Distance and
Conventional Education: Patters of flexibility for the individual learner, Routledge, London.
Palfreyman, D. (1991), ‘The Art of Costing and the Politics of Pricing’, in Promoting
Education, no. 2, pp. 26-27.

Costs of Networked Learning
Bacsich et al. 89
Peebles, C. S. (1997), Cost, Quality and Value: Assessing the networked information value
chain at Indiana University. URL - http://www.cni.org/regconfs/1997/ukoln-
content/repor~24.html
Rawlings, A., Fox S., Hobb, V., Fox, N., Bacsich, P., and Curran, C. (1993), Telematic
Networks for Open and Distance Learning in the Tertiary Sector. Scenarios, Costings and
Survey. Final Report Volume 1-2, Heerlen, EADTU.
Robertshaw, M. (1993), ‘The Importation and Adaption of Distance Education Courses: Is it
an expensive option?’, in Economics of Distance Education, Proceedings of the Asian
Association of Open Universities (AAOU) VIIth annual conference 1993, Hong Kong, 21-25
November, Hong Kong, Open Learning Institute.
Rowntree, D. (1995), ‘Teaching and Learning Online: A correspondence education for the
21st century?’, in British Journal of Educational Technology, vol. 26, no.3, pp.205-215.
Rumble, G. (1989), ‘Online Costs: Interactivity at a Price’, in Mason, R. and Kaye, A. (eds.)
Mindweave: Communication, Computers and Distance Education, pp. 146-165, Oxford,
Permagon Press.
Rumble, G. (1992), ‘The Competitive Vulnerability of Distance Teaching Universities’, in
Open Learning vol. 7, no. 2, pp. 31-45.
Rumble, G. (1997), The Costs and Economics of Open and Distance Learning, London,
Kogan Page.
Rumble, G. (1999), The Costs of Networked Learning: What have we learnt? Paper presented
at the FLISH99 Conference, URL -http://www.shu.ac.uk/flish/rumblep.htm
Sefton A.J. (1997), ‘From a Traditional to a Problem-based Curriculum - Estimating Staff
Time and Resources’, in Education for Health, vol. 10, no. 2, pp. 165-178.
Sharratt, R. (1993), ‘Costing of Open and Distance Learning (ODL) - is it worth it?’, in
Economics of Distance Education, Proceedings of the Asian Association of Open Universities
(AAOU) VIIth annual conference 1993, Hong Kong, 21-25 November, Hong Kong, Open
Learning Institute.
Shepherd, C. for the Epic Group plc (1998), The Cost-Benefit Tool, URL -
http://www.intranet-cafe.co.uk/cost_benefit_tool.htm
Shepherd, C. for the Epic Group plc (1998), Assessing Intranet Cost-Benefits, URL -
http://www.intranet-cafe.co.uk/featuredarticles3.htm
Shepherd, C. (1998), Why Training Needs the Internet, URL - http://www.fastrak-
consulting.co.uk/tactix/Features/tngintra/tngintra.htm
Stahmer, A. (1995), Assessing Costs, Benefits, and Return on Investment for Technology-
based training: Tools for decision makers, Paper presented at Online Educa Berlin, 1st
International Conference on Technology Supported Learning.
Tait, A. and Mills, R (eds.) (1999), The Convergence of Distance and Conventional
Education: Patterns of flexibility for the individual learner, New York, Routledge.
Tait, K. (1998), ‘Replacing Lectures with Multimedia CBL: Student attitudes and reactions’,
in Instructional Science, 1998, vol. 26, no. 6, pp. 409-438.
Taylor, J.C. (1997), Flexible Learning Systems: Opportunities and strategies for staff
development in industry, Paper presented at the 11th AAOU Conference - Quality Assurance
in Distance & Open Learning, Kuala Lumpur, Malaysia, 11-15 November URL -
http://www.usq.edu.au/dec/STAFF/TAYLORJ/readings/aaou.htm
“The classic report on costs of e-learning, online learning and distance learning”
Bacsich et al. 90
Temple, H. (1995), Cost-effectiveness of Open Learning for Small Firms: A study of first
experiences of open learning, Research Paper, Sheffield, DfEE.
The College Board (1999), The Virtual University and Educational Opportunity: Issues of
equity and access for the next generation URL - http://ww.collegeboard.org
Thomas, P., Carswell, L., Price, B., and Petre, M. (1998), ‘A Holistic Approach to Supporting
Distance Learning using the Internet: Transformation, not translation’, in British Journal of
Educational Technology, vol. 29, no. 2, pp. 149-161.
Tonks, D. and Long, G. (1989), ‘The Hidden Costs of Marketing Simulations’, in
Simulation/Games for Learning, vol. 19, no. 1, pp. 24-34.
UNESCO (1980), The Economics of New Educational Media: vol 2 - Cost and Effectiveness,
Paris, UNESCO.
UCISA (1998), UCISA Statistics 1997 Volume 1, Statistics Returns, Oxford, UCISA.
UCISA (1999), UCISA Statistics 1998 URL -http://www.ucisa.ac.uk/docs/statsur/stats98.htm
Usip, E.E. and Bee, R.H. (1998), ‘Economics - A discriminant analysis of students’
perceptions of Web-based learning’, in Social Science Computer Review, vol. 16, no.1, pp.
16-29.
Van der Drift, K.D.J.M. (1980), ‘Cost-effectiveness of Audiovisual Media in Higher
Education’, in Instructional Science, vol.9, no. 4, pp. 355-364.
Walker, A. and Lincoln I. (1996), ‘An Evaluation of Schemes for Funding Higher Education
in the UK’, in Higher Education Review, vol. 28, no.3, pp. 7-32.
Wright, D. (1998), Cost-Benefit Analysis of Web-Based Tele-Learning: Case study of the
Bell Online Institute, Internal report, Bell Online Institute, Bell Canada.
Yenbamrung, P. (1993), ‘The Emerging Electronic University: A study of student cost-
effectiveness’, in Economics of Distance Education, Proceedings of the Asian Association of
Open Universities (AAOU) VIIth annual conference 1993, Hong Kong, 21-25 November,
Hong Kong, Open Learning Institute.

Costs of Networked Learning
Bacsich et al. 91
A2 Questionnaire to UK HEIs
Section One
HESA Identifier
Name of Recipient ............................................................................................
Role of Recipient ............................................................................................
Brief Description of that Role ...............................................................................
.................................................................................................................................
Contact Details: e mail ............................................................
phone ............................................................
fax ............................................................
Section Two
1 How many computers does the institution own? ...................
2 How many computers are available on campus for student use? ....................
3 How many computers are assigned for staff usage only?
actual number .................... percentage of total ......................
4 How many institution-owned computers are available for off-campus use?
Staff .......................
Student .......................
5 Please state the number on computers assigned to: Central Computing Facilities ........................
Library Computing Facilities ........................
Departmental Computing Facilities ........................
6 Please state the opening hours of the above.
Mon-Fri. Saturday Sunday
Central Computing Facilities .................. ................... ..................
Library Computing Facilities .................. ................... ..................
Departmental Computing Facilities .................. ................... ..................
7 Please indicate which facilities are open access (OA) and which require users
to belong to a particular subject area (SA).
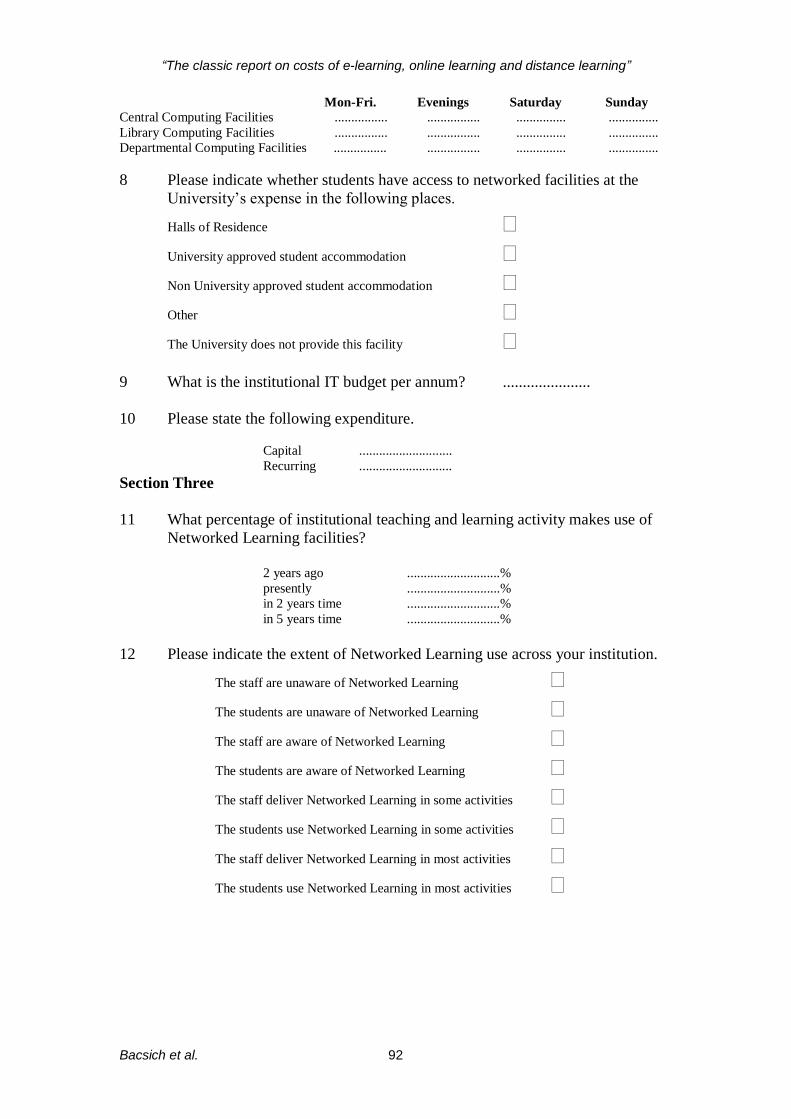
“The classic report on costs of e-learning, online learning and distance learning”
Bacsich et al. 92
Mon-Fri. Evenings Saturday Sunday Central Computing Facilities ................ ................ ............... ...............
Library Computing Facilities ................ ................ ............... ...............
Departmental Computing Facilities ................ ................ ............... ...............
8 Please indicate whether students have access to networked facilities at the
University’s expense in the following places.
Halls of Residence
University approved student accommodation
Non University approved student accommodation
Other
The University does not provide this facility
9 What is the institutional IT budget per annum? ......................
10 Please state the following expenditure.
Capital ............................
Recurring ............................
Section Three
11 What percentage of institutional teaching and learning activity makes use of
Networked Learning facilities?
2 years ago ............................%
presently ............................%
in 2 years time ............................%
in 5 years time ............................%
12 Please indicate the extent of Networked Learning use across your institution.
The staff are unaware of Networked Learning
The students are unaware of Networked Learning
The staff are aware of Networked Learning
The students are aware of Networked Learning
The staff deliver Networked Learning in some activities
The students use Networked Learning in some activities
The staff deliver Networked Learning in most activities
The students use Networked Learning in most activities
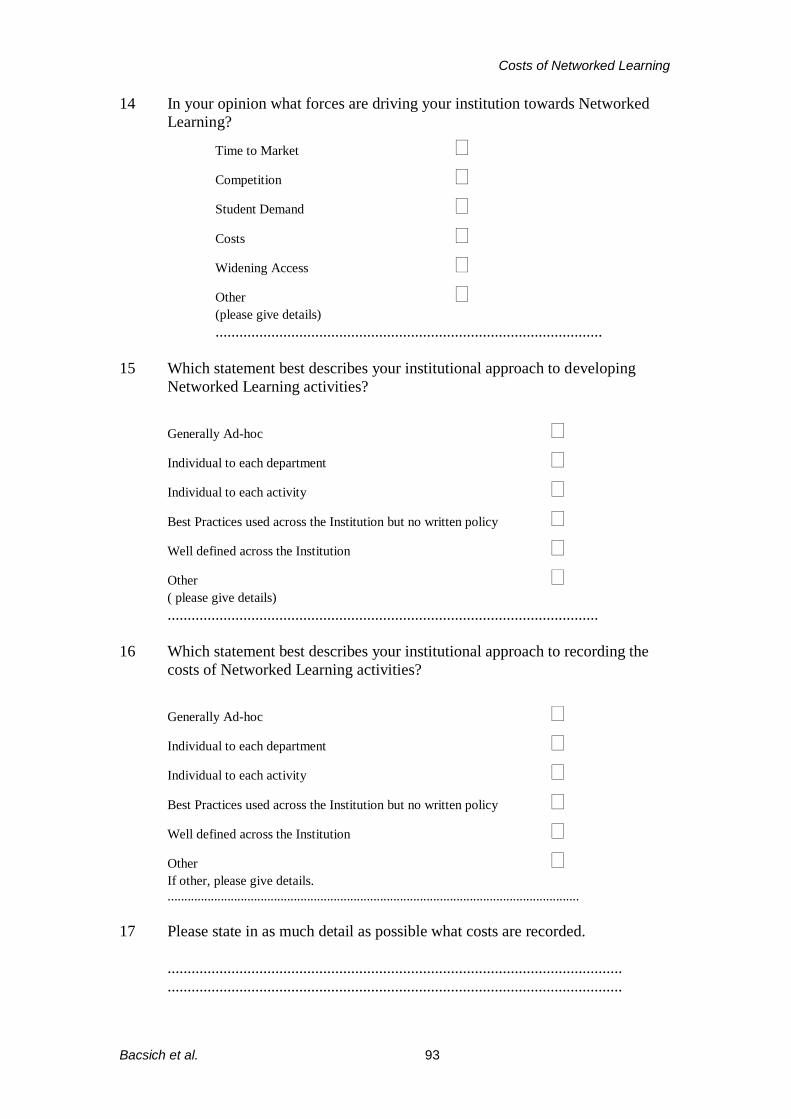
Costs of Networked Learning
Bacsich et al. 93
14 In your opinion what forces are driving your institution towards Networked
Learning?
Time to Market
Competition
Student Demand
Costs
Widening Access
Other
(please give details)
.................................................................................................
15 Which statement best describes your institutional approach to developing
Networked Learning activities?
Generally Ad-hoc
Individual to each department
Individual to each activity
Best Practices used across the Institution but no written policy
Well defined across the Institution
Other
( please give details) ............................................................................................................
16 Which statement best describes your institutional approach to recording the
costs of Networked Learning activities?
Generally Ad-hoc
Individual to each department
Individual to each activity
Best Practices used across the Institution but no written policy
Well defined across the Institution
Other
If other, please give details.
............................................................................................................................
17 Please state in as much detail as possible what costs are recorded.
..................................................................................................................
..................................................................................................................

“The classic report on costs of e-learning, online learning and distance learning”
Bacsich et al. 94
18 When are these costs recorded?
In the Planning Stages
During Development
After Development
During Activity Execution
At End of Financial Year
19 In particular we are looking at unrecorded or hidden costs for the institution
and the student. With this in mind are there any costs which you do not record
but see as important to take into account when developing further activities?
...........................................................................................................................
...........................................................................................................................
...........................................................................................................................
...........................................................................................................................
...........................................................................................................................
Please feel free to continue any answers on additional sheets of paper.
Thank you very much for your time and effort.
Please return the questionnaire in the pre paid envelope provided.

Costs of Networked Learning
Bacsich et al. 95
Yes No
A3 Student Representative Survey We would be grateful if you could take the time to complete this questionnaire. It will form an
important part of a national study into the Costs of Networked Learning in Higher Education. Hidden
and unrecorded costs are the main focus of our research. We believe that these costs are being largely
absorbed by you, the student, so your input will be valuable.
You should fill in your responses with a line like this.
Use an HB pencil or a blue or black pen. Please do not tick or circle.
1 E-mail address Male ** Female **
(optional but necessary for entry into draw)
2 Age: 18-21 ** 22-25 ** 26-29 ** 30+ **
3 School:
4 Are you: Under Grad ** Post Grad **
5 Are you: Full time ** Part time **
6 Daily travel time to campus: 0 – 30 min ** 30 min – 1 hr ** Over 1 hr **
7 Daily cost of travel to campus: no cost ** £0.01-£2.49 ** £2.50 + **
8 Are you in paid employment? Yes ** No **
9 If Yes, How many hours per week? 1 to 16 ** 17 to 32 ** 33 + **
10 Do you have a computer for your own use in your semester time residence?
Yes ** No ** IF NO, GO TO
Q22
11 Is this computer a – Desktop ** Laptop **
12 Is this computer attached to a printer? Yes ** No **
13 Does this computer have a modem? Yes ** No **
14 Is there a phone socket at your semester time residence that you could
realistically use with your computer when you wanted to? Yes ** No **
15 How old is your computer? up to 1 year ** 2-3 years **
1-2 years ** 3+ years **
16 How much did your home computer cost? (approx.) below £500 ** £1000-£1500 **
£500-£1000 ** £1500+ **
17 How much do you spend per year on computer consumables (ie ink, paper, discs)? £
(please be as accurate as possible)
18 On average, how much is your phone bill per month? £ PLEASE TURN OVER
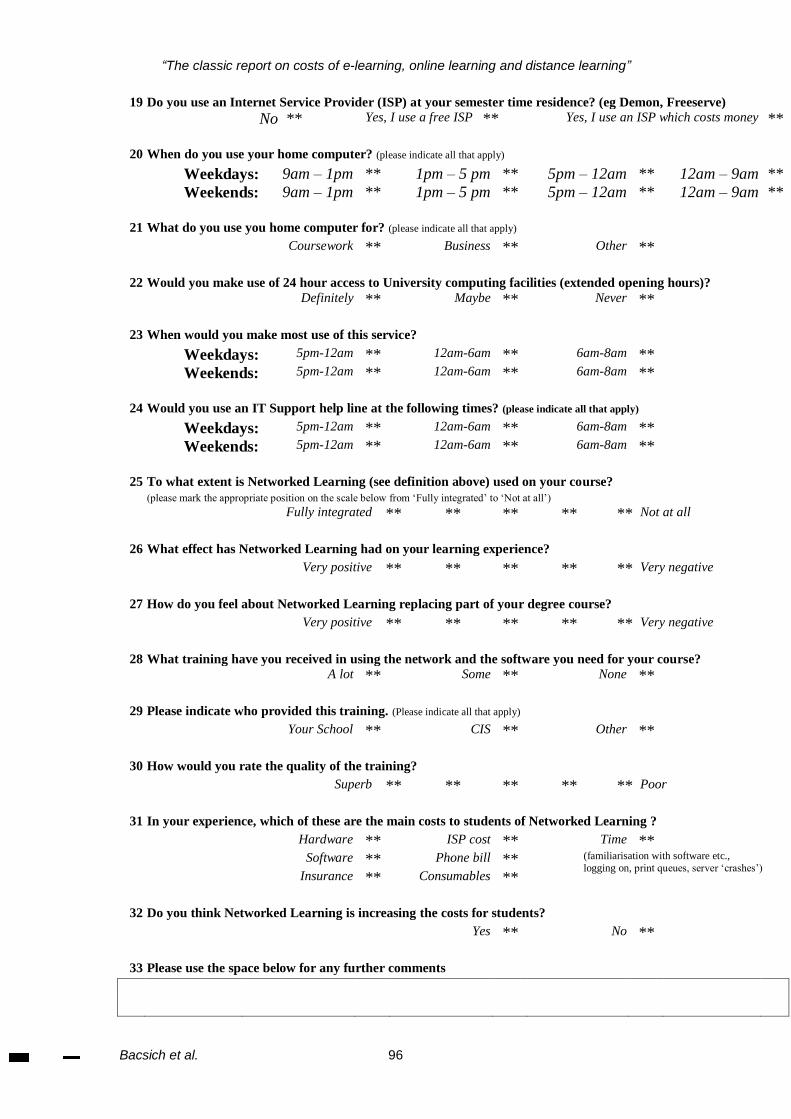
“The classic report on costs of e-learning, online learning and distance learning”
Bacsich et al. 96
19 Do you use an Internet Service Provider (ISP) at your semester time residence? (eg Demon, Freeserve) No ** Yes, I use a free ISP ** Yes, I use an ISP which costs money **
20 When do you use your home computer? (please indicate all that apply)
Weekdays: 9am – 1pm ** 1pm – 5 pm ** 5pm – 12am ** 12am – 9am **
Weekends: 9am – 1pm ** 1pm – 5 pm ** 5pm – 12am ** 12am – 9am **
21 What do you use you home computer for? (please indicate all that apply)
Coursework ** Business ** Other **
22 Would you make use of 24 hour access to University computing facilities (extended opening hours)?
Definitely ** Maybe ** Never **
23 When would you make most use of this service?
Weekdays: 5pm-12am ** 12am-6am ** 6am-8am **
Weekends: 5pm-12am ** 12am-6am ** 6am-8am **
24 Would you use an IT Support help line at the following times? (please indicate all that apply)
Weekdays: 5pm-12am ** 12am-6am ** 6am-8am **
Weekends: 5pm-12am ** 12am-6am ** 6am-8am **
25 To what extent is Networked Learning (see definition above) used on your course?
(please mark the appropriate position on the scale below from ‘Fully integrated’ to ‘Not at all’)
Fully integrated ** ** ** ** ** Not at all
26 What effect has Networked Learning had on your learning experience?
Very positive ** ** ** ** ** Very negative
27 How do you feel about Networked Learning replacing part of your degree course?
Very positive ** ** ** ** ** Very negative
28 What training have you received in using the network and the software you need for your course?
A lot ** Some ** None **
29 Please indicate who provided this training. (Please indicate all that apply)
Your School ** CIS ** Other **
30 How would you rate the quality of the training?
Superb ** ** ** ** ** Poor
31 In your experience, which of these are the main costs to students of Networked Learning ?
Hardware ** ISP cost ** Time **
Software ** Phone bill ** (familiarisation with software etc.,
logging on, print queues, server ‘crashes’) Insurance ** Consumables **
32 Do you think Networked Learning is increasing the costs for students?
Yes ** No **
33 Please use the space below for any further comments
Costs of Networked Learning
Bacsich et al. 97
A4 Conference Reports
A4.1 Report on the FLISH99 Conference with regard to CNL
Introduction
In response to JISC circular 9/98 it was stated that should Sheffield Hallam University be
awarded the grant, the outcomes of the “Costs of Networked Learning” project would be
presented at the “1999 Flexible Learning on the Information SuperHighway” (FLISH)
conference. The conference took place in May at the University and its theme was, “The
Business Case for Online Learning”. Due to the late notification and other planning
difficulties explained elsewhere in the project report, the study was delayed by one month and
therefore it was agreed by the Advisory Panel that only the preliminary outcomes would be
presented at the conference. This short report details the organisation of FLISH99 and how
integral this has been to the success of the project.
Organisation
The organisation for FLISH99 commenced in February 1999 with Professor Bacsich taking
the lead assisted by staff and financial support from the Virtual Campus Programme at
Sheffield Hallam University. The organisation was undertaken in close consultation with the
project team, to maintain continuity and direct relevance to the project.
Speakers with costings expertise were invited and marketing commissioned, including a Web
site and Conference brochure. A call was posted for papers to be contributed to the costings
workshop on the final day of the conference.
Once the Web site was functional and brochure completed a large postal mailing was
distributed from a database of contacts held within the team and built up over a number of
years. E-mail notification to UK HEIs was undertaken and several members of the team
posted to listservs. Adverts were placed in the Times Higher Educational Supplement, the
Independent and local press over the weeks leading up to the conference. Sponsorship, in the
form of funds and services, was obtained from SoftArc, Tiny Computers and WBTSystems.
The conference was held in the Pennine Theatre on the University’s City Campus, with
exhibitions and refreshments in the Atrium. A conference social evening took place at the
Kelham Island Industrial Museum and gave delegates and speakers a chance to network and
discuss issues raised during the day informally.
Registration was available by phone, fax, post and online and delegates were charged a
conference fee of £300. The event covered its own costs on a non-profit basis.
Speakers
Keynote speakers were invited to present at the conference on the theme of “The Business
Case for Online Learning”, several concentrated specifically on costs. These included:
Professor Chris Curran, Dublin City University, “Online Learning - the Business Case”
Patti Harvey, Mount Royal College, Canada, “Shining a Flashlight on Students (CSI) &
Resources Costs”
Professor Jef Moonen, University of Twente, Netherlands, “National Differences in
Approach to the Costs of Online Learning”

“The classic report on costs of e-learning, online learning and distance learning”
Bacsich et al. 98
Dr Greville Rumble, The Open University (UK), “The Costs of Networked Learning:
What have we Learnt?”
Other keynote speakers included:
Chris Yapp, ICL (UK), “The Business Case for Online Learning: UK Plc”
Professor Claudio Dondi, Scienter, Italy, “The Business case for Virtual Student
Mobility”
Professor Linda Harasim, Simon Fraser University, Canada, “A Business Case for
Research in Online Education and TeleLearning: Outlook for the 21st Century”
Dick Davies, Cable and Wireless College (UK), “Controlling Risk in the MarketSpace for
Online Learning”
Dr Robin Mason, The Open University (UK), “The Business Case for Global Online
Courses”
Keith Dunham*, CBTSystems
Professor Bill Graziadei*, WBTSystems
Dr Catherine Middleton*, York University, Canada
* These speakers were part of the commercial sponsorship of the Conference.
Presentations were also made by Paul Bacsich on the Costs of Networked Learning Project,
and Charlotte Ash on current work in progress and the Financial Schema. This session was
followed by a plenary discussion with an experts’ panel on costs and hidden costs.
It was observed that hidden costs were not considered as institutional costs although they
were quite a high proportion of costs. Time was seen as a principal cost. Staff were not sure
how to organise themselves on on-line. There was a need for a more sophisticated
apportionment of overheads.
The Head of Computing Services from one University told the conference that income per
student was £3,500 of which the share of computing services was £350. Yet the total cost of
ownership of a workstation was £1500 including network and technical support costs. This
was 3-4 times more than the individual allocation per student and was a driver towards future
student ownership of PCs.
Four papers were selected for the Costings Workshop on the final day of the conference:
Dr Grainne Conole, University of North London, “The Hidden Costs of Change:
evaluating the impact of moving to online delivery”
Dr Gilly Salmon, The Open University, “The Business Café Project”
Silvia Bartolic-Zlomislic, University of British Columbia, Canada, “Cost-Benefit of
TeleLearning”
Pieter de Vries, CINOP (Centre for the Innovation of Training and Education), Den
Bosch, Netherlands, “TELELEARN: An EU project on Costing Issues in Flexible and
Distance Learning”
Copies of the presentations, and papers where available, are available on the FLISH99 web
site at http://www.shu.ac.uk/flish/
Delegates
The project team had made provision for 200 delegates but in practice it was much more
difficult to engage potential delegates in this subject. It is estimated that over 7000 people
Costs of Networked Learning
Bacsich et al. 99
were directly targeted via postal and email postings, apart from the newspaper advertisements.
Some 120 people registered for the conference, with some being on a day-delegate or special
rate. The delegates came from a range of backgrounds and professions. Some were engaged in
their own costings work, others about to begin work in this area at the behest of their
organisations and others merely curious.
Analysis of event in relation to CNL
The event allowed consultation, both formally and informally, with a number of experts
whom it would have otherwise been difficult to pin down.
It enabled presentation and discussion of the project during work in progress stages.
It was clear that the sector is especially difficult to engage in this subject at all levels.
Those who did attend had genuine interest and concerns.
World experts in costings could sit around one table, while those presently working on
costing-related projects would fill only a medium-sized room.
A4.2 Report on Ed-Media conference with regard to CNL
The CNL team submitted a short work-in-progress paper to the Ed-Media99 conference held
in Seattle, 19-24th June. On the whole the conference was worth attending and much informal
dissemination was conducted. Forty-two people attended the short presentation given by
Professor Bacsich and Charlotte Ash about the project. The response was good and a number
of people expressed a wish to receive a copy of the final report.
On scanning the Ed-Media CD-ROM abstracts the word “cost” arises 16 times generally
accompanied by ‘at low’ or ‘minimal’ cost or with terms such as efficiency or effectiveness
tagged on. Only three papers (apart from our own) were specifically about cost, and these are
briefly detailed below.
Thomas Walter, Swiss Federal Institute of Technology in Zurich, presented a paper entitled
‘A System for the Cost-Value Evaluation of Teleteaching Systems and Its Application’. The
project team aimed to calculate the costs of ownership, the cost of usage and the associated
benefits of using the Teleteaching system. Costs were categorised as either, equipment,
manpower or operation, but did not account for non-project specific costs. The costs were
multiplied by both subjective and objective benefits, arrived at through a weighted
questionnaire, to determine the cost-value ratio. The lower the ratio the more cost-effective
the system. Walter did state on questioning that the methodology was very specific to the
Teleteaching project and that there were no plans to assess its applicability to other scenarios.
Only seven people attended this presentation.
Kenneth J Ekegren, from the North Central Technical College in the USA, presented a paper
entitled ‘Practical and Low Cost Methodology for Internet Classroom Presentations’. He had
introduced a system by which live lectures were recorded, in audio, and then posted to the
web site alongside the corresponding visuals, accompanying materials and assignments
allowing students unable to get to the lecture to receive the same information. The method
was reported as low cost as the additional equipment needed did not amount to $1000, but no
account was made for the pre-existing equipment or for the time needed to rerecord the
lectures onto the visual material. The audience for this presentation was large and generally
thought this was a practical, low stress and low cost method of increasing access to materials.
Konrad Michalski, Assistant Professor, Computers and Management Information Systems at
the University of Athabasca in Canada, delivered a paper to a large audience about a ‘Cost-
“The classic report on costs of e-learning, online learning and distance learning”
Bacsich et al. 100
Effective Approach to Electronic Course Development and Delivery in Distance Education’.
The system removed all costs from the course provider and placed them on the student and a
third party - whom they did not pay - leaving the University only with the costs of
examinations and marking. It was clear from the reaction of the audience and talking to
people after the presentation that this was clearly a laughable suggestion, and a fine example
of why costing education is treated in such a negative way.
A4.3 Report on Sunderland conference with regard to CNL
Paul Bacsich and Charlotte Ash submitted a paper to the Sunderland University Teaching and
Learning Conference, held on the 1st July 1999, which was accepted, and a thirty minute
presentation was given followed by an extensive question and answer session.
The audience was mainly academics with a small number of top management. Questions
focused on the staff issues mentioned, the collection of materials, and student concerns.
The other sessions attended by Paul Bacsich and Charlotte Ash concentrated on the practical
application of ideas not cost issues although costs were mentioned in a few instances as
difficulties, barriers or where work had taken place through funding opportunities. There were
a number of references to students, such as the quality of the learning experience, value for
money, extended provision and retention; in contrast the staff themselves were not mentioned.
A4.4 Report on IMUA conference with regard to CNL
Paul Bacsich presented a paper “The Hidden Costs of Networked Learning: The
consequences for university administrators” during the International Meeting of University
Administrators (IMUA) at the University of Edinburgh on 6-9th September.
The audience comprised mainly senior administrators (Registrars, University Secretaries)
with a small number of academics. The questions focused on working hours of academics and
the calculation of overheads. It seemed to be the case that the JCPSG Costings Guidelines had
not yet percolated much beyond Finance Departments.
A4.5 Report on Association for Learning Technology Conference with regard to CNL
Paul Bacsich and Charlotte Ash attended the annual Association for Learning Technology
Conference at the University of Bristol. The conference theme was the Learning Technology
Lifecycle and concentrated on Design, Practice and Outcomes over a three-day period. The
dissemination team presented a paper entitled ‘Costing the Lifecycle of Networked Learning:
Documenting the Costs from Conception to Evaluation’ under the Organisational Change
sub-strand. The presentation was well received by the packed room of delegates from a range
of backgrounds, although the paper concentrated on the development of the Lifecycle model
rather than the final outcomes of the project. Much informal dissemination and consensus
building took place throughout the event.
The Lifecycle model developed for the project was also used by the Oxford University TALL
(Technology Assisted Lifelong Learning) team as part of their pre-conference workshop.
There were no other papers related to costing issues at this conference.
Related Documents