www.policyschool.ca Volume 9 • Issue 11 • March 2016 THE COSTLIEST TAX OF ALL: RAISING REVENUE THROUGH CORPORATE TAX HIKES CAN BE COUNTER-PRODUCTIVE FOR THE PROVINCES † Ergete Ferede ‡ and Bev Dahlby * SUMMARY Raising taxes can come at a serious cost. Not just to the taxpayer, of course, but to the economy. Every tax hike naturally leads people or companies to reallocate resources in ways that are less productive, resulting in a loss of income-generating opportunities. At a certain point, raising taxes becomes manifestly counterproductive, with the revenue lost due to the negative economic effects outweighing any tax gains. In cases like that, a government would actually raise more money by lowering taxes, broadening the tax base, than it does by increasing taxes. In fact, an analysis of the tax-base elasticities of the provinces, using data from 1972 to 2010, reveals that this very phenomenon is what occurred in Saskatchewan, which raised corporate taxes to a point where it began to backfire, sabotaging the government’s goal of raising more revenue. It also occurred in New Brunswick, Newfoundland and Labrador, P.E.I., and Nova Scotia. In all these provinces, tax increases on corporate earnings actually ended up yielding less for the provinces than the provincial governments would have collected had they instead lowered corporate income taxes. In five other provinces, governments undermined their own provincial economies over the same period, raising corporate taxes when they would have been better off actually cutting the corporate income tax, and making up the difference with a revenue-neutral sales tax. Alberta, Ontario, British Columbia, Manitoba and Quebec all paid dearly for the decision to hit corporations with higher taxes, by sacrificing what could have been significant welfare gains had they sought to raise the same amount of revenue through higher sales taxes (or in the case of Alberta, a new sales tax). Quebec, at least, has lower tax-base elasticity than the others, however, possibly due to its unique cultural and linguistic characteristics, which may make it somewhat less likely for people and investors to leave the province. The evidence clearly demonstrates that corporate income taxes are far more sensitive to changes in the provincial tax rate than are personal income taxes or general sales taxes. Of course, it is not hard to see why politicians may feel political pressure to raise taxes on corporations, who do not vote, rather than passing tax increases onto residents, who do. But, while taxing corporations may be popular, preferred both by the voters and the politicians, when creating greater economic opportunities for their residents, provinces would have been far better off, over the measured 38-year period, looking elsewhere for additional revenue. As politically contentious as it may be, that means going easier on corporations and instead raising personal income and sales taxes. † We would like to thank Ross Hickey, Wojciech Kopczuk, an anonymous referee and seminar participants at the University of Barcelona for their helpful comments and suggestions. All remaining errors are our own. ‡ Department of Economics, MacEwan University, Edmonton * The School of Public Policy and Department of Economics, University of Calgary, Calgary

Welcome message from author
This document is posted to help you gain knowledge. Please leave a comment to let me know what you think about it! Share it to your friends and learn new things together.
Transcript

www.policyschool.ca
Volume 9 • Issue 11 • March 2016
THE COSTLIEST TAX OF ALL: RAISING REVENUE THROUGH CORPORATE TAX HIKES CAN BE COUNTER-PRODUCTIVE FOR THE PROVINCES†
Ergete Ferede‡ and Bev Dahlby*
SUMMARYRaising taxes can come at a serious cost. Not just to the taxpayer, of course, but to the economy. Every tax hike naturally leads people or companies to reallocate resources in ways that are less productive, resulting in a loss of income-generating opportunities. At a certain point, raising taxes becomes manifestly counterproductive, with the revenue lost due to the negative economic effects outweighing any tax gains. In cases like that, a government would actually raise more money by lowering taxes, broadening the tax base, than it does by increasing taxes.
In fact, an analysis of the tax-base elasticities of the provinces, using data from 1972 to 2010, reveals that this very phenomenon is what occurred in Saskatchewan, which raised corporate taxes to a point where it began to backfire, sabotaging the government’s goal of raising more revenue. It also occurred in New Brunswick, Newfoundland and Labrador, P.E.I., and Nova Scotia. In all these provinces, tax increases on corporate earnings actually ended up yielding less for the provinces than the provincial governments would have collected had they instead lowered corporate income taxes.
In five other provinces, governments undermined their own provincial economies over the same period, raising corporate taxes when they would have been better off actually cutting the corporate income tax, and making up the difference with a revenue-neutral sales tax. Alberta, Ontario, British Columbia, Manitoba and Quebec all paid dearly for the decision to hit corporations with higher taxes, by sacrificing what could have been significant welfare gains had they sought to raise the same amount of revenue through higher sales taxes (or in the case of Alberta, a new sales tax). Quebec, at least, has lower tax-base elasticity than the others, however, possibly due to its unique cultural and linguistic characteristics, which may make it somewhat less likely for people and investors to leave the province.
The evidence clearly demonstrates that corporate income taxes are far more sensitive to changes in the provincial tax rate than are personal income taxes or general sales taxes. Of course, it is not hard to see why politicians may feel political pressure to raise taxes on corporations, who do not vote, rather than passing tax increases onto residents, who do. But, while taxing corporations may be popular, preferred both by the voters and the politicians, when creating greater economic opportunities for their residents, provinces would have been far better off, over the measured 38-year period, looking elsewhere for additional revenue. As politically contentious as it may be, that means going easier on corporations and instead raising personal income and sales taxes.
† We would like to thank Ross Hickey, Wojciech Kopczuk, an anonymous referee and seminar participants at the University of Barcelona for their helpful comments and suggestions. All remaining errors are our own.
‡ Department of Economics, MacEwan University, Edmonton
* The School of Public Policy and Department of Economics, University of Calgary, Calgary
1
1. INTRODUCTION
The responsiveness of tax bases to tax rate changes is at the heart of academic and political debates surrounding the economic effects of taxes. Taxes influence labour supply, saving, investment, and other important economic decisions of the private sector. As a result, when governments increase tax rates in an attempt to raise more tax revenue, the resulting changes in the allocation of resources cause efficiency losses for the economy. This efficiency cost of tax rate changes can be nicely summarized with the marginal cost of public funds (MCF)—a measure of the loss incurred by a society in raising an additional dollar of tax revenue. The efficiency loss from the reallocation of resources caused by tax rate increases is directly related to the responsiveness of tax bases to tax rate changes. Consequently, tax-base elasticity—the responsiveness of tax bases to tax rate changes—has a central importance in tax-policy discussions and analyses.
The revenue and economic effects of tax rate changes greatly depend on how the various tax bases respond to tax rate changes. A number of previous studies examine the behavioural responses of tax bases to tax rate changes. The empirical methodology used varies across studies and most of these studies focus on the estimation of the elasticity of taxable income with respect to the net-of-tax rate (one minus the tax rate). An excellent survey of the earlier literature on the elasticity of taxable income is given by Saez, Slemrod, and Giertz.1 The majority of the studies also rely on individual U.S. household-tax-return data. Some of these studies such as Lindsey,2 and Feldstein,3 obtain taxable-income elasticities in excess of one. However, more recent studies such as Auten and Carroll,4 Long,5 Kopczuk,6 Gruber and Saez,7 and Giertz8 find that the taxable-income response is much lower than one. Using tax-returns data from Canadian households, Sillamaa and Veall9 also find an elasticity of taxable income with respect to the net-of-tax rate close to 0.25 for working-age individuals. Milligan and Smart10 also estimate the elasticity of reported personal income to tax rate changes by exploiting subnational variation across Canadian provinces as their main identification strategy. They find that the elasticity is
1 Emmanuel Saez, Joel Slemrod and Seth H. Giertz, “The Elasticity of Taxable Income with Respect to Marginal Tax Rates: A Critical Review,” NBER Working Paper 15012 (Cambridge, Mass.: National Bureau of Economic Research, 2009).
2 Lawrence Lindsey, “Individual Taxpayer Response to Tax Cuts: 1982-1984,” Journal of Public Economics 33, 2 (1987): 173–206.
3 Martin Feldstein, “The Effect of Marginal Tax Rates on Taxable Income: A Panel Study of the 1986 Tax Reform Act,” Journal of Political Economy 103, 3 (1995): 551–72.
4 Gerald Auten and Robert Carroll, “The Effect of Income Taxes on Household Income,” Review of Economics and Statistics 81, 4 (1999): 681-693.
5 James E. Long, “The Impact of Marginal Tax Rates on Taxable Income: Evidence from State Income Tax Differentials,” Southern Economic Journal 65, 4 (1999): 855–69.
6 Wojciech Kopczuk, “Tax Bases, Tax Rates and the Elasticity of Reported Income,” Journal of Public Economics 89, 11-12 (2005): 2093–119.
7 Jonathan Gruber and Emmanuel Saez, “The Elasticity of Taxable Income: Evidence and Implications,” Journal of Public Economics 84, 1 (2002): 1–32.
8 Seth H. Giertz, “The Elasticity of Taxable Income over the 1980s and 1990s,” National Tax Journal 60, 4 (2007): 743–68. 9 Mary-Anne Sillamaa and Michael R. Veall, “The Effect of Marginal Tax Rates on Taxable Income: A Panel Study of the
1988 Tax Flattening in Canada,” Journal of Public Economics 80, 3 (2001): 341–56. 10 Kevin Milligan and M. Smart, “Taxation and Top Income in Canada,” NBER Working Paper No. 20489 (Cambridge, Mass.:
National Bureau of Economic Research, 2014).
2
high for those people in the top one percentile of the income distribution and small for other income groups. Their results also suggest that both earned and capital income are responsive to tax rate changes.
Another strand of the empirical literature focuses on the responsiveness of the corporate-income-tax base to tax rate changes. These studies include Mintz and Smart11 for Canada, Gruber and Rauh12 for the United States, Huizinga and Laeven13 for European countries, and Riedl and Rocha-Akis14 for OECD countries. These studies find high responsiveness of the corporate-income-tax base to tax rate changes.
In a previous study,15 we employ panel data analysis to estimate tax-base elasticities for all Canadian provinces for their three major sources of tax revenue: corporate income tax (CIT), personal income tax (PIT) and provincial general sales tax (PST). We find that one-percentage-point increases in corporate-income-, personal income-, and sales-tax rates were associated with short-run reductions in their respective tax bases of 3.67, 0.76, and 1.17 per cent. The corresponding long-run tax-base-elasticity estimates are much higher. We also use the elasticity estimates to compute the marginal cost of public funds (MCF) for each of these taxes for each province based on the tax rates and tax-revenue shares of the tax bases, which vary over time and across provinces. We find that the corporate income tax has the highest MCF and sales tax has the lowest MCF in all provinces.
MCF computations in the previous study relied on the use of tax-base-elasticity estimates that were common to all the provinces. In this paper, however, we focus on investigating province-specific responsiveness of tax bases to tax rate changes. One would expect tax-base-elasticity estimates to differ across provinces due to various province-specific characteristics that change over time. First, some models of tax competition such as Kanbur and Keen16 suggest that small provinces may have more elastic tax bases than do large provinces. But the relative size of provinces can change over time.17 Second, variations in the socio-cultural makeup of provinces may influence tax-base mobility. For instance, the personal income tax base in Quebec, where the mother tongue of the majority of the population is French, may be lower than in other provinces if the francophone population is less likely to move from Quebec in response to higher tax rates.18 Third, the sensitivity
11 Jack Mintz and M. Smart, “Income Shifting, Investment, and Tax Competition: Theory and Evidence from Provincial Taxation in Canada,” Journal of Public Economics 88, 6 (2004): 1149–68.
12 Jonathan Gruber and Joshua Rauh, “How Elastic Is the Corporate Income Tax Base?” in Taxing Corporate Income in the 21st Century, ed. Alan Auerbach, James R. Hines, and Joel Slemrod (Cambridge, Mass.: Cambridge University Press, 2007).
13 Harry Huizinga and Luc Laeven, “International Profit Shifting within Multinationals: A Multi-Country Perspective,” Journal of Public Economics 92, 5-6 (2008): 1164–82.
14 Aleksandra Riedl and Silvia Rocha-Akis, “Testing the Tax Competition Theory: How Elastic Are National Tax Bases in OECD Countries?” CESifo Working Paper 2669 (Munich: CESifo, 2009).
15 Bev Dahlby and E. Ferede, “The effects of tax rate changes on tax bases and the marginal cost of public funds for provincial governments,” International Tax and Public Finance 19 (2012) 844-883.
16 Ravi Kanbur and Michael Keen, “Jeux Sans Frontières: Tax Competition and Tax Coordination When Countries Differ in Size,” American Economic Review 83, 4 (1993): 877-892.
17 For instance, the relative economic shares of Alberta and British Columbia in the federation changed over time. While British Columbia had historically the third-largest economy in the country, the province was overtaken by Alberta in 1995.
18 See: R. Finnie, “Who Moves? A Panel Logit Model Analysis of Inter-Provincial Migration in Canada,” Applied Economics 36, 16 (2004): 1759–79; and Emmanuel Saez and Michael R. Veall, “The Evolution of High Incomes in Northern America: Lessons from Canadian Evidence,” American Economic Review 95, 3 (2005): 831-849.
3
of tax bases to tax rate changes may well depend on the industrial mix of provinces, which obviously changes across time periods and provinces due to structural changes in the various sectors. For these and other reasons it is important to obtain province-specific tax-base-elasticity estimates so that relatively more precise estimates of the effects of provincial tax-policy changes can be provided.
The main objective of this paper is to provide province-specific long-run tax-base semi-elasticity estimates for the three major tax categories: corporate income, personal income, and sales taxes, using provincial annual time-series data over the period 1972–2010. We focus on the long-run tax-base-elasticity estimates because tax-policy discussions and debates usually focus on the long-run effects of tax rate changes. To obtain the tax-base-elasticity estimates, we employ the Dynamic Ordinary Least Square (DOLS) estimation method proposed by Stock and Watson.19 This estimation method performs better than other competing methods in small sample studies such as ours as it has superior small-sample properties. For this reason, previous studies such as Sobel and Holcombe,20 Schaller,21 and Bruce, Deskins and Fox22 employ a similar method. Another important contribution of our paper is that we use the province-specific tax-base semi-elasticity estimates to compute MCF measures for the three taxes for all provinces for the years up to 2013. We believe the MCF estimates obtained through such a procedure will provide better insights into the economic costs of taxes and contribute towards Canadian tax-policy discussions and analysis. To the best of our knowledge, this is the first study that attempts to measure the long-run tax-base responsiveness to tax rate changes for individual Canadian provinces.
Our results suggest that the corporate-income-tax base shows the most responsiveness to tax rate changes. The estimated corporate-income-tax base’s own semi-elasticity estimates range from –6.08 for Quebec to –17.56 for New Brunswick. The own semi-elasticity estimate for the personal income tax base varies from –2.62 for Quebec to –4.42 for British Columbia. We also obtain general-sales-tax-base semi-elasticity estimates for seven provinces, and those range from about –3.65 for Manitoba to –5.90 for Prince Edward Island.
We use the province-specific long-run tax-base-elasticity estimates to compute the MCF for the three taxes for all provinces. The results indicate that there have been significant variations in the MCF during the period under investigation due to changes in tax rates and tax-revenue shares. We find that corporate and personal income taxes have higher MCF than does sales tax. Our results also indicate that, in 2013, the MCF for corporate income tax was the highest and the MCF for sales tax was the lowest for all provinces except Ontario. The MCF estimates for corporate income tax range from 2.91 for Alberta to 5.21 for Ontario in 2013. This is consistent with the findings of previous studies, which
19 J. H Stock and M. W. Watson, “A simple estimator of co-integrating vectors in higher order integrated systems,” Econometrica 61, 4 (1993): 783-820.
20 Russell Sobel and Randall Holcombe, “Measuring the Growth and Variability of Tax Bases over the Business Cycle,” National Tax Journal 49 (1996): 535-552.
21 H. Schaller, “Estimating the Long-Run User Cost Elasticity,” Journal of Monetary Economics 53 (2006): 725-736. 22 Donald Bruce, John Deskins and William Fox, “On the Extent, Growth, and Efficiency Consequences of State Business Tax
Planning,” in Taxing Corporate Income in the 21st Century, ed. A. Auerbach, J. Hines, and J. Slemrod (Cambridge, Mass.: Cambridge University Press, 2007).

4
have indicated that there is a very high economic cost associated with raising tax revenue through increases in the corporate income tax.
An important policy implication of our findings is that there would have been significant welfare gains in 2013 from a reduction in the CIT rate with a revenue-neutral switch to higher sales tax rates in British Columbia, Alberta, Manitoba, Ontario and Quebec. We also find that a CIT-rate reduction would have increased tax revenue in the Atlantic provinces and Saskatchewan—i.e. these provinces were on the negatively sloped section of their long-run Laffer curves with respect to corporate-income-tax rates.
The remaining part of the paper is organized as follows. In Section 2, we specify the empirical model, discuss the methodology, and describe the data used in our analysis. The econometric results are presented and discussed in Section 3. Our framework for calculating the MCF using our estimated tax-base semi-elasticities is described in Section 4, along with the computations of the provinces’ MCF for the three major taxes. Section 5 concludes.
2. ECONOMETRIC SPECIFICATION, METHODOLOGY AND DATA
2.1. Econometric specification
Our main objective is to estimate the responsiveness of tax bases to tax rates for the three main taxes that are levied by the provincial governments in Canada: the corporate income tax (c), personal income tax (p), and general sales tax (s). As is common in previous studies, the basic empirical model can be specified as:
(1)
where j = c, p, s. In Equation (1), jtBln is the log of tax base j in year t, and τjt is the corresponding provincial statutory tax rate. X includes a vector of various control variables. Using annual provincial data, Equation (1) will be estimated for each province and for each tax category separately. The coefficients of interest in Equation (1) are εji, which show the percentage response of the tax base j due to a one-percentage-point change in the tax rate i. We expect the own semi-elasticity estimates, εjj, to be negative, implying that an increase in the statutory tax rate reduces its corresponding tax base due to possible tax evasion and avoidance activities.
Previous studies often rely on tax-base proxies due to the absence of tax-base data. In this study, however, we use actual measures of tax bases. In our corporate-income-tax-base regression, the dependent variable is the log of the business income tax base. Similarly, in our sales-tax-base regression, the dependent variable is the log of general-sales-tax base. These tax bases are part of the administrative data that the federal government uses in its equalization-payments calculations. Further, we use reported personal taxable income as a measure of personal income tax base. Since the sizes of provinces vary greatly, we divide the tax bases by the province’s total population to make comparison across provinces possible. We also deflate the tax bases by the province’s respective GDP deflator in order to account for the effect of inflation.

5
Our key variables of interest are the provincial statutory tax rates. We rely on provincial statutory rates rather than the combined federal and provincial rates because our main interest is to estimate provincial-tax-base semi-elasticities. This approach also enables us to assess whether provincial and federal tax rates have differential effects on provincial tax bases. In our empirical analysis, the sales tax rate is the statutory provincial retail-sales-tax rate. For those provinces that harmonized their sales taxes with the federal GST, on the other hand, we use the provincial component of the harmonized sales tax rate. During the period under consideration, as all provinces use progressive income tax systems, the choice of the provincial income tax rate for empirical analysis is not straightforward.23 Ideally, one would like to use a weighted average of the various tax rates applicable to the different tax brackets. This requires information on the number of taxpayers for the different tax brackets. As such a dataset is not readily available, following our previous study,24 we use the personal income tax rate that is applicable for the top income tax bracket. Some provinces during some years charge surtax on the top income earners. Thus, our top statutory provincial and federal personal income tax rates include all such applicable surtaxes.
Although our main interest is in estimating the semi-elasticity of tax bases with their own tax rates, as the different taxes are interrelated, a change in one tax rate may affect another tax base. This is particularly true between the corporate and personal income taxes. Thus, in our analysis we include all the three tax rates (CIT, PIT, and PST) as explanatory variables in each tax-base regression. This helps us assess the cross effects of tax rates on tax bases. For example we include sales- and income-tax rates in the corporate-tax-base regressions. There are various factors that may affect a province’s tax base other than its tax rates. Consequently, our sets of control variables include other provinces’ tax rates, federal tax rates and other macroeconomic variables that may have direct effects on the tax bases. We discuss these various control variables below.
The literature on tax competition suggests that a province’s tax base may be affected by the relevant tax rates in other jurisdictions. If the tax base is mobile (as is the case for corporate- and provincial-income-tax bases), the tax base may move from a high-tax jurisdiction to a low-tax jurisdiction. Differences in sales taxes between contiguous provinces may also encourage cross-border shopping. Thus, to account for these horizontal tax externalities, we include other provinces’ tax rates as control variables.25 We expect the other provinces’ tax rates to have positive effects on a tax base. In order to account for the presence of vertical tax externality in the Canadian federation, we also include the federal tax rate wherever applicable. More specifically, we include the federal CIT and the top marginal PIT rates in the corporate-tax-base and personal income tax-base regressions, respectively. We also include the federal goods and services tax (GST) in the sales-tax-base regression. As the provincial and federal governments co-occupy the same tax base, an increase in the federal tax rate is expected to have a negative effect on the tax base. Thus, we expect the coefficient of the federal tax rate to be negative in the provincial-tax-base regressions.
23 Since 2001, Alberta has been using a flat personal income tax rate of 10 per cent.24 Dahlby and Ferede, “The effects.”25 In the CIT-base regression, we use the weighted-average (weighted by population size) tax rate of all other provinces, but in
the PIT- and PST-base regressions we use the weighted-average tax rate of contiguous neighbouring provinces.

6
One would expect tax bases to be affected by various domestic and foreign macroeconomic shocks. To control for such effects, we also include various proxy variables for foreign and domestic shocks. As all provincial economies have their respective unique characteristics, they may face similar or different macroeconomic shocks. Thus the macroeconomic variables used to capture these shocks may well vary from one province to another.
2.2. Methodology
The main goal of this paper is to estimate province-specific long-run tax-base elasticities and use them to compute provincial MCF. To this effect, as indicated before, we use time-series analysis and provide empirical analysis for each province separately.26 In time-series-based studies such as ours, co-integration techniques are commonly used to obtain long-run elasticities. However, to use this estimation method, one needs to first investigate the time-series properties of the various variables. A common empirical challenge in time-series analysis is that if the variables are non-stationary, estimation of specifications such as Equation (1) with the commonly used ordinary least square (OLS) estimation method may provide spurious results. This is particularly true if the relevant variables do not have long-term relationships or are not co-integrated. For this reason, the first step in time-series analysis is to check for the order of integration of the various variables.
In the literature, there are various kinds of unit-root tests. Previous studies commonly employ the Augmented-Dickey-Fuller (ADF) unit-root test to check for the order of integration of time-series variables. The Phillips-Perron unit-root test is also another commonly used test to check whether a time-series variable possesses a unit root. However, these unit-root tests are also known to have serious limitations particularly in small samples. To overcome some of the shortcomings of these tests, Elliott, Rothenberg and Stock27 proposed an efficient unit-root test that modifies the familiar Dickey-Fuller test statistic using a generalized least squares (GLS) method (DF-GLS). They and other later studies show that this unit-root test (DF-GLS) is much better than all previous unit-root tests and has better performance and power in small-sample-size studies such as ours. Thus, in our analysis we employ this relatively powerful unit-root test in order to check whether the various variables of interest are non-stationary. Another advantage of the DF-GLS unit-root test is that it automatically chooses the necessary lag length for unit-root tests. We choose the optimal lag length for the DF-GLS test using the method suggested by Ng and Perron.28
Our results suggest that all of the variables of interest, with the exception of the sales tax rate for British Columbia and Ontario, the corporate-income-tax base for New Brunswick and Prince Edward Island, and the personal income tax rate for Nova Scotia are non-
26 An alternative empirical approach to obtain province-specific tax-base-elasticity estimates would be to use panel data analysis as in Dahlby and Ferede, “The effects,” and interact the tax rates with the provincial dummies. However, given the limited span of our data, such an approach would not be feasible. There will be no sufficient degrees of freedom to estimate the very many explanatory variables and their interaction terms in the model. For instance, interacting the three tax rates with the provincial dummies alone involves adding about 30 explanatory variables in the model.
27 G. R. Elliott, T. J. Rothenberg and J. H. Stock, “Efficient tests for an autoregressive unit root,” Econometrica 64 (1996): 813–836.
28 S. Ng and P. Perron, “Unit root tests in ARMA models with data-dependent methods for the selection of the truncation lag,” Journal of the American Statistical Association 90 (1995): 268–281.
7
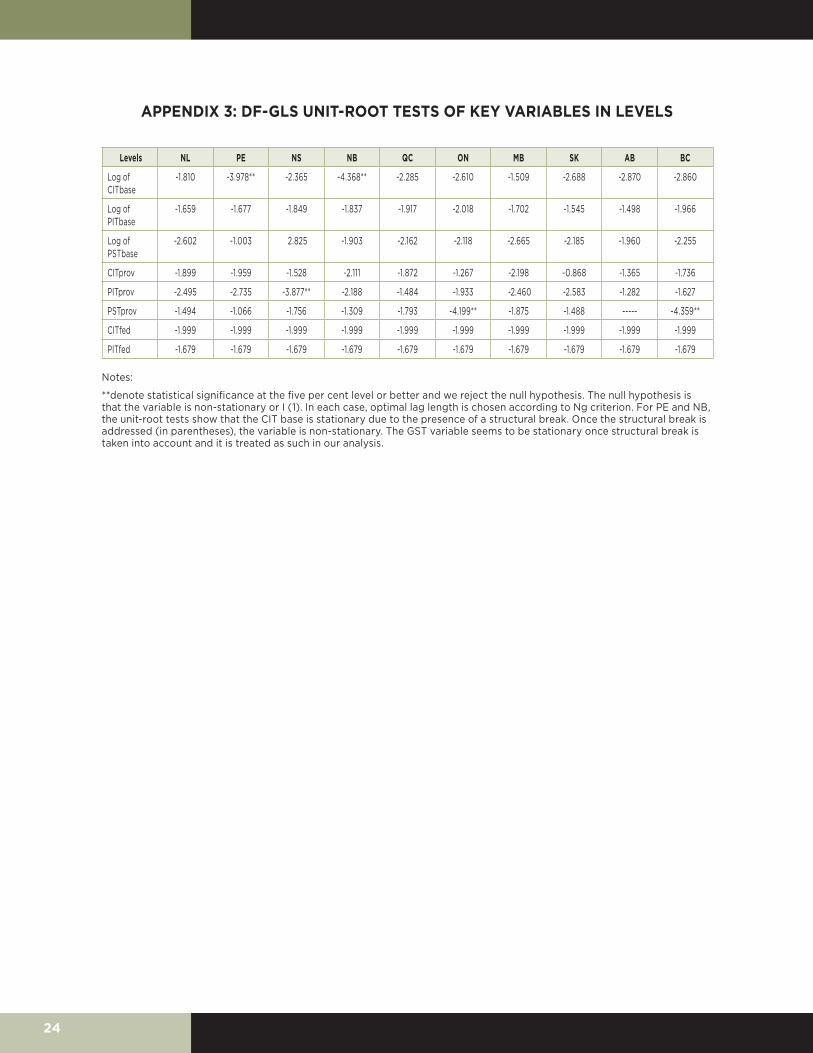
stationary or I(1). Although the DF-GLS test suggests that the corporate-income-tax base is stationary for New Brunswick and Prince Edward Island, a closer look at the data indicates that this is due to the presence of a structural break in the data for the two provinces. It is generally well-known that in the presence of structural breaks, all unit-root tests perform very poorly and can be unreliable. Using a procedure suggested by Clemente, Montanes, and Reyes29 we conduct a unit-root test that would allow for structural breaks for the CIT base for the two provinces. We find that the corporate-income-tax base is indeed non-stationary for the provinces and we treat this variable as non-stationary in our analysis. The unit-root tests are provided in Appendix 3.
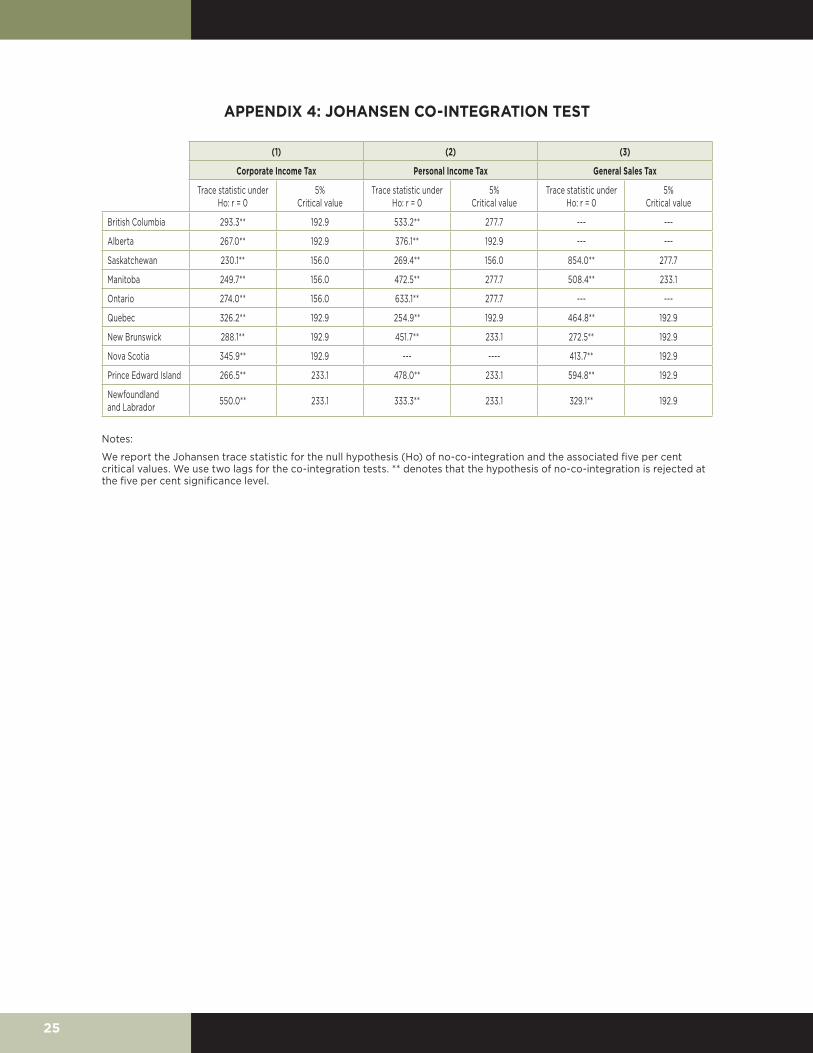
As the various variables of interest are non-stationary, estimation of Equation (1) by OLS may yield spurious results. The risk of spurious regression results from the direct estimation of Equation (1) by OLS can, however, be assuaged if the variables are co-integrated or have common trend. If the variables are co-integrated, it means that they have common stochastic trends and they move together in the long run. In the presence of co-integration, OLS estimation of Equation (1) reveals long-run relationships among the various relevant time-series variables. Thus, if the relevant variables in Equation (1) are co-integrated, the coefficient estimates will provide the long-run tax-base semi-elasticity estimates. Thus, empirically testing for the presence of co-integration relationships between the variables is important in time-series analysis. We conduct co-integration tests using the Johansen co-integration test procedure. We find that the various variables of interest are co-integrated for all provinces and the three relevant tax bases. The detailed results of the co-integration tests are given in Appendix 4.
It is known that if the variables are co-integrated, OLS coefficient estimates are consistent. However, OLS is not asymptotically normal and the usual inference using t- statistic cannot be used. Inference using OLS also becomes difficult if the explanatory variables are endogenous. Stock and Watson30 suggest augmenting the OLS regression with leads and lags of the first difference of the non-stationary explanatory variables. Stock and Watson31 show that including the first difference of the non-stationary variables in the regression solves the endogeneity problem. OLS estimation of the model that includes the first difference of the non-stationary variables and their leads and lags is called Dynamic OLS (DOLS) estimation.32 If the variables are co-integrated, coefficient estimates through DOLS are super consistent and statistical inference based on coefficients from such a regression and heteroskedasticity and autocorrelation consistent standard errors are valid. In
29 J. Clemente, A. Montanes, and M. Reyes, “Testing for a Unit Root in Variables with a Double Change in the Mean,” Economics Letters, 59 (1998): 175-182.
30 Stock and Watson, “A simple.”31 ibid.32 DOLS estimation is based on a modified version of Equation (1) that includes past, present, and future values of
the changes in the non-stationary explanatory variables. If the tax rates are non-stationary, ignoring the other control variables for simplicity, the model to be estimated takes the following form: 𝑛𝑛𝐵𝐵𝑗𝑗𝑗𝑗 = 𝑜𝑜𝑗𝑗 + 𝜀𝜀𝑗𝑗𝑗𝑗𝜏𝜏𝑗𝑗 + 𝜀𝜀
𝑗𝑗𝑗𝑗𝜏𝜏𝑗𝑗𝑗𝑗 + 𝜀𝜀
𝑗𝑗𝑗𝑗𝜏𝜏𝑗𝑗𝑗𝑗 + ∑ 𝜀𝜀𝑗𝑗′∆𝜏𝜏𝑗𝑗𝑗𝑗−𝑖𝑖
𝑘𝑘
𝑖𝑖=−𝑘𝑘+ ∑ 𝜀𝜀𝑗𝑗′∆𝜏𝜏𝑗𝑗𝑗𝑗−𝑖𝑖
𝑘𝑘
𝑖𝑖=−𝑘𝑘+ ∑ 𝜀𝜀𝑠𝑠′∆𝜏𝜏𝑠𝑠𝑗𝑗−𝑖𝑖 + 𝑣𝑣𝑗𝑗
𝑘𝑘
𝑖𝑖=−𝑘𝑘
𝑛𝑛𝐵𝐵𝑗𝑗𝑗𝑗 = 𝑜𝑜𝑗𝑗 + 𝜀𝜀𝑗𝑗𝑗𝑗𝜏𝜏𝑗𝑗 + 𝜀𝜀𝑗𝑗𝑗𝑗𝜏𝜏𝑗𝑗𝑗𝑗 + 𝜀𝜀
𝑗𝑗𝑗𝑗𝜏𝜏𝑗𝑗𝑗𝑗 + ∑ 𝜀𝜀𝑗𝑗′∆𝜏𝜏𝑗𝑗𝑗𝑗−𝑖𝑖
𝑘𝑘
𝑖𝑖=−𝑘𝑘+ ∑ 𝜀𝜀𝑗𝑗′∆𝜏𝜏𝑗𝑗𝑗𝑗−𝑖𝑖
𝑘𝑘
𝑖𝑖=−𝑘𝑘+ ∑ 𝜀𝜀𝑠𝑠′∆𝜏𝜏𝑠𝑠𝑗𝑗−𝑖𝑖 + 𝑣𝑣𝑗𝑗
𝑘𝑘
𝑖𝑖=−𝑘𝑘 , where the variables are as denoted before. Coefficient
estimates obtained through DOLS are consistent, asymptotically normally distributed and efficient. Further, asymptotically there is no simultaneity bias in DOLS estimation. This is because the inclusion of the first-differenced variables asymptotically eliminates the endogeneity of the explanatory variables. See Bruce, Deskins and Fox, “On the Extent,” for a similar discussion. DOLS also deals with potential measurement error problems.

8
fact, Monte Carlo studies such as Carrion-i-Silvestre and Sansó-i-Rosselló33 show that the DOLS estimator performs better than the Johansen method particularly in small samples such as ours as its finite sample properties are better. Previous studies such as Schaller,34 Bruce, Deskins and Fox,35 and Wolswijk36 use DOLS to estimate elasticities. While DOLS estimates are super consistent if the non-stationary variables are co-integrated, the standard errors may not be useful as the problem of serial correlation still remains in the model. To address this, we rely on Newey-West serial correlation-robust standard errors. Note also that since the DOLS estimation controls for lagged and future values of changes in the tax rates, it also deals with the potential problem of endogeneity.
2.3. Data
Our empirical specification is estimated using annual aggregate provincial time-series data for all the 10 Canadian provinces for the period 1972–2010. The data on statutory marginal tax rates are obtained from various issues of Finances of the Nation (formerly National Finances). The dataset on provincial taxable income is obtained from various issues of Income Statistics (formerly Tax Statistics on Individuals) published by the Canada Revenue Agency and it is an aggregate measure of the reported personal taxable income. As stated before, the business-income-tax and general-sales-tax bases are obtained from Finance Canada and they are the ones used by the federal government in its equalization-payment allocations. A brief description of the data and definitions of the variables used in our empirical analysis is provided in Appendix 2. In Appendix 1 we present the key variables of interest for all the provinces. In addition to the average values for the study period, we indicate the corresponding values for the beginning and final year of the study period, and the last year for which we are going to compute the MCF. Over the period under consideration, there is a great deal of variation in real tax bases across provinces. As the main economic variables and the associated data are similar to those of our previous study,37 we keep our discussion brief here.
3. EMPIRICAL RESULTS
In this section, we present and discuss the long-run tax-base semi-elasticity estimates obtained using the DOLS method. In DOLS estimation, the leads and lags of the differenced non-stationary variables are included as explanatory variables. In order to save degrees of freedom, given our relatively small sample size, we include up to two leads and lags whenever possible. Different length of lags and leads are used for the various
33 J.L. Carrion-i-Silvestre and A.S. Sansó-i-Rosselló, “Testing the Null of Cointegration with Structural Breaks,” Oxford Bulletin of Economics and Statistics 68 (2006), 623–646.
34 Schaller, “Estimating.”35 Bruce, Deskins and Fox, “On the Extent.”36 G. Wolswijk, “Short-and long-run tax elasticities: the case of The Netherlands,” Working Paper No. 763 (European Central
Bank, 2007).37 Dahlby and Ferede, “The effects.”
9
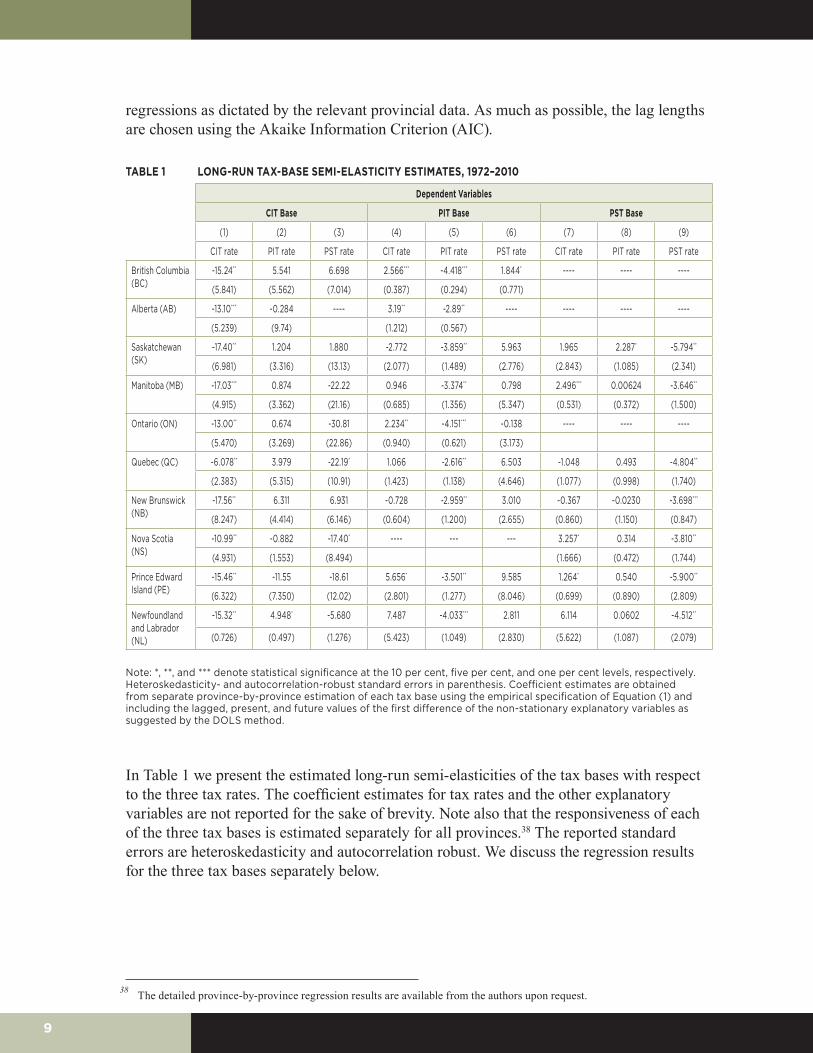
regressions as dictated by the relevant provincial data. As much as possible, the lag lengths are chosen using the Akaike Information Criterion (AIC).
TABLE 1 LONG-RUN TAX-BASE SEMI-ELASTICITY ESTIMATES, 1972–2010
Dependent Variables
CIT Base PIT Base PST Base
(1) (2) (3) (4) (5) (6) (7) (8) (9)
CIT rate PIT rate PST rate CIT rate PIT rate PST rate CIT rate PIT rate PST rate
British Columbia (BC)
-15.24** 5.541 6.698 2.566*** -4.418*** 1.844* ---- ---- ----
(5.841) (5.562) (7.014) (0.387) (0.294) (0.771)
Alberta (AB) -13.10*** -0.284 ---- 3.19** -2.89** ---- ---- ---- ----
(5.239) (9.74) (1.212) (0.567)
Saskatchewan (SK)
-17.40** 1.204 1.880 -2.772 -3.859** 5.963 1.965 2.287* -5.794**
(6.981) (3.316) (13.13) (2.077) (1.489) (2.776) (2.843) (1.085) (2.341)
Manitoba (MB) -17.03*** 0.874 -22.22 0.946 -3.374** 0.798 2.496*** 0.00624 -3.646**
(4.915) (3.362) (21.16) (0.685) (1.356) (5.347) (0.531) (0.372) (1.500)
Ontario (ON) -13.00** 0.674 -30.81 2.234** -4.151*** -0.138 ---- ---- ----
(5.470) (3.269) (22.86) (0.940) (0.621) (3.173)
Quebec (QC) -6.078** 3.979 -22.19* 1.066 -2.616** 6.503 -1.048 0.493 -4.804**
(2.383) (5.315) (10.91) (1.423) (1.138) (4.646) (1.077) (0.998) (1.740)
New Brunswick (NB)
-17.56** 6.311 6.931 -0.728 -2.959** 3.010 -0.367 -0.0230 -3.698***
(8.247) (4.414) (6.146) (0.604) (1.200) (2.655) (0.860) (1.150) (0.847)
Nova Scotia (NS)
-10.99** -0.882 -17.40* ---- --- --- 3.257* 0.314 -3.810**
(4.931) (1.553) (8.494) (1.666) (0.472) (1.744)
Prince Edward Island (PE)
-15.46** -11.55 -18.61 5.656* -3.501** 9.585 1.264* 0.540 -5.900**
(6.322) (7.350) (12.02) (2.801) (1.277) (8.046) (0.699) (0.890) (2.809)
Newfoundland and Labrador (NL)
-15.32** 4.948* -5.680 7.487 -4.033*** 2.811 6.114 0.0602 -4.512**
(0.726) (0.497) (1.276) (5.423) (1.049) (2.830) (5.622) (1.087) (2.079)
Note: *, **, and *** denote statistical significance at the 10 per cent, five per cent, and one per cent levels, respectively. Heteroskedasticity- and autocorrelation-robust standard errors in parenthesis. Coefficient estimates are obtained from separate province-by-province estimation of each tax base using the empirical specification of Equation (1) and including the lagged, present, and future values of the first difference of the non-stationary explanatory variables as suggested by the DOLS method.
In Table 1 we present the estimated long-run semi-elasticities of the tax bases with respect to the three tax rates. The coefficient estimates for tax rates and the other explanatory variables are not reported for the sake of brevity. Note also that the responsiveness of each of the three tax bases is estimated separately for all provinces.38 The reported standard errors are heteroskedasticity and autocorrelation robust. We discuss the regression results for the three tax bases separately below.
38 The detailed province-by-province regression results are available from the authors upon request.

10
3.1. Corporate income tax
Column (1) shows the long-run own semi-elasticity for the corporate-income-tax base, while the cross effects of personal income and sales-tax rates on the corporate-income-tax base are shown in columns (2) and (3), respectively. Note also that the CIT-base regressions, in addition to the three tax rates, include lagged, present and future values of the change in the tax rates, and other control variables that are deemed to have an influence on corporate-income-tax bases. As explained before, these additional explanatory variables control for such factors as external economic shocks, horizontal tax competition, vertical tax competition and other province-specific corporate-income-tax-base shocks. Whenever necessary, we try using dummy variables to account for provincial corporate-income-tax-base shocks, which commonly manifest themselves in the form of sharp falls or jumps in the tax base. However, the coefficients of these variables are not reported in Table 1 for the sake of brevity.
As explained before, we expect an increase in the corporate-income-tax rate to have a negative effect on the corporate-income-tax base due to possible tax-avoidance and evasion activities associated with higher corporate income tax. That is, we expect the long-run own semi-elasticity coefficients to be negative. As column (1) shows, for all provinces, we find a statistically significant negative own semi-elasticity estimate for the corporate-income-tax base. The numerical magnitudes of the coefficient estimates vary across provinces. The own semi-elasticity estimates range from about –6.08 for Quebec to –17.56 for New Brunswick.
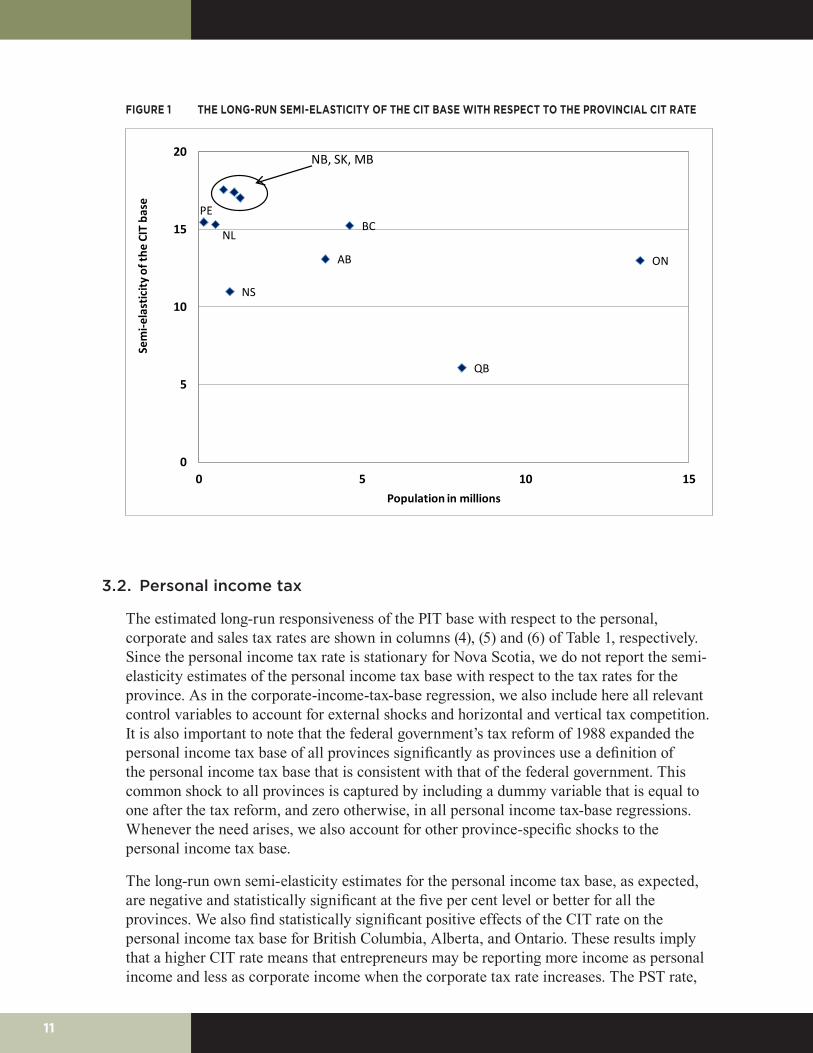
In Figure 1, we plot the (absolute value of) the semi-elasticities of the CIT base with respect to the provinces’ own CIT rate versus the provinces’ population. The figure indicates that the CIT base is generally more tax sensitive in the smaller provinces than in the larger provinces, which is an implication of some models of tax competition such as Kanbur and Keen.39 An exceptionally low semi-elasticity was estimated for Quebec, where a one-percentage-point increase in that province’s CIT rate is associated with a 6.1 per cent reduction in its corporate-income-tax base in the long run, which is 53 per cent lower than the semi-elasticity in Ontario, the largest province. Quebec’s unique cultural and linguistic characteristics, and perhaps some of the province’s regulatory policies, may make corporate capital investment less sensitive to the tax policy than in other provinces. In addition, until very recently, Quebec had, by far, the lowest corporate-income-tax rate in the country and this may partly explain the low tax-base sensitivity that we find in this paper. Finally, note that, although we expect other tax rates to have an effect on the corporate-income-tax base, we do not find strong statistically significant cross effects of PIT rate and PST rate on the corporate-income-tax base. Our previous study40 also reported similar qualitative results.
39 Kanbur and Keen, “Jeux Sans.”40 Dahlby and Ferede, “The effects.”
11
FIGURE 1 THE LONG-RUN SEMI-ELASTICITY OF THE CIT BASE WITH RESPECT TO THE PROVINCIAL CIT RATE
NL
PE
NS
QB
ONAB
BC
0
5
10
15
20
0 5 10 15
Sem
i-ela
stic
ity o
f the
CIT
bas
e
Population in millions
NB, SK, MB
3.2. Personal income tax
The estimated long-run responsiveness of the PIT base with respect to the personal, corporate and sales tax rates are shown in columns (4), (5) and (6) of Table 1, respectively. Since the personal income tax rate is stationary for Nova Scotia, we do not report the semi-elasticity estimates of the personal income tax base with respect to the tax rates for the province. As in the corporate-income-tax-base regression, we also include here all relevant control variables to account for external shocks and horizontal and vertical tax competition. It is also important to note that the federal government’s tax reform of 1988 expanded the personal income tax base of all provinces significantly as provinces use a definition of the personal income tax base that is consistent with that of the federal government. This common shock to all provinces is captured by including a dummy variable that is equal to one after the tax reform, and zero otherwise, in all personal income tax-base regressions. Whenever the need arises, we also account for other province-specific shocks to the personal income tax base.
The long-run own semi-elasticity estimates for the personal income tax base, as expected, are negative and statistically significant at the five per cent level or better for all the provinces. We also find statistically significant positive effects of the CIT rate on the personal income tax base for British Columbia, Alberta, and Ontario. These results imply that a higher CIT rate means that entrepreneurs may be reporting more income as personal income and less as corporate income when the corporate tax rate increases. The PST rate,
12
on the other hand, seems to have no statistically significant effects on the personal income tax base. The own semi-elasticity estimate for the personal income tax base ranges from about –2.62 for Quebec to –4.42 for British Columbia. The low responsiveness of the Quebec PIT base with respect to the province’s PIT rate may reflect the unique linguistic and cultural characteristics, which may make the PIT base less responsive because of lower population mobility than in other provinces. It may also help to explain why Quebec has been able to maintain very high personal income tax rate in the Canadian and North American context. 41 See for example Finnie42 and Saez and Veall.43
3.3. General sales tax
The sales-tax-base regression results are reported in columns (7) through (9) in Table 1 above. Since we find that sales tax rates are stationary for British Columbia and Ontario, we do not present sales-tax-base semi-elasticity estimates with respect to the sales tax rate for these provinces. This is because co-integration, or long-term relationship, is infeasible if the explanatory variable is stationary. Finally, Alberta does not impose a sales tax and as such there is no sales-tax-base regression for the province.
The estimated long-run sales-tax-base own semi-elasticity estimates are shown in column (9) of Table 1. As expected, the own semi-elasticity estimates are negative and statistically significant at the five per cent level or better for all the provinces. The coefficient estimates range from about –3.65 for Manitoba to –5.90 for Prince Edward Island. We also find a very high coefficient estimate for Saskatchewan. One may be surprised by the high responsiveness of Saskatchewan’s sales tax base with respect to the sales tax rate given that the province has had the lowest sales tax rate in the federation during the period under consideration. But the high sensitivity of the sales tax base in Saskatchewan might be explained by the absence of a general sales tax in the neighbouring province of Alberta.
One may expect a higher personal income tax rate that reduces the after-tax income of individuals to have a negative effect on the sales tax base. Contrary to our expectation, the personal income tax rate is not statistically significant in the sales-tax-base regression for any of the provinces. Similarly, we do not find a statistically significant effect of corporate-income-tax rate on the sales tax base. The only exception is for Manitoba where we find the unexpected positive effect of the CIT rate on the sales tax base. Again, these qualitative results are generally consistent with those reported in our 2012 study.44
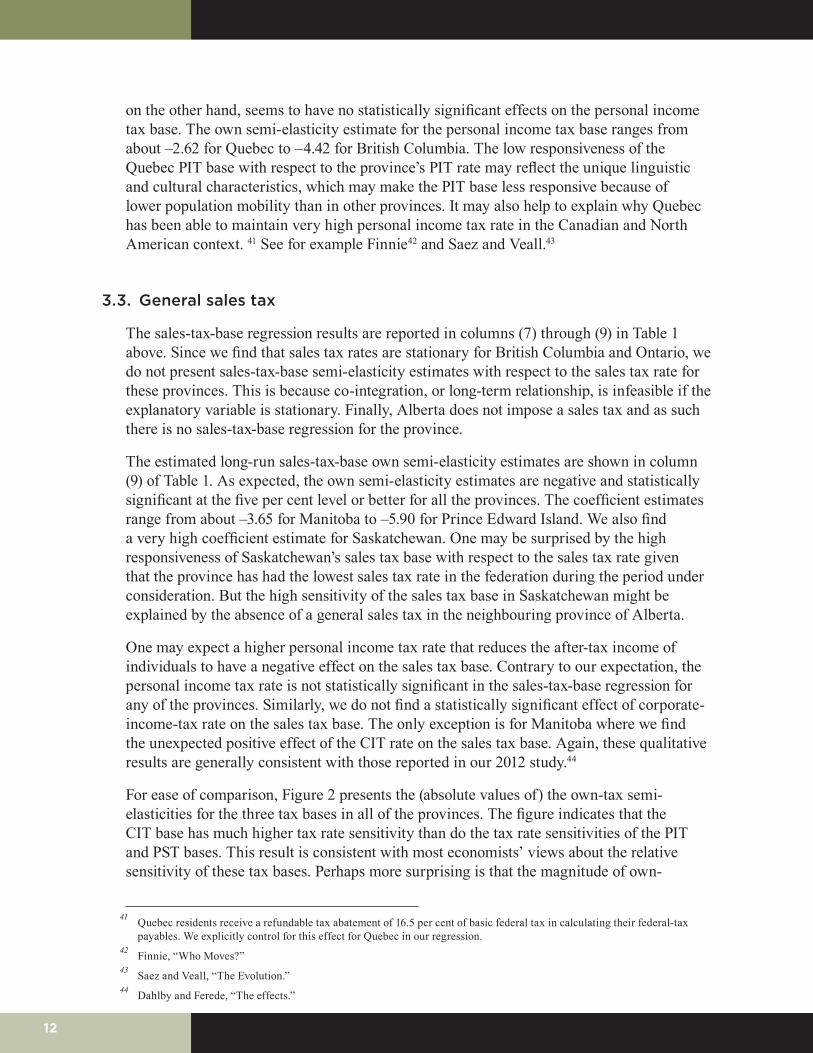
For ease of comparison, Figure 2 presents the (absolute values of) the own-tax semi-elasticities for the three tax bases in all of the provinces. The figure indicates that the CIT base has much higher tax rate sensitivity than do the tax rate sensitivities of the PIT and PST bases. This result is consistent with most economists’ views about the relative sensitivity of these tax bases. Perhaps more surprising is that the magnitude of own-
41 Quebec residents receive a refundable tax abatement of 16.5 per cent of basic federal tax in calculating their federal-tax payables. We explicitly control for this effect for Quebec in our regression.
42 Finnie, “Who Moves?”43 Saez and Veall, “The Evolution.”44 Dahlby and Ferede, “The effects.”
13
tax semi-elasticities of the PST and PIT do not exhibit significant differences in many provinces. Results in our previous study,45 on the other hand, indicated that the PST base was less sensitive to tax rate changes than is the PIT base.
FIGURE 2 THE SEMI-ELASTICITIES OF THE TAX BASES WITH RESPECT TO THEIR OWN TAX RATES
0
5
10
15
20
NL PE NS NB QB ON MB SK AB BC
CIT PIT PST
4. COMPUTING THE MARGINAL COST OF PUBLIC FUNDS
4.1. Analytical framework
As indicated previously, our main objective is to compute MCF for the CIT, PIT, and PST using the province-specific tax-base-elasticity estimates. The analytical framework for the MCF computations is the same as that used in our 2012 study.46 In this section, we describe the computation of the MCF using estimates of tax-base semi-elasticities as presented in Table 1. As indicated below, in addition to tax-base semi-elasticity estimates, we need information on provincial governments’ tax rates and the tax bases’ shares of tax revenues to estimate the MCF.
Suppose we denote tax base j by Bj . We assume that the tax base depends on the three tax rates: corporate, personal, and sales. The tax-base function can formally be specified as:
,,, spcjj BB (2)
45 ibid.46 ibid.

14
where j = c, p, s denotes the corporate-income-tax (c), personal income tax (p), and sales-tax (s) bases, respectively. For the different tax-revenue sources, a government’s tax revenue depends on the tax base and its respective tax rates. Thus, the total tax revenue (TR) from the three tax-revenue categories under consideration will be simply the sum of the product of each tax base with its respective tax rate. That is, a government’s total tax revenue from the three tax bases is given by:
.j
jj BTR (3)
As we have indicated before, a tax base depends on all the three tax rates. Thus, a change in a particular tax rate can affect the total tax revenue of the government directly, through the tax base related to the particular tax rate, and indirectly, through the other tax bases. Thus, the total effect of a change in any particular tax rate on the total provincial tax revenue is given by:
, j j
jijii
jji
i
RBddB
BddTR
(4)
where Rj = τjBj is the revenue raised from tax base j and ijji dBd /)ln( is the semi-elasticity of tax base j with respect to tax rate i.
It is well-known that an increase in a tax rate may induce tax-avoidance and tax-evasion activities, ultimately reducing the tax base associated with the particular tax rate. Thus we expect the own-base semi-elasticity, εjj, to be negative. However, the sign of the cross-base semi-elasticity, εji, cannot be determined a priori. If an increase in the tax rate associated with tax base i causes taxpayers to shift their activities to tax base j to avoid the tax rate increase on tax base i, we expect the sign of the cross-base elasticity to be positive. On the other hand, if the two tax bases are complementary, an increase in a tax rate can reduce both tax bases and the cross-base semi-elasticity would be negative. The responsiveness of total tax revenue to changes in a particular tax rate i can be computed as:
j
jijiii
ii ss
ddTR
TR
(5)
where TRRs ii / is the share of total tax revenue from tax base i and all the other variables are as defined before. Equation (5) shows the elasticity of total tax revenue with respect to the tax rate on tax base i. Note that this tax-revenue-elasticity measure (ρi) depends on the own-base semi-elasticity associated with the tax rate and on the weighted average (weighted by tax-revenue shares) semi-elasticity of other tax bases with respect to that tax rate.
Our ultimate objective in this paper is to compute provincial MCF for the three major taxes. We discuss tax-base and tax-revenue elasticities because, as we show below, the tax-revenue-elasticity estimates are important ingredients in the computation of the MCF. As discussed in Dahlby47 in more detail, when governments raise their tax rates there are both direct and indirect costs to society. When a government increases a tax rate associated with a particular tax base, the direct cost to taxpayers is the additional revenue it generates.
47 Bev Dahlby, The Marginal Cost of Public Funds: Theory and Applications (Cambridge, Mass.: MIT Press, 2008).
15
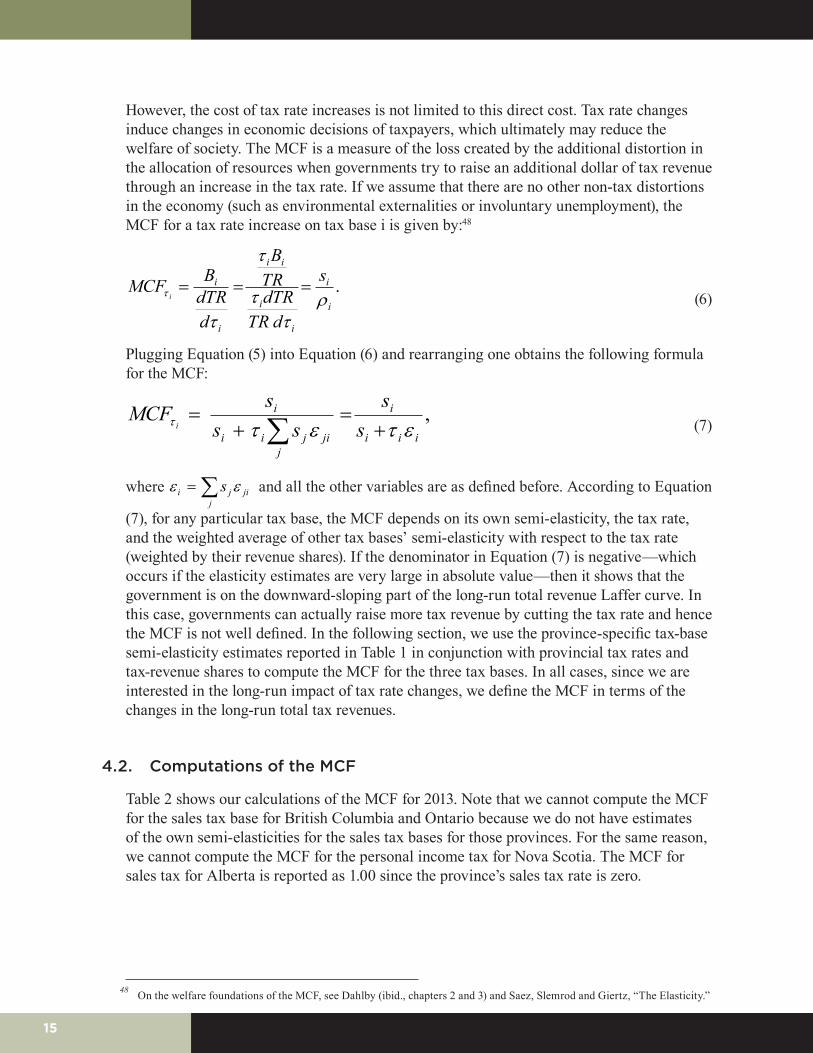
However, the cost of tax rate increases is not limited to this direct cost. Tax rate changes induce changes in economic decisions of taxpayers, which ultimately may reduce the welfare of society. The MCF is a measure of the loss created by the additional distortion in the allocation of resources when governments try to raise an additional dollar of tax revenue through an increase in the tax rate. If we assume that there are no other non-tax distortions in the economy (such as environmental externalities or involuntary unemployment), the MCF for a tax rate increase on tax base i is given by:48
.i
i
i
i
ii
i
i s
dTRdTRTR
B
ddTRBMCF
i
(6)
Plugging Equation (5) into Equation (6) and rearranging one obtains the following formula for the MCF:
,
iii
i
jjijii
i
ss
sssMCF
i
(7)
where j
jiji s and all the other variables are as defined before. According to Equation
(7), for any particular tax base, the MCF depends on its own semi-elasticity, the tax rate, and the weighted average of other tax bases’ semi-elasticity with respect to the tax rate (weighted by their revenue shares). If the denominator in Equation (7) is negative—which occurs if the elasticity estimates are very large in absolute value—then it shows that the government is on the downward-sloping part of the long-run total revenue Laffer curve. In this case, governments can actually raise more tax revenue by cutting the tax rate and hence the MCF is not well defined. In the following section, we use the province-specific tax-base semi-elasticity estimates reported in Table 1 in conjunction with provincial tax rates and tax-revenue shares to compute the MCF for the three tax bases. In all cases, since we are interested in the long-run impact of tax rate changes, we define the MCF in terms of the changes in the long-run total tax revenues.
4.2. Computations of the MCF
Table 2 shows our calculations of the MCF for 2013. Note that we cannot compute the MCF for the sales tax base for British Columbia and Ontario because we do not have estimates of the own semi-elasticities for the sales tax bases for those provinces. For the same reason, we cannot compute the MCF for the personal income tax for Nova Scotia. The MCF for sales tax for Alberta is reported as 1.00 since the province’s sales tax rate is zero.
48 On the welfare foundations of the MCF, see Dahlby (ibid., chapters 2 and 3) and Saez, Slemrod and Giertz, “The Elasticity.”

16
TABLE 2 THE MARGINAL COST OF PUBLIC FUNDS FOR THE PROVINCIAL GOVERNMENTS, 2013
Marginal Cost of Public Funds
(1) (2) (3)
Corporate Income Tax Personal Income Tax General Sales Tax
British Columbia 3.19 2.86 ---
Alberta 2.91 1.41 1.00
Saskatchewan *** 2.38 1.41
Manitoba 4. 70 2.42 1.34
Ontario 5.21 6.76 ---
Quebec 3.62 3.05 1.92
New Brunswick *** 1.91 1.42
Nova Scotia *** --- 1.62
Prince Edward Island *** 2.80 2.44
Newfoundland and Labrador *** 2.16 1.57
Note: *** indicates that a tax rate increase would reduce the long-run total tax revenues.
--- indicates that the MCF could not be computed because the own semi-elasticity could not be estimated.
The MCF for provincial corporate income tax in 2013 are reported in column (1) of Table 2.49 The MCF was not computed for Saskatchewan, New Brunswick, Nova Scotia, Prince Edward Island and Newfoundland and Labrador because the computations indicated that these provinces were on the downward-sloping sections of their long-run total revenue Laffer curves — i.e., a reduction in their CIT rates would increase their long-run total tax revenues. For the other provinces, the MCF for the CIT range from about 2.91 for Alberta to 5.21 for Ontario. The low MCF for Alberta is in marked contrast with the results in our 2012 study,50 a point that we will return to later. Column (2) of Table 2 show that the MCF for PIT ranges from 1.41 for Alberta to 6.76 for Ontario. The low MCF for Alberta may be explained by the fact that the province has had the lowest top personal income tax rate in the federation since 2001. For year 2013, Quebec has the second-highest MCF for PIT even though the estimated tax-base own semi-elasticity estimates are (in absolute value) the lowest in the country. This may be due to the fact that the province has the highest statutory top personal income tax rate in the country. Note also that, with the exception of Ontario, the CIT has the highest MCF and the PST has the lowest MCF. The reversal of ranking for Ontario may be partly explained due to the significant increase in the province’s statutory top personal income tax rate in the year. Our previous study also found similar results.51
The results of Table 2 provide MCF estimates only for one year and one may wonder how the computed MCF evolve over time. For three of the largest provinces in the federation— Alberta, Ontario and Quebec—we have computed the MCF for each year over the last three decades. The three provinces together accounted for about 75 per cent of the Canadian economy in 2013.
49 We compute and discuss provincial MCF estimates for year 2013, the last year for which we have complete data on tax rates and revenue shares. The computed MCF are based on the tax-base-elasticity estimates reported in Table 1 and the tax rates and revenue shares of year 2013. However, for comparison purposes, we also present the computed provincial MCF for year 2010, the last year of our sample period, in Appendix 5.
50 Dahlby and Ferede, “The effects.”51 ibid.

17
Figure 3 shows that the estimated MCF for the CIT for Alberta have fluctuated a greater deal over the last 30 years, while the MCF for PIT have declined with the reduction in the personal income tax rates in 2000, and then remained constant.
FIGURE 3 THE MCF FOR PERSONAL AND CORPORATE INCOME TAX, ALBERTA, 1984–2013
0.00
0.50
1.00
1.50
2.00
2.50
3.00
3.50
4.00
4.50
5.00
1984
1985
1986
1987
1988
1989
1990
1991
1992
1993
1994
1995
1996
1997
1998
1999
2000
2001
2002
2003
2004
2005
2006
2007
2008
2009
2010
2011
2012
2013
MCF
($)
MCF Estimates for Alberta, 1984–2013
PIT CIT
The primary reason for these fluctuations is that the corporate-income-tax base is very volatile, which affects its revenue share and the calculation of the MCF for the CIT.52 Note also that the MCF for PIT for the province was higher than the corresponding value for the CIT between 1989 and 2001. After the year 2001, the MCF of CIT has been continuously higher than the MCF for PIT. The reason for this reversal in ranking in the province’s MCF is due to the personal income tax reform in the province that lowered the statutory tax rate and instituted a flat income tax rate of 10 per cent.
One of the most significant differences between the estimates of the MCF in our 2012 study53 and the current calculations, which are based on the province-specific semi-elasticities, is that the MCF for the CIT in Alberta is now much lower. For example, our estimate of the MCF for the CIT for Alberta in 2006 was 30.60 in our 2012 paper, and it is now 2.91. The main reason for the reduction in the estimate of the MCF for the CIT is that we now have a much higher estimate of the effect of a CIT-rate increase on the PIT base—3.19 now versus 1.101 in our 2012 paper. Even though our estimate of the own tax semi-elasticity for the CIT base in Alberta is larger (in absolute value) — –13.10 versus –12.034 — the higher value for the cross-elasticity substantially reduces the MCF for the CIT in Alberta. Intuitively, the higher cross elasticity implies that an increase in the CIT rate, by increasing the PIT base, results in additional tax revenues from a CIT-rate increase
52 It should be indicated that, given the semi-elasticity estimates, changes in the MCF are due to changes in tax rates and/or tax-revenue shares. The contribution of the latter on the MCF is due to the nature of the functional form used in our empirical analysis.
53 Dahlby and Ferede, “The effects,” Table 6A.
18
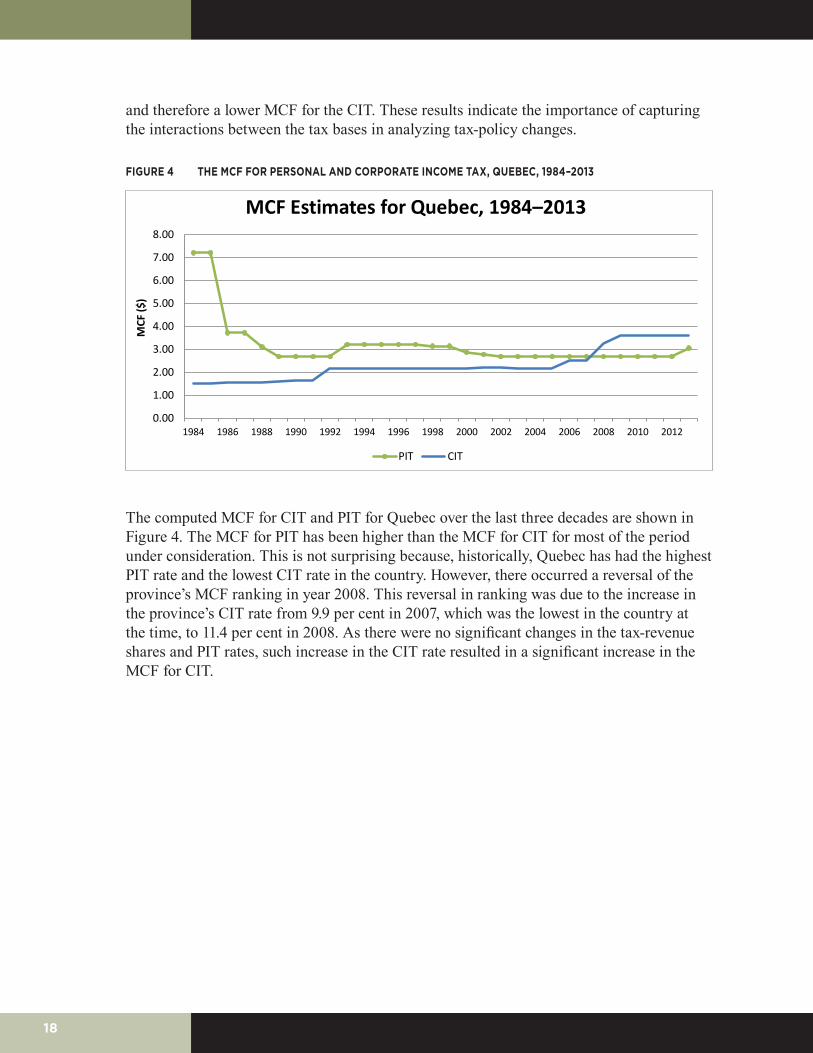
and therefore a lower MCF for the CIT. These results indicate the importance of capturing the interactions between the tax bases in analyzing tax-policy changes.
FIGURE 4 THE MCF FOR PERSONAL AND CORPORATE INCOME TAX, QUEBEC, 1984–2013
0.00
1.00
2.00
3.00
4.00
5.00
6.00
7.00
8.00
1984 1986 1988 1990 1992 1994 1996 1998 2000 2002 2004 2006 2008 2010 2012
MCF
($)
MCF Estimates for Quebec, 1984–2013
PIT CIT
The computed MCF for CIT and PIT for Quebec over the last three decades are shown in Figure 4. The MCF for PIT has been higher than the MCF for CIT for most of the period under consideration. This is not surprising because, historically, Quebec has had the highest PIT rate and the lowest CIT rate in the country. However, there occurred a reversal of the province’s MCF ranking in year 2008. This reversal in ranking was due to the increase in the province’s CIT rate from 9.9 per cent in 2007, which was the lowest in the country at the time, to 11.4 per cent in 2008. As there were no significant changes in the tax-revenue shares and PIT rates, such increase in the CIT rate resulted in a significant increase in the MCF for CIT.

19
FIGURE 5 THE MCF FOR PERSONAL AND CORPORATE INCOME TAX, ONTARIO, 1984–2013
0.00
5.00
10.00
15.00
20.00
25.00
1984
1985
1986
1987
1988
1989
1990
1991
1992
1993
1994
1995
1996
1997
1998
1999
2000
2001
2002
2003
2004
2005
2006
2007
2008
2009
2010
2011
2012
2013
MCF
($)
MCF Estimates for Ontario, 1984–2013
PIT CIT
Ontario is the largest province in the country. It accounts for about 37 per cent of Canada’s GDP and 39 per cent of the total Canadian population in 2013. So it is important to look at how the social cost of raising tax revenues has evolved over time in this province. Figure 5 above presents the MCF for PIT and MCF for CIT for the province for the last three decades. Both MCF estimates show a great deal of variation during the period. And, as is the case in other provinces, the MCF for the CIT shows more fluctuations than the MCF for PIT. The MCF exhibits significant swings over time mainly due to changes in the provincial CIT revenue shares. The MCF for CIT was relatively low prior to 1998, then it spiked to over 20 in 2000, and then declined to 3.71 in 2003. From 2004 to 2010, it ranged between 5.28 and 10.91. In 2011, the province cut its CIT rate from 14 per cent to 11.5 per cent. This reduction in the CIT rate reduced the province’s MCF for CIT to 3.39, below the MCF for PIT. In addition, in the following two years, the province raised the PIT rate, which resulted in a further increase in the MCF for PIT above the MCF for CIT. Thus, the exception in the provincial ranking of MCF for Ontario that we indicated in Table 2 is a recent phenomenon caused by the recent PIT-rate increase.
5. CONCLUSIONS
The revenue and economic effects of tax-policy reforms crucially depend on the responsiveness of tax bases to tax rate changes. A higher tax-base-elasticity estimate implies that tax rate changes will have significant effects on the tax base, implying a greater distortion in the allocation of resources in the economy and ultimately a higher efficiency cost from tax rate increases. Consequently, tax-base-elasticity estimates are key parameters in many tax-policy analyses and discussions. While a number of previous studies investigate the responsiveness of taxable income to tax rate changes based on individual tax-returns data, there is generally a paucity of empirical studies that provide empirical
20
estimates of these important variables for corporate income tax or a general sales tax. Due to the nature of their investigations, previous studies also largely ignore the possible interaction of the various tax rates. Further, there are only very limited studies that focus on the estimation of tax-base-elasticity estimates for Canada.
In this paper, we estimate the long-run responsiveness of Canadian provincial tax bases to tax rate changes by explicitly controlling for the possible interactions between tax rates. While our previous paper54 provides tax-base-elasticity estimates that are the same for all provinces, one would expect tax-base-elasticity estimates to differ across provinces due to various province-specific characteristics that change over time. We use annual time-series data from Canadian provinces over the period 1972–2010 and focus on the three major tax rates: corporate income, personal income and sales tax. Such an empirical methodology enables us to provide province-specific long-run tax-base-elasticity estimates associated with the three major taxes imposed by the Canadian provinces. Our results indicate that the corporate-income-tax base generally is the most responsive to tax rate changes. The estimated corporate-income-tax-base own semi-elasticity estimates range from –6.08 for Quebec to –17.56 for New Brunswick. The own semi-elasticity estimate for the personal income tax base also varies from –2.62 for Quebec to –4.42 for British Columbia. Our econometric results also indicate that small provinces have more tax-sensitive corporate-income-tax bases. The exception is Quebec where the tax responsiveness of both the corporate- and personal income tax bases are relatively low, perhaps because of its unique Francophone culture and historically low corporate-income-tax environment. Due to the nature of data, we could only obtain general-sales-tax-base own semi-elasticity estimates for seven provinces, and those range from about –3.65 for Manitoba to –5.90 for Prince Edward Island.
We also use the province-specific long-run tax-base semi-elasticity estimates along with provincial tax rates and tax-revenue shares to compute the MCF for the three taxes for all provinces. The results suggest that there has been a significant variation in the MCF during the period under investigation due to changes in tax rates and tax-revenue shares. We find that corporate and personal income taxes have higher MCF than does sales tax. Our results also indicate that, in 2013, the MCF for corporate income tax was the highest and the MCF for sales tax was the lowest for all provinces except Ontario. For Ontario, MCF for personal income tax was higher than MCF for corporate income tax. The MCF estimates for corporate income tax range from 2.91 for Alberta to 5.21 for Ontario in 2013.
An important policy implication of our findings is that raising tax revenue with corporate-income-tax rate increases by provincial governments has the highest economic cost to society. In fact, the results suggest that there would have been welfare gains in 2013 from a reduction in the CIT rate with a revenue-neutral switch to higher sales tax rates in British Columbia, Alberta, Manitoba, Ontario and Quebec. A CIT-rate reduction would have increased tax revenue in the Atlantic provinces and Saskatchewan and, as a result, would not have required a compensating increase in sales tax rates.
54 Dahlby and Ferede, “The effects.”

21
Our results also have important implications for tax-policy analysis in other federations. As tax-base responsiveness to tax rate changes seem to vary across subnational governments, one should be cautious when relying on unique elasticity estimates that are common for all jurisdictions in the federation in tax-policy discussions.
It is important to indicate some of the limitations of our study. First, while tax-policy discussions and debates usually focus on the long-run effects of tax rate changes, policy-makers with a short time-planning horizon may be interested in the short-run responses of tax bases and tax revenue to changes in tax rates. However, we do not provide short-run tax-base elasticity and MCF estimates in this paper. Further, our computation of long-run MCF and attempts to measure the social cost of tax rate increases ignores the possible distributional effects of tax rate changes. Although we explicitly account for possible horizontal and vertical tax competition, our analysis assumes that the burden of any tax rate increase will be entirely borne by residents in the province. The above issues are beyond the scope of the study and are important limitations that can be addressed in future research to enrich tax-policy discussions in Canada.

22
APPENDIX 1: PROFILE OF CANADIAN PROVINCES, 1972–2010
NL PEI NS NB QC ON MB SK AB BC
Average real tax base per capita
(2002 Canadian dollars)
Corporate income tax
1,451 1,552 1,725 1,671 3,055 3,777 2,117 2,289 5,393 2,665
Personal income tax
9,494 10,789 12,133 11,062 13,145 16,307 12,535 11,498 15,556 15,542
Sales taxa 8,125 8,733 9,449 9,016 9,536 10,879 9,113 9,391 13,598 11,537
Average tax-revenue shares, 1972–2010
(%)
Corporate income tax
9.69 7.69 8.88 8.80 8.48 15.02 10.25 13.34 30.62 12.47
Personal income tax
43.81 46.61 52.71 49.30 65.12 51.40 55.91 56.75 69.38 52.21
Sales tax 46.50 45.70 38.41 41.90 26.40 33.57 33.84 29.90 0.00 35.32
Provincial statutory CIT rate
(%)
1972 13.00 10.00 10.00 10.00 12.00 12.00 13.00 12.00 11.00 13.00
2010 14.00 16.00 16.00 11.00 11.90 14.00 12.00 12.00 10.00 10.50
2013 14.00 16.00 16.00 10.00 11.90 11.50 12.00 12.00 10.00 10.00
1972–2010 14.71 13.44 14.62 14.10 9.30 14.24 15.51 15.03 12.55 14.58
Provincial statutory top marginal PIT rate
(%)b
1972 16.92 16.92 18.10 19.51 28.00 14.03 19.98 18.80 16.92 14.34
2010 15.50 18.37 19.25 14.30 24.00 17.41 17.40 15.00 10.00 14.70
2013 13.30 18.37 21.00 16.07 25.75 20.53 17.40 15.00 10.00 14.70
1972–2010 20.00 18.64 19.30 19.21 27.17 17.68 18.83 18.32 13.59 17.41
Provincial general-sales-tax rate
(%)
1972 7.00 8.00 7.00 8.00 8.00 5.00 5.00 5.00 0.00 5.00
2010 8.00 10.50 8.00 8.00 7.88 8.00 7.00 5.00 0.00 7.00
2013 8.00 10.00 10.00 8.00 9.98 8.00 7.00 5.00 0.00 7.00
1972–2010 10.00 9.90 8.82 9.09 8.08 7.49 6.36 6.15 0.00 6.40
Notes:a This is only for the period 1977–2010.b The PIT rates include applicable surtaxes; note that Quebec residents also receive a refundable tax abatement of 16.5 per
cent of basic federal tax, which reduces their federal tax liability.

23
APPENDIX 2: DEFINITIONS OF KEY VARIABLES AND DATA SOURCES
Variable Description Source
Corporate-income-tax base (CITbase) Business-tax base used in equalization-payment calculations
Finance Canada
Personal income tax base (PITbase) Personal taxable income Canada Revenue Agency, Income Statistics (formerly Tax Statistics on Individuals)
General-sales-tax base (PSTbase) Provincial general and miscellaneous sales tax base used in equalization-payment calculations
Finance Canada
Corporate marginal tax rate (CITprov) Provincial statutory top marginal corporate-income-tax rate (general rate)
Finances of the Nation (formerly National Finances)
Top personal marginal tax rate (PITprov) Provincial-income-tax rate of the top income bracket Finances of the Nation (formerly National Finances)
Sales tax rate (PSTprov) Provincial-sales-tax rate (PST) Finances of the Nation (formerly National Finances)
Federal CIT rate (CITfed) Federal government corporate-income-tax rate Finances of the Nation (formerly National Finances)
Federal PIT rate (PITfed) Federal government top personal income tax rate Finances of the Nation (formerly National Finances)
Population Total provincial population Statistics Canada, CANSIM table 051-0001
GDP deflator Gross domestic product, implicit price index (2002 = 100)
Statistics Canada, Provincial Economic Accounts
24
APPENDIX 3: DF-GLS UNIT-ROOT TESTS OF KEY VARIABLES IN LEVELS
Levels NL PE NS NB QC ON MB SK AB BC
Log of CITbase
-1.810 -3.978** -2.365 -4.368** -2.285 -2.610 -1.509 -2.688 -2.870 -2.860
Log of PITbase
-1.659 -1.677 -1.849 -1.837 -1.917 -2.018 -1.702 -1.545 -1.498 -1.966
Log of PSTbase
-2.602 -1.003 2.825 -1.903 -2.162 -2.118 -2.665 -2.185 -1.960 -2.255
CITprov -1.899 -1.959 -1.528 -2.111 -1.872 -1.267 -2.198 -0.868 -1.365 -1.736
PITprov -2.495 -2.735 -3.877** -2.188 -1.484 -1.933 -2.460 -2.583 -1.282 -1.627
PSTprov -1.494 -1.066 -1.756 -1.309 -1.793 -4.199** -1.875 -1.488 ----- -4.359**
CITfed -1.999 -1.999 -1.999 -1.999 -1.999 -1.999 -1.999 -1.999 -1.999 -1.999
PITfed -1.679 -1.679 -1.679 -1.679 -1.679 -1.679 -1.679 -1.679 -1.679 -1.679
Notes:
**denote statistical significance at the five per cent level or better and we reject the null hypothesis. The null hypothesis is that the variable is non-stationary or I (1). In each case, optimal lag length is chosen according to Ng criterion. For PE and NB, the unit-root tests show that the CIT base is stationary due to the presence of a structural break. Once the structural break is addressed (in parentheses), the variable is non-stationary. The GST variable seems to be stationary once structural break is taken into account and it is treated as such in our analysis.
25
APPENDIX 4: JOHANSEN CO-INTEGRATION TEST
(1) (2) (3)
Corporate Income Tax Personal Income Tax General Sales Tax
Trace statistic under Ho: r = 0
5% Critical value
Trace statistic under Ho: r = 0
5% Critical value
Trace statistic under Ho: r = 0
5% Critical value
British Columbia 293.3** 192.9 533.2** 277.7 --- ---
Alberta 267.0** 192.9 376.1** 192.9 --- ---
Saskatchewan 230.1** 156.0 269.4** 156.0 854.0** 277.7
Manitoba 249.7** 156.0 472.5** 277.7 508.4** 233.1
Ontario 274.0** 156.0 633.1** 277.7 --- ---
Quebec 326.2** 192.9 254.9** 192.9 464.8** 192.9
New Brunswick 288.1** 192.9 451.7** 233.1 272.5** 192.9
Nova Scotia 345.9** 192.9 --- ---- 413.7** 192.9
Prince Edward Island 266.5** 233.1 478.0** 233.1 594.8** 192.9
Newfoundland and Labrador 550.0** 233.1 333.3** 233.1 329.1** 192.9
Notes:
We report the Johansen trace statistic for the null hypothesis (Ho) of no-co-integration and the associated five per cent critical values. We use two lags for the co-integration tests. ** denotes that the hypothesis of no-co-integration is rejected at the five per cent significance level.

26
APPENDIX 5: THE MARGINAL COST OF PUBLIC FUNDS FOR THE PROVINCIAL GOVERNMENTS, 2010
Marginal Cost of Public Funds
(1) (2) (3)
Corporate Income Tax Personal Income Tax General Sales Tax
British Columbia 3.37 2.86 ---
Alberta 3.02 1.41 1.00
Saskatchewan *** 2.38 1.40
Manitoba 3.40 2.42 1.34
Ontario 5.47 3.60 ---
Quebec 3.62 2.68 1.61
New Brunswick *** 1.73 1.42
Nova Scotia *** --- 1.44
Prince Edward Island *** 2.80 2.63
Newfoundland and Labrador *** 2.66 1.50
Notes:
*** indicates that a tax rate increase would reduce the long-run total tax revenues.
--- indicates that the MCF could not be computed because the own semi-elasticity could not be estimated.

27
About the Authors
Ergete Ferede is currently an associate professor of Economics at Grant MacEwan University and Fellow of the Institute of Public Economics at the University of Alberta. His BA and MSc are from Addis Ababa University in Ethiopia and his PhD is from the University of Alberta in 2005. His main research areas are public finance and economic growth. His research has been published in the National Tax Journal, International Tax and Public Finance, Small Business Economics, etc. He previously taught a wide range of courses at Addis Ababa University, the University of Alberta and the University of Windsor. He was a winner of the University of Windsor Teaching Score Award for the academic year 2005/6.
Bev Dahlby, Distinguished Fellow at The School of Public Policy, University of Calgary, attended St. Peter’s College, the University of Saskatchewan, Queen’s University and the London School of Economics. Dr. Dahlby has published extensively on tax policy and fiscal federalism.
He has served as a policy advisor to the federal and provincial governments. His international experience includes advisory work on tax reform for the IMF in Malawi, for the Thailand Development Research Institute, and for the World Bank in Brazil and Mexico. He was a member of the Jenkins Panel on federal support to research and development, a research fellow at the C.D. Howe Institute, and currently serves on Canada’s Ecofiscal Commission.

28
ABOUT THE SCHOOL OF PUBLIC POLICY
The School of Public Policy will become the flagship school of its kind in Canada by providing a practical, global and focused perspective on public policy analysis and practice in areas of energy and environmental policy, international policy and economic and social policy that is unique in Canada.
The mission of The School of Public Policy is to strengthen Canada’s public service, institutions and economic performance for the betterment of our families, communities and country. We do this by:
• Building capacity in Government through the formal training of public servants in degree and non-degree programs, giving the people charged with making public policy work for Canada the hands-on expertise to represent our vital interests both here and abroad;
• Improving Public Policy Discourse outside Government through executive and strategic assessment programs, building a stronger understanding of what makes public policy work for those outside of the public sector and helps everyday Canadians make informed decisions on the politics that will shape their futures;
• Providing a Global Perspective on Public Policy Research through international collaborations, education, and community outreach programs, bringing global best practices to bear on Canadian public policy, resulting in decisions that benefit all people for the long term, not a few people for the short term.
Our research is conducted to the highest standards of scholarship and objectivity. The decision to pursue research is made by a Research Committee chaired by the Research Director and made up of Area and Program Directors. All research is subject to blind peer-review and the final decision whether or not to publish is made by an independent Director.
The School of Public PolicyUniversity of Calgary, Downtown Campus906 8th Avenue S.W., 5th FloorCalgary, Alberta T2P 1H9Phone: 403 210 3802
DISTRIBUTIONOur publications are available online at www.policyschool.ca.
DISCLAIMERThe opinions expressed in these publications are the authors' alone and therefore do not necessarily reflect the opinions of the supporters, staff, or boards of The School of Public Policy.
COPYRIGHTCopyright © 2016 by The School of Public Policy. All rights reserved. No part of this publication may be reproduced in any manner whatsoever without written permission except in the case of brief passages quoted in critical articles and reviews.
ISSN1919-112x SPP Research Papers (Print) 1919-1138 SPP Research Papers (Online)
DATE OF ISSUEMarch 2016
MEDIA INQUIRIES AND INFORMATIONFor media inquiries, please contact Morten Paulsen at 403-220-2540. Our web site, www.policyschool.ca, contains more information about The School's events, publications, and staff.
DEVELOPMENTFor information about contributing to The School of Public Policy, please contact Rachael Lehr by telephone at 403-210-7183 or by e-mail at [email protected].

29
RECENT PUBLICATIONS BY THE SCHOOL OF PUBLIC POLICY
INTO THE MIRE: A CLOSER LOOK AT FOSSIL FUEL SUBSIDIEShttp://policyschool.ucalgary.ca/?q=content/mire-closer-look-fossil-fuel-subsidiesRadoslaw Stefanski | March 2016
THE ISSUE OF SOCIAL LICENCE AND ENERGY UTILITY PLANNING AND INVESTMENThttp://policyschool.ucalgary.ca/?q=content/issue-social-licence-and-energy-utility-planning-and-investmentMichal C. Moore | March 2016
IS SOCIAL LICENCE A LICENCE TO STALL?http://policyschool.ucalgary.ca/?q=content/social-licence-licence-stallMark Lowey | March 2016
A FISCAL FRAMEWORK FOR OFFSHORE OIL AND GAS ACTIVITIES IN ROMANIAhttp://policyschool.ucalgary.ca/?q=content/fiscal-framework-offshore-oil-and-gas-activities-romaniaDaria Crisan | March 2016
LIFTING THE HOOD ON ALBERTA’S ROYALTY REVIEWhttp://policyschool.ucalgary.ca/?q=content/lifting-hood-alberta%E2%80%99s-royalty-reviewBlake Shaffer | February 2016
UNDERSTANDING THE NEW PUBLIC OUTLOOK ON THE ECONOMY AND MIDDLE-CLASS DECLINE: HOW FDI ATTITUDES ARE CAUGHT IN A TENTATIVE CLOSING OF THE CANADIAN MINDhttp://policyschool.ucalgary.ca/?q=content/understanding-new-public-outlook-economy-and-middle-class-decline-how-fdi-attitudes-are-caugFrank Graves | February 2016
GIVE CANADA POST A BREAK: ALLOWING MORE PRICING FLEXIBILITY AND COMPETITION COULD HELP THE CORPORATION SUCCEEDhttp://policyschool.ucalgary.ca/?q=content/give-canada-post-break-allowing-more-pricing-flexibility-and-competition-could-help-corporatPhilippe De Donder | February 2016
RATES OF RETURN ON FLOW-THROUGH SHARES: INVESTORS AND GOVERNMENTS BEWAREhttp://policyschool.ucalgary.ca/?q=content/rates-return-flow-through-shares-investors-and-governments-bewareVijay Jog | February 2016
THE FALSE PANACEA OF CITY CHARTERS? A POLITICAL PERSPECTIVE ON THE CASE OF TORONTOhttp://policyschool.ucalgary.ca/?q=content/false-panacea-city-charters-political-perspective-case-toronto-0Andrew Sancton | January 2016
IS ‘CHARTER-CITY STATUS’ A SOLUTION FOR FINANCING CITY SERVICES IN CANADA — OR IS THAT A MYTH?http://policyschool.ucalgary.ca/?q=content/%E2%80%98charter-city-status%E2%80%99-solution-financing-city-services-canada-%E2%80%94-or-myth-0Harry Kitchen | January 2016
LAYING THE FOUNDATION FOR POLICY: MEASURING LOCAL PREVALENCE FOR AUTISM SPECTRUM DISORDERhttp://policyschool.ucalgary.ca/?q=content/laying-foundation-policy-measuring-local-prevalence-autism-spectrum-disorder-0Carolyn Dudley and Jennifer D. Zwicker | January 2016
WHAT DO WE KNOW ABOUT IMPROVING EMPLOYMENT OUTCOMES FOR INDIVIDUALS WITH AUTISM SPECTRUM DISORDER?http://policyschool.ucalgary.ca/?q=content/what-do-we-know-about-improving-employment-outcomes-individuals-autism-spectrum-disorder-0Carolyn Dudley and Jennifer D. Zwicker | January 2016
Related Documents