THE COST OF MAJOR AMPUTATION Mary L. Yost, M.B.A. President THE SAGE GROUP LLC Research and Consulting

Welcome message from author
This document is posted to help you gain knowledge. Please leave a comment to let me know what you think about it! Share it to your friends and learn new things together.
Transcript

THE COST OF MAJOR AMPUTATION
Mary L. Yost, M.B.A. President
THE SAGE GROUP LLC Research and Consulting
DISCLOSURES
THE SAGE GROUP LLC is a for-profit research and consulting
company specializing in vascular disease in the lower limbs including Peripheral Artery Disease (PAD), Intermittent
Claudication (IC), Critical Limb Ischemia (CLI) Acute Limb Ischemia (ALI) and Diabetic Foot Ulcer (DFU) & Amputation.
CLIENTS
Aastrom Biosciences
Abbott Vascular
ActivBiotics
Advanced Biohealing
AngioScore
ANS (St. Jude Medical)
AtheroMed Inc.
Bain & Company
Bard
Baxter
Bayer (Medrad)
BioMarin Pharmaceutical
Boston Scientific
Boston Scientific India
Chemo France
Cardiovascular Systems, Inc.
CoDa Therapeutics
Cordis (Johnson & Johnson)
Cook Medical
Diffusion Pharmaceuticals LLC
Diomed Inc.
Edwards Lifesciences
Ev3
FoxHollow Technologies
GlaxoSmithKline
Grifols SA
Harvest Technologies
IDev Technologies
Indigo Pharmaceuticals
Infocus Research
Intact Vascular
Jihad Mustapha MD
Joan Piesinger & Associates
Kerberos Proximal Solution
King Pharmaceuticals
Maxis
Medtronic
Merck Serono AG Mexico
Novadaq Technologies
Nuvelo Inc.
OmniSonics Medical
Pathway Medical Technologies
Pluristem Therapeutics
Possis Medical
Rapid Medical
Sanofi-Aventis
Schering-Plough Corp.
Shire Pharmaceuticals
Solvay Pharmaceuticals
Spectranetics Corporation
Stempeutics
Stereotaxis
Straub Medical AG
Terumo
The Medicines Company
ThermoGenesis Corp.
ThromboGenics NV
W. L. Gore

DISCLOSURES
Stock Ownership (January 31, 2015)
Abbott Laboratories, Inc.
AbbVie Inc.
Angiodynamics Inc.
Derma Sciences Inc.
CRITICAL LIMB ISCHEMIA
LIMB SALVAGE CAN:
REDUCE COSTS
FOR THE ECONOMY,
THE HOSPITAL,
& THE PATIENT

CLI PREVALENCE & COST 2015
2-3 Million
400,000-700,000 Treated w/
Revascularization or Amputation-Major & Minor
Cost $40-$66 Billion
Source: Yost. CLI Vol I, Nehler 2014, Baser, HCUP Queries, Barshes 2012, Mahoney 2010, Dillingham 2005 and THE SAGE GROUP estimates.

WHO PAYS THE CLI BILL?
Source: HCUP Query. Outcomes.
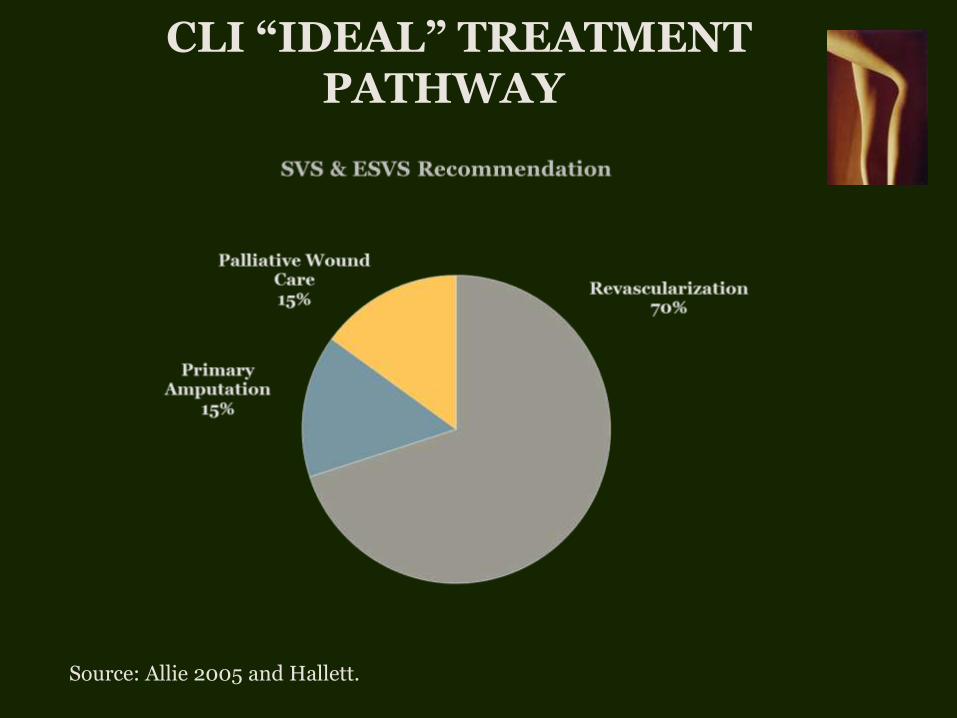
CLI “IDEAL” TREATMENT PATHWAY
Source: Allie 2005 and Hallett.

MAJOR AMPUTATION
25%-33% CLI patients undergo primary amputation (PA)
65,000-75,000 major amputations performed annually
Source: Yost. EVT 2014, Henry 2011 and Baser.
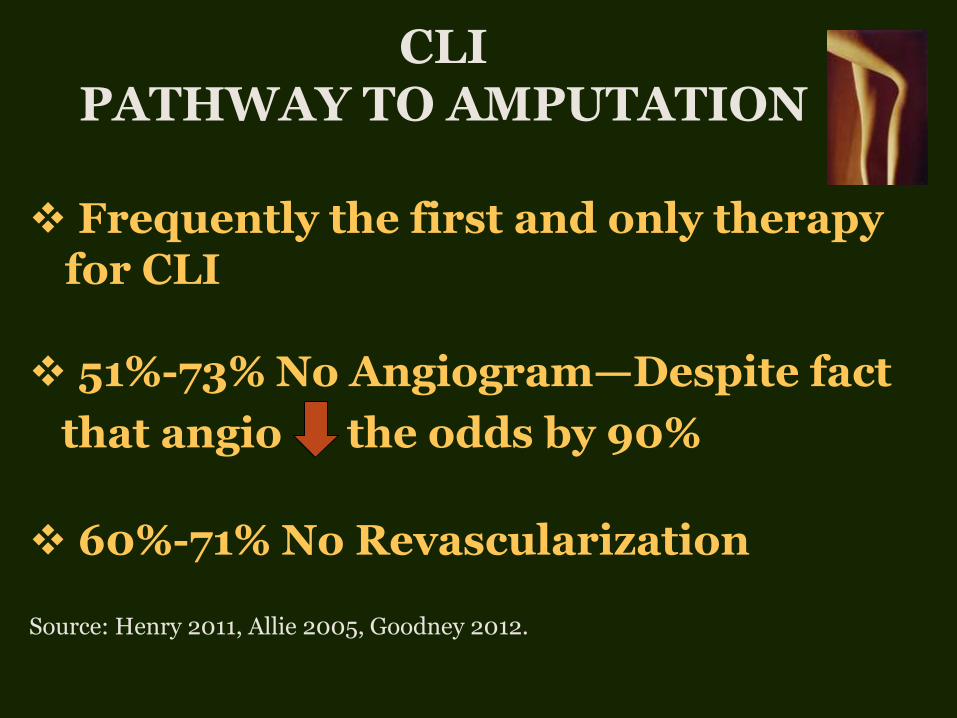
CLI PATHWAY TO AMPUTATION
Frequently the first and only therapy for CLI
51%-73% No Angiogram—Despite fact
that angio the odds by 90%
60%-71% No Revascularization
Source: Henry 2011, Allie 2005, Goodney 2012.

AMPUTATION LOTTERY
Probability of major amputation depends on who you are and where you live
Amputation varies by: race, sex, age, socioeconomic status, hospital volume, geographic location
Medicare & Medicaid-More likely than private, Medicaid most likely!
Source: Henry 2011, Baser, Goodney 2012, Jones, Margolis DJ 2011 & Eslami 2007.

MAJOR AMPUTATION ANNUAL ECONOMIC COST*
$11 BILLION
*Total Direct Inpatient and Outpatient Costs in 2014 $ Source: Dillingham 2005, Yost EVT 2014.

COST-EFFECTIVENESS ANALYSIS (CEA)
Model to Assess Value of a Treatment & Allocate Resources
Compares Costs & Outcomes of Therapies
Cost Perspective Macroeconomic, Hospital, Payer, Patient
Source: Barshes 2012, Hlatky and Weintraub.
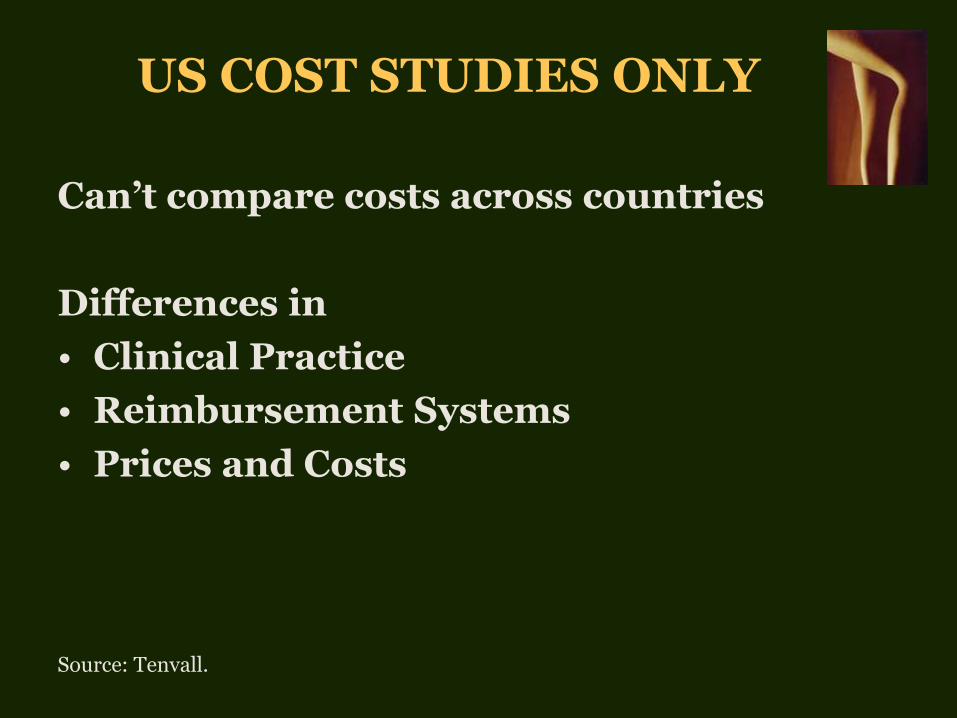
US COST STUDIES ONLY
Can’t compare costs across countries
Differences in
• Clinical Practice
• Reimbursement Systems
• Prices and Costs
Source: Tenvall.
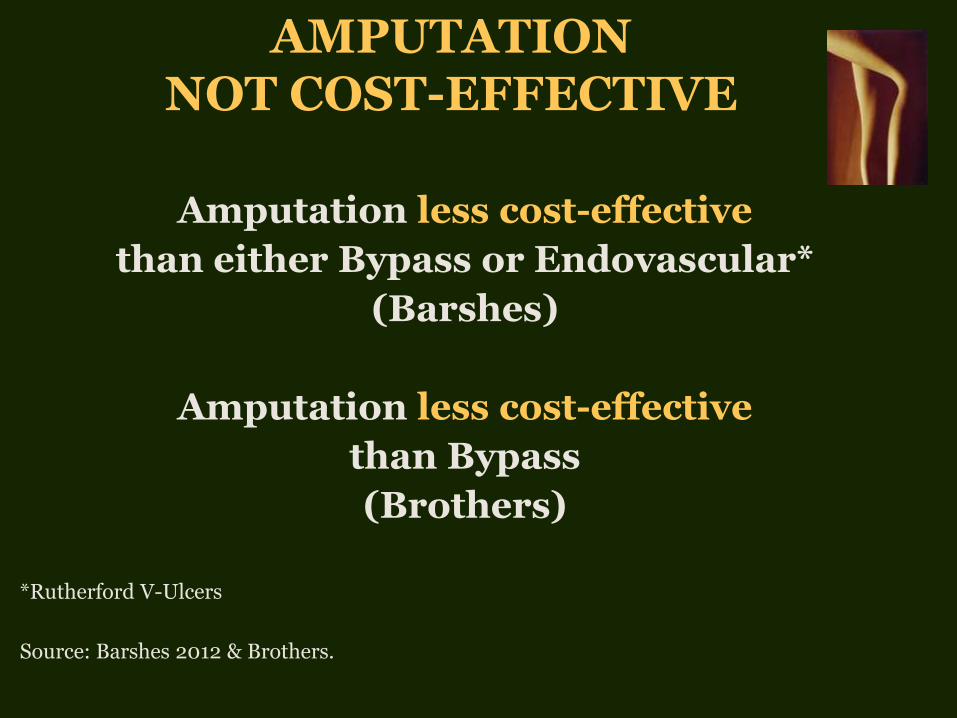
AMPUTATION NOT COST-EFFECTIVE
Amputation less cost-effective
than either Bypass or Endovascular*
(Barshes)
Amputation less cost-effective
than Bypass
(Brothers)
*Rutherford V-Ulcers
Source: Barshes 2012 & Brothers.

AMPUTATION NOT COST-EFFECTIVE
“MARGINAL” PATIENTS
Conventional Wisdom: Frail, Elderly Pts w Limited Mobility—Primary Amputation “Better”
Limb Salvage w/ Endovascular “Best Option”
PA: Lower Health Benefits & Higher Costs (Need for LT Nursing Home)
Source: Barshes. Ann Vasc Surg 2014.
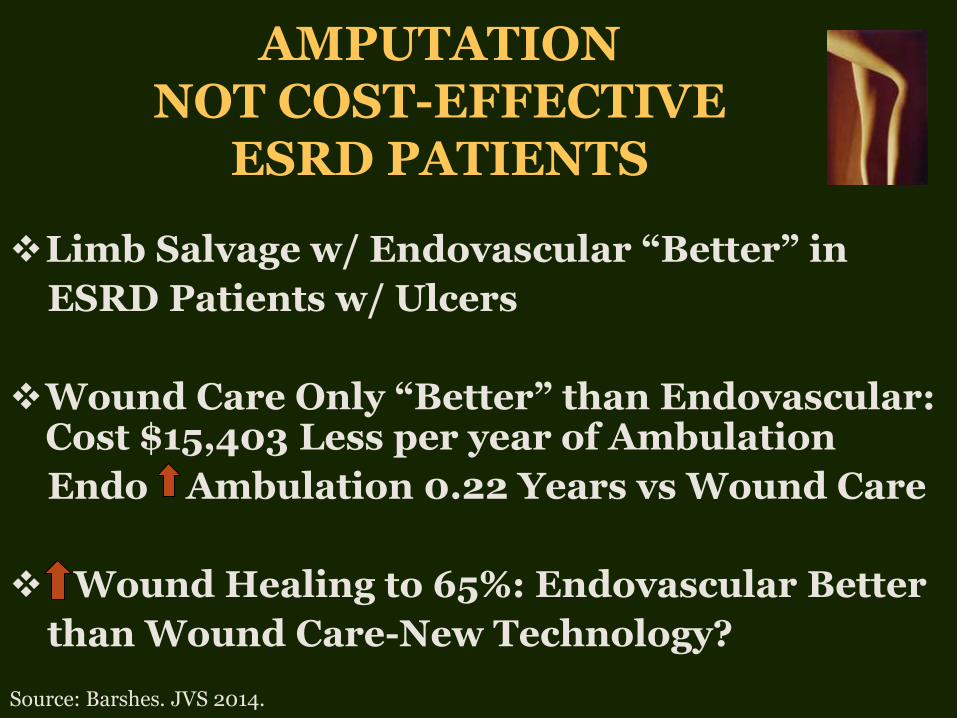
AMPUTATION
NOT COST-EFFECTIVE ESRD PATIENTS
Limb Salvage w/ Endovascular “Better” in
ESRD Patients w/ Ulcers
Wound Care Only “Better” than Endovascular: Cost $15,403 Less per year of Ambulation
Endo Ambulation 0.22 Years vs Wound Care
Wound Healing to 65%: Endovascular Better
than Wound Care-New Technology?
Source: Barshes. JVS 2014.
Source: Barshes JVS 2014.
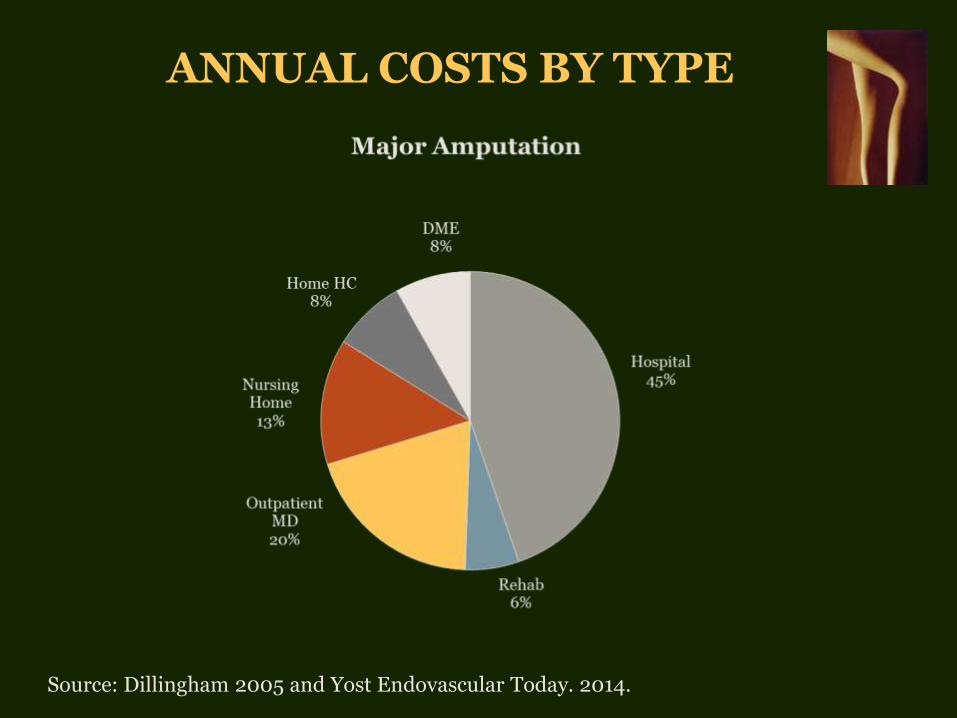
ANNUAL COSTS BY TYPE
Source: Dillingham 2005 and Yost Endovascular Today. 2014.
“PATHWAY TO AMPUTATION”
IMPACT ON HOSPITAL
COSTS & OUTCOMES
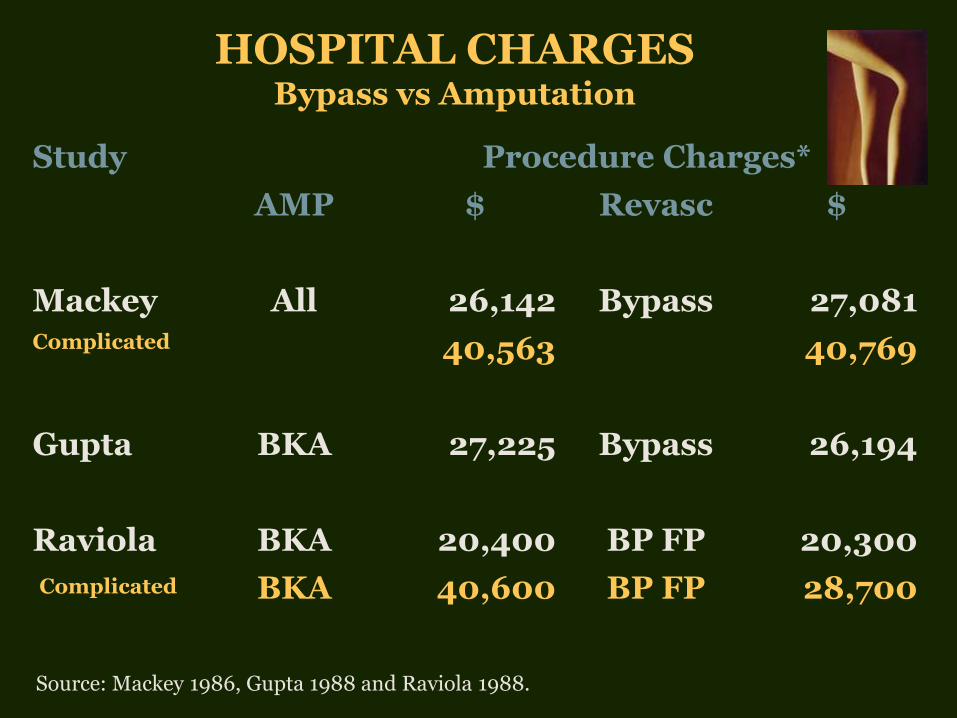
HOSPITAL CHARGES
Bypass vs Amputation
Study Procedure Charges*
AMP $ Revasc $
Mackey All 26,142 Bypass 27,081 Complicated 40,563 40,769
Gupta BKA 27,225 Bypass 26,194
Raviola BKA 20,400 BP FP 20,300
Complicated BKA 40,600 BP FP 28,700
Source: Mackey 1986, Gupta 1988 and Raviola 1988.
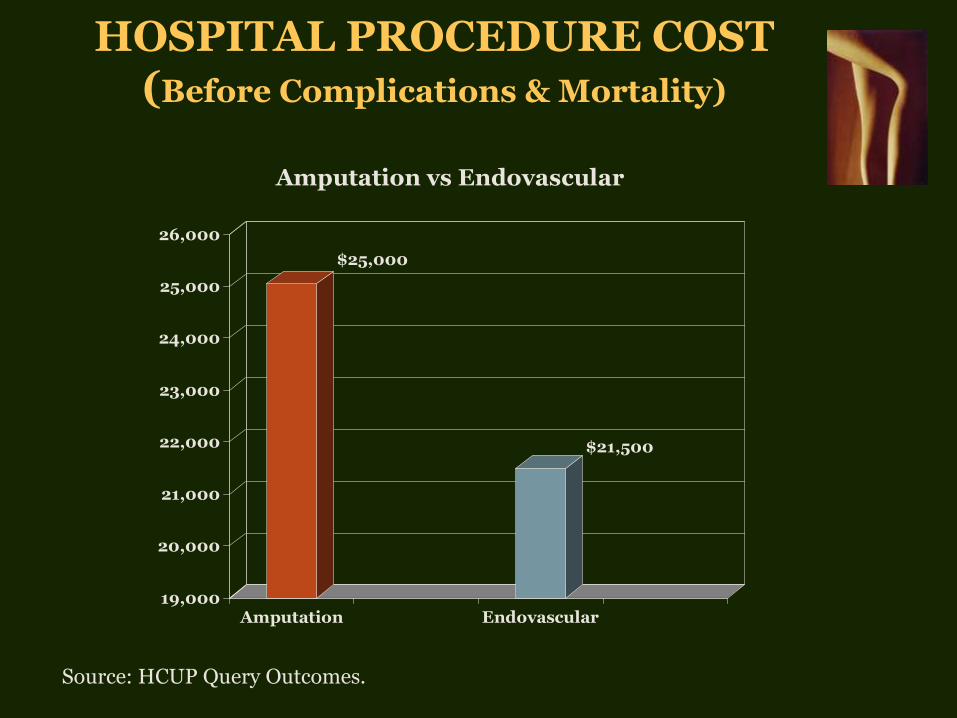
HOSPITAL PROCEDURE COST (Before Complications & Mortality)
$25,000
$21,500
19,000
20,000
21,000
22,000
23,000
24,000
25,000
26,000
Amputation Endovascular
Amputation vs Endovascular
Source: HCUP Query Outcomes.
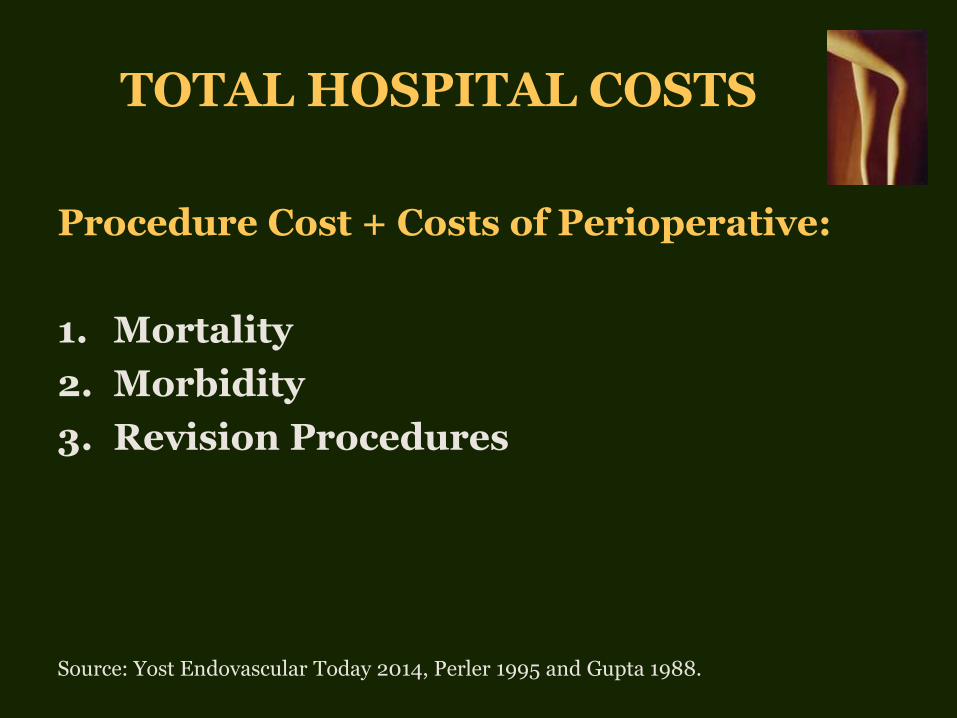
TOTAL HOSPITAL COSTS
Procedure Cost + Costs of Perioperative:
1. Mortality
2. Morbidity
3. Revision Procedures
Source: Yost Endovascular Today 2014, Perler 1995 and Gupta 1988.

PERIOPERATIVE MORTALITY
AKA & BKA are 2 of the top 5 procedures with the highest perioperative mortality
Source: Hasanadka, Belmont, Aulivola, Alonso, Stone, Vogel 2011, DeRubertis, Sachs, Muradin and Ghaferi.
Amputation Endovascular
AKA 5%-10% 1%-3%
BKA 15%-20%

IN-HOSPITAL DEATH
Average Cost $18,600
(In 2010 $)
Source: Davenport & Yost.

PERIOPERATIVE MORBIDITY INCREASES COSTS
PROCEDURE MORBIDITY
Amputation
20%-37%
General & Vascular Surgery
16%-17%
Endovascular
5%-9%
Source: Alonso, Vogel 2011, DeRubertis, Ghaferi, Dormandy, Boltz and Schneider.
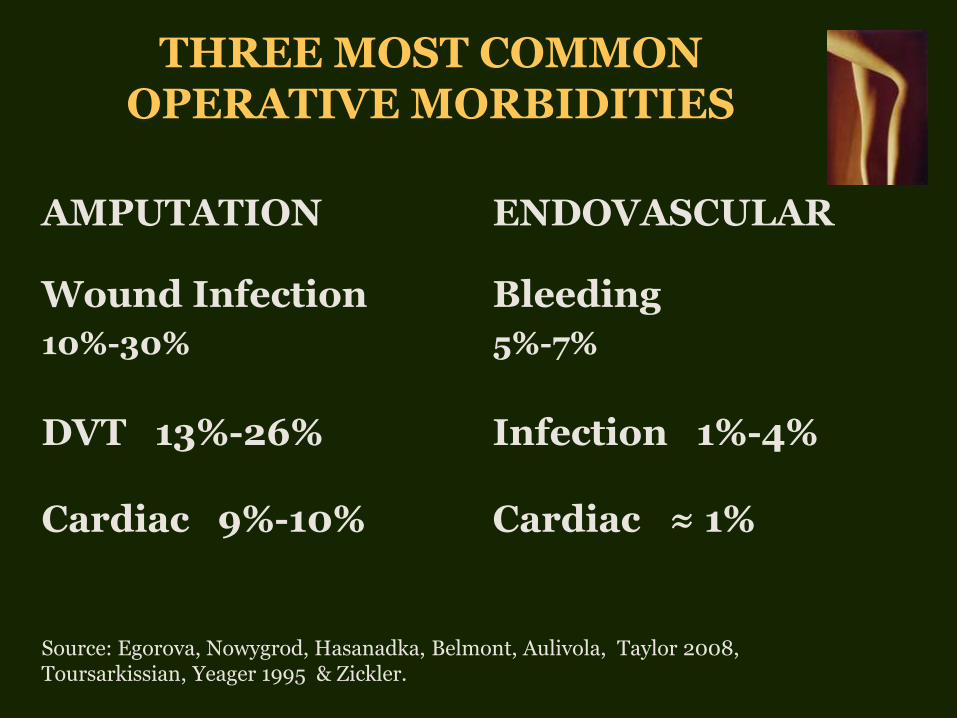
THREE MOST COMMON OPERATIVE MORBIDITIES
Source: Egorova, Nowygrod, Hasanadka, Belmont, Aulivola, Taylor 2008, Toursarkissian, Yeager 1995 & Zickler.
AMPUTATION ENDOVASCULAR
Wound Infection
10%-30%
Bleeding
5%-7%
DVT 13%-26% Infection 1%-4%
Cardiac 9%-10% Cardiac ≈ 1%

IN-HOSPITAL REVISION RATES
AMPUTATION ENDOVASCULAR
Above Knee 12% Endovascular 1%
Below Knee 20% Bypass 4%-9%
Amputation 2%-4%
Source: DeRubertis, Muradin, Faglia 2006, Dillingham 2005, BASIL.

TOTAL HOSPITAL COSTS Including Morbidity, Mortality & Revisions
$35,500
$25,700
0
5,000
10,000
15,000
20,000
25,000
30,000
35,000
40,000
Amputation Endovascular
Amputation vs Endovascular
Source: Yost Endovascular Today 2014.

LIMB SALVAGE PROGRAM IMPACT ON HOSPITAL
Substitute Endovascular Procedures for Amputations
Costs
Capture Foregone Revenues from Angiograms (51%-73% PA No Angio)
Revenues-Attract New CLI Patients
Source: Balar, Mustapha, Bell, Sanguily and THE SAGE GROUP.
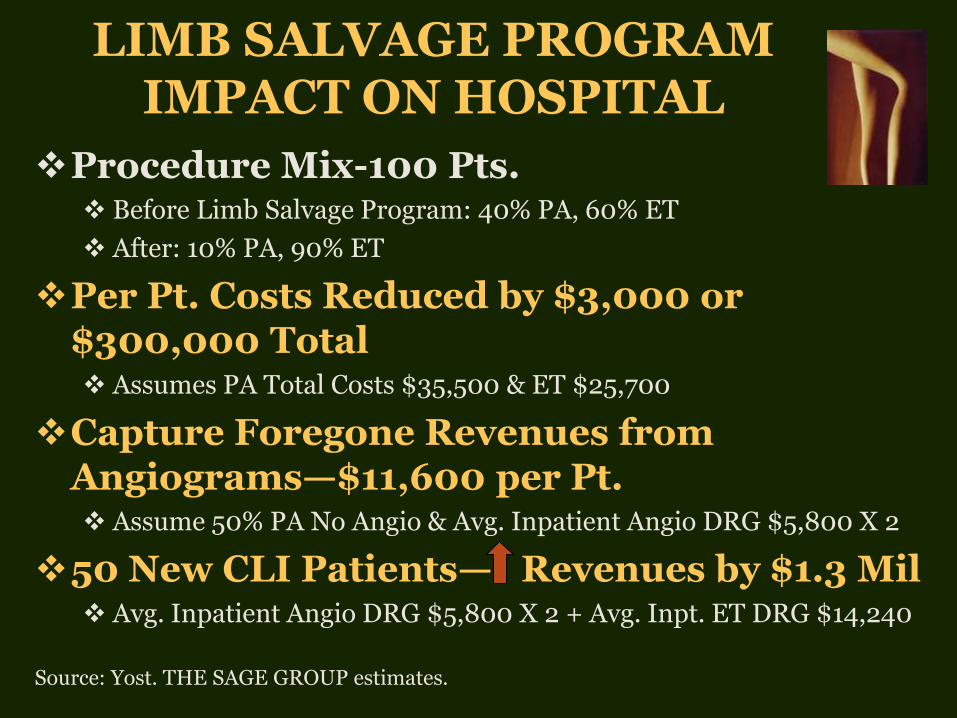
LIMB SALVAGE PROGRAM IMPACT ON HOSPITAL
Procedure Mix-100 Pts. Before Limb Salvage Program: 40% PA, 60% ET
After: 10% PA, 90% ET
Per Pt. Costs Reduced by $3,000 or $300,000 Total Assumes PA Total Costs $35,500 & ET $25,700
Capture Foregone Revenues from Angiograms—$11,600 per Pt. Assume 50% PA No Angio & Avg. Inpatient Angio DRG $5,800 X 2
50 New CLI Patients— Revenues by $1.3 Mil Avg. Inpatient Angio DRG $5,800 X 2 + Avg. Inpt. ET DRG $14,240
Source: Yost. THE SAGE GROUP estimates.
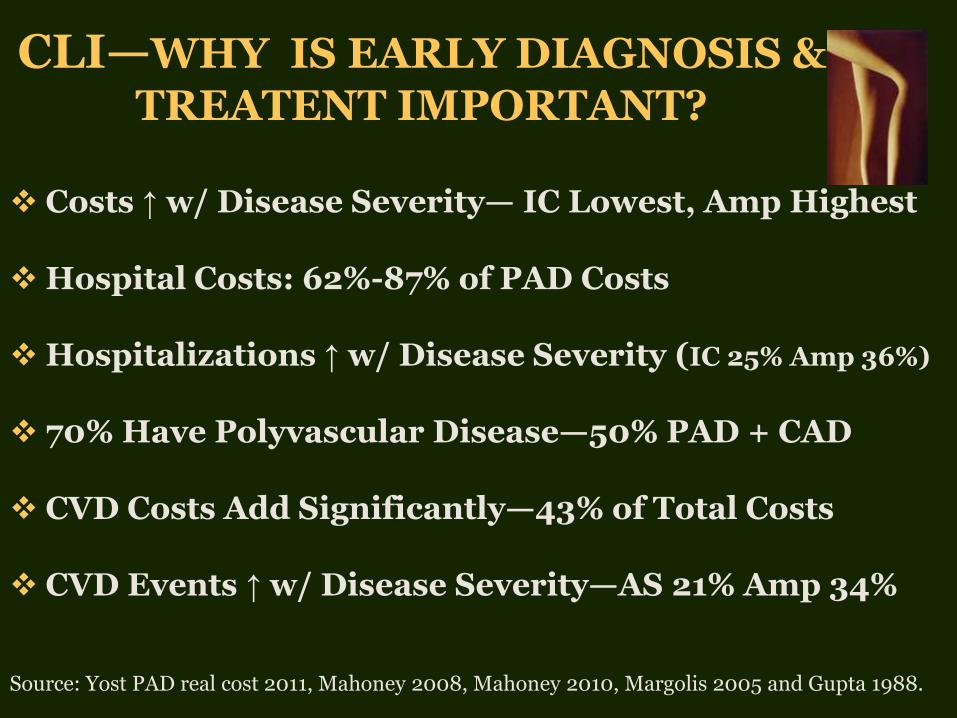
CLI—WHY IS EARLY DIAGNOSIS &
TREATENT IMPORTANT?
Costs ↑ w/ Disease Severity— IC Lowest, Amp Highest Hospital Costs: 62%-87% of PAD Costs Hospitalizations ↑ w/ Disease Severity (IC 25% Amp 36%)
70% Have Polyvascular Disease—50% PAD + CAD CVD Costs Add Significantly—43% of Total Costs
CVD Events ↑ w/ Disease Severity—AS 21% Amp 34%
Source: Yost PAD real cost 2011, Mahoney 2008, Mahoney 2010, Margolis 2005 and Gupta 1988.
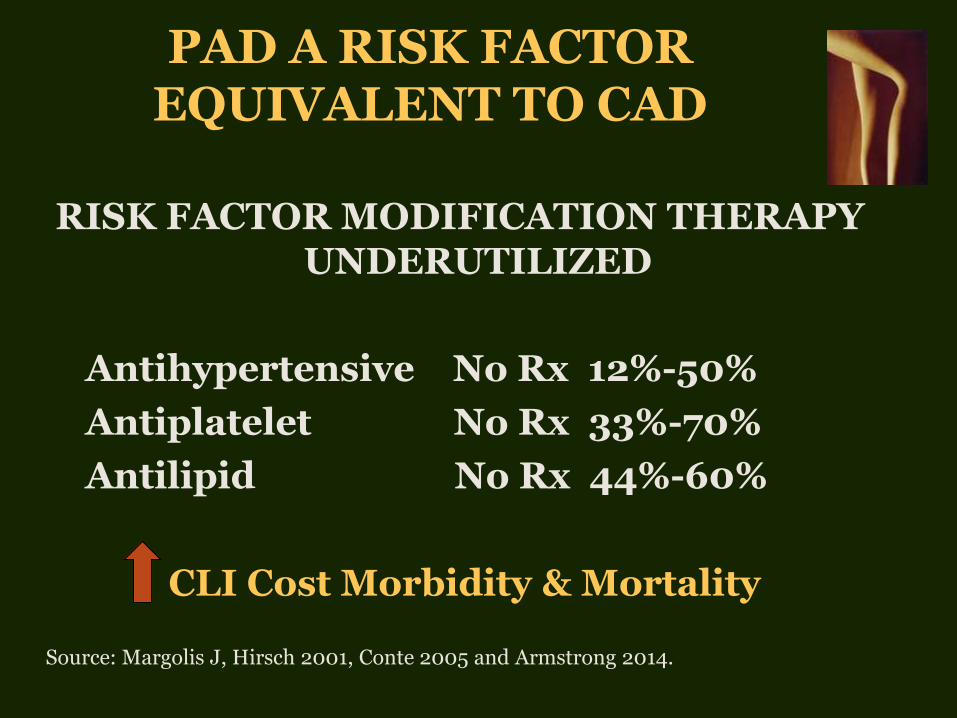
PAD A RISK FACTOR EQUIVALENT TO CAD
RISK FACTOR MODIFICATION THERAPY UNDERUTILIZED
Antihypertensive No Rx 12%-50%
Antiplatelet No Rx 33%-70%
Antilipid No Rx 44%-60%
CLI Cost Morbidity & Mortality
Source: Margolis J, Hirsch 2001, Conte 2005 and Armstrong 2014.

ENDOVASCULAR PATIENT
OUTCOMES
•Discharge Status
– 62% go home routinely 18% (NH, Rehab) 17% Home HC
•Ambulation-2 Year
– 81% walking
– 88% living independently
•Revascularization (18 mos.)
– 30%-40%
•Mortality-2 Year
– 16%-24%
Source: Allie 2005, Sachs, HCUP Query DRG 252-254, Taylor 2006, Bradbury, Vogel 2008, Conrad, Aiello, Abularrage.
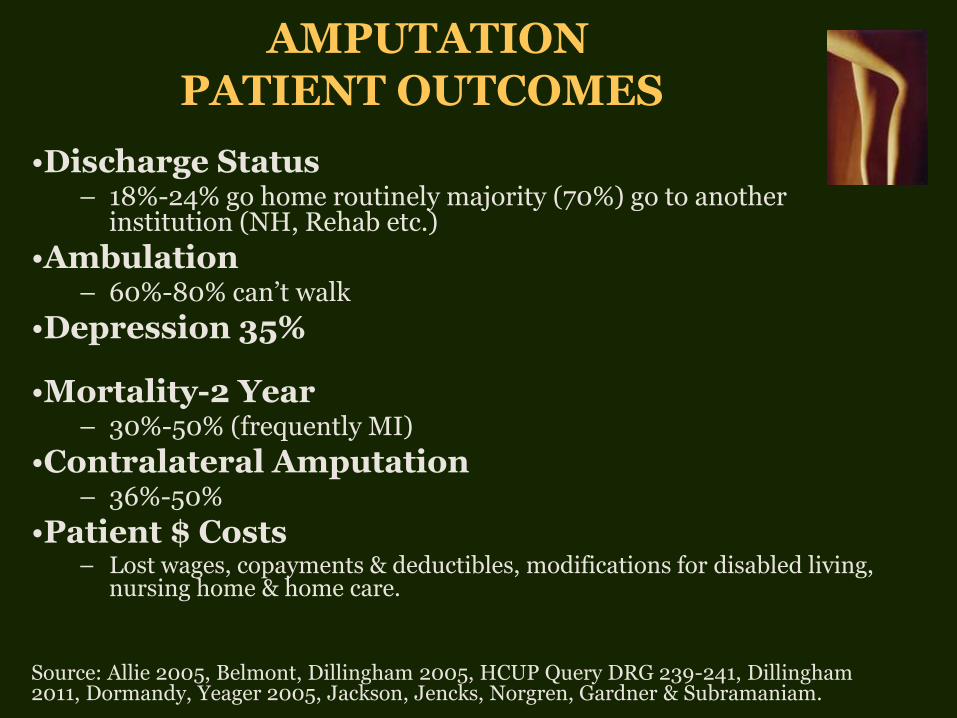
AMPUTATION
PATIENT OUTCOMES
•Discharge Status
– 18%-24% go home routinely majority (70%) go to another institution (NH, Rehab etc.)
•Ambulation
– 60%-80% can’t walk
•Depression 35%
•Mortality-2 Year
– 30%-50% (frequently MI)
•Contralateral Amputation – 36%-50%
•Patient $ Costs – Lost wages, copayments & deductibles, modifications for disabled living,
nursing home & home care. Source: Allie 2005, Belmont, Dillingham 2005, HCUP Query DRG 239-241, Dillingham 2011, Dormandy, Yeager 2005, Jackson, Jencks, Norgren, Gardner & Subramaniam.
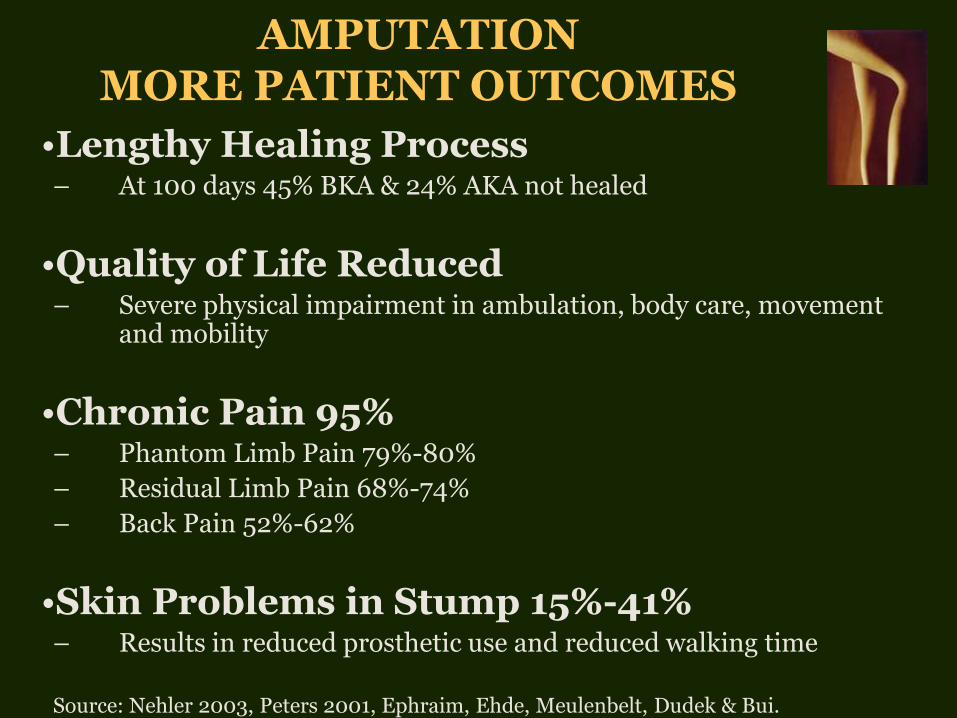
AMPUTATION MORE PATIENT OUTCOMES
•Lengthy Healing Process
– At 100 days 45% BKA & 24% AKA not healed
•Quality of Life Reduced
– Severe physical impairment in ambulation, body care, movement and mobility
•Chronic Pain 95%
– Phantom Limb Pain 79%-80%
– Residual Limb Pain 68%-74%
– Back Pain 52%-62%
•Skin Problems in Stump 15%-41%
– Results in reduced prosthetic use and reduced walking time Source: Nehler 2003, Peters 2001, Ephraim, Ehde, Meulenbelt, Dudek & Bui.
CONCLUSIONS
CLI: ACTUAL TREATMENT SIGNIFICANTLY DIFFERENT FROM IDEAL— COSTS
AMPUTATION IS LESS COST-EFFECTIVE THAN LIMB SALVAGE—EVEN IN MARGINAL & ESRD PTS
AMPUTATION COSTS THE HOSPITAL MORE THAN LIMB SALVAGE
CLI EARLY DIAGNOSIS & TREATMENT: COULD REDUCE COSTS, MORBIDITY & MORTALITY
AMPUTATION: HIGH PATIENT COSTS—NOT JUST $$$$ BUT POOR QUALITY OF LIFE, PAIN, INABILITY TO AMBULATE
MORE RESEARCH: COSTS/ECONOMICS & OC

THANK YOU—THE STAFF
REFERENCES
Abularrage CJ. J Vasc Surg 2010; 52(2):314-22.
Aiello FA. J Vasc Surg 2012; 55(2):371-9.
Allie DE. Eurointervention 2005; 1(1): 60-69.
Alonso A. Endovascular Today 2011; 10: 3206.
Armstrong EJ. J Am Heart Assoc 2014;3e000697.
Aulivola B. Arch Surg 2004; 139: 395-99.
Balar NN. Endovascular Today 2011;10(8):61-4.
Barshes NR. J Vasc Surg 2012; 56:1015-24.
Barshes NR. JVS 2014;60:369-74.
Barshes NR. Ann Vasc Surg 2014; 28(1):10-17.
Baser. Vasc Dis Mgmt 2013: 10(20); E26-36.
BASIL. Lancet 2005; 366:1925-34.
Belmont. J Am Coll Surg 2011; 213: 370-8.
Bell D. Amputation trends and the drive for 25. Presentation at the SALSAL National meeting 2011, October 27-30; Orlando, Florida.
Boltz MM. Surgery 2011;150:934-42.
Bradbury AW. J Vasc Surg 2010; 51(5 Suppl): 5S-17S.
Brothers. Cardiovasc Surg 1999; 7(1): 62-9.
Bui KM. J Rehabil Res Dev 2009; 46: 1085-90.

REFERENCES
Conte MS, J Vasc Surg 2005; 42(3): 456-65.
Conrad MF. J Vasc Surg. 2011; 53(4):1020-5.
Davenport DL. Ann Surg 2005; 242: 463-71.
DeRubertis. Ann Surg 2007; 246:415-24.
Dillingham. Arch Phys Med Rehabil 2005; 86: 480-6.
Dillingham. PM R 2011; 3(4): 336-44.
Dormandy. J Vasc Surg 2000; 31(Suppl): S1-S296. Dudek NL. Arch Phys Med Rehabil 2005; 86: 659-63.
Egorova. J Vasc Surg 2010; 51(4): 878-85.
Ehde. Arch Phys Med Rehabil 2000; 81:1039-44.
Ephraim. Arch Phys Med Rehabil 2005; 86: 1910-19.
Eslami. J Vasc Surg 2007; 45: 55-9.
Faglia E. Eur J Vasc Endovasc Surg 2006; 32: 484-90.
Fuller RL. Health Care Financing Review 2009;30:17-32.
Gardner. Endovascular Today 2011; 10(8): 38-44. Ghaferi AA. N Engl J Med 2009362:1368-75.
Goodney. Cardiovasc Qual Outcomes 2012; 5:94-102.
Gupta. Eur J Vasc Surg 1988; 2:151-4.

REFERENCES
HCUP Query. ICD-9 diagnosis codes PAD 440.20-29, 443.9 & 443.81.
HCUP Query. ICD-9 procedure codes 84.14-84.17.
HCUP Query. ICD-9 procedure codes 39.50, 39.90 & 00.55.
HCUP Query. Discharge status for DRG 239-241.
HCUP Query. Discharge status for DRG 252-254.
Hallett. J Vasc Surg 1997; 25:29-38.
Hasanadka R. J Vasc Surg 2011; 54: 1374-82.
Henry. J Vasc Surg 2011; 53(2): 330-9el.
Hirsch AJ. JAMA 2001;286:1317-24.
Hlatky. Circulation 2013; 127: 764-5. Jackson. Slide presentation at Vascular Annual Meeting, 2011.
Jencks. N Engl J Med 2009; 360: 1418-28.
Jones. J Am Coll Cardiol 2012; 59(13s1):E1670.
Mackey. Surgery 1986; 99: 26-35.
Mahoney EM. Circ Cardiovasc Qual Outcomes 2008;1:38-45.
Mahoney EM. Circ Cardiovasc Qual Outcomes 2010;3:642-51.
Margolis DJ. Diabetes Care. 2011; 34(11):2363-7.
REFERENCES
Margolis J. J Manag Care Pharm 2005; 11(9): 727-24.
Meulenbelt HEJ. Acta Derm Venereol 2011; 91: 173-7.
Muradin GSR. Radiology 2001; 218:464-9. Mustapha JA. Amputation prevention: a multidisciplinary approach. [Internet.] Supplement to Podiatry Today and Vascular Disease Management.
Nehler. J Vasc Surg 2003; 38(1): 7-14.
Nehler MR. J Vasc Surg 2014; 60(3): 686-95 e2. Norgren. J Vasc Surg 2007; 45(suppl): S1-S67. Nowygrod. J Vasc Surg 2006; 43: 205-16.
Perler. J Vasc Interv Radiol 1995; 6:111S-115S.
Peters. Diabetes Care 2001; 24(10): 1799-1804.
Raviola. Arch Surg 1988; 123: 495-6.
Sachs. J Vasc Surg 2011; 54: 1021-31.
Sanguily J. Endovascular evaluation and treatment of patients with peripheral artery disease results in lower amputation rate. Poster Abstract, ISET 2015.
Schneider. In: Rutherford Vascular Surgery 2005; 1192-1222.
Stone PA. W V Med J 2007; 103(5): 14-8.

REFERENCES
Subramaniam. Anesth Analg. 2005; 100:1241-7.
Taylor SM. Ann Surg 2008; 74:607-12.
Tennvall. Clin Infect Dis 2004; 39(Suppl 2): S132-9.
Toursarkissian B. Ann Surg 2002; 68: 606-10.
Vogel TR. Vasc Endovasc Surg 2008; 42:12-18.
Vogel TR. Vasc Surg 2011; 54: 706-13.
Weintraub. Circ Cardiovasc Qual Outcomes 2009; 2:55-8.
Yeager RA. J Vasc Surg 1995; 22: 612-5.
Yeager RA. Rutherford. Vascular surgery 2005. p. 2474-2481.
Yost ML. Cost-benefit analysis of critical limb ischemia in the era of the Affordable Care Act. Endovascular Today 2014, May.
Yost ML. CLI Vol I & II Atlanta, GA. THE SAGE GROUP; 2007, 2008 & 2010.
Yost ML. Peripheral artery disease interventional market analysis based on treatment with angioplasty or atherectomy. THE SAGE GROUP 2012.
Yost ML. The economic cost of dysvascular amputation. THE SAGE GROUP. In press.
Yost ML. The Real cost of peripheral artery disease. THE SAGE GROUP. 2011.
Zickler RW. Arch Phys Med Rehabil 1999; 80: 509-11.
Related Documents