The cost-effectiveness of weight management interventions following childbirth Commissioned by: NICE Centre for Public Health Excellence Produced by: ScHARR Public Health Collaborating Centre Authors: Alejandra Duenas Andrew Rawdin Jim Chilcott Josie Messina Maxine Johnson Fiona Campbell Emma Everson Hock Louise Guillaume Elizabeth Goyder Nick Payne Correspondence to: Vivienne Walker School of Health and Related Research (ScHARR) University of Sheffield Regent Court 30 Regent Street Sheffield S1 4DA [email protected]

Welcome message from author
This document is posted to help you gain knowledge. Please leave a comment to let me know what you think about it! Share it to your friends and learn new things together.
Transcript
The cost-effectiveness of weight management interventions following childbirth
Commissioned by: NICE Centre for Public Health Excellence
Produced by: ScHARR Public Health Collaborating Centre
Authors: Alejandra Duenas Andrew Rawdin Jim Chilcott Josie Messina Maxine Johnson Fiona Campbell Emma Everson Hock Louise Guillaume Elizabeth Goyder Nick Payne
Correspondence to: Vivienne Walker School of Health and Related Research (ScHARR) University of Sheffield Regent Court 30 Regent Street Sheffield S1 4DA [email protected]

The cost-effectiveness of weight management interventions following childbirth
2
About the ScHARR Public Health Collaborating Centre
The School of Health and Related Research (ScHARR), in the Faculty of Medicine,
Dentistry and Health, University of Sheffield, is a multidisciplinary research-led
academic department with established strengths in health technology assessment,
health services research, public health, medical statistics, information science, health
economics, operational research and mathematical modelling, and qualitative
research methods. It has close links with the NHS locally and nationally and an
extensive programme of undergraduate and postgraduate teaching, with Masters
courses in public health, health services research, health economics and decision
modelling.
ScHARR is one of the two Public Health Collaborating Centres for the Centre for
Public Health Excellence (CPHE) in the National Institute for Health and Clinical
Excellence (NICE) established in May 2008. The Public Health Collaborating Centres
work closely with colleagues in the Centre for Public Health Excellence to produce
evidence reviews, economic appraisals, systematic reviews and other evidence
based products to support the development of guidance by the public health advisory
committees of NICE (the Public Health Interventions Advisory Committee (PHIAC)
and Programme Development Groups).
Contribution of Authors
Alejandra Duenas was lead modeller, and Andrew Rawdin was an additional
economic modeller. Josie Messina was the systematic review lead. Maxine Johnson,
Fiona Campbell and Emma Everson-Hock were reviewers on the project. Louise
Guillaume developed and undertook literature searches. Elizabeth Goyder and Jim
Chilcott were the senior leads.
Acknowledgements
This report was commissioned by the Centre for Public Health Excellence of behalf of
the National Institute for Health and Clinical Excellence. The views expressed in the
report are those of the authors and not necessarily those of the Centre for Public
Health Excellence or the National Institute for Health and Clinical Excellence. The
final report and any errors remain the responsibility of the University of Sheffield.
Elizabeth Goyder and Jim Chilcott are guarantors.
The cost-effectiveness of weight management interventions following childbirth
3
Contents
1. Glossary of terms ...................................................................................... 4 2. Executive summary ................................................................................... 6
2.1 Background ............................................................................................ 6 2.2 Objectives ............................................................................................... 6 2.3 Methods .................................................................................................. 6 2.4 Results ................................................................................................... 7 2.5 Discussion and conclusion ..................................................................... 7
3. Introduction ................................................................................................ 8 4. Review of previous economic studies ..................................................... 8
4.1 Search strategy ...................................................................................... 8 4.2 Inclusion and exclusion strategy ............................................................. 8 4.3 Results of review .................................................................................... 9
5. Economic Assessment ............................................................................ 11 5.1 Objective .............................................................................................. 11 5.2 Methods ................................................................................................ 11
6. Results ...................................................................................................... 22 7. Discussion and conclusion ..................................................................... 24 8. References ................................................................................................ 27 9. Appendices ............................................................................................... 28
Appendix 1: Search Strategies ................................................................... 28 Appendix 2: Included studies...................................................................... 29 Appendix 3: Probabilistic sensitivity analysis parameters ........................... 37
Tables and figures Table 1: Body weight changes for intervention and control group ......... 12
Table 2: Body weight changes for intervention and control group ......... 13
Table 3: Multivariable model 15-year body weight change (kg), Rooney (2005) ............................................................................................................ 14
Table 4: IOM recommendations for Weight Gain During Pregnancy ...... 15
Table 5: Cost of supervised exercise (6 months) ...................................... 18
Table 6: Cost of dietary supervision (6 months) ....................................... 18
Table 7: Unit cost of health and social health used in the ScHARR model ....................................................................................................................... 19
Table 8: Utility score (standard deviation) and sample size for women according to BMI and age (addapted from Macran). ................................. 20
Table 9: Results at 15 years and lifetime ................................................... 22
The cost-effectiveness of weight management interventions following childbirth
4
1. Glossary of terms
Body Fat Percentage: the percentage of total body weight that is comprised of fat
(Concepts of Fitness and Wellness).
Body Mass Index: A key index for relating a person's body weight to their height.
The body mass index (BMI) is a person's weight in kilograms (kg) divided by their
height in meters (m) squared (kg/m2). (Concepts of Fitness and Wellness)
Calorie: A unit of energy supplied by food; the quantity of heat necessary to raise the
temperature of a kilogram of water one degree centigrade. A kilocalorie is usually
called a Calorie for weight control purposes (Concepts of Fitness and Wellness)
Fat-free Mass: the mass (weight) of the body (muscle, bone, skin and organs) that is
not fat
Gestational diabetes: Carbohydrate intolerance of varying severity which is
diagnosed in pregnancy and may or may not resolve after pregnancy.
Metabolic equivalent (METs): a unit of energy expenditure, or metabolic cost, of
physical activity. One MET is the rate of energy expenditure while sitting at rest
(Fitness Glossary).
Physical activity is any force exerted by skeletal muscle that results in energy
expenditure above resting level (Caspersen, Powell, & Christenson 1985). It includes
the full range of human movement and can encompass everything from competitive
sport and active hobbies to walking, cycling and the general activities involved in
daily living (such as housework).
Physical activity: measured in terms of:
the time it takes (duration)
how often it occurs (frequency)
its intensity (the rate of energy expenditure – or rate at which calories are burnt).
The intensity of an activity is usually measured either in kcals per kg per minute or
in METs (metabolic equivalents – multiples of resting metabolic rate). Depending on
the intensity, the activity will be described as: moderate-intensity or vigorous-
intensity. Moderate-intensity activities increase the heart and breathing rates but, at
the same time, allow someone to have a normal conversation. An example is brisk
walking.
The cost-effectiveness of weight management interventions following childbirth
5
Post Partum: the period after birth
List of Abbreviations BMI: body mass index CEAC: cost-effectiveness acceptability curve GWG: gestational weight gain IOM: Institute of Medicine Kcal: calorie, or kilocalorie LTPA: leisure time physical activity NRS: non randomised studies NA: not applicable NR: not reported OECD: Organisation for Economic Co-operation and Development OR: odds ratio QALY: quality-adjusted life-year RR: risk ratio RCTs: randomised control trials

The cost-effectiveness of weight management interventions following childbirth
6
2. Executive summary
2.1 Background
Effective weight management following childbirth may reduce the long term risks of
heart disease, cancer, obesity and diabetes among childbearing women, as well as
reduce the risk of entering future pregnancies overweight or obese (Gore et al.
2003). The National Institute for Health and Clinical Excellence has been asked by
the Department of Health to develop public health guidance to promote weight
management following childbirth.
An economic model was developed in order to estimate the cost-effectiveness of
weight management interventions targeted at women who have given birth within 2
years. This present model is based on the effectiveness review aimed to identify and
synthesise evidence on the effectiveness of dietary and/ or physical activity
interventions and any other intervention after childbirth that may impact on weight
management. The outcomes considered were weight related outcomes, diet and
physical activity, breastfeeding, access to and use of services, harms of interventions
and long term overweight and obesity rates (outcomes).
2.2 Objectives
The primary objective of this evaluation is to appraise the cost-effectiveness of
weight management after childbirth interventions.
2.3 Methods
Economic analyses were performed to model the cost-effectiveness and cost utility of
weight management interventions targeted at women who have given birth within 2
years.
The model was designed in order to assess different outcomes. It assessed the
effectiveness of dietary interventions and or physical activity interventions for either
post natal weight management or any dietary or physical activity following pregnancy
that may impact on weight management. It has a NHS and personal social services
(PSS) perspective.
The results are presented in terms of incremental cost-effectiveness ratios (ICERs).
Detailed reviews were undertaken to obtain the most recent evidence on costs and
utilities for the different states modelled. UK specific data were used although the

The cost-effectiveness of weight management interventions following childbirth
7
effectiveness of dietary and physical activity interventions were taken from US setting
studies.
2.4 Results
The mean incremental cost effectiveness ratio of the diet and exercise interventions
as estimated from the trial by Lovelady was £44,144 per QALY over a 15 year time
horizon with a 95% confidence interval ranging from £15,000 per QALY to dominated
(e. g. less effective and costs more). Over a lifetime horizon this cost effectiveness
improves to £9,096, ranging from £4,000 to dominated.
2.5 Discussion and conclusion
The review of effectiveness concluded that interventions to manage weight gain after
childbirth were shown to be effective in the short term. In contrast the economic
results were highly dependent on the long term impact of these short term effects.
These long term effects are dependent on key assumptions within the modelling. For
example, the 15 year impact on weight change and the lifelong impact on survival are
estimated from observational studies that demonstrate associations rather than
causative effects. The long term economic estimates are thus prone to high levels of
structural uncertainty not represented in the probabilistic sensitivity analysis.
Studies examining interventions in weight management after childbirth are required in
a UK population. Future research in interventions to managing weight gain after
childbirth should ensure that follow up is sufficient to demonstrate health and
economic advantages. Where trials are designed to collect short term surrogate
outcomes, the relationship between these and long term final health outcomes
should be explicit and quantifiable. Observation studies in a UK population are
required to assist in determining long term effects of interventions in this area.
The cost-effectiveness of weight management interventions following childbirth
8
3. Introduction
This study was undertaken in parallel with a systematic review on the effectiveness
of weight management interventions targeted at women who have given birth within 2
years. The systematic review aimed to identify and synthesise evidence on the
effectiveness of dietary and/ or physical activity interventions and any intervention
after childbirth that may impact on weight management. It also included interventions
focussed on assessments, monitoring, and support/advice for post partum weight
management. The purpose of this economic review was to evaluate the cost
effectiveness and applicability of interventions identified as being effective in the
systematic review. The outcomes considered were weight related outcomes, diet and
physical activity, breastfeeding, access to and use of services, harms of interventions
and long term overweight and obesity rates (outcomes). A review of cost-
effectiveness of weight management after childbirth interventions was also
undertaken with the primary objective of systematically identifying and evaluating
methodologies used in economic evaluations.
4. Review of previous economic studies
4.1 Search strategy
Studies were identified through searches of economic databases: EconLit and NHS
EED. All searches were undertaken in August 2009. A list of the keyword strategies
and the sources consulted are given in Appendix 1. Where additional information
requirements were identified, targeted searches were undertaken for model
parameters.
4.2 Inclusion and exclusion strategy
The titles and abstracts of papers identified through the searches outlined above
were assessed for inclusion using the following criteria:
Inclusion criteria
Cost-effectiveness, cost-benefit or cost minimisation analyses.
Dietary interventions and or physical activity interventions for either post
natal weight management or any dietary or physical activity following
pregnancy that may impact on weight management. These interventions
may be targeted at individuals, families, communities or whole population.
The cost-effectiveness of weight management interventions following childbirth
9
Community weight management interventions.
Comparator current postnatal care.
Mothers, up to at least two years with a BMI greater than 18.5 kg/m2
following the birth of their baby, both those who are breast feeding and those
who are not breast feeding.
Mothers, up to at least two years following the birth of their baby who are
planning a subsequent pregnancy.
Women from vulnerable groups such as those diagnosed with gestational
diabetes and those with a BMI greater than 25 kg/m2 who are at risk of
excess weight retention following pregnancy.
Exclusion criteria
Publications in languages other than English
Pharmaceutical or surgical interventions for overweight and obese women.
Complementary interventions for overweight and obese women.
4.3 Results of review
Data Extraction, critical appraisal and data synthesis
It had been planned for one economic modeller to extract previous model structures
with no blinding to author or journal for the purpose of providing a narrative account
of previous economic modelling for the reader. Planned quality assessment was with
criteria based on those provided by the NHS centre for reviews and dissemination for
randomised controlled trials, or using the Downs and Black checklist for randomised
and non-randomised studies for the other studies accepted into the review.
Results
The search yielded 500 citations, of which 470 were rejected from titles and
abstracts. Of the remaining 30 papers only one looked at the costs and effectiveness
of a postnatal intervention (Morrell et al. 2000). However, the postnatal intervention
was aimed to help women rest and recover after childbirth. This intervention did not
The cost-effectiveness of weight management interventions following childbirth
10
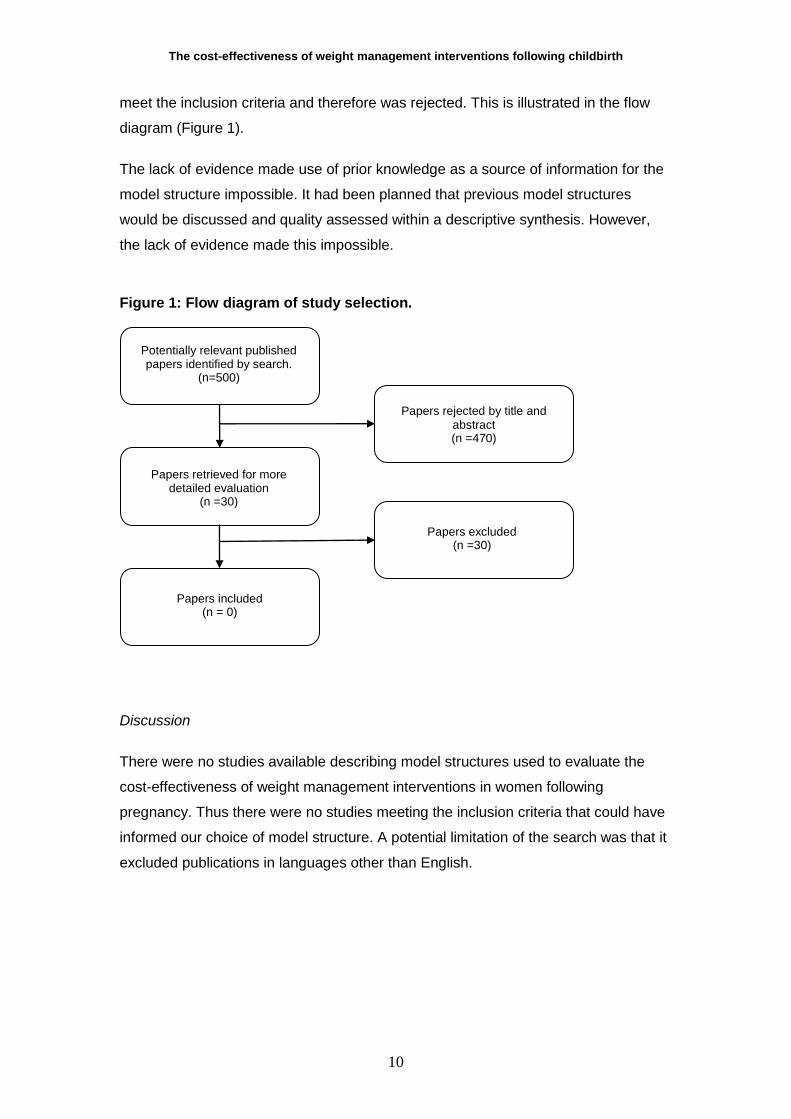
meet the inclusion criteria and therefore was rejected. This is illustrated in the flow
diagram (Figure 1).
The lack of evidence made use of prior knowledge as a source of information for the
model structure impossible. It had been planned that previous model structures
would be discussed and quality assessed within a descriptive synthesis. However,
the lack of evidence made this impossible.
Figure 1: Flow diagram of study selection.
Discussion
There were no studies available describing model structures used to evaluate the
cost-effectiveness of weight management interventions in women following
pregnancy. Thus there were no studies meeting the inclusion criteria that could have
informed our choice of model structure. A potential limitation of the search was that it
excluded publications in languages other than English.
Potentially relevant published papers identified by search.
(n=500)
Papers retrieved for more detailed evaluation
(n =30)
Papers included (n = 0)
Papers rejected by title and abstract (n =470)
Papers excluded (n =30)

The cost-effectiveness of weight management interventions following childbirth
11
5. Economic Assessment
5.1 Objective
The primary objective of this evaluation is to appraise the cost-effectiveness of
weight management after childbirth interventions.
5.2 Methods
A model was developed to explore the economic outcomes associated with weight
management interventions targeted at women who have given birth within 2 years.
This model was used to determine the cost and benefits over a lifetime horizon. The
effectiveness of interventions was obtained from the systematic review conducted by
ScHARR on the effectiveness of weight management after childbirth interventions.
The results are presented in terms of costs per quality adjusted life year gained.
Population considered in the economic evaluation
The population comprised women who have given birth within two years with no pre-
existing medical complications relating to pregnancy or the post partum period that
may affect weight management. No age limits at the time of intervention were
applied.
Comparator
The comparator was conventional postnatal care.
Outcomes
Outcomes included in the systematic review were classed into 5 categories: weight
related outcomes, diet and physical activity, breastfeeding, access to and use of
services, harms of interventions. The following outcomes were of particular interest
for the economic evaluation: changes in measures of body weight and BMI and long
term overweight and obesity rates.
Effectiveness of interventions
This model was informed with evidence of interventions‟ effectiveness and their link
with outcomes found in the systematic review. A total of five randomised control trials
(RCT) (Dewey et al. 1994; Leermakers et al. 1998; Lovelady et al. 2006; McCrory et
al. 1999, O‟Toole et al. 2003) and two non-randomised studies (NRS) (Albright et al.
2009; Kinnunen et al. 2007) were identified. All the identified studies were conducted

The cost-effectiveness of weight management interventions following childbirth
12
in the United States (US). The effectiveness evidence of these studies is presented
in the systematic review conducted by ScHARR. The two main effectiveness
outcomes needed to model the economic evaluation are changes in measures of
body weight and BMI. For effects of this economic evaluation only the RCTs (Dewey
et al. 1994; Leermakers et al. 1998; Lovelady et al. 2006; McCrory et al. 1999,
O‟Toole et al. 2003) reported the main effectiveness outcomes and are summarised
below in Table 1 and 2.
Table 1: Body weight changes for intervention and control group
Dewey et al (RCT) Exercise Group
(mean ± SD)
Control Group
(mean ± SD)
Pre-pregnancy weight (kg) 61.3 ± 6.5 61.6 ± 6.5
Start of Intervention 6 – 8 weeks 6 – 8 weeks
Duration of intervention (follow-up) 12 weeks 12 weeks
Nature of intervention Aerobic exercise None
Weight gained during pregnancy (kg) 15.2 ± 5.3 17.5 ± 5.4
Weight lost by six months (kg) Not reported Not reported
Weight at end of study (kg) 65.7 ± 10.7 65.4 ± 8.3
Infant birth weight (kg) 3.66 ± 0.36 3.89 ± 0.54
Height 163.2 ± 6.9 cm 167.6 ± 6.5 cm
Leermakers et al (RCT) Exercise Group
(mean ± SD)
Control Group
(mean ± SD)
Pre-pregnancy weight (kg) 67.0 ± 8.4 67.0 ± 8.4
Start of intervention 3 – 12 months 3 – 12 months
Duration of intervention (follow-up) 6 months 6 months
Nature of intervention
Behavioural
weight loss by
correspondence
None
Weight gained during pregnancy (kg) 17.5 ± 5.7 19.8 ± 6.7
Weight lost by six months (kg) 7.8 ± 4.5 4.9 ± 5.4
Weight at end of study (kg) Not reported Not reported
Infant birth weight (kg) Not reported Not reported
Height Not reported Not reported
Lovelady et al (RCT) Exercise Group
(mean ± SD)
Control Group
(mean ± SD)
Pre-pregnancy weight (kg) 68.6 ± 2.3 70.5 ± 2.9
Start of intervention 4 weeks 4 weeks
Duration of intervention (follow-up) 10 weeks 10 weeks

The cost-effectiveness of weight management interventions following childbirth
13
Nature of intervention Diet and exercise None
Weight gained during pregnancy (kg) 15.5 ±1.0 14.8 ± 1.3
Weight lost by six months (kg) Not reported Not reported
Weight at end of study (kg) 72.2 ± 2.8 73.7 ± 2.3
Infant birth weight (kg) 3.61 ± 0.21 3.51 ± 0.10
Height 166.5 ± 1.9 cm 164.8 ± 1.3
Table 2: Body weight changes for intervention and control group
O’Toole et al (RCT)
Structured Diet
& Physical Activity
Programme
Self Directed
Programme
Pre-pregnancy weight (kg) 79.8 ± 5.2 83.9 ± 10.2
Start of intervention 6 – 26 weeks 6 – 26 weeks
Duration of intervention (follow-
up) 1 year 1 year
Nature of intervention Structured diet and physical
activity programme
Self directed diet and
physical activity
Weight gained during pregnancy
(kg) > 15 >15
Weight lost by six months (kg) Not reported Not reported
Weight at end of study (kg) 71.3 ± 2.2 84.1 ± 4.3
Infant birth weight (kg) Not reported Not reported
Height 164 ± 5.4 167 ± 6.6
McCrory et al (RCT) Diet Diet &
exercise Control
Pre-pregnancy weight (kg) 67.3 ± 14.0 64.9 ±14.2 66.4 ± 8.7
Start of intervention 8 – 16 weeks 8 – 16 weeks
Duration of intervention (follow-
up) 11 days 11 days
Nature of intervention Diet Diet and
exercise None
Weight gained during pregnancy
(kg) 15.2 ± 5.0 16.1 ± 4.8 16.4 ± 6.0
Weight lost by six months (kg) Not reported Not reported Not reported
Weight at end of study (kg) 66.4 ± 9.8 67.8 ± 12.7 68.3 ± 8.6
Infant birth weight (kg) 3.58 ± 0.53 3.54 ± 0.49 3.52 ± 0.41
Height 165.0 ±
10.01 164.6 ± 7.7 166.5 ± 7.1

The cost-effectiveness of weight management interventions following childbirth
14
Structure of the model
All of the comparative effectiveness studies investigated short term outcomes of
weight management intervention. Weight gain after pregnancy however has a lifelong
impact on both economic and effectiveness outcomes. A model is used to
extrapolate short term outcomes over a longer time horizon. Searches were
undertaken to identify evidence upon which to base this extrapolation.
The model is based on a study undertaken by Rooney et al. (2005). The objective of
the Rooney study was to estimate the impact of perinatal weight on obesity-related
diseases. 484 women in the US (Wisconsin) were available for a 15-year follow-up.
The dependent variable was weight gain from first prenatal visit to follow-up after 15
years. Key variables included in this observational study were marital status, weight
gain during pregnancy, duration of breastfeeding, BMI at the index birth (pre-
pregnancy), retained pregnancy weight at 6 months and aerobic exercise
participation after childbirth. The multivariable model used to predict weight gain after
15 years is presented in Table 3.
Table 3: Multivariable model 15-year body weight change (kg), Rooney (2005)
Characteristic Regression Coefficient 95% CI
Y axis intercept -2.00 (-6.11 to 2.10)
Marital Status at index birth (pre-pregnancy)
Single 3.36 (0.13 to 6.60)
Married Reference category
Gestational weight gain categories
Less than recommended 0.43 (-1.87 to 2.73)
Recommended Reference category
More than recommended 4.19 (1.88 to 6.51)
Weight loss by six months
Lost weight gained in pregnancy Reference category
Retained weight gained in pregnancy 5.44 (3.34 to 7.55)
Duration of breast feeding
Did not breast feed 2.02 (-0.22 to 4.26)
Breast fed for between 2 and 12 weeks 2.44 (0.01 to 4.87)
Breast fed beyond 12 weeks Reference category
Postpartum participation in aerobic exercise
Yes Reference category
No 2.59 (0.21 to 4.97)
BMI at birth (pre-pregnancy)
Underweight Reference category
Normal weight 1.83 (-1.20 to 4.85)
Overweight 4.76 (1.24 to 8.29)
Obese 8.31 (4.12 to 12.49)
R2
0.167

The cost-effectiveness of weight management interventions following childbirth
15
Figure 2 shows the economic model structure. This model could be used as an
indicator of obesity in mother at midlife.
Figure 2: Model structure
The classifications used in the model are based on the American Institute of
Medicine (IOM) re-examined guidelines (Rasmussen and Yaktine, 2009) on weight
management in pregnancy (Table 4).
Table 4: IOM recommendations for Weight Gain During Pregnancy
Weight Category BMI (kg/m2)
Recommended Total Weight Gain (kg)
Underweight < 18.5 12.5 - 18.0
Normal weight 18.5 - 24.9 11.5 - 16.0
Overweight 25.0 - 29.9 7.0 - 11.5
Obese 30 5.0 - 9.0
This model links the outcomes reported by Lovelady et al. (2006) effectiveness study
with the multivariable model developed by Rooney et al. (2005). The Lovelady study
was selected because it is the only one that reports short term outcomes that match
the inputs needed by the Rooney and a statistically significant difference between the
intervention and control group weight change (Appendix 2) at a baseline of 4 to 6
weeks postpartum. Dewey et al. (1994) reported not statistically significant difference
between the intervention and control arms. Leermakers et al. (1998) recruited women
who were between 3 to 12 months postpartum and therefore the effectiveness is not
suitable for the model. The RCT conducted by O‟Toole et al. (2003) recruited women
Pre-pregnancy BMI
Weight gain during pregnancy
Weight index at birth
Lifestyle changes
Intervention
Weight change at 6 months
Weight change at 15 years
Long Term
Overweight
Obese

The cost-effectiveness of weight management interventions following childbirth
16
who had given birth in the past 6 weeks to 6 months postpartum making unsuitable to
include the intervention‟s effectiveness in the economic model. McCrory et al. (1999)
conducted an 11-day follow up after baseline consequently the effectiveness of the
intervention on longer term cannot be concluded.
Pre-Pregnancy Body Mass Index.
The mean pre-pregnancy BMI in the control and experimental groups of the Lovelady
trial were estimated from the reported pre-pregnancy weight and height (Lovelady,
2001), the standard error on pre-pregnancy BMI being assumed to be the same as
that at baseline measurement, i.e. at 4-6 weeks postpartum. The mean pre-
pregnancy BMI for women in the experimental and control groups respectively are
thus estimated as 24.75 kg/m2 (se 0.8) and 25.96 kg/m2 (se 0.7). It should be noted
that the mean BMIs are either side of the threshold for the „normal‟ and „overweight‟
BMI categories, given in Table 4.
To determine the proportions of each trial arm population in each BMI category it was
assumed that BMI was normally distributed according to the above sample
characteristics. In order to facilitate the probabilistic sensitivity analysis a Dirichlet
distribution, with continuity correction, was assumed for the proportion in each BMI
category.
Gestational Weight Gain.
Gestational weight gain was reported in the trial paper Lovelady et al. (2001) in order
to facilitate extrapolation of the trial results to BMI 15 years post-partum. Gestational
weight gain is categorised into „less than recommended‟, „recommended‟ or „more
than recommended‟ according to the pre-pregnancy BMI specific IOM guidelines
detailed in Table 4.
In order to estimate the proportions of women in each category gestational weight
gain was assumed to be normally distributed. A Dirichlet distribution was used to
facilitate probabilistic sensitivity analysis of the proportion of women in each
gestational weight gain category.
Weight Loss in the Initial Six Months Postpartum.
In order to estimate the proportion of women who would return to pre-pregnancy
weight within 6 months of childbirth, it was assumed that the rate of weight loss in the
ten weeks of the trial period would be maintained to twenty six weeks postpartum. A

The cost-effectiveness of weight management interventions following childbirth
17
ten week target weight loss was then estimated from the difference between pre-
pregnancy weight and weight at baseline measurement (4-6 weeks post partum) and
the proportion achieving this target was estimated assuming that weight loss was
normally distributed. A beta distribution was used to estimate the proportion
achieving weight loss target in the probabilistic sensitivity analysis.
Time horizon
The model explores the cost and benefits accrued through the measured outcomes
over a 15 years post-partum time horizon and over a lifetime horizon. The shorter
time horizon is reported as there would be considerable structural uncertainties in the
lifetime model associated with the long term extrapolation of outcomes beyond the
evidence used from the Lovelady and Rooney studies. The PSA results will
underestimate the true uncertainty
Perspective
A UK NHS perspective is used. Therefore, production lost through illness or costs
incurred directly by patients are not included. Discount rates of 3.5% per year are
applied to both costs and health benefits, according to current NICE guidelines
(National Institute for Health and Clinical Excellence 2008). Costs are at 2008 prices.
Costs and resources used
The costs of weight management after childbirth interventions are based on resource
use reported by Lovelady (2001) and Lovelady et al (2006). The intervention was
defined by three components: exercise, dietary restriction, and measurements and
examinations. A total cost of doing supervised exercise during 6 months was
estimated to be £6,015. This cost was calculated considering the cost of exercise
supervision plus the travel costs (Table 5). Lovelady (2001) reported a supervised
exercise intervention of 42 minutes, four times a week. This gives an estimated of 59
hours of exercise supervision during 6 months (21 weeks, since the intervention
starts at week 4 after childbirth). Assuming that the cost per hour of exercise
supervision was the same as the cost of a health visitor (£101 per hour, Table 7)
reported in the Unit costs of health and social care 2008 (Curtis and Netten 2008),
the cost of supervised exercise is £5,959 per 6 months (duration of intervention). For
the travel cost, it was assumed 40 visits in 6 months (Lovelady, 2001) at a travel cost
per visit of £1.40 (Table 7).

The cost-effectiveness of weight management interventions following childbirth
18
Table 5: Cost of supervised exercise (6 months)
Cost of exercise supervision Excl qualification cost
Number of hours 59
Cost per hour[1]
£101.00
Total Cost £5,959.00
Travel Costs
Number of visits 40
Travel cost per visit £1.40
Total Travel cost £56.00
Total cost of exercise supervision £6,015.00
Notes: [1] Assume health visitor (see Table 7).
Table 6 contains the costs of dietary supervision. Energy intake prescription was
determined by subtracting 500 calories from the average of the reported daily
baseline consumption and estimated energy requirements (after adding an extra 630
calories for lactation and using an activity factor of 1.35). Women were prescribed a
diet containing approximately 25% of energy from fat, 20% from protein and 55%
from carbohydrate. Although no mention is made in Lovelady et al. (2001) from which
population and intervention details were extracted, a paper by the same authors
(Lovelady 2006) reports that participants were instructed by trained graduate
research assistants to meet their dietary requirements using the food guide pyramid
and that behavioural modification strategies were discussed at individual weekly
sessions. We have assumed that participants have an initial individual dietary
counselling session of 60 minutes duration and follow up sessions every week of 15
minutes duration (Table 6).
Table 6: Cost of dietary supervision (6 months)
Cost of dietary supervision Excl qualification cost
Number of hours 6
Cost per hour[2]
£51.00
Total Cost £306.00
Travel Costs
Number of visits 22
Travel cost per visit £2.60
Total Travel cost £57.20
Total cost of dietary supervision £363.20
Notes: [2] Assume dietitian (see Table 7).

The cost-effectiveness of weight management interventions following childbirth
19
Table 7 presents the cost for professions, used to calculate the three cost
components exercise, diet and examination. These costs were taken from the Unit
costs of health and social care 2008 (Curtis and Netten 2008).
Table 7: Unit cost of health and social health used in the ScHARR model taken from Curtis and Netten 2008
Profession
Cost per hour spent on home
visit
Travel Cost
Health Visitor £101.00 £1.40
Dietitian £51.00[1]
£2.60
Notes
[1] Per hour of client contact
[2] Per hour of face to face contact
The cost of examination was calculated using the results present by Lovelady (2006).
Although it would not be necessary for women using this programme to undergo the
amount of measurement and testing that women in the trial experienced, some initial
measurements would be necessary to determine the participants‟ heart rate reserve
(necessary for the exercise programme) and the baseline diet. It would be expected
that continued measurements of weight would be carried out by the woman herself or
by heath visitors during the exercise supervision visits. Measurement and
Examination cost: £250. Therefore, the total cost for the diet and exercise
intervention modelled was £6,628 per 6 months.
Utilities
The quality adjusted life years accrued by a woman following childbirth are calculated
by determining the time after childbirth at which a woman enters and leaves the
different BMI categories (underweight, normal weight, overweight and obese). The
relationship between BMI and quality of life was obtained from a study conducted at
the Centre for Health Economics, University of York (Macran 2004). This study
explored the relationship between health-related quality of life (HRQoL) and BMI for
men and women within the 1996 Health Survey for England where HRQoL was
measured using EQ-5D. Table 8 presents mean utility scores by BMI and age group
for women (Macran 2004).

The cost-effectiveness of weight management interventions following childbirth
20
Table 8: Utility score (standard deviation) and sample size for women according to BMI and age (adapted from Macran).
Age <21 kg/m2 21 – 25 kg/m2 26 – 30 kg/m2 31 – 39 kg/m2 >39 kg/m2
18 – 24 years
0.90 (0.16) N = 112
0.90 (0.16) N = 341
0.90 (0.16) N = 116
0.88 (0.21) N = 48
0.93 (0.11) N = 8
25 – 34 years
0.88 (0.21) N = 116
0.92 (0.15) N = 607
0.91 (0.16) N = 295
0.88 (0.19) N = 153
0.90 (0.14) N = 22
35 – 44 years
0.89 (0.18) N = 85
0.89 (0.18) N = 591
0.86 (0.20) N = 308
0.82 (0.25) N = 176
0.81 (0.20) N = 22
45 – 54 years
0.89 (0.13) N = 44
0.86 (0.19) N = 473
0.83 (0.23) N = 403
0.83 (0.23) 186
0.76 (0.27) N = 22
55 – 64 years
0.76 (0.27) N = 35
0.83 (0.22) N = 264
0.78 (0.27) N = 322
0.74 (0.30) N = 190
0.54 (0.38) N = 18
65 – 74 years
0.79 (0.22) N = 52
0.82 (0.21) N = 242
0.76 (0.25) N = 324
0.71 (0.28) N = 172
0.68 (0.21) N = 18
75+ years 0.64 (0.31) N = 42
0.76 (0.23) N = 212
0.73 (0.26) N = 227
0.68 (0.31) N = 115
0.53 (0.28) N = 5
The BMI at six months postpartum and the BMI at fifteen years postpartum were
obtained from the specification of the trial population and the regression model
respectively. These BMI are used to determine the time it will take women to become
overweight and obese. Women received a utility score for each year there were in a
specific age and BMI category (Table 8).
Since BMI cannot be considered to continue to increase indefinitely and no evidence
was available regarding the change in BMI following the initial 15 years postpartum it
was assumed that the women remain in the same BMI category obtained at 15 years
following the birth of the index child.
Mortality
BMI specific survival rates were obtained from a collaborative analysis of 57
prospective studies with 894,576 participants, mostly in Western Europe and North
America (Prospective Studies Collaboration 2009). The aim of the study was to find
the associations of BMI with overall and cause-specific mortality. It was found that
BMI is a strong predictor of overall mortality. Figure 3 shows the survival rates for
females used in the model according to the different BMI ranges (normal, overweight
and obese). The excess mortality above a normal BMI (18.5-25 kg/m2) is due to
vascular disease, diabetes, renal and hepatic diseases.

The cost-effectiveness of weight management interventions following childbirth
21
Figure 3: BMI versus lifespan for females in Western Europe adapted from Prospective Studies Collaboration 2009
0.00
0.10
0.20
0.30
0.40
0.50
0.60
0.70
0.80
0.90
1.00
0 10 20 30 40 50 60 70 80 90 100
Age (years)
Ali
ve
Normal BMI
Overweight
BMIObese BMI
Cost-effectiveness Ratios
Incremental cost-effectiveness ratios (ICER) measure the additional cost per quality-
adjusted life-year QALY gained of Treatment A versus Treatment B:
BTreatment from QALYs -ATreatment from QALYs
BTreatment Cost -A Treatment Cost ICER
Sensitivity analysis
Comprehensive sensitivity analyses were undertaken to explore the joint uncertainty
in model parameters on the economic evaluation of the intervention (Appendix 3).
Monte Carlo sampling techniques (10,000 samples) were used to generate
information on the probability that weight management interventions are optimal in
terms of amount of net benefit. Since the regression considers whether the mothers
exercise post-partum or not, data from the Active People Survey conducted by Sport
England were considered. This survey took place between October 2007 and
October 2008 and interviewed 191,000 adults in England (age 16+) by telephone. It
was decided to consider Key Performance Indicator 1 - Participation is defined as
taking part on at least 3 days a week in moderate intensity sport and active
recreation (at least 12 days in the last 4 weeks) for at least 30 minutes continuously

The cost-effectiveness of weight management interventions following childbirth
22
in any one session. Participation includes recreational walking and cycling. The
proportion of women between 30 and 44 years who participated in exercise was
estimated to be 20%. This proportion was included in the model when running the
probabilistic sensitivity analysis (PSA).
6. Results
Results for the effectiveness reported by Lovelady (2001) are modelled in this
assessment and are presented in this section. Initially, the model was run to calculate
the weight change in the mother after 15 years. The factors that have an impact in
the weight change are pre-pregnancy BMI, weight gain during pregnancy, breast-
feeding, post-partum exercise participation and pre-pregnancy marital status. The
model was also run for a lifetime horizon. The results were based on a start age of
the population of 25 years and are presented in discounted incremental values.
Table 9: Results at 15 years and lifetime
Time Horizon Discounted QALYs (95% CI) ICER (£/QALY) (95% CI)
15 years 0.1503 (-0.0267, 0.4168) £44,144 (£15,000, dominated)
Lifetime 0.7296 (0.1565, 1.5108) £9,096 (£4,000, dominated)
From Table 9, it can be seen that at 15 years after childbirth the ICER is above
£30,000 per QALY gained while for a lifetime horizon the ICER is below £20,000.
This is due to the impact of being obese as opposed to being overweight has.
The results of the probabilistic sensitivity analyses are presented as scatter plots of
incremental cost and incremental QALYs for the 15-year and lifetime horizons
respectively.

The cost-effectiveness of weight management interventions following childbirth
23
Figure 4: Scatter plot of incremental QALYs and incremental costs for 15-year and lifetime horizons
Cost-effectiveness plane
-£10,000
£0
£10,000
£20,000
£30,000
£40,000
£50,000
£60,000
-3 -2 -1 0 1 2 3
Incremental QALYs
Incre
menta
l C
osts
Lifetime horizon
£25,000 per QALY
15yr QALY
Figure 4 shows that for some cases the QALYs gained by the control group are
bigger that the QALYs gained by the intervention group. In these cases the
intervention is dominated by usual postnatal care. This means that usual postnatal
care accrues more benefits (in the long run) that the dietary and exercise
interventions. This can be due to the BMI category the mother is after six months of
childbirth.
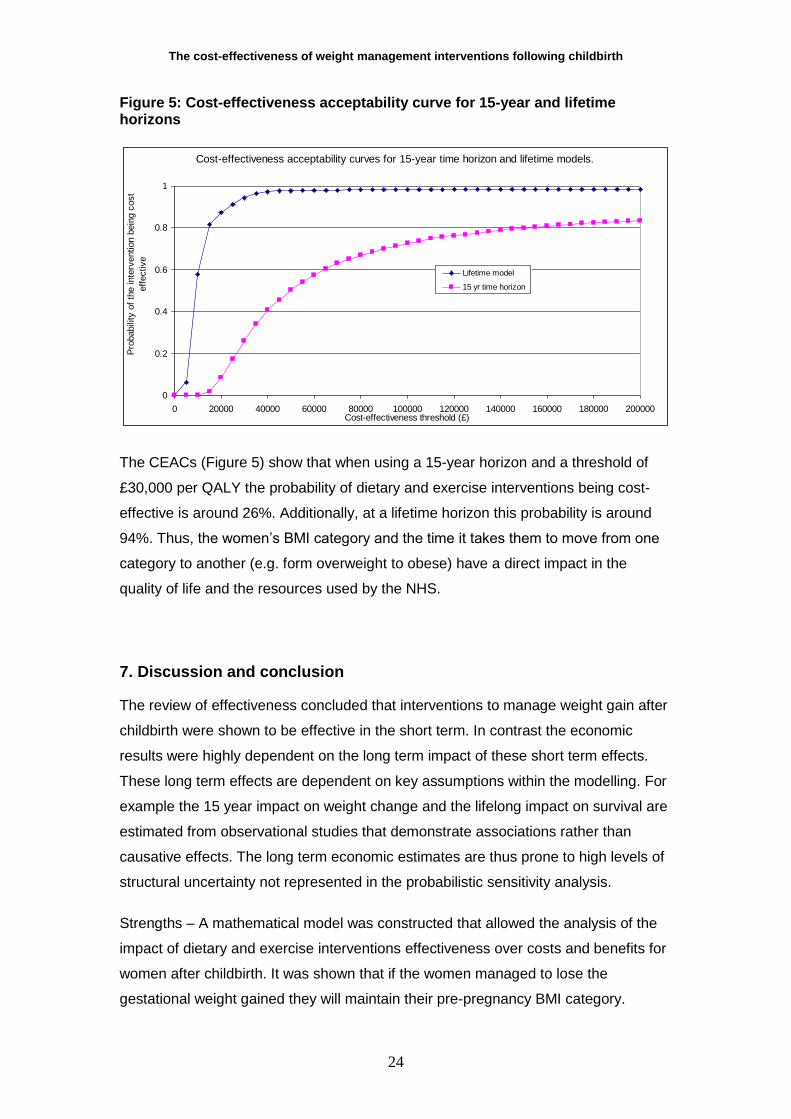
Figure 5 shows incremental cost-effectiveness curves (CEACs) for the 15-year and
lifetime horizons evaluated in the economic model. The net benefit of the dietary and
exercise interventions are compared incrementally and the CEACs show the
probability that the intervention will results in the greatest net benefit at a specific
cost-effectiveness threshold ( ). The net benefit is calculated as:
Net benefit = ( Incremental QALYs) – Cost of dietary and exercise intervention
The cost-effectiveness of weight management interventions following childbirth
24
Figure 5: Cost-effectiveness acceptability curve for 15-year and lifetime horizons
Cost-effectiveness acceptability curves for 15-year time horizon and lifetime models.
0
0.2
0.4
0.6
0.8
1
0 20000 40000 60000 80000 100000 120000 140000 160000 180000 200000Cost-effectiveness threshold (£)
Pro
babili
ty o
f th
e inte
rvention b
ein
g c
ost-
eff
ective
Lifetime model
15 yr time horizon
The CEACs (Figure 5) show that when using a 15-year horizon and a threshold of
£30,000 per QALY the probability of dietary and exercise interventions being cost-
effective is around 26%. Additionally, at a lifetime horizon this probability is around
94%. Thus, the women‟s BMI category and the time it takes them to move from one
category to another (e.g. form overweight to obese) have a direct impact in the
quality of life and the resources used by the NHS.
7. Discussion and conclusion
The review of effectiveness concluded that interventions to manage weight gain after
childbirth were shown to be effective in the short term. In contrast the economic
results were highly dependent on the long term impact of these short term effects.
These long term effects are dependent on key assumptions within the modelling. For
example the 15 year impact on weight change and the lifelong impact on survival are
estimated from observational studies that demonstrate associations rather than
causative effects. The long term economic estimates are thus prone to high levels of
structural uncertainty not represented in the probabilistic sensitivity analysis.
Strengths – A mathematical model was constructed that allowed the analysis of the
impact of dietary and exercise interventions effectiveness over costs and benefits for
women after childbirth. It was shown that if the women managed to lose the
gestational weight gained they will maintain their pre-pregnancy BMI category.
The cost-effectiveness of weight management interventions following childbirth
25
Limitations – This model is limited by the quality of the evidence used to inform it.
The majority of the effectiveness evidence is based in the US; therefore, it is unclear
whether it is possible to generalise evidence from this population to women within the
UK.
The model uses a single study from the set of trials reviewed in the effectiveness
review. This study appears to give weight loss results broadly in line with the whole
evidence base on effectiveness and was quality assessed as (+). This being said it
should be noted that this was a small study (22 women) and the control group had
already lost more weight (equivalent to half of the total weight loss in the study
period) between childbirth and the start of the intervention than the intervention
group.
The cost effectiveness results suggest that dietary and exercise interventions for
weight management after childbirth have the potential to be cost effective depending
on the ability to maintain the short term impacts of the interventions into the longer
term. These interventions have the potential to influence long term health outcomes
such as overweight and obesity rates which will have a direct impact in other
diseases such as diabetes, cancer, vascular, renal and hepatic diseases.
Studies examining interventions in weight management after childbirth are required in
a UK population. Future research in interventions to managing weight gain after
childbirth should ensure that follow up is sufficient to demonstrate health and
economic advantages. Where trials are designed to collect short term surrogate
outcomes the relationship between these and long term final health outcomes should
be explicit and quantifiable. Observation studies in a UK population are required to
assist in determining long term effects of interventions in this area.
Separate economic models were constructed for weight management during
pregnancy (WMIP) and weight management after childbirth (WMAC), this was
because of differences in the structure of the underlying decision problems and
differences in the interventions being considered. The models have been designed to
be as consistent as possible given the constraints of the guidance development
process. The model for WMIP was essentially a short-term model whilst the model
for WMAC, presented in this report, gives a fuller consideration to long-term effects.
The WMIP model included only long-term effects and cost savings associated with

The cost-effectiveness of weight management interventions following childbirth
26
type II diabetes subsequent to gestational diabetes, whilst the WMAC model included
costs and effects (including both morbidity and mortality effects) of BMI changes over
15 years following pregnancy. Longer effects beyond 15 years after birth have not
been included in the model. Whilst the cumulative impact of weight gain through
subsequent pregnancies will have been captured in the model through the use of the
15 year cohort study the impact on costs and in pregnancy outcomes will not be
included. These omissions would lead the economic estimates in this report to
underestimate cost effectiveness.

The cost-effectiveness of weight management interventions following childbirth
27
8. References
Albright, C. L., Maddock, J. E., Nigg, C. R. 2009, "Increasing physical activity in postpartum multiethnic women in Hawaii: results from a pilot study", BMC Women's Health, vol. 9, p. 4. Dewey, K. G., Lovelady, C. A., Nommsen-Rivers, L. A., McCrory, M. A., & Lonnerdal, B. 1994, "A randomized study of the effects of aerobic exercise by lactating women on breast-milk volume and composition", New England Journal of Medicine, vol. 330, no. 7, pp. 449-453. Gore, S. A., Brown, D. M., & West, D. S. 2003, "The role of postpartum weight retention in obesity among women: A review of the evidence", Annals of Behavioral Medicine, vol. 26, no. 2, pp. 149-159.
Kinnunen, T. I., Pasanen, M., Aittasalo, M., Fogelholm, M., Weiderpass, E., & Luoto, R. 2007, "Reducing postpartum weight retention--a pilot trial in primary health care", Nutrition Journal, vol. 6, p. 21. Leermakers, E. A., Anglin, K., & Wing, R. R. 1998, "Reducing postpartum weight retention through a correspondence intervention", International Journal of Obesity & Related Metabolic Disorders: Journal of the International Association for the Study of Obesity, vol. 22, no. 11, pp. 1103-1109. Lovelady, C. A., Williams, J. P., Garner, K. E., Moreno, K. L., Taylor, M. L., & Leklem, J. E. 2001, "Effect of energy restriction and exercise on vitamin B-6 status of women during lactation", Medicine & Science in Sports & Exercise, vol. 33, no. 4, pp. 512-518. Lovelady, C. A., Garner, K. E., Moreno, K. L., & Williams, J. P. 2000, "The effect of weight loss in overweight, lactating women on the growth of their infants. New England, ”Journal of Medicine, vol. 342, no. 7, pp. 449-453. Lovelady, C. A., Stephenson, K. G., Kuppler, K. M., Williams, J. P. 2006, "The effects of dieting on food and nutrient intake of lactating women", Journal of the American Dietetic Association, vol. 106, no. 6, pp. 908-912. McCrory, M. A., Nommsen-Rivers, L. A., Mole, P. A., Lonnerdal, B., Dewey, K. G. 1999, "Randomized trial of the short-term effects of dieting compared with dieting plus aerobic exercise on lactation performance", American Journal of Clinical Nutrition, vol. 69, no. 5, pp. 959-967. NICE Guide to the methods of Technology Appraisal (reference No.515). NICE 2008. O'Toole, M. L., Sawicki, M. A., & Artal, R. 2003, "Structured diet and physical activity prevent postpartum weight retention", Journal of Women's Health, vol. 12, no. 10, pp. 991-998. Prospective Studies Collaboration 2009, “Body-mass index and cause-specific mortality in 900 000 adults: collaborative analyses of 57 prospective studies”, The Lancet, vol. 373, no. 9669, pp. 1083-1096. Rasmussen, K.M. and Yaktine A.L. (Eds) 2009, “Weight Gain during Pregnancy: Re-examining the Guidelines”. Committee to Reexamine IOM Pregnancy Weight Guidelines Food and Nutrition Board and Board on Children, Youth, and Families, Institute of Medicine and National Research Council of the National Academies. Rooney, B.L., Schauberger, C.W., & Mathiason, M.A. 2005, “Impact of perinatal weight change on long term obesity and obesity-related illnesses”, Obstetrics & Gynecology, vol 106, no. 6, pp 1349-1356. Curtis, L and Netten, A. Unit Costs of Health and Social Care. PSSRU 2008.

The cost-effectiveness of weight management interventions following childbirth
28
9. Appendices
Appendix 1: Search Strategies
Searches for evidence for the cost effectiveness review and economic model List of terms 1 (post natal or postnatal).ti. 2 (post pregnancy or postpregnancy).ti. 3 ((Post or after or following) adj birth).ti. 4 (postpartum or post partum).ti. 5 obes*.ti. 6 weight gain*.ti. 7 weight change.ti. 8 weight loss.ti. 9 body mass index.ti. 10 bmi.ti. 11 10 or 6 or 1 or 9 or 4 or 3 or 7 or 2 or 5 or 8 12 (child* or adolescen*).ti. 13 11 not 12 List of databases Econlit via OVID SP NHS EED via Cochrane Library via Wiley

The cost-effectiveness of weight management interventions following childbirth
29
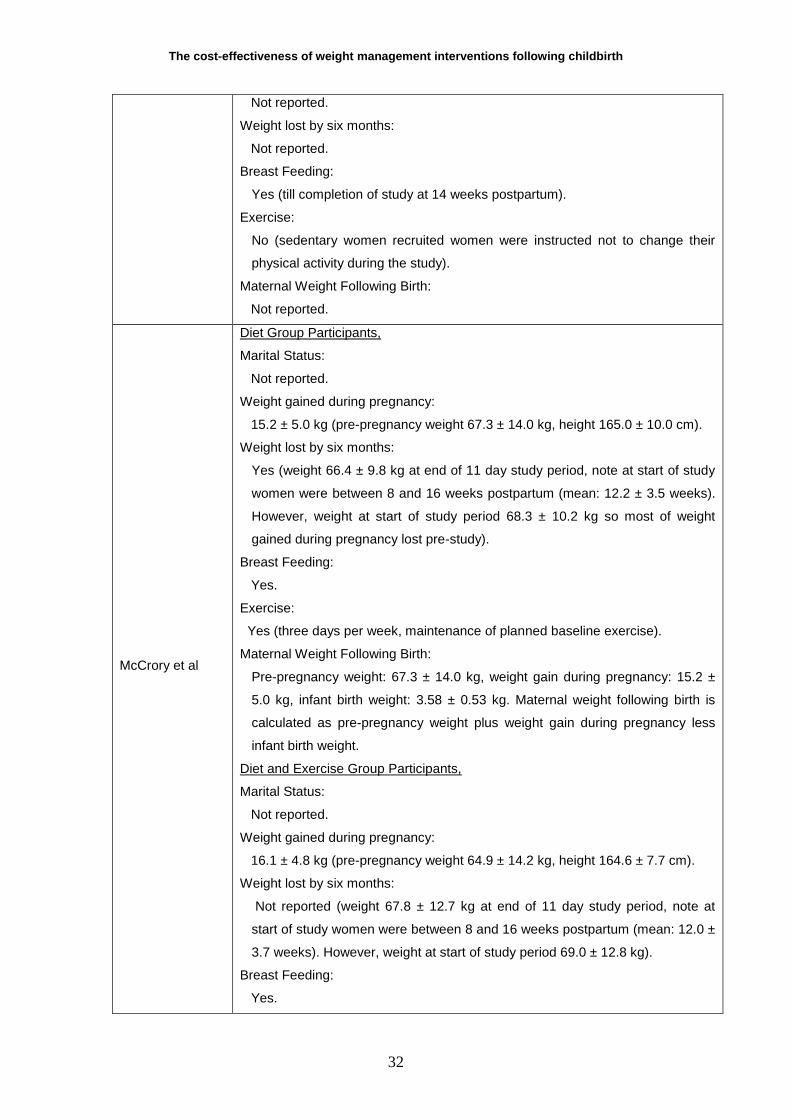
Appendix 2: Included studies
Paper Characteristics of Trial Required to Extrapolate Post-Pregnancy Weight Gain.
Dewey et al
Exercise Group Participants.
Marital Status:
Not reported.
Weight gained during pregnancy:
15.2 ± 5.3 kg (pre-pregnancy weight 61.3 ± 6.5 kg, height 163.2 ± 6.9 cm).
Weight lost by six months:
Not reported (weight 65.7 ± 10.7 kg at end of study, 18 to 20 weeks
postpartum).
Breast Feeding:
All participants planned to breast feed their infant for at least 20 weeks.
Exercise:
Yes (structured as part of the intervention).
Maternal Weight Following Birth:
Pre-pregnancy weight: 61.3 ± 6.5 kg, weight gain during pregnancy: 15.2 ± 5.3
kg, infant birth weight: 3.66 ± 0.36 kg. Maternal weight following birth is
calculated as pre-pregnancy weight plus weight gain during pregnancy less
infant birth weight.
Control Group Participants.
Marital Status:
Not reported.
Weight gained during pregnancy:
17.5 ± 5.4 kg (pre-pregnancy weight 61.6 ± 6.5 kg, height 167.6 ± 6.5 cm).
Weight lost by six months:
Not reported (weight 65.4 ± 8.3 kg at end of study, 18 to 20 weeks
postpartum).
Breast Feeding:
All participants planned to breast feed their infant for at least 20 weeks.
Exercise:
No (did not engage in aerobic exercise more than once per week during the
period of the intervention).
Maternal Weight Following Birth:
Pre-pregnancy weight: 61.6 ± 6.5 kg, weight gain during pregnancy: 17.5 ± 5.4
kg, infant birth weight: 3.89 ± 0.54 kg. Maternal weight following birth is
calculated as pre-pregnancy weight plus weight gain during pregnancy less
infant birth weight.

The cost-effectiveness of weight management interventions following childbirth
30
Leermakers et al
Correspondence Behavioural Weight Loss Programme Participants.
Marital Status:
93.5% married, 2.2% single, 4.3% separated or divorced.
Percentage of subjects who exceeded IOM weight gain recommendations:
64%. (pregnancy weight gain: 17.5 ± 5.7 kg).
Weight lost by six months:
No (7.8 ± 4.5 kg lost at end of six month study period, note at start of study
women were between three and twelve months postpartum (mean: 8.3 ± 2.2
months). Retained weight at start of study 11.0 ± 4.2 kg).
Breast Feeding:
Lactating participants were excluded from the study.
Exercise:
Yes (encouraged as part of the intervention).
Maternal Weight Following Birth:
Not reported.
Non Treatment Control Condition Participants.
Marital Status:
79.1% married, 20.9% single, 0% separated or divorced.
Percentage of subjects who exceeded IOM weight gain recommendations:
77%. (pregnancy weight gain: 19.8 ± 6.7 kg).
Weight lost by six months:
No (4.9 ± 5.4 kg lost at end of six month study period, note at start of study
women were between three and twelve months postpartum (mean: 8.5 ± 2.1
months). Retained weight at start of study 11.3 ± 3.7 kg).
Breast Feeding:
Lactating participants were excluded from the study.
Exercise:
Not reported.
Maternal Weight Following Birth:
Not reported.
Lovelady et al
Experimental Group Participants,
Marital Status:
Not reported.
Weight gained during pregnancy:
15.5 ± 1.0 kg (pre-pregnancy weight 68.6 ± 2.3 kg, height 166.5 ± 1.9 cm).
Weight lost by six months:
Not reported (4.4 ± 0.4 kg lost at end of study, 14 weeks postpartum).
Breast Feeding:
Yes (duration not reported).
Exercise:

The cost-effectiveness of weight management interventions following childbirth
31
Yes (structured as part of the intervention).
Maternal Weight Following Birth:
Pre-pregnancy weight: 68.6 ± 2.3 kg, weight gain during pregnancy: 15.5 ± 1.0
kg, infant birth weight: 3.61 ± 0.21 kg. Maternal weight following birth is
calculated as pre-pregnancy weight plus weight gain during pregnancy less
infant birth weight.
Control Group Participants,
Marital Status:
Not reported.
Weight gained during pregnancy:
14.8 ± 1.3 kg (pre-pregnancy weight 70.5 ± 2.9 kg, height 164.8 ± 1.3 cm).
Weight lost by six months:
Not reported (0.9 ± 0.5 kg lost at end of study, 14 weeks postpartum).
Breast Feeding:
Yes (duration not reported).
Exercise:
Did not engage in aerobic exercise more than once per week during the period
of the intervention.
Maternal Weight Following Birth:
Pre-pregnancy weight: 70.5 ± 2.9 kg, weight gain during pregnancy: 14.8 ± 1.3
kg, infant birth weight: 3.51 ± 0.10 kg. Maternal weight following birth is
calculated as pre-pregnancy weight plus weight gain during pregnancy less
infant birth weight.
Lovelady et al
Diet and Exercise Group Participants,
Marital Status:
Not reported.
Weight gained during pregnancy:
Not reported.
Weight lost by six months:
Not reported.
Breast Feeding:
Yes (till completion of study at 14 weeks postpartum).
Exercise:
Yes (structured as part of the intervention).
Maternal Weight Following Birth:
Not reported.
Control Group Participants,
Marital Status:
Not reported.
Weight gained during pregnancy:
The cost-effectiveness of weight management interventions following childbirth
32
Not reported.
Weight lost by six months:
Not reported.
Breast Feeding:
Yes (till completion of study at 14 weeks postpartum).
Exercise:
No (sedentary women recruited women were instructed not to change their
physical activity during the study).
Maternal Weight Following Birth:
Not reported.
McCrory et al
Diet Group Participants,
Marital Status:
Not reported.
Weight gained during pregnancy:
15.2 ± 5.0 kg (pre-pregnancy weight 67.3 ± 14.0 kg, height 165.0 ± 10.0 cm).
Weight lost by six months:
Yes (weight 66.4 ± 9.8 kg at end of 11 day study period, note at start of study
women were between 8 and 16 weeks postpartum (mean: 12.2 ± 3.5 weeks).
However, weight at start of study period 68.3 ± 10.2 kg so most of weight
gained during pregnancy lost pre-study).
Breast Feeding:
Yes.
Exercise:
Yes (three days per week, maintenance of planned baseline exercise).
Maternal Weight Following Birth:
Pre-pregnancy weight: 67.3 ± 14.0 kg, weight gain during pregnancy: 15.2 ±
5.0 kg, infant birth weight: 3.58 ± 0.53 kg. Maternal weight following birth is
calculated as pre-pregnancy weight plus weight gain during pregnancy less
infant birth weight.
Diet and Exercise Group Participants,
Marital Status:
Not reported.
Weight gained during pregnancy:
16.1 ± 4.8 kg (pre-pregnancy weight 64.9 ± 14.2 kg, height 164.6 ± 7.7 cm).
Weight lost by six months:
Not reported (weight 67.8 ± 12.7 kg at end of 11 day study period, note at
start of study women were between 8 and 16 weeks postpartum (mean: 12.0 ±
3.7 weeks). However, weight at start of study period 69.0 ± 12.8 kg).
Breast Feeding:
Yes.

The cost-effectiveness of weight management interventions following childbirth
33
Exercise:
Yes (structured as part of the intervention).
Maternal Weight Following Birth:
Pre-pregnancy weight: 64.9 ± 14.2 kg, weight gain during pregnancy: 16.1 ±
4.8 kg, infant birth weight: 3.54 ± 0.49 kg. Maternal weight following birth is
calculated as pre-pregnancy weight plus weight gain during pregnancy less
infant birth weight.
Control Group Participants,
Marital Status:
Not reported.
Weight gained during pregnancy:
16.1 ± 6.0 kg (pre-pregnancy weight 66.4 ± 8.7 kg, height 166.5 ± 7.1 cm).
Weight lost by six months:
Not reported (weight 68.3 ± 8.6 kg at end of 11 day study period, note at start
of study women were between 8 and 16 weeks postpartum (mean: 12.6 ± 3.7
weeks). However, weight at start of study period 68.5 ± 8.5 kg).
Breast Feeding:
Yes.
Exercise:
Yes (three days per week, maintenance of planned baseline exercise).
Maternal Weight Following Birth:
Pre-pregnancy weight: 66.4 ± 8.7 kg, weight gain during pregnancy: 16.4 ± 6.0
kg, infant birth weight: 3.52 ± 0.41 kg. Maternal weight following birth is
calculated as pre-pregnancy weight plus weight gain during pregnancy less
infant birth weight.
O‟Toole et al
Structured Diet and Physical Activity Programme Participants,
Marital Status:
Not reported.
Weight gained during pregnancy:
All study participants gained more than 15 kg during pregnancy otherwise not
reported).
Weight lost by six months:
No (reported that at start of intervention all study participants were more than 5
kg heavier than pre-pregnancy weight at baseline 85.4 ± 3.5 kg, weight at 12
weeks 84.8 ± 4.2 kg, weight at one year 84.1 ± 4.3 kg).
Breast Feeding:
Breastfeeding women were not excluded, otherwise not reported.
Exercise:
Yes (structured as part of the intervention).
Maternal Weight Following Birth:

The cost-effectiveness of weight management interventions following childbirth
34
Not reported.
Self Directed Programme Participants,
Marital Status:
Not reported.
Weight gained during pregnancy:
All study participants gained more than 15 kg during pregnancy otherwise not
reported).
Weight lost by six months:
Not explicitly reported (however reported that at start of intervention all study
participants were more than 5 kg heavier than pre-pregnancy, weight at
baseline 78.6 ± 1.6 kg, weight at 12 weeks 73.0 ± 2.2 kg, weight at one year
71.3 ± 2.2 kg thus a mean participant in the self directed programme would
have lost 5.6 kg by 12 weeks and 7.3 kg by 1 year compared to baseline. Note
however that women were between 6 weeks and 6 months postpartum at start
of study).
Breast Feeding:
Breastfeeding women were not excluded, otherwise not reported.
Exercise:
Not reported.
Maternal Weight Following Birth:
Not reported.
Albright et al
Intervention Group Participants,
Marital Status:
95% married, 5% other marital status
Weight gained during pregnancy:
Not reported.
Weight lost by six months:
Not reported.
Breast Feeding:
Not reported.
Exercise:
Yes (structured as part of intervention).
Maternal Weight Following Birth:
Not reported.
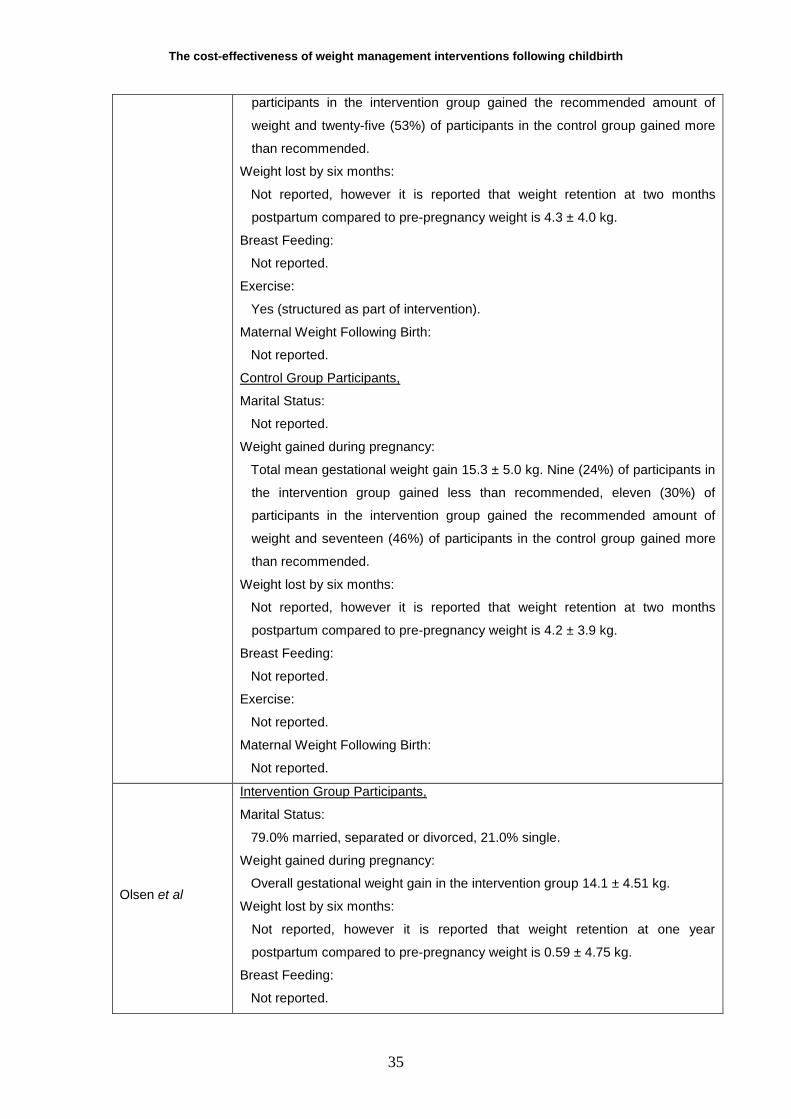
Kinnunen et al
Intervention Group Participants,
Marital Status:
Not reported.
Weight gained during pregnancy:
Total mean gestational weight gain 16.2 ± 5.0 kg. Nine (19%) of participants in
the intervention group gained less than recommended, thirteen (28%) of
The cost-effectiveness of weight management interventions following childbirth
35
participants in the intervention group gained the recommended amount of
weight and twenty-five (53%) of participants in the control group gained more
than recommended.
Weight lost by six months:
Not reported, however it is reported that weight retention at two months
postpartum compared to pre-pregnancy weight is 4.3 ± 4.0 kg.
Breast Feeding:
Not reported.
Exercise:
Yes (structured as part of intervention).
Maternal Weight Following Birth:
Not reported.
Control Group Participants,
Marital Status:
Not reported.
Weight gained during pregnancy:
Total mean gestational weight gain 15.3 ± 5.0 kg. Nine (24%) of participants in
the intervention group gained less than recommended, eleven (30%) of
participants in the intervention group gained the recommended amount of
weight and seventeen (46%) of participants in the control group gained more
than recommended.
Weight lost by six months:
Not reported, however it is reported that weight retention at two months
postpartum compared to pre-pregnancy weight is 4.2 ± 3.9 kg.
Breast Feeding:
Not reported.
Exercise:
Not reported.
Maternal Weight Following Birth:
Not reported.
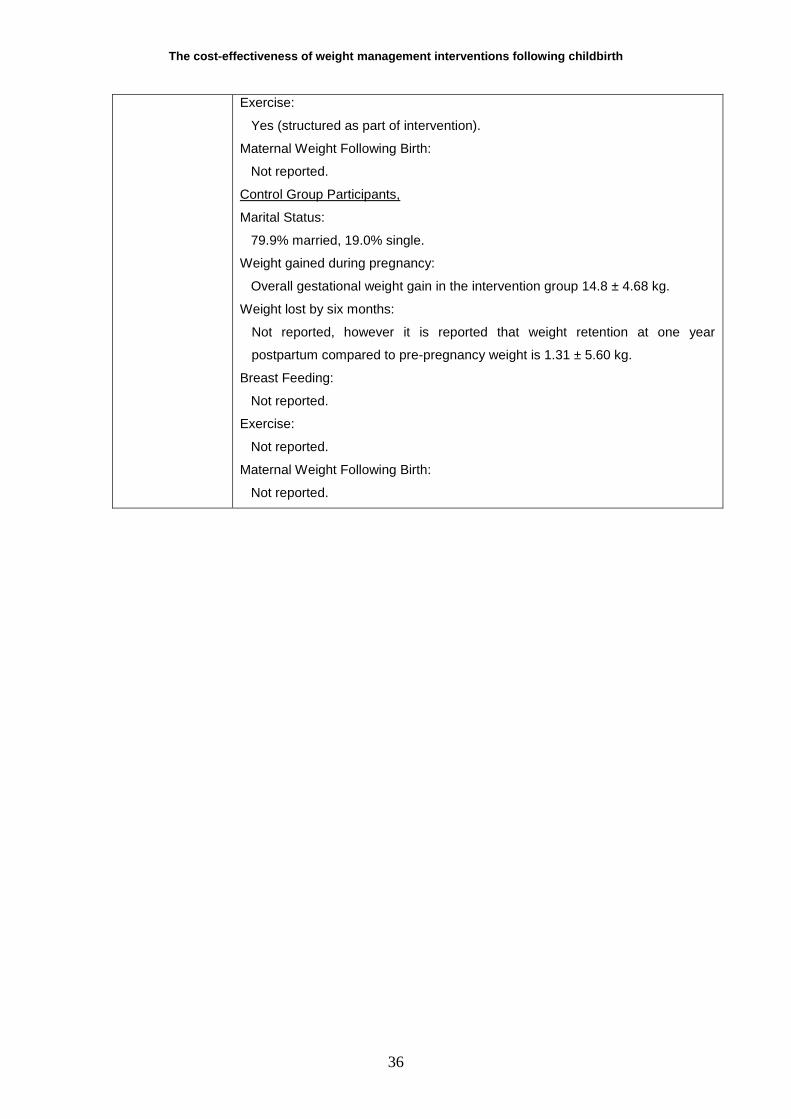
Olsen et al
Intervention Group Participants,
Marital Status:
79.0% married, separated or divorced, 21.0% single.
Weight gained during pregnancy:
Overall gestational weight gain in the intervention group 14.1 ± 4.51 kg.
Weight lost by six months:
Not reported, however it is reported that weight retention at one year
postpartum compared to pre-pregnancy weight is 0.59 ± 4.75 kg.
Breast Feeding:
Not reported.
The cost-effectiveness of weight management interventions following childbirth
36
Exercise:
Yes (structured as part of intervention).
Maternal Weight Following Birth:
Not reported.
Control Group Participants,
Marital Status:
79.9% married, 19.0% single.
Weight gained during pregnancy:
Overall gestational weight gain in the intervention group 14.8 ± 4.68 kg.
Weight lost by six months:
Not reported, however it is reported that weight retention at one year
postpartum compared to pre-pregnancy weight is 1.31 ± 5.60 kg.
Breast Feeding:
Not reported.
Exercise:
Not reported.
Maternal Weight Following Birth:
Not reported.

Appendix 3: Probabilistic sensitivity analysis parameters
Regression model predicting weight gain over 15 years
Characteristic Experimental Group Control Group
Change in body weight at 15 year follow up Change in body weight at 15 year follow up
Y axis intercept -2.00 1.00 -2.00 -2.00 1.00 -2.00
Marital Status Coefficient Selection Value Coefficient Selection Value
Married 0.00 0.00 0.00 0.00 0.00 0.00
Single 3.36 1.00 3.36 3.36 1.00 3.36
Gestational weight gain categories Coefficient Selection Value Coefficient Selection Value
Less than recommended 0.43 0.06 0.03 0.43 0.10 0.04
Recommended 0.00 0.29 0.00 0.00 0.25 0.00
More than recommended 4.19 0.65 2.71 4.19 0.65 2.73
Weight loss by six months Coefficient Selection Value Coefficient Selection Value
Lost weight gained in pregnancy 0.00 0.67 0.00 0.00 0.26 0.00
Retained weight gained in pregnancy 5.44 0.33 1.79 5.44 0.74 4.01
Duration of breast feeding Coefficient Selection Value Coefficient Selection Value
Did not breast feed 2.02 0.00 0.00 2.02 0.00 0.00
Breast fed for between 2 and 12 weeks 2.44 0.00 0.00 2.44 0.00 0.00
Breast fed beyond 12 weeks 0.00 1.00 0.00 0.00 1.00 0.00
Postpartum participation in aerobic exercise Coefficient Selection Value Coefficient Selection Value
Yes 0.00 1.00 0.00 0.00 0.00 0.00
No 2.59 0.00 0.00 2.59 1.00 2.59
Body mass index at birth Coefficient Selection Value Coefficient Selection Value
Underweight 0.00 0.01 0.00 0.00 0.00 0.00
Normal weight 1.83 0.53 0.97 1.83 0.34 0.62
Overweight 4.76 0.44 2.08 4.76 0.62 2.95
Obese 8.31 0.02 0.20 8.31 0.04 0.34
The cost-effectiveness of weight management interventions following childbirth
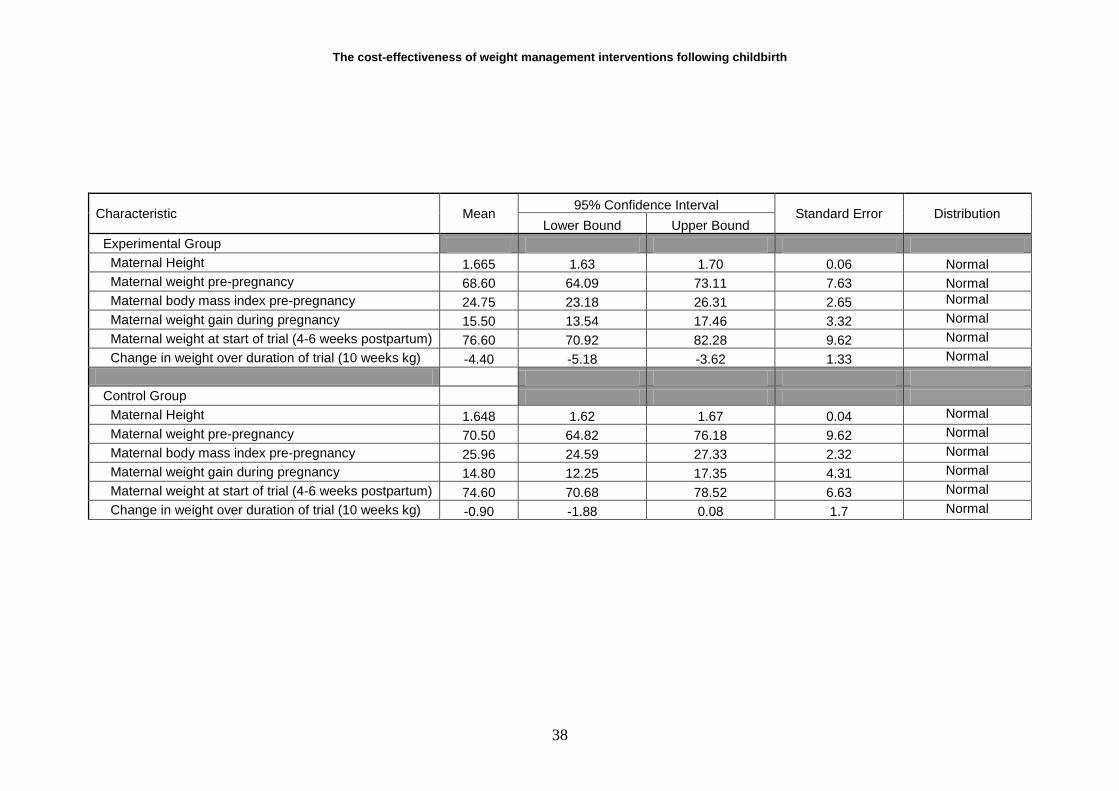
38
Characteristic Mean 95% Confidence Interval
Standard Error Distribution Lower Bound Upper Bound
Experimental Group
Maternal Height 1.665 1.63 1.70 0.06 Normal
Maternal weight pre-pregnancy 68.60 64.09 73.11 7.63 Normal
Maternal body mass index pre-pregnancy 24.75 23.18 26.31 2.65 Normal
Maternal weight gain during pregnancy 15.50 13.54 17.46 3.32 Normal
Maternal weight at start of trial (4-6 weeks postpartum) 76.60 70.92 82.28 9.62 Normal
Change in weight over duration of trial (10 weeks kg) -4.40 -5.18 -3.62 1.33 Normal
Control Group
Maternal Height 1.648 1.62 1.67 0.04 Normal
Maternal weight pre-pregnancy 70.50 64.82 76.18 9.62 Normal
Maternal body mass index pre-pregnancy 25.96 24.59 27.33 2.32 Normal
Maternal weight gain during pregnancy 14.80 12.25 17.35 4.31 Normal
Maternal weight at start of trial (4-6 weeks postpartum) 74.60 70.68 78.52 6.63 Normal
Change in weight over duration of trial (10 weeks kg) -0.90 -1.88 0.08 1.7 Normal

Related Documents