The Consequences of the Russian Transformation on the Third World Satoshi Mizobata Institute of Economic Research, Kyoto University, Japan [email protected] 3-5 April 2007, SU-HSE, Russia

The Consequences of the Russian Transformation on the Third World Satoshi Mizobata Institute of Economic Research, Kyoto University, Japan [email protected].
Dec 19, 2015
Welcome message from author
This document is posted to help you gain knowledge. Please leave a comment to let me know what you think about it! Share it to your friends and learn new things together.
Transcript

The Consequences of the Russian Transformation on the Third World
Satoshi MizobataInstitute of Economic Research, Kyoto
University, [email protected]
3-5 April 2007, SU-HSE, Russia

Aims of the paper
The meaning of the Russian transformation from the experiences of the Third World
The transformation in the Third World compared with the Russian transformation
The transformation in Russia was deeply connected with the changes in the Third World.
The changes of the Third World have Influenced the Russian transformation.
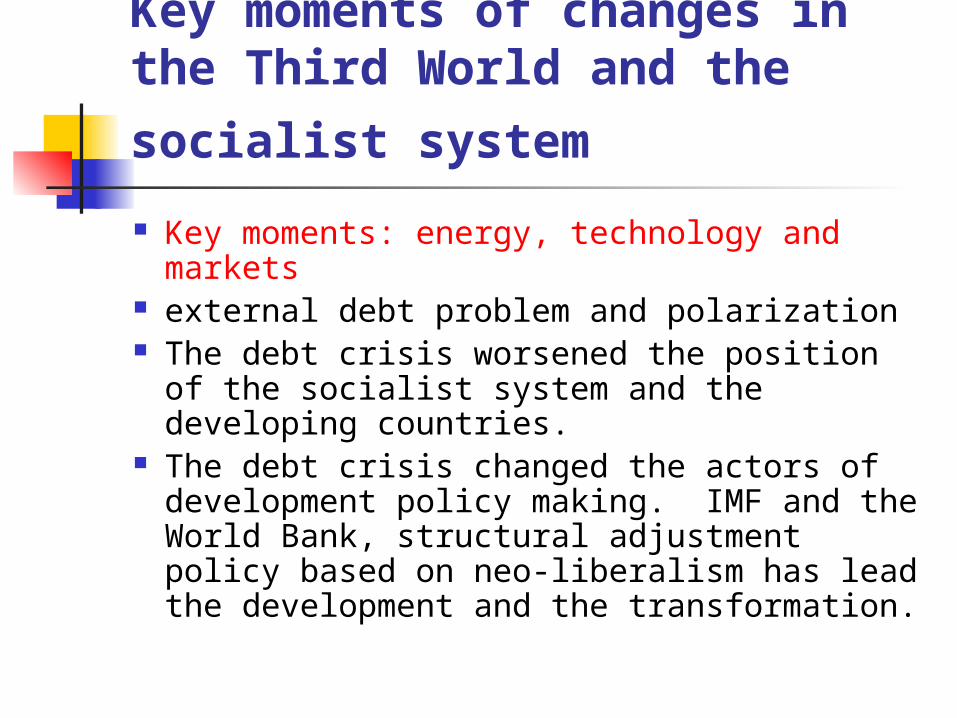
Key moments of changes in the Third
World and the socialist system Key moments: energy, technology and markets external debt problem and polarization The debt crisis worsened the position of the
socialist system and the developing countries. The debt crisis changed the actors of development
policy making. IMF and the World Bank, structural adjustment policy based on neo-liberalism has lead the development and the transformation.
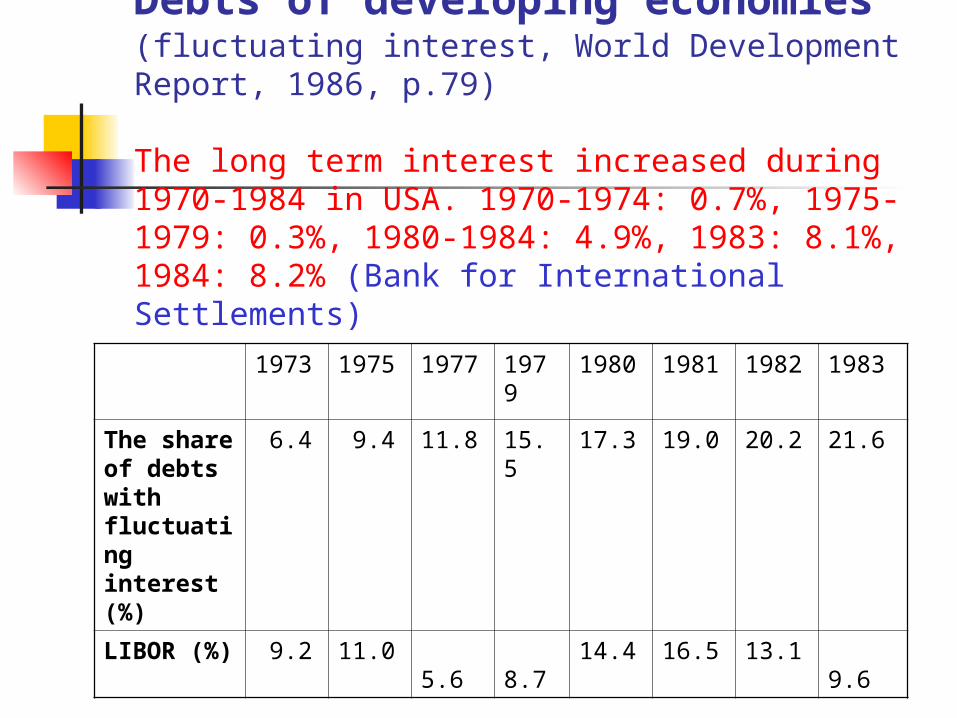
Debts of developing economies (fluctuating interest, World Development Report, 1986, p.79)
The long term interest increased during 1970-1984 in USA. 1970-1974: 0.7%, 1975-1979: 0.3%, 1980-1984: 4.9%, 1983: 8.1%, 1984: 8.2% (Bank for International Settlements)
1973 1975 1977 1979 1980 1981 1982 1983
The share of debts with fluctuating interest (%)
6.4 9.4 11.8 15.5 17.3 19.0 20.2 21.6
LIBOR (%) 9.2 11.0 5.6 8.7 14.4 16.5 13.1 9.6

F ig u r e 1 T h e Im p a c t o f T r a n s fo r m a tio n o n th e T h ir d W o r ld
Globalization
Liberalization, Stabilization, Privatization P o lic y Ⅰ
Default on financial obligations
Transformation in Socialist System
R e g im e C h a n g e a n d P o lic y C h a n g e in D e v e lo p m e n t S ta te s
Conditionality by IMF and WB
R e g io n a l In te g ra tio n , F o re ig n T ra d e , In te rd e p en d e n c e In te rn a tio n a l D iv is io n
o f L a b o r Ⅲ
Democratization, Elites Change R eg im e Ⅱ

Figure 2 The catch-up (flying geese) model in East Asia
Authoritarian Regime for development
Japan
China
ASEAN
NIEs
Vietnam
Laos, Cambodia Myanmar
Graduation

Availability of the flying geese model
In 1950s-1990s, the model can explain the successive development in Asian countries, from Japan to Vietnam.
Telescoping process and innovative combination played an important role.
Change of the model :

Impact of the Transformation in Asia
The flying geese model The transformation did not so noticeably affect
developing Asian countries. Prior to the Russian transformation, many countries had accepted reform package (economic conditionality) with the financial aid, and the Soviet model had already been abandoned.
Virtuous circle for the development

Developmentalism and Asian industrialization
USA changed the external policy to the developing economies, and nationalism from above brought about the developmentalism and the growth ideology.
Neo-developmental market economy after 1980s in Asia: promotion of export industry, the growth ideology using the centralized mobilization of resources (state intervention)
The growth ideology has been preserved and harmonized with liberalism ideology and new international division of labour. Developmentalism can survive in Asia.

The Path of Three “socialist countries”
1) India failure of import substitute industrialization Assistance from USA liberalization in 1980s with the financing
from the IMF and the World bank, and the FDI

2) Vietnam Dependence on USSR and ChinaIn 1980-1990s, improved foreign trade relation with the west
and an inflow of foreign capital offset the shock. 1980-1990: ruble denominated foreign trade increased in 2.5 times, dollar
denominated foreign trade increased in 4.1 times.
1986, Doi Moi (socialist oriented market economy): acceptance of the IMF policy and the IMF financing, and the high growth of FDI and the foreign aid.
The reform absorbed the shock of the collapse of the Soviet Union and the Russian transformation.
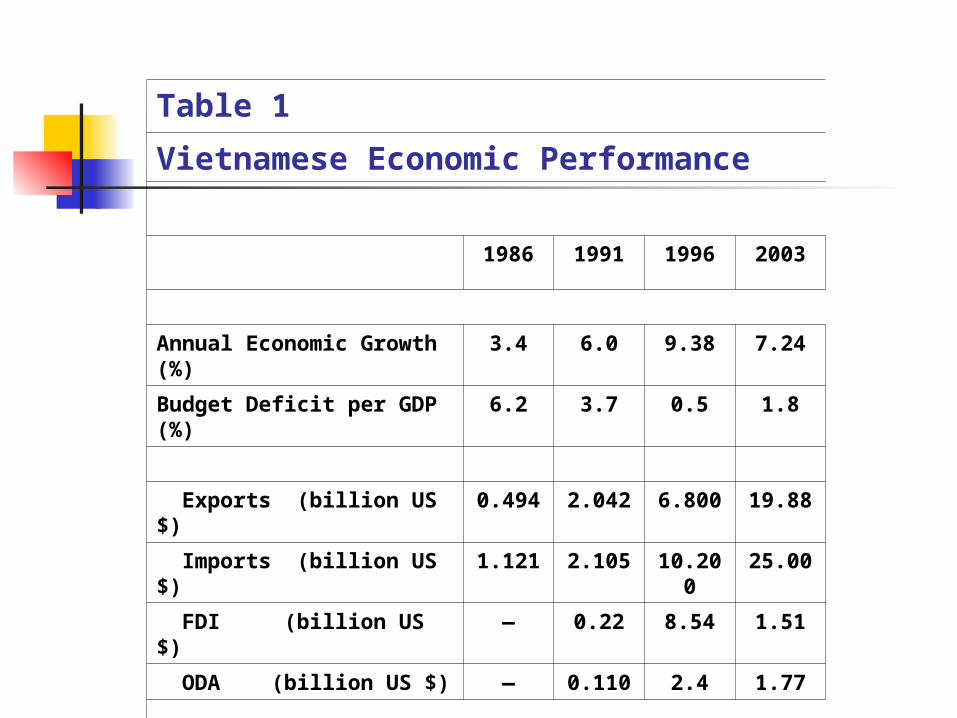
Table 1
Vietnamese Economic Performance
1986 1991 1996 2003
Annual Economic Growth (%) 3.4 6.0 9.38 7.24
Budget Deficit per GDP (%) 6.2 3.7 0.5 1.8
Exports (billion US $) 0.494 2.042 6.800 19.88
Imports (billion US $) 1.121 2.105 10.200 25.00
FDI (billion US $) ― 0.22 8.54 1.51
ODA (billion US $) ― 0.110 2.4 1.77
Source) Oanh, 2003, p.98, UNDP, Human Development Report 2006,The Japanese Embassy in Vietnam, March 2006 Report.
3) North Korea
Remarkable shock from heavy dependence on the Soviet Union
Closed economy but the specific path
Asian case, why1) Liberalized by themselves, 2) IMF, World
Bank, USA and Japan, 3) export oriented and interdependence within the Asia-Pacific Area

Impact of the Transformation in Africa
Democratization or political changes in 1980s – domestic changes, influence of the end of the cold war and the collapse of the Soviet Union
Economic conditionality and political conditionality (democratization) which are similar to the Russian path
Dependence on ODA (in Tanzania, ODA occupied 40% of GDP), and distorted distribution by the elite.
Vicious circle The transformation was to be carried out inline with
development strategy.

percapita
2003 2003 2003 1990 2003 1980 1993
Developing countries 5,022.4 T 1,414 9.7 2.7 3.0 - -East Asia and the Pacific 1,928.1 T 1,512 3.4 1.0 0.5 - -Vietnam 82.0 482 21.8 2.9 4.5 - -India 1,070.8 564 0.9 0.4 0.2 13.2 16.9
Sub-Saharan Africa 674.2 T 633 32.9 12.0 18.6 - -Madagascar 17.6 324 31.9 12.9 9.9 - 16.1Cameroon 15.7 776 55.0 4.0 7.1 15.5 18.3Kenya 32.7 450 15.2 13.9 3.4 26.1 28.9Guinea 9.0 459 30.0 10.4 6.5 - 21.9Senegal 11.1 634 44.7 14.4 6.9 23.9 -Rwanda 8.8 195 40.2 11.3 20.3 14.3 31.9Cote d'lvoire 17.6 816 15.0 6.4 1.8 33.3 -Tanzania,U.Rep.of 36.9 287 46.5 27.5 16.2 28.8 -Zambia 11.3 417 53.8 14.6 12.9 40.0 -Mozambique 19.1 230 55.0 40.7 23.9 - -Mali 12.7 371 45.3 19.9 12.2 21.6 -Niger 13.1 232 38.5 16.0 16.6 18.7 -
Source) The World Bank, World Development Report 1995, UNDP, Human Development Report 2006.
Table 2 Asian and African Economy
Official developmentassistance
(ODA) receivedAs % of GDP
Totalexpenditure(% of GNP)
Totalpopulati
on(millions
GDPper
capita

Figure 3 Asian Virtuous Circle
Increase of Population
Innovation, Institutional Changes
Infrastructure of Agriculture, R&D and Human Development
Green Revolution
Resource Transfer to Industry
Relative Success of Industrialization
Development of Formal Sector
Public Goods
Agricultural State
Source) Takahashi, 1998, p.40.

Figure 4 African Vicious Circle
Rapid Increase of Population Lack of Innovation, Institutional Changes
Undevelopment
Infrastructure, Lack
of R&D and Human
Development
Stagnant Agriculture
Stagnant Transfer to Industry
Failure of Industrialization
U n d e v elo p m e n t o f F o r m a l S e cto r , In fo r m a liz a tio n
Private Goods
Tribalism State
Source) Takahashi, 1998, p.41.

Some Lessons of the Transformation in the Third World
Meanings of the impact:
1) success story of the Asian countries with local-oriented measures and selective adoption of soft conditionality
2) inefficient transformation in Africa with the severe conditionality, similar to the Russian transformation (hard conditionality)

Lessons of the Transformation
1) Authoritarian regimes weakened or survived.2) Debt crisis caused the policy and system changes.3) Initial conditions are strong. Informal sector and social
capital4) Local society embedded habitual institutions created the
Asian model, based on Japanese and Korean model5) The state failure and good governance6) Laissez-faire is not fit to the newly created taxation
system.7) The transformation does not simply means
marketization. –Dual transformation or Triple transformation

Dual or Triple Transformation
1) Modernization: II and III sectors / I sector
2) Marketization or privatization: non-state sector / state sector
3) Maturity : Social expenditure and social welfare
China: modernization – marketization
Vietnam: marketization and moderate modernization
The Asian transformation went in the same direction but followed different paths.
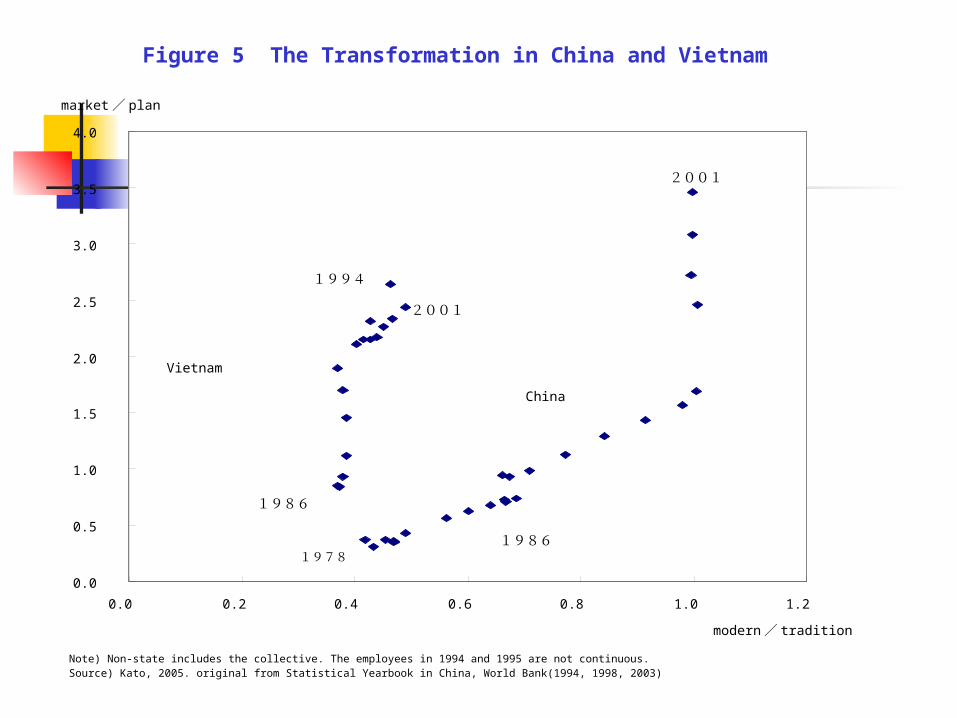
Figure 5 The Transformation in China and Vietnam
0.0
0.5
1.0
1.5
2.0
2.5
3.0
3.5
4.0
0.0 0.2 0.4 0.6 0.8 1.0 1.2
modern / tradition
market / plan
Vietnam
China
1986
19781986
2001
2001
1994
Note) Non-state includes the collective. The employees in 1994 and 1995 are not continuous.Source) Kato, 2005. original from Statistical Yearbook in China, World Bank(1994, 1998, 2003)
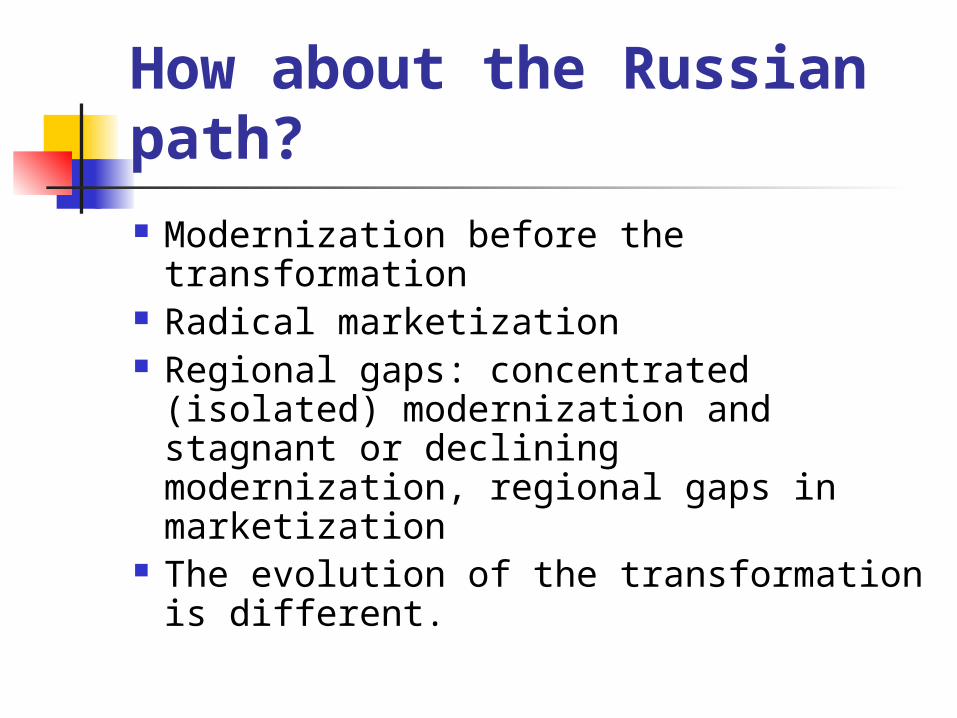
How about the Russian path?
Modernization before the transformation Radical marketization Regional gaps: concentrated (isolated)
modernization and stagnant or declining modernization, regional gaps in marketization
The evolution of the transformation is different.

Figure 6 The Transformation in Russia
1990
1980
1994
1999
2004
0.0
0.5
1.0
1.5
2.0
0.0 1.0 2.0 3.0 4.0 5.0 6.0 7.0 8.0 9.0
modern /tradition
market /plan
Source) Rosstat, Trud i zanyatost v Rossii, 1999, 2001, 2003, 2005, Rosstat, Rossiiskii statisticheskii ejegodnik..

Figure 7 The Transformation in the Russian Regions
0.00
0.50
1.00
1.50
2.00
2.50
0.00 5.00 10.00 15.00 20.00
Market / plan
Modern / tradition
Source) Rosstat, Trud i zanyatost v Rossii, 1999, 2001, 2003, 2005, Goskomstat, Regionyi Rossii, 1997

Table 3 Dual Transformation In Moscow and St.Petersburg
1990 1995 1996 1997 1998 1999 2000 2002 2004
Moscow 296 376
1.39
315 439
1.61
608
1.82
251 529
1.92
637
2.01
804
2.53
St.Petersburg 199 199
1.21
186 184
1.58
180
1.64
116 116
1.82
132
1.96
161
1.99
Note) Upper figure is II+III/I, and lower figure is non-state/state in employment.Source) Rosstat, Trud i zanyatost v Rossii, 1999, 2001, 2003, 2005, Goskomstat, Regionyi Rossii, 1997

Transformation as social changes
From the socialist welfare state to the market welfare state
Transfer of the social functions from the enterprise to the local communities and societies
Evolution of social responsibility: state-enterprise-region
Therefore, the transformation goes with the change of the regional structure.

Table 4 Comparison of social indicator: prevalence of child malnutrition % of children under 5, The World Bank, World Development Report 2007
1989-1994 2000-2004
Russian Federation 4 6
China 17 8
Vietnam 45 28

Table 5 Comparison of social indicator: Human Development Index Trends, UNDP, Human Development Report 2001, 2006
1980 1985 1990 1995 2000 2004
1.Norway 0.875 0.887 0.912 0.936 0.956 0.965
7.Japan 0.876 0.891 0.914 0.927 0.939 0.949
65.RF 0.809 0.826 0.818 0.771 0.785 0.797
81.China 0.553 0.590 0.628 0.685 0.730 0.768
109.Vietnam - 0.581 0.618 0.661 0.696 0.709

International division of labour, Economic integration, and the Transformation
Transformation under the second wave of regionalism and globalization: common values and policy convergence
Spill-over effects of the regional integration and chain reaction : APEC
FDI and multinationals in East Asia and close network: intra-regional foreign trade in East Asia
The external framework and the economic integration must be regarded as a key transition indicator. Four-fold transformation
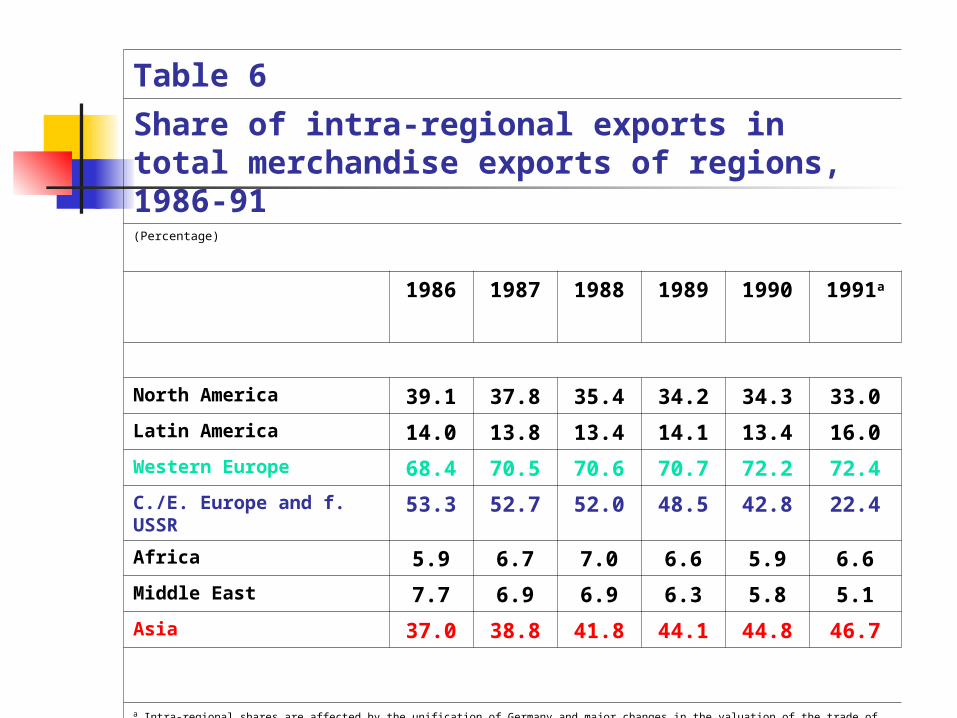
Table 6
Share of intra-regional exports in total merchandise exports of regions, 1986-91(Percentage)
1986 1987 1988 1989 1990 1991a
North America 39.1 37.8 35.4 34.2 34.3 33.0
Latin America 14.0 13.8 13.4 14.1 13.4 16.0
Western Europe 68.4 70.5 70.6 70.7 72.2 72.4
C./E. Europe and f. USSR 53.3 52.7 52.0 48.5 42.8 22.4
Africa 5.9 6.7 7.0 6.6 5.9 6.6
Middle East 7.7 6.9 6.9 6.3 5.8 5.1
Asia 37.0 38.8 41.8 44.1 44.8 46.7
a Intra-regional shares are affected by the unification of Germany and major changes in the valuation of the trade of Central and Eastern Europe and former USSR.

Table 7 Intra-regional trade (%)
1980export import
1990export import
1995export import
2000export import
2002export import
Japan,China, and Korea
15.8 12.8 13.9 15.8 18.7 21.8 18.7 22.9 20.1 24.5
ASEAN+3 31.7 33.5 36.7 33.0 44.9 45.7 42.6 48.4 44.8 49.2
NAFTA 33.6 33.9 41.4 33.3 46.2 37.7 55.7 39.8 56.7 38.2
MERCOSUR 15.9 11.9 11.8 18.3 23.2 20.8 23.5 24.2 16.5 22.5
EU 52.5 47.4 58.5 56.4 62.3 60.9 62.3 58.0 61.5 51.5

Figure 8 Export combination index of Japan (1999 , 2000)
ASEAN 3.07 1.79 USA
2.42
NIEs
Export combination index to Japan (2000)
ASEAN 2.84
1.73
NIEs
Note: Japan’s export to the destination country/ the total export of Japan ÷ the total import of the destination country/ the total import of the world
Source: White paper of Trade and Commerce, Government of Japan, 2002.
Russia
0.16
Japan
1.86
China
Russia
0.92
Japan
2.91
China

Figure 9 Export combination index of Japan (2001)
Export combination index to Japan (2001)
Note: Japan’s export to the destination country/ the total export of Japan ÷ the total import of the destinatio n country/ the total import of the world
Source: White paper of Trade and Commerce, Government of Japan, 2003.
2.91
ASEAN4
China
2.02
2.46
NIEs
Japan
2.96
ASEAN4
Japan
China
3.10
1.57
NIEs

Figure 10
Intensity of Trade in Russia (2003)
1 0.54
0.78 0.37
0.26
21.8 12.4 0.22
0.16
0.11
Note: Intensity = (Xij/Xi)/(Mj/W)
Source: IMF, Direction of Trade Statistics, September 2004.
Russia EU
CIS
ASEAN4
NIEs
Japan and China
Conclusion
The Third World has different ways. Dual or triple Transformation in Asia Liberalization prior to the Transformation External yardsticks of the transformation Gradual and local-oriented model different
from the Anglo-American model New regional integration in Asia

Figure 11 Transformation in Developing
Capitalism
0
-
+
lo w
S ta te ro le
h ig h
Globalization
Domestic factors
Integration, Asian model
Developing Capitalism
G lo b al e con o m ic ru le s
Related Documents