THE CONNECTICUT E CONOMIC D IGEST JUNE 2016 June 2016 Economic Indicators on the Overall Economy ......................... 5 Individual Data Items ......................... 6-8 Comparative Regional Data .............. 9 Economic Indicator Trends ........ 10-11 Help Wanted OnLine ........................ 15 Business and Employment Changes Announced in the News Media ...... 19 Labor Market Areas: Nonfarm Employment .................... 12-17 Sea. Adj. Nonfarm Employment .......... 14 Labor Force ............................................ 18 Hours and Earnings .............................. 19 Cities and Towns: Labor Force ..................................... 20-21 Housing Permits .................................... 22 Technical Notes ............................... 23 At a Glance ....................................... 24 Labor Force Participation Rate and Employment-Population Ratio, 1976-2016 ................... 1-2, 5 Annual Town Unemployment Rates, 2011-2015 ...................... 3-4 IN THIS ISSUE... In April... Nonfarm Emplo yment Connecticut ..................... 1,689,800 Change over month ........... +0.21% Change over year ................ +1.2% United States .............. 143,915,000 Change over month ........... +0.11% Change over year ................. +1.9% Unemplo yment Rate Connecticut ............................. 5.7% United States .......................... 5.0% Consumer Price Inde x United States ...................... 239.261 Change over year .................. +1.1% Vol.21 No.6 A joint publication of the Connecticut Department of Labor & the Connecticut Department of Economic and Community Development T Labor Force Participation Rate and Employment-Population Ratio, 1976-2016 By Jungmin Charles Joo, DOL Chart 1. CT LFPR, EPR, and UR, 1976-Apr. 2016 he Connecticut Economic Digest now publishes the monthly labor force participation rate and employment-population ratio, which are found under the “Unemployment” table on page 6. These two data, produced by the Bureau of Labor Statistics (BLS), provide additional perspectives to the unemployment rate data in assessing the current economic condition. This article also looks at their entire historical trends. Definitions The labor force participation rate (LFPR) is the percentage of the civilian noninstitutional population (CNP) who is in the labor force. CNP is everyone ages 16 and older who is not on active duty in the Armed Forces or residing in prisons or homes for the aged. Labor force is the subset of the CNP who is employed or unemployed. The LFPR is calculated by dividing the labor force by the CNP and multiplying by 100. The employment-population ratio (EPR) is the ratio of employed persons to the CNP. Current Data In April 2016, the seasonally adjusted Connecticut LFPR, at 66.1%, was essentially unchanged from a month ago as well as over the year. The EPR was 62.3%, same as in March, and slightly higher than in April 2015. Meanwhile, the unemployment rate rose to 5.7% in April, same as in March, and down slightly from 5.8% a year ago (Chart 1). 0 2 4 6 8 10 12 50 55 60 65 70 75 1976 1978 1980 1982 1984 1986 1988 1990 1992 1994 1996 1998 2000 2002 2004 2006 2008 2010 2012 2014 2016 UR (%) LFPR and EPR (%) SA LFPR SA EPR SA UR

Welcome message from author
This document is posted to help you gain knowledge. Please leave a comment to let me know what you think about it! Share it to your friends and learn new things together.
Transcript

THE CONNECTICUT
ECONOMIC DIGESTJUNE 2016
June 2016
Economic Indicators on the Overall Economy ......................... 5 Individual Data Items ......................... 6-8Comparative Regional Data .............. 9Economic Indicator Trends ........ 10-11Help Wanted OnLine ........................ 15Business and Employment ChangesAnnounced in the News Media ...... 19Labor Market Areas: Nonfarm Employment .................... 12-17 Sea. Adj. Nonfarm Employment ..........14 Labor Force ............................................ 18 Hours and Earnings .............................. 19Cities and Towns: Labor Force ..................................... 20-21 Housing Permits .................................... 22Technical Notes ............................... 23At a Glance ....................................... 24
Labor Force Participation Rateand Employment-PopulationRatio, 1976-2016 ................... 1-2, 5
Annual Town UnemploymentRates, 2011-2015 ...................... 3-4
IN THIS ISSUE...
In April...Nonfarm Employment Connecticut..................... 1,689,800 Change over month ........... +0.21% Change over year ................ +1.2%
United States .............. 143,915,000 Change over month ........... +0.11% Change over year ................. +1.9%
Unemployment Rate Connecticut............................. 5.7% United States .......................... 5.0%
Consumer Price Index United States ...................... 239.261 Change over year .................. +1.1%
Vol.21 No.6 A joint publication of the Connecticut Department of Labor & the Connecticut Department of Economic and Community Development
T
Labor Force Participation Rateand Employment-PopulationRatio, 1976-2016By Jungmin Charles Joo, DOL
Chart 1. CT LFPR, EPR, and UR, 1976-Apr. 2016
he Connecticut EconomicDigest now publishes the
monthly labor force participationrate and employment-populationratio, which are found under the“Unemployment” table on page 6.These two data, produced by theBureau of Labor Statistics (BLS),provide additional perspectives tothe unemployment rate data inassessing the current economiccondition. This article also looks attheir entire historical trends.
Definitions The labor force participation rate(LFPR) is the percentage of thecivilian noninstitutional population(CNP) who is in the labor force.CNP is everyone ages 16 and olderwho is not on active duty in theArmed Forces or residing in prisons
or homes for the aged. Labor force isthe subset of the CNP who isemployed or unemployed. The LFPRis calculated by dividing the laborforce by the CNP and multiplying by100. The employment-populationratio (EPR) is the ratio of employedpersons to the CNP.
Current Data In April 2016, the seasonallyadjusted Connecticut LFPR, at66.1%, was essentially unchangedfrom a month ago as well as over theyear. The EPR was 62.3%, same asin March, and slightly higher thanin April 2015. Meanwhile, theunemployment rate rose to 5.7% inApril, same as in March, and downslightly from 5.8% a year ago (Chart1).
0
2
4
6
8
10
12
50
55
60
65
70
75
1976
1978
1980
1982
1984
1986
1988
1990
1992
1994
1996
1998
2000
2002
2004
2006
2008
2010
2012
2014
2016
UR (%)
LFPR and EPR (%)
SA LFPR SA EPR SA UR
THE CONNECTICUT ECONOMIC DIGEST2 June 2016
ConnecticutDepartment of Labor
Connecticut Departmentof Economic andCommunity Development
THE CONNECTICUT
The Connecticut Economic Digest ispublished monthly by the ConnecticutDepartment of Labor, Office of Research, andthe Connecticut Department of Economic andCommunity Development. Its purpose is toregularly provide users with a comprehensivesource for the most current, up-to-date dataavailable on the workforce and economy of thestate, within perspectives of the region andnation.
The annual subscription is $50. Sendsubscription requests to: The ConnecticutEconomic Digest, Connecticut Department ofLabor, Office of Research, 200 Folly BrookBoulevard, Wethersfield, CT 06109-1114.Make checks payable to the ConnecticutDepartment of Labor. Back issues are $4 percopy. The Digest can be accessed free ofcharge from the DOL Web site. Articles fromThe Connecticut Economic Digest may bereprinted if the source is credited. Please sendcopies of the reprinted material to the ManagingEditor. The views expressed by the authors aretheirs alone and may not reflect those of theDOL or DECD.
Managing Editor: Jungmin Charles Joo
Associate Editor: Sarah C. Pilipaitis
We would like to acknowledge the contributionsof many DOL Research and DECD staff andRob Damroth to the publication of the Digest.
Catherine Smith, CommissionerTim Sullivan, Deputy Commissioner
505 Hudson StreetHartford, CT 06106-2502Phone: (860) 270-8000Fax: (860) 270-8200E-Mail: [email protected]: http://www.decd.org
Scott D. Jackson, CommissionerKurt Westby, Deputy Commissioner
Andrew Condon, Ph.D., DirectorOffice of Research200 Folly Brook BoulevardWethersfield, CT 06109-1114Phone: (860) 263-6275Fax: (860) 263-6263E-Mail: [email protected]: http://www.ctdol.state.ct.us/lmi
ECONOMIC DIGEST
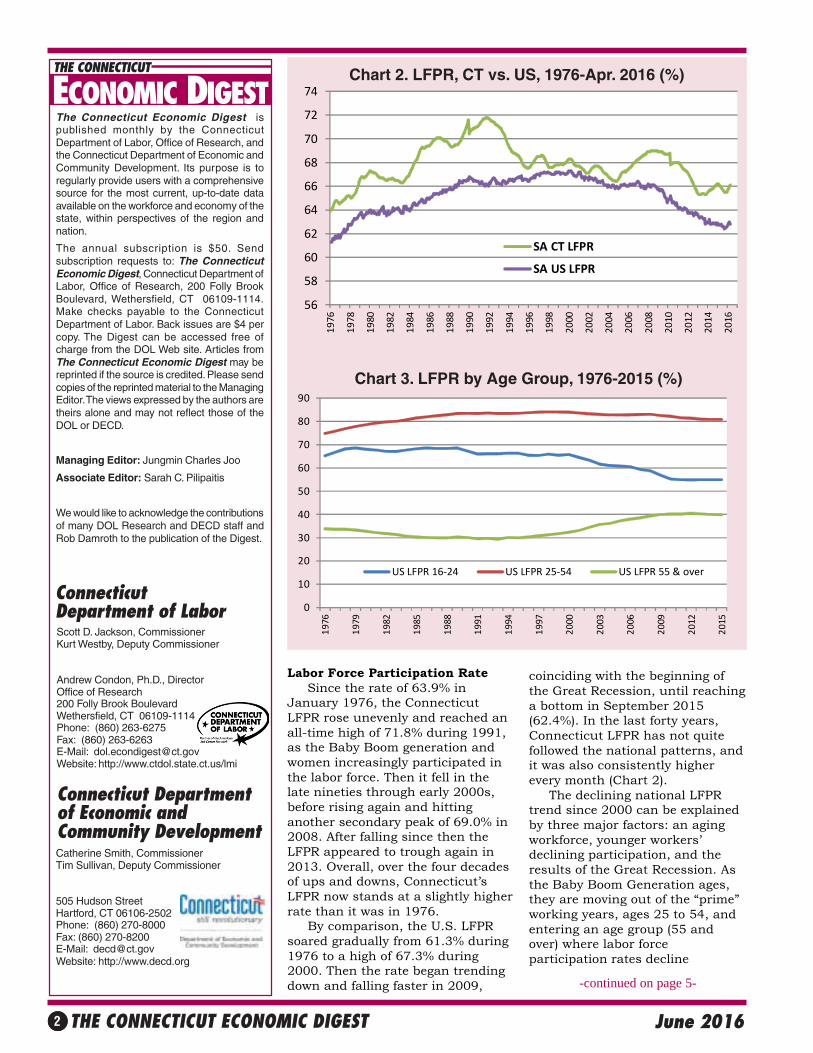
Labor Force Participation Rate Since the rate of 63.9% inJanuary 1976, the ConnecticutLFPR rose unevenly and reached anall-time high of 71.8% during 1991,as the Baby Boom generation andwomen increasingly participated inthe labor force. Then it fell in thelate nineties through early 2000s,before rising again and hittinganother secondary peak of 69.0% in2008. After falling since then theLFPR appeared to trough again in2013. Overall, over the four decadesof ups and downs, Connecticut’sLFPR now stands at a slightly higherrate than it was in 1976. By comparison, the U.S. LFPRsoared gradually from 61.3% during1976 to a high of 67.3% during2000. Then the rate began trendingdown and falling faster in 2009,
coinciding with the beginning ofthe Great Recession, until reachinga bottom in September 2015(62.4%). In the last forty years,Connecticut LFPR has not quitefollowed the national patterns, andit was also consistently higherevery month (Chart 2). The declining national LFPRtrend since 2000 can be explainedby three major factors: an agingworkforce, younger workers’declining participation, and theresults of the Great Recession. Asthe Baby Boom Generation ages,they are moving out of the “prime”working years, ages 25 to 54, andentering an age group (55 andover) where labor forceparticipation rates decline
-continued on page 5-
Chart 2. LFPR, CT vs. US, 1976-Apr. 2016 (%)
Chart 3. LFPR by Age Group, 1976-2015 (%)
56
58
60
62
64
66
68
70
72
74
1976
1978
1980
1982
1984
1986
1988
1990
1992
1994
1996
1998
2000
2002
2004
2006
2008
2010
2012
2014
2016
SA CT LFPR
SA US LFPR
0
10
20
30
40
50
60
70
80
90
1976
1979
1982
1985
1988
1991
1994
1997
2000
2003
2006
2009
2012
2015
US LFPR 16‐24 US LFPR 25‐54 US LFPR 55 & over

THE CONNECTICUT ECONOMIC DIGEST 3June 2016
U
Annual TAnnual TAnnual TAnnual TAnnual Town Unemployment Rates, 2011-2015own Unemployment Rates, 2011-2015own Unemployment Rates, 2011-2015own Unemployment Rates, 2011-2015own Unemployment Rates, 2011-2015By Jungmin Charles Joo, DOL
Unemployment Rates of Five Largest CT Cities (%)
0
2
4
6
8
10
12
14
Hartford Waterbury Bridgeport New Haven Stamford
2014 2015
nemployment rates comefrom the Local Area
Unemployment Statistics (LAUS)program. There are total of 169cities and towns in Connecticutfor which labor force estimatesare produced monthly by theConnecticut Department of Laborin cooperation with the U.S.Bureau of Labor Statistics (BLS).For a brief explanation of themethodology of LAUS, see “LaborForce Estimates” on page 23. InJuly 2015 Digest, 2010-2014annual average townunemployment rate estimateswere published. This year,revised 2011-2015 data areanalyzed.
2014 to 2015 Reflecting a continuedeconomic recovery (see“Employment Grew for the FifthYear,” March 2016 issue),unemployment rates decreasedin all 169 cities and towns inConnecticut in 2015. Of the total169 cities and towns, Canaanhad the largest decrease from5.5% in 2014 to 3.6% in 2015
(-1.9 percentage points). Theannual average Connecticutunemployment rate in 2015 was5.6%, down from 6.6% a yearearlier. Overall, a total of 132cities and towns had joblessrates below the statewide figureof 5.6%, 36 had rates above it,and one (Middletown) had a rateequal to it last year. Roxburyhad the lowest annual averageunemployment rate of 3.3%,while the City of Hartfordexperienced the highest rate of10.4% in 2015 (See table on page4 for the complete town data). Of the five largest cities in theState with a 2010 Censuspopulation of 100,000 or more,Stamford, once again, had thelowest unemployment rate in2015 of 4.6%. Hartford againhad the highest jobless rateamong the large cities at 10.4%(See Chart). All five cities hadover-the-year unemploymentrate decreases, the largest ofwhich occurred in Hartford (-1.8percentage points).
2011 to 2015 As the table also shows, lastyear’s unemployment rates werealso down in all but one townwhen compared with 2011, as theConnecticut economy ended itsfifth year of employment recovery.Scotland was the only town toexperience an increase in therate, from 4.8% to 6.3%.Hampton, again, led the largestdecline of 5.6 percentage pointsfrom 2011 to 2015. Over fiveyears, the State unemploymentrate fell from 8.8% to 5.6%.Colebrook had the lowest joblessrate of 4.4%, while Hartford’s wasthe highest at 15.7% in 2011. In 2011, Stamford had thelowest unemployment rate (7.3%)out of the five largest cities inConnecticut, while Hartford’s(15.7%) was the highest. All fivecities had jobless rate declinesduring the 2011-2015 period, thelargest of which was Hartford(-5.3 percentage points).

THE CONNECTICUT ECONOMIC DIGEST4 June 2016
Town/City 2011 2012 2013 2014 2015 Town/City 2011 2012 2013 2014 2015 Town/City 2011 2012 2013 2014 2015
Andover 6.9 6.6 6.4 5.6 4.4 Griswold 10.4 10.0 9.4 8.1 6.9 Prospect 7.5 6.9 5.9 5.2 4.8
Ansonia 11.8 11.5 10.9 9.3 8.0 Groton 8.5 8.0 7.4 6.0 5.2 Putnam 9.9 10.0 9.5 7.6 6.7
Ashford 7.8 7.7 6.8 5.5 4.5 Guilford 6.0 5.5 5.3 4.6 3.8 Redding 6.1 6.1 5.9 4.9 4.2
Avon 5.6 5.4 5.0 4.3 3.6 Haddam 6.1 6.0 5.5 4.8 4.0 Ridgef ield 6.1 5.8 5.5 4.8 3.9
Barkhamsted 8.2 7.6 6.4 5.3 4.5 Hamden 7.9 7.5 6.8 5.8 5.0 Rocky Hill 6.7 6.2 5.7 4.9 4.2
Beacon Falls 8.3 7.4 6.4 6.0 5.1 Hampton 10.8 10.0 9.3 6.2 5.2 Roxbury 5.1 5.2 5.1 3.9 3.3
Bethlehem 7.0 6.5 5.7 5.4 4.6 Hart ford 15.7 15.1 14.3 12.2 10.4 Salem 7.9 8.2 7.5 6.1 5.4
Berlin 7.4 6.7 6.0 5.2 4.6 Hart land 6.4 6.3 5.7 5.2 4.7 Salisbury 6.2 5.5 4.9 4.0 3.4
Bethany 6.9 6.1 5.6 5.3 4.3 Harwinton 6.4 6.6 5.8 5.1 4.2 Scot land 4.8 4.9 4.6 5.6 5.1
Bethel 7.4 6.9 6.5 5.4 4.6 Hebron 6.3 5.9 5.3 4.8 4.0 Seymour 9.2 8.6 8.0 7.1 6.0
Bloomfield 9.3 9.0 8.4 7.2 6.3 Kent 6.8 6.3 5.7 4.5 4.0 Sharon 5.9 5.4 5.4 4.3 3.4
Bolton 6.2 5.7 5.5 4.5 3.9 Killingly 10.6 10.4 9.5 7.9 6.8 Shelton 8.5 7.9 7.3 6.3 5.4
Bozrah 7.4 7.9 7.6 6.6 5.3 Killingworth 6.2 5.8 5.7 4.7 3.8 Sherman 6.8 6.3 5.9 4.9 4.1
Branford 8.0 7.5 6.7 5.7 5.0 Lebanon 8.3 8.0 6.9 5.8 4.8 Simsbury 5.9 5.4 5.0 4.3 3.6
Bridgeport 13.2 12.6 11.9 10.2 8.7 Ledyard 7.3 7.3 6.8 5.6 4.9 Somers 6.9 6.9 6.3 5.5 4.7
Bridgewater 6.3 5.7 6.0 5.9 4.4 Lisbon 8.1 8.1 7.2 6.7 5.9 South Windsor 6.8 6.3 5.8 5.1 4.4
Bristol 9.9 9.2 8.5 7.3 6.5 Litchf ield 6.8 6.1 5.7 5.0 4.2 Southbury 7.8 7.0 6.7 5.7 5.1
Brookf ield 6.9 6.6 6.2 5.2 4.4 Lyme 6.1 5.5 5.5 4.7 4.1 Southington 7.5 7.1 6.4 5.5 4.6
Brooklyn 9.0 8.6 7.9 7.0 5.9 M adison 6.3 6.1 5.7 4.8 4.0 Sprague 10.8 11.0 9.6 7.8 6.6
Burlington 6.9 6.2 5.5 4.5 4.3 M anchester 8.5 8.3 7.5 6.5 5.5 Stafford 8.8 8.5 7.9 6.8 6.0
Canaan 7.9 8.5 7.2 5.5 3.6 M ansf ield 8.2 8.1 7.7 6.2 5.1 Stamford 7.3 7.0 6.4 5.5 4.6
Canterbury 8.5 8.5 7.6 6.6 5.8 M arlborough 6.6 6.3 5.7 5.1 4.4 Sterling 10.3 10.6 9.6 8.6 7.3
Canton 6.6 5.6 5.4 4.7 3.9 M eriden 11.0 10.3 9.8 8.5 7.1 Stonington 6.5 6.2 5.9 5.7 4.8
Chaplin 8.3 7.8 7.2 6.6 6.0 M iddlebury 7.1 6.7 5.8 5.1 4.3 Strat ford 9.6 9.3 8.8 7.5 6.4
Cheshire 6.2 5.5 5.2 4.5 3.8 M iddlef ield 6.7 6.5 6.0 5.5 4.5 Suff ield 7.3 6.8 6.2 5.4 4.4
Chester 6.4 5.6 5.3 4.6 3.9 M iddletown 8.5 7.9 7.4 6.5 5.6 Thomaston 8.0 7.6 7.2 6.1 4.9
Clinton 7.7 7.2 6.5 5.6 4.7 M ilford 8.3 7.3 6.6 5.7 4.9 Thompson 9.4 8.6 7.7 6.2 5.3
Colchester 7.6 7.0 6.3 5.2 4.4 M onroe 7.8 7.2 6.4 5.7 5.0 Tolland 5.9 5.6 5.4 4.5 3.7
Colebrook 4.4 4.9 4.9 5.3 4.3 M ontville 9.2 8.9 8.2 6.9 6.1 Torrington 9.9 9.0 8.4 7.2 6.2
Columbia 7.0 6.4 6.1 5.3 4.7 M orris 7.4 6.2 5.6 5.0 4.4 Trumbull 6.9 6.8 6.3 5.4 4.7
Cornwall 6.2 5.6 5.6 3.7 3.5 Naugatuck 10.2 9.4 8.8 7.6 6.6 Union 6.7 6.1 5.8 5.2 4.8
Coventry 7.2 7.0 6.2 5.2 4.5 New Britain 12.5 11.9 11.2 9.5 8.1 Vernon 8.1 8.0 7.4 6.4 5.5
Cromwell 7.2 6.8 6.3 5.5 4.7 New Canaan 6.4 6.1 5.8 5.0 4.3 Voluntown 10.0 10.2 9.0 6.9 5.8
Danbury 7.2 6.8 6.1 5.2 4.6 New Fairf ield 7.8 7.2 6.5 5.2 4.6 Wallingford 7.8 7.2 6.6 5.7 4.8
Darien 6.5 6.7 6.1 5.1 4.3 New Hart ford 7.0 6.3 6.5 5.7 4.6 Warren 5.5 6.2 6.2 5.4 4.9
Deep River 6.8 6.1 5.7 5.2 4.5 New Haven 12.2 11.6 10.8 9.0 7.5 Washington 6.2 5.6 5.4 4.7 3.8
Derby 10.5 9.8 9.1 8.1 6.8 New London 12.2 12.6 11.9 9.8 8.3 Waterbury 13.7 12.9 12.3 10.7 9.3
Durham 6.5 5.8 5.3 4.8 3.8 New M ilford 7.3 7.1 6.6 5.6 4.7 Waterford 8.0 7.8 7.3 5.8 5.1
East Granby 6.1 5.6 5.5 4.9 3.9 Newington 7.6 7.1 6.4 5.4 4.7 Watertown 7.5 7.0 6.3 5.5 4.9
East Haddam 7.1 7.0 6.5 5.8 4.9 Newtown 6.6 6.1 5.7 4.9 4.3 West Hart ford 6.5 6.0 5.5 4.7 4.0
East Hampton 7.3 6.9 6.2 5.0 4.3 North Branford 7.6 6.9 6.0 5.2 4.6 West Haven 10.8 10.3 9.5 8.1 6.8
East Hart ford 11.1 10.7 10.0 8.5 7.3 North Canaan 8.0 7.1 6.1 5.3 4.5 Westbrook 7.6 7.2 6.4 5.6 4.9
East Haven 10.1 9.5 8.8 7.4 6.3 North Haven 7.8 7.2 6.4 5.5 4.7 Weston 6.5 6.1 5.9 5.0 4.2
East Lyme 7.9 7.9 7.0 5.8 5.2 North Stonington 7.0 7.3 7.1 6.1 4.8 Westport 6.3 6.2 5.9 5.0 4.1
East Windsor 9.2 8.7 8.0 6.7 5.7 Norfolk 7.0 6.7 7.2 6.0 4.8 Wethersf ield 7.8 7.1 6.5 5.7 4.8
Eastford 7.3 6.4 6.4 5.6 4.0 Norwalk 7.4 7.0 6.4 5.6 4.8 Willington 6.6 6.4 5.6 5.3 4.2
Easton 5.9 5.8 5.5 4.7 3.9 Norwich 10.5 10.1 9.7 8.4 7.2 Wilton 5.9 5.9 5.6 4.6 4.0
Ellington 7.0 6.4 6.1 5.1 4.7 Old Lyme 6.8 6.8 6.1 5.3 4.5 Winchester 10.6 9.2 8.7 7.2 5.9
Enf ield 8.8 8.1 7.6 6.4 5.4 Old Saybrook 7.6 7.0 6.3 5.3 4.6 Windham 11.2 10.6 10.0 8.4 7.0
Essex 7.3 6.7 6.1 5.2 4.7 Orange 6.3 6.0 5.7 4.9 4.1 Windsor 8.2 8.1 7.6 6.4 5.4
Fairf ield 7.3 7.1 6.5 5.4 4.7 Oxford 7.1 6.6 6.1 5.4 4.7 Windsor Locks 8.1 8.0 7.4 6.3 5.5
Farmington 6.1 5.8 5.4 4.6 3.9 Plainf ield 10.8 10.2 9.6 8.3 7.0 Wolcott 8.2 7.5 6.6 5.4 4.7
Franklin 7.3 6.6 6.5 6.3 5.3 Plainville 8.9 8.1 7.5 6.3 5.2 Woodbridge 5.3 4.9 5.0 4.2 3.8
Glastonbury 5.8 5.4 5.1 4.5 3.8 Plymouth 10.6 9.7 9.1 7.9 6.7 Woodbury 6.6 6.2 6.0 5.1 4.3
Goshen 7.3 7.1 5.8 5.1 4.6 Pomfret 6.5 6.3 5.6 4.8 4.1 Woodstock 7.6 7.3 6.7 5.6 4.7
Granby 6.1 5.6 5.2 4.6 4.0 Port land 7.2 6.7 6.2 5.4 4.7
Greenwich 6.7 6.2 5.7 4.8 4.1 Preston 8.4 8.4 7.8 6.8 5.5 CONNECTICUT 8 . 8 8 . 3 7 . 8 6 . 6 5 . 6
Annual Average Unemployment Rate by Town, 2011-2015

THE CONNECTICUT ECONOMIC DIGEST 5June 2016
GENERAL ECONOMIC INDICATORS
Sources: *Dr. Steven P. Lanza, University of Connecticut **Farmington Bank ***Federal Reserve Bank of Philadelphia
General Drift Indicators are composite measures of the four-quarter change in three coincident (Connecticut Manufacturing Production Index, nonfarm employment, andreal personal income) and three leading (housing permits, manufacturing average weekly hours, and initial unemployment claims) economic variables, and are indexed so1996 = 100.
The Farmington Bank Business Barometer is a measure of overall economic growth in the state of Connecticut that is derived from non-manufacturing employment,real disposable personal income, and manufacturing production.
The Philadelphia Fed’s Coincident Index summarizes current economic condition by using four coincident variables: nonfarm payroll employment, average hoursworked in manufacturing, the unemployment rate, and wage and salary disbursements deflated by the consumer price index (U.S. city average).
1Q 1Q CHANGE 4Q(Seasonally adjusted) 2016 2015 NO. % 2015General Drift Indicator (1996=100)* Leading 117.7 110.1 7.5 6.9 116.8 Coincident 116.9 115.6 1.3 1.1 116.4Farmington Bank Business Barometer (1992=100)** 134.5 132.0 2.5 1.9 134.1
Philadelphia Fed's Coincident Index (July 1992=100)*** Apr Apr Mar(Seasonally adjusted) 2016 2015 2016 Connecticut 171.17 165.56 5.61 3.4 170.69 United States 178.68 173.31 5.37 3.1 178.23
significantly. Although the LFPR in“55 and over” group is increasing,its rate is lower than the “25-54”group. As the older group makes upa larger share of the population,overall participation rates fall. Atthe same time, the LFPR among thenation’s youth and young adults(ages 16 to 24) has been fallingsharply since 2001 (Chart 3). This isbecause a lot of jobs that were onceheld by teens went to adults, andmore teens opted for school andcollege rather than working rightout of high school. The third reasonfor the decreasing LFPR since the2000s is that the U.S. hasundergone two recessions (2001and 2007-2009 “Great Recession”).
LFPRs tend to fall during or lingerafter recessions as people leave thelabor force because they getdiscouraged over job prospects andsome decide to go back to schooluntil the job market picks up again.There are no comparable data forthese age groups for Connecticut,however, those above factors alsomost likely contributed to ourState’s decreasing LFPR.
Employment-Population Ratio Connecticut employment-population ratio (EPR) fluctuatedthroughout the series, ranging froma low of 57.6% in 1976 to a high of68.3% in 1989. The nation’s EPR
started at 56.4% in 1976 andpeaked at 64.7% in 2000. Both thestate and the U.S. exhibited similarlong-term trends. However, it isencouraging to note thatConnecticut EPR was consistentlyhigher than the nation’s rate duringthe entire series. Also,Connecticut’s rate now stands at62.3%, markedly higher than 57.6%in 1976, whereas U.S.’s 59.7% isnot as much higher than 1976’s56.4% (Chart 4).
Going Forward According to the BLSprojections, the U.S. labor forceparticipation rate will likely bedeclining over the next 10 years.The declining participation rate,combined with the aging of thepopulation, and younger peoplestaying in school longer in order tobe able to obtain better paying jobsin the future, will cause the laborforce to grow at a slower pace(average annual rate of 0.5%)during the 2014-24 projectionperiod, slightly less than the 0.6%registered in 2004–14. Assuming weshare the same above factors,Connecticut would also likely followthe similar declining trend, thoughat a slightly higher rate than thenation, over the next decade.
Reference:http://www.bls.gov/opub/mlr/2015/article/labor-force-projections-to-2024.htm
-continued from page 2-
Chart 4. EPR, CT vs. US, 1976-Apr. 2016 (%)
50
52
54
56
58
60
62
64
66
68
70
1976
1978
1980
1982
1984
1986
1988
1990
1992
1994
1996
1998
2000
2002
2004
2006
2008
2010
2012
2014
2016
SA CT EPR SA U.S. EPR

THE CONNECTICUT ECONOMIC DIGEST6 June 2016
EMPLOYMENT BY INDUSTRY SECTOR
INCOME
Average weekly initial
claims fell from a year
ago.
UNEMPLOYMENT
The production worker
weekly earnings rose
over the year.
MANUFACTURING ACTIVITY
ECONOMIC INDICATORSTotal nonfarm
employment increased
over the year.
Personal income for third
quarter 2016 is
forecasted to increase 2.8
percent from a year
earlier.
Source: Connecticut Department of Labor * Includes Native American tribal government employment
Sources: Connecticut Department of Labor; U.S. Bureau of Labor Statistics
Sources: Connecticut Department of Labor; U.S. Department of Energy*Latest two months are forecasted.
Source: Bureau of Economic Analysis*Forecasted by Connecticut Department of Labor
(Seasonally adjusted) 3Q* 3Q CHANGE 2Q*(Annualized; $ Millions) 2016 2015 NO. % 2016Personal Income $250,549 $243,679 6,870 2.8 $248,813UI Covered Wages $109,699 $107,276 2,423 2.3 $109,089
Apr Apr CHANGE Mar(Seasonally adjusted; 000s) 2016 2015 NO. % 2016TOTAL NONFARM 1,689.8 1,669.7 20.1 1.2 1,686.3 Natural Res & Mining 0.5 0.5 0.0 0.0 0.5 Construction 59.5 57.2 2.3 4.0 57.1 Manufacturing 159.7 158.9 0.8 0.5 159.5 Trade, Transportation & Utilities 299.9 296.8 3.1 1.0 299.2 Information 34.6 32.4 2.2 6.8 34.3 Financial Activities 131.8 130.3 1.5 1.2 131.1 Professional and Business Services 218.6 215.3 3.3 1.5 217.5 Education and Health Services 330.0 325.4 4.6 1.4 329.2 Leisure and Hospitality 152.4 150.5 1.9 1.3 155.4 Other Services 64.9 63.8 1.1 1.7 64.7 Government* 237.9 238.6 -0.7 -0.3 237.8
STATE
Apr Apr CHANGE Mar Feb(Not seasonally adjusted) 2016 2015 NO. % 2016 2016Production Worker Avg Wkly Hours 41.9 40.1 1.8 4.5 42.0 --Prod. Worker Avg Hourly Earnings 27.58 25.44 2.14 8.4 27.39 --Prod. Worker Avg Weekly Earnings 1,155.60 1,020.14 135.46 13.3 1,150.38 --CT Mfg. Prod. Index, NSA (2009=100) 106.3 105.3 1.1 1.0 106.3 102.4 Production Worker Hours (000s) 4,110 3,848 262 6.8 4,103 -- Industrial Electricity Sales (mil kWh)* 259 272 -12.5 -4.6 260 248CT Mfg. Prod. Index, SA (2009=100) 109.2 108.5 0.7 0.6 111.0 107.8
Apr Apr CHANGE Mar(Seasonally adjusted) 2016 2015 NO. % 2016Labor Force, resident (000s) 1,905.1 1,895.9 9.2 0.5 1,901.9 Employed (000s) 1,795.7 1,786.8 8.9 0.5 1,794.4 Unemployed (000s) 109.5 109.1 0.4 0.4 107.5Unemployment Rate (%) 5.7 5.8 -0.1 --- 5.7Labor Force Participation Rate (%) 66.1 66.0 0.1 --- 66.0Employment-Population Ratio (%) 62.3 62.2 0.1 --- 62.3Average Weekly Initial Claims 3,825 4,122 -297 -7.2 3,790Avg. Insured Unemp. Rate (%) 2.44 2.68 -0.24 --- 2.37
1Q2016 1Q2015 2015U-6 Rate (%) 10.7 12.5 -1.8 --- 10.9

THE CONNECTICUT ECONOMIC DIGEST 7June 2016
TOURISM AND TRAVEL
ECONOMIC INDICATORSBUSINESS ACTIVITY S&P 500 Index fell over the
year.
Gaming slots rose over the
year.
BUSINESS STARTS AND TERMINATIONS Net business formation, as
measured by starts minus
stops registered with the
Secretary of the State, was
up over the year.
STATE REVENUES
Sources: Connecticut Department of Economic and Community Development; U.S. Department of Energy,Energy Information Administration; Connecticut Department of Revenue Services; F.W. Dodge;Connecticut Department of Motor Vehicles; Wisertrade.org
* Estimated by the Bureau of the Census
Sources: Connecticut Secretary of the State; Connecticut Department of Labor
Apr Apr % % (Millions of dollars) 2016 2015 CHG CURRENT PRIOR CHGTOTAL ALL REVENUES* 2,537.3 2,697.1 -5.9 6,921.4 7,000.8 -1.1 Corporate Tax 119.5 59.2 101.9 349.4 288.2 21.2 Personal Income Tax 1,827.9 1,911.0 -4.3 4,233.2 4,315.4 -1.9 Real Estate Conv. Tax 13.3 11.3 17.7 56.7 44.5 27.4 Sales & Use Tax 278.3 355.2 -21.6 1,317.5 1,393.5 -5.5 Gaming Payments** 23.1 22.6 2.4 87.7 84.7 3.5
YEAR TO DATE
Sources: Connecticut Department of Revenue Services; Division of Special Revenue*Includes all sources of revenue; Only selected sources are displayed; Most July receipts arecredited to the prior fiscal year and are not shown. **See page 23 for explanation.
Sources: Connecticut Department of Transportation, Bureau of Aviation and Ports; ConnecticutCommission on Culture and Tourism; Division of Special Revenue
*STR, Inc. Due to layoffs, Info Center Visitors data are no longer published.**Attraction participants expanded from 6 to 23 beginning with July 2014 data***See page 23 for explanation
Y/Y % YEAR TO DATE % MONTH LEVEL CHG CURRENT PRIOR CHG
Occupancy Rate (%)* Apr 2016 62.4 2.1 53.6 54.6 -1.8Major Attraction Visitors** Apr 2016 505,857 3.0 1,507,226 1,421,003 6.1Air Passenger Count Apr 2016 NA NA NA NA NAGaming Slots (Mil.$)*** Apr 2016 1,116.5 4.3 4,274.6 4,043.0 5.7
Y/Y % %MO/QTR LEVEL CHG CURRENT PRIOR CHG
STARTS Secretary of the State Apr 2016 2,598 42.5 9,848 8,008 23.0 Department of Labor 3Q 2015 1,904 -1.6 6,267 6,504 -3.6
TERMINATIONS Secretary of the State Apr 2016 1,015 -9.1 4,049 4,392 -7.8 Department of Labor 3Q 2015 1,691 0.1 4,798 5,093 -5.8
YEAR TO DATE
STATE
Total all revenues were down
from a year ago.
Y/Y % YEAR TO DATE % MONTH LEVEL CHG CURRENT PRIOR CHG
New Housing Permits* Apr 2016 380 -10.4 2,204 1,192 84.9Electricity Sales (mil kWh) Mar 2016 2,292 -10.3 7,203 7,917 -9.0Construction Contracts Index (1980=100) Apr 2016 289.4 -45.9 --- --- ---New Auto Registrations Apr 2016 24,714 42.6 108,478 55,749 94.6Exports (Bil. $) 1Q 2016 3.78 -4.0 3.78 3.93 -4.0S&P 500: Monthly Close Apr 2016 2,065.30 -1.0 --- --- ---

THE CONNECTICUT ECONOMIC DIGEST8 June 2016
CONSUMER NEWS
EMPLOYMENT COST INDEXCompensation cost for the
nation rose 1.8 percent
over the year.
Conventional mortgage
rate fell to 3.61 percent
over the month.
INTEREST RATES
ECONOMIC INDICATORS
U.S. inflation rate
was up by 1.1 percent
over the year.
Source: U.S. Department of Labor, Bureau of Labor Statistics
Sources: U.S. Department of Labor, Bureau of Labor Statistics; The Conference Board*Change over prior monthly or quarterly period**The Boston CPI can be used as a proxy for New England and is measured every other month.
Sources: Federal Reserve; Federal Home Loan Mortgage Corp.
Apr Mar Apr(Percent) 2016 2016 2015Prime 3.50 3.50 3.25
Federal Funds 0.37 0.36 0.12
3 Month Treasury Bill 0.23 0.30 0.02
6 Month Treasury Bill 0.37 0.47 0.09
1 Year Treasury Note 0.56 0.66 0.23
3 Year Treasury Note 0.92 1.04 0.87
5 Year Treasury Note 1.26 1.38 1.35
7 Year Treasury Note 1.57 1.68 1.6910 Year Treasury Note 1.81 1.89 1.94
20 Year Treasury Note 2.21 2.28 2.33
Conventional Mortgage 3.61 3.69 3.67
Seasonally Adjusted Not Seasonally AdjustedPrivate Industry Workers Mar Dec 3-Mo Mar Mar 12-Mo(Dec. 2005 = 100) 2016 2015 % Chg 2016 2015 % ChgUNITED STATES TOTAL 125.4 124.6 0.6 125.4 123.2 1.8
Wages and Salaries 125.2 124.3 0.7 125.1 122.6 2.0
Benefit Costs 125.9 125.3 0.5 126.0 124.5 1.2
NORTHEAST TOTAL --- --- --- 127.3 125.3 1.6 Wages and Salaries --- --- --- 126.9 124.7 1.8
STATE
(Not seasonally adjusted) MO/QTR LEVEL Y/Y P/P*CONSUMER PRICES CPI-U (1982-84=100)
U.S. City Average Apr 2016 239.261 1.1 0.5 Purchasing Power of $ (1982-84=$1.00) Apr 2016 0.418 -1.1 -0.5
Northeast Region Apr 2016 254.270 1.0 0.6
NY-Northern NJ-Long Island Apr 2016 262.619 1.0 0.4
Boston-Brockton-Nashua** Mar 2016 258.587 0.6 0.5 CPI-W (1982-84=100)
U.S. City Average Apr 2016 233.438 0.8 0.5
% CHANGE

THE CONNECTICUT ECONOMIC DIGEST 9June 2016
UNEMPLOYMENT RATES
LABOR FORCE
NONFARM EMPLOYMENT
Eight of nine states
showed a decrease in its
unemployment rate over
the year.
All nine states in the
region gained jobs over
the year.
Seven states posted
increases in the labor
force from last year.
COMPARATIVE REGIONAL DATA
Source: U.S. Department of Labor, Bureau of Labor Statistics
Source: U.S. Department of Labor, Bureau of Labor Statistics
Source: U.S. Department of Labor, Bureau of Labor Statistics
Apr Apr CHANGE Mar(Seasonally adjusted; 000s) 2016 2015 NO. % 2016Connecticut 1,689.8 1,669.7 20.1 1.2 1,686.3Maine 612.7 609.8 2.9 0.5 614.6Massachusetts 3,551.0 3,477.5 73.5 2.1 3,537.1New Hampshire 663.5 654.8 8.7 1.3 664.9New Jersey 4,066.4 4,002.5 63.9 1.6 4,073.9New York 9,343.3 9,209.8 133.5 1.4 9,332.9Pennsylvania 5,877.7 5,822.7 55.0 0.9 5,894.6Rhode Island 489.1 484.0 5.1 1.1 490.6Vermont 317.2 311.2 6.0 1.9 316.5United States 143,915.0 141,223.0 2,692.0 1.9 143,755.0
Apr Apr CHANGE Mar(Seasonally adjusted) 2,016 2,015 NO. % 2,016Connecticut 1,905,135 1,895,924 9,211 0.5 1,901,902
Maine 675,484 682,910 -7,426 -1.1 674,327
Massachusetts 3,596,930 3,583,594 13,336 0.4 3,581,450
New Hampshire 746,738 741,804 4,934 0.7 744,253
New Jersey 4,585,931 4,542,482 43,449 1.0 4,579,686
New York 9,800,503 9,685,063 115,440 1.2 9,808,559
Pennsylvania 6,525,530 6,417,941 107,589 1.7 6,501,686
Rhode Island 552,848 556,036 -3,188 -0.6 552,784
Vermont 345,351 345,276 75 0.0 344,564
United States 158,924,000 157,032,000 1,892,000 1.2 159,286,000
Apr Apr Mar(Seasonally adjusted) 2016 2015 CHANGE 2016Connecticut 5.7 5.8 -0.1 5.7Maine 3.4 4.5 -1.1 3.4Massachusetts 4.2 5.0 -0.8 4.4New Hampshire 2.6 3.6 -1.0 2.6New Jersey 4.7 6.0 -1.3 4.4New York 4.9 5.5 -0.6 4.8Pennsylvania 5.3 5.2 0.1 4.9Rhode Island 5.3 6.3 -1.0 5.4Vermont 3.2 3.7 -0.5 3.3United States 5.0 5.4 -0.4 5.0
STATE

THE CONNECTICUT ECONOMIC DIGEST10 June 2016
ECONOMIC INDICATOR TRENDSSTATE
CONSTRUCTION EMP., SA, 000s Month 2014 2015 2016Jan 53.4 56.9 58.1
Feb 53.9 56.7 58.1
Mar 54.2 57.0 57.1
Apr 55.1 57.2 59.5
May 55.3 58.1
Jun 55.6 58.1
Jul 56.0 57.6
Aug 56.1 57.6
Sep 56.2 57.5
Oct 56.5 57.0
Nov 56.3 57.7
Dec 56.7 57.4
MANUFACTURING EMP., SA, 000s Month 2014 2015 2016Jan 160.7 158.8 158.8
Feb 160.5 158.7 159.9
Mar 160.1 158.9 159.5
Apr 159.8 158.9 159.7
May 159.2 159.1
Jun 158.8 159.3
Jul 158.9 159.3
Aug 159.0 159.4
Sep 158.8 159.2
Oct 158.9 158.4
Nov 159.0 158.8
Dec 158.7 158.5
TRADE, TRANSP., & UTILITIES EMP., SA, 000s Month 2014 2015 2016Jan 295.3 296.3 298.5
Feb 295.1 295.6 298.5
Mar 295.5 295.9 299.2
Apr 296.1 296.8 299.9
May 295.5 296.8
Jun 295.2 297.3
Jul 295.6 296.7
Aug 295.5 296.4
Sep 295.4 297.0Oct 296.1 297.2
Nov 296.2 298.5
Dec 296.4 299.3
INFORMATION EMP., SA, 000s Month 2014 2015 2016Jan 32.1 32.3 33.1
Feb 31.9 32.2 33.6
Mar 32.1 32.3 34.3
Apr 32.1 32.4 34.6
May 31.9 32.4
Jun 31.9 32.5
Jul 32.0 32.3Aug 32.1 32.5
Sep 32.0 32.5
Oct 32.0 32.6
Nov 32.4 32.7
Dec 32.4 32.9
100
130
160
190
220
250
02 03 04 05 06 07 08 09 10 11 12 13 14 15 16
40
45
50
55
60
65
70
75
02 03 04 05 06 07 08 09 10 11 12 13 14 15 16
20
25
30
35
40
45
02 03 04 05 06 07 08 09 10 11 12 13 14 15 16
260
270
280
290
300
310
320
02 03 04 05 06 07 08 09 10 11 12 13 14 15 16

THE CONNECTICUT ECONOMIC DIGEST 11June 2016
ECONOMIC INDICATOR TRENDS STATE
FINANCIAL ACTIVITIES EMP., SA, 000s Month 2014 2015 2016Jan 129.0 129.8 131.5
Feb 128.7 129.7 130.9
Mar 128.2 129.9 131.1
Apr 128.2 130.3 131.8
May 128.8 130.2
Jun 128.4 130.0
Jul 128.5 130.0
Aug 128.7 130.0
Sep 128.9 129.8
Oct 129.1 130.2
Nov 129.3 130.1
Dec 129.3 130.3
PROFESSIONAL & BUSINESS SERV. EMP., SA, 000s Month 2014 2015 2016Jan 209.5 215.6 216.9
Feb 209.7 216.1 216.6
Mar 210.2 216.1 217.5
Apr 211.6 215.3 218.6
May 212.8 216.4
Jun 212.4 216.8
Jul 212.5 216.4
Aug 212.5 216.3
Sep 212.6 216.4
Oct 213.4 216.4
Nov 214.3 216.7
Dec 214.6 217.4
EDUCATIONAL & HEALTH SERV. EMP., SA, 000s Month 2014 2015 2016Jan 321.3 326.5 325.1
Feb 320.9 326.2 329.1
Mar 322.0 326.0 329.2
Apr 323.4 325.4 330.0
May 323.9 325.7
Jun 323.9 326.8
Jul 324.7 326.1
Aug 325.3 325.9
Sep 325.9 325.4
Oct 325.6 326.7
Nov 326.1 327.9Dec 326.3 327.6
LEISURE AND HOSPITALITY EMP., SA, 000s Month 2014 2015 2016Jan 150.0 151.2 154.9
Feb 149.3 150.7 155.0
Mar 150.2 150.9 155.4
Apr 149.9 150.5 152.4
May 149.5 151.2
Jun 149.7 151.0
Jul 149.6 150.7Aug 149.6 150.6
Sep 149.9 150.7
Oct 150.3 152.7
Nov 150.6 153.5
Dec 150.4 153.9
110
120
130
140
150
160
02 03 04 05 06 07 08 09 10 11 12 13 14 15 16
170
180
190
200
210
220
230
02 03 04 05 06 07 08 09 10 11 12 13 14 15 16
220
240
260
280
300
320
340
02 03 04 05 06 07 08 09 10 11 12 13 14 15 16
120
125
130
135
140
145
150
02 03 04 05 06 07 08 09 10 11 12 13 14 15 16
THE CONNECTICUT ECONOMIC DIGEST12 June 2016
Not Seasonally Adjusted
Apr Apr CHANGE Mar2016 2015 NO. % 2016
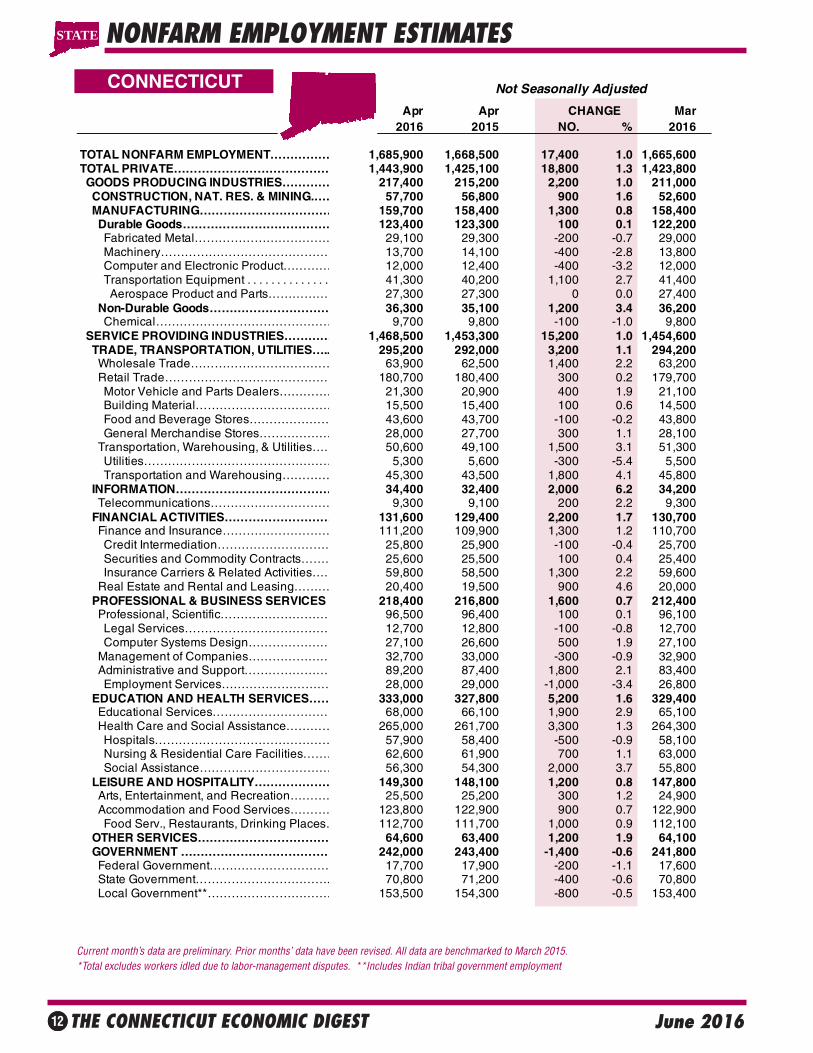
TOTAL NONFARM EMPLOYMENT…………… 1,685,900 1,668,500 17,400 1.0 1,665,600TOTAL PRIVATE………………………………… 1,443,900 1,425,100 18,800 1.3 1,423,800 GOODS PRODUCING INDUSTRIES………… 217,400 215,200 2,200 1.0 211,000 CONSTRUCTION, NAT. RES. & MINING.…… 57,700 56,800 900 1.6 52,600 MANUFACTURING…………………………… 159,700 158,400 1,300 0.8 158,400 Durable Goods………………………………… 123,400 123,300 100 0.1 122,200 Fabricated Metal……………………………… 29,100 29,300 -200 -0.7 29,000 Machinery…………………………………… 13,700 14,100 -400 -2.8 13,800 Computer and Electronic Product………… 12,000 12,400 -400 -3.2 12,000 Transportation Equipment . . . . . . . . . . . . . . 41,300 40,200 1,100 2.7 41,400 Aerospace Product and Parts…………… 27,300 27,300 0 0.0 27,400 Non-Durable Goods………………………… 36,300 35,100 1,200 3.4 36,200 Chemical……………………………………… 9,700 9,800 -100 -1.0 9,800 SERVICE PROVIDING INDUSTRIES………… 1,468,500 1,453,300 15,200 1.0 1,454,600 TRADE, TRANSPORTATION, UTILITIES….. 295,200 292,000 3,200 1.1 294,200 Wholesale Trade……………………………… 63,900 62,500 1,400 2.2 63,200 Retail Trade…………………………………… 180,700 180,400 300 0.2 179,700 Motor Vehicle and Parts Dealers…………… 21,300 20,900 400 1.9 21,100 Building Material……………………………… 15,500 15,400 100 0.6 14,500 Food and Beverage Stores………………… 43,600 43,700 -100 -0.2 43,800 General Merchandise Stores……………… 28,000 27,700 300 1.1 28,100 Transportation, Warehousing, & Utilities…… 50,600 49,100 1,500 3.1 51,300 Utilities………………………………………… 5,300 5,600 -300 -5.4 5,500 Transportation and Warehousing………… 45,300 43,500 1,800 4.1 45,800 INFORMATION………………………………… 34,400 32,400 2,000 6.2 34,200 Telecommunications………………………… 9,300 9,100 200 2.2 9,300 FINANCIAL ACTIVITIES……………………… 131,600 129,400 2,200 1.7 130,700 Finance and Insurance……………………… 111,200 109,900 1,300 1.2 110,700 Credit Intermediation………………………… 25,800 25,900 -100 -0.4 25,700 Securities and Commodity Contracts……… 25,600 25,500 100 0.4 25,400 Insurance Carriers & Related Activities…… 59,800 58,500 1,300 2.2 59,600 Real Estate and Rental and Leasing……… 20,400 19,500 900 4.6 20,000 PROFESSIONAL & BUSINESS SERVICES 218,400 216,800 1,600 0.7 212,400 Professional, Scientific……………………… 96,500 96,400 100 0.1 96,100 Legal Services……………………………… 12,700 12,800 -100 -0.8 12,700 Computer Systems Design………………… 27,100 26,600 500 1.9 27,100 Management of Companies………………… 32,700 33,000 -300 -0.9 32,900 Administrative and Support………………… 89,200 87,400 1,800 2.1 83,400 Employment Services……………………… 28,000 29,000 -1,000 -3.4 26,800 EDUCATION AND HEALTH SERVICES…… 333,000 327,800 5,200 1.6 329,400 Educational Services………………………… 68,000 66,100 1,900 2.9 65,100 Health Care and Social Assistance………… 265,000 261,700 3,300 1.3 264,300 Hospitals……………………………………… 57,900 58,400 -500 -0.9 58,100 Nursing & Residential Care Facilities……… 62,600 61,900 700 1.1 63,000 Social Assistance…………………………… 56,300 54,300 2,000 3.7 55,800 LEISURE AND HOSPITALITY………………… 149,300 148,100 1,200 0.8 147,800 Arts, Entertainment, and Recreation………… 25,500 25,200 300 1.2 24,900 Accommodation and Food Services………… 123,800 122,900 900 0.7 122,900 Food Serv., Restaurants, Drinking Places… 112,700 111,700 1,000 0.9 112,100 OTHER SERVICES…………………………… 64,600 63,400 1,200 1.9 64,100 GOVERNMENT ………………………………… 242,000 243,400 -1,400 -0.6 241,800 Federal Government………………………… 17,700 17,900 -200 -1.1 17,600 State Government……………………………. 70,800 71,200 -400 -0.6 70,800 Local Government**…………………………… 153,500 154,300 -800 -0.5 153,400
CONNECTICUT
NONFARM EMPLOYMENT ESTIMATES
Current month’s data are preliminary. Prior months’ data have been revised. All data are benchmarked to March 2015. *Total excludes workers idled due to labor-management disputes. **Includes Indian tribal government employment
STATE

THE CONNECTICUT ECONOMIC DIGEST 13June 2016
DANBURY LMA
BRIDGEPORT -STAMFORD LMA
NONFARM EMPLOYMENT ESTIMATES
Current month’s data are preliminary. Prior months’ data have been revised. All data are benchmarked to March 2015. *Total excludes workers idled due to labor-management disputes.
LMA
Not Seasonally Adjusted
Apr Apr CHANGE Mar2016 2015 NO. % 2016
TOTAL NONFARM EMPLOYMENT…………… 410,700 406,000 4,700 1.2 405,500TOTAL PRIVATE………………………………… 365,100 361,000 4,100 1.1 360,200 GOODS PRODUCING INDUSTRIES………… 43,400 43,200 200 0.5 42,300 CONSTRUCTION, NAT. RES. & MINING.…… 12,400 11,900 500 4.2 11,100 MANUFACTURING…………………………… 31,000 31,300 -300 -1.0 31,200 Durable Goods………………………………… 23,100 23,400 -300 -1.3 23,100 SERVICE PROVIDING INDUSTRIES………… 367,300 362,800 4,500 1.2 363,200 TRADE, TRANSPORTATION, UTILITIES….. 70,000 69,800 200 0.3 70,000 Wholesale Trade……………………………… 13,800 13,400 400 3.0 13,800 Retail Trade…………………………………… 46,300 46,700 -400 -0.9 46,100 Transportation, Warehousing, & Utilities…… 9,900 9,700 200 2.1 10,100 INFORMATION………………………………… 12,900 12,100 800 6.6 12,800 FINANCIAL ACTIVITIES……………………… 42,100 41,000 1,100 2.7 41,500 Finance and Insurance……………………… 35,300 34,700 600 1.7 35,200 Credit Intermediation………………………… 9,500 9,800 -300 -3.1 9,500 Securities and Commodity Contracts……… 17,100 17,700 -600 -3.4 17,100 PROFESSIONAL & BUSINESS SERVICES 65,600 65,800 -200 -0.3 63,300 Professional, Scientific……………………… 27,300 28,900 -1,600 -5.5 27,100 Administrative and Support………………… 25,000 24,400 600 2.5 23,100 EDUCATION AND HEALTH SERVICES…… 72,400 71,500 900 1.3 71,600 Health Care and Social Assistance………… 60,800 59,700 1,100 1.8 60,400 LEISURE AND HOSPITALITY………………… 41,100 40,500 600 1.5 41,300 Accommodation and Food Services………… 31,300 30,600 700 2.3 32,000 OTHER SERVICES…………………………… 17,600 17,100 500 2.9 17,400 GOVERNMENT ………………………………… 45,600 45,000 600 1.3 45,300 Federal………………………………………… 2,400 2,500 -100 -4.0 2,500 State & Local…………………………………… 43,200 42,500 700 1.6 42,800
Not Seasonally Adjusted
Apr Apr CHANGE Mar2016 2015 NO. % 2016
TOTAL NONFARM EMPLOYMENT…………… 78,600 78,400 200 0.3 77,800TOTAL PRIVATE………………………………… 68,200 67,600 600 0.9 67,600 GOODS PRODUCING INDUSTRIES………… 12,200 12,000 200 1.7 12,100 SERVICE PROVIDING INDUSTRIES………… 66,400 66,400 0 0.0 65,700 TRADE, TRANSPORTATION, UTILITIES….. 17,000 17,100 -100 -0.6 17,200 Retail Trade…………………………………… 12,300 12,600 -300 -2.4 12,400 PROFESSIONAL & BUSINESS SERVICES 9,500 9,400 100 1.1 9,200 LEISURE AND HOSPITALITY………………… 7,200 7,400 -200 -2.7 7,100 GOVERNMENT ………………………………… 10,400 10,800 -400 -3.7 10,200 Federal………………………………………… 700 700 0 0.0 700 State & Local…………………………………… 9,700 10,100 -400 -4.0 9,500

THE CONNECTICUT ECONOMIC DIGEST14 June 2016
HARTFORD LMA
NONFARM EMPLOYMENT ESTIMATESLMA
SEASONALLY ADJUSTED TOTAL NONFARM EMPLOYMENT
Current month’s data are preliminary. Prior months’ data have been revised. All data are benchmarked to March 2015.*Total excludes workers idled due to labor-management disputes
** Unofficial seasonally adjusted estimates produced by the Connecticut Department of Labor
Not Seasonally Adjusted
Apr Apr CHANGE Mar2016 2015 NO. % 2016
TOTAL NONFARM EMPLOYMENT…………… 575,000 568,400 6,600 1.2 567,600TOTAL PRIVATE………………………………… 484,900 477,800 7,100 1.5 477,200 GOODS PRODUCING INDUSTRIES………… 74,500 75,200 -700 -0.9 72,100 CONSTRUCTION, NAT. RES. & MINING.…… 19,100 19,600 -500 -2.6 17,200 MANUFACTURING…………………………… 55,400 55,600 -200 -0.4 54,900 Durable Goods………………………………… 46,000 46,200 -200 -0.4 45,500 Non-Durable Goods………………………… 9,400 9,400 0 0.0 9,400 SERVICE PROVIDING INDUSTRIES………… 500,500 493,200 7,300 1.5 495,500 TRADE, TRANSPORTATION, UTILITIES….. 89,000 88,700 300 0.3 88,300 Wholesale Trade……………………………… 17,200 17,900 -700 -3.9 17,000 Retail Trade…………………………………… 55,200 55,300 -100 -0.2 54,700 Transportation, Warehousing, & Utilities…… 16,600 15,500 1,100 7.1 16,600 Transportation and Warehousing………… 15,700 14,600 1,100 7.5 15,700 INFORMATION………………………………… 12,300 11,800 500 4.2 12,200 FINANCIAL ACTIVITIES……………………… 57,900 56,700 1,200 2.1 57,700 Depository Credit Institutions……………… 6,100 6,100 0 0.0 6,100 Insurance Carriers & Related Activities…… 37,800 37,500 300 0.8 37,900 PROFESSIONAL & BUSINESS SERVICES 73,800 72,700 1,100 1.5 72,000 Professional, Scientific……………………… 34,900 34,600 300 0.9 34,500 Management of Companies………………… 10,100 10,200 -100 -1.0 10,100 Administrative and Support………………… 28,800 27,900 900 3.2 27,400 EDUCATION AND HEALTH SERVICES…… 109,100 104,900 4,200 4.0 106,900 Educational Services………………………… 15,300 14,100 1,200 8.5 13,800 Health Care and Social Assistance………… 93,800 90,800 3,000 3.3 93,100 Ambulatory Health Care…………………… 31,100 30,700 400 1.3 30,700 LEISURE AND HOSPITALITY………………… 46,400 46,300 100 0.2 46,200 Accommodation and Food Services………… 39,900 39,200 700 1.8 39,700 OTHER SERVICES…………………………… 21,900 21,500 400 1.9 21,800 GOVERNMENT ………………………………… 90,100 90,600 -500 -0.6 90,400 Federal………………………………………… 5,300 5,400 -100 -1.9 5,300 State & Local…………………………………… 84,800 85,200 -400 -0.5 85,100
Seasonally AdjustedApr Apr CHANGE Mar
Labor Market Areas 2016 2015 NO. % 2016 BRIDGEPORT-STAMFORD LMA……………… 412,700 407,500 5,200 1.3 412,900 DANBURY LMA**……………………………… 78,500 78,400 100 0.1 78,700 HARTFORD LMA………………………………. 574,000 566,200 7,800 1.4 571,500 NEW HAVEN LMA……………………………… 280,600 278,900 1,700 0.6 280,500 NORWICH-NEW LONDON LMA……………… 129,300 126,500 2,800 2.2 129,800 WATERBURY LMA**…………………………… 66,800 66,300 500 0.8 67,200 ENFIELD LMA**………………………………… 45,300 45,400 -100 -0.2 45,400 TORRINGTON-NORTHWEST LMA**………… 33,800 33,700 100 0.3 33,900 DANIELSON-NORTHEAST LMA**…………… 26,400 26,700 -300 -1.1 26,700

THE CONNECTICUT ECONOMIC DIGEST 15June 2016
NEW HAVEN LMA
NONFARM EMPLOYMENT ESTIMATES
Current month’s data are preliminary. Prior months’ data have been revised. All data are benchmarked to March 2015. *Total excludes workers idled due to labor-management disputes. **Value less than 50
LMA
HELP WANTED ONLINE
* A percent of advertised vacancies per 100 persons in labor forceSource: The Conference Board
CT Online Labor DemandFell 400 in April
The Conference Board’s HelpWanted OnLine (HWOL) datareported that there were 61,500advertisements for Connecticut-based jobs in April 2016, a 0.6percent decrease over the monthand a 19.6 percent decrease overthe year. There were 3.23 adver-tised vacancies for every 100persons in Connecticut’s labor force,while nationally it was 3.25 percent.Among the New England states,Massachusetts had the highestlabor demand rate (4.28), whileRhode Island had the lowest rate(2.84).
The Conference Board Help Wanted OnLine® Data Series (HWOL) measures the number ofnew, first-time online jobs and jobs reposted from the previous month for over 16,000 Internet jobboards, corporate boards and smaller job sites that serve niche markets and smaller geographicareas. Background information and technical notes and discussion of revisions to the series areavailable at: www.conference-board.org/data/helpwantedonline.cfm.
Not Seasonally Adjusted
Apr Apr CHANGE Mar2016 2015 NO. % 2016
TOTAL NONFARM EMPLOYMENT…………… 281,500 280,600 900 0.3 277,700 TOTAL PRIVATE………………………………… 244,600 244,100 500 0.2 241,000 GOODS PRODUCING INDUSTRIES………… 34,500 34,600 -100 -0.3 33,800 CONSTRUCTION, NAT. RES. & MINING.…… 10,500 10,200 300 2.9 9,900 MANUFACTURING…………………………… 24,000 24,400 -400 -1.6 23,900 Durable Goods………………………………… 18,100 18,400 -300 -1.6 17,900 SERVICE PROVIDING INDUSTRIES………… 247,000 246,000 1,000 0.4 243,900 TRADE, TRANSPORTATION, UTILITIES….. 49,900 49,200 700 1.4 49,400 Wholesale Trade……………………………… 11,300 11,200 100 0.9 11,200 Retail Trade…………………………………… 29,200 29,100 100 0.3 28,800 Transportation, Warehousing, & Utilities…… 9,400 8,900 500 5.6 9,400 INFORMATION………………………………… 3,500 3,600 -100 -2.8 3,500 FINANCIAL ACTIVITIES……………………… 12,800 12,500 300 2.4 12,700 Finance and Insurance……………………… 9,000 8,900 100 1.1 9,000 PROFESSIONAL & BUSINESS SERVICES 31,300 30,500 800 2.6 30,100 Administrative and Support………………… 15,100 14,300 800 5.6 13,900 EDUCATION AND HEALTH SERVICES…… 78,300 79,500 -1,200 -1.5 77,700 Educational Services………………………… 30,100 30,500 -400 -1.3 29,200 Health Care and Social Assistance………… 48,200 49,000 -800 -1.6 48,500 LEISURE AND HOSPITALITY………………… 23,500 23,400 100 0.4 23,100 Accommodation and Food Services………… 19,600 20,100 -500 -2.5 19,300 OTHER SERVICES…………………………… 10,800 10,800 0 0.0 10,700 GOVERNMENT ………………………………… 36,900 36,500 400 1.1 36,700 Federal………………………………………… 4,800 4,800 0 0.0 4,900 State & Local…………………………………… 32,100 31,700 400 1.3 31,800
Apr Apr Mar(Seasonally adjusted) 2016 2015 2016CT Vacancies (000s) 61.5 76.5 61.9
Hartford Vac. (000s) 24.6 30.6 25.2
Connecticut 3.23 4.03 3.26
United States 3.25 3.41 3.22
Maine 3.03 4.32 3.18
Massachusetts 4.28 4.59 4.39
New Hampshire 3.41 3.55 3.57Rhode Island 2.84 3.87 2.96
Vermont 3.10 4.01 3.01
Labor Demand Rate *
THE CONNECTICUT ECONOMIC DIGEST16 June 2016
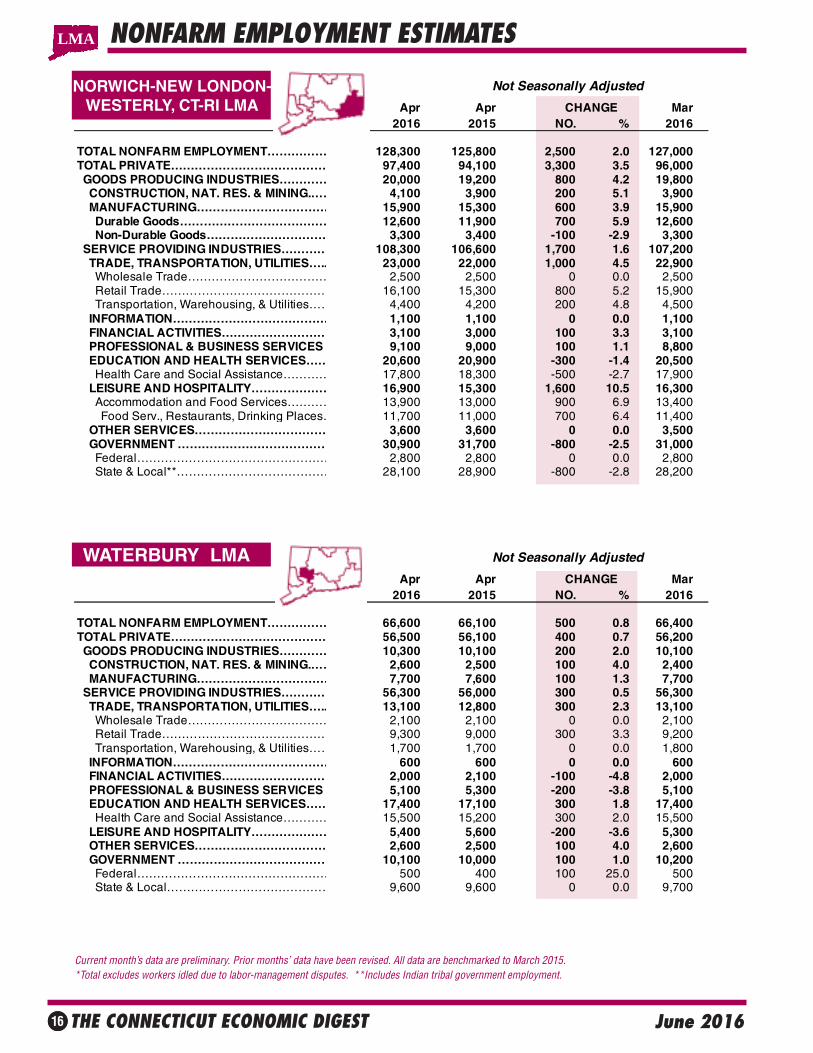
NORWICH-NEW LONDON-WESTERLY, CT-RI LMA
Current month’s data are preliminary. Prior months’ data have been revised. All data are benchmarked to March 2015. *Total excludes workers idled due to labor-management disputes. **Includes Indian tribal government employment.
NONFARM EMPLOYMENT ESTIMATES
WATERBURY LMA
LMA
Not Seasonally Adjusted
Apr Apr CHANGE Mar2016 2015 NO. % 2016
TOTAL NONFARM EMPLOYMENT…………… 128,300 125,800 2,500 2.0 127,000TOTAL PRIVATE………………………………… 97,400 94,100 3,300 3.5 96,000 GOODS PRODUCING INDUSTRIES………… 20,000 19,200 800 4.2 19,800 CONSTRUCTION, NAT. RES. & MINING.…… 4,100 3,900 200 5.1 3,900 MANUFACTURING…………………………… 15,900 15,300 600 3.9 15,900 Durable Goods………………………………… 12,600 11,900 700 5.9 12,600 Non-Durable Goods………………………… 3,300 3,400 -100 -2.9 3,300 SERVICE PROVIDING INDUSTRIES………… 108,300 106,600 1,700 1.6 107,200 TRADE, TRANSPORTATION, UTILITIES….. 23,000 22,000 1,000 4.5 22,900 Wholesale Trade……………………………… 2,500 2,500 0 0.0 2,500 Retail Trade…………………………………… 16,100 15,300 800 5.2 15,900 Transportation, Warehousing, & Utilities…… 4,400 4,200 200 4.8 4,500 INFORMATION………………………………… 1,100 1,100 0 0.0 1,100 FINANCIAL ACTIVITIES……………………… 3,100 3,000 100 3.3 3,100 PROFESSIONAL & BUSINESS SERVICES 9,100 9,000 100 1.1 8,800 EDUCATION AND HEALTH SERVICES…… 20,600 20,900 -300 -1.4 20,500 Health Care and Social Assistance………… 17,800 18,300 -500 -2.7 17,900 LEISURE AND HOSPITALITY………………… 16,900 15,300 1,600 10.5 16,300 Accommodation and Food Services………… 13,900 13,000 900 6.9 13,400 Food Serv., Restaurants, Drinking Places… 11,700 11,000 700 6.4 11,400 OTHER SERVICES…………………………… 3,600 3,600 0 0.0 3,500 GOVERNMENT ………………………………… 30,900 31,700 -800 -2.5 31,000 Federal………………………………………… 2,800 2,800 0 0.0 2,800 State & Local**………………………………… 28,100 28,900 -800 -2.8 28,200
Not Seasonally Adjusted
Apr Apr CHANGE Mar 2016 2015 NO. % 2016
TOTAL NONFARM EMPLOYMENT…………… 66,600 66,100 500 0.8 66,400TOTAL PRIVATE………………………………… 56,500 56,100 400 0.7 56,200 GOODS PRODUCING INDUSTRIES………… 10,300 10,100 200 2.0 10,100 CONSTRUCTION, NAT. RES. & MINING.…… 2,600 2,500 100 4.0 2,400 MANUFACTURING…………………………… 7,700 7,600 100 1.3 7,700 SERVICE PROVIDING INDUSTRIES………… 56,300 56,000 300 0.5 56,300 TRADE, TRANSPORTATION, UTILITIES….. 13,100 12,800 300 2.3 13,100 Wholesale Trade……………………………… 2,100 2,100 0 0.0 2,100 Retail Trade…………………………………… 9,300 9,000 300 3.3 9,200 Transportation, Warehousing, & Utilities…… 1,700 1,700 0 0.0 1,800 INFORMATION………………………………… 600 600 0 0.0 600 FINANCIAL ACTIVITIES……………………… 2,000 2,100 -100 -4.8 2,000 PROFESSIONAL & BUSINESS SERVICES 5,100 5,300 -200 -3.8 5,100 EDUCATION AND HEALTH SERVICES…… 17,400 17,100 300 1.8 17,400 Health Care and Social Assistance………… 15,500 15,200 300 2.0 15,500 LEISURE AND HOSPITALITY………………… 5,400 5,600 -200 -3.6 5,300 OTHER SERVICES…………………………… 2,600 2,500 100 4.0 2,600 GOVERNMENT ………………………………… 10,100 10,000 100 1.0 10,200 Federal………………………………………… 500 400 100 25.0 500 State & Local…………………………………… 9,600 9,600 0 0.0 9,700

THE CONNECTICUT ECONOMIC DIGEST 17June 2016
NONFARM EMPLOYMENT ESTIMATES
NOTE: More industry detail data is available for the State and its nine labor market areas at: http://www.ctdol.state.ct.us/lmi/202/covered.htm. The data published there differ from the data in the preced-ing tables in that they are developed from a near-universe count of Connecticut employment covered bythe unemployment insurance (UI) program, while the data here is sample-based. The data drawn fromthe UI program does not contain estimates of employment not covered by unemployment insurance, andis lagged several months behind the current employment estimates presented here.
SMALLER LMAS*
Current month’s data are preliminary. Prior months’ data have been revised. All data are benchmarked to March 2015. *Total excludes workers idled due to labor-management disputes.
SPRINGFIELD, MA-CTNECTA**
** New England City and Town Area
LMA
For further information on these nonfarm employment estimates contact Lincoln Dyer at (860) 263-6292.
Not Seasonally Adjusted
Apr Apr CHANGE Mar 2016 2015 NO. % 2016
TOTAL NONFARM EMPLOYMENT ENFIELD LMA…………………………………… 46,000 46,100 -100 -0.2 44,700 TORRINGTON-NORTHWEST LMA…………… 33,500 33,400 100 0.3 32,700 DANIELSON-NORTHEAST LMA……………… 26,400 26,700 -300 -1.1 26,200
Not Seasonally Adjusted
Apr Apr CHANGE Mar2016 2015 NO. % 2016
TOTAL NONFARM EMPLOYMENT…………… 332,000 330,000 2,000 0.6 325,100TOTAL PRIVATE………………………………… 267,500 265,000 2,500 0.9 260,800 GOODS PRODUCING INDUSTRIES………… 39,400 39,500 -100 -0.3 38,100 CONSTRUCTION, NAT. RES. & MINING.…… 10,500 10,500 0 0.0 9,400 MANUFACTURING…………………………… 28,900 29,000 -100 -0.3 28,700 Durable Goods………………………………… 19,600 19,600 0 0.0 19,500 Non-Durable Goods………………………… 9,300 9,400 -100 -1.1 9,200 SERVICE PROVIDING INDUSTRIES………… 292,600 290,500 2,100 0.7 287,000 TRADE, TRANSPORTATION, UTILITIES….. 58,800 58,400 400 0.7 58,700 Wholesale Trade……………………………… 11,200 11,300 -100 -0.9 11,200 Retail Trade…………………………………… 34,000 34,200 -200 -0.6 34,000 Transportation, Warehousing, & Utilities…… 13,600 12,900 700 5.4 13,500 INFORMATION………………………………… 3,400 3,500 -100 -2.9 3,400 FINANCIAL ACTIVITIES……………………… 17,200 17,200 0 0.0 17,100 Finance and Insurance……………………… 13,800 13,900 -100 -0.7 13,900 Insurance Carriers & Related Activities…… 9,300 9,400 -100 -1.1 9,300 PROFESSIONAL & BUSINESS SERVICES 27,800 27,200 600 2.2 26,200 EDUCATION AND HEALTH SERVICES…… 79,000 76,100 2,900 3.8 77,900 Educational Services………………………… 15,800 15,500 300 1.9 15,500 Health Care and Social Assistance………… 63,200 60,600 2,600 4.3 62,400 LEISURE AND HOSPITALITY………………… 29,100 30,600 -1,500 -4.9 26,800 OTHER SERVICES…………………………… 12,800 12,500 300 2.4 12,600 GOVERNMENT ………………………………… 64,500 65,000 -500 -0.8 64,300 Federal………………………………………… 5,700 6,300 -600 -9.5 5,800 State & Local…………………………………… 58,800 58,700 100 0.2 58,500
* State-designated Non-CES areas
THE CONNECTICUT ECONOMIC DIGEST18 June 2016
LABOR FORCE ESTIMATES
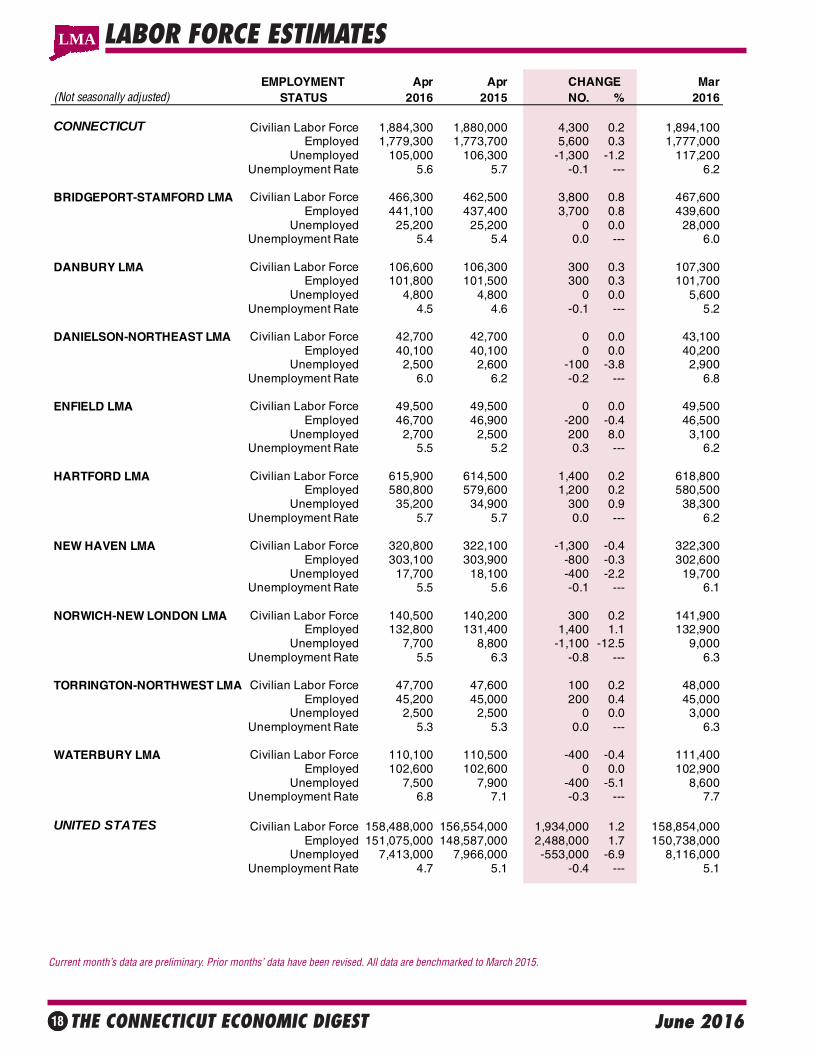
Current month’s data are preliminary. Prior months’ data have been revised. All data are benchmarked to March 2015.
EMPLOYMENT Apr Apr CHANGE Mar(Not seasonally adjusted) STATUS 2016 2015 NO. % 2016
CONNECTICUT Civilian Labor Force 1,884,300 1,880,000 4,300 0.2 1,894,100Employed 1,779,300 1,773,700 5,600 0.3 1,777,000
Unemployed 105,000 106,300 -1,300 -1.2 117,200Unemployment Rate 5.6 5.7 -0.1 --- 6.2
BRIDGEPORT-STAMFORD LMA Civilian Labor Force 466,300 462,500 3,800 0.8 467,600Employed 441,100 437,400 3,700 0.8 439,600
Unemployed 25,200 25,200 0 0.0 28,000Unemployment Rate 5.4 5.4 0.0 --- 6.0
DANBURY LMA Civilian Labor Force 106,600 106,300 300 0.3 107,300Employed 101,800 101,500 300 0.3 101,700
Unemployed 4,800 4,800 0 0.0 5,600Unemployment Rate 4.5 4.6 -0.1 --- 5.2
DANIELSON-NORTHEAST LMA Civilian Labor Force 42,700 42,700 0 0.0 43,100Employed 40,100 40,100 0 0.0 40,200
Unemployed 2,500 2,600 -100 -3.8 2,900Unemployment Rate 6.0 6.2 -0.2 --- 6.8
ENFIELD LMA Civilian Labor Force 49,500 49,500 0 0.0 49,500Employed 46,700 46,900 -200 -0.4 46,500
Unemployed 2,700 2,500 200 8.0 3,100Unemployment Rate 5.5 5.2 0.3 --- 6.2
HARTFORD LMA Civilian Labor Force 615,900 614,500 1,400 0.2 618,800Employed 580,800 579,600 1,200 0.2 580,500
Unemployed 35,200 34,900 300 0.9 38,300Unemployment Rate 5.7 5.7 0.0 --- 6.2
NEW HAVEN LMA Civilian Labor Force 320,800 322,100 -1,300 -0.4 322,300Employed 303,100 303,900 -800 -0.3 302,600
Unemployed 17,700 18,100 -400 -2.2 19,700Unemployment Rate 5.5 5.6 -0.1 --- 6.1
NORWICH-NEW LONDON LMA Civilian Labor Force 140,500 140,200 300 0.2 141,900Employed 132,800 131,400 1,400 1.1 132,900
Unemployed 7,700 8,800 -1,100 -12.5 9,000Unemployment Rate 5.5 6.3 -0.8 --- 6.3
TORRINGTON-NORTHWEST LMA Civilian Labor Force 47,700 47,600 100 0.2 48,000Employed 45,200 45,000 200 0.4 45,000
Unemployed 2,500 2,500 0 0.0 3,000Unemployment Rate 5.3 5.3 0.0 --- 6.3
WATERBURY LMA Civilian Labor Force 110,100 110,500 -400 -0.4 111,400Employed 102,600 102,600 0 0.0 102,900
Unemployed 7,500 7,900 -400 -5.1 8,600Unemployment Rate 6.8 7.1 -0.3 --- 7.7
UNITED STATES Civilian Labor Force 158,488,000 156,554,000 1,934,000 1.2 158,854,000Employed 151,075,000 148,587,000 2,488,000 1.7 150,738,000
Unemployed 7,413,000 7,966,000 -553,000 -6.9 8,116,000Unemployment Rate 4.7 5.1 -0.4 --- 5.1
LMA
THE CONNECTICUT ECONOMIC DIGEST 19June 2016
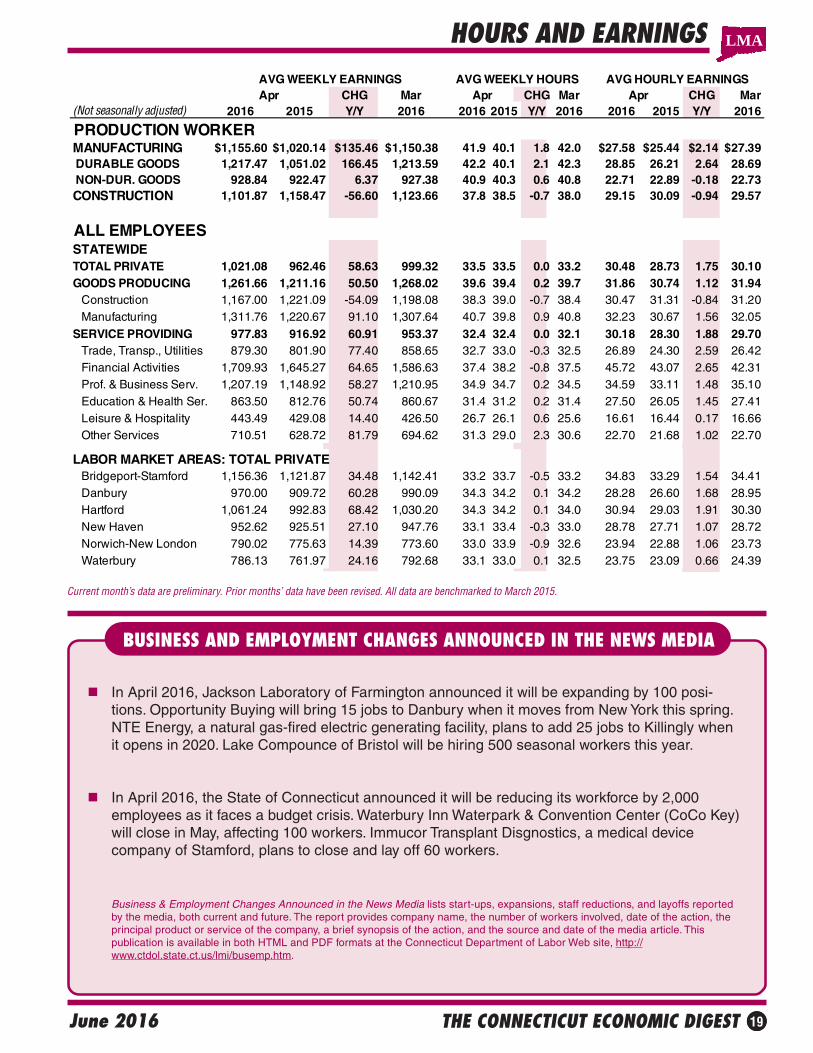
HOURS AND EARNINGS
Current month’s data are preliminary. Prior months’ data have been revised. All data are benchmarked to March 2015.
BUSINESS AND EMPLOYMENT CHANGES ANNOUNCED IN THE NEWS MEDIA
In April 2016, Jackson Laboratory of Farmington announced it will be expanding by 100 posi-tions. Opportunity Buying will bring 15 jobs to Danbury when it moves from New York this spring.NTE Energy, a natural gas-fired electric generating facility, plans to add 25 jobs to Killingly whenit opens in 2020. Lake Compounce of Bristol will be hiring 500 seasonal workers this year.
In April 2016, the State of Connecticut announced it will be reducing its workforce by 2,000employees as it faces a budget crisis. Waterbury Inn Waterpark & Convention Center (CoCo Key)will close in May, affecting 100 workers. Immucor Transplant Disgnostics, a medical devicecompany of Stamford, plans to close and lay off 60 workers.
Business & Employment Changes Announced in the News Media lists start-ups, expansions, staff reductions, and layoffs reportedby the media, both current and future. The report provides company name, the number of workers involved, date of the action, theprincipal product or service of the company, a brief synopsis of the action, and the source and date of the media article. Thispublication is available in both HTML and PDF formats at the Connecticut Department of Labor Web site, http://www.ctdol.state.ct.us/lmi/busemp.htm.
LMA
AVG WEEKLY EARNINGS AVG WEEKLY HOURS AVG HOURLY EARNINGSApr CHG Mar Apr CHG Mar Apr CHG Mar
(Not seasonally adjusted) 2016 2015 Y/Y 2016 2016 2015 Y/Y 2016 2016 2015 Y/Y 2016
PRODUCTION WORKERMANUFACTURING $1,155.60 $1,020.14 $135.46 $1,150.38 41.9 40.1 1.8 42.0 $27.58 $25.44 $2.14 $27.39 DURABLE GOODS 1,217.47 1,051.02 166.45 1,213.59 42.2 40.1 2.1 42.3 28.85 26.21 2.64 28.69 NON-DUR. GOODS 928.84 922.47 6.37 927.38 40.9 40.3 0.6 40.8 22.71 22.89 -0.18 22.73CONSTRUCTION 1,101.87 1,158.47 -56.60 1,123.66 37.8 38.5 -0.7 38.0 29.15 30.09 -0.94 29.57
ALL EMPLOYEESSTATEWIDETOTAL PRIVATE 1,021.08 962.46 58.63 999.32 33.5 33.5 0.0 33.2 30.48 28.73 1.75 30.10GOODS PRODUCING 1,261.66 1,211.16 50.50 1,268.02 39.6 39.4 0.2 39.7 31.86 30.74 1.12 31.94 Construction 1,167.00 1,221.09 -54.09 1,198.08 38.3 39.0 -0.7 38.4 30.47 31.31 -0.84 31.20 Manufacturing 1,311.76 1,220.67 91.10 1,307.64 40.7 39.8 0.9 40.8 32.23 30.67 1.56 32.05SERVICE PROVIDING 977.83 916.92 60.91 953.37 32.4 32.4 0.0 32.1 30.18 28.30 1.88 29.70 Trade, Transp., Utilities 879.30 801.90 77.40 858.65 32.7 33.0 -0.3 32.5 26.89 24.30 2.59 26.42 Financial Activities 1,709.93 1,645.27 64.65 1,586.63 37.4 38.2 -0.8 37.5 45.72 43.07 2.65 42.31 Prof. & Business Serv. 1,207.19 1,148.92 58.27 1,210.95 34.9 34.7 0.2 34.5 34.59 33.11 1.48 35.10 Education & Health Ser. 863.50 812.76 50.74 860.67 31.4 31.2 0.2 31.4 27.50 26.05 1.45 27.41 Leisure & Hospitality 443.49 429.08 14.40 426.50 26.7 26.1 0.6 25.6 16.61 16.44 0.17 16.66 Other Services 710.51 628.72 81.79 694.62 31.3 29.0 2.3 30.6 22.70 21.68 1.02 22.70
LABOR MARKET AREAS: TOTAL PRIVATE Bridgeport-Stamford 1,156.36 1,121.87 34.48 1,142.41 33.2 33.7 -0.5 33.2 34.83 33.29 1.54 34.41 Danbury 970.00 909.72 60.28 990.09 34.3 34.2 0.1 34.2 28.28 26.60 1.68 28.95 Hartford 1,061.24 992.83 68.42 1,030.20 34.3 34.2 0.1 34.0 30.94 29.03 1.91 30.30 New Haven 952.62 925.51 27.10 947.76 33.1 33.4 -0.3 33.0 28.78 27.71 1.07 28.72 Norwich-New London 790.02 775.63 14.39 773.60 33.0 33.9 -0.9 32.6 23.94 22.88 1.06 23.73 Waterbury 786.13 761.97 24.16 792.68 33.1 33.0 0.1 32.5 23.75 23.09 0.66 24.39

THE CONNECTICUT ECONOMIC DIGEST20 June 2016
LABOR FORCE ESTIMATES BY TOWN
APRIL 2016(By Place of Residence - Not Seasonally Adjusted)
The civilian labor force comprises all state residents age 16 years and older classified as employed or unemployed in accordance with criteria described below.Excluded are members of the military and persons in institutions (correctional and mental health, for example).
The employed are all persons who did any work as paid employees or in their own business during the survey week, or who have worked 15 hours or more asunpaid workers in an enterprise operated by a family member. Persons temporarily absent from a job because of illness, bad weather, strike or for personalreasons are also counted as employed whether they were paid by their employer or were seeking other jobs.
The unemployed are all persons who did not work, but were available for work during the survey week (except for temporary illness) and made specific efforts tofind a job in the prior four weeks. Persons waiting to be recalled to a job from which they had been laid off need not be looking for work to be classified asunemployed.
LABOR FORCE CONCEPTS
Town
All Labor Market Areas (LMAs) in Connecticut except three are federally-designated areas for developing labor statistics. For the sake of simplicity, thefederal Bridgeport-Stamford-Norwalk NECTA is referred to in Connecticut DOLpublications as the Bridgeport-Stamford LMA, and the Hartford-West Hartford-East Hartford NECTA is the Hartford LMA. The northwest part of the state isnow called Torrington-Northwest LMA. Five towns which are part of theSpringfield, MA area are published as the Enfield LMA. The towns of Eastfordand Hampton and other towns in the northeast are now called Danielson-Northeast LMA.
LMA/TOWNS LABOR FORCE EMPLOYED UNEMPLOYED % LMA/TOWNS LABOR FORCE EMPLOYED UNEMPLOYED %BRIDGEPORT-STAMFORD HARTFORD cont...
466,292 441,056 25,236 5.4 Canton 5,655 5,430 225 4.0Ansonia 9,388 8,684 704 7.5 Chaplin 1,264 1,189 75 5.9Bridgeport 71,088 64,985 6,103 8.6 Colchester 9,321 8,923 398 4.3Darien 8,636 8,256 380 4.4 Columbia 3,150 3,023 127 4.0Derby 6,821 6,354 467 6.8 Coventry 7,698 7,359 339 4.4Easton 3,864 3,715 149 3.9 Cromwell 7,916 7,550 366 4.6Fairfield 29,186 27,838 1,348 4.6 East Granby 3,053 2,937 116 3.8Greenwich 28,920 27,793 1,127 3.9 East Haddam 4,980 4,738 242 4.9Milford 29,565 28,167 1,398 4.7 East Hampton 7,624 7,279 345 4.5Monroe 10,245 9,734 511 5.0 East Hartford 27,492 25,340 2,152 7.8New Canaan 8,355 8,028 327 3.9 Ellington 8,990 8,576 414 4.6Norwalk 50,638 48,201 2,437 4.8 Farmington 14,026 13,483 543 3.9Oxford 7,078 6,739 339 4.8 Glastonbury 18,814 18,126 688 3.7Redding 4,500 4,309 191 4.2 Granby 6,765 6,479 286 4.2Ridgefield 11,865 11,423 442 3.7 Haddam 4,979 4,782 197 4.0Seymour 9,009 8,460 549 6.1 Hartford 54,092 48,235 5,857 10.8Shelton 22,148 20,955 1,193 5.4 Hartland 1,136 1,090 46 4.0Southbury 8,849 8,384 465 5.3 Harwinton 3,227 3,078 149 4.6Stamford 69,794 66,619 3,175 4.5 Hebron 5,405 5,197 208 3.8Stratford 27,725 25,851 1,874 6.8 Lebanon 3,969 3,793 176 4.4Trumbull 18,122 17,278 844 4.7 Manchester 32,545 30,727 1,818 5.6Weston 4,443 4,250 193 4.3 Mansfield 12,369 11,786 583 4.7Westport 12,629 12,145 484 3.8 Marlborough 3,576 3,429 147 4.1Wilton 8,524 8,166 358 4.2 Middletown 26,010 24,624 1,386 5.3Woodbridge 4,900 4,722 178 3.6 New Britain 36,562 33,465 3,097 8.5
New Hartford 4,034 3,844 190 4.7DANBURY 106,617 101,841 4,776 4.5 Newington 17,176 16,323 853 5.0Bethel 10,680 10,196 484 4.5 Plainville 10,380 9,825 555 5.3Bridgewater 845 818 27 3.2 Plymouth 6,705 6,278 427 6.4Brookfield 9,347 8,936 411 4.4 Portland 5,470 5,204 266 4.9Danbury 46,913 44,874 2,039 4.3 Rocky Hill 11,354 10,867 487 4.3New Fairfield 7,236 6,910 326 4.5 Scotland 958 907 51 5.3New Milford 15,344 14,643 701 4.6 Simsbury 12,912 12,441 471 3.6Newtown 14,377 13,678 699 4.9 Southington 24,213 23,070 1,143 4.7Sherman 1,875 1,786 89 4.7 South Windsor 13,937 13,320 617 4.4
Stafford 6,736 6,344 392 5.8ENFIELD 49,468 46,736 2,732 5.5 Thomaston 4,663 4,451 212 4.5East Windsor 6,496 6,106 390 6.0 Tolland 8,493 8,167 326 3.8Enfield 23,041 21,682 1,359 5.9 Union 458 439 19 4.1Somers 5,125 4,881 244 4.8 Vernon 17,011 16,082 929 5.5Suffield 7,475 7,151 324 4.3 West Hartford 34,127 32,773 1,354 4.0Windsor Locks 7,331 6,916 415 5.7 Wethersfield 13,984 13,275 709 5.1
Willington 3,598 3,442 156 4.3HARTFORD 615,940 580,756 35,184 5.7 Windham 11,963 11,224 739 6.2Andover 1,924 1,842 82 4.3 Windsor 16,474 15,577 897 5.4Ashford 2,515 2,397 118 4.7Avon 9,307 8,974 333 3.6Barkhamsted 2,296 2,176 120 5.2Berlin 11,655 11,098 557 4.8Bloomfield 11,442 10,728 714 6.2Bolton 3,153 3,026 127 4.0Bristol 32,845 30,738 2,107 6.4Burlington 5,539 5,286 253 4.6

THE CONNECTICUT ECONOMIC DIGEST 21June 2016
LABOR FORCE ESTIMATES BY TOWN
The unemployment rate represents the number unemployed as a percent of the civilian labor force.
With the exception of those persons temporarily absent from a job or waiting to be recalled to one, persons with no job and who are not actively looking for oneare counted as "not in the labor force".
Over the course of a year, the size of the labor force and the levels of employment undergo fluctuations due to such seasonal events as changes in weather,reduced or expanded production, harvests, major holidays and the opening and closing of schools. Because these seasonal events follow a regular pattern eachyear, their influence on statistical trends can be eliminated by adjusting the monthly statistics. Seasonal Adjustment makes it easier to observe cyclical and othernonseasonal developments.
(By Place of Residence - Not Seasonally Adjusted)
APRIL 2016
LABOR FORCE CONCEPTS (Continued)
Town
LMA/TOWNS LABOR FORCE EMPLOYED UNEMPLOYED % LMA/TOWNS LABOR FORCE EMPLOYED UNEMPLOYED %NEW HAVEN 320,776 303,104 17,672 5.5 TORRINGTON-NORTHWESTBethany 3,070 2,940 130 4.2 47,714 45,165 2,549 5.3Branford 15,904 15,113 791 5.0 Canaan 691 664 27 3.9Cheshire 15,311 14,735 576 3.8 Colebrook 857 812 45 5.3Chester 2,358 2,268 90 3.8 Cornwall 762 738 24 3.1Clinton 7,170 6,856 314 4.4 Goshen 1,567 1,495 72 4.6Deep River 2,903 2,779 124 4.3 Kent 1,533 1,470 63 4.1Durham 4,237 4,072 165 3.9 Litchfield 4,773 4,567 206 4.3East Haven 15,677 14,708 969 6.2 Morris 1,379 1,326 53 3.8Essex 3,374 3,228 146 4.3 Norfolk 902 853 49 5.4Guilford 12,824 12,340 484 3.8 North Canaan 1,717 1,637 80 4.7Hamden 34,679 33,006 1,673 4.8 Roxbury 1,324 1,279 45 3.4Killingworth 3,803 3,659 144 3.8 Salisbury 1,792 1,740 52 2.9Madison 8,991 8,639 352 3.9 Sharon 1,465 1,415 50 3.4Meriden 31,882 29,686 2,196 6.9 Torrington 19,760 18,466 1,294 6.5Middlefield 2,488 2,375 113 4.5 Warren 789 755 34 4.3New Haven 63,246 58,705 4,541 7.2 Washington 2,046 1,982 64 3.1North Branford 8,144 7,780 364 4.5 Winchester 6,357 5,966 391 6.2North Haven 13,243 12,665 578 4.4Old Saybrook 5,078 4,844 234 4.6 WATERBURY 110,111 102,623 7,488 6.8Orange 7,182 6,880 302 4.2 Beacon Falls 3,373 3,204 169 5.0Wallingford 25,916 24,654 1,262 4.9 Bethlehem 1,916 1,823 93 4.9West Haven 29,680 27,732 1,948 6.6 Middlebury 3,815 3,649 166 4.4Westbrook 3,616 3,440 176 4.9 Naugatuck 17,128 16,043 1,085 6.3
Prospect 5,481 5,236 245 4.5*NORWICH-NEW LONDON-WESTERLY, CT PART Waterbury 50,307 45,872 4,435 8.8
124,692 117,868 6,824 5.5 Watertown 12,783 12,178 605 4.7Bozrah 1,429 1,352 77 5.4 Wolcott 9,738 9,286 452 4.6Canterbury 2,843 2,683 160 5.6 Woodbury 5,570 5,332 238 4.3East Lyme 8,573 8,142 431 5.0Franklin 1,048 999 49 4.7 DANIELSON-NORTHEASTGriswold 6,239 5,812 427 6.8 42,672 40,133 2,539 6.0Groton 18,258 17,376 882 4.8 Brooklyn 4,101 3,885 216 5.3Ledyard 7,871 7,514 357 4.5 Eastford 901 864 37 4.1Lisbon 2,317 2,183 134 5.8 Hampton 1,015 960 55 5.4Lyme 1,210 1,167 43 3.6 Killingly 9,529 8,880 649 6.8Montville 9,209 8,700 509 5.5 Plainfield 8,607 8,046 561 6.5New London 11,894 10,997 897 7.5 Pomfret 2,455 2,360 95 3.9No. Stonington 2,875 2,759 116 4.0 Putnam 4,794 4,490 304 6.3Norwich 20,027 18,731 1,296 6.5 Sterling 2,031 1,897 134 6.6Old Lyme 3,758 3,612 146 3.9 Thompson 5,170 4,872 298 5.8Preston 2,375 2,249 126 5.3 Woodstock 4,069 3,879 190 4.7Salem 2,109 2,012 97 4.6Sprague 1,611 1,516 95 5.9Stonington 9,613 9,199 414 4.3Voluntown 1,435 1,352 83 5.8Waterford 9,998 9,513 485 4.9
Not Seasonally Adjusted:CONNECTICUT 1,884,300 1,779,300 105,000 5.6
*Connecticut portion only. For whole NECTA,including RI part, see below. UNITED STATES 158,488,000 151,075,000 7,413,000 4.7NORWICH-NEW LONDON-WESTERLY, CT-RI
140,521 132,827 7,694 5.5 Seasonally Adjusted:RI part 15,829 14,959 870 5.5 CONNECTICUT 1,905,100 1,795,700 109,500 5.7(Hopkinton and Westerly) UNITED STATES 158,924,000 151,004,000 7,920,000 5.0
THE CONNECTICUT ECONOMIC DIGEST22 June 2016
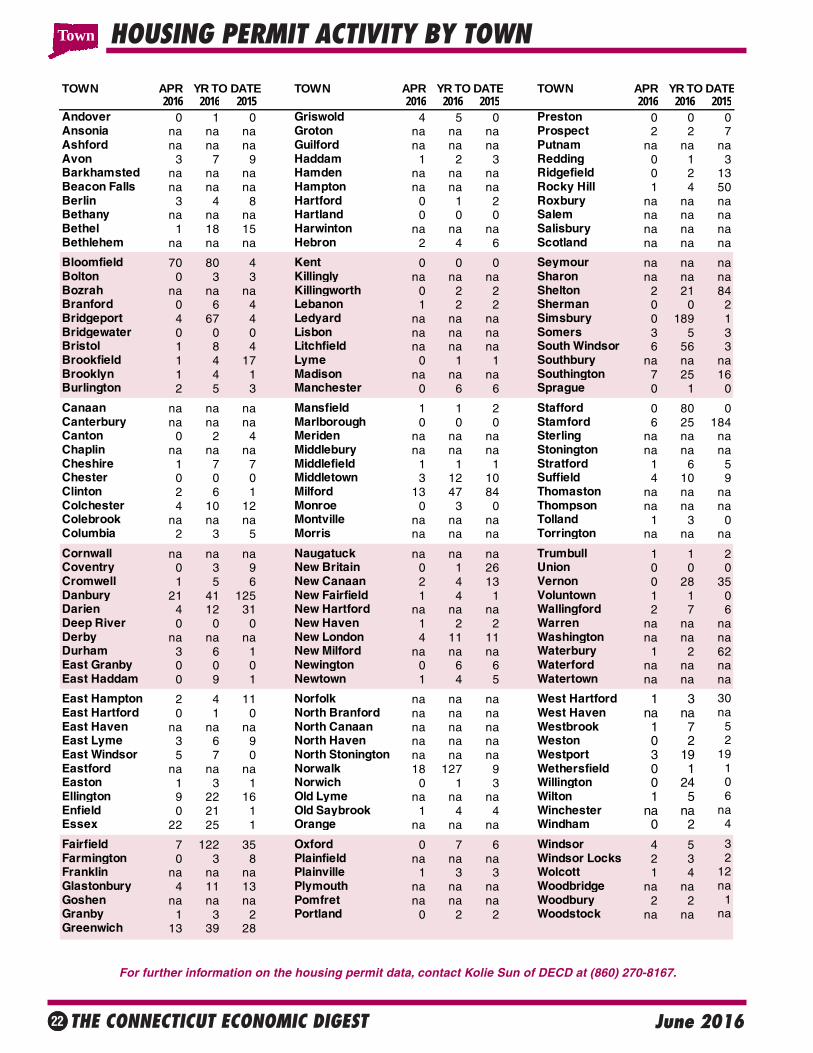
HOUSING PERMIT ACTIVITY BY TOWN
For further information on the housing permit data, contact Kolie Sun of DECD at (860) 270-8167.
TOWN APR YR TO DATE TOWN APR YR TO DATE TOWN APR YR TO DATE2016 2016 2015 2016 2016 2015 2016 2016 2015
Andover 0 1 0 Griswold 4 5 0 Preston 0 0 0Ansonia na na na Groton na na na Prospect 2 2 7Ashford na na na Guilford na na na Putnam na na naAvon 3 7 9 Haddam 1 2 3 Redding 0 1 3Barkhamsted na na na Hamden na na na Ridgefield 0 2 13Beacon Falls na na na Hampton na na na Rocky Hill 1 4 50Berlin 3 4 8 Hartford 0 1 2 Roxbury na na naBethany na na na Hartland 0 0 0 Salem na na naBethel 1 18 15 Harwinton na na na Salisbury na na naBethlehem na na na Hebron 2 4 6 Scotland na na na
Bloomfield 70 80 4 Kent 0 0 0 Seymour na na naBolton 0 3 3 Killingly na na na Sharon na na naBozrah na na na Killingworth 0 2 2 Shelton 2 21 84Branford 0 6 4 Lebanon 1 2 2 Sherman 0 0 2Bridgeport 4 67 4 Ledyard na na na Simsbury 0 189 1Bridgewater 0 0 0 Lisbon na na na Somers 3 5 3Bristol 1 8 4 Litchfield na na na South Windsor 6 56 3Brookfield 1 4 17 Lyme 0 1 1 Southbury na na naBrooklyn 1 4 1 Madison na na na Southington 7 25 16Burlington 2 5 3 Manchester 0 6 6 Sprague 0 1 0
Canaan na na na Mansfield 1 1 2 Stafford 0 80 0Canterbury na na na Marlborough 0 0 0 Stamford 6 25 184Canton 0 2 4 Meriden na na na Sterling na na naChaplin na na na Middlebury na na na Stonington na na naCheshire 1 7 7 Middlefield 1 1 1 Stratford 1 6 5Chester 0 0 0 Middletown 3 12 10 Suffield 4 10 9Clinton 2 6 1 Milford 13 47 84 Thomaston na na naColchester 4 10 12 Monroe 0 3 0 Thompson na na naColebrook na na na Montville na na na Tolland 1 3 0Columbia 2 3 5 Morris na na na Torrington na na na
Cornwall na na na Naugatuck na na na Trumbull 1 1 2Coventry 0 3 9 New Britain 0 1 26 Union 0 0 0Cromwell 1 5 6 New Canaan 2 4 13 Vernon 0 28 35Danbury 21 41 125 New Fairfield 1 4 1 Voluntown 1 1 0Darien 4 12 31 New Hartford na na na Wallingford 2 7 6Deep River 0 0 0 New Haven 1 2 2 Warren na na naDerby na na na New London 4 11 11 Washington na na naDurham 3 6 1 New Milford na na na Waterbury 1 2 62East Granby 0 0 0 Newington 0 6 6 Waterford na na naEast Haddam 0 9 1 Newtown 1 4 5 Watertown na na na
East Hampton 2 4 11 Norfolk na na na West Hartford 1 3 30East Hartford 0 1 0 North Branford na na na West Haven na na naEast Haven na na na North Canaan na na na Westbrook 1 7 5East Lyme 3 6 9 North Haven na na na Weston 0 2 2East Windsor 5 7 0 North Stonington na na na Westport 3 19 19Eastford na na na Norwalk 18 127 9 Wethersfield 0 1 1Easton 1 3 1 Norwich 0 1 3 Willington 0 24 0Ellington 9 22 16 Old Lyme na na na Wilton 1 5 6Enfield 0 21 1 Old Saybrook 1 4 4 Winchester na na naEssex 22 25 1 Orange na na na Windham 0 2 4
Fairfield 7 122 35 Oxford 0 7 6 Windsor 4 5 3Farmington 0 3 8 Plainfield na na na Windsor Locks 2 3 2Franklin na na na Plainville 1 3 3 Wolcott 1 4 12Glastonbury 4 11 13 Plymouth na na na Woodbridge na na naGoshen na na na Pomfret na na na Woodbury 2 2 1Granby 1 3 2 Portland 0 2 2 Woodstock na na naGreenwich 13 39 28
Town
THE CONNECTICUT ECONOMIC DIGEST 23June 2016
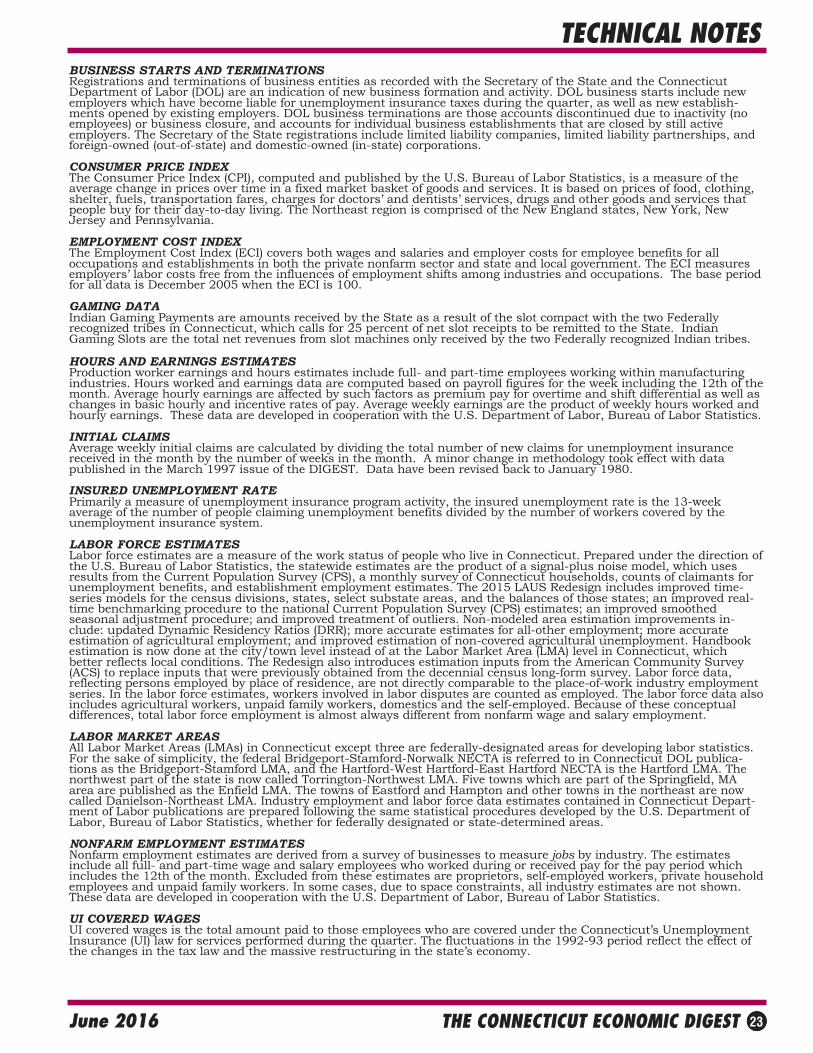
TECHNICAL NOTESBUSINESS STARTS AND TERMINATIONSRegistrations and terminations of business entities as recorded with the Secretary of the State and the ConnecticutDepartment of Labor (DOL) are an indication of new business formation and activity. DOL business starts include newemployers which have become liable for unemployment insurance taxes during the quarter, as well as new establish-ments opened by existing employers. DOL business terminations are those accounts discontinued due to inactivity (noemployees) or business closure, and accounts for individual business establishments that are closed by still activeemployers. The Secretary of the State registrations include limited liability companies, limited liability partnerships, andforeign-owned (out-of-state) and domestic-owned (in-state) corporations.
CONSUMER PRICE INDEXThe Consumer Price Index (CPI), computed and published by the U.S. Bureau of Labor Statistics, is a measure of theaverage change in prices over time in a fixed market basket of goods and services. It is based on prices of food, clothing,shelter, fuels, transportation fares, charges for doctors’ and dentists’ services, drugs and other goods and services thatpeople buy for their day-to-day living. The Northeast region is comprised of the New England states, New York, NewJersey and Pennsylvania.
EMPLOYMENT COST INDEXThe Employment Cost Index (ECI) covers both wages and salaries and employer costs for employee benefits for alloccupations and establishments in both the private nonfarm sector and state and local government. The ECI measuresemployers’ labor costs free from the influences of employment shifts among industries and occupations. The base periodfor all data is December 2005 when the ECI is 100.
GAMING DATAIndian Gaming Payments are amounts received by the State as a result of the slot compact with the two Federallyrecognized tribes in Connecticut, which calls for 25 percent of net slot receipts to be remitted to the State. IndianGaming Slots are the total net revenues from slot machines only received by the two Federally recognized Indian tribes.
HOURS AND EARNINGS ESTIMATESProduction worker earnings and hours estimates include full- and part-time employees working within manufacturingindustries. Hours worked and earnings data are computed based on payroll figures for the week including the 12th of themonth. Average hourly earnings are affected by such factors as premium pay for overtime and shift differential as well aschanges in basic hourly and incentive rates of pay. Average weekly earnings are the product of weekly hours worked andhourly earnings. These data are developed in cooperation with the U.S. Department of Labor, Bureau of Labor Statistics.
INITIAL CLAIMSAverage weekly initial claims are calculated by dividing the total number of new claims for unemployment insurancereceived in the month by the number of weeks in the month. A minor change in methodology took effect with datapublished in the March 1997 issue of the DIGEST. Data have been revised back to January 1980.
INSURED UNEMPLOYMENT RATEPrimarily a measure of unemployment insurance program activity, the insured unemployment rate is the 13-weekaverage of the number of people claiming unemployment benefits divided by the number of workers covered by theunemployment insurance system.
LABOR FORCE ESTIMATESLabor force estimates are a measure of the work status of people who live in Connecticut. Prepared under the direction ofthe U.S. Bureau of Labor Statistics, the statewide estimates are the product of a signal-plus noise model, which usesresults from the Current Population Survey (CPS), a monthly survey of Connecticut households, counts of claimants forunemployment benefits, and establishment employment estimates. The 2015 LAUS Redesign includes improved time-series models for the census divisions, states, select substate areas, and the balances of those states; an improved real-time benchmarking procedure to the national Current Population Survey (CPS) estimates; an improved smoothedseasonal adjustment procedure; and improved treatment of outliers. Non-modeled area estimation improvements in-clude: updated Dynamic Residency Ratios (DRR); more accurate estimates for all-other employment; more accurateestimation of agricultural employment; and improved estimation of non-covered agricultural unemployment. Handbookestimation is now done at the city/town level instead of at the Labor Market Area (LMA) level in Connecticut, whichbetter reflects local conditions. The Redesign also introduces estimation inputs from the American Community Survey(ACS) to replace inputs that were previously obtained from the decennial census long-form survey. Labor force data,reflecting persons employed by place of residence, are not directly comparable to the place-of-work industry employmentseries. In the labor force estimates, workers involved in labor disputes are counted as employed. The labor force data alsoincludes agricultural workers, unpaid family workers, domestics and the self-employed. Because of these conceptualdifferences, total labor force employment is almost always different from nonfarm wage and salary employment.
LABOR MARKET AREASAll Labor Market Areas (LMAs) in Connecticut except three are federally-designated areas for developing labor statistics.For the sake of simplicity, the federal Bridgeport-Stamford-Norwalk NECTA is referred to in Connecticut DOL publica-tions as the Bridgeport-Stamford LMA, and the Hartford-West Hartford-East Hartford NECTA is the Hartford LMA. Thenorthwest part of the state is now called Torrington-Northwest LMA. Five towns which are part of the Springfield, MAarea are published as the Enfield LMA. The towns of Eastford and Hampton and other towns in the northeast are nowcalled Danielson-Northeast LMA. Industry employment and labor force data estimates contained in Connecticut Depart-ment of Labor publications are prepared following the same statistical procedures developed by the U.S. Department ofLabor, Bureau of Labor Statistics, whether for federally designated or state-determined areas.
NONFARM EMPLOYMENT ESTIMATESNonfarm employment estimates are derived from a survey of businesses to measure jobs by industry. The estimatesinclude all full- and part-time wage and salary employees who worked during or received pay for the pay period whichincludes the 12th of the month. Excluded from these estimates are proprietors, self-employed workers, private householdemployees and unpaid family workers. In some cases, due to space constraints, all industry estimates are not shown.These data are developed in cooperation with the U.S. Department of Labor, Bureau of Labor Statistics.
UI COVERED WAGESUI covered wages is the total amount paid to those employees who are covered under the Connecticut’s UnemploymentInsurance (UI) law for services performed during the quarter. The fluctuations in the 1992-93 period reflect the effect ofthe changes in the tax law and the massive restructuring in the state’s economy.
ECONOMIC INDICATORS AT A GLANCE
Leading General Drift Indicator ..... +6.9Coincident General Drift Indicator +1.1Farmington Bank Bus. Barometer +1.9Phil. Fed’s CT Coincident Index .... +3.4
Total Nonfarm Employment........... +1.2
Labor Force ..................................... +0.5Employed ......................................... +0.5Unemployed .................................... +0.4Unemployment Rate ..................... -0.1*Labor Force Participation Rate ......... +0.1Employment-Population Ratio .......... +0.1
Average Weekly Initial Claims ........ -7.2Avg Insured Unempl. Rate ........... -0.24*U-6 Rate ......................................... -1.8*
Prod. Worker Avg Wkly Hrs, Mfg .... +4.5PW Avg Hourly Earnings, Mfg ....... +8.4PW Avg Weekly Earnings, Mfg .... +13.3CT Mfg. Production Index .............. +1.0 Production Worker Hours ............... +6.8 Industrial Electricity Sales ............... -4.6
Personal Income ............................ +2.8UI Covered Wages .......................... +2.3
Business Activity New Housing Permits .................... -10.4 Electricity Sales ............................ -10.3 Construction Contracts Index ........ -45.9 New Auto Registrations ................ +42.6 Exports ........................................... -4.0 S&P 500: Monthly Close ................. -1.0
Business Starts Secretary of the State .................. +42.5 Dept. of Labor ................................. -1.6
Business Terminations Secretary of the State ..................... -9.1 Dept. of Labor ................................ +0.1
State Revenues ............................... -5.9 Corporate Tax ............................. +101.9 Personal Income Tax ........................ -4.3 Real Estate Conveyance Tax ......... +17.7 Sales & Use Tax ............................. -21.6 Gaming Payments .......................... +2.4
Tourism and Travel Occupancy Rate ............................ +2.1 Attraction Visitors ........................... +3.0 Air Passenger Count ........................ NA Gaming Slots ................................. +4.3
Employment Cost Index (U.S.) Total ............................................... +1.8 Wages & Salaries........................... +2.0 Benefit Costs ................................. +1.2
Consumer Prices U.S. City Average ........................... +1.1 Northeast Region ........................... +1.0 NY-NJ-Long Island ......................... +1.0 Boston-Brockton-Nashua ............... +0.6
Interest Rates Prime .......................................... +0.25* Conventional Mortgage ................ -0.06*
Mailing address:
Connecticut Economic DigestConnecticut Department of Labor
Office of Research200 Folly Brook Boulevard
Wethersfield, CT 06109-1114
THE CONNECTICUT ECONOMIC DIGEST
*Percentage point change; **Less than 0.05 percent; NA = Not Available
The Connecticut Economic Digest is available on the internet at:
http://www.ctdol.state.ct.us/lmi
June 2016
(Percent change from prior year; see pages 4-8 for reference months or quarters)
THE CONNECTICUT
A joint publication of The Connecticut Departments of Labor and Economic and Community Development
ECONOMIC DIGEST
If you wish to have your name removed from our mailing list, please
check here and return this page (or a photocopy) to the address at left.
If your address has changed, please check here, make the necessary
changes to your address label and return this page to the address at left.
If you receive more than one copy of this publication, please check
here and return this page from the duplicate copy to the address at left.
DO YOU WANT TO BE NOTIFIED BY EMAIL WHEN THEDIGEST IS PUBLISHED EACH MONTH?
Simply email to [email protected] with only the following inthe body of the message, leave subject blank:SUBSCRIBE DOL-CTEconomicDigest your_name(type in your name where it says your_name)
Related Documents