Welcome message from author
This document is posted to help you gain knowledge. Please leave a comment to let me know what you think about it! Share it to your friends and learn new things together.
Transcript

The Condition of South CarolinaThe Condition of South CarolinaThe Condition of South CarolinaThe Condition of South CarolinaThe Condition of South Carolina’s’s’s’s’sEstuarine and Coastal HabitatsEstuarine and Coastal HabitatsEstuarine and Coastal HabitatsEstuarine and Coastal HabitatsEstuarine and Coastal Habitats
During 1999-2000During 1999-2000During 1999-2000During 1999-2000During 1999-2000
Summary RSummary RSummary RSummary RSummary Reporteporteporteporteport
An Interagency Assessment ofAn Interagency Assessment ofAn Interagency Assessment ofAn Interagency Assessment ofAn Interagency Assessment ofSouth CarolinaSouth CarolinaSouth CarolinaSouth CarolinaSouth Carolina’s Coastal Zone’s Coastal Zone’s Coastal Zone’s Coastal Zone’s Coastal Zone
UNITED STATES
EN
VIR
ON
ME
N
TA LP R O T E C
TIO
NA
GE
NC
Y
D H E C
PROMOTE PROTECT P R O S P E R
South Carolina Department of Health
and Environmental Control
The Condition of South CarolinaThe Condition of South CarolinaThe Condition of South CarolinaThe Condition of South CarolinaThe Condition of South Carolina’s’s’s’s’sEstuarine and Coastal HabitatsEstuarine and Coastal HabitatsEstuarine and Coastal HabitatsEstuarine and Coastal HabitatsEstuarine and Coastal Habitats
During 1999 - 2000During 1999 - 2000During 1999 - 2000During 1999 - 2000During 1999 - 2000
Summary RSummary RSummary RSummary RSummary Reporteporteporteporteport
Prepared by:
R.F. Van Dolah, P.C. Jutte, G.H.M. Riekerk,M.V. Levisen, L.E. Zimmerman, J.D. Jones, A.J. Lewitus
Marine Resources DivisionSouth Carolina Department of Natural Resources
P.O. Box 12559Charleston, SC 29412
D.E. Chestnut, and W. McDermott
Bureau of WaterSouth Carolina Department of Health and Environmental Control
2600 Bull StreetColumbia, SC 29201
D. Bearden, G.I. Scott, M. H. Fulton
Center for Coastal Environmental Health and Biomolecular ResearchNOAA NOS CCEHBR Laboratory
219 Ft. Johnson RdCharleston, SC 29412
2002
This document should be cited as follows:
Van Dolah, R.F., P.C. Jutte, G.H.M. Riekerk, M.V. Levisen, L.E. Zimmerman, J.D. Jones, A.J. Lewitus, D.E. Chest-nut, W. McDermott, D. Bearden, G.I. Scott, M.H. Fulton. 2002. The Condition of South Carolina’s Estuarine andCoastal Habitats During 1999-2000: Summary Report. Charleston, SC: South Carolina Marine Resources Division.Educational Report No. 20, 23p.
ACKNOWLEDGEMENTSACKNOWLEDGEMENTSACKNOWLEDGEMENTSACKNOWLEDGEMENTSACKNOWLEDGEMENTSThe South Carolina Estuarine and Coastal Assessment Program is supported through funding from several
agencies, including the South Carolina Department of Natural Resources, the South Carolina Department of Healthand Environmental Control, the U.S. Environmental Protection Agency, Office of Research and Development –National Coastal Assessment Program under Cooperative Agreement R-82847201-0, and the U.S. Fish and WildlifeService Sport Fish Restoration Act Grant No. D70. A portion of the 1999 pilot study was supported by the NationalOceanic and Atmospheric Administration through coordination with the NOAA-USEPA EMAP Study in the Carolin-ian Province. The counties of Beaufort, Charleston, Georgetown and Horry also provided funding to purchase waterquality instrumentation that is a critical element of this program. Finally, staff with the USEPA NHEERL inCorvallis, OR provided technical assistance in developing the sampling design and statistical routines used for thisprogram.
Graphic Design by Karen Swanson, SCDNR/MRD

TTTTTABLE OF CONTENTSABLE OF CONTENTSABLE OF CONTENTSABLE OF CONTENTSABLE OF CONTENTS
INTRODUCTIONINTRODUCTIONINTRODUCTIONINTRODUCTIONINTRODUCTION ........................................................................................................................................................................................................................................................................................................................................................................ 11111
STUDSTUDSTUDSTUDSTUDY DESIGNY DESIGNY DESIGNY DESIGNY DESIGN .................................................................................................................................................................................................................................................................................................................................................................................. 11111Measurements TMeasurements TMeasurements TMeasurements TMeasurements Takenakenakenakenaken .................................................................................................................................................................................................................................................................................................................................................................................. 22222
FINDINGSFINDINGSFINDINGSFINDINGSFINDINGS .......................................................................................................................................................................................................................................................................................................................................................................................................................... 44444WWWWWater Qualityater Qualityater Qualityater Qualityater Quality......................................................................................................................................................................................................................................................................................................................................................................................................................................... 44444
Dissolved Oxygen .......................................................................... 5pH................................................................................................ 6Nutrients ....................................................................................... 7Biochemical Oxygen Demand ........................................................ 9Fecal Coliform Bacteria .................................................................. 9Integrated Water Quality Measure ................................................ 10
Sediment QualitySediment QualitySediment QualitySediment QualitySediment Quality ...................................................................................................................................................................................................................................................................................................................................................................................................... 1111111111Contaminants .............................................................................. 11Toxicity ........................................................................................ 12Integrated Assessment of Sediment Quality .................................... 13
Biological ConditionBiological ConditionBiological ConditionBiological ConditionBiological Condition ............................................................................................................................................................................................................................................................................................................................................................................. 1414141414Phytoplankton.............................................................................. 14Benthic Communities ................................................................... 15Finfish and Crustacean Communities ............................................ 15
Integrated Measure of South CarolinaIntegrated Measure of South CarolinaIntegrated Measure of South CarolinaIntegrated Measure of South CarolinaIntegrated Measure of South Carolina’s’s’s’s’sEstuarine Habitat QualityEstuarine Habitat QualityEstuarine Habitat QualityEstuarine Habitat QualityEstuarine Habitat Quality .......................................................................................................................................................................................................................................................................................................................................... 1717171717
CONCLCONCLCONCLCONCLCONCLUSIONSUSIONSUSIONSUSIONSUSIONS ................................................................................................................................................................................................................................................................................................................................................................... 2121212121
LITERALITERALITERALITERALITERATURE CITEDTURE CITEDTURE CITEDTURE CITEDTURE CITED .................................................................................................................................................................................................................................................................................................................................................... 2222222222
1
INTRODUCTIONINTRODUCTIONINTRODUCTIONINTRODUCTIONINTRODUCTIONThe South Carolina Department of Natural Re-
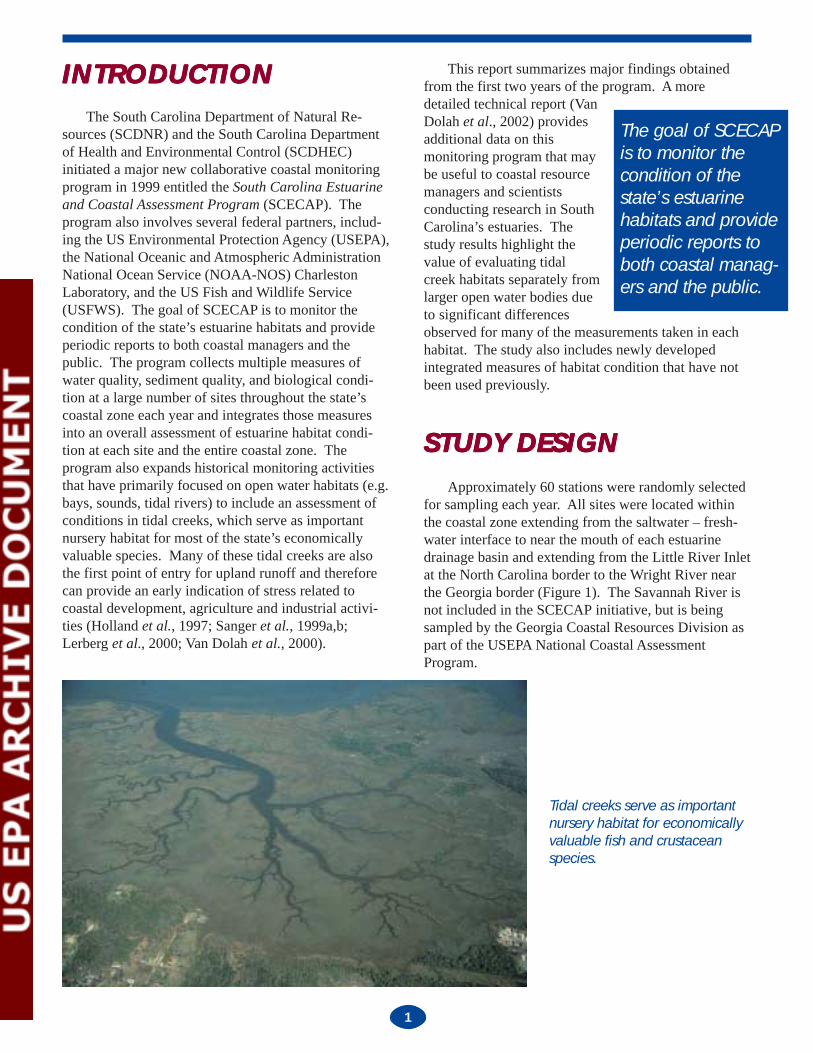
sources (SCDNR) and the South Carolina Departmentof Health and Environmental Control (SCDHEC)initiated a major new collaborative coastal monitoringprogram in 1999 entitled the South Carolina Estuarineand Coastal Assessment Program (SCECAP). Theprogram also involves several federal partners, includ-ing the US Environmental Protection Agency (USEPA),the National Oceanic and Atmospheric AdministrationNational Ocean Service (NOAA-NOS) CharlestonLaboratory, and the US Fish and Wildlife Service(USFWS). The goal of SCECAP is to monitor thecondition of the state’s estuarine habitats and provideperiodic reports to both coastal managers and thepublic. The program collects multiple measures ofwater quality, sediment quality, and biological condi-tion at a large number of sites throughout the state’scoastal zone each year and integrates those measuresinto an overall assessment of estuarine habitat condi-tion at each site and the entire coastal zone. Theprogram also expands historical monitoring activitiesthat have primarily focused on open water habitats (e.g.bays, sounds, tidal rivers) to include an assessment ofconditions in tidal creeks, which serve as importantnursery habitat for most of the state’s economicallyvaluable species. Many of these tidal creeks are alsothe first point of entry for upland runoff and thereforecan provide an early indication of stress related tocoastal development, agriculture and industrial activi-ties (Holland et al., 1997; Sanger et al., 1999a,b;Lerberg et al., 2000; Van Dolah et al., 2000).
This report summarizes major findings obtainedfrom the first two years of the program. A moredetailed technical report (VanDolah et al., 2002) providesadditional data on thismonitoring program that maybe useful to coastal resourcemanagers and scientistsconducting research in SouthCarolina’s estuaries. Thestudy results highlight thevalue of evaluating tidalcreek habitats separately fromlarger open water bodies dueto significant differencesobserved for many of the measurements taken in eachhabitat. The study also includes newly developedintegrated measures of habitat condition that have notbeen used previously.
STUDSTUDSTUDSTUDSTUDY DESIGNY DESIGNY DESIGNY DESIGNY DESIGNApproximately 60 stations were randomly selected
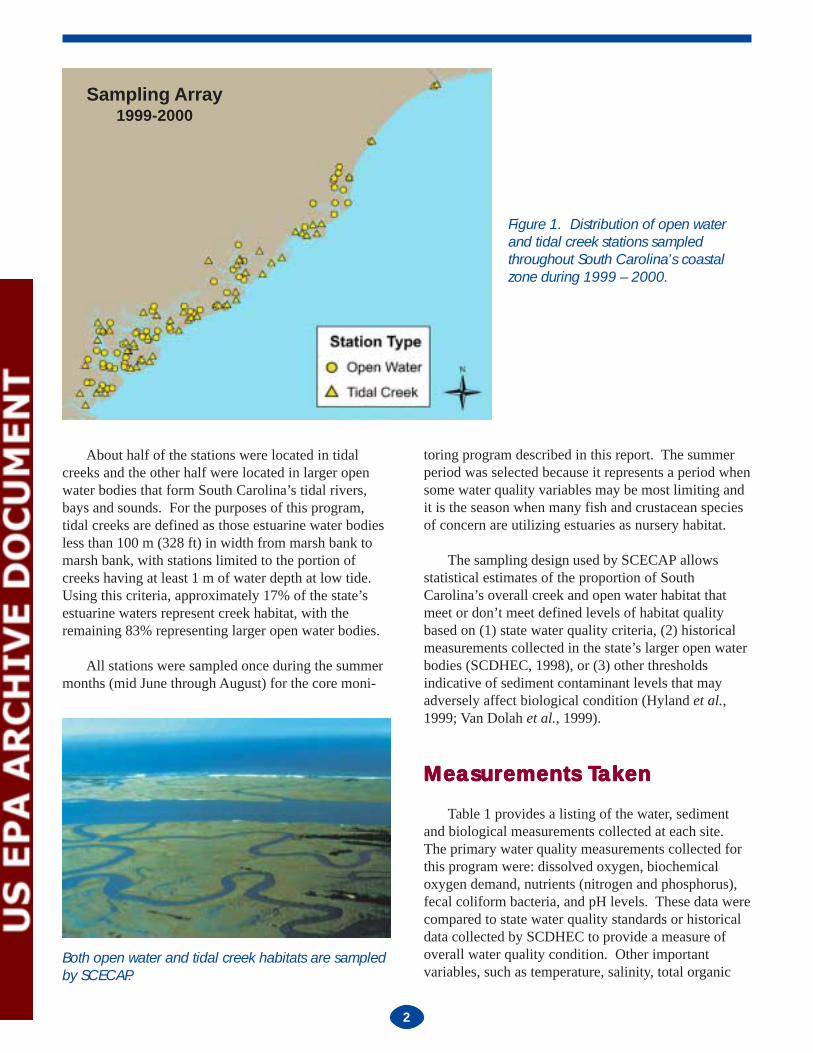
for sampling each year. All sites were located withinthe coastal zone extending from the saltwater – fresh-water interface to near the mouth of each estuarinedrainage basin and extending from the Little River Inletat the North Carolina border to the Wright River nearthe Georgia border (Figure 1). The Savannah River isnot included in the SCECAP initiative, but is beingsampled by the Georgia Coastal Resources Division aspart of the USEPA National Coastal AssessmentProgram.
The goal of SCECAPis to monitor thecondition of thestate’s estuarinehabitats and provideperiodic reports toboth coastal manag-ers and the public.
Tidal creeks serve as importantnursery habitat for economicallyvaluable fish and crustaceanspecies.
2
About half of the stations were located in tidalcreeks and the other half were located in larger openwater bodies that form South Carolina’s tidal rivers,bays and sounds. For the purposes of this program,tidal creeks are defined as those estuarine water bodiesless than 100 m (328 ft) in width from marsh bank tomarsh bank, with stations limited to the portion ofcreeks having at least 1 m of water depth at low tide.Using this criteria, approximately 17% of the state’sestuarine waters represent creek habitat, with theremaining 83% representing larger open water bodies.
All stations were sampled once during the summermonths (mid June through August) for the core moni-
toring program described in this report. The summerperiod was selected because it represents a period whensome water quality variables may be most limiting andit is the season when many fish and crustacean speciesof concern are utilizing estuaries as nursery habitat.
The sampling design used by SCECAP allowsstatistical estimates of the proportion of SouthCarolina’s overall creek and open water habitat thatmeet or don’t meet defined levels of habitat qualitybased on (1) state water quality criteria, (2) historicalmeasurements collected in the state’s larger open waterbodies (SCDHEC, 1998), or (3) other thresholdsindicative of sediment contaminant levels that mayadversely affect biological condition (Hyland et al.,1999; Van Dolah et al., 1999).
Measurements TMeasurements TMeasurements TMeasurements TMeasurements Takakakakakenenenenen
Table 1 provides a listing of the water, sedimentand biological measurements collected at each site.The primary water quality measurements collected forthis program were: dissolved oxygen, biochemicaloxygen demand, nutrients (nitrogen and phosphorus),fecal coliform bacteria, and pH levels. These data werecompared to state water quality standards or historicaldata collected by SCDHEC to provide a measure ofoverall water quality condition. Other importantvariables, such as temperature, salinity, total organic
Figure 1. Distribution of open waterand tidal creek stations sampledthroughout South Carolina’s coastalzone during 1999 – 2000.
Both open water and tidal creek habitats are sampledby SCECAP.
Sampling Array1999-2000

3
Table 1. Listing of measurements and samples collected for the South Carolina Estuarine and Coastal AssessmentProgram (SCECAP).
WWWWWater Quality:ater Quality:ater Quality:ater Quality:ater Quality:
Parameter Type and DepthDissolved oxygen, temperature, salinity, pH, depth instantaneous at surface, mid, bottom
(pH at surface only)Dissolved oxygen, temperature, salinity, pH, depth continuous 25-48 hr record, bottomSecchi disk readings* instantaneous at surfaceTotal nitrate-nitrite, TKN, ammonia, total phosphorus instantaneous at surfaceDissolved nitrate-nitrite, organic nitrogen, ammonia, instantaneous at surface
orthophosphate and silica*Total Organic Carbon (TOC) instantaneous at surfaceBiochemical Oxygen Demand (BOD5) instantaneous at surfaceTotal alkalinity instantaneous at surfaceFecal coliform bacteria instantaneous at surfaceTotal cadmium, chromium, copper, iron, lead, instantaneous at surface
manganese, mercury, nickel, zinc**
Sediment Quality:Sediment Quality:Sediment Quality:Sediment Quality:Sediment Quality:
Sediment composition (% sand, silt/clay) composite samplePorewater ammonia composite sampleTotal Organic Carbon (TOC) composite sampleMetals (13) composite samplePolycyclic Aromatic Hydrocarbons (PAHs – 24) composite samplePolychlorinated biphenyls (PCBs – 27) composite samplePesticides (21) composite sampleSediment toxicity – Seed clam assay composite sampleSediment toxicity – Microtox assay composite sampleSediment toxicity – 10 day amphipod assay* composite sample
Biological Condition:Biological Condition:Biological Condition:Biological Condition:Biological Condition:
Phytoplankton concentration (Chl-a) instantaneous at surfacePhytoplankton pigment composition (HPLC) instantaneous at surfacePhytoplankton composition (microscopic exam)*** instantaneous at surfaceBenthic community replicate 0.04 m2 grabsFinfish/crustacean community 0.5 km trawls (open water)
0.25 km trawls (creeks)Tissue contaminant concentrations (target finfish) composite sample from trawlsIncidence of diseases, deformities in finfish composite sample from trawlsJuvenile finfish community**** replicate 0.10 km sled tows (creeks)
Habitat Characteristics:Habitat Characteristics:Habitat Characteristics:Habitat Characteristics:Habitat Characteristics:
Proximity to upland development visual assessmentEvidence of litter visual assessmentCurrent weather conditions visual assessmentCreek habitat characteristics**** GIS analysis
* Expansion related to the USEPA National Coastal Assessment Program** Part of SCDHEC year-round monitoring activities at selected sites*** Expansion related to the state-wide Harmful Algal Bloom Program**** Expansion related to USFWS funded Tidal Creek Study

4
carbon, and turbidity were also included in our assess-ment of water quality. Some measurements includedboth instantaneous and time series data.
Sediment samples were collected at every site toprovide information on composition, contaminant
levels, and toxicity usingmultiple sediment bioassaytests (Table 1). Bottomdwelling invertebrates livingin the sediments (benthos)were also evaluated as onemeasure of biotic condition.These organisms are animportant source of food formany fish, shrimp and crabspecies, and they have provento be a good indicator ofbiotic condition related toelevated contaminant concen-trations and poor waterquality. A Benthic Index of
Biotic Integrity (B-IBI) developed for the southeasternregion (Van Dolah et al., 1999) was used as the primarymeasure of biological condition for the 1999-2000SCECAP survey.
Another measure of biotic condition considered inthis report was an estimate of phytoplankton concentra-tion as a measure of how the state’s waters compare tonational guidelines developed by NOAA that may beindicative of estuarine eutrophication (effects ofnutrient enrichment). Fish and crustaceans (shrimp andcrabs) were also sampled to determine the relativeabundance, biomass, and diversity of species among thesites sampled. As more data are collected on thesespecies, a SCECAP goal is to develop a second indexof biotic integrity using the fish and crustacean catchdata.
FINDINGSFINDINGSFINDINGSFINDINGSFINDINGS
Water Quality
SCDHEC has developed State regulations toprotect the water quality of the state for several of theparameters measured by the SCECAP program(SCDHEC, 2001a). These regulations are used forsetting permit limits on discharges to waters of theState, with the intent of maintaining and improvingsurface waters to provide for the survival and propaga-
tion of a balanced aquatic community of flora andfauna and to provide for recreation in and on the water.Occasional short-term departures from these conditionswill not automatically result in adverse effects to thecommunity and these deviations may occur due solelyto natural conditions that the aquatic community isadapted to. Therefore, one goal of SCECAP is toprovide additional data on typical conditions observedduring the summer months in South Carolina estuarinehabitats, especially in those habitats such as tidalcreeks that historically have not been sampled bySCDHEC as part of their long-term water qualitymonitoring program.
As noted previously, the six primary water qualityparameters used to develop an integrated measure ofoverall water quality within the state’s coastal waterswere dissolved oxygen (DO), biochemical oxygendemand (BOD5), total nitrogen (TN), total phosphorus(TP), fecal coliform bacteria, and pH. The oxygenmeasures provide an indication of both oxygen avail-ability (i.e. DO) and consumption (i.e. BOD5). Thenitrogen and phosphorus measures provide the bestindication of possible nutrient enrichment (eutrophica-tion) in our estuaries. Fecal coliform bacteria concen-trations provide an indication of the suitability of the
water for shellfish harvesting and primary contactrecreation with regard to the amount of potentiallyharmful bacteria in the water. Measures of pH provideadditional information on conditions that may bestressful for many marine species.
Values of each water quality parameter werecompared to standards for the state’s saltwaters(SCDHEC, 2001a) where possible. Because SCECAP
The primary waterquality measure-ments collected forthis program were:dissolved oxygen,biochemical oxy-gen demand, nutri-ents (nitrogen andphosphorus), fecalcoliform bacteria,and pH levels.
Scientists collect various measures of water quality ateach site.
5
sampling is limited to a summer index period andgenerally doesn’t include multiple samples over time,the data are not appropriate for use in USEPA 303(d) or305(b) reporting requirements. Additionally, only afew of the water quality parameters measured forSCECAP have state standards. When standards werenot available, values were compared to data compiledover a 5-year period (1993-1997) by the SCDHECBureau of Water in their routine statewide FixedAmbient Surface Water Monitoring Network(SCDHEC, 1998). Values exceeding the 75th percentileof all historical values reported by SCDHEC in thestate’s saltwaters were considered to be evidence ofelevated concentrations; values exceeding the 90th
percentile of the historical values were considered to beextreme concentrations. Because the SCDHEC histori-cal database was primarily obtained from larger openwater bodies, caution should be used in interpretingdata from tidal creek sites since high or low valuesobserved for some parameters in that habitat mayrepresent “normal” conditions. In the future, theSCECAP database will be used to identify normalconditions in tidal creeks using protocols similar tothose described by SCDHEC (1998).
This report summarizes conditions related to eachof the six primary water quality parameters used by theSCECAP program. More detailed findings, along withinformation on the other water quality parametersmeasured for SCECAP, are provided by Van Dolah etal. (2002).
Dissolved OxygenDissolved oxygen (DO) is one of the most critical
water quality parameters measured in this program.Low dissolved oxygen conditions can limit the distribu-tion or survival of most estuarine biota, especially ifthese conditions persist for extended time periods.Dissolved oxygen criteria established by the SCDHECfor “Shellfish Harvesting Waters” (SFH) and tidalsaltwaters suitable for primary and secondary contactrecreation (Class SA saltwaters) is a daily average notless than 5.0 mg/L with a low of 4.0 mg/L (SCDHEC,2001a). Tidal saltwaters suitable for primary andsecondary contact recreation, crabbing and fishing,except harvesting of clams, mussels, or oysters forhuman consumption (Class SB waters), should havedissolved oxygen levels not less than 4.0 mg/L. Sincethe SCECAP program was designed to sample onlyduring a summer index period when DO levels wouldbe at their lowest, DO measurements collected in thisprogram approximate short-term worst-case conditions
that may not necessarily occur for long time periods.Therefore, these measurements should not be used forregulatory purposes. However, SCECAP data doprovide useful measures of average DO concentrationsoccurring in both tidal creek and open water habitatsduring a period when DO levels may be limiting, and itidentifies areas within thestate where this is occurring.Based on the state waterquality standards, average DOconcentrations > 4 mg/L areconsidered to be good andvalues > 5 mg/L are consid-ered to be very good for thistime of year. Average DOconcentrations < 4 mg/L, but> 3 mg/L are considered to be marginal (i.e. does notmeet one portion of the state standards). Average DOconcentrations < 3 mg/L are considered to be poten-tially stressful, especially since most of the sites withDO levels in this range had many measurements thatwere < 2 mg/L, which represents very low oxygenconditions known to be limiting to many estuarine andmarine biota.
The primary measure of dissolved oxygen used forSCECAP was based on a 25-hr average of measure-ments collected every 15 minutes by water qualitymeters deployed in the bottom waters of each site.During 1999 and 2000, the average DO concentrationat open water stations was 4.9 mg/L and the averageDO concentration in tidal creek habitats was 4.1 mg/L(Figure 2). Approximately 91% of the state’s openwater habitat had good to very good DO levels which
Dissolved oxygen(DO) is one of themost critical waterquality parametersmeasured in thisprogram.
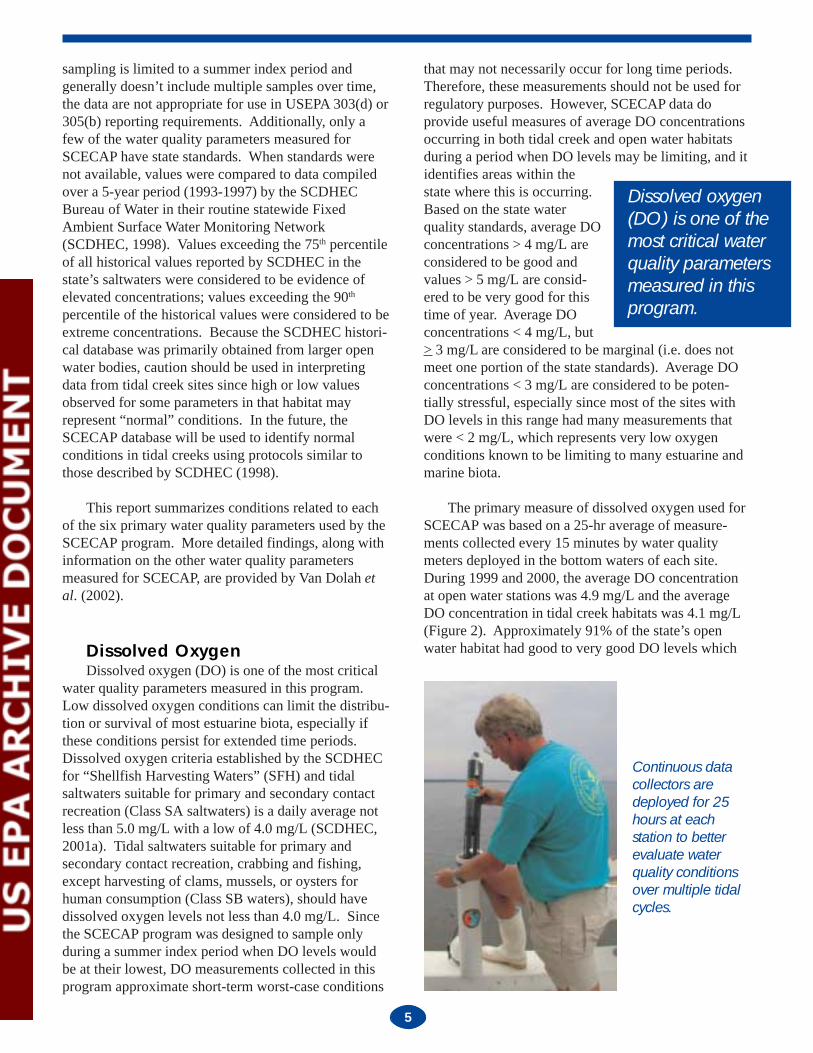
Continuous datacollectors aredeployed for 25hours at eachstation to betterevaluate waterquality conditionsover multiple tidalcycles.

6
should not be limiting to most species of concern.Only 9% of the open water habitat had marginal DOconditions and none of the open water sites had poorDO concentrations. In contrast, only 54% of the state’stidal creek habitat had good to very good DO condi-tions, 39% of this habitat had marginal DO concentra-tions, and 7% had poor DO concentrations that may belimiting to many species.
Since tidal creek habitats generally supported agreater density and diversity of fish and crustaceansthan the open water sites (see biological summary), DOmeasures traditionally obtained by SCDHEC in largeropen water may not be indicative of stressful condi-tions in creeks. However, creeks with poor DO levels(< 3 mg/L on average) may not fully support biologicalassemblages inhabiting those sites, especially duringperiods when DO levels are less than 2 mg/L (hypoxicconditions).
pHMeasures of pH provide another indicator of water
quality in estuarine habitats. The pH measurements arebased on a logarithmic scale, so even small changes inthe value can result in significant stress to estuarineorganisms (Bamber, 1987, 1990; Ringwood andKeppler, in review). Low pH values can indicate thepresence of pollutants (e.g. release of acids or causticmaterials) or high concentrations of carbon dioxide(Gibson et al., 2000).
Because salinity and alkalinity affect the pH ofestuarine waters, SCDHEC has established waterquality standards that account for these effects. The pHin Class SA and SB tidal saltwaters should not varymore than one-half of a pH unit above or below efflu-ent-free waters in the same geologic area having asimilar salinity, alkalinity and temperature, and values
Creeks
Average Dissolved Oxygen9%
45%
39%
7%
46%
9%
45%Open
Poor< 3 mg/L
Marginal> 3 & < 4 mg/L
Percent of Coastal Habitat
CreeksOpen0
1
2
3
4
5
6
DO
(mg/
l)
CreeksOpen0
1
2
3
4
5
6Average Dissolved OxygenAverage Dissolved OxygenAverage Dissolved Oxygen
9%
45%
39%
7%
46%
9%
45%
9%
45%
39%
7%
46%
9%
45%
9%
45%
39%
7%
46%
9%
45%
CreeksOpen0
1
2
3
4
5
6
CreeksOpen0
1
2
3
4
5
6
Good> 4 & < 5 mg/L
Very good> 5 mg/L
Figure 2. Comparison of the average dissolved oxygen concentrations observed in tidal creek and open waterhabitats during 1999-2000, and estimates of the percent of the state’s coastal habitat representing various DOconditions.
pH
7.2
7.4
7.6
0CreeksOpen
7.8
7.1
7.3
7.5
7.7
Average pH
Creeks
OpenPoor< 7.1
Marginal> 7.1 & < 7.4
Good> 7.4
Percent of Stations(with salinities > 18 ppt)
14%
10%
76%
35%
7%
58%
Figure 3. Comparison of the average pH concentrations observed in tidal creek and open water habitats during1999-2000, and estimates of the percent of the high salinity stations having poor, moderate, or good pH values.
7
should never be lower than 6.5 or higher than 8.5.Shellfish harvesting waters (SFH) shouldn’t deviatemore than 0.3 units from pH levels in effluent-freewaters.
The pH measurements used to characterize eachsite were collected from water quality meters deployedfor 25 hrs. There were a sufficient number of siteshaving moderate to high salinities (18 – 40 ppt) to
establish pH criteria for theSCECAP program. Themajority of these stationswere located in areas consid-ered to be pristine environ-ments (e.g. Cape RomainNational Wildlife Refuge,North Inlet and Ashepoo,Combahee, and Edisto[ACE] National EstuarineResearch Reserve, and SFHclass saltwaters). Only a few
stations were sampled in 1999-2000 that had lowersalinities. These stations were not evaluated for pHsince we do not yet have a sufficient database to setcriteria for what represents good, marginal, and poorpH levels in that salinity regime. For the SCECAPprogram, pH values below 7.4 were considered torepresent marginal pH conditions and values below 7.1represented poor conditions (see Van Dolah et al., 2002for criteria methodology).
The 1999 – 2000 average of pH values measured attidal creek stations was lower than the average pHvalue measured at open water stations (Figure 3).
Based on the SCECAP criteria, approximately 24% ofthe open water sites sampled had marginal or poor pHconcentrations compared to about 42% of the tidalcreek sites. The pH at these stations may be causingstress for some organisms, particularly at sites withvalues < 7.1.
NutrientsNutrient loading into estuarine waters has become
a major concern due to the rapid development that isoccurring in the coastal zone of South Carolina andother states. This development results in increasednutrient input from wastewater treatment facilities,some industrial facilities, urban and suburban runoff offertilizers, vehicle exhaust, etc. Other sources ofnutrients include runoff from agricultural fields adja-cent to estuarine habitats, riverine input of nutrient-richwaters from inland areas, and atmospheric deposition.High nutrient levels can lead to enrichment or eutrophi-cation of estuarine waters resulting in excessive algalgrowth including harmful algal blooms (HAB), de-creased dissolved oxygen, and other undesirable effectsthat adversely affect estuarine biota (Bricker et al.,1999).
There are no State orUSEPA standards for thevarious forms of nitrogen(except ammonia) andphosphorus in estuarinewaters. Therefore, theSCECAP data were compar-ed to SCDHEC’s historicaldatabase (SCDHEC, 1998)to identify waters showingevidence of elevated nutri-ents. Values were alsocompared with guidelinespublished by NOAA forestuarine waters (Bricker et al., 1999), although itshould be noted that those values represent dissolvedrather than total nutrient concentrations.
Low pH values canindicate the pres-ence of pollutants(e.g. release ofacids or causticmaterials) or highconcentrations ofcarbon dioxide.
Coastal develop-ment results inincreased nutrientinput from wastewa-ter treatment facili-ties, some industrialfacilities, urban andsuburban runoff offertilizers, vehicleexhaust, . . . .
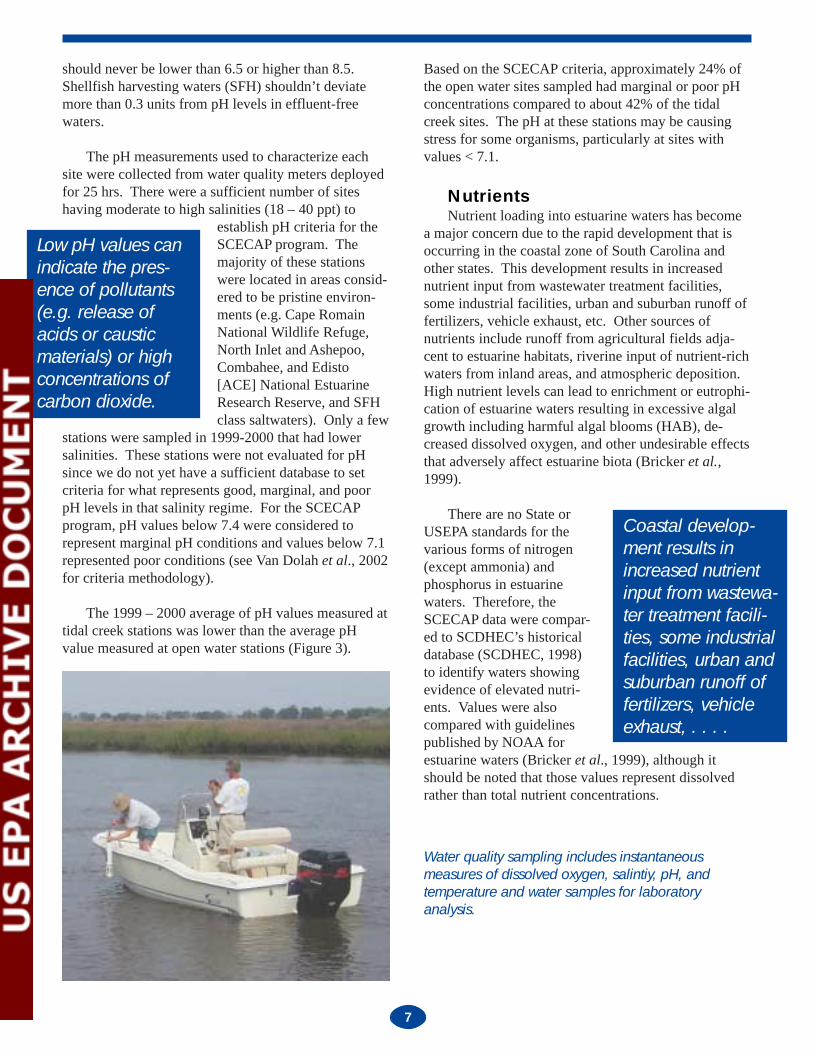
Water quality sampling includes instantaneousmeasures of dissolved oxygen, salintiy, pH, andtemperature and water samples for laboratoryanalysis.

8
The average total nitrogen (TN) concentrationmeasured at tidal creek sites was significantly higherthan the average concentration measured at open watersites. Approximately 12% of the creek habitat and only4% of the state’s open water habitat had TN concentra-tions that were considered to be enriched (Figure 4). In2000, total dissolved nitrogen (TDN) was also mea-sured. None of those samples had high TDN concen-trations (> 1.0 mg/L) based on the guidelines developedfor coastal waters by NOAA (Bricker et al., 1999) andthere was no significant difference in TDN betweencreek and open water sites.
The average total phosphorus (TP) concentrationmeasured at tidal creek sites was significantly higherthan the concentration measured at open water sites
(Figure 5). Approximately 47% of the state’s tidalcreek habitat showed moderate phosphorus enrichmentand an additional 8% of that habitat was very enrichedwith respect to total phosphorus. In contrast, only 19%of the open water habitat showed moderate enrichmentand none of the sites had highly enriched phosphoruslevels. The higher phosphorus concentrations mayrepresent natural conditions in creek habitats since thehistorical database was based on sampling in largeropen water systems. Additional data collected throughthis program will help to resolve whether new guide-lines for TP enrichment should be considered for creekhabitats. Until those data are available, the historicalSCDHEC database provides the best record of devia-tions from normal estuarine water quality conditions.
Total Nitrogen
TN (m
g/L)
Creeks
Open
Percent of Coastal Habitat
Very enriched> 1.29 mg/L
Moderately Enriched> 0.95 & < 1.29 mg/L
Normal< 0.95 mg/L
4%
96%
12%
88%0
0.2
0.4
0.6
0.8
1.0
Open Creeks
Figure 4. Comparison of the average total nitrogen (TN) concentrations observed in tidal creek and open waterhabitats during 1999-2000, and estimates of the percent of the state’s coastal habitat with TN values representingnormal or enriched values relative to SCDHEC historical data.
TP (m
g/L)
0
0.02
0.04
0.06
0.08
0.10
0.12
Total Phosphorus
Open Creeks
Creeks
Open
Percent of Coastal Habitat
81%
19%
8%
45% 47%
Very enriched> 0.17 mg/L
Moderately Enriched> 0.09 & < 0.17 mg/L
Normal< 0.09 mg/L
Figure 5. Comparison of the average total phosphorus (TP) concentrations observed in tidal creek and openwater habitats during 1999-2000, and estimates of the percent of the state’s coastal habitat with TP rangesrepresenting normal, enriched, or highly enriched values relative to SCDHEC historical data.
9
Percent of Coastal Habitat
BO
D (m
g/L)
Creeks
17%
56% 21%
23%
66%
17%Open Very high> 2.6 mg/L
High> 1.8 & < 2.6 mg/L
Normal< 1.8 mg/L
Average BOD
0.0
0.5
1.0
1.5
2.0
2.5
Open Creeks
The average total dissolved phosphorus (TDP)concentration measured in the creek versus open waterstations in 2000 were not significantly different. Usingthe NOAA guidelines (Bricker et al., 1999), none of theopen water sites and only two of the creek sites wereenriched.
Biochemical Oxygen DemandThe five-day biochemical oxygen demand (BOD5)
is a measure of the amount of oxygen consumed by thedecomposition of organic matter, both natural and man-made wastes, in the water column. Although BOD5 isregulated by National Pollutant Discharge EliminationSystem (NPDES) permits to protect instream dissolvedoxygen, there are no freshwater or saltwater standardsfor natural waters. Both the SCDHEC water qualitymonitoring program and the SCECAP program include
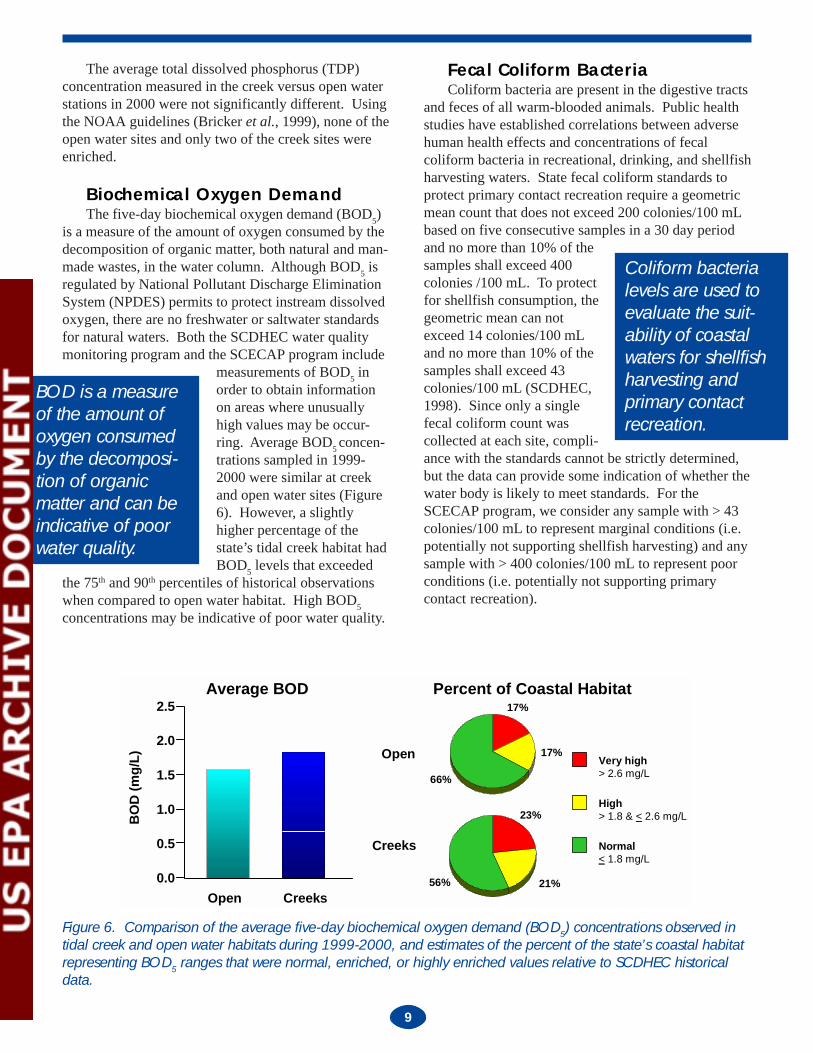
measurements of BOD5 inorder to obtain informationon areas where unusuallyhigh values may be occur-ring. Average BOD5 concen-trations sampled in 1999-2000 were similar at creekand open water sites (Figure6). However, a slightlyhigher percentage of thestate’s tidal creek habitat hadBOD5 levels that exceeded
the 75th and 90th percentiles of historical observationswhen compared to open water habitat. High BOD5concentrations may be indicative of poor water quality.
Fecal Coliform BacteriaColiform bacteria are present in the digestive tracts
and feces of all warm-blooded animals. Public healthstudies have established correlations between adversehuman health effects and concentrations of fecalcoliform bacteria in recreational, drinking, and shellfishharvesting waters. State fecal coliform standards toprotect primary contact recreation require a geometricmean count that does not exceed 200 colonies/100 mLbased on five consecutive samples in a 30 day periodand no more than 10% of thesamples shall exceed 400colonies /100 mL. To protectfor shellfish consumption, thegeometric mean can notexceed 14 colonies/100 mLand no more than 10% of thesamples shall exceed 43colonies/100 mL (SCDHEC,1998). Since only a singlefecal coliform count wascollected at each site, compli-ance with the standards cannot be strictly determined,but the data can provide some indication of whether thewater body is likely to meet standards. For theSCECAP program, we consider any sample with > 43colonies/100 mL to represent marginal conditions (i.e.potentially not supporting shellfish harvesting) and anysample with > 400 colonies/100 mL to represent poorconditions (i.e. potentially not supporting primarycontact recreation).
Figure 6. Comparison of the average five-day biochemical oxygen demand (BOD5) concentrations observed intidal creek and open water habitats during 1999-2000, and estimates of the percent of the state’s coastal habitatrepresenting BOD5 ranges that were normal, enriched, or highly enriched values relative to SCDHEC historicaldata.
BOD is a measureof the amount ofoxygen consumedby the decomposi-tion of organicmatter and can beindicative of poorwater quality.
Coliform bacterialevels are used toevaluate the suit-ability of coastalwaters for shellfishharvesting andprimary contactrecreation.

10
RT9
9037
RT9
9007
RT9
9009
RT9
9017
RT9
9024
RT9
9036
RT9
9039
RT9
9003
RT9
9013
RT9
9002
Average Dissolved Oxygen
Average pH
Fecal Coliform Bacteria
Biological Oxygen Demand
Total Nitrogen
Total Phosphorous
Integrated Score
Station RT9
9037
RT9
9007
RT9
9009
RT9
9017
RT9
9024
RT9
9036
RT9
9039
RT9
9003
RT9
9013
RT9
9002
Average Dissolved Oxygen
Average pH
Fecal Coliform Bacteria
Biological Oxygen Demand
Total Nitrogen
Total Phosphorous
Integrated Score
Station
1999 - 20001999 - 2000- 2000
Open89%
11%
89%
11%
89%
11%
Open89%
11%
CreeksCreeks33%
5%
62%33%
5%
62%33%
5%
62%33%
5%
62%33%
5%
62%
33%
5%
62%
Average fecal coliform concentrations were higherin creeks than in open water during 1999 – 2000(Figure 7). Approximately 17% of the state’s creekhabitat was marginal and 1% was poor with respect tofecal coliform concentrations. In contrast, only 5% ofthe open water habitat was marginal and 1% was poor.The higher fecal coliform counts observed in creekhabitats is most likely due to the proximity of thesesmall drainage systems to upland runoff from bothhuman and domestic as well as wildlife sources,combined with the lower dilution capacity compared tolarger water bodies. Greater protection of tidal creekhabitats is warranted in areas where upland sources ofwaste can be controlled.
Integrated Water Quality MeasureThe integrated water quality score developed for
the SCECAP program incorporates all six of the waterquality measures described above. An explanation ofthe scoring process is provided by Van Dolah et al.(2002). Sites coding as poor (red) generally had four tosix of the individual water quality variables coding aspoor or marginal. Approximately 5% of the state’screek habitat had poor water quality in 1999-2000,whereas none of the open water habitat had poor waterquality (Figure 8). Sites with marginal water quality
010203040506070
Feca
l Col
iform
(#
colo
nies
/100
mL)
Open Creeks
Fecal Coliform
Open
Creeks
82%
94%
1%
Percent of Coastal Habitat
Poor> 400 colonies/100mL
Marginal>43 & < 400 col./100mL
Good> 0 < 43 col./100mL
17% 1%
5%
Figure 7. Comparison of the average fecal coliform concentrations observed in tidal creek and open waterhabitats during 1999-2000, and percent estimates of the state’s coastal habitat representing concentrations thatare acceptable (green), possibly unsuitable for shellfish harvesting (yellow), or possibly unsuitable for primarycontact recreation (red).
Figure 8. Proportion of the South Carolina’s estuarine habitat that ranks as good (green), marginal (yellow), orpoor (red) using the integrated water quality score developed for the SCECAP program. The left portion of thefigure shows examples of how individual stations coded for each of the six water quality parameters and theaverage integrated score for each station based on the combined numerical ratings of the six parameters (VanDolah et al., 2002). The right portion of the figure shows the estimated proportion of water quality conditions forthe entire coastal zone of the state.

11
(yellow) generally had 2-3 parameters coding asmarginal or poor. Approximately 33% of the state’screek habitat had marginal water quality conditionscompared to approximately 11% of the open waterhabitat. The higher percentage of poor and marginalwater quality conditions in creeks indicates that thesehabitats are often more stressful environments and may,in part, reflect the relatively greater effect of anthropo-genic runoff into these smaller water bodies due to theirproximity to upland sources and their lower dilutioncapacity. However, since many of the creeks with poorwater quality were in relatively pristine locations, someof the differences observed between creek and openwater sites may simply be the result of using thresholdsderived from SCDHEC’s historic database, which iscomposed predominantly of data from open waterhabitats. Once a larger database is available, ourthreshold criteria for some of the water quality param-eters measured in creek habitats may be changed fromthose used in this report to reflect the greater naturalvariability in these habitats.
Sediment QualitySediment QualitySediment QualitySediment QualitySediment Quality
The primary measures of sediment quality used forSCECAP include a collective measure of the concentra-tion of 24 contaminants and results obtained from 2-3laboratory bioassays that evaluate the toxic effects ofthose sediments to both invertebrate and microbialorganisms. Other sediment characteristics also mea-sured for the program are not summarized here, but areavailable in the full Technical Report (Van Dolah et al.,2002).
ContaminantsThe 24 contaminants used to evaluate sediment
quality include both trace metals and organic com-pounds for which there are published bioeffects guide-lines based on laboratory and field studies of estuarineand marine organisms (Long et al., 1995). None of thesites sampled in 1999-2000 had contaminant concentra-tions that exceeded values considered to be high (i.e.cause adverse effects in at least 50% of the studiesevaluated by Long et al., 1995). However, several siteshad moderately high concentrations (i.e. cause adversebioeffects in at least 10% of the studies evaluated byLong et al., 1995). More tidal creek sites had elevatedcontaminants compared to the sites in larger waterbodies (15 vs 9 sites). The elevated contaminantsincluded arsenic, cadmium, copper, chromium, andseveral polycyclic aromatic hydrocarbons (PAHs)commonly associated with fuel combustion, petro-
chemical industrial effluents,etc. Arsenic is naturallyelevated in South Carolinaestuarine sediments (Scott etal., 1994; 2000; Sanger et al.,1999a) and the values ob-served cannot be attributedsolely to anthropogenic stress.Only one site had many contaminants at levels knownto cause adverse bioeffects. This station was located inthe turning basin of Shipyard Creek, an industrializeddrainage basin in Charleston Harbor.
24 contaminantsare used to evaluatefor possible effectsto estuarine ani-mals.
Sediments are collected to test for the presence ofcontaminants and evaluate the health of bottom-dwelling communities.
12
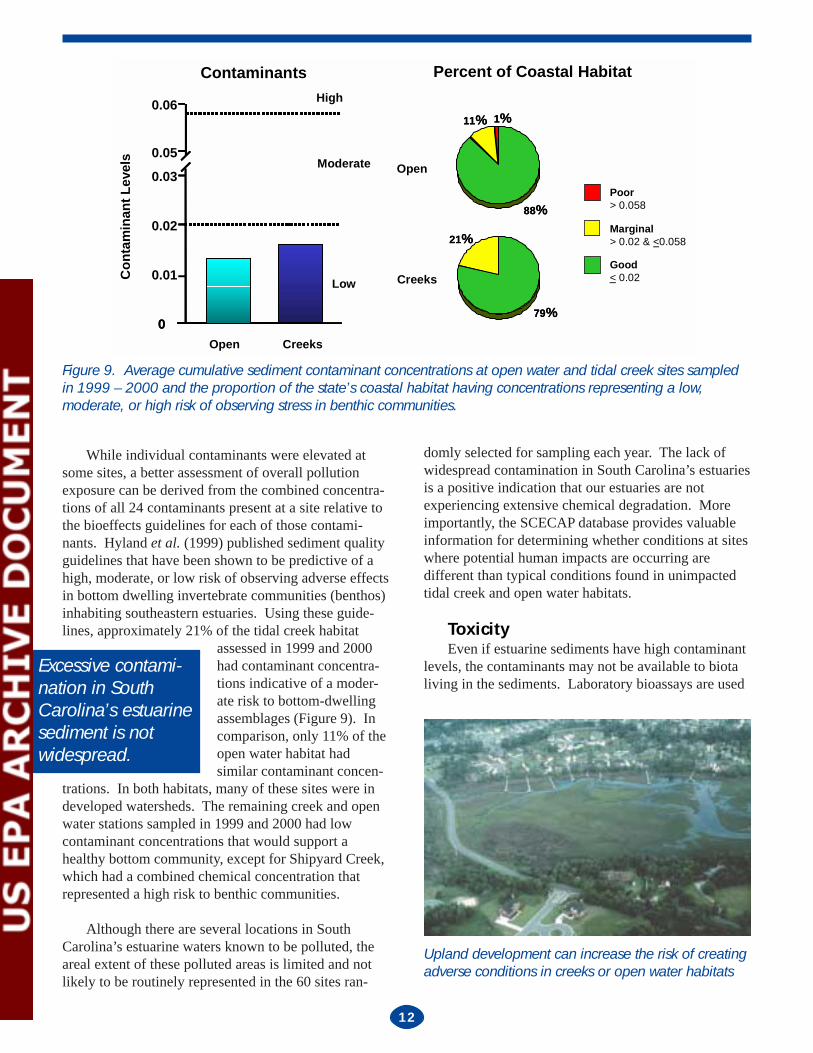
While individual contaminants were elevated atsome sites, a better assessment of overall pollutionexposure can be derived from the combined concentra-tions of all 24 contaminants present at a site relative tothe bioeffects guidelines for each of those contami-nants. Hyland et al. (1999) published sediment qualityguidelines that have been shown to be predictive of ahigh, moderate, or low risk of observing adverse effectsin bottom dwelling invertebrate communities (benthos)inhabiting southeastern estuaries. Using these guide-lines, approximately 21% of the tidal creek habitat
assessed in 1999 and 2000had contaminant concentra-tions indicative of a moder-ate risk to bottom-dwellingassemblages (Figure 9). Incomparison, only 11% of theopen water habitat hadsimilar contaminant concen-
trations. In both habitats, many of these sites were indeveloped watersheds. The remaining creek and openwater stations sampled in 1999 and 2000 had lowcontaminant concentrations that would support ahealthy bottom community, except for Shipyard Creek,which had a combined chemical concentration thatrepresented a high risk to benthic communities.
Although there are several locations in SouthCarolina’s estuarine waters known to be polluted, theareal extent of these polluted areas is limited and notlikely to be routinely represented in the 60 sites ran-
domly selected for sampling each year. The lack ofwidespread contamination in South Carolina’s estuariesis a positive indication that our estuaries are notexperiencing extensive chemical degradation. Moreimportantly, the SCECAP database provides valuableinformation for determining whether conditions at siteswhere potential human impacts are occurring aredifferent than typical conditions found in unimpactedtidal creek and open water habitats.
ToxicityEven if estuarine sediments have high contaminant
levels, the contaminants may not be available to biotaliving in the sediments. Laboratory bioassays are used
1%
Open
11%
88%
Creeks
79%
21%
Moderate
High
0
0.01
0.02
0.03
Low
0.05
0.06
Open Creeks
Con
tam
inan
t Lev
els
Good< 0.02
Poor> 0.058
Marginal> 0.02 & <0.058
1%11%
88%
79%
21%
0
Contaminants Percent of Coastal Habitat
Figure 9. Average cumulative sediment contaminant concentrations at open water and tidal creek sites sampledin 1999 – 2000 and the proportion of the state’s coastal habitat having concentrations representing a low,moderate, or high risk of observing stress in benthic communities.
Excessive contami-nation in SouthCarolina’s estuarinesediment is notwidespread.
Upland development can increase the risk of creatingadverse conditions in creeks or open water habitats
13
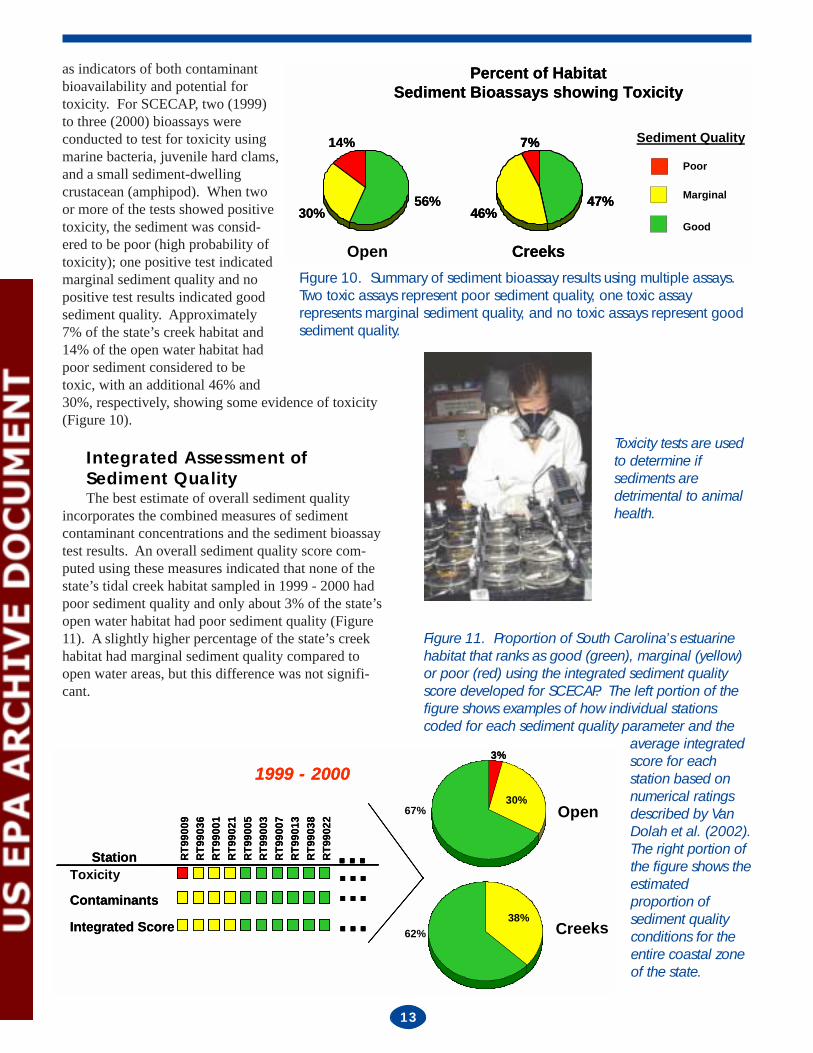
as indicators of both contaminantbioavailability and potential fortoxicity. For SCECAP, two (1999)to three (2000) bioassays wereconducted to test for toxicity usingmarine bacteria, juvenile hard clams,and a small sediment-dwellingcrustacean (amphipod). When twoor more of the tests showed positivetoxicity, the sediment was consid-ered to be poor (high probability oftoxicity); one positive test indicatedmarginal sediment quality and nopositive test results indicated goodsediment quality. Approximately7% of the state’s creek habitat and14% of the open water habitat hadpoor sediment considered to betoxic, with an additional 46% and30%, respectively, showing some evidence of toxicity(Figure 10).
Integrated Assessment ofSediment QualityThe best estimate of overall sediment quality
incorporates the combined measures of sedimentcontaminant concentrations and the sediment bioassaytest results. An overall sediment quality score com-puted using these measures indicated that none of thestate’s tidal creek habitat sampled in 1999 - 2000 hadpoor sediment quality and only about 3% of the state’sopen water habitat had poor sediment quality (Figure11). A slightly higher percentage of the state’s creekhabitat had marginal sediment quality compared toopen water areas, but this difference was not signifi-cant.
Percent of HabitatSediment Bioassays showing Toxicity
Percent of HabitatSediment Bioassays showing Toxicity
Open
56%
14%
30%56%
14%
30%
Creeks
47%
7%
46%
Creeks
47%
7%
46%47%
7%
46%
Sediment Quality
Poor
Marginal
Good
Figure 10. Summary of sediment bioassay results using multiple assays.Two toxic assays represent poor sediment quality, one toxic assayrepresents marginal sediment quality, and no toxic assays represent goodsediment quality.
Station RT9
9009
RT9
9036
RT9
9001
RT9
9021
RT9
9005
RT9
9003
RT9
9007
RT9
9013
RT9
9038
RT9
9022
Integrated Score
…………
Contaminants
…………Station R
T990
09R
T990
36R
T990
01R
T990
21R
T990
05R
T990
03R
T990
07R
T990
13R
T990
38R
T990
22
Toxicity
Integrated Score
…………
Contaminants
…………
1999 - 20001999 - 2000
Open29%
67%
3%
30%67%
29%67%
3%
30%67%
Creeks37%
63%37%
63%38%
62%37%
63%37%
63%37%
63%38%
62%
Figure 11. Proportion of South Carolina’s estuarinehabitat that ranks as good (green), marginal (yellow)or poor (red) using the integrated sediment qualityscore developed for SCECAP. The left portion of thefigure shows examples of how individual stationscoded for each sediment quality parameter and the
average integratedscore for eachstation based onnumerical ratingsdescribed by VanDolah et al. (2002).The right portion ofthe figure shows theestimatedproportion ofsediment qualityconditions for theentire coastal zoneof the state.
Toxicity tests are usedto determine ifsediments aredetrimental to animalhealth.
14
Biological ConditionBiological ConditionBiological ConditionBiological ConditionBiological Condition
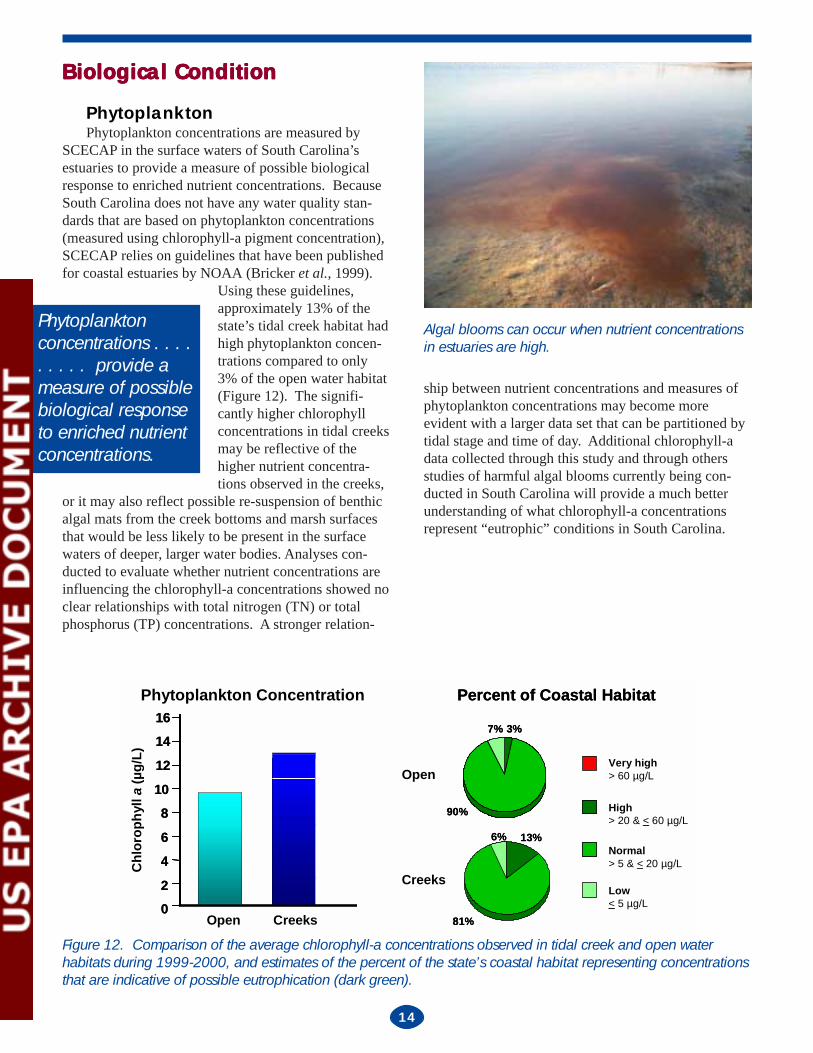
PhytoplanktonPhytoplankton concentrations are measured by
SCECAP in the surface waters of South Carolina’sestuaries to provide a measure of possible biologicalresponse to enriched nutrient concentrations. BecauseSouth Carolina does not have any water quality stan-dards that are based on phytoplankton concentrations(measured using chlorophyll-a pigment concentration),SCECAP relies on guidelines that have been publishedfor coastal estuaries by NOAA (Bricker et al., 1999).
Using these guidelines,approximately 13% of thestate’s tidal creek habitat hadhigh phytoplankton concen-trations compared to only3% of the open water habitat(Figure 12). The signifi-cantly higher chlorophyllconcentrations in tidal creeksmay be reflective of thehigher nutrient concentra-tions observed in the creeks,
or it may also reflect possible re-suspension of benthicalgal mats from the creek bottoms and marsh surfacesthat would be less likely to be present in the surfacewaters of deeper, larger water bodies. Analyses con-ducted to evaluate whether nutrient concentrations areinfluencing the chlorophyll-a concentrations showed noclear relationships with total nitrogen (TN) or totalphosphorus (TP) concentrations. A stronger relation-
ship between nutrient concentrations and measures ofphytoplankton concentrations may become moreevident with a larger data set that can be partitioned bytidal stage and time of day. Additional chlorophyll-adata collected through this study and through othersstudies of harmful algal blooms currently being con-ducted in South Carolina will provide a much betterunderstanding of what chlorophyll-a concentrationsrepresent “eutrophic” conditions in South Carolina.
Creeks
13%6%
Percent of Coastal Habitat
Open
Normal> 5 & < 20 µg/L
81%
3%7%
90%
Creeks02
4
6
810
12
1416
13%6%
Percent of Coastal Habitat
Open
High> 20 & < 60 µg/L
81%
3%7%
90%
Phytoplankton Concentration
Very high> 60 µg/L
Chl
orop
hyll
a (µ
g/L)
02
4
6
810
12
1416
Low< 5 µg/L
Figure 12. Comparison of the average chlorophyll-a concentrations observed in tidal creek and open waterhabitats during 1999-2000, and estimates of the percent of the state’s coastal habitat representing concentrationsthat are indicative of possible eutrophication (dark green).
Phytoplanktonconcentrations . . . .. . . . . provide ameasure of possiblebiological responseto enriched nutrientconcentrations.
Algal blooms can occur when nutrient concentrationsin estuaries are high.

15
Benthic CommunitiesBottom-dwelling (benthic) invertebrate organisms
are important because they are near the bottom of thefood chain and are common food items for many fish
and crustacean species.Benthic organisms are alsoconsidered to be excellentindicators of environmentalstress because they aresessile and cannot easilyavoid exposure to natural oranthropogenic stresses.Characterizing the benthic
community in South Carolina coastal habitats is,therefore, essential to the SCECAP program. Usingseveral measures of benthic community condition, VanDolah et al. (1999) recently developed a benthic indexof biological integrity (B-IBI) for southeastern estuariesto distinguish between degraded and undegradedenvironments. Using this B-IBI, the majority of South
Finfish and CrustaceanCommunitiesEstuarine waters support a diverse and transitory
fish assemblage, with many species often present onlyduring certain seasons or stages of development(Ogburn et al., 1988). Tidalcreeks provide critical habitatsfor many species becausethese shallow wetland areassupply food, provide refugefrom predators, and arevaluable habitats that areutilized by the egg, larval,juvenile, and adult stages of avariety of finfish and crusta-cean species (Joseph, 1973;Mann, 1982; Nelson et al., 1991). Because theseorganisms are highly motile, they may or may not besuitable as indicators of biotic condition at a particular
Figure 13. Estimates of the percent of the state’scoastal habitat having benthic invertebratecommunities representing undegraded, marginallydegraded, or degraded conditions.
Tidal creeks providefood, refuge frompredators, andcritical habitats forthe life cycle devel-opment of manyspecies.
Carolina’s coastal habitat sampled in 1999-2000 hadundegraded benthic communities, 12% of both creekand open water habitat showed evidence of somepossible degradation, and only 4% of tidal creek habitatand 2% of open water habitat had benthic communitiesthat were degraded (Figure 13).
Benthic organismsare considered tobe excellent indica-tors of environmen-tal stress.
Sediment samples aresieved to collect bottom-dwelling organisms suchas the crustacean shownon the left.
4%12%
84%
Creeks
2%12%
86%
Open
Percent of HabitatBenthic- IBI
Degraded Marginal Undegraded
16
site. However, we consider it important to documentthe abundance and diversity of the fish and crustaceansat the various sites, with an ultimate objective to define
where these communities arelimited and, hopefully,develop a second index ofbiotic integrity using thesespecies. The data are alsouseful for defining whererecreationally and ecologi-cally valuable species aremost abundant and diverse,and what specific habitat
characteristics are associated with these conditions.Better knowledge of the most productive habitats iscritical for protection against human-induced impacts.
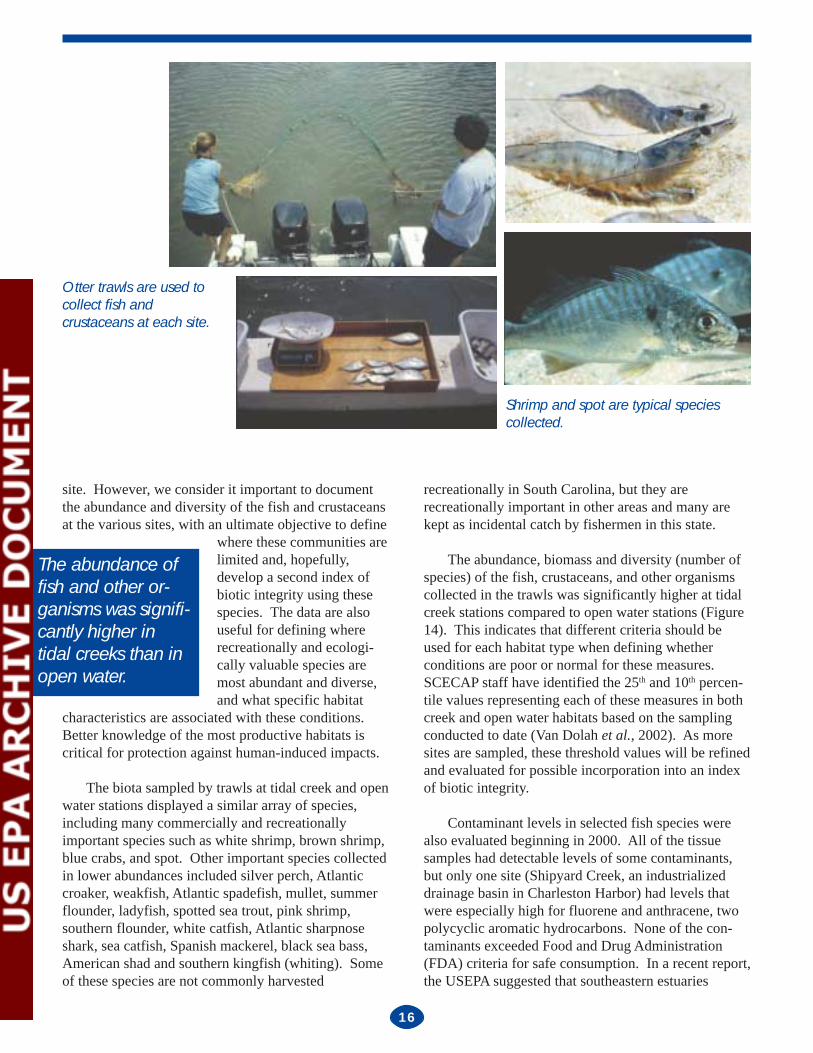
The biota sampled by trawls at tidal creek and openwater stations displayed a similar array of species,including many commercially and recreationallyimportant species such as white shrimp, brown shrimp,blue crabs, and spot. Other important species collectedin lower abundances included silver perch, Atlanticcroaker, weakfish, Atlantic spadefish, mullet, summerflounder, ladyfish, spotted sea trout, pink shrimp,southern flounder, white catfish, Atlantic sharpnoseshark, sea catfish, Spanish mackerel, black sea bass,American shad and southern kingfish (whiting). Someof these species are not commonly harvested
recreationally in South Carolina, but they arerecreationally important in other areas and many arekept as incidental catch by fishermen in this state.
The abundance, biomass and diversity (number ofspecies) of the fish, crustaceans, and other organismscollected in the trawls was significantly higher at tidalcreek stations compared to open water stations (Figure14). This indicates that different criteria should beused for each habitat type when defining whetherconditions are poor or normal for these measures.SCECAP staff have identified the 25th and 10th percen-tile values representing each of these measures in bothcreek and open water habitats based on the samplingconducted to date (Van Dolah et al., 2002). As moresites are sampled, these threshold values will be refinedand evaluated for possible incorporation into an indexof biotic integrity.
Contaminant levels in selected fish species werealso evaluated beginning in 2000. All of the tissuesamples had detectable levels of some contaminants,but only one site (Shipyard Creek, an industrializeddrainage basin in Charleston Harbor) had levels thatwere especially high for fluorene and anthracene, twopolycyclic aromatic hydrocarbons. None of the con-taminants exceeded Food and Drug Administration(FDA) criteria for safe consumption. In a recent report,the USEPA suggested that southeastern estuaries
The abundance offish and other or-ganisms was signifi-cantly higher intidal creeks than inopen water.
Otter trawls are used tocollect fish andcrustaceans at each site.
Shrimp and spot are typical speciescollected.

17
Sediment
Quality
Water
Quality
Biological
Condition
generally had low tissue contaminant levels comparedto the northeast, gulf and west coast regions (USEPA,2001). The results from the SCECAP data set, al-though limited to only one year of data, support thisevaluation.
Integrated Measure of SouthIntegrated Measure of SouthIntegrated Measure of SouthIntegrated Measure of SouthIntegrated Measure of SouthCarolinaCarolinaCarolinaCarolinaCarolina’s Estuarine Habitat’s Estuarine Habitat’s Estuarine Habitat’s Estuarine Habitat’s Estuarine HabitatQualityQualityQualityQualityQuality
A major goal of the SCECAP program is to com-bine our integrated measures of water quality, sediment
quality and biotic conditioninto an overall assessment ofhabitat condition at each sitesampled, and for the entirecoastal zone of SouthCarolina. An integratedmeasure of habitat conditionis preferred since it providesa better “collective” descrip-tion of the condition. Forexample, it is possible forsome areas to have poor ormarginal water quality basedon state standards or histori-
cal data, but the conditions may not result in any clearevidence of degraded biotic communities. Many of the
state’s water quality standards are intentionally conser-vative to be protective and some contravention ofpreferred conditions are not severe enough to be aproblem. Similarly, marginal or poor sediment qualitymay not result in degraded biotic condition because theorganisms are either not directly exposed to the sedi-ments (e.g. phytoplankton, fish) or because the con-taminants are not readily available to the animals.Additionally, some of the more motile organisms mayonly be exposed temporarily due to their transientmovements. When two of the three measures (e.g.water quality and biotic condition) are marginal orpoor, there is greatercertainty that thehabitat may belimiting. When allthree measures(e.g. water, sedi-ment, and biota)show evidence ofdegradation, there is arelatively strong weightof evidence that the habitatis compromised. This“triad” approach to measur-ing overall habitat quality is commonly used in manymonitoring programs assessing the health of coastalenvironments (e.g. Chapman, 1990; Chapman et al.,1991; USEPA, 2001).
0200400600800
10001200
Open Creeks
Abun
danc
e/he
ctar
e
0
2
4
6
8
10
Open Creeks
Kilo
gram
s/he
ctar
e
0200400600800
10001200
Open Creeks0
200400600800
10001200
Open Creeks
Abundance
0
2
4
6
8
10
Open Creeks0
2
4
6
8
10
Open Creeks
Biomass
0
2
4
6
8
Open Creeks
Spec
ies/
Traw
l
Number of Species(Diversity)
0
2
4
6
8
Open Creeks0
2
4
6
8
Open Creeks
Figure 14. Comparison of the averageabundance, biomass, and number of speciescollected in trawls at open water versus tidalcreek sites during 1999-2000.
When all threemeasures (water,sediment, andbiota) show evi-dence of degrada-tion, there is . .strong . . evidencethat the habitat iscompromised.
18
Until more biological data can be collected todefine water or sediment quality conditions that resultin enriched phytoplankton assemblages, or poorconditions in finfish and crustacean assemblages inSouth Carolina habitats, the SCECAP program will relyprimarily on the Benthic Index of Biotic Integrity (B-IBI) developed for the southeastern region as the bestmeasure of biotic condition. The B-IBI developed for this region has beendemonstrated to have a high corre-spondence with sediment qualityconditions.
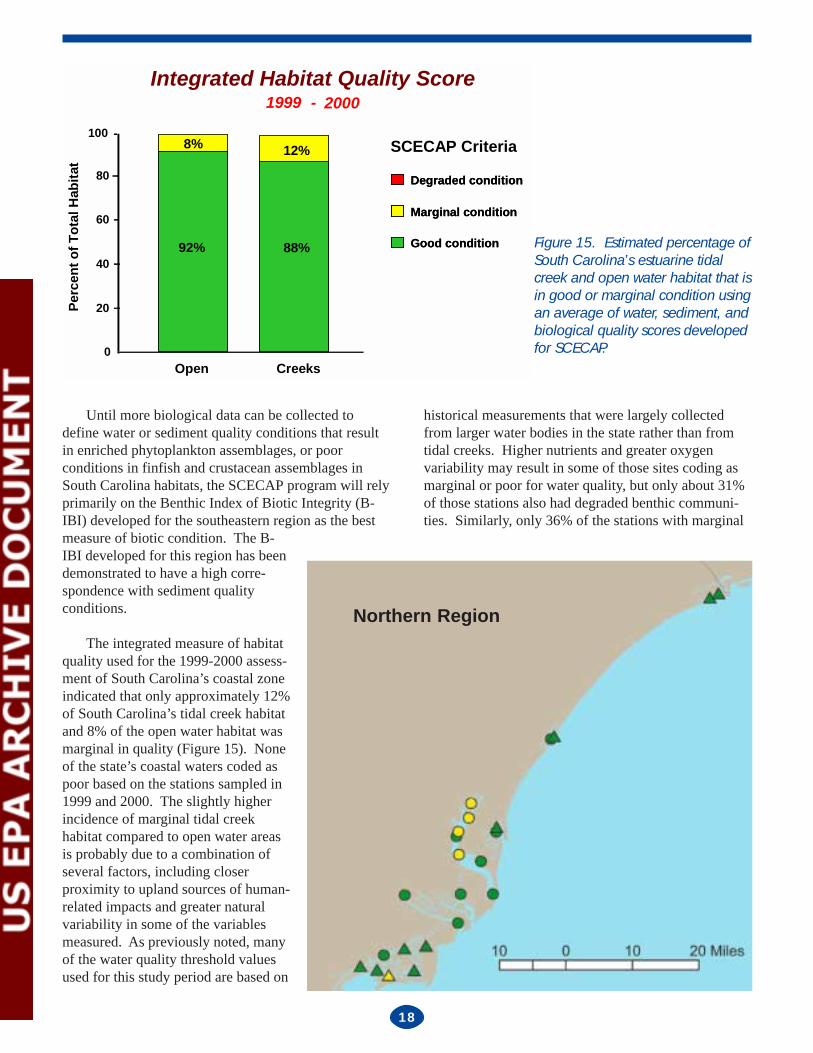
The integrated measure of habitatquality used for the 1999-2000 assess-ment of South Carolina’s coastal zoneindicated that only approximately 12%of South Carolina’s tidal creek habitatand 8% of the open water habitat wasmarginal in quality (Figure 15). Noneof the state’s coastal waters coded aspoor based on the stations sampled in1999 and 2000. The slightly higherincidence of marginal tidal creekhabitat compared to open water areasis probably due to a combination ofseveral factors, including closerproximity to upland sources of human-related impacts and greater naturalvariability in some of the variablesmeasured. As previously noted, manyof the water quality threshold valuesused for this study period are based on
Integrated Habitat Quality ScorePe
rcen
t of T
otal
Hab
itat
0
20
40
60
80
100
CreeksOpen
91%
8%
92%
SCECAP Criteria
1999 - 2000
10%
88%
12%
88% Good conditionGood condition
Marginal conditionMarginal condition
Degraded conditionDegraded condition
Figure 15. Estimated percentage ofSouth Carolina’s estuarine tidalcreek and open water habitat that isin good or marginal condition usingan average of water, sediment, andbiological quality scores developedfor SCECAP.
Northern Region
historical measurements that were largely collectedfrom larger water bodies in the state rather than fromtidal creeks. Higher nutrients and greater oxygenvariability may result in some of those sites coding asmarginal or poor for water quality, but only about 31%of those stations also had degraded benthic communi-ties. Similarly, only 36% of the stations with marginal
19
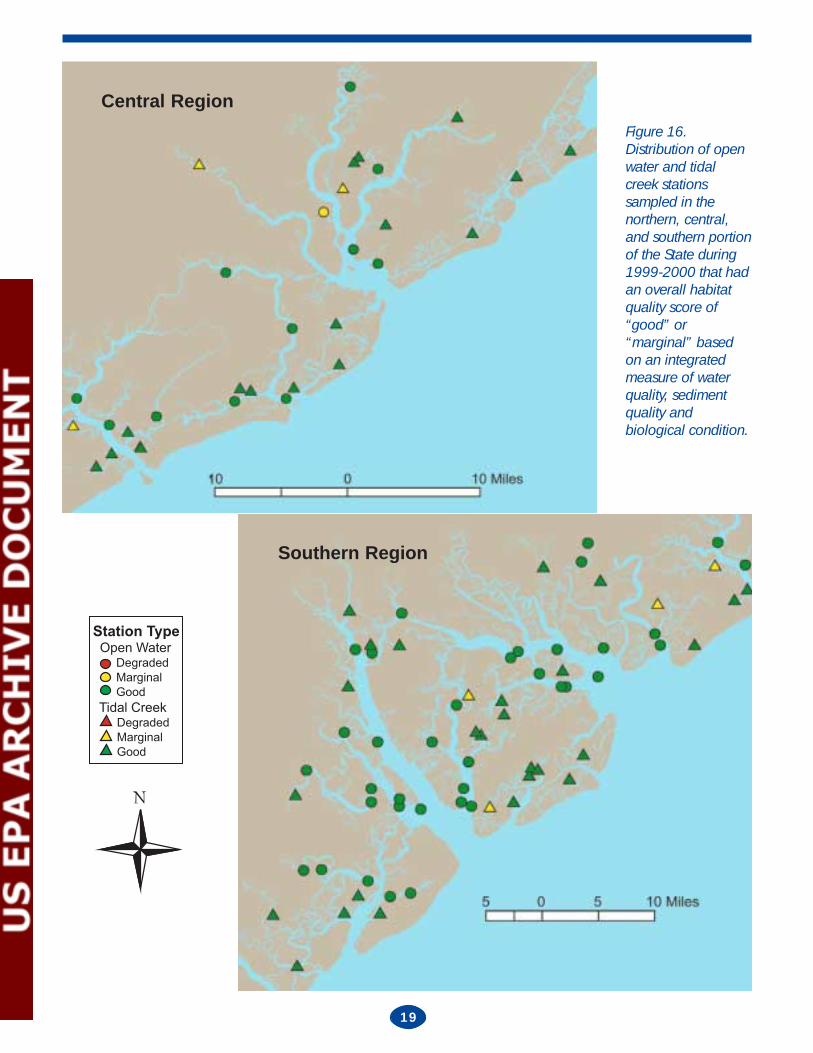
Figure 16.Distribution of openwater and tidalcreek stationssampled in thenorthern, central,and southern portionof the State during1999-2000 that hadan overall habitatquality score of“good” or“marginal” basedon an integratedmeasure of waterquality, sedimentquality andbiological condition.
Station Type Open Water Degraded
Marginal
Good
Tidal Creek Degraded
Marginal
Good
Southern Region
Central Region
20
or poor sediment quality also had evidence of a de-graded benthic community.
Four of the five marginal stations found in thenorthern portion of the state were located in Winyah
Bay, which is highly indus-trialized and has commercialport facilities (Figure 16).All but one of those had poorsediment quality and mar-ginal or poor benthic condi-tion, but good water quality.The other marginal site waslocated in Key Creek off thelower portion of FiveFathom Creek in the CapeRomain area. This site hadmarginal water quality,
sediment quality, and a marginal biotic condition, butthere was no clear source of anthropogenic input.
Three of the four sites that coded as marginal in thecentral portion of the state were located in tidal creeks(Figure 16). All three had poor or marginal waterquality, two had poor sediment quality, and two had
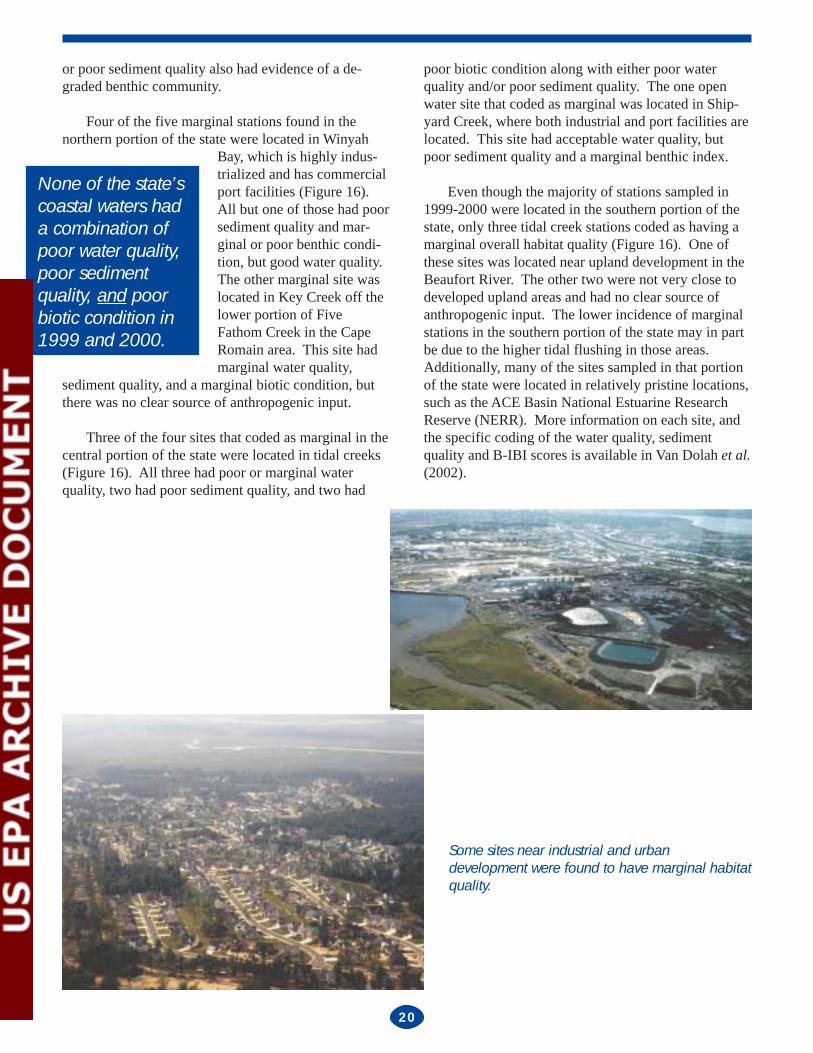
Some sites near industrial and urbandevelopment were found to have marginal habitatquality.
poor biotic condition along with either poor waterquality and/or poor sediment quality. The one openwater site that coded as marginal was located in Ship-yard Creek, where both industrial and port facilities arelocated. This site had acceptable water quality, butpoor sediment quality and a marginal benthic index.
Even though the majority of stations sampled in1999-2000 were located in the southern portion of thestate, only three tidal creek stations coded as having amarginal overall habitat quality (Figure 16). One ofthese sites was located near upland development in theBeaufort River. The other two were not very close todeveloped upland areas and had no clear source ofanthropogenic input. The lower incidence of marginalstations in the southern portion of the state may in partbe due to the higher tidal flushing in those areas.Additionally, many of the sites sampled in that portionof the state were located in relatively pristine locations,such as the ACE Basin National Estuarine ResearchReserve (NERR). More information on each site, andthe specific coding of the water quality, sedimentquality and B-IBI scores is available in Van Dolah et al.(2002).
None of the state’scoastal waters hada combination ofpoor water quality,poor sedimentquality, and poorbiotic condition in1999 and 2000.
21
CONCLUSIONSCONCLUSIONSCONCLUSIONSCONCLUSIONSCONCLUSIONSResults obtained from the 1999-2000 SCECAP
survey indicate that most of South Carolina’s estuarinehabitats are in good condition. Portions of the state’sestuaries that coded as marginal were primarily locatedin developedwatersheds,although a fewsites had noobvious sources ofhuman influence.Future sampling insubsequent yearswill provide anindication ofwhether habitatquality throughoutthe state is similarover time, orgetting worse withincreased coastaldevelopmentpressures. Futuresampling will also provide an opportunity to evaluateconditions within some of the larger drainage basins,such as Winyah Bay, Charleston Harbor, Port RoyalSound, or within specific areas of interest such asGeorgetown County, Charleston County, BeaufortCounty, etc., once a large enough database is available.Criteria for defining marginal or poor conditions withrespect to the various water quality, sediment quality,and biological measures also will be refined once alarger data set is available.
Finally, the data obtained from the 1999-2000survey, combined with future data to be collected bythe SCECAP program, provides a valuable database onthe environmental and biological conditions in tidal
creek and openwater habitatslocated in bothpristine areas andsites near indus-trial and residentialdevelopment.Other studiestargeting specialareas of concernshould find thisdatabase extremelyuseful for compari-son with “normal”conditions repre-senting relativelypristine habitatsthroughout the
state’s coastal zone, or in a sub-region of the state. Thedata also provide a better understanding of what valuesrepresent normal versus unusual conditions withrespect to the various water quality, sediment qualityand biological measures considered. This is particu-larly important for tidal creek habitats, which showclear differences in many of these measures comparedto the same measures taken in the larger open waterbodies that have been traditionally sampled by theSCDHEC and SCDNR.
22
LITERALITERALITERALITERALITERATURE CITEDTURE CITEDTURE CITEDTURE CITEDTURE CITEDBamber, R.N. 1987. The effects of acidic sea water on young
carpet-shell clams Venerupis decussata (l.) (Mollusca:Veneracea). Journal of Experimental Marine Biology andEcology 108:241-260.
Bamber, R.N. 1990. The effects of acidic seawater on threespecies of lamellibranch mollusks. Journal ofExperimental Marine Biology and Ecology 143: 181-191.
Bricker, S. B., C. G. Clement, D. E. Pirhalla, S. P. Orlando andD. R. G. Farrow. 1999. National Estuarine EutrophicationAssessment: Effects of Nutrient Enrichment in the Nation’sEstuaries. National Oceanic and AtmosphericAdministration, National Ocean Service, Special ProjectsOffice and the National Centers for Coastal Ocean Science.Silver Spring, Maryland.
Chapman, P.M. 1990. The sediment quality triad approach todetermining pollution-induced degradation. Sci. Total.Environ. 97: 815-825.
Chapman, P.M., E.A. Power, R.N. Dexter, and G.A. Burton, Jr.1991. Integrative assessments in aquatic ecocsystems. Pp313-340 In G.A. Burton, Jr. (ed). Contaminant SedimentToxicity Assessment. Lewis Pubulisher, Chelsea, MI.
Gibson G.R., M.L. Bowman, J.Gerritsen, and B.D. Snyder.2000. Estuarine and Coastal Marine Waters: Bioassessmentand Biocriteria Technical Guidance. EPA 822-B-00-024.U.S. Environmental Protection Agency, Office of Water,Washington, DC.
Holland, A.F., G.H.M. Riekerk, S.B. Lerberg, L.E. Zimmerman,and D.M. Sanger. 1997. Assessment of the Impact ofWatershed Development on the Nursery Functions of TidalCreek Habitats. pp. 110-115 In: Management of AtlanticCoastal Marine Fish Habitat: Proceedings of a Workshopfor Habitat Managers, ASMFC Habitat Management Series#2, April 1997. 223p.
Hyland, J.L. R.F. Van Dolah, and T.R. Snoots. 1999. Predictingstress in benthic communities of southeastern U.S.estuaries in relation to chemical contamination ofsediments. Environmental Toxicology and Chemistry18(11): 2557-2564.
Joseph, E.B. 1973. Analysis of a nursery ground. In Pacheco,A.L. (ed.) Proceedings of a Workshop on Egg, Larval, andJuvenile Stages of Fish in Atlantic Coast Estuaries.
Lerberg, S.B., A.F. Holland, and D.M. Sanger. 2000.Responses of tidal creek macrobenthic communities to theeffects of watershed development. Estuaries 23: 838-853.
Long, E.R., D.D. MacDonald, S.L. Smith, and F.L. Calder.1995. Incidence of adverse biological effects withinranges of chemical concentrations in marine andestuarine sediments. Environmental Management 19:81-97.
Mann, K.H. 1982. Ecology of coastal waters. University ofCalifornia Press, Los Angeles, California. 322 pp.
Nelson, D.M., E.A. Irlandi, L.R. Settle, M.E. Monaco, L.Coston-Clements. 1991. Distribution and abundance offishes and invertebrates in Southeast estuaries. ELMRRep. No. 9. NOAA/NOS Strategic EnvironmentalAssessments Division, Silver Spring, Maryland. 167 pp.
Ogburn, M.V., D.M. Allen, W.K. Michener. 1988. Fishes,shrimps, and crabs of North Inlet Estuary, SC: A four-yearseine and trawl survey. Baruch Institute Technical Report.No. 88-1. 299 pp. University of South Carolina. Columbia,South Carolina.
Ringwood, A.H. and C.J. Keppler. In review. Is pH really a“non-issue” in estuaries. Estuaries.
Sanger, D.M., A.F. Holland, and G.I. Scott. 1999a. Tidal Creekand Salt marsh Sediments in South Carolina CoastalEstuaries. I. Distribution of Trace Metals. Archives ofEnvironmental Contamination and Toxicology 37:445-457.
Sanger, D.M., A.F. Holland, and G.I. Scott. 1999b. Tidal Creekand Salt Marsh Sediments in South Carolina CoastalEstuaries. II. Distribution of Organic Contaminants.Archives of Environmental Contamination and Toxicology37:458-471.
Scott, G.I. M.H. Fulton, G.T. Chandler, P.B. Key, E.D. Strozier,B.C. Thomposn, J.W. Daugomah, P. Pennington, SlLayman. 1994. A survey of sediment toxicity in CharlestonHarbor, Winyah Bay, North Edisto River and North Inletestuaries of South Carolina. Final Report to NOAA,National Status and Trend Program, Bioeffects Divsion,Seattle, Washington: 80p + appendices.
Scott, G.I., M.H. Fulton, D. Bearden, K.W.Chung, M.Sanders,A. Dias, L.A. Reed, S. Sivertsen, E. D. Strozier, P.B.Jenkins, J.W. Daugomah, P. Pennington, J. DeVane, P.B.Key, A.K.Leight, and W. Ellenbery. 2000. Chemicalcontaminant levels in estuarine sediment of the Ashepooo-Combahee-Edisto River (ACE) Basin National EstuarineReseearch Reserve and Sanctuary Site. 104 p.
South Carolina Department of Health and EnvironmentalControl. 1998. Summary of Selected Water QualityParameter Concentrations in South Carolina Waters andSediments January 1, 1993 - December 31, 1997. TechnicalReport 004-98. Bureau of Water, Columbia, S.C.

23
South Carolina Department of Health and EnvironmentalControl. 2001a. Water Classifications and Standards(Regulation 61-68) and Classified Watrs (Regulation 61-69) for the State of South Carolina. Office ofEnvironmental Quality Control, Columbia, SC.
U.S. Environmental Protection Agency. 2001. NationalCoastal Condition Report. EPA-620-R-01-005. 204 pp.
Van Dolah, R.F. J.L. Hyland, A.F. Holland, J.S. Rosen, andT.R. Snoots. 1999. A benthic index of biological integrityfor assessing habitat quality in estuaries of the southeasternUnited States. Marine Environmental Research 48: 269-283.
Van Dolah, R.F., D.E. Chestnut, and G.I. Scott. 2000. Abaseline assessment of environmental and biologicalconditions in Broad Creek and the Okatee River, BeaufortCounty, South Carolina. Final Report to the BeaufortCounty Council, Beaufort County, South Carolina. 115 p.plus appendices.
Van Dolah, R.F., P.C. Jutte, G.H.M. Riekerk, M.V. Levisen,L.E. Zimmerman, J.D. Jones, A. Lewitus, D.E. Chestnut,W.McDermott, D. Bearden, G.I. Scott, and M.H. Fulton.2002. The Condition of South Carolina’s Estuarine andCoastal Habitats During 1999-2000: Technical Report.Charleston, SC: South Carolina Marine Resources DivisionTechnical Report No. 90. 132 p.
The South Carolina Department of Natural Resourcesprohibits discrimination on the basis of race, color,sex, national origin, disability, religion or age. Directall inquiries to the Office of Human Resources, P.O.Box 167, Columbia, S.C. 29202.
Printed on Recycled Paper
October 2002
Total copies: 300Total cost: $2,565.00Cost per copy: $8.55
D H E C
PROMOTE PROTECT P R O S P E R
South Carolina Department of Health
and Environmental Control
Related Documents