NEW MEXICO HIGHER EDUCATION DEPARTMENT The Condition of Higher Education in New Mexico 2005-2006 December 2006 Dear Colleagues: Thanks to the vision and support of New Mexico’s Legislators and Governor, higher education in New Mexico is experiencing unprecedented advances. Students of all ages have increased opportunities for obtaining certificates, attending college, and pursuing advanced degrees. Students have access to more assistance for paying for their studies. And, students are more aware that those who continue their education after high school are more likely to get a better paying job and to experience a higher quality of life. The Condition of Higher Education in New Mexico 2005-2006 reports on data collected by the New Mexico Higher Education Department. The data presented provides the status of higher education as of fall 2005. This data is important for two reasons: it is the basis for the 2007 appropriations that fund the higher education formula for distribution of state funds to New Mexico’s public colleges and universities and it is one of the elements that provides information from which we can make sound policy decisions. The emphasis of the New Mexico Higher Education Department is to create policy that helps us to improve access to educational opportunities for all students, as well as to improve success once they have entered the doors of our post-secondary institutions. The data herein presents a snapshot of New Mexico higher education that assists us in determining our benchmarks and assessing our progress. For the first time in the state’s history, the New Mexico Higher Education Department gleaned input from diverse stakeholders to create statewide strategic priorities for higher education that are tied to economic and workforce development and to our P-12 partners. The data included in this report each year will assist us in continually updating the statewide priorities so that they are founded on sound research and reflect responsiveness to the needs of today’s students. The New Mexico Higher Education Department is dedicated to advancing higher education throughout the state. Thank you for your interest and support. Sincerely, Dr. Beverlee J. McClure Cabinet Secretary

Welcome message from author
This document is posted to help you gain knowledge. Please leave a comment to let me know what you think about it! Share it to your friends and learn new things together.
Transcript
NEW MEXICO HIGHER EDUCATION DEPARTMENT
The Condition of Higher Education in New Mexico 2005-2006
December 2006 Dear Colleagues: Thanks to the vision and support of New Mexico’s Legislators and Governor, higher education in New Mexico is experiencing unprecedented advances. Students of all ages have increased opportunities for obtaining certificates, attending college, and pursuing advanced degrees. Students have access to more assistance for paying for their studies. And, students are more aware that those who continue their education after high school are more likely to get a better paying job and to experience a higher quality of life. The Condition of Higher Education in New Mexico 2005-2006 reports on data collected by the New Mexico Higher Education Department. The data presented provides the status of higher education as of fall 2005. This data is important for two reasons: it is the basis for the 2007 appropriations that fund the higher education formula for distribution of state funds to New Mexico’s public colleges and universities and it is one of the elements that provides information from which we can make sound policy decisions. The emphasis of the New Mexico Higher Education Department is to create policy that helps us to improve access to educational opportunities for all students, as well as to improve success once they have entered the doors of our post-secondary institutions. The data herein presents a snapshot of New Mexico higher education that assists us in determining our benchmarks and assessing our progress. For the first time in the state’s history, the New Mexico Higher Education Department gleaned input from diverse stakeholders to create statewide strategic priorities for higher education that are tied to economic and workforce development and to our P-12 partners. The data included in this report each year will assist us in continually updating the statewide priorities so that they are founded on sound research and reflect responsiveness to the needs of today’s students. The New Mexico Higher Education Department is dedicated to advancing higher education throughout the state. Thank you for your interest and support. Sincerely, Dr. Beverlee J. McClure Cabinet Secretary

The Condition of Higher Education in New Mexico 2005-2006 Page 2 of 69
Table of Contents
I. Overview of the Status of Public Higher Education in New Mexico 5
II. Public Universities and Colleges in New Mexico 16
III. Enrollment Data 17
IV. Degrees Awarded 21
V. Tuition and Fees 27
VI. Student Aid 30
VII. Revenue Sources and Budgets 38
VIII. Salary Increases 41
IX. Appropriations 44
X. Adult Basic Education in New Mexico 46
XI. Tribal Higher Education in New Mexico 54
XI. Private Higher Education in New Mexico 57
Appendix A: Enrollments 2002-2004 Compared 68
The Condition of Higher Education in New Mexico 2005-2006 Page 3 of 69
List of Tables
Table 1 Public Universities and Colleges in New Mexico 16 Table 2 Total Student Enrollment at NM Public Post-Secondary Institutions 17 Table 3 State Residency of Students Attending NM Public Post-Secondary Institutions 18 Table 4 Ethnicity and Gender of Students at NM Public Post-Secondary Institutions 19 Table 5 Average Age of Students in New Mexico Public Post-Secondary Institutions 20 Table 6 Certificates and Associate’s Degrees Awarded 21 Table 7 Bachelor’s Degrees Awarded Statewide 22 Table 8 Graduate Degrees Awarded Statewide 23 Table 9 Statewide Certificate and Degree Recipients in New Mexico 24 Table 10 Bachelor’s Degree Completion / Continuation Rates for NM Public Universities 26 Table 11 Six-Year Bachelor’s Degree Completion Rates for NM Public Universities By
Student Ethnicity 26 Table 12 Annual Tuition and Fees at Public Post-Secondary Institution 27 Table 13 Comparison of Annual Tuition and Fees 28 Table 14 Tuition and Fees for Resident Undergraduates 29 Table 15 State Financial Aid Awarded 30 Table 16 Federal Financial Aid Awarded 2005-2006 31 Table 17 Sources of Financial Aid Awards by Institution 32 Table 18 Lottery Success Scholarship Recipients by Age and Gender 33 Table 19 Degrees Awarded to Lottery Success Scholarship Recipients 34 Table 20 Revenues for Instruction-and-General Purposes 39 Table 21 Analysis of Instruction-and-General Expenditures 40 Table 22 Budgeted Salary Increases for Public Post-Secondary Faculty and Staff 41 Table 23 Salaries of Selected Administrators at Public Post-Secondary Institutions 42 Table 24 Faculty Salaries with Benefits at Public Post-Secondary 4-Year Institutions 43 Table 25 Faculty Salaries with Benefits at Public Post-Secondary 2-Year Institutions 43 Table 26 General Fund Appropriations for Higher Education in New Mexico 44 Table 27 History of New Mexico Capital Outlay Appropriations 45 Table 28 Adult Basic Education Funding History 46 Table 29 Adult Basic Education Enrollment History 48 Table 30 Tribal Colleges in New Mexico 54 Table 31 Enrollment at New Mexico Tribal Colleges 54 Table 32 Ethnicity and Gender of Students at Tribal Colleges 55 Table 33 Completion at New Mexico’s Tribal Colleges 55 Table 34 Certificates, Diplomas, and Associate’s Degrees Awarded by Tribal College 56 Table 35 Bachelor’s Degrees Awarded by Tribal Colleges 56 Table 36 Licensed Private Post-Secondary Schools in New Mexico 58 Table 37 Accredited Private Post-Secondary Institutions in New Mexico 59 Table 38, Table 39 Degrees Awarded by New Mexico Private Post-Secondary Institutions 60 Table 40 Enrollments at New Mexico Private Post-Secondary Institutions 61 Table 41 Enrollments at New Mexico Private Post-Secondary Institutions 64 Table 42 Number of Graduates at New Mexico Private Post-Secondary Institutions 67 Table 43 Recent History of Student Headcount Enrollment in New Mexico 68 Table 44 Recent History of Full-Time-Equivalent Student Enrollment in New Mexico 69
The Condition of Higher Education in New Mexico 2005-2006 Page 4 of 69
List of Figures
Figure 1 Enrollment 2005..........................................................................................................7 Figure 2 Loan-for-Service Expenditures .................................................................................35 Figure 3 WICHE (Western Interstate Commission on Higher Education) Expenditures .........36 Figure 4 Lottery Success Scholarship Recipients ...................................................................37 Figure 5 Revenues for Public Universities ..............................................................................38 Figure 6 Revenues for Community Colleges ..........................................................................38 Figure 7 Adult Basic Education Contract Hours......................................................................47 Figure 8 Adult Basic Education 2005-2006 Enrollment by Ethnicity and Age .........................49 Figure 9 Adult Basic Education Enrollment by Educational Level ...........................................50 Figure 10 Adult Basic Education Educational Completion Level.............................................51 Figure 11 Adult Basic Education Performance Measures.......................................................52 Figure 12 Adult Basic Education Incentive Success Rate.......................................................53

The Condition of Higher Education in New Mexico 2005-2006 Page 5 of 69
The Condition of Higher Education in New Mexico 2005-2006 The Condition of Higher Education in New Mexico 2005-2006 reports on data collected by the New Mexico Higher Education Department as part of its Data Editing and Reporting (DEAR) system. The data presented here provides the status of higher education as of the fall 2005 semester and makes comparisons to prior year data to calculate change rates. Fall 2005 enrollment data is the basis for the 2007 appropriations that fund the higher education formula for distribution of state funds to institutions.
I. Overview of the Status of Public Higher Education in New Mexico
A Statewide Vision for Higher Education In collaboration with the New Mexico Higher Education Advisory Board, leadership and governing boards of New Mexico’s public and private post-secondary institutions, students, recommendations from New Mexico First’s Town Hall on Higher Education, state agencies including the Public Education Department, and others, the New Mexico Higher Education Department developed Statewide Strategic Priorities for Higher Education. These priorities will be a useful tool in guiding New Mexico’s students into successful educational degree programs and professional opportunities for generations to come.
New Mexico Higher Education Statewide Strategic Priorities and Goals
Strategic Priority 1: Increase student access and success.
Goal 1.1: Prepare all students to graduate high school and enroll in college ready for success Goal 1.2: Improve the retention and completion rates of all students in higher education Goal 1.3: Raise the minority representation in higher education to be reflective of the state’s population
Goal 1.4: Improve the minority participation and graduation rates in graduate and professional programs
Goal 1.5: Maintain an affordable cost of attendance Goal 1.6: Complete a statewide distance education plan Strategic Priority 2: Innovate to meet current and future educational needs efficiently and effectively.
Goal 2.1: Articulate a statewide vision for higher education which includes two- and four-year public and private institutions
Goal 2.2: Implement a strategic plan that addresses the needs of all New Mexicans in public and private institutions
Goal 2.3: Develop a system for prioritizing deferred maintenance and identify funding mechanism(s) to ensure sustainability
Goal 2.4: Implement the policy for service and responsibility areas to prevent duplication of effort and to ensure access Goal 2.5: Improve the recruitment and retention of high quality faculty and staff Goal 2.6: Create a performance and accountability system tied to funding

The Condition of Higher Education in New Mexico 2005-2006 Page 6 of 69
Strategic Priority 3: Provide programs and services integral to state and regional economic needs. Goal 3.1: Recognize and fund the role of research in our state’s economy Goal 3.2: Align programs and services with statewide career clusters
Goal 3.3: Develop each institution’s capacity to be engaged in and add value to its region Goal 3.4: Improve collaboration between two- and four-year institutions to create programs that increase the number of educational opportunities for all New Mexicans
Goal 3.5: Support regional vitality by contributing artistic, cultural, and civic assets that attract employers and other residents seeking a higher quality of life
Goal 3.6: Create funding mechanisms and support for collaborative technology projects that serve the needs of the state
Strategic Priority 4: Position New Mexico Higher Education to be ranked in the upper echelon by improving national rankings. Goal 4.1: Align performance measures with national standards
Goal 4.2: Create funding mechanisms that encourages research institutions to be top tier by supporting such initiatives as raising admission standards while still serving the students of New Mexico
Goal 4.3: Implement a marketing and outreach plan to help recruit students in New Mexico and from other states Goal 4.4: Develop incentives to keep New Mexico’s students in state institutions Goal 4.5: Partner with the private sector to develop opportunities in New Mexico for internship programs and post graduate employment Goal 4.6: Support institutions’ efforts to compete globally and to prepare their students to do so
Public Colleges and Universities The State of New Mexico supports:
• Three high quality research universities, each of which has received national recognition in areas of specialization;
• Four comprehensive universities which provide the benefits of small residential colleges at relatively low tuition rates;
• Seventeen two-year colleges, ten of which operate as branch campuses of the universities and seven as independent community colleges; they are located around the state so that every New Mexican has geographic access to higher education; and
• Three special schools.
Student Enrollments Enrollment at New Mexico’s public institutions of higher education is relatively flat with an overall enrollment increase of less than 1% from Fall 2004 to Fall 2005, with an 1.4% increase in the two-year sector, and a less than 1% decrease at the state’s universities. Recent projections of high school graduates in the state, provided by the Western Interstate Commission for Higher Education (WICHE), suggest enrollment will remain flat.
The Condition of Higher Education in New Mexico 2005-2006 Page 7 of 69
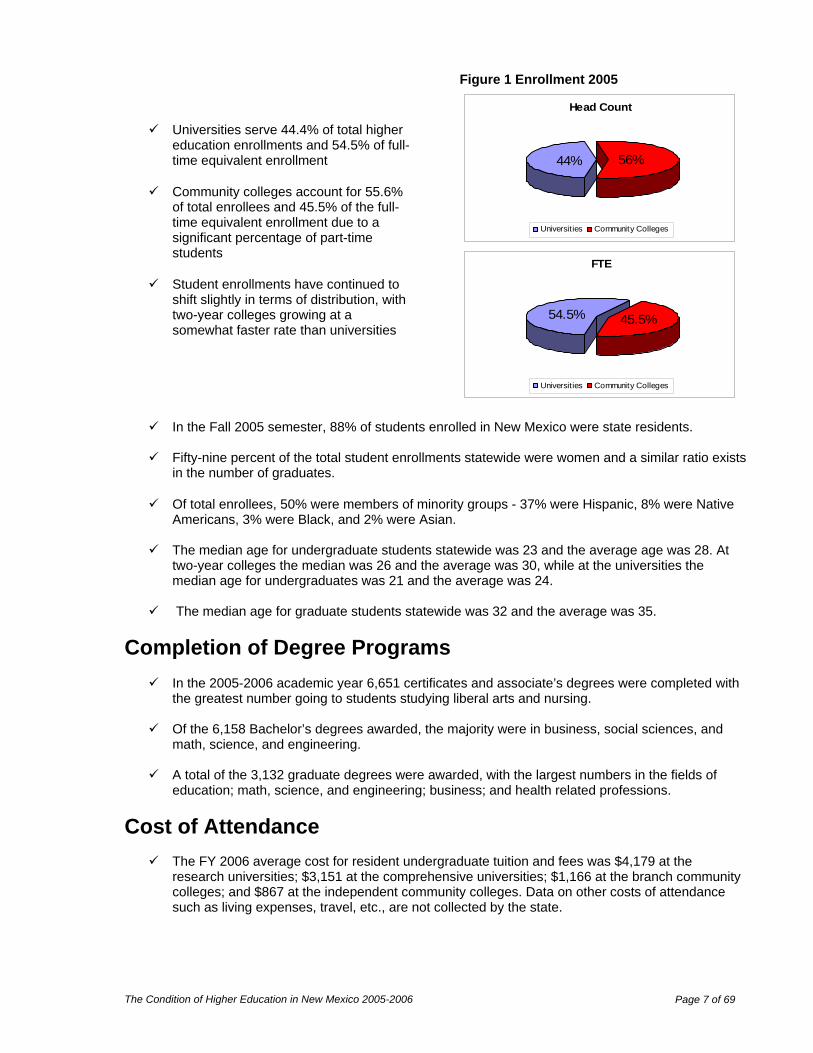
Figure 1 Enrollment 2005
Universities serve 44.4% of total higher education enrollments and 54.5% of full-time equivalent enrollment
Community colleges account for 55.6%
of total enrollees and 45.5% of the full-time equivalent enrollment due to a significant percentage of part-time students
Student enrollments have continued to
shift slightly in terms of distribution, with two-year colleges growing at a somewhat faster rate than universities
Head Count
56%44%
Universities Community Colleges
FTE
54.5% 45.5%
Universities Community Colleges
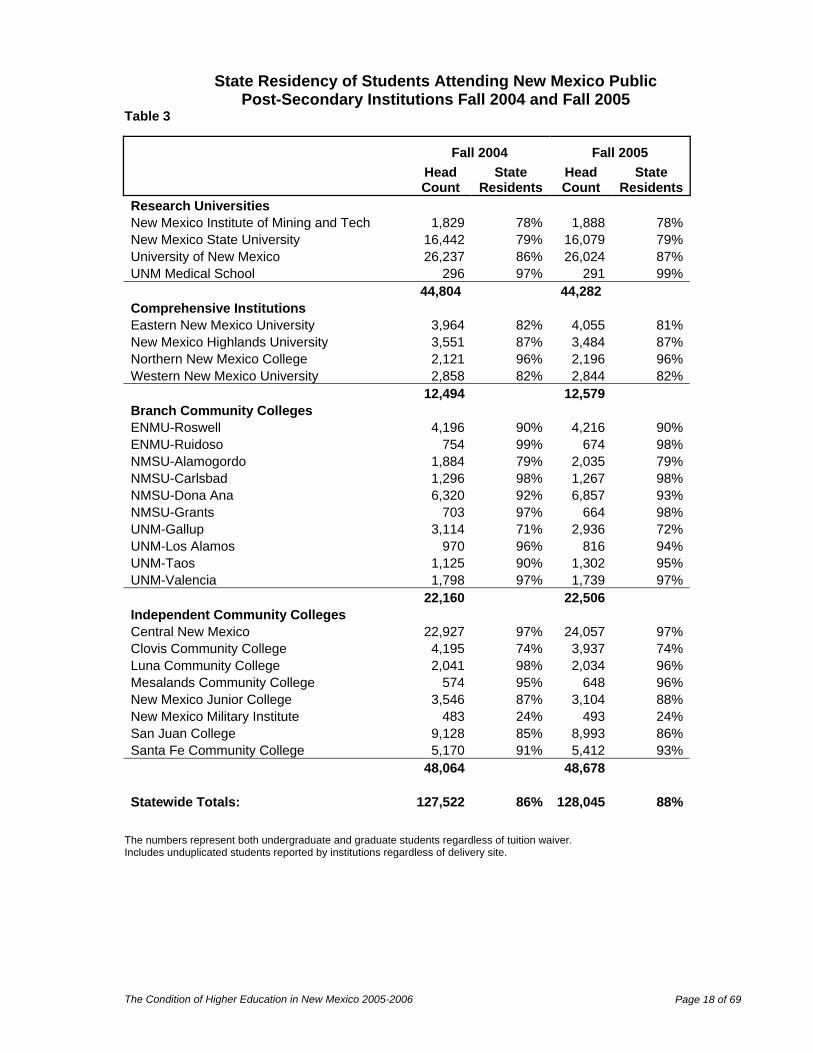
In the Fall 2005 semester, 88% of students enrolled in New Mexico were state residents.
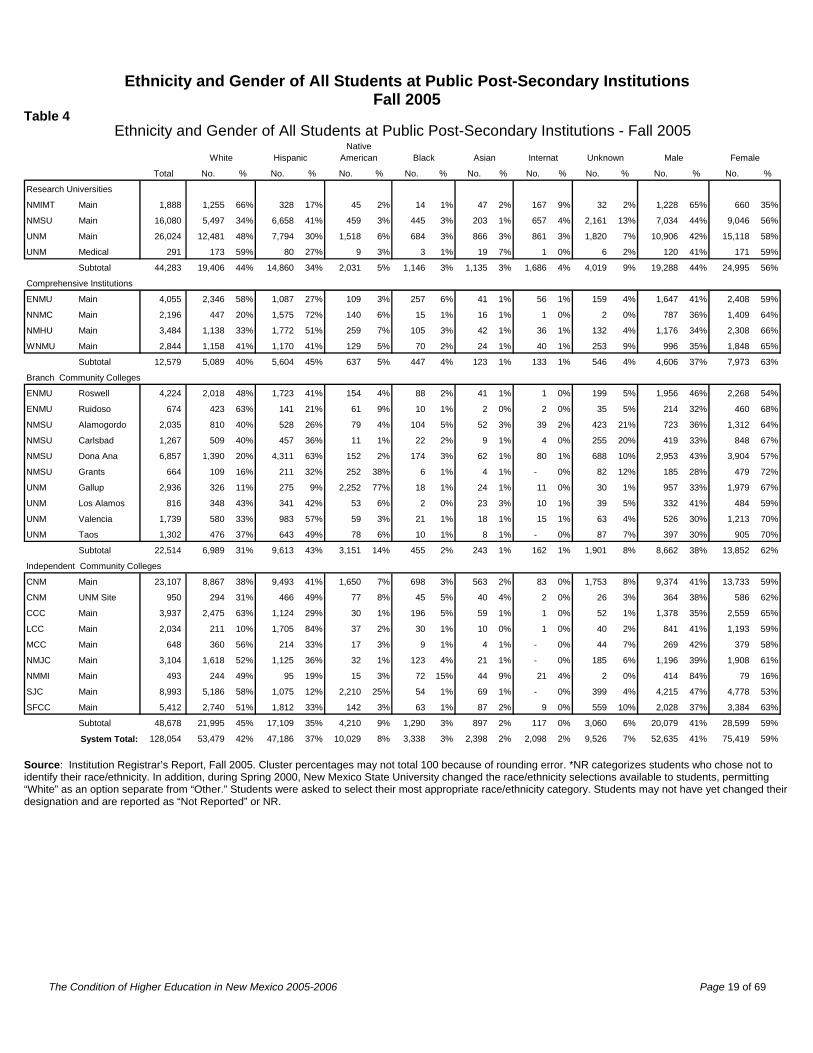
Fifty-nine percent of the total student enrollments statewide were women and a similar ratio exists in the number of graduates.
Of total enrollees, 50% were members of minority groups - 37% were Hispanic, 8% were Native
Americans, 3% were Black, and 2% were Asian.
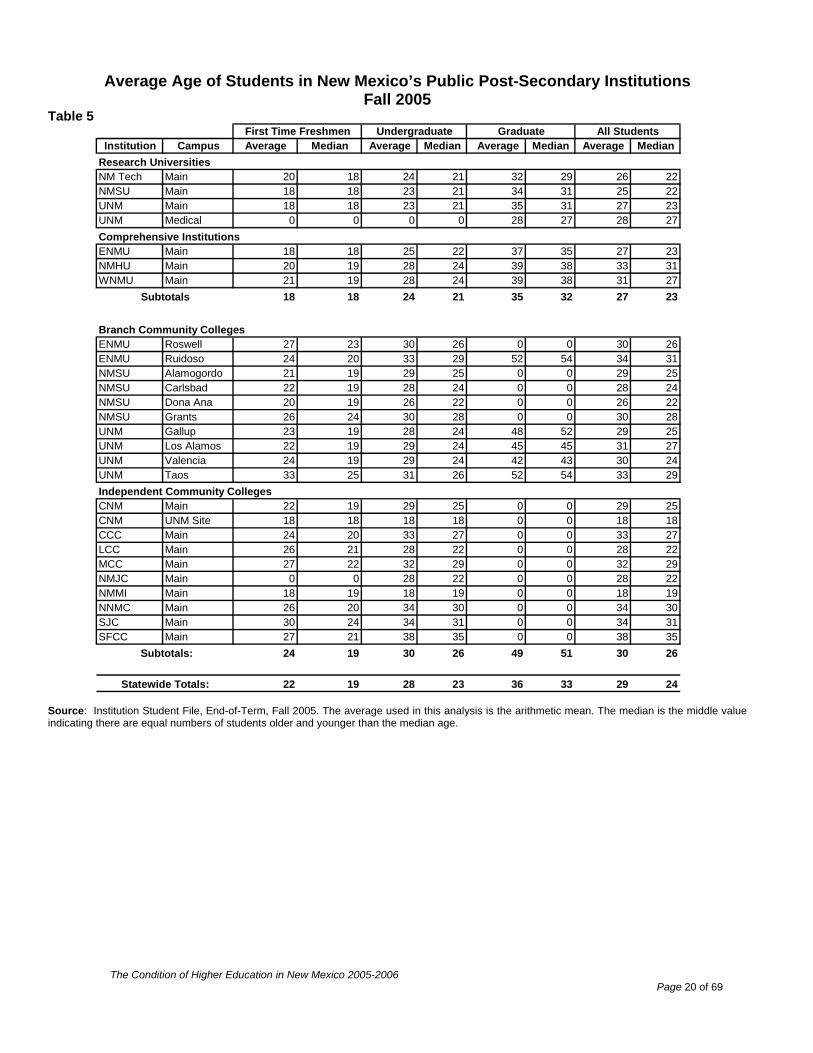
The median age for undergraduate students statewide was 23 and the average age was 28. At two-year colleges the median was 26 and the average was 30, while at the universities the median age for undergraduates was 21 and the average was 24.
The median age for graduate students statewide was 32 and the average was 35.
Completion of Degree Programs
In the 2005-2006 academic year 6,651 certificates and associate’s degrees were completed with the greatest number going to students studying liberal arts and nursing.
Of the 6,158 Bachelor’s degrees awarded, the majority were in business, social sciences, and
math, science, and engineering.
A total of the 3,132 graduate degrees were awarded, with the largest numbers in the fields of education; math, science, and engineering; business; and health related professions.
Cost of Attendance
The FY 2006 average cost for resident undergraduate tuition and fees was $4,179 at the research universities; $3,151 at the comprehensive universities; $1,166 at the branch community colleges; and $867 at the independent community colleges. Data on other costs of attendance such as living expenses, travel, etc., are not collected by the state.

The Condition of Higher Education in New Mexico 2005-2006 Page 8 of 69
Student Financial Assistance
In the 2004-2005 academic year, New Mexico’s post-secondary students received $446 million in financial assistance; of that amount, 72% was from federal sources, 14% was from state sources, and 12% was from private/institutional sources.
In the 2005-2006 academic year, New Mexico’s post-secondary students received just over $461
million in financial assistance, an increase of 3% over the previous year. Seventy-one percent, or $325 million of these funds are attributed to federal sources. However, state contribution of $70 million (16%), institutional aid and private or other external source contribution of $57 million (13%) also provided significant support.
Funding of Post-Secondary Education
In the FY 2007 academic year, 14.9% of the General Fund was appropriated by the legislature for higher education, compared to the FY 2006 academic year in which 15% of the General Fund was appropriated by the legislature for higher education.
Among the six universities, 61.6% of instruction and general revenue budgeted was projected to
come from state sources in FY 2006, with 28% from tuition and fees. In FY 2005, 62.3% of instruction-and-general revenue budgeted was from state sources and 26.8% from tuition and fees.
FY 2006 funding for two-year colleges was anticipated at 59.6% from state sources, 23.3% from
local property tax mil levies, and 15.2% from tuition and fees. For community college funding during FY 2005, 59.3% was from state sources, 23.5% from local property tax mil levies, and 15.2% from tuition and fees. Remaining higher education revenues include federal grants, donations, and other miscellaneous sources.
The average instruction-and-general expenditure budgeted per full-time equivalent student was
$10,408 in FY 2007 and $9,825 in FY 2006.
The average instruction-and-general expenditure budgeted by universities in FY 2007 was $12,308 and for community college campuses $8,126. The average instruction-and-general expenditure budgeted by universities for FY 2006 was $11,548 and for community college campuses $7,098.
During the 2006 Legislative Session, The New Mexico Legislature appropriated more than $164.6
million in Capital Outlay Projects at higher education institutions. In the 2005 session, the New Mexico Legislature appropriated more than $34.4 million for capital outlay projects at higher education institutions.
Further detail on each of these points can be found in the data tables that follow. Additional information can be obtained from the New Mexico Higher Education Department. The New Mexico Higher Education Department The New Mexico Higher Education Department was created during the 2005 legislative session under House Bill 745. The Department brings a statewide perspective in recommending and establishing policy direction and in providing leadership in higher education within New Mexico. Established to foster and guide a system of higher education that best meets the needs of the citizens of the state within the resources available, the Department recognizes that the institutions have authority to determine their own respective missions as set forth in the various constitutional and statutory provisions through which they have been established. The Department provides financing to the state’s institutions of higher education with an equitable distribution of funds among the institutions. The Department has oversight of all public universities and

The Condition of Higher Education in New Mexico 2005-2006 Page 9 of 69
colleges including three research universities, four comprehensive universities, ten branch community colleges, seven independent community colleges, and three special schools. This year, Northern New Mexico College transitioned from a community college to a comprehensive university. Five Native American public institutions and four regionally accredited independent private colleges participate voluntarily in some Department programs. The Department also has regulatory authority over private for-profit institutions operating within the state that include 43 licensed schools and 51 schools exempt from licensure. The Department has statutory authority with regard to higher education governance in the following areas (see below for detailed information):
• Budget • Data collection and verification • Administration of student financial aid • System-wide coordination • Statewide planning and assessment • Review of all new academic programs prior to allocation of state funding • Regulation of private and proprietary schools and out-of-state institutions operating in the
state • Policy analysis, research, and fiscal impact analysis • Administration of the process for changes in college districts and new campuses.
Several federal grants were administered by the agency, including the Adult Basic Education program, which assists adults in becoming literate and in completing a secondary school education, and GEAR UP, a federally funded, secondary school program targeting low-income students and providing information about planning, preparing, and paying for college. Its primary goal is to increase participation and success rates. P20 Policy and Program Division: “PreK to College” The Department’s P20 Policy and Program Division creates policies and programs to minimize barriers to students as they move through the New Mexico educational system. P20 refers to the system of education from PreK though postgraduate study and into the workforce. Easing student transitions from middle school to high school and to college is critical to increasing New Mexico’s student retention, graduation rates, and readiness for the workplace. The current lack of alignment between PreK-12 and post-secondary education is reflected in the high remediation rates at New Mexico colleges and universities (Ready for College?, Department of Finance and Administration, Office of Education Accountability, April, 2006). Forty-eight percent of New Mexico high school graduates require remediation in one or more subjects. Once in the post-secondary system, only 50% of first year community college students return for their second year and only 38% of first-time, full-time students complete a bachelor’s degree within six years of entering college (Measuring Up 2006, State Report Card on Higher Education, National Center for Public Policy and Higher Education, 2006). We are not adequately preparing New Mexico students to succeed in college. The major initiatives of the P20 Policy and Program Division: The Alignment Task Force is a joint initiative of the Higher Education Department and Public Education Department to match high school graduation requirements with college placement requirements. The purpose of alignment is to clarify expectations for learning outcomes at both the secondary and post-secondary levels. In an aligned P20 system, what students are asked to know and do in high school is congruent with post-secondary expectations. Currently, many New Mexico students graduate from high school with the impression that they are prepared for college or the workforce. Unfortunately, too often this is not the case. Many students enter two- or four-year institutions unable to perform college-level work. Working with the Legislative Education Study Committee, the Alignment Task Force will be strengthened by New Mexico’s participation in the American Diploma Project, a network of states working together to accelerate policy development for alignment.
The Data Sharing Task Force is an interagency effort to establish shared student data systems from Pre-K to post-secondary levels of education, including Adult Basic Education (ABE). The goal of the task force

The Condition of Higher Education in New Mexico 2005-2006 Page 10 of 69
is to create data and research capability to develop New Mexico policies to improve student outcomes. These efforts will inform policy development to address student proficiencies and college and career readiness. New Mexico GEAR UP (Gaining Early Awareness and Readiness for Undergraduate Programs) In 2006, the Department was awarded GEAR UP, a U.S. Department of Education grant-funded program to prepare a cohort of 6,000 students in mostly rural school districts to prepare for and succeed in college. New Mexico GEAR UP students will enroll in college and career readiness curricula. Academic and career planning will begin in the seventh grade. Interventions such as tutoring, mentoring, hands-on projects, field trips, and individualized student support will be used. Summer enrichment camps will supplement these intensive academic interventions. Families will be assisted with college planning through workshops, state conferences, and publications. Teachers will participate in professional development. Intended outcomes are improved academic achievement as evidenced by higher levels of proficiency on the New Mexico Standards Based Assessment (NMSBA) test. Governance of Higher Education in New Mexico Governance of the public system of higher education in New Mexico is a joint responsibility of the state, exercised through the New Mexico Higher Education Department, and the individual institutions. Seven public universities in the state are each governed by a board of regents appointed by the Governor. There are ten branch campuses of the universities in the state, which are governed under the auspices of the boards of regents for the parent institutions. In addition, these campuses also have locally elected advisory boards. There are seven independent community colleges, which are governed by locally elected governing boards. The Department also oversees three special schools and coordinates financial aid programs at eight institutions which are not part of the state system, including tribal colleges and private, nonprofit colleges.
Role of the Higher Education Advisory Board The Higher Education Advisory Board advises the Department and the Governor on policy matters. House Bill 745 that created the Higher Education Department outlines the membership of a 14-member advisory board appointed by the Cabinet Secretary. The members representing the post-secondary educational institutions are the chief executive officers of the institution or their designees. By statute, three members represent the research universities, one each from New Mexico Institute of Mining and Technology, New Mexico State University, and the University of New Mexico. One representative from a comprehensive university and three members represent the two-year public post-secondary institutions. One member represents each of the following areas: the accredited private post-secondary institutions, business, faculty, non-faculty staff, tribal colleges in New Mexico, and the Indian nations, tribes, and pueblos in New Mexico. For a list of current advisory board members, visit www.hed.state.nm.us. To reference House Bill 745 visit www.legis.state.nm.us.
Role of the Institutions in Governance The governing boards and management of New Mexico public post-secondary institutions have the authority for: • New program development and approval in conjunction with a review by the New Mexico Higher
Education Department • The quality of instruction • Maintaining accreditation • Facilities planning, building, and maintenance, subject to the approval of the Department prior to
expenditures for capital construction or remodeling • Developing operating budgets for submission to the Department • All personnel decisions • Setting tuition rates • Granting scholarships and administering other financial aid programs • All decisions concerning student acceptance and progress • Awarding of degrees and certificates • Other responsibilities necessary to the day-to-day management of the institution.

The Condition of Higher Education in New Mexico 2005-2006 Page 11 of 69
Statutory Authority of the New Mexico Higher Education Department The New Mexico Higher Education Department has the authority for: Financing and Financial Accountability of Institutions
• Develop, implement, and periodically adjust a funding formula, taking into account numerous cost factors, through which state funds are allocated annually on an equitable basis to all public institutions of higher education; cost factors taken into account include such variables as institutional incomes; balances; overhead costs; student institutional costs varied by type and level of program; research activities; auxiliary enterprise operations; athletic program funding; the funding of branches and vocational facilities; and tuition equalization grants to students
• Make funding recommendations for institutional funds and for the Department’s own budget to the Governor and the Legislature
• Provide procedures and requirements for budgeting, accounting, and reporting of institutional finances
• Review, adjust, and approve operating budgets of the institutions and require mechanisms to track expenditures
• Recommend and prioritize institutional capital projects for executive and legislative approval for funding, primarily from state general obligation bonds
• Recommend funding for infrastructure renovation and expansion projects and distribute proceeds to governing bodies of institutions
• Approve institutional revenue bonds and local general obligation bonds proposed by institutions • Approve capital construction or remodeling projects prior to expenditures, including approval of
financing plans and construction plans • Develop procedures and requirements for accessibility, water conservation in landscaping, and
energy efficiency for facilities • Develop logical, consistent, and equitable organizational and fiscal provisions for the operation of
post-secondary education and for the effective utilization of federal, state, and local funding • Calculate and certify property tax mil rates for community colleges which will yield revenue for the
following fiscal year • In consultation with the state auditor, compile a manual prescribing a uniform classification of
accounts and a uniform system for budgeting and reporting that includes the reporting of all the funds available
• Conduct verification of state institutions of higher education, including enrollment, fund balances, compliance with legislation, comparison of expenditures to budgets and other areas, and report on such annually to the executive and legislative branches
Providing Student Financial Aid
• Provide student financial aid regulations, guidelines, and eligibility criteria to all institutions of higher education in the state
• Administer state student financial aid programs • Develop criteria and award loan-for-service grants for health professions and teaching • Administer New Mexico’s program under the Western Interstate Commission on Higher
Education (WICHE) loan-for-service program • Administer federal student aid programs which are allocated through the state • Serve on the Educational Trust Board and the board of the New Mexico Student Loan Foundation
Coordinating a Statewide System of Higher Education
• Make recommendations to the Governor and the New Mexico State Legislature for actions necessary for a coordinated statewide system of higher education
• Make recommendations to adjust operations of a particular institution in order to best serve a coordinated system of post-secondary education to meet statewide needs
• Develop and maintain a statewide plan for articulation, including a general education common core, additional transfer modules, a student complaint system, and make annual reports on articulation to the New Mexico State Legislature and the Governor
• Facilitate dual credit opportunities for high school students
The Condition of Higher Education in New Mexico 2005-2006 Page 12 of 69
• Review any proposal for the establishment of a new public post-secondary educational institution or campus and submit recommendations to the New Mexico State Legislature
• Receive petitions regarding the service area for a community college district or technical vocational institute district and call and administer any elections concerning the change in boundaries of a district or dissolution of a district
• Carry out responsibilities under the Learning Center Act • Serve on boards such as the Industrial Training Board
Statewide Planning and Assessment • Report annually to the Governor and the New Mexico State Legislature on accountability of all
public and post-secondary institutions with regard to student progress and success, student access and diversity, affordability and cost of educational services, public and community service
• Conduct statewide planning for post-secondary education and make recommendations to institutional governing boards, the New Mexico State Legislature and the Governor. Continued program of planning includes assessment of present and projected needs for all post-secondary institutions, including program and facility needs, analysis of effectiveness, and identification of problems and duplication to assure coordination of a statewide system
Approving and Improving Educational Programs and Operations
• Develop and approve new programs in conjunction with a review by the Department • Approve new associate degree programs at selected independent two-year institutions • Approve courses offered in New Mexico by out-of-state institutions • Exercise authority to approve, deny or revoke registration of private and proprietary post-
secondary schools operating in the state • Promote cooperative education and work-related educational experience, particularly in fields
with shortages • Annually inspect or investigate by report the facilities and programs of each community college to
determine the extent of compliance with the rules promulgated by the Department and bring any serious deviations to the attention of the president and board of the college; in the case of repeated failure to meet standards, may take action discontinuing approval and exclude from subsequent funding calculations
Authorities and Responsibilities Related to Federal Educational Programs
• Administer Adult Basic Education programs throughout the state, supported by both federal and state funding (29 programs at 23 educational institutions of which 19 are state public post-secondary institutions, three are tribal colleges, and one is a public high school; four nonprofit organizations; the State Corrections Facility; and the Alamo Navajo School Board) to provide adult education and literacy programs
• Administer outreach to secondary schools and students under the GEAR UP program to promote college readiness, desire to matriculate, and knowledge of availability of financial aid
• Administer federal Title II, Part A to improve teacher quality • Administer aspects of student financial aid programs authorized by the federal Higher Education
Act
Other responsibilities of the New Mexico Higher Education Department • Conduct research and policy analysis related to improvement of post-secondary education and
education opportunity • Receive student data from institutions for all students enrolled in public institutions of higher
education and maintain student data tracking system • Identify and recommend policies to increase enrollment and retention of students in institutions of
higher education • Provide fiscal impact analysis related to policy recommendations • Respond to requests for financial aid data from executive, legislative, and other external entities • Maintain fiscal watch task force to monitor and review institutions for any inadequacies • Provide analysis of the most effective educational programs • Identify marginal programs and unnecessary duplication of programs • Respond to requests of the Governor and the Legislature related to data collection analysis and
research related to higher education and other requests
The Condition of Higher Education in New Mexico 2005-2006 Page 13 of 69
• Provide information in response to public inquiries • When appropriate, handle complaints related to institutions that fall within the purview of the
Department. The New Mexico Higher Education Department is committed to providing the seamless integration of institutions from preschool through college and/or into the workforce. Moving higher education forward in New Mexico and streamlining the educational experience for students are vital for creating and sustaining a dynamic, high-wage economy. New Mexico Higher Education Department Major Accomplishments 2005-2006 Quantitative Impacts - Making Schools Work
Improve Teacher Quality and ensure every New Mexico resident has the opportunity and necessary financial support to attend higher education: • The Department has defined policy for grants from the College Affordability Act. Beginning Fall
2006, $1.25 million became available to non-traditional students who do not meet the requirements for other state aid.
• Lottery Success Scholarship Awards - In 2005, the Department awarded Lottery Success Scholarships to approximately 15,332 students in the amount of $28.3 million, compared with 2004, when the Department awarded approximately 14,563 students in the amount of $23.9 million. Nearly $5 million more dollars were awarded this year to put an additional 769 New Mexico students in college. Approximately 48% of Lottery Success Scholarship recipients are from low-income or poverty level households.
• The Department produced the Lottery Success Scholarship projection report. • Adult Basic Education Programs – more than 35% of the adult population in New Mexico has
basic skills deficiencies. Last year’s accomplishments include: o 73% of students with the goal of entering post-secondary education or training achieved their
goal o 60% of students with the goal of obtaining a high school diploma achieved their goal o 58% of tested students made significant educational gains (at least one functioning level)
Thanks to Adult Basic Education Programs throughout the state, in 2004-05, New Mexico generated:
o $3,984,864 in new income from 372 students gaining jobs o $267,280 in increased income from 514 students receiving job promotions o An estimated savings of $1,911,000 from 147 students being removed from public assistance o $796,973 in new taxes from 372 students gaining jobs o $53,456 in increased taxes from 514 students receiving job promotions o $850,432 increased taxes paid annually o $14,822,200 added income annually for 2,003 GED graduates
• P-16 Professional Development Grants – the Department awarded grants to six recipients in the amount of $567,604.09.
• Minority Doctoral Program to increase minority faculty at New Mexico institutions – For the 2005-2006 academic year the Department awarded seven recipients in the amount of $105,000. Twenty-two minority faculty members who have received doctoral program grants from the Department are currently teaching at New Mexico’s public higher education institutions.
• In 2005-2006 the Department provided Teacher Loan-for-Service awards to 84 recipients in the amount of $313,488.
• In 2005-2006 the Department provided: o Nursing Loan-for-Service awards to 81 recipients in the amount of $464,100 o Medical Loan-for-Service awards to 7 recipients in the amount of $79,500 o Allied Health Loan-for-Service awards to 9 recipients in the amount of $125,000
Increase the level of educational excellence for all students, ensure that all students are taught by competent teachers, and ensure students graduate from high school better prepared to succeed in higher education: • With the Office of Education Accountability and the Public Education Department, the Department
completed the “Ready for College?” study of students needing remediation after high school graduation. New Mexico is one of a few, if not the only state to conduct such a study. This

The Condition of Higher Education in New Mexico 2005-2006 Page 14 of 69
establishes baseline data for New Mexico to use to measure improvement. • The Department obtained an $18 million GEAR-UP grant, a federally-funded college preparation
program that will reach 18 school districts with 6,000 seventh graders to address every aspect of educating students and their families about how to prepare for college.
• The Department completed the comprehensive faculty compensation survey to determine inequities within the state and between peer institutions in other states. The staff compensation study will be completed in December 2006.
• The Department is coordinating with Public Education, Office of Workforce Training and Development, Department of Labor, and Children, Youth and Families Department on the Data Sharing Task Force to use a student identifier to monitor a student’s progress from preschool into the workforce.
• The Higher Education and Public Education Alignment Task Force on High School Competencies and College Placement is aligning high school competencies with college entrance requirements to help reduce the number of students needing remedial courses in college. A joint agreement on definitions and equivalencies for student learning and placement will be completed by December 2006. The goal is to test students at the beginning of junior year in high school to allow sufficient time for academic remediation.
• The Department is collaborating with the Public Education Department to strengthen dual enrollment and advanced placement programs, including definitions, agreements, and revisions to each Department’s administrative code for a more effective policy tool for student retention and graduation.
• The Department established an Educational Equity and Access Division to address minority educational attainment. The Division produced the Native American and Hispanic Recruitment and Retention report, tracking data for minority participation in higher education. This is the first study of its kind conducted in New Mexico. The Division also produced a report of the recommendations and results from the Indian Education Summit.
• To support Hispanic enrollment in higher education, the Department secured increased funding for the ENLACE program in the amount of $891,000.
Ensure New Mexico’s education system supports the state’s efforts to develop a high-wage economy: • The Department secured increased funding for Loan-for-Service and Loan Repayment Programs
including $300,000 for Public Service Law and $133,000 for WICHE dental slots. The Financial Aid Division will provide the first repayment awards to lawyers working in public service and earning an annual salary less than $45,000.
• The Department was one of seven state agencies appointed by the Governor to the Workforce Coordination and Oversight Council to develop and market the Career Clusters Guidebook, published in August 2006.
• The Department has tracked the implementation of career-technical programs funded through 2004 capital outlay to ensure that draw downs are processed within 30 days of receipt and all funding is distributed in a timely manner.
• The Department allocated Nursing Enhancement Awards to selected institutions based on nursing program proposals.
• The Department is developing a web-based general education course articulation matrix to better serve students in planning their education path and accessing information on the transferability of courses.
• The Department is developing a private/proprietary policy plan to strengthen regulation of private proprietary post-secondary institutions in New Mexico.
Ensure all students attend schools that are safe, adequate, well-maintained, and equipped with current education technology:
• The Department secured state funding in the amount of $20 million as a supplement for the Building Renewal and Replacement fund.
• The Department created the Infrastructure Task Force to develop new means of prioritizing infrastructure needs and to seek alternative revenue sources.
• The Department secured funding to update the 3D/I facilities study to prioritize and fund infrastructure needs at public colleges and universities and to develop a five-year plan for higher education infrastructure.

The Condition of Higher Education in New Mexico 2005-2006 Page 15 of 69
• The Department transferred the funding mechanism for the School for the Deaf and the School for the Blind and Visually Impaired to the Public School Capital Outlay process.
Administrative Actions
• With input from diverse stakeholders, the Department created a statewide plan for higher education that focuses on the needs of the students and the priorities of the state as a whole as opposed to those of each individual institution.
• The Department participated in the New Mexico First Town Hall meeting on higher education and staff has served on the implementation team to address the outcomes of the town hall meeting identifying higher education priorities.
• The Department developed a five-year plan for the graduate program approval process that resulted in the Board of Finance lifting its moratorium on the approval of new graduate programs.
• The Department combined budget and capital projects hearings for public institutions to streamline the budget approval process.
• The Department is working with Tribal colleges and the Tribal Higher Education Commission to develop a Memorandum of Understanding regarding articulation and other issues.
• The Department produced the first Governor’s Summit on Higher Education, which was attended by more than 570 participants.
• The Department is working with other agencies to address statewide distance learning needs to maximize resources, develop efficient means of delivering education at all levels to rural areas, and to address infrastructure needs.
• The Department produced the Governing Boards Retreat for presidents and governing board members of public colleges and universities.
• The Department conducted business meetings for Chief Academic Officers, Registrars, Financial Aid Professionals, Business Officers, Data Coordinators, and Capital Project Managers.
• The Department has increased the commitment to collaboration and coordination with public institutions and other state agencies on better serving students and preparing them for college and the workforce.
• The Department has entered into an agreement with a contractor to scan students’ transcripts from closed private post-secondary institutions. Scanning will save staff time to retrieve transcripts requested by students and also improve response time to students.
• The Department developed and launched a new website for data exchanges and resource access for institutions.
• The Secretary of Higher Education established higher education task forces: o Geographic Service Areas Task Force to look at geographic service areas and design
policy and funding mechanisms to improve efficiency o Formula Enhancement Task Force to study the results of revisions to the Higher
Education Funding Formula to produce the desired outcomes and to implement components of performance-based funding
o Articulation Task Force to develop a system that ensures the transferability of the statewide general education core, creating a set of competencies for each area under general education, creating a common template for communicating competency components, and developing a common course numbering and naming system. Transfer modules have been completed in Early Education, Business, and Criminal Justice.
o Nursing Enhancement Task Force is a partnership with private providers to help develop performance measures for nursing programs, to continue the dialogue of how higher education can help provide nurses for New Mexico, and in preparation to pilot performance-based funding.
The Condition of Higher Education in New Mexico 2005-2006 Page 16 of 69
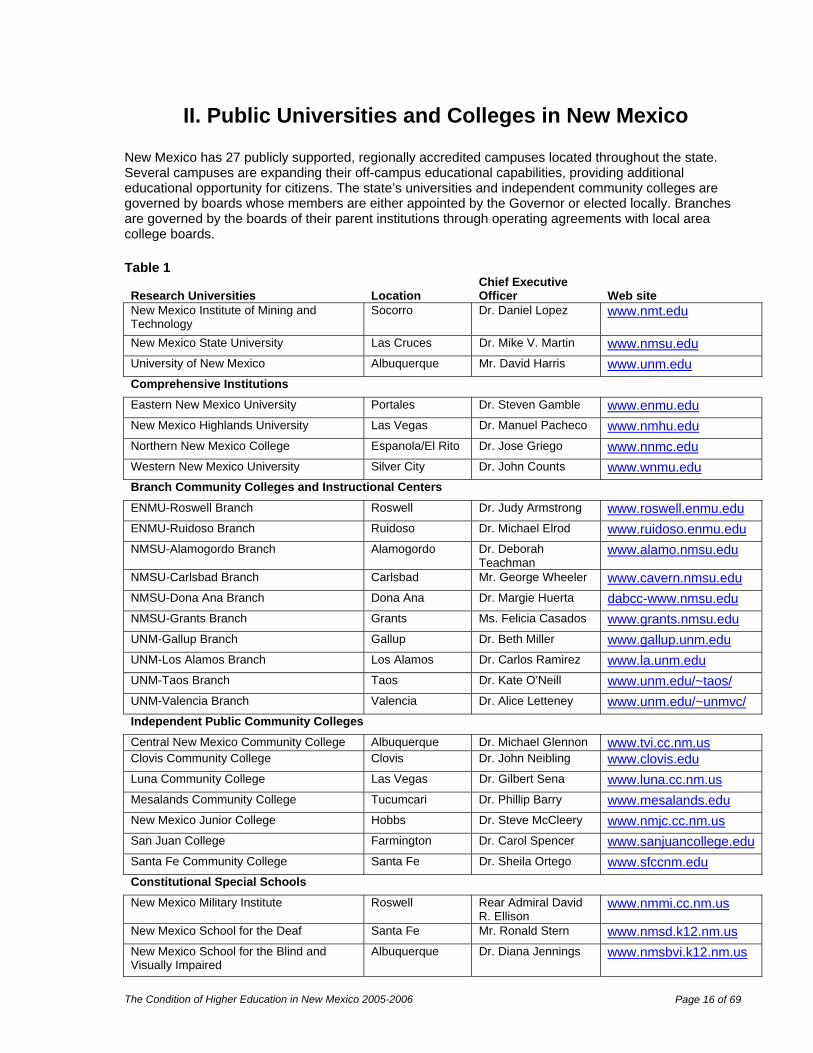
II. Public Universities and Colleges in New Mexico New Mexico has 27 publicly supported, regionally accredited campuses located throughout the state. Several campuses are expanding their off-campus educational capabilities, providing additional educational opportunity for citizens. The state’s universities and independent community colleges are governed by boards whose members are either appointed by the Governor or elected locally. Branches are governed by the boards of their parent institutions through operating agreements with local area college boards. Table 1
Research Universities Location Chief Executive Officer Web site
New Mexico Institute of Mining and Technology
Socorro Dr. Daniel Lopez www.nmt.edu
New Mexico State University Las Cruces Dr. Mike V. Martin www.nmsu.edu University of New Mexico Albuquerque Mr. David Harris www.unm.edu Comprehensive Institutions Eastern New Mexico University Portales Dr. Steven Gamble www.enmu.edu New Mexico Highlands University Las Vegas Dr. Manuel Pacheco www.nmhu.edu Northern New Mexico College Espanola/El Rito Dr. Jose Griego www.nnmc.edu Western New Mexico University Silver City Dr. John Counts www.wnmu.edu Branch Community Colleges and Instructional Centers
ENMU-Roswell Branch Roswell Dr. Judy Armstrong www.roswell.enmu.edu ENMU-Ruidoso Branch Ruidoso Dr. Michael Elrod www.ruidoso.enmu.edu NMSU-Alamogordo Branch Alamogordo Dr. Deborah
Teachman www.alamo.nmsu.edu
NMSU-Carlsbad Branch Carlsbad Mr. George Wheeler www.cavern.nmsu.edu NMSU-Dona Ana Branch Dona Ana Dr. Margie Huerta dabcc-www.nmsu.edu NMSU-Grants Branch Grants Ms. Felicia Casados www.grants.nmsu.edu UNM-Gallup Branch Gallup Dr. Beth Miller www.gallup.unm.edu UNM-Los Alamos Branch Los Alamos Dr. Carlos Ramirez www.la.unm.edu UNM-Taos Branch Taos Dr. Kate O’Neill www.unm.edu/~taos/ UNM-Valencia Branch Valencia Dr. Alice Letteney www.unm.edu/~unmvc/ Independent Public Community Colleges Central New Mexico Community College Albuquerque Dr. Michael Glennon www.tvi.cc.nm.us Clovis Community College Clovis Dr. John Neibling www.clovis.edu Luna Community College Las Vegas Dr. Gilbert Sena www.luna.cc.nm.us Mesalands Community College Tucumcari Dr. Phillip Barry www.mesalands.edu New Mexico Junior College Hobbs Dr. Steve McCleery www.nmjc.cc.nm.us San Juan College Farmington Dr. Carol Spencer www.sanjuancollege.eduSanta Fe Community College Santa Fe Dr. Sheila Ortego www.sfccnm.edu Constitutional Special Schools
New Mexico Military Institute Roswell Rear Admiral David R. Ellison
www.nmmi.cc.nm.us
New Mexico School for the Deaf Santa Fe Mr. Ronald Stern www.nmsd.k12.nm.us New Mexico School for the Blind and Visually Impaired
Albuquerque Dr. Diana Jennings www.nmsbvi.k12.nm.us

The Condition of Higher Education in New Mexico 2005-2006 Page 17 of 69
III. Enrollment Data
Table 2
Total Student Enrollment at New Mexico Public Post-Secondary Institutions Fall 2005
Institution Head Count FTE Research Universities NMIMT Main 1,888 1,504 NMSU Main 16,079 12,652 UNM Main 26,024 20,542 UNM Medical 291 466 Subtotal: 44,282 35,164 Comprehensive Institutions ENMU Main 4,055 3,134 NMHU Main 3,484 2,217 NNMC Main 2,196 1,139 WNMU Main 2,844 1,878 Subtotal: 12,579 8,367 Branch Community Colleges ENMU Roswell 4,216 2,390 ENMU Ruidoso 674 296 NMSU Alamogordo 2,035 1,100 NMSU Carlsbad 1,267 817 NMSU Dona Ana 6,857 3,759 NMSU Grants 664 415 UNM Gallup 2,936 1,662 UNM Los Alamos 816 398 UNM Valencia 1,739 973 UNM Taos 1,302 577 Subtotal: 22,506 12,387 Independent Community Colleges CNM Main 23,107 12,236 CNM UNM Site 950 246 CCC Main 3,937 1,773 LCC Main 2,034 936 MCC Main 648 341 NMJC Main 3,104 1,687 NMMI Main 493 544 SJC Main 8,993 4,196 SFCC Main 5,412 2,067 Subtotal: 48,678 24,026 System Total: 128,045 79,944
Source: Fall 2005 Institution Registrar’s Report. These figures are based upon Third Friday census date enrollments. Full-time equivalent enrollment is calculated by dividing the total undergraduate credit hours taken by 15 and dividing the total graduate credit hours taken by 12, the minimum numbers of credit hours required for full-time enrollment at those two levels, respectively. Enrollments 2002-2005 are provided in Appendix A.
The Condition of Higher Education in New Mexico 2005-2006 Page 18 of 69
State Residency of Students Attending New Mexico Public Post-Secondary Institutions Fall 2004 and Fall 2005
Table 3
Fall 2004 Fall 2005
Head Count
State Residents
Head Count
State Residents
Research Universities New Mexico Institute of Mining and Tech 1,829 78% 1,888 78%New Mexico State University 16,442 79% 16,079 79%University of New Mexico 26,237 86% 26,024 87%UNM Medical School 296 97% 291 99% 44,804 44,282 Comprehensive Institutions Eastern New Mexico University 3,964 82% 4,055 81%New Mexico Highlands University 3,551 87% 3,484 87%Northern New Mexico College 2,121 96% 2,196 96%Western New Mexico University 2,858 82% 2,844 82% 12,494 12,579 Branch Community Colleges ENMU-Roswell 4,196 90% 4,216 90%ENMU-Ruidoso 754 99% 674 98%NMSU-Alamogordo 1,884 79% 2,035 79%NMSU-Carlsbad 1,296 98% 1,267 98%NMSU-Dona Ana 6,320 92% 6,857 93%NMSU-Grants 703 97% 664 98%UNM-Gallup 3,114 71% 2,936 72%UNM-Los Alamos 970 96% 816 94%UNM-Taos 1,125 90% 1,302 95%UNM-Valencia 1,798 97% 1,739 97% 22,160 22,506 Independent Community Colleges Central New Mexico 22,927 97% 24,057 97%Clovis Community College 4,195 74% 3,937 74%Luna Community College 2,041 98% 2,034 96%Mesalands Community College 574 95% 648 96%New Mexico Junior College 3,546 87% 3,104 88%New Mexico Military Institute 483 24% 493 24%San Juan College 9,128 85% 8,993 86%Santa Fe Community College 5,170 91% 5,412 93% 48,064 48,678 Statewide Totals: 127,522 86% 128,045 88%
The numbers represent both undergraduate and graduate students regardless of tuition waiver. Includes unduplicated students reported by institutions regardless of delivery site.
The Condition of Higher Education in New Mexico 2005-2006 Page 19 of 69
Ethnicity and Gender of All Students at Public Post-Secondary Institutions Fall 2005
Table 4
Total No. % No. % No. % No. % No. % No. % No. % No. % No. %
NMIMT Main 1,888 1,255 66% 328 17% 45 2% 14 1% 47 2% 167 9% 32 2% 1,228 65% 660 35%
NMSU Main 16,080 5,497 34% 6,658 41% 459 3% 445 3% 203 1% 657 4% 2,161 13% 7,034 44% 9,046 56%
UNM Main 26,024 12,481 48% 7,794 30% 1,518 6% 684 3% 866 3% 861 3% 1,820 7% 10,906 42% 15,118 58%
UNM Medical 291 173 59% 80 27% 9 3% 3 1% 19 7% 1 0% 6 2% 120 41% 171 59%
Subtotal 44,283 19,406 44% 14,860 34% 2,031 5% 1,146 3% 1,135 3% 1,686 4% 4,019 9% 19,288 44% 24,995 56%
ENMU Main 4,055 2,346 58% 1,087 27% 109 3% 257 6% 41 1% 56 1% 159 4% 1,647 41% 2,408 59%
NNMC Main 2,196 447 20% 1,575 72% 140 6% 15 1% 16 1% 1 0% 2 0% 787 36% 1,409 64%
NMHU Main 3,484 1,138 33% 1,772 51% 259 7% 105 3% 42 1% 36 1% 132 4% 1,176 34% 2,308 66%
WNMU Main 2,844 1,158 41% 1,170 41% 129 5% 70 2% 24 1% 40 1% 253 9% 996 35% 1,848 65%
Subtotal 12,579 5,089 40% 5,604 45% 637 5% 447 4% 123 1% 133 1% 546 4% 4,606 37% 7,973 63%
ENMU Roswell 4,224 2,018 48% 1,723 41% 154 4% 88 2% 41 1% 1 0% 199 5% 1,956 46% 2,268 54%
ENMU Ruidoso 674 423 63% 141 21% 61 9% 10 1% 2 0% 2 0% 35 5% 214 32% 460 68%
NMSU Alamogordo 2,035 810 40% 528 26% 79 4% 104 5% 52 3% 39 2% 423 21% 723 36% 1,312 64%
NMSU Carlsbad 1,267 509 40% 457 36% 11 1% 22 2% 9 1% 4 0% 255 20% 419 33% 848 67%
NMSU Dona Ana 6,857 1,390 20% 4,311 63% 152 2% 174 3% 62 1% 80 1% 688 10% 2,953 43% 3,904 57%
NMSU Grants 664 109 16% 211 32% 252 38% 6 1% 4 1% - 0% 82 12% 185 28% 479 72%
UNM Gallup 2,936 326 11% 275 9% 2,252 77% 18 1% 24 1% 11 0% 30 1% 957 33% 1,979 67%
UNM Los Alamos 816 348 43% 341 42% 53 6% 2 0% 23 3% 10 1% 39 5% 332 41% 484 59%
UNM Valencia 1,739 580 33% 983 57% 59 3% 21 1% 18 1% 15 1% 63 4% 526 30% 1,213 70%
UNM Taos 1,302 476 37% 643 49% 78 6% 10 1% 8 1% - 0% 87 7% 397 30% 905 70%
Subtotal 22,514 6,989 31% 9,613 43% 3,151 14% 455 2% 243 1% 162 1% 1,901 8% 8,662 38% 13,852 62%
CNM Main 23,107 8,867 38% 9,493 41% 1,650 7% 698 3% 563 2% 83 0% 1,753 8% 9,374 41% 13,733 59%
CNM UNM Site 950 294 31% 466 49% 77 8% 45 5% 40 4% 2 0% 26 3% 364 38% 586 62%
CCC Main 3,937 2,475 63% 1,124 29% 30 1% 196 5% 59 1% 1 0% 52 1% 1,378 35% 2,559 65%
LCC Main 2,034 211 10% 1,705 84% 37 2% 30 1% 10 0% 1 0% 40 2% 841 41% 1,193 59%
MCC Main 648 360 56% 214 33% 17 3% 9 1% 4 1% - 0% 44 7% 269 42% 379 58%
NMJC Main 3,104 1,618 52% 1,125 36% 32 1% 123 4% 21 1% - 0% 185 6% 1,196 39% 1,908 61%
NMMI Main 493 244 49% 95 19% 15 3% 72 15% 44 9% 21 4% 2 0% 414 84% 79 16%
SJC Main 8,993 5,186 58% 1,075 12% 2,210 25% 54 1% 69 1% - 0% 399 4% 4,215 47% 4,778 53%
SFCC Main 5,412 2,740 51% 1,812 33% 142 3% 63 1% 87 2% 9 0% 559 10% 2,028 37% 3,384 63%
Subtotal 48,678 21,995 45% 17,109 35% 4,210 9% 1,290 3% 897 2% 117 0% 3,060 6% 20,079 41% 28,599 59%
System Total: 128,054 53,479 42% 47,186 37% 10,029 8% 3,338 3% 2,398 2% 2,098 2% 9,526 7% 52,635 41% 75,419 59%
Research Universities
Comprehensive Institutions
Branch Community Colleges
Independent Community Colleges
Ethnicity and Gender of All Students at Public Post-Secondary Institutions - Fall 2005White Hispanic
Native American Black Asian Internat Unknown Male Female
Source: Institution Registrar’s Report, Fall 2005. Cluster percentages may not total 100 because of rounding error. *NR categorizes students who chose not to identify their race/ethnicity. In addition, during Spring 2000, New Mexico State University changed the race/ethnicity selections available to students, permitting “White” as an option separate from “Other.” Students were asked to select their most appropriate race/ethnicity category. Students may not have yet changed their designation and are reported as “Not Reported” or NR.
The Condition of Higher Education in New Mexico 2005-2006 Page 20 of 69
Average Age of Students in New Mexico’s Public Post-Secondary Institutions Fall 2005
Table 5
Institution Campus Average Median Average Median Average Median Average Median
NM Tech Main 20 18 24 21 32 29 26 22NMSU Main 18 18 23 21 34 31 25 22UNM Main 18 18 23 21 35 31 27 23UNM Medical 0 0 0 0 28 27 28 27
ENMU Main 18 18 25 22 37 35 27 23NMHU Main 20 19 28 24 39 38 33 31WNMU Main 21 19 28 24 39 38 31 27
18 18 24 21 35 32 27 23
ENMU Roswell 27 23 30 26 0 0 30 26ENMU Ruidoso 24 20 33 29 52 54 34 31NMSU Alamogordo 21 19 29 25 0 0 29 25NMSU Carlsbad 22 19 28 24 0 0 28 24NMSU Dona Ana 20 19 26 22 0 0 26 22NMSU Grants 26 24 30 28 0 0 30 28UNM Gallup 23 19 28 24 48 52 29 25UNM Los Alamos 22 19 29 24 45 45 31 27UNM Valencia 24 19 29 24 42 43 30 24UNM Taos 33 25 31 26 52 54 33 29
CNM Main 22 19 29 25 0 0 29 25CNM UNM Site 18 18 18 18 0 0 18 18CCC Main 24 20 33 27 0 0 33 27LCC Main 26 21 28 22 0 0 28 22MCC Main 27 22 32 29 0 0 32 29NMJC Main 0 0 28 22 0 0 28 22NMMI Main 18 19 18 19 0 0 18 19NNMC Main 26 20 34 30 0 0 34 30SJC Main 30 24 34 31 0 0 34 31SFCC Main 27 21 38 35 0 0 38 35
24 19 30 26 49 51 30 26
22 19 28 23 36 33 29 24
All Students
Subtotals:
Statewide Totals:
Subtotals
Comprehensive Institutions
Research Universities
Branch Community Colleges
Independent Community Colleges
First Time Freshmen Undergraduate Graduate
Source: Institution Student File, End-of-Term, Fall 2005. The average used in this analysis is the arithmetic mean. The median is the middle value indicating there are equal numbers of students older and younger than the median age.

The Condition of Higher Education in New Mexico 2005-2006 Page 21 of 69
IV. Degrees Awarded
Certificates and Associate’s Degrees Awarded, 2005-2006 Academic Year Table 6
Fields of Study Male Female TotalAgriculture, Agriculture Operations, and Related Sciences 7 5 12 Area, Ethnic, Cultural, and Gender Studies - 1 1 Basic Skills 1 - 1 Biological and Biomedical Sciences 3 20 23 Business, Management, Marketing, and Related Support Services 166 688 854 Communication, Journalism, and Related Programs 1 - 1 Communications Technologies/Technicians and Support Services 2 1 3 Computer and Information Sciences and Support Services 155 81 236 Construction Trades 205 24 229 Education 52 350 402 Engineering Technologies/Technicians 255 67 322 Engineering 19 5 24 Family and Consumer Sciences/Human Sciences 11 94 105 Foreign Languages, Literatures, and Linguistics 2 4 6 Health Professions and Related Clinical Sciences 328 1,282 1,610 History 1 - 1 Legal Professions and Studies 10 80 90 Leisure and Recreational Activities 1 - 1 Liberal Arts and Sciences, General Studies and Humanities 333 896 1,229 Library Science - 7 7 Mathematics and Statistics - 2 2 Mechanic and Repair Technologies/Technicians 315 27 342 Multi/Interdisciplinary Studies 120 96 216 Natural Resources and Conservation 3 - 3 Parks, Recreation, Leisure, and Fitness Studies 8 17 25 Personal and Culinary Services 60 148 208 Physical Sciences 10 9 19 Precision Production 77 5 82 Psychology 2 5 7 Public Administration and Social Service Professions 16 55 71 Security and Protective Services 135 118 253 Social Sciences 3 2 5 Transportation and Materials Moving 127 16 143 Visual and Performing Arts 36 82 118
Total 2,464 4,187 6,651 Source: Institution Degree Files, 2005-2006. Categories used in this table have been formed to follow certain distinctions used in New Mexico, including classification of fields of study in the Lower-Division Common Core of General Education, health-related fields of study eligible for state-funded student financial aid, and clusters about which information is most frequently requested. The table reflects numbers of degrees awarded and not a headcount.

The Condition of Higher Education in New Mexico 2005-2006 Page 22 of 69
Bachelor’s Degrees Awarded State Wide, 2005-2006 Academic Year Table 7
Fields of Study Male Female TotalAgriculture, Agriculture Operations, and Related Sciences 60 61 121 Architecture and Related Services 25 23 48 Area, Ethnic, Cultural, and Gender Studies 12 22 34 Biological and Biomedical Sciences 123 206 329 Business, Management, Marketing, and Related Support Services 489 540 1,029 Communication, Journalism, and Related Programs 56 99 155 Computer and Information Sciences and Support Services 62 25 87 Education 172 708 880 Engineering Technologies/Technicians 61 6 67 Engineering 313 80 393 English Language and Literature/Letters 84 157 241 Family and Consumer Sciences/Human Sciences 6 109 115 Foreign Languages, Literatures, and Linguistics 41 106 147 Health Professions and Related Clinical Sciences 77 424 501 History 68 55 123 Liberal Arts and Sciences, General Studies and Humanities 127 185 312 Mathematics and Statistics 53 33 86 Multi/Interdisciplinary Studies - 1 1 Natural Resources and Conservation 24 18 42 Parks, Recreation, Leisure, and Fitness Studies 11 7 18 Philosophy and Religious Studies 25 14 39 Physical Sciences 67 46 113 Psychology 80 209 289 Public Administration and Social Service Professions 15 60 75 Security and Protective Services 115 154 269 Social Sciences 165 236 401 Visual and Performing Arts 95 148 243
Total 2,426 3,732 6,158 Source: Institution Degree Files, 2005-2006. Categories used in this table have been formed to follow certain disciplines used in New Mexico, including classification of fields of study in the Lower-Division Common Core of General Education, health-related fields of study eligible for state-funded student financial aid, and clusters about which information is most frequently requested. The table reflects numbers of degrees awarded and not a headcount.

The Condition of Higher Education in New Mexico 2005-2006 Page 23 of 69
Graduate Degrees Awarded Statewide, 2005-2006 Academic Year Master’s, Educational Specialist, and Doctoral Degrees
Table 8
Fields of Study Male Female TotalAgriculture, Agriculture Operations, and Related Sciences 26 14 40 Architecture and Related Services 16 30 46 Area, Ethnic, Cultural, and Gender Studies 15 23 38 Biological and Biomedical Sciences 22 31 53 Business, Management, Marketing, and Related Support Servic 159 151 310 Communication, Journalism, and Related Programs 1 3 4 Communications Technologies/Technicians and Support Servic 5 1 6 Computer and Information Sciences and Support Services 69 18 87 Education 213 741 954 Engineering Technologies/Technicians 1 1 Engineering 233 72 305 English Language and Literature/Letters 26 63 89 Family and Consumer Sciences/Human Sciences 4 26 30 Foreign Languages, Literatures, and Linguistics 15 37 52 Health Professions and Related Clinical Sciences 100 349 449 History 8 6 14 Legal Professions and Studies 54 65 119 Liberal Arts and Sciences, General Studies and Humanities 2 - 2 Mathematics and Statistics 22 21 43 Multi/Interdisciplinary Studies 3 9 12 Natural Resources and Conservation 3 8 11 Philosophy and Religious Studies 6 1 7 Physical Sciences 79 43 122 Psychology 16 34 50 Public Administration and Social Service Professions 29 76 105 Security and Protective Services 1 10 11 Social Sciences 51 57 108 Visual and Performing Arts 28 36 64
Total 1,207 1,925 3,132 Source: Institution Degree Files, 2005-2006. Categories used in this table have been formed to follow certain disciplines used in New Mexico, including classification of fields of study in the Lower-Division Common Core of General Education, health-related fields of study eligible for state-funded student financial aid, and clusters about which information is most frequently requested.

The Condition of Higher Education in New Mexico 2005-2006 Page 24 of 69
Statewide Certificate and Degree Recipients in New Mexico Numbers of Graduates at Each Degree Level and
Number of Recipients by Racial/Ethnic and Gender Clusters Table 9
Anglo/ Non-Res.White Hispanic Black Asian Alien NR Female
Associate & Certificates
1996-1997 4,183 2,270 1,228 437 112 62 16 58 1,5061997-1998 3,887 2,037 1,245 369 106 50 17 63 1,3201998-1999 3,968 2,011 1,343 355 108 70 9 72 1,3941999-2000* 4,523 1,697 1,635 438 106 86 14 547 1,7872000-2001* 4,497 1,716 1,706 449 112 68 10 436 1,6462001-2002* 4,532 1,683 1,726 496 97 69 22 439 1,6392002-2003* 4,892 1,861 1,873 516 105 108 20 409 1,7702003-2004 5,634 2,393 2,076 555 108 87 20 395 2,1132004-2005 6,183 2,511 2,331 605 114 80 29 513 2,1742005-2006 6,651 2,692 2,603 633 121 121 32 449 4,187
Bachelor’s1996-1997 5,564 3,394 1,605 190 130 98 115 32 2,4351997-1998 5,751 3,458 1,734 204 115 105 94 41 2,4291998-1999 5,697 3,291 1,722 249 132 135 94 74 2,3541999-2000* 5,605 2,282 1,657 219 122 108 71 1146 2,3532000-2001* 5,405 2,342 1,776 232 134 118 76 727 2,2082001-2002* 5,322 2,272 1,805 200 118 135 63 729 2,1392002-2003* 5,794 2,452 2,079 242 133 147 70 671 2,3502003-2004 5,940 2,532 2,176 242 148 138 75 629 2,4182004-2005 6,101 2,564 2,236 280 148 137 73 663 2,4952005-2006 6,158 2,754 2,232 287 156 108 60 559 3,732
Master’s & Post-Masters1996-1997 2,316 1,607 382 35 26 24 214 28 1,0011997-1998 2,159 1,437 374 53 34 36 199 26 9061998-1999 2,098 1,342 409 36 38 32 180 61 8521999-2000* 1,960 852 345 54 33 21 194 461 7732000-2001* 2,003 932 384 59 36 36 231 325 8222001-2002* 1,998 851 436 66 36 37 240 332 7882002-2003* 2,144 1,044 439 58 33 37 263 270 8882003-2004 2,414 1,127 550 97 46 53 276 265 9432004-2005 2,639 1,262 620 87 53 53 312 252 1,0352005-2006 2,595 1,169 643 93 42 43 308 298 1,657
Doctoral & Professional1996-1997 451 277 67 22 8 11 62 4 2481997-1998 497 300 70 16 9 10 88 4 2851998-1999 447 304 58 11 4 9 54 7 2201999-2000* 497 268 93 9 9 18 51 49 2562000-2001* 514 273 91 15 9 35 51 40 2612001-2002* 559 310 89 19 7 34 70 30 2642002-2003* 489 266 85 12 11 28 51 36 2402003-2004 526 267 91 15 13 34 66 40 2622004-2005 561 270 102 23 10 35 80 41 259
Degrees Awarded
Native American
The Condition of Higher Education in New Mexico 2005-2006 Page 25 of 69
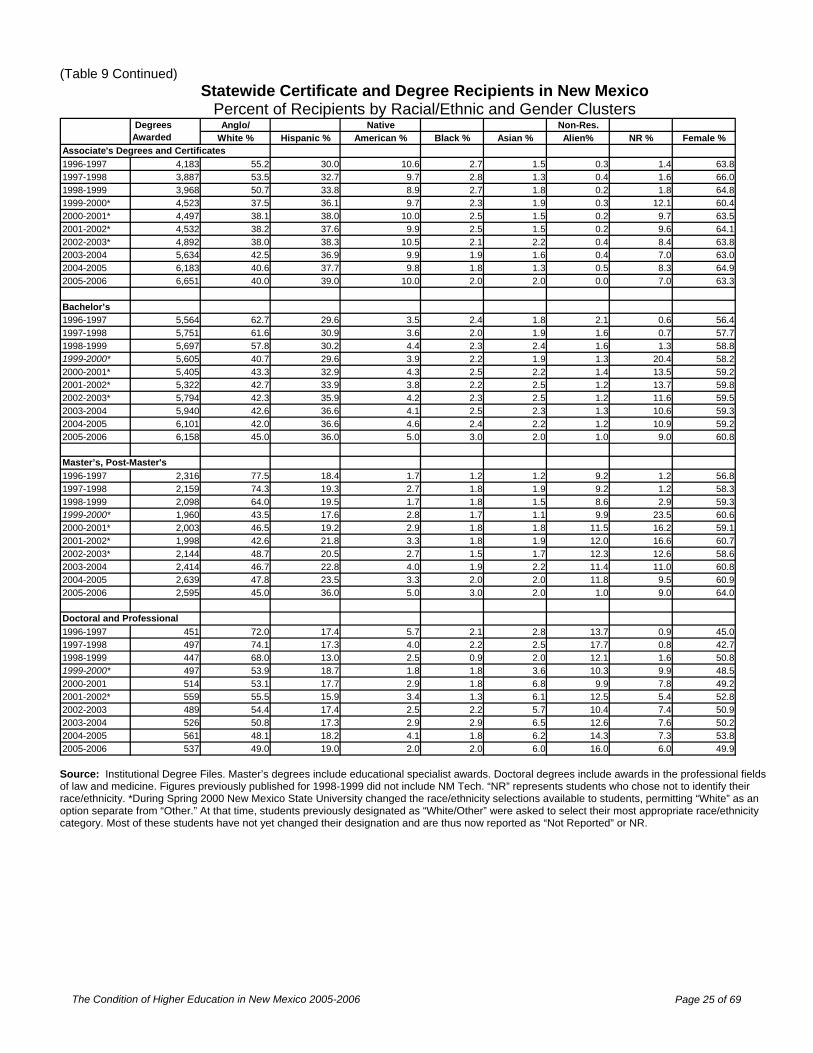
(Table 9 Continued) Statewide Certificate and Degree Recipients in New Mexico
Percent of Recipients by Racial/Ethnic and Gender Clusters Anglo/ Native Non-Res.
White % Hispanic % American % Black % Asian % Alien% NR % Female %
1996-1997 4,183 55.2 30.0 10.6 2.7 1.5 0.3 1.4 63.81997-1998 3,887 53.5 32.7 9.7 2.8 1.3 0.4 1.6 66.01998-1999 3,968 50.7 33.8 8.9 2.7 1.8 0.2 1.8 64.81999-2000* 4,523 37.5 36.1 9.7 2.3 1.9 0.3 12.1 60.42000-2001* 4,497 38.1 38.0 10.0 2.5 1.5 0.2 9.7 63.52001-2002* 4,532 38.2 37.6 9.9 2.5 1.5 0.2 9.6 64.12002-2003* 4,892 38.0 38.3 10.5 2.1 2.2 0.4 8.4 63.82003-2004 5,634 42.5 36.9 9.9 1.9 1.6 0.4 7.0 63.02004-2005 6,183 40.6 37.7 9.8 1.8 1.3 0.5 8.3 64.92005-2006 6,651 40.0 39.0 10.0 2.0 2.0 0.0 7.0 63.3
Bachelor’s1996-1997 5,564 62.7 29.6 3.5 2.4 1.8 2.1 0.6 56.41997-1998 5,751 61.6 30.9 3.6 2.0 1.9 1.6 0.7 57.71998-1999 5,697 57.8 30.2 4.4 2.3 2.4 1.6 1.3 58.81999-2000* 5,605 40.7 29.6 3.9 2.2 1.9 1.3 20.4 58.22000-2001* 5,405 43.3 32.9 4.3 2.5 2.2 1.4 13.5 59.22001-2002* 5,322 42.7 33.9 3.8 2.2 2.5 1.2 13.7 59.82002-2003* 5,794 42.3 35.9 4.2 2.3 2.5 1.2 11.6 59.52003-2004 5,940 42.6 36.6 4.1 2.5 2.3 1.3 10.6 59.32004-2005 6,101 42.0 36.6 4.6 2.4 2.2 1.2 10.9 59.22005-2006 6,158 45.0 36.0 5.0 3.0 2.0 1.0 9.0 60.8
1996-1997 2,316 77.5 18.4 1.7 1.2 1.2 9.2 1.2 56.81997-1998 2,159 74.3 19.3 2.7 1.8 1.9 9.2 1.2 58.31998-1999 2,098 64.0 19.5 1.7 1.8 1.5 8.6 2.9 59.31999-2000* 1,960 43.5 17.6 2.8 1.7 1.1 9.9 23.5 60.62000-2001* 2,003 46.5 19.2 2.9 1.8 1.8 11.5 16.2 59.12001-2002* 1,998 42.6 21.8 3.3 1.8 1.9 12.0 16.6 60.72002-2003* 2,144 48.7 20.5 2.7 1.5 1.7 12.3 12.6 58.62003-2004 2,414 46.7 22.8 4.0 1.9 2.2 11.4 11.0 60.82004-2005 2,639 47.8 23.5 3.3 2.0 2.0 11.8 9.5 60.92005-2006 2,595 45.0 36.0 5.0 3.0 2.0 1.0 9.0 64.0
1996-1997 451 72.0 17.4 5.7 2.1 2.8 13.7 0.9 45.01997-1998 497 74.1 17.3 4.0 2.2 2.5 17.7 0.8 42.71998-1999 447 68.0 13.0 2.5 0.9 2.0 12.1 1.6 50.81999-2000* 497 53.9 18.7 1.8 1.8 3.6 10.3 9.9 48.52000-2001 514 53.1 17.7 2.9 1.8 6.8 9.9 7.8 49.22001-2002* 559 55.5 15.9 3.4 1.3 6.1 12.5 5.4 52.82002-2003 489 54.4 17.4 2.5 2.2 5.7 10.4 7.4 50.92003-2004 526 50.8 17.3 2.9 2.9 6.5 12.6 7.6 50.22004-2005 561 48.1 18.2 4.1 1.8 6.2 14.3 7.3 53.82005-2006 537 49.0 19.0 2.0 2.0 6.0 16.0 6.0 49.9
Degrees Awarded
Associate's Degrees and Certificates
Master’s, Post-Master's
Doctoral and Professional
Source: Institutional Degree Files. Master’s degrees include educational specialist awards. Doctoral degrees include awards in the professional fields of law and medicine. Figures previously published for 1998-1999 did not include NM Tech. “NR” represents students who chose not to identify their race/ethnicity. *During Spring 2000 New Mexico State University changed the race/ethnicity selections available to students, permitting “White” as an option separate from “Other.” At that time, students previously designated as “White/Other” were asked to select their most appropriate race/ethnicity category. Most of these students have not yet changed their designation and are thus now reported as “Not Reported” or NR.
The Condition of Higher Education in New Mexico 2005-2006 Page 26 of 69
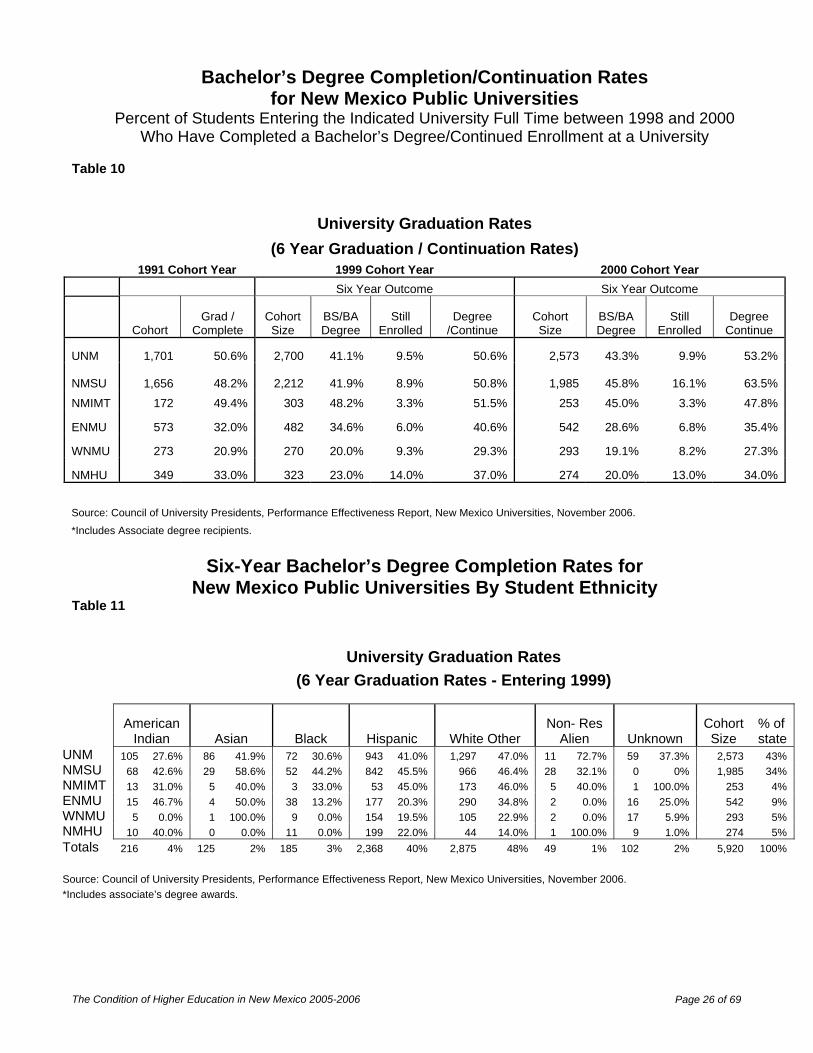
Bachelor’s Degree Completion/Continuation Rates for New Mexico Public Universities
Percent of Students Entering the Indicated University Full Time between 1998 and 2000 Who Have Completed a Bachelor’s Degree/Continued Enrollment at a University
Table 10
Six-Year Bachelor’s Degree Completion Rates for
New Mexico Public Universities By Student Ethnicity Table 11
University Graduation Rates (6 Year Graduation / Continuation Rates)
1991 Cohort Year 1999 Cohort Year 2000 Cohort Year Six Year Outcome Six Year Outcome
Cohort Grad /
Complete Cohort Size
BS/BA Degree
Still Enrolled
Degree /Continue
Cohort Size
BS/BA Degree
Still Enrolled
Degree Continue
UNM 1,701 50.6% 2,700 41.1% 9.5% 50.6% 2,573 43.3% 9.9% 53.2%
NMSU
1,656 48.2% 2,212 41.9% 8.9% 50.8% 1,985 45.8% 16.1% 63.5%NMIMT 172 49.4% 303 48.2% 3.3% 51.5% 253 45.0% 3.3% 47.8%
ENMU 573 32.0% 482 34.6% 6.0% 40.6% 542 28.6% 6.8% 35.4%
WNMU 273 20.9% 270 20.0% 9.3% 29.3% 293 19.1% 8.2% 27.3%
NMHU 349 33.0% 323 23.0% 14.0% 37.0% 274 20.0% 13.0% 34.0%
Source: Council of University Presidents, Performance Effectiveness Report, New Mexico Universities, November 2006. *Includes Associate degree recipients.
University Graduation Rates (6 Year Graduation Rates - Entering 1999)
American
Indian Asian Black Hispanic White Other Non- Res
Alien Unknown Cohort Size
% of state
UNM 105 27.6% 86 41.9% 72 30.6% 943 41.0% 1,297 47.0% 11 72.7% 59 37.3% 2,573 43% NMSU 68 42.6% 29 58.6% 52 44.2% 842 45.5% 966 46.4% 28 32.1% 0 0% 1,985 34% NMIMT 13 31.0% 5 40.0% 3 33.0% 53 45.0% 173 46.0% 5 40.0% 1 100.0% 253 4% ENMU 15 46.7% 4 50.0% 38 13.2% 177 20.3% 290 34.8% 2 0.0% 16 25.0% 542 9% WNMU 5 0.0% 1 100.0% 9 0.0% 154 19.5% 105 22.9% 2 0.0% 17 5.9% 293 5% NMHU 10 40.0% 0 0.0% 11 0.0% 199 22.0% 44 14.0% 1 100.0% 9 1.0% 274 5% Totals 216 4% 125 2% 185 3% 2,368 40% 2,875 48% 49 1% 102 2% 5,920 100% Source: Council of University Presidents, Performance Effectiveness Report, New Mexico Universities, November 2006. *Includes associate’s degree awards.

The Condition of Higher Education in New Mexico 2005-2006 Page 27 of 69
V. Tuition and Fees Annual Tuition and Fees at Public Post-Secondary Institutions, 2005-2006
Institutional Operating Budgets State-Resident Undergraduate Students
Table 12
Tuition Fees Total
% Increase over prior
Year
Tuition as %
of I&G Four-Year Institutions: Research Universities NMIMT $3,440 $531 $3,971 9.0% 8.5% NMSU $3,124 $1,106 $4,230 8.0% 19.2% UNM $3,475 $861 $4,336 5.5% 24.7% Comprehensive Institutions ENMU $2,136 $828 $2,964 6.5% 21.6% NMHU $1,848 $576 $2,424 6.3% 15.5% NNMC $864 $206 $1,070 4.7% 11.0% WNMU $2,256 $809 $3,065 7.1% 13.0% Average Four-Year Institutions $2,449 $702 $3,151 7.0% 16.2% Two-Year Institutions: Branch Community Colleges ENMU-Roswell $944 $107 $1,051 6.3% 12.2% ENMU-Ruidoso $648 $20 $668 3.1% 12.0% NMSU-Alamogordo $1,248 $48 $1,296 10.2% 19.0% NMSU-Carlsbad $1,080 $148 $1,228 13.7% 12.7% NMSU-Dona Ana $984 $144 $1,128 4.4% 18.0% NMSU-Grants $1,152 $48 $1,200 6.4% 14.9% UNM-Gallup $1,248 $96 $1,344 10.2% 17.9% UNM-Los Alamos $1,068 $108 $1,176 9.8% 15.5% UNM-Taos $1,248 $72 $1,320 3.8% 19.6% UNM-Valencia $1,176 $72 $1,248 8.3% 19.9% Average Branch Community Colleges $1,080 $86 $1,166 7.8% 16.2% Independent Community Colleges Central New Mexico $994 $80 $1,074 2.7% 8.1% Clovis Community College $696 $40 $736 3.4% 9.2% Luna Community College $672 $46 $718 11.5% 8.5% Mesalands Community College $888 $234 $1,122 4.3% 10.2% NM Junior College $576 $260 $836 6.1% 5.1% Santa Fe Community College $775 $91 $866 3.1% 16.2% San Juan College $720 $0 $720 20.0% 8.3%Average Independent Community Colleges $760 $107 $867 6.4% 9.4% Special Schools New Mexico Military Institute $2,608 $2,144 $4,752 2.5% 0.3%
Source: New Mexico Higher Education Department: Overview of Institutional Operating Budgets, Fiscal Year 2006-2007, plus institutional data. The far-right column shows the share of each institution’s total unrestricted Instruction-and-General (I&G) revenue that will come from tuition. Expenditures for Instructional and General include instruction, student services, academic and administrative support, and physical plant costs. I&G does not include research, public service, financial aid, auxiliary operations, or athletics. For community colleges, rates shown are for students in arts and science courses, not occupational courses. Note on Community College Tuition Changes: Relatively small increases in actual dollar amounts may produce a significant percentage change due to existing low tuition rates. (See Table 14 for national tuition comparisons.)
The Condition of Higher Education in New Mexico 2005-2006 Page 28 of 69
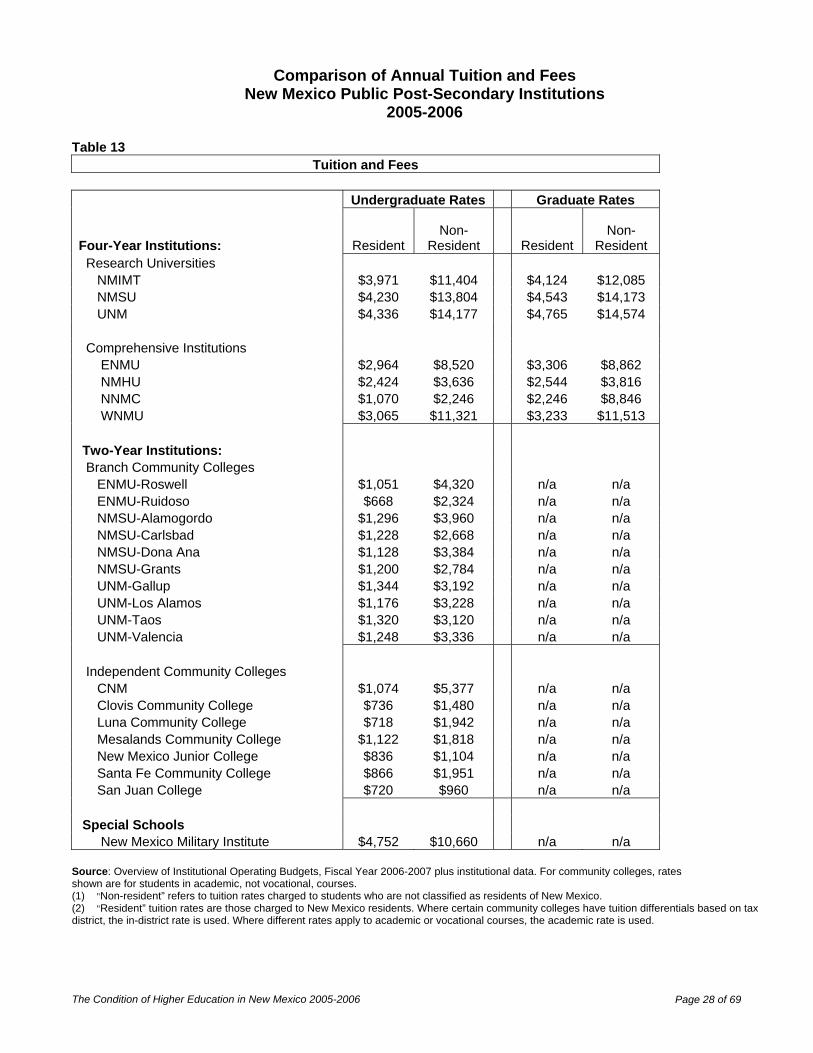
Comparison of Annual Tuition and Fees New Mexico Public Post-Secondary Institutions
2005-2006 Table 13
Tuition and Fees
Undergraduate Rates Graduate Rates
Four-Year Institutions: Resident Non-
Resident Resident Non-
Resident Research Universities NMIMT $3,971 $11,404 $4,124 $12,085 NMSU $4,230 $13,804 $4,543 $14,173 UNM $4,336 $14,177 $4,765 $14,574 Comprehensive Institutions ENMU $2,964 $8,520 $3,306 $8,862 NMHU $2,424 $3,636 $2,544 $3,816 NNMC $1,070 $2,246 $2,246 $8,846 WNMU $3,065 $11,321 $3,233 $11,513 Two-Year Institutions: Branch Community Colleges ENMU-Roswell $1,051 $4,320 n/a n/a ENMU-Ruidoso $668 $2,324 n/a n/a NMSU-Alamogordo $1,296 $3,960 n/a n/a NMSU-Carlsbad $1,228 $2,668 n/a n/a NMSU-Dona Ana $1,128 $3,384 n/a n/a NMSU-Grants $1,200 $2,784 n/a n/a UNM-Gallup $1,344 $3,192 n/a n/a UNM-Los Alamos $1,176 $3,228 n/a n/a UNM-Taos $1,320 $3,120 n/a n/a UNM-Valencia $1,248 $3,336 n/a n/a Independent Community Colleges CNM $1,074 $5,377 n/a n/a Clovis Community College $736 $1,480 n/a n/a Luna Community College $718 $1,942 n/a n/a Mesalands Community College $1,122 $1,818 n/a n/a New Mexico Junior College $836 $1,104 n/a n/a Santa Fe Community College $866 $1,951 n/a n/a San Juan College $720 $960 n/a n/a Special Schools New Mexico Military Institute $4,752 $10,660 n/a n/a
Source: Overview of Institutional Operating Budgets, Fiscal Year 2006-2007 plus institutional data. For community colleges, rates shown are for students in academic, not vocational, courses. (1) "Non-resident” refers to tuition rates charged to students who are not classified as residents of New Mexico. (2) "Resident” tuition rates are those charged to New Mexico residents. Where certain community colleges have tuition differentials based on tax district, the in-district rate is used. Where different rates apply to academic or vocational courses, the academic rate is used.
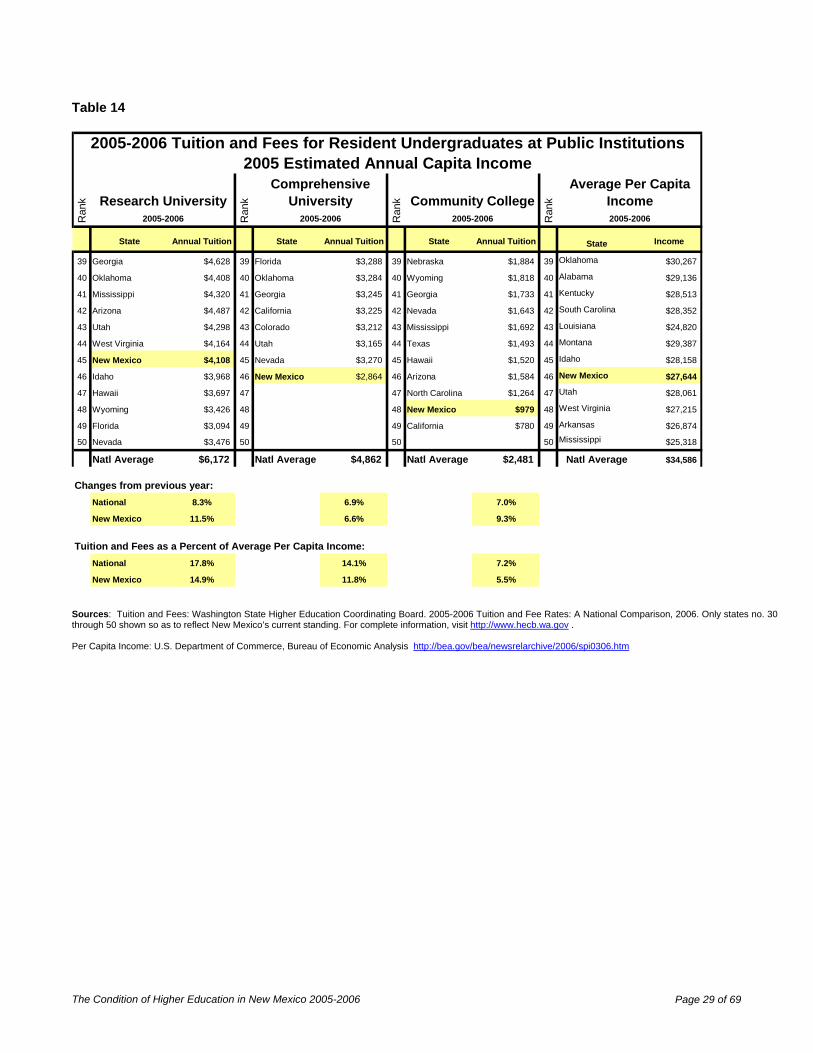
The Condition of Higher Education in New Mexico 2005-2006 Page 29 of 69
Table 14
State Annual Tuition State Annual Tuition State Annual Tuition State Income
39 Georgia $4,628 39 Florida $3,288 39 Nebraska $1,884 39 Oklahoma $30,267
40 Oklahoma $4,408 40 Oklahoma $3,284 40 Wyoming $1,818 40 Alabama $29,136
41 Mississippi $4,320 41 Georgia $3,245 41 Georgia $1,733 41 Kentucky $28,513
42 Arizona $4,487 42 California $3,225 42 Nevada $1,643 42 South Carolina $28,352
43 Utah $4,298 43 Colorado $3,212 43 Mississippi $1,692 43 Louisiana $24,820
44 West Virginia $4,164 44 Utah $3,165 44 Texas $1,493 44 Montana $29,387
45 New Mexico $4,108 45 Nevada $3,270 45 Hawaii $1,520 45 Idaho $28,158
46 Idaho $3,968 46 New Mexico $2,864 46 Arizona $1,584 46 New Mexico $27,644
47 Hawaii $3,697 47 47 North Carolina $1,264 47 Utah $28,061
48 Wyoming $3,426 48 48 New Mexico $979 48 West Virginia $27,215
49 Florida $3,094 49 49 California $780 49 Arkansas $26,874
50 Nevada $3,476 50 50 50 Mississippi $25,318
Natl Average $6,172 Natl Average $4,862 Natl Average $2,481 Natl Average $34,586
National 8.3% 6.9% 7.0%
New Mexico 11.5% 6.6% 9.3%
National 17.8% 14.1% 7.2%
New Mexico 14.9% 11.8% 5.5%
Ran
k
Ran
k
Changes from previous year:
Research University Community CollegeComprehensive
University
Tuition and Fees as a Percent of Average Per Capita Income:
2005-2006 Tuition and Fees for Resident Undergraduates at Public Institutions2005 Estimated Annual Capita Income
2005-2006 2005-2006 2005-2006 2005-2006
Average Per Capita Income
Ran
k
Ran
k
Sources: Tuition and Fees: Washington State Higher Education Coordinating Board. 2005-2006 Tuition and Fee Rates: A National Comparison, 2006. Only states no. 30 through 50 shown so as to reflect New Mexico’s current standing. For complete information, visit http://www.hecb.wa.gov . Per Capita Income: U.S. Department of Commerce, Bureau of Economic Analysis http://bea.gov/bea/newsrelarchive/2006/spi0306.htm
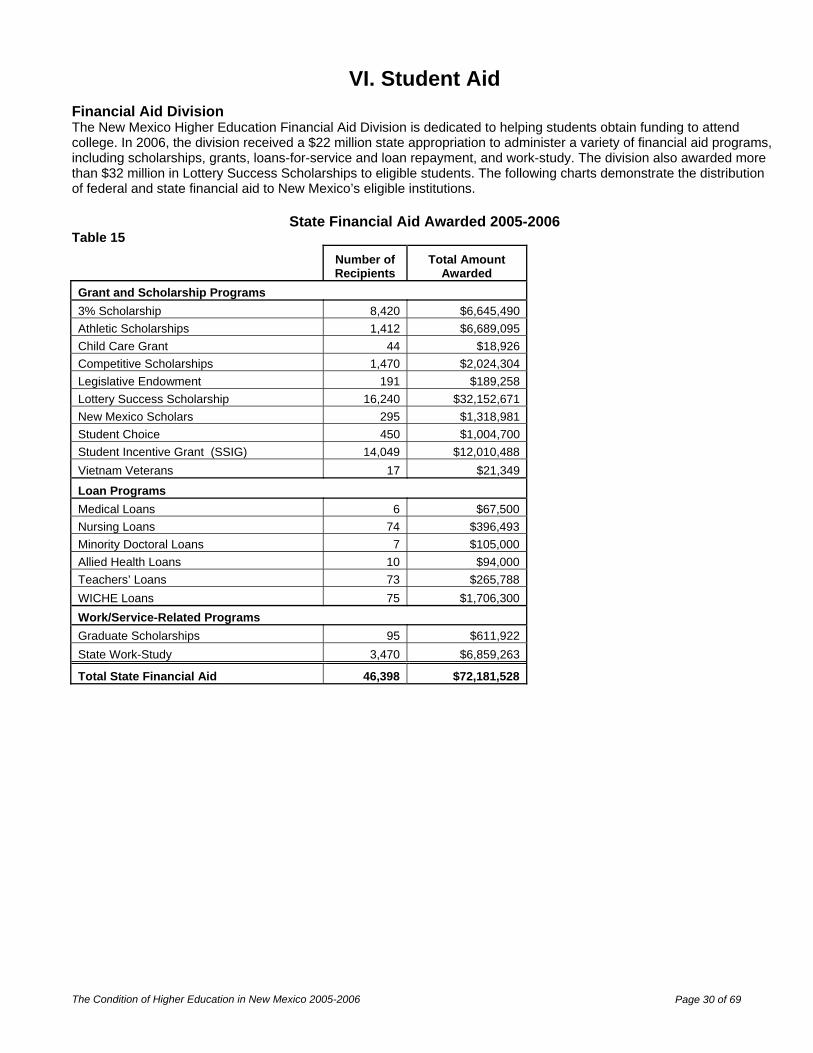
The Condition of Higher Education in New Mexico 2005-2006 Page 30 of 69
VI. Student Aid
Financial Aid Division The New Mexico Higher Education Financial Aid Division is dedicated to helping students obtain funding to attend college. In 2006, the division received a $22 million state appropriation to administer a variety of financial aid programs, including scholarships, grants, loans-for-service and loan repayment, and work-study. The division also awarded more than $32 million in Lottery Success Scholarships to eligible students. The following charts demonstrate the distribution of federal and state financial aid to New Mexico’s eligible institutions.
State Financial Aid Awarded 2005-2006
Table 15
Number of Recipients
Total Amount Awarded
Grant and Scholarship Programs 3% Scholarship 8,420 $6,645,490 Athletic Scholarships 1,412 $6,689,095 Child Care Grant 44 $18,926 Competitive Scholarships 1,470 $2,024,304 Legislative Endowment 191 $189,258 Lottery Success Scholarship 16,240 $32,152,671 New Mexico Scholars 295 $1,318,981 Student Choice 450 $1,004,700 Student Incentive Grant (SSIG) 14,049 $12,010,488 Vietnam Veterans 17 $21,349
Loan Programs Medical Loans 6 $67,500 Nursing Loans 74 $396,493 Minority Doctoral Loans 7 $105,000 Allied Health Loans 10 $94,000 Teachers’ Loans 73 $265,788 WICHE Loans 75 $1,706,300 Work/Service-Related Programs Graduate Scholarships 95 $611,922 State Work-Study 3,470 $6,859,263
Total State Financial Aid 46,398 $72,181,528

The Condition of Higher Education in New Mexico 2005-2006 Page 31 of 69
Federal Financial Aid Awarded 2005-2006
Table 16
Number of Recipients
Total Amount Awarded
Grant and Scholarship Programs Pell Grants 40,185 $95,292,439 Supp. Educational Opportunity Grants (SEOG) 6,873 $5,136,287 Loan Programs Parent Loans for Undergraduates (PLUS) 748 $5,238,971 Perkins Loan 3,577 $8,317,087 Stafford Student Loan (Subsidized) 29,909 $110,558,271Stafford Student Loan (Unsubsidized) 20,469 $85,382,503 Other Federal 2,252 $8,100,523 Work/Service-Related Programs Federal Work-Study 3,638 $6,778,896
Total Federal Financial Aid 5,787 $324,804,977
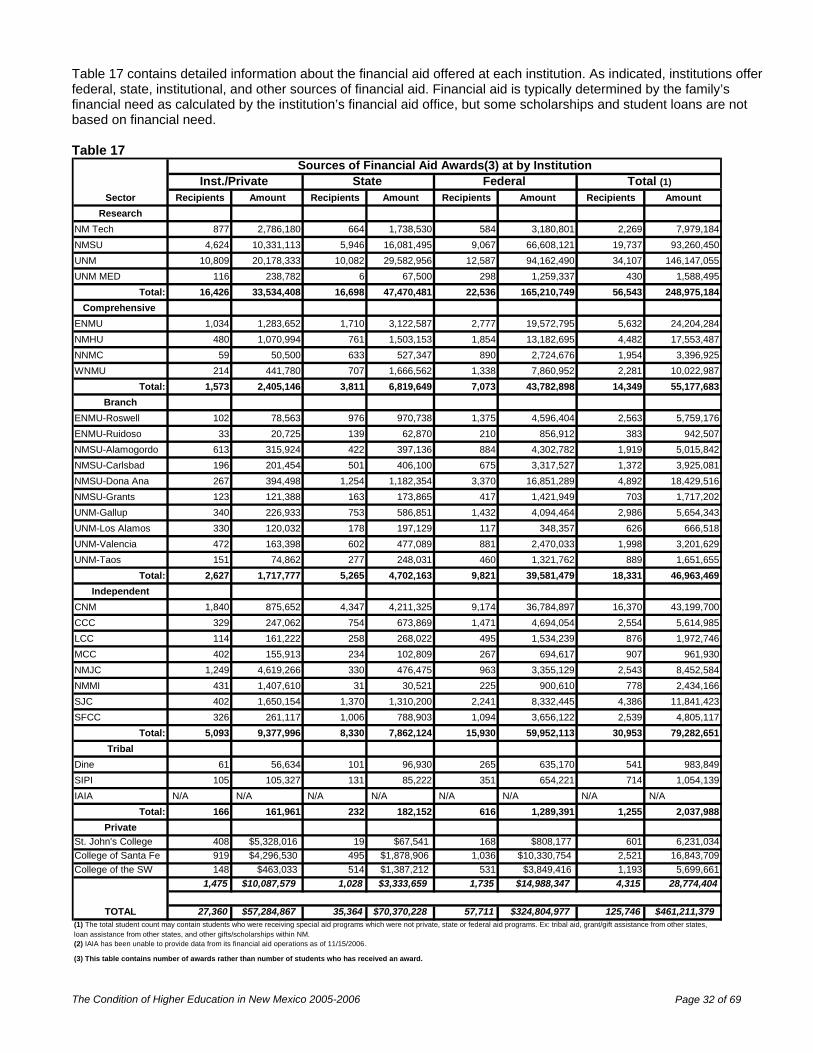
The Condition of Higher Education in New Mexico 2005-2006 Page 32 of 69
Table 17 contains detailed information about the financial aid offered at each institution. As indicated, institutions offer federal, state, institutional, and other sources of financial aid. Financial aid is typically determined by the family’s financial need as calculated by the institution’s financial aid office, but some scholarships and student loans are not based on financial need. Table 17
Sector Recipients Amount Recipients Amount Recipients Amount Recipients AmountResearch
NM Tech 877 2,786,180 664 1,738,530 584 3,180,801 2,269 7,979,184NMSU 4,624 10,331,113 5,946 16,081,495 9,067 66,608,121 19,737 93,260,450UNM 10,809 20,178,333 10,082 29,582,956 12,587 94,162,490 34,107 146,147,055UNM MED 116 238,782 6 67,500 298 1,259,337 430 1,588,495
Total: 16,426 33,534,408 16,698 47,470,481 22,536 165,210,749 56,543 248,975,184Comprehensive
ENMU 1,034 1,283,652 1,710 3,122,587 2,777 19,572,795 5,632 24,204,284NMHU 480 1,070,994 761 1,503,153 1,854 13,182,695 4,482 17,553,487NNMC 59 50,500 633 527,347 890 2,724,676 1,954 3,396,925WNMU 214 441,780 707 1,666,562 1,338 7,860,952 2,281 10,022,987
Total: 1,573 2,405,146 3,811 6,819,649 7,073 43,782,898 14,349 55,177,683Branch
ENMU-Roswell 102 78,563 976 970,738 1,375 4,596,404 2,563 5,759,176ENMU-Ruidoso 33 20,725 139 62,870 210 856,912 383 942,507NMSU-Alamogordo 613 315,924 422 397,136 884 4,302,782 1,919 5,015,842NMSU-Carlsbad 196 201,454 501 406,100 675 3,317,527 1,372 3,925,081NMSU-Dona Ana 267 394,498 1,254 1,182,354 3,370 16,851,289 4,892 18,429,516NMSU-Grants 123 121,388 163 173,865 417 1,421,949 703 1,717,202UNM-Gallup 340 226,933 753 586,851 1,432 4,094,464 2,986 5,654,343UNM-Los Alamos 330 120,032 178 197,129 117 348,357 626 666,518UNM-Valencia 472 163,398 602 477,089 881 2,470,033 1,998 3,201,629UNM-Taos 151 74,862 277 248,031 460 1,321,762 889 1,651,655
Total: 2,627 1,717,777 5,265 4,702,163 9,821 39,581,479 18,331 46,963,469Independent
CNM 1,840 875,652 4,347 4,211,325 9,174 36,784,897 16,370 43,199,700CCC 329 247,062 754 673,869 1,471 4,694,054 2,554 5,614,985LCC 114 161,222 258 268,022 495 1,534,239 876 1,972,746MCC 402 155,913 234 102,809 267 694,617 907 961,930NMJC 1,249 4,619,266 330 476,475 963 3,355,129 2,543 8,452,584NMMI 431 1,407,610 31 30,521 225 900,610 778 2,434,166SJC 402 1,650,154 1,370 1,310,200 2,241 8,332,445 4,386 11,841,423SFCC 326 261,117 1,006 788,903 1,094 3,656,122 2,539 4,805,117
Total: 5,093 9,377,996 8,330 7,862,124 15,930 59,952,113 30,953 79,282,651Tribal
Dine 61 56,634 101 96,930 265 635,170 541 983,849SIPI 105 105,327 131 85,222 351 654,221 714 1,054,139IAIA N/A N/A N/A N/A N/A N/A N/A N/A
Total: 166 161,961 232 182,152 616 1,289,391 1,255 2,037,988Private
St. John's College 408 $5,328,016 19 $67,541 168 $808,177 601 6,231,034College of Santa Fe 919 $4,296,530 495 $1,878,906 1,036 $10,330,754 2,521 16,843,709College of the SW 148 $463,033 514 $1,387,212 531 $3,849,416 1,193 5,699,661
1,475 $10,087,579 1,028 $3,333,659 1,735 $14,988,347 4,315 28,774,404
TOTAL 27,360 $57,284,867 35,364 $70,370,228 57,711 $324,804,977 125,746 $461,211,379
(3) This table contains number of awards rather than number of students who has received an award.
(1) The total student count may contain students who were receiving special aid programs which were not private, state or federal aid programs. Ex: tribal aid, grant/gift assistance from other states, loan assistance from other states, and other gifts/scholarships within NM.(2) IAIA has been unable to provide data from its financial aid operations as of 11/15/2006.
Sources of Financial Aid Awards(3) at by InstitutionInst./Private State Federal Total (1)

The Condition of Higher Education in New Mexico 2005-2006 Page 33 of 69
Lottery Success Scholarship This year New Mexico celebrated its tenth anniversary of the Lottery Success Scholarship. As of 2006, more than 43,000 students from across the state have attended New Mexico public universities and colleges with the help of the Lottery Success Scholarship. According to Department data, every county and school district in the state has students who have received in-state college tuition from the scholarship. The majority of the recipients are between the ages of 18 and 21 and over 60% of the recipients are women.
Lottery Success Scholarship Recipients by Age and Gender, 1998 - 2006 Table 18 Age Gender
County Less
than 18 18-19 20-21 21+ Male Female Total Bernalillo 22 8312 4457 169 5217 7743 12960 Catron 0 37 25 0 26 36 62 Chaves 3 874 619 45 618 923 1541 Cibola 4 310 198 18 206 324 530 Colfax 0 156 96 1 113 140 253 Curry 1 688 444 54 466 721 1187 De Baca 3 50 27 0 29 51 80 Dona Ana 9 2886 1505 115 1774 2741 4515 Eddy 4 807 600 37 538 910 1448 Grant 3 477 273 20 325 448 773 Guadalupe 0 57 44 1 51 51 102 Harding 0 25 26 2 22 31 53 Hidalgo 0 73 44 1 47 71 118 Lea 42 563 466 17 462 626 1088 Lincoln 7 229 169 15 169 251 420 Los Alamos 2 456 298 7 359 404 763 Luna 1 212 153 7 151 222 373 McKinley 2 721 410 29 417 745 1162 Mora 0 79 53 1 59 74 133 No Response 0 100 51 2 103 50 153 Otero 2 896 502 16 581 835 1416 Quay 0 158 108 19 116 169 285 Rio Arriba 4 785 438 29 472 784 1256 Roosevelt 2 376 222 18 246 372 618 San Juan 3 1365 924 48 910 1430 2340 San Miguel 0 490 276 11 311 466 777 Sandoval 4 1354 702 24 791 1293 2084 Santa Fe 9 1755 1046 64 1159 1715 2874 Sierra 1 95 63 3 65 97 162 Socorro 0 168 132 4 115 189 304 Taos 0 403 238 12 245 408 653 Torrance 0 205 111 4 119 201 320 Union 0 56 55 2 41 72 113 Valencia 10 1141 577 60 629 1159 1788 Other 3 222 118 39 146 236 385 Totals 141 26581 15470 894 17098 25988 43089

The Condition of Higher Education in New Mexico 2005-2006 Page 34 of 69
Degrees Awarded to Lottery Success Scholarship Recipients, 1998 - 2006 The table below lists the number of recipients on the Lottery Success Scholarship by county, the total amount awarded, and the number of graduates by highest degree earned. Table 19
County Attended College Total Awards Total Grads Certificate Associates Bachelors Masters Prof’l
Bernalillo 12,958 60,805,566 4,466 134 482 3,944 270 71
Catron 62 279,386 30 2 9 21 0 0
Chaves 1,541 4,418,898 508 60 152 348 20 3
Cibola 530 1,697,444 229 33 81 139 9 4
Colfax 253 1,009,766 97 0 8 89 6 0
Curry 1,187 3,013,543 395 51 139 252 18 3
De Baca 80 270,624 33 3 6 26 2 0
Dona Ana 4,515 18,600,528 1,668 64 274 1,389 108 14
Eddy 1,447 4,514,462 542 39 178 379 38 2
Grant 774 2,942,798 296 5 45 255 27 1
Guadalupe 102 343,107 33 3 4 27 4 0
Harding 53 206,873 25 2 3 20 1 0
Hidalgo 118 529,887 59 2 7 52 1 0
Lea 1,088 1,940,244 384 44 210 168 15 1
Lincoln 420 1,468,411 159 8 51 109 4 0
Los Alamos 764 3,487,914 279 3 39 247 9 4
Luna 373 1,299,302 122 10 25 92 8 0
McKinley 1,163 3,492,881 353 27 127 219 18 3
Mora 133 535,402 50 0 5 45 3 0
No Response 151 649,251 81 2 11 68 2 0
Otero 1,416 5,110,991 571 10 188 420 26 4
Quay 285 881,802 101 7 26 72 1 0
Rio Arriba 1,254 3,979,672 471 49 183 284 24 2
Roosevelt 617 1,873,367 222 21 35 184 9 0
San Juan 2,340 6,194,334 864 65 399 499 38 9
San Miguel 779 2,852,357 299 16 32 259 24 3
Sandoval 2,083 8,690,713 576 36 82 473 22 5
Santa Fe 2,877 10,821,278 932 37 207 731 49 8
Sierra 162 694,031 56 2 8 50 1 0
Socorro 304 1,229,356 113 7 20 89 9 2
Taos 653 2,311,007 202 21 45 151 11 0
Torrance 320 1,289,328 103 9 18 80 6 1
Union 113 419,421 40 1 4 36 2 0
Valencia 1,789 6,183,571 622 40 202 434 28 5
Other 385 975,129 114 16 45 61 5 0
Totals 43,089 165,012,644 15,095 829 3350 11,712 818 145
Notes:
(1) Based on data submitted by institutions.
(2) Student count is cumulative and includes all students that were awarded a Lottery Success Scholarship at anytime.
(3) Graduates and degrees may include duplicates if a student attained more than one degree (i.e., student received an
Associates degree and continued for a Bachelors degree.)
* Refers to NM students who graduated from a Texas or Arizona high school under an agreement with SDE and Arizona.
residents on the Navajo Reservation who qualify for Lottery Success Scholarships

The Condition of Higher Education in New Mexico 2005-2006 Page 35 of 69
Loan-for-Service Programs
The state of New Mexico has identified several professions in high demand, especially in our rural communities. In an attempt to attract teachers, doctors, allied health professionals, nurses, nurse educators, and pharmacists to provide service in the neediest areas, the Department provides loans to help pay for educational costs.
Loan Repayment Programs
The State of New Mexico strives to help professionals with high student loan debt as a means to attract them to work in shortage areas. The Department receives a federal grant from the Department of Health and Human Services to administer the New Mexico Health Professional Loan Repayment Program.
The following chart illustrates the distribution of expenditures for the various Loan-for-Service and Loan Repayment programs offered in New Mexico.
Figure 2 Loan-for-Service Expenditures
*Health Professional Loan Repayment Program
Service Program Expenditures 2006
$110,000.00 $105,086.78
$416,700.00
$67,500.00$28,352.00
$437,520.94
$273,787.50
$- $50,000.00
$100,000.00 $150,000.00 $200,000.00 $250,000.00 $300,000.00 $350,000.00 $400,000.00 $450,000.00
Allied Health
HealthProf *Fed
HealthProf *State
MedicalStudent
NurseEducator
Nursing
Teacher

The Condition of Higher Education in New Mexico 2005-2006 Page 36 of 69
WICHE Loan-for-Service
To address other critical shortages in the state, the New Mexico Higher Education Department helps support students who attend eligible institutions in the western region through the WICHE Loan-for-Service (Professional Student Exchange Program). New Mexico will support students in the following programs:
• Dentistry • Veterinary Medicine • Graduate Library Sciences • Optometry • Osteopathic Medicine
Figure 3 WICHE Expenditures
WICHE Loan-for-Service Expenditures 2006
$921,300.00
$11,000.00 $49,800.00$119,700.00
$604,500.00
$-$100,000.00$200,000.00$300,000.00$400,000.00$500,000.00$600,000.00$700,000.00$800,000.00$900,000.00
$1,000,000.00
Veterinarian Library Osteopathic Optometry Dentistry
Disciplines
$ Sp
ent
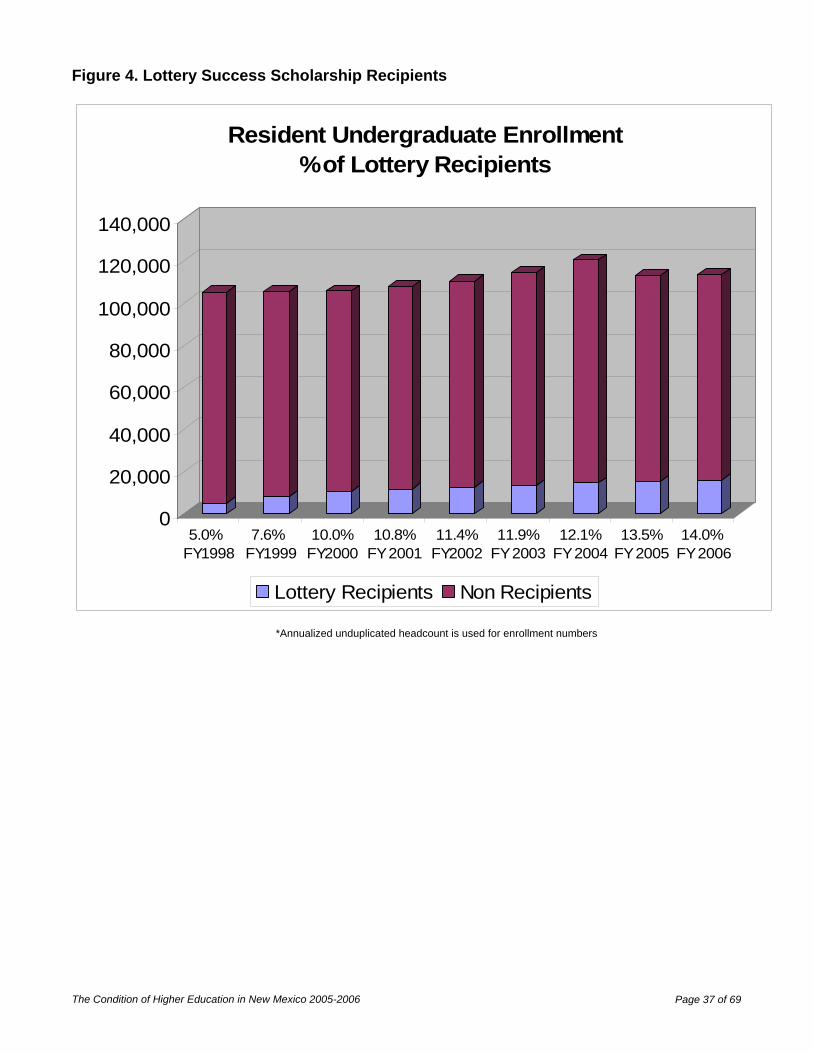
The Condition of Higher Education in New Mexico 2005-2006 Page 37 of 69
Figure 4. Lottery Success Scholarship Recipients
0
20,000
40,000
60,000
80,000
100,000
120,000
140,000
5.0% FY1998
7.6% FY1999
10.0%FY2000
10.8%FY 2001
11.4%FY2002
11.9%FY 2003
12.1%FY 2004
13.5%FY 2005
14.0% FY 2006
Resident Undergraduate Enrollment % of Lottery Recipients
Lottery Recipients Non Recipients
*Annualized unduplicated headcount is used for enrollment numbers

The Condition of Higher Education in New Mexico 2005-2006 Page 38 of 69
VII. Revenue Sources and Budgets
2005-2006 Revenues in Instruction and General Budgets The instructional programs of New Mexico’s public universities and colleges are funded from the following sources in the indicated proportions. In 2005-2006 State General Fund Appropriations were projected to account for 61.6% of the instruction-and-general revenues of the universities and 59.6% of those for two-year campuses.
Figure 5. Revenues for Public Universities
Public Universities Total = $558,811.90
61.6%
7.9%
2.4%
1.9%
26.1%
State GF Tuition Fees Land & Per. Fund Misc
Figure 6. Revenues for Community Colleges
Public Community Colleges Total = $280,957.30
59.6%
1.7%
13.3%
1.9%
23.3%
State GF Tuition Fees Local Tax Levy Misc
Sources of Revenue:
Sources of Revenue:

The Condition of Higher Education in New Mexico 2005-2006 Page 39 of 69
Sources of Revenue for Instruction
Public post-secondary institutions rely upon a number of sources of revenue for their operations. As the following tables illustrate, New Mexico’s colleges and universities continue to rely upon state appropriations for nearly two-thirds of their operations funds for instructional programs. Universities generate most of their remaining revenue from tuition, research contracts, investments, and state-land-and-permanent-fund income. Community colleges generate most of their additional revenue from local property tax levies and tuition.
Revenues for Instruction-and-General Purposes Unrestricted Funds in 2006-2007 Institution Budgets
Table 20 State Local Grants & L&PF/ Appropriation Tuition Fees Tax Levy Contracts Endow. Misc. Total Universities $400,704.7 $155,889.7 $7,983.9 $0 $35,968.0 $16,106.2 $52,933.5 $669,586.0 Branch Colleges $64,127.5 $18,903.9 $1,269.9 $9,499.4 $14,996.0 $0 $1,407.3 $110,203.9 Independent Colleges $111,972.6 $20,758.1 $6,284.9 $63,087.3 $22,516.9 $0 $4,412.7 $229,032.5 Total Community Colleges $176,100.0 $39,662.1 $7,554.8 $72,586.7 $37,512.8 $0 $5,819.9 $339,236.4
All Institutions $576,804.7 $195,551.8 $15,538.8 $72,586.7 $73,480.8 $16,106.2 $58,753.4 $1,008,822.4
Percentages State Local Grants & L&PF/ Appropriation Tuition Fees Tax Levy Contracts Endow. Misc. Total Universities 59.8% 23.3% 1.2% 0.0% 5.4% 2.4% 7.9% 100.0%Branch Colleges 58.2% 17.2% 1.2% 8.6% 13.6% 0.0% 1.3% 100.0%Independent Colleges 48.9% 9.1% 2.7% 27.5% 9.8% 0.0% 1.9% 100.0%Total Community Colleges 51.9% 11.7% 2.2% 21.4% 11.1% 0.0% 1.7% 100.0%All Institutions 57.2% 19.4% 1.5% 7.2% 7.3% 1.6% 5.8% 100.0% Source: New Mexico Higher Education Department, Overview of Institutional Operating Budgets for Fiscal year 2005-06, and individual institutional reports.

The Condition of Higher Education in New Mexico 2005-2006 Page 40 of 69
Table 21
Analysis of Instruction-and-General ExpendituresOperating Budgets, Unrestricted, Fiscal Year 2006-07
(Dollars in Thousands, except $ per FTE)
Fall 2005 Student
FTE
Budget Budget Per FTE
Budget as % of Total
I&G
Budget Budget Per FTE
Budget as % of
Total I&G
Budget Budget Per FTE
Four-Year Institutions:
Research UniversitiesNMIMT 1,504 $14,891.50 $9,901 48.50% $15,803.30 $10,508 51.50% $30,694.80 20,409.00 NMSU 12,652 83,013.90 6,561 55.20% 67,328.70 5,322 44.80% 150,342.60 11,883.00 UNM 20,542 135,331.20 6,588 54.10% 114,762.00 5,587 45.90% 250,093.20 12,175.00 Comprehensive InstitutionsENMU 3,134 17,064.00 5,445 54.10% 14,502.00 4,627 45.90% 31,566.00 10,072.00 NMHU 2,217 16,523.40 7,453 49.20% 17,039.60 7,686 50.80% 33,563.00 15,139.00 NNMC 1,139 5,975.60 5,246 49.70% 6,039.00 5,302 50.30% 12,014.60 10,548.00 WNMU 1,878 12,744.80 6,786 58.50% 9,052.60 4,820 41.50% 21,797.40 11,607.00 Total Four-Year Institutions 43,066 $285,544.40 $6,630 53.90% $244,527.20 $5,678 46.10% $530,071.60 12,308.00
Branch Community CollegesENMU - Roswell 2,390 $10,473.60 $4,382 56.80% $7,972.50 $3,336 43.20% $18,446.10 7,718.00 ENMU - Ruidoso 296 921.6 3,114 42.50% 1,249.10 4,220 57.50% 2,170.70 7,333.00 NMSU - Alamogordo 1,100 3,978.90 3,617 50.90% 3,833.20 3,485 49.10% 7,812.10 7,102.00 NMSU - Carlsbad 817 2,719.70 3,329 48.10% 2,932.90 3,590 51.90% 5,652.60 6,919.00 NMSU - Dona Ana 3,759 14,292.30 3,802 58.60% 10,099.00 2,687 41.40% 24,391.30 6,489.00 NMSU - Grants 415 1,642.50 3,958 44.10% 2,083.50 5,020 55.90% 3,726.00 8,978.00 UNM - Gallup 1,662 7,317.90 4,403 53.70% 6,310.70 3,797 46.30% 13,628.60 8,200.00 UNM - Los Alamos 398 1,758.30 4,418 48.00% 1,903.30 4,782 52.00% 3,661.60 9,200.00 UNM - Taos 577 1,565.70 2,714 38.10% 2,543.60 4,408 61.90% 4,109.30 7,122.00 UNM - Valencia 973 3,188.20 3,277 43.40% 4,163.90 4,279 56.60% 7,352.10 7,556.00 Subtotal Branch Community Colleges 12,387 $47,858.70 $3,864 52.60% $43,091.70 $3,479 47.40% $90,950.40 7,342.00 IndependentCNM 12,482 $48,600.10 $3,894 51.00% $46,747.00 $3,745 49.00% $95,347.10 7,639.00 Clovis CC 1,773 5,980.00 3,373 48.70% 6,300.00 3,553 51.30% 12,280.00 6,926.00 Luna CC 936 4,300.50 4,595 41.60% 6,026.50 6,439 58.40% 10,327.00 11,033.00 Mesalands CC 341 1,514.00 4,440 42.20% 2,077.00 6,091 57.80% 3,591.00 10,531.00 NM Junior College 1,687 7,413.40 4,394 46.00% 8,686.40 5,149 54.00% 16,099.80 9,543.00 San Juan Coll. 4,196 21,130.10 5,036 54.70% 17,465.60 4,162 45.30% 38,595.70 9,198.00 SFCC 2,067 12,215.60 5,910 50.30% 12,080.20 5,844 49.70% 24,295.80 11,754.00 Subtotal Independent Community Colleges 23,482.00 101,153.70$ 4,308.00$ 50.40% $99,382.70 $4,232 49.60% $200,536.40 $8,540Total Two-Year Institutions 35,869 $149,012.40 $4,154 51.10% $142,474.40 $3,972 48.90% 291,486.80$ 8,126.00$
GRAND TOTAL 78,935 $434,556.80 $5,505 52.90% $387,001.60 $4,903 47.10% $821,558.40 $10,408
INSTRUCTION GENERAL TOTAL I & G
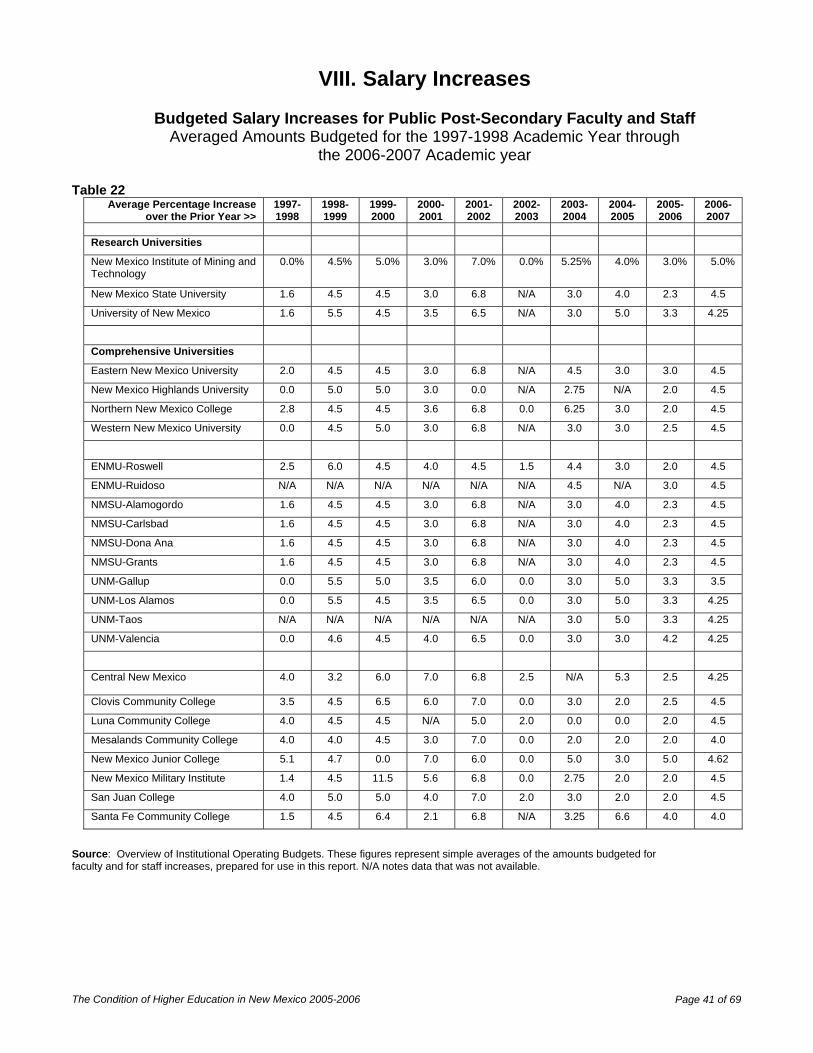
The Condition of Higher Education in New Mexico 2005-2006 Page 41 of 69
VIII. Salary Increases
Budgeted Salary Increases for Public Post-Secondary Faculty and Staff Averaged Amounts Budgeted for the 1997-1998 Academic Year through
the 2006-2007 Academic year Table 22
Average Percentage Increase over the Prior Year >>
1997- 1998
1998- 1999
1999- 2000
2000- 2001
2001- 2002
2002- 2003
2003-2004
2004-2005
2005-2006
2006-2007
Research Universities
New Mexico Institute of Mining and Technology
0.0% 4.5% 5.0% 3.0% 7.0% 0.0% 5.25% 4.0% 3.0% 5.0%
New Mexico State University 1.6 4.5 4.5 3.0 6.8 N/A 3.0 4.0 2.3 4.5
University of New Mexico 1.6 5.5 4.5 3.5 6.5 N/A 3.0 5.0 3.3 4.25
Comprehensive Universities
Eastern New Mexico University 2.0 4.5 4.5 3.0 6.8 N/A 4.5 3.0 3.0 4.5
New Mexico Highlands University 0.0 5.0 5.0 3.0 0.0 N/A 2.75 N/A 2.0 4.5
Northern New Mexico College 2.8 4.5 4.5 3.6 6.8 0.0 6.25 3.0 2.0 4.5
Western New Mexico University 0.0 4.5 5.0 3.0 6.8 N/A 3.0 3.0 2.5 4.5
ENMU-Roswell 2.5 6.0 4.5 4.0 4.5 1.5 4.4 3.0 2.0 4.5
ENMU-Ruidoso N/A N/A N/A N/A N/A N/A 4.5 N/A 3.0 4.5
NMSU-Alamogordo 1.6 4.5 4.5 3.0 6.8 N/A 3.0 4.0 2.3 4.5
NMSU-Carlsbad 1.6 4.5 4.5 3.0 6.8 N/A 3.0 4.0 2.3 4.5
NMSU-Dona Ana 1.6 4.5 4.5 3.0 6.8 N/A 3.0 4.0 2.3 4.5
NMSU-Grants 1.6 4.5 4.5 3.0 6.8 N/A 3.0 4.0 2.3 4.5
UNM-Gallup 0.0 5.5 5.0 3.5 6.0 0.0 3.0 5.0 3.3 3.5
UNM-Los Alamos 0.0 5.5 4.5 3.5 6.5 0.0 3.0 5.0 3.3 4.25
UNM-Taos N/A N/A N/A N/A N/A N/A 3.0 5.0 3.3 4.25
UNM-Valencia 0.0 4.6 4.5 4.0 6.5 0.0 3.0 3.0 4.2 4.25
Central New Mexico 4.0 3.2 6.0 7.0 6.8 2.5 N/A 5.3 2.5 4.25
Clovis Community College 3.5 4.5 6.5 6.0 7.0 0.0 3.0 2.0 2.5 4.5
Luna Community College 4.0 4.5 4.5 N/A 5.0 2.0 0.0 0.0 2.0 4.5
Mesalands Community College 4.0 4.0 4.5 3.0 7.0 0.0 2.0 2.0 2.0 4.0
New Mexico Junior College 5.1 4.7 0.0 7.0 6.0 0.0 5.0 3.0 5.0 4.62
New Mexico Military Institute 1.4 4.5 11.5 5.6 6.8 0.0 2.75 2.0 2.0 4.5
San Juan College 4.0 5.0 5.0 4.0 7.0 2.0 3.0 2.0 2.0 4.5
Santa Fe Community College 1.5 4.5 6.4 2.1 6.8 N/A 3.25 6.6 4.0 4.0
Source: Overview of Institutional Operating Budgets. These figures represent simple averages of the amounts budgeted for faculty and for staff increases, prepared for use in this report. N/A notes data that was not available.
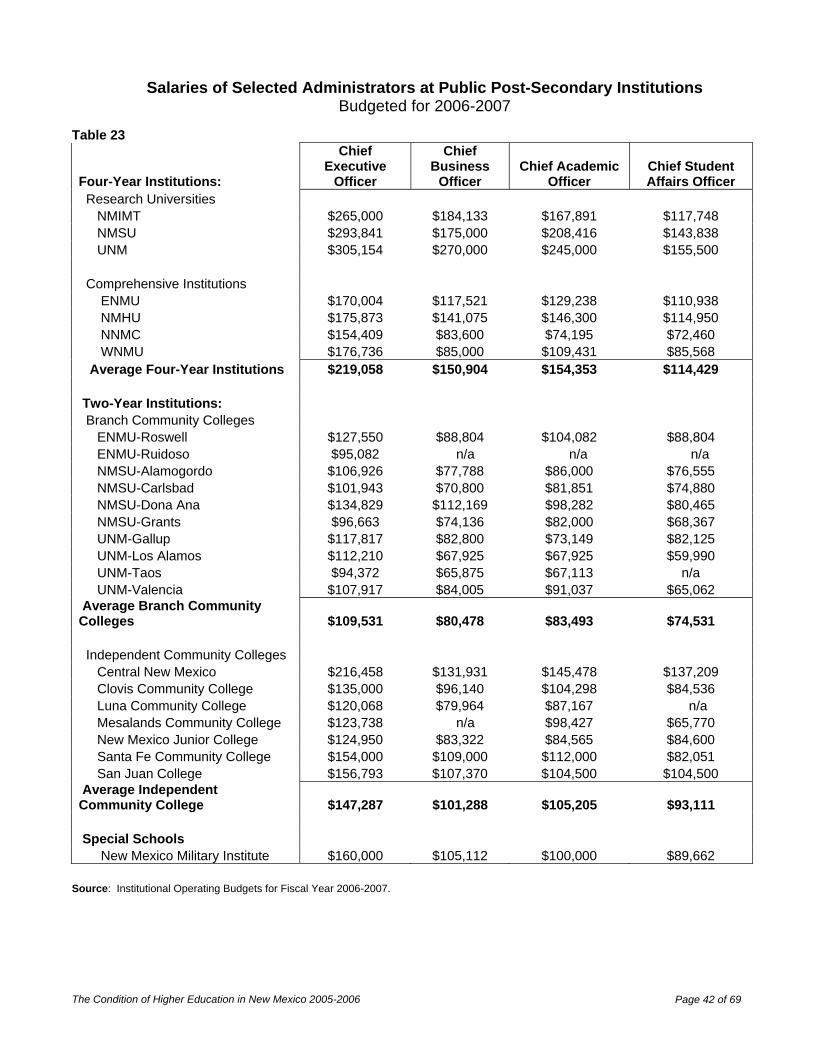
The Condition of Higher Education in New Mexico 2005-2006 Page 42 of 69
Salaries of Selected Administrators at Public Post-Secondary Institutions
Budgeted for 2006-2007 Table 23
Four-Year Institutions:
Chief Executive
Officer
Chief Business
Officer Chief Academic
Officer Chief Student Affairs Officer
Research Universities NMIMT $265,000 $184,133 $167,891 $117,748 NMSU $293,841 $175,000 $208,416 $143,838 UNM $305,154 $270,000 $245,000 $155,500 Comprehensive Institutions ENMU $170,004 $117,521 $129,238 $110,938 NMHU $175,873 $141,075 $146,300 $114,950 NNMC $154,409 $83,600 $74,195 $72,460 WNMU $176,736 $85,000 $109,431 $85,568 Average Four-Year Institutions $219,058 $150,904 $154,353 $114,429 Two-Year Institutions: Branch Community Colleges ENMU-Roswell $127,550 $88,804 $104,082 $88,804 ENMU-Ruidoso $95,082 n/a n/a n/a NMSU-Alamogordo $106,926 $77,788 $86,000 $76,555 NMSU-Carlsbad $101,943 $70,800 $81,851 $74,880 NMSU-Dona Ana $134,829 $112,169 $98,282 $80,465 NMSU-Grants $96,663 $74,136 $82,000 $68,367 UNM-Gallup $117,817 $82,800 $73,149 $82,125 UNM-Los Alamos $112,210 $67,925 $67,925 $59,990 UNM-Taos $94,372 $65,875 $67,113 n/a UNM-Valencia $107,917 $84,005 $91,037 $65,062 Average Branch Community Colleges $109,531 $80,478 $83,493 $74,531 Independent Community Colleges Central New Mexico $216,458 $131,931 $145,478 $137,209 Clovis Community College $135,000 $96,140 $104,298 $84,536 Luna Community College $120,068 $79,964 $87,167 n/a Mesalands Community College $123,738 n/a $98,427 $65,770 New Mexico Junior College $124,950 $83,322 $84,565 $84,600 Santa Fe Community College $154,000 $109,000 $112,000 $82,051 San Juan College $156,793 $107,370 $104,500 $104,500 Average Independent Community College $147,287 $101,288 $105,205 $93,111 Special Schools New Mexico Military Institute $160,000 $105,112 $100,000 $89,662
Source: Institutional Operating Budgets for Fiscal Year 2006-2007.

The Condition of Higher Education in New Mexico 2005-2006 Page 43 of 69
2005-2006 Faculty Salaries with Benefits at Public Post-Secondary Institutions Table 24 Research Professor Associate Assistant Instructor LecturerNew Mexico Tech $98,015 $77,634 $70,461 $43,121 $49,772 New Mexico State University $89,741 $76,235 $64,064 $45,722 $0 University of New Mexico $108,859 $78,810 $70,235 $66,684 $58,502
Comprehensive Professor Associate Assistant Instructor Lecturer No RankEastern New Mexico University $75,492 $61,917 $56,680 $46,410 $0 $0 New Mexico Highlands University $69,005 $63,529 $59,131 $0 $0 $54,676 Northern New Mexico College* $0 $0 $0 $0 $0 $51,126Western New Mexico University $65,766 $55,935 $59,390 $46,998 $0 $0
Table 25 Institution Faculty Average
UNM T 8 $63,905
NMMI 79 $61,836
SFCC 58 $61,665
UNM G 66 $57,816
SJC 96 $56,849
NMSU C 25 $56,464
CCC 50 $55,348
UNM V 24 $55,321
CNM 330 $55,286
NMJC 70 $54,778
NMSU G 15 $53,814
ENMU RUI 3 $52,848
ENMU R 66 $52,601
NMSU DA 93 $51,711
UNM LA 1 $47,725
NMSU A 52 $47,118
MCC 12 $46,814
LCC 34 $44,674 Source: Integrated Postsecondary Education Data System. *Northern New Mexico College does not distinguish academic ranks. For comparison purposes the figure above can be compared to those of instructors at other comprehensive institutions

The Condition of Higher Education in New Mexico 2005-2006 Page 44 of 69
IX. Appropriations
General Fund Appropriations for Higher Education in New Mexico Compared to Total General Fund Appropriations for All State Services
Table 26
Millions of Dollars Appropriated
Academic (Fiscal) Year
Total General Fund Appropriations
Higher Education Appropriations
Higher Education as a Percent of Total General
Fund 1977-1978 $601.76 $108.50 18.0% 1978-1979 670.75 126.00 18.8 1979-1980 780.30 139.21 17.8
1980-1981 882.18 161.08 18.3 1981-1982 1,061.92 185.14 17.4 1982-1983 1,181.69 202.45 17.1 1983-1984 1,243.86 211.37 17.0 1984-1985 1,330.20 240.60 18.1
1985-1986 1,384.02 243.57 17.6 1986-1987 1,444.07 245.38 17.0 1987-1988 1,495.10 257.89 17.2 1988-1989 1,600.22 271.81 17.0 1989-1990 1,740.84 298.25 17.1
1990-1991 1,925.86 334.44 17.4 1991-1992 2,063.40 348.33 16.8 1992-1993 2,162.40 363.90 16.8 1993-1994 2,368.80 392.10 16.6 1994-1995 2,623.40 436.27 16.6
1995-1996 2,769.90 464.74 16.8 1996-1997 2,862.26 486.99 17.0 1997-1998 2,996.88 484.68 16.2 1998-1999 3,143.31 514.58 16.4 1999-2000 3,327.51 540.93 16.3
2000-2001 3,486.15 565.23 16.2 2001-2002 3,844.00 611.07 15.9 2002-2003* 3,874.00 604.89 15.6 2003-2004* 4,017.47 653.81 16.3 2004-2005* 4,380.60 671.90 15.3
2005-2006* 4,708.60 705.00 15.0 2006-2007* 5,084.06 761.96 14.9
Higher Education appropriations include funds appropriated for instruction-and-general, financial aid, and a range of individual appropriations for research and public service projects. *Only includes recurring general fund appropriations.

The Condition of Higher Education in New Mexico 2005-2006 Page 45 of 69
History of New Mexico Capital Outlay Appropriations, 2002-2006 Table 27 Research Universities 2002 2003 2004 2005 2006NM Tech $8,085,322.00 $25,000.00 $4,490,000.00 $940,000.00 $8,980,000.00 NM State University $9,562,500.00 $726,000.00 $17,703,000.00 $9,397,855.00 $22,523,500.00 UNM $18,933,750.00 $2,824,200.00 $23,558,149.00 $10,262,400.00 $36,910,200.00
ENMU $5,938,750.00 $208,000.00 $8,098,000.00 $1,710,000.00 $6,650,000.00 NM Highlands University $7,200,000.00 $2,295,000.00 $6,845,000.00 $3,046,000.00 $11,960,000.00 Northern NM College $1,875,000.00 $20,000.00 $860,000.00 -0- $3,740,000.00 Western NM University $4,600,000.00 $70,000.00 $2,124,028.00 $1,966,048.00 $7,825,000.00 University Subtotals: $56,195,322.00 $6,168,200.00 $80,554,149.00 $27,322,303.00 $98,443,700.00
ENMU-Roswell $250,000.00 $80,000.00 $3,250,000.00 $345,811.00 $6,840,000.00 ENMU-Ruidoso -0- -0- $865,000.00 -0- $2,800,000.00 NMSU-Alamogordo $727,000.00 -0- $280,000.00 $2,500,000.00 $2,075,000.00 NMSU-Carlsbad $1,220,000.00 -0- $80,000.00 $220,000.00 $1,715,000.00 NMSU-Dona Ana $4,995,000.00 -0- $3,775,000.00 $375,000.00 $3,875,000.00 NMSU-Grants $500,000.00 -0- $175,000.00 $250,000.00 $1,085,000.00 UNM-Gallup $750,000.00 $120,000.00 $1,260,000.00 $45,000.00 $2,445,000.00 UNM-Los Alamos -0- -0- $435,000.00 -0- $600,000.00 UNM-Taos $2,300,000.00 -0- $1,500,000.00 -0- $1,720,000.00 UNM-Valencia $1,200,000.00 -0- $550,000.00 -0- $1,000,000.00
CNM $4,711,000.00 $551,400.00 $7,440,000.00 $375,000.00 $11,300,000.00 CCC $300,000.00 -0- $750,000.00 -0- $3,000,000.00 LCC $1,630,000.00 $45,000.00 $1,315,000.00 $1,250,000.00 $2,320,000.00 MCC $800,000.00 -0- $688,000.00 $25,000.00 $1,500,000.00 NM JC $5,989,385.00 -0- $4,895,500.00 $100,000.00 $1,935,000.00 SJC $5,872,500.00 $877,500.00 $3,510,000.00 $1,262,143.00 $4,000,000.00 SFCC $950,000.00 -0- $465,000.00 $205,000.00 $3,425,000.00 Community Colleges Subtotals: $32,194,885.00 $1,673,900.00 $31,233,500.00 $6,952,954.00 $51,635,000.00
NMMilitary Institute $3,213,000.00 $101,500.00 $1,750,000.00 -0- $4,369,000.00 NM School for the Deaf -0- -0- $6,190,000.00 -0- $7,100,000.00 NM School for the Blind and Visually Impaired
-0- -0- $240,000.00 $189,000.00 $3,100,000.00
Special Schools Subtotals: $3,213,000.00 $101,500.00 $8,180,000.00 $189,000.00 $14,569,000.00 Statewide Totals: $91,603,207.00 $7,943,600.00 $119,967,649.00 $34,464,257.00 $164,647,700.00
Constitutional Special Schools
Comprehensive Institutions
Branch Community Colleges
Independent Community Colleges
This table does not include reauthorizations. The data excludes the following: statewide general obligation bond issues for Americans with Disabilities Act projects, information technologies, and equipment renewal and replacement.
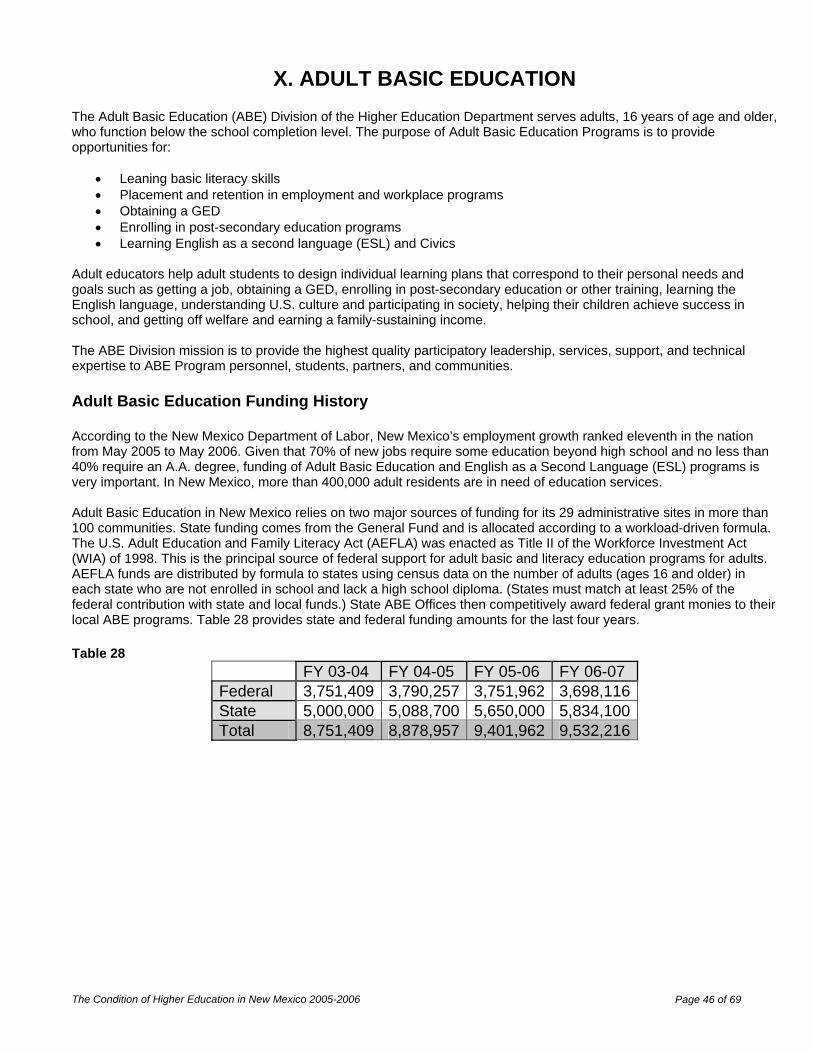
The Condition of Higher Education in New Mexico 2005-2006 Page 46 of 69
X. ADULT BASIC EDUCATION
The Adult Basic Education (ABE) Division of the Higher Education Department serves adults, 16 years of age and older, who function below the school completion level. The purpose of Adult Basic Education Programs is to provide opportunities for:
• Leaning basic literacy skills • Placement and retention in employment and workplace programs • Obtaining a GED • Enrolling in post-secondary education programs • Learning English as a second language (ESL) and Civics
Adult educators help adult students to design individual learning plans that correspond to their personal needs and goals such as getting a job, obtaining a GED, enrolling in post-secondary education or other training, learning the English language, understanding U.S. culture and participating in society, helping their children achieve success in school, and getting off welfare and earning a family-sustaining income. The ABE Division mission is to provide the highest quality participatory leadership, services, support, and technical expertise to ABE Program personnel, students, partners, and communities. Adult Basic Education Funding History According to the New Mexico Department of Labor, New Mexico’s employment growth ranked eleventh in the nation from May 2005 to May 2006. Given that 70% of new jobs require some education beyond high school and no less than 40% require an A.A. degree, funding of Adult Basic Education and English as a Second Language (ESL) programs is very important. In New Mexico, more than 400,000 adult residents are in need of education services. Adult Basic Education in New Mexico relies on two major sources of funding for its 29 administrative sites in more than 100 communities. State funding comes from the General Fund and is allocated according to a workload-driven formula. The U.S. Adult Education and Family Literacy Act (AEFLA) was enacted as Title II of the Workforce Investment Act (WIA) of 1998. This is the principal source of federal support for adult basic and literacy education programs for adults. AEFLA funds are distributed by formula to states using census data on the number of adults (ages 16 and older) in each state who are not enrolled in school and lack a high school diploma. (States must match at least 25% of the federal contribution with state and local funds.) State ABE Offices then competitively award federal grant monies to their local ABE programs. Table 28 provides state and federal funding amounts for the last four years. Table 28
FY 03-04 FY 04-05 FY 05-06 FY 06-07 Federal 3,751,409 3,790,257 3,751,962 3,698,116 State 5,000,000 5,088,700 5,650,000 5,834,100 Total 8,751,409 8,878,957 9,401,962 9,532,216

The Condition of Higher Education in New Mexico 2005-2006 Page 47 of 69
ABE contact hour participation increases proportionately with increases in resources (05-06 contact hours are preliminary). The following graph confirms this trend. Figure 7. ABE Contract Hours
$2,000,000
$4,000,000
$6,000,000
$8,000,000
$10,000,000
2003
-2004
2004
-2005
2005
-2006
2006
-2007St
ate
and
Fede
ral D
olla
rs
1,000,000
2,000,000
3,000,000
Con
tact
Hou
rs
State and Federal ABE Dollars Contact Hours
This trend is an important success to highlight for New Mexico ABE since there is a significant difference in average annual per-pupil expenditures between ABE and K-12 Public Schools.
• K-12 = $6,035 (2004-2005) • ABE = $343 (2004-2005)
(Source: New Mexico Public Education Department Budget Report for 2004-2005 actual expenditures. This number excludes federal programs, capital outlay, and department services. New Mexico Higher Education Department, ABE Division 2004-2005 Annual Report. The ABE figure includes federal funding.) Adults 20 and older make up 71% of the New Mexico total population (2005, Bureau of Business and Economic Research statistics, UNM). Since 30+% of New Mexico adults do not have a high school diploma or speak English well, addressing the basic education needs of this population is a top priority for the Higher Education Department. Using a cost-benefit analysis to illustrate “return on investment” shows that adult education pays off:
+ income tax dollars from receiving a HS diploma
+ new income tax dollars from students gaining jobs
+ dollar savings from students being removed from public assistance
= ABE Return on Investment ABE

The Condition of Higher Education in New Mexico 2005-2006 Page 48 of 69
Adult Basic Education Enrollment History
Table 29
Agency 2002-
03 2003-
04 2004-
05 Preliminary
2005-06 4-year mean
Alamo Navajo School Board Inc. 260 40 85 97 120.5 CNM CC 3,697 3,519 3,331 3,163 3,428 Catholic Charities 570 704 846 798 729.5 Clovis Community College 702 542 558 429 557.75 Crownpoint Inst. of Tech. 108 121 194 127 137.5 Dine College 171 179 177 157 171 ENMU-Roswell 995 1,677 1,616 1,469 1,439 ENMU-Ruidoso 185 216 246 255 225.5 The Gathering Place 182 182 190 256 202.5 Luna Community College 408 339 375 313 358.75 Mesalands Community College 152 148 158 155 153.25 NM Correctional 1,604 2,304 3,403 2,842 2,538 NMJC 658 737 730 553 669.5 NMSU-Alamogordo 515 534 530 442 505.25 NMSU-Carlsbad 514 504 577 458 513.25 NMSU-Dona Ana 3,455 3,387 3,486 3,233 3,390 NMSU-Grants 123 192 176 210 175.25 NNMC 302 290 312 330 308.5 Sage Lifelong Learning 205 207 324 368 276 San Juan Community College 878 1,067 986 872 950.75 SFCC 2,238 2,318 2,072 1,972 2,150 Ser De 67 86 160 200 128.25 Socorro 566 505 461 41 393.25 SIPI 230 254 168 245 224.25 UNM-Gallup 672 785 832 807 774 UNM-Los Alamos 270 320 276 258 281 UNM-Taos 164 123 192 159 159.5 UNM-Valencia 901 927 937 786 887.75 WNMU 670 620 734 477 625.25 Total 21,462 22,827 24,132 21,472 22,473
Adult Basic education students are considered enrolled after clocking 12 hours of instructional time. The Adult Student Waiting List Survey results from spring 2006 revealed that 13 of the 21 surveyed programs have students on a waiting list according to the National Adult Education Professional Development Consortium (NAEPDC). Five of these programs have 100-500 students on the list. Of those programs with waiting lists, seven maintain a wait of up to four months and the other six programs maintain a wait as long as eight months.
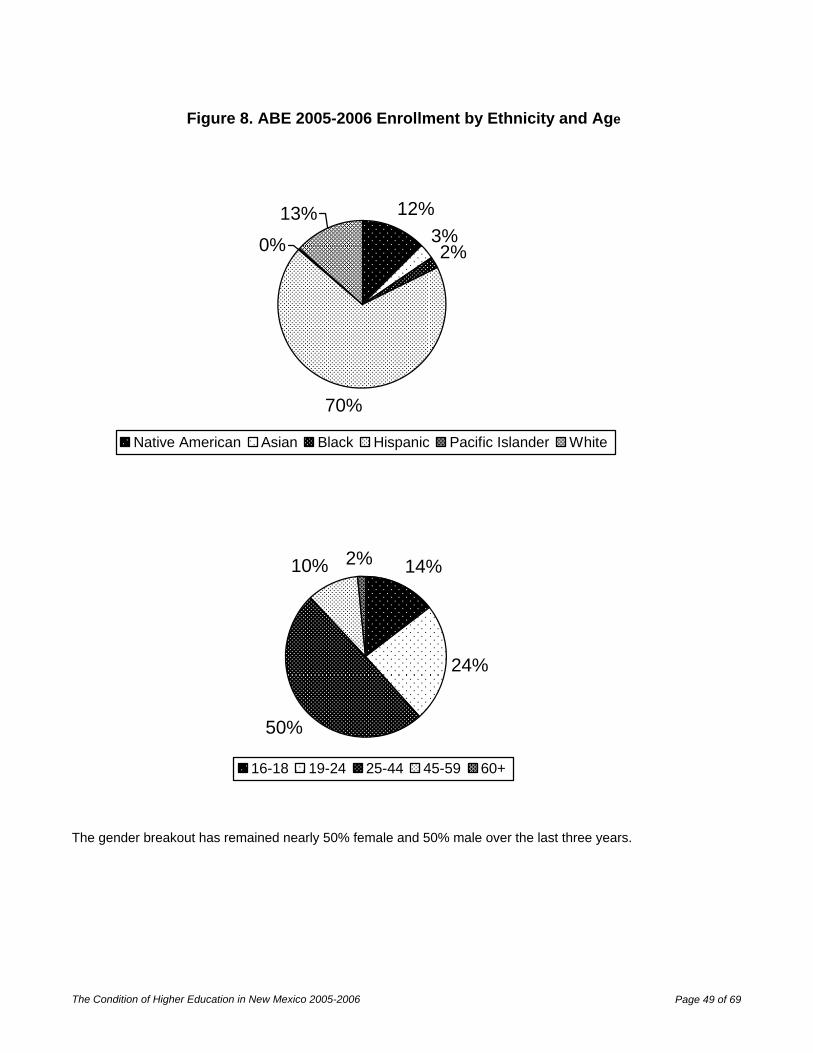
The Condition of Higher Education in New Mexico 2005-2006 Page 49 of 69
Figure 8. ABE 2005-2006 Enrollment by Ethnicity and Age
12%3%2%
70%
0%
13%
Native American Asian Black Hispanic Pacific Islander White
14%
24%
50%
10% 2%
16-18 19-24 25-44 45-59 60+
The gender breakout has remained nearly 50% female and 50% male over the last three years.

The Condition of Higher Education in New Mexico 2005-2006 Page 50 of 69
2005-2006 Adult Basic Education Student Outcomes Adult Basic Education students set goals upon entry into the program according to their desired outcome, their placement level, and the perceived ability to accomplish the goal(s) within the fiscal year. Four core goals are tracked according to federal policy:
• Entered Employment • Retained Employment • Obtained a GED • Entered Post-secondary Education or Training
Additional secondary goals are tracked such as learning the English language, registering to vote, and helping their children with homework, among others. The default goal for every student is completing an educational functioning level and moving through the 12 levels consisting of Adult Basic Education, Adult Secondary Education (ASE) and English as a Second Language (ESL). Figure 9. ABE Enrollment by Educational Level
Percent of Total Enrollment by Educational Level
0%
5%
10%
15%
20%
ABE Beg. Lit.
ABE Beg.
ABE Low In
ter.
ABE High In
ter.
ASE Low
ASE High
ESL Beg. Lit.
ESL Beg.
ESL Low In
ter.
ESL High
Inter
.
ESL Low Adv
.
ESL High
Adv
.
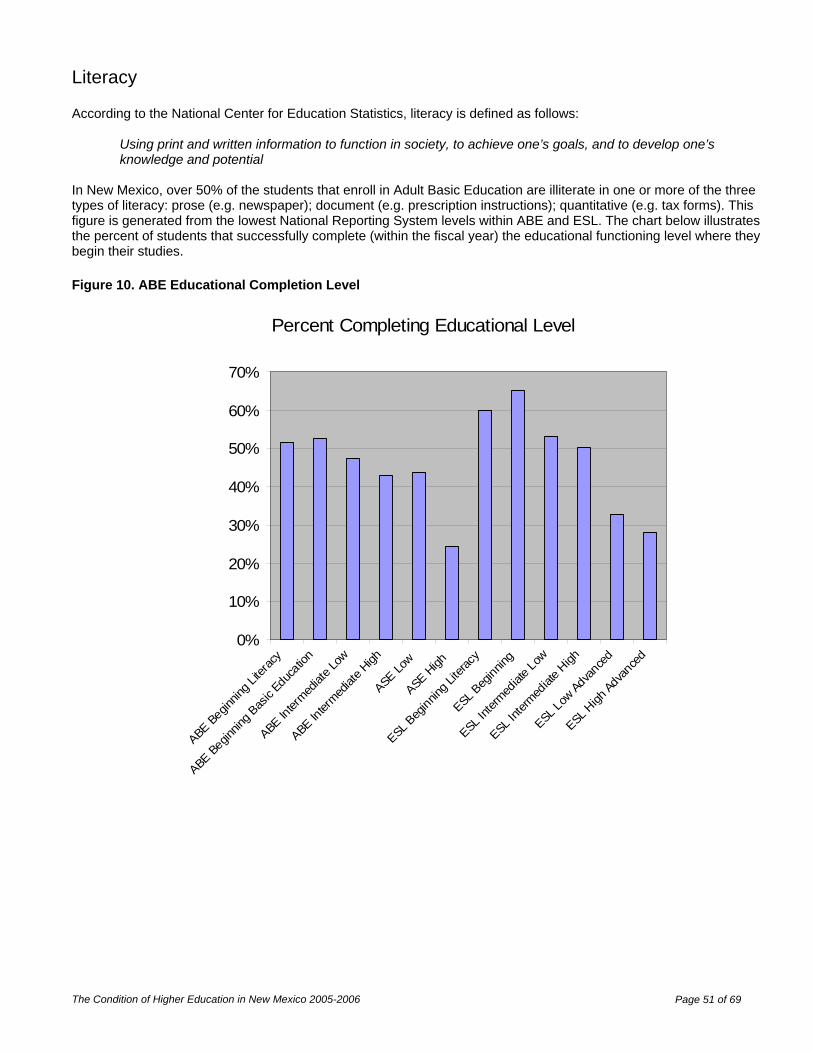
The Condition of Higher Education in New Mexico 2005-2006 Page 51 of 69
Literacy According to the National Center for Education Statistics, literacy is defined as follows:
Using print and written information to function in society, to achieve one’s goals, and to develop one’s knowledge and potential
In New Mexico, over 50% of the students that enroll in Adult Basic Education are illiterate in one or more of the three types of literacy: prose (e.g. newspaper); document (e.g. prescription instructions); quantitative (e.g. tax forms). This figure is generated from the lowest National Reporting System levels within ABE and ESL. The chart below illustrates the percent of students that successfully complete (within the fiscal year) the educational functioning level where they begin their studies. Figure 10. ABE Educational Completion Level
Percent Completing Educational Level
0%
10%
20%
30%
40%
50%
60%
70%
ABE Be
ginnin
g Lite
racy
ABE Be
ginnin
g Bas
ic Ed
ucati
on
ABE In
termed
iate L
ow
ABE In
termed
iate H
igh
ASE Lo
w
ASE H
igh
ESL Beg
inning
Liter
acy
ESL Beg
inning
ESL In
termed
iate L
ow
ESL In
termed
iate H
igh
ESL Lo
w Adva
nced
ESL H
igh Ad
vanc
ed

The Condition of Higher Education in New Mexico 2005-2006 Page 52 of 69
Core Outcomes for Federal Measures Every year, the four federal core outcomes are tracked to measure the percent of students that successfully complete their set goals for the year. The chart below illustrates the success rates for these core outcomes for the last two fiscal years. Figure 11. ABE Performance Measures
Outcome Performance Measures
0%
10%
20%
30%
40%
50%
60%
70%
80%En
tere
dEm
ploy
men
t
Ret
aini
ndEm
ploy
men
t
Obt
aine
d a
GED
Plac
ed in
Post
-S
econ
dary
FY 04-05FY 05-06
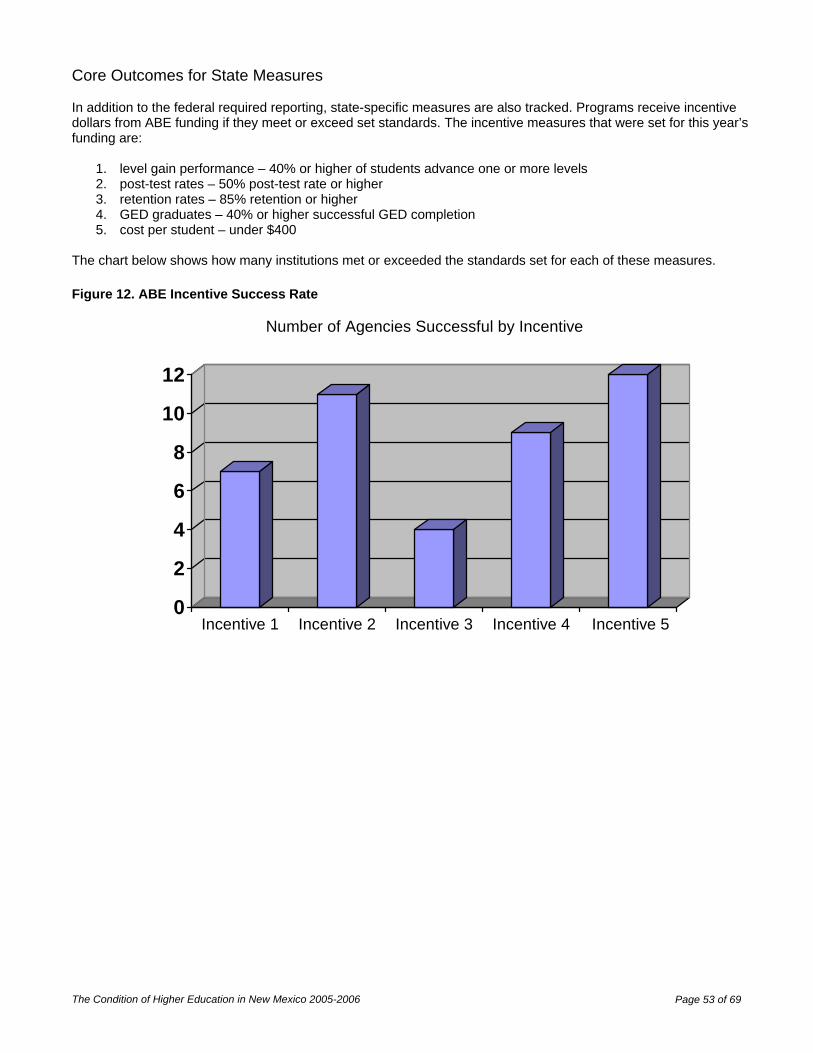
The Condition of Higher Education in New Mexico 2005-2006 Page 53 of 69
Core Outcomes for State Measures In addition to the federal required reporting, state-specific measures are also tracked. Programs receive incentive dollars from ABE funding if they meet or exceed set standards. The incentive measures that were set for this year’s funding are:
1. level gain performance – 40% or higher of students advance one or more levels 2. post-test rates – 50% post-test rate or higher 3. retention rates – 85% retention or higher 4. GED graduates – 40% or higher successful GED completion 5. cost per student – under $400
The chart below shows how many institutions met or exceeded the standards set for each of these measures. Figure 12. ABE Incentive Success Rate
0
2
4
6
8
10
12
Incentive 1 Incentive 2 Incentive 3 Incentive 4 Incentive 5
Number of Agencies Successful by Incentive
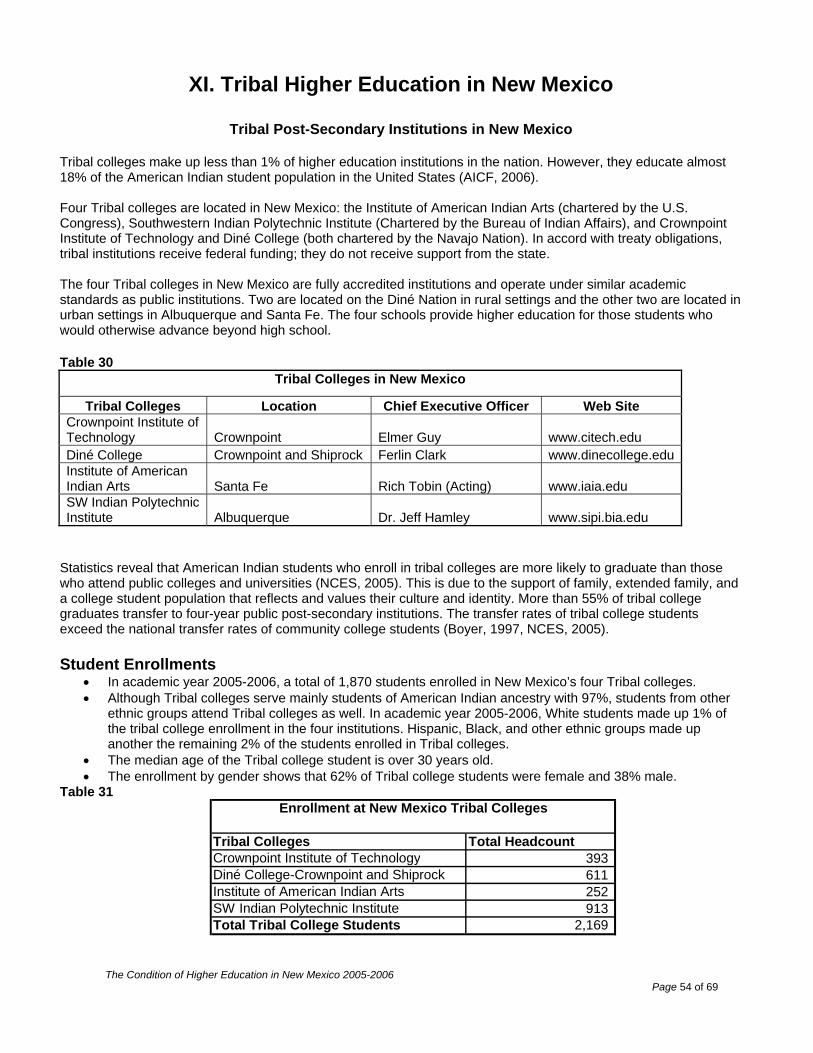
The Condition of Higher Education in New Mexico 2005-2006 Page 54 of 69
XI. Tribal Higher Education in New Mexico
Tribal Post-Secondary Institutions in New Mexico
Tribal colleges make up less than 1% of higher education institutions in the nation. However, they educate almost 18% of the American Indian student population in the United States (AICF, 2006).
Four Tribal colleges are located in New Mexico: the Institute of American Indian Arts (chartered by the U.S. Congress), Southwestern Indian Polytechnic Institute (Chartered by the Bureau of Indian Affairs), and Crownpoint Institute of Technology and Diné College (both chartered by the Navajo Nation). In accord with treaty obligations, tribal institutions receive federal funding; they do not receive support from the state. The four Tribal colleges in New Mexico are fully accredited institutions and operate under similar academic standards as public institutions. Two are located on the Diné Nation in rural settings and the other two are located in urban settings in Albuquerque and Santa Fe. The four schools provide higher education for those students who would otherwise advance beyond high school. Table 30
Tribal Colleges in New Mexico
Tribal Colleges Location Chief Executive Officer Web Site Crownpoint Institute of Technology Crownpoint Elmer Guy www.citech.edu Diné College Crownpoint and Shiprock Ferlin Clark www.dinecollege.edu Institute of American Indian Arts Santa Fe Rich Tobin (Acting) www.iaia.edu SW Indian Polytechnic Institute Albuquerque Dr. Jeff Hamley www.sipi.bia.edu
Statistics reveal that American Indian students who enroll in tribal colleges are more likely to graduate than those who attend public colleges and universities (NCES, 2005). This is due to the support of family, extended family, and a college student population that reflects and values their culture and identity. More than 55% of tribal college graduates transfer to four-year public post-secondary institutions. The transfer rates of tribal college students exceed the national transfer rates of community college students (Boyer, 1997, NCES, 2005). Student Enrollments
• In academic year 2005-2006, a total of 1,870 students enrolled in New Mexico’s four Tribal colleges. • Although Tribal colleges serve mainly students of American Indian ancestry with 97%, students from other
ethnic groups attend Tribal colleges as well. In academic year 2005-2006, White students made up 1% of the tribal college enrollment in the four institutions. Hispanic, Black, and other ethnic groups made up another the remaining 2% of the students enrolled in Tribal colleges.
• The median age of the Tribal college student is over 30 years old. • The enrollment by gender shows that 62% of Tribal college students were female and 38% male.
Table 31
Tribal Colleges Total HeadcountCrownpoint Institute of Technology 393 Diné College-Crownpoint and Shiprock 611 Institute of American Indian Arts 252 SW Indian Polytechnic Institute 913 Total Tribal College Students 2,169
Enrollment at New Mexico Tribal Colleges
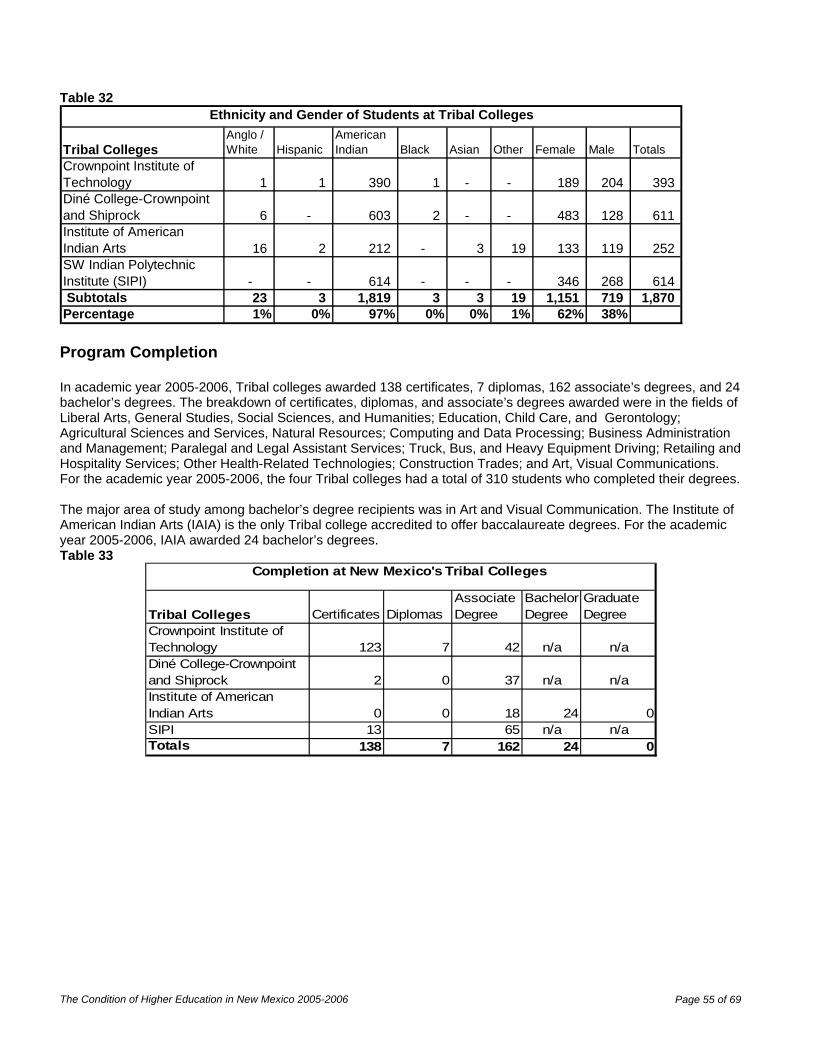
The Condition of Higher Education in New Mexico 2005-2006 Page 55 of 69
Table 32
Tribal Colleges Anglo / White Hispanic
American Indian Black Asian Other Female Male Totals
Crownpoint Institute of Technology 1 1 390 1 - - 189 204 393 Diné College-Crownpoint and Shiprock 6 - 603 2 - - 483 128 611 Institute of American Indian Arts 16 2 212 - 3 19 133 119 252 SW Indian Polytechnic Institute (SIPI) - - 614 - - - 346 268 614 Subtotals 23 3 1,819 3 3 19 1,151 719 1,870 Percentage 1% 0% 97% 0% 0% 1% 62% 38%
Ethnicity and Gender of Students at Tribal Colleges
Program Completion In academic year 2005-2006, Tribal colleges awarded 138 certificates, 7 diplomas, 162 associate’s degrees, and 24 bachelor’s degrees. The breakdown of certificates, diplomas, and associate’s degrees awarded were in the fields of Liberal Arts, General Studies, Social Sciences, and Humanities; Education, Child Care, and Gerontology; Agricultural Sciences and Services, Natural Resources; Computing and Data Processing; Business Administration and Management; Paralegal and Legal Assistant Services; Truck, Bus, and Heavy Equipment Driving; Retailing and Hospitality Services; Other Health-Related Technologies; Construction Trades; and Art, Visual Communications. For the academic year 2005-2006, the four Tribal colleges had a total of 310 students who completed their degrees. The major area of study among bachelor’s degree recipients was in Art and Visual Communication. The Institute of American Indian Arts (IAIA) is the only Tribal college accredited to offer baccalaureate degrees. For the academic year 2005-2006, IAIA awarded 24 bachelor’s degrees. Table 33
Tribal Colleges Certificates DiplomasAssociate Degree
Bachelor Degree
Graduate Degree
Crownpoint Institute of Technology 123 7 42 n/a n/aDiné College-Crownpoint and Shiprock 2 0 37 n/a n/aInstitute of American Indian Arts 0 0 18 24 0SIPI 13 65 n/a n/aTotals 138 7 162 24 0
Completion at New Mexico's Tribal Colleges
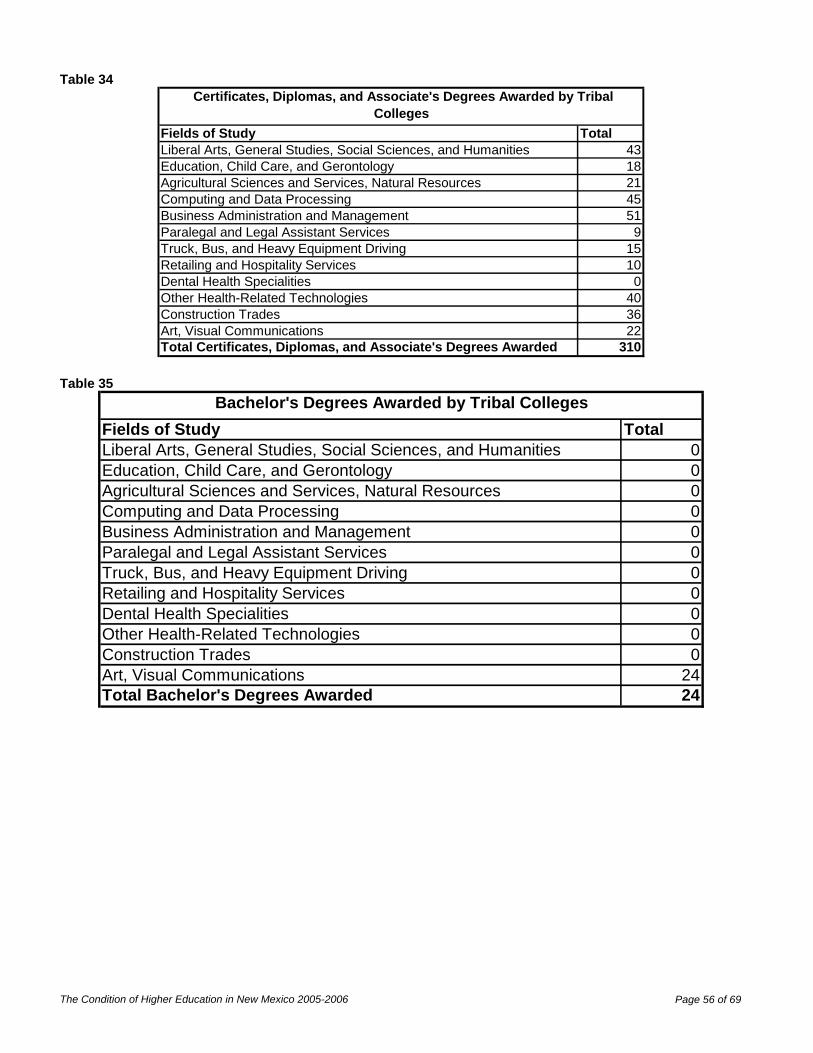
The Condition of Higher Education in New Mexico 2005-2006 Page 56 of 69
Table 34
Total43182145519
15100
403622
310Total Certificates, Diplomas, and Associate's Degrees Awarded
Certificates, Diplomas, and Associate's Degrees Awarded by Tribal Colleges
Other Health-Related TechnologiesConstruction TradesArt, Visual Communications
Fields of StudyLiberal Arts, General Studies, Social Sciences, and HumanitiesEducation, Child Care, and Gerontology
Truck, Bus, and Heavy Equipment DrivingRetailing and Hospitality ServicesDental Health Specialities
Agricultural Sciences and Services, Natural ResourcesComputing and Data ProcessingBusiness Administration and ManagementParalegal and Legal Assistant Services
Table 35
Total00000000000
2424
Bachelor's Degrees Awarded by Tribal CollegesFields of StudyLiberal Arts, General Studies, Social Sciences, and Humanities
Dental Health Specialities
Education, Child Care, and GerontologyAgricultural Sciences and Services, Natural ResourcesComputing and Data ProcessingBusiness Administration and ManagementParalegal and Legal Assistant ServicesTruck, Bus, and Heavy Equipment DrivingRetailing and Hospitality Services
Total Bachelor's Degrees Awarded
Other Health-Related TechnologiesConstruction TradesArt, Visual Communications
The Condition of Higher Education in New Mexico 2005-2006 Page 57 of 69
XII. Private Higher Education in New Mexico
Overview of the Status of Private Post-Secondary Education in New Mexico
There are 51private post-secondary institutions operating in New Mexico. Of these, eight of New Mexico’s private post-secondary institutions are regionally accredited. Of the other 43 licensed private post-secondary schools, nine are nationally accredited. Each plays a unique and important role in the scope of educational opportunities and services provided to New Mexico’s citizens. A wide range of educational programs are available, from certificates in floral design and computer training to bachelor’s and graduate degrees in education, business, health, and the social sciences. Some programs are delivered on campus in a traditional manner, while others are delivered non-traditionally, via distance education. The basis of the information provided here is a survey conducted by the New Mexico Higher Education Department. Forty-three institutions, or 85%, responded to the Department’s request for data, while 15% of the private institutions did not respond. Some schools do not track gender or ethnicity and were unable to provide a breakdown of enrollment by those factors. Student Enrollments
20,557 students were reported as enrolled in New Mexico’s private post-secondary institutions during Fall 2005. Most of these students (94%) are studying on campus, while the remainder take courses at a site off campus, via distance education.
The median age of students enrolled at institutions with regional accreditation during Fall 2005, was 36; at
institutions with national accreditation the median age was 29. At institutions with no accreditation which are tracking median age, the median age for students appears to be 32 years of age. Women represent 61% of the total enrollment at those institutions reporting gender. (Not all institutions track gender.)
Of the total number of students reported enrolled, 12,054 were tracked as to their ethnicity. Of these,
students for Fall 2005 at New Mexico’s private post-secondary institutions that did report ethnicity were: 31% Anglo/White; 40% Hispanic; 5% Native American, 3% Black, 1% Asian, and 19% were reported as ‘Other.’ (These percentages are based upon only those students classifying themselves among these five categories. Not all institutions report ethnicity.)
Program Completions During the 2005-2006 academic years, responding private institutions awarded 2,369 certificates of completion, 894 diplomas, 255 associate’s degrees, 1,345 bachelor’s degrees, and 788 graduate degrees. The largest number of certificates, diplomas, and associate’s degrees awarded were in the healthcare professions, followed by transportation. The predominant area of study among bachelor’s degree recipients was business, followed by education. The largest numbers of graduate degrees were awarded in business.

The Condition of Higher Education in New Mexico 2005-2006 Page 58 of 69
Table 36 Licensed Private Post-secondary Schools in New Mexico
Licensed Schools - UnaccreditedPrincipal Location
Principal Owner/Director Website
A Cat & Dog Grooming Academy Albuquerque Carolyn Conwell www.petgroomingschoolnm.comAlbuquerque Career Institute Albuquerque Dr. Anita Padilla N/AAquila Travel Academy Albuquerque Sandra Levinson www.aquilatravel.comArtesia Training Academy Artesia Lee Macaw www.artesiatraining.comAviation & Electronic Schools of NM Alamogordo James Doyle www.aesa.comThe Ayurvedic Institute Albuquerque Wynn Werner www.ayurveda.comCasino Dealer School Albuquerque David Rosenlund www.casinodealerschool.netCentury University Albuquerque Antonin Smrcka www.centuryuniversity.eduComp USA - Albuquerque Albuquerque Jill Wagnon www.compusa.comCulinary Business Academy Rio Rancho David MacKay www.culinarybusiness.comEC-Council University Albuquerque Sanjay Bavisi www.eccuni.usEcoVersity Santa Fe Arina Pittman www.ecoversity.orgEMI, Incorporated Mesa Eunice Kent N/AEmployment Training Svs., Inc. Albuquerque Hank Vigil N/AHypnotherapy Academy of America Santa Fe Heather Simmerman www.hypnotherapyacademy.comInternational Institute for Counter Terrorism Studies Albuquerque Jeff Hill www.iicts.comJohn Robert Powers School of Albuquerque Albuquerque Diana Horner www.jrpsouthwest.comThe Kemtah Group Albuquerque Keith Harris www.kemtahtraining.comLife Design International Santa Fe Gary De Rodriguez www.garyderodriguez.comMaharishi College of Vedic Medicine Albuquerque Dr. D. Edwards Smith N/AThe Medicine Wheel Aztec Randy L. Barnes not reportedMesilla Valley Training Institute Las Cruces Luis Garcia www.m-v-t-i.comMission Career Institute Albuquerque Frances Abila www.missioncareerinstitute.orgNational Ctr for Montessori Education Los Alamos Joan Ellard N/ANatl. Hypnotherapy Training Center Albuquerque Lois Prinz www.hypnotherapytrainingcenter.comNew Horizons Computer Learning Ctr Albuquerque Robin Dennehey www.nhabq.comNew Mexico Dealers School Albuquerque Julian Padilla, Jr. N/APrecision Groom Academy Las Cruces Sarah Reynolds N/APro Force Training Center Silver City Charles W. Cassady www.proforcetrain.comRio Grande Dental Assisting Training Socorro Ginger Bratzel, DDS N/A reportedRocky Mt. Truck Driving School Albuquerque Tracy Raven N/A reportedTrim Interntl. Floral School Albuquerque Lois I. Trim www.floralschools.comTrinity Learning Solutions, Inc. Albuquerque Don Bass www.trinityls.comUniversity of Natural Medicine Santa Fe Dr. Larry J. Milam www.universitynaturalmedicine.org
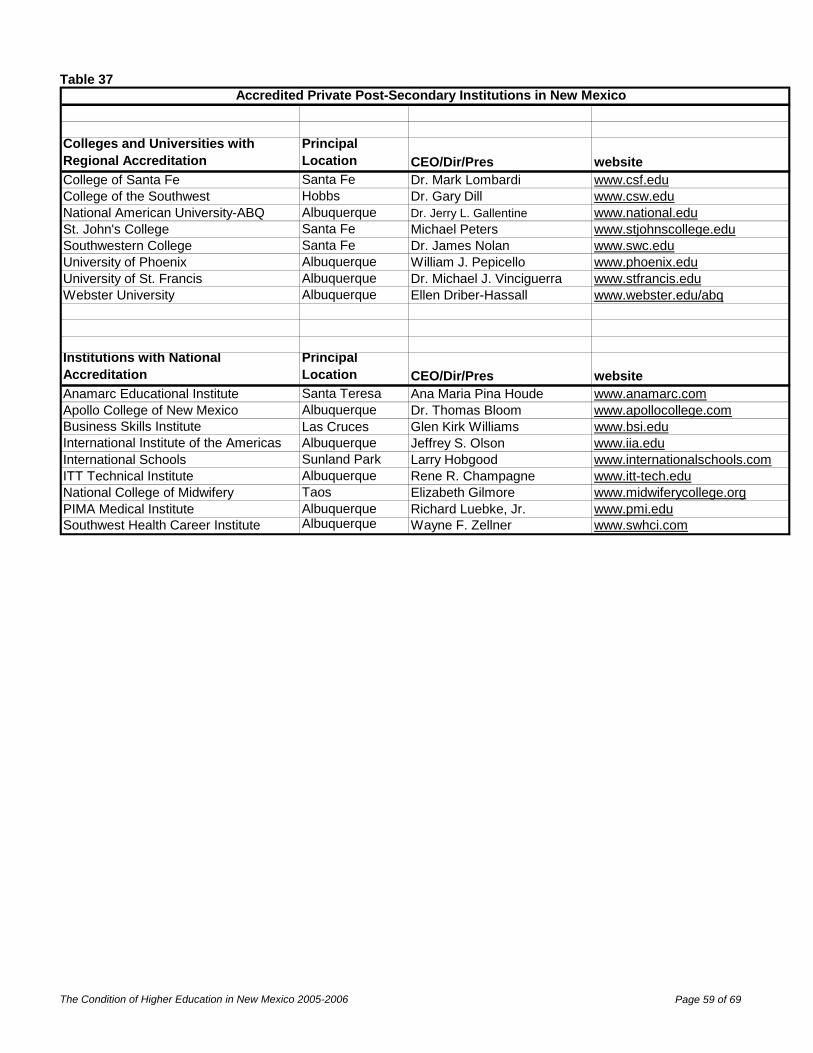
The Condition of Higher Education in New Mexico 2005-2006 Page 59 of 69
Table 37
Colleges and Universities with Regional Accreditation
Principal Location CEO/Dir/Pres website
College of Santa Fe Santa Fe Dr. Mark Lombardi www.csf.eduCollege of the Southwest Hobbs Dr. Gary Dill www.csw.eduNational American University-ABQ Albuquerque Dr. Jerry L. Gallentine www.national.eduSt. John's College Santa Fe Michael Peters www.stjohnscollege.eduSouthwestern College Santa Fe Dr. James Nolan www.swc.eduUniversity of Phoenix Albuquerque William J. Pepicello www.phoenix.eduUniversity of St. Francis Albuquerque Dr. Michael J. Vinciguerra www.stfrancis.eduWebster University Albuquerque Ellen Driber-Hassall www.webster.edu/abq
Institutions with National Accreditation
Principal Location CEO/Dir/Pres website
Anamarc Educational Institute Santa Teresa Ana Maria Pina Houde www.anamarc.comApollo College of New Mexico Albuquerque Dr. Thomas Bloom www.apollocollege.comBusiness Skills Institute Las Cruces Glen Kirk Williams www.bsi.eduInternational Institute of the Americas Albuquerque Jeffrey S. Olson www.iia.eduInternational Schools Sunland Park Larry Hobgood www.internationalschools.comITT Technical Institute Albuquerque Rene R. Champagne www.itt-tech.eduNational College of Midwifery Taos Elizabeth Gilmore www.midwiferycollege.orgPIMA Medical Institute Albuquerque Richard Luebke, Jr. www.pmi.eduSouthwest Health Career Institute Albuquerque Wayne F. Zellner www.swhci.com
Accredited Private Post-Secondary Institutions in New Mexico
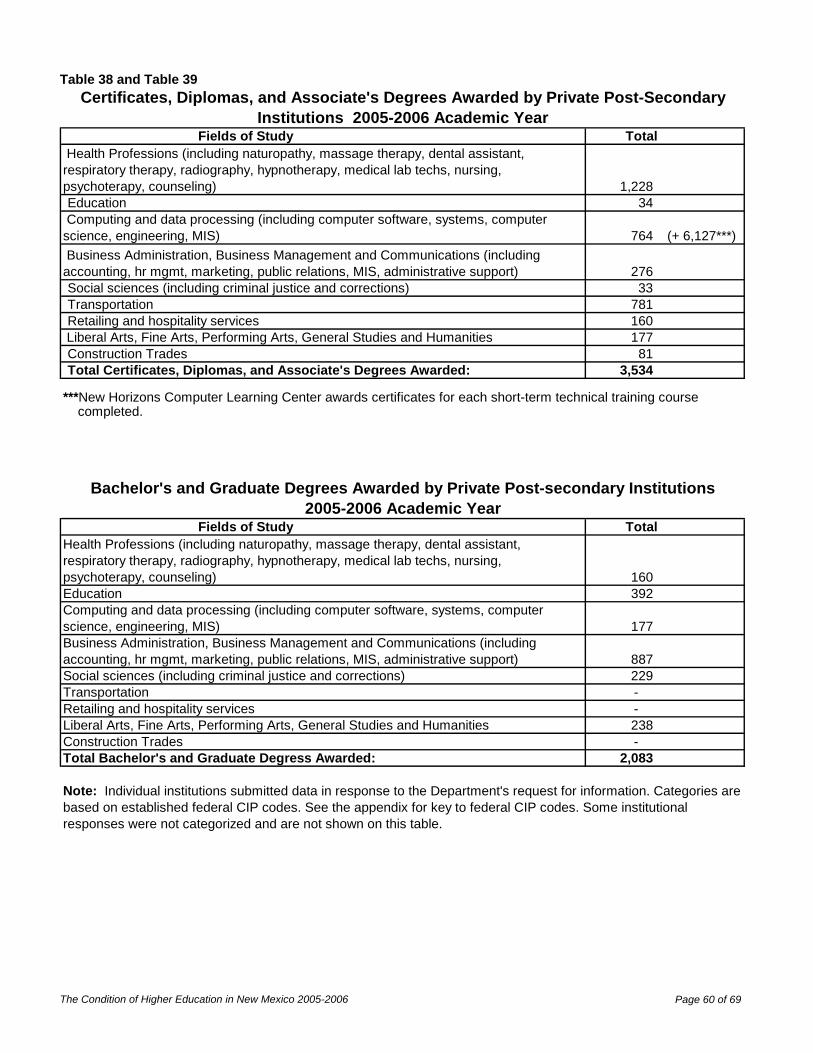
The Condition of Higher Education in New Mexico 2005-2006 Page 60 of 69
Table 38 and Table 39
Fields of Study Total
1,228 Education 34
764 (+ 6,127***)
276 Social sciences (including criminal justice and corrections) 33 Transportation 781 Retailing and hospitality services 160
177 Construction Trades 81 Total Certificates, Diplomas, and Associate's Degrees Awarded: 3,534
completed.
Fields of Study Total
160 Education 392
177
887 Social sciences (including criminal justice and corrections) 229 Transportation - Retailing and hospitality services -
238 Construction Trades - Total Bachelor's and Graduate Degress Awarded: 2,083
Certificates, Diplomas, and Associate's Degrees Awarded by Private Post-SecondaryInstitutions 2005-2006 Academic Year
Bachelor's and Graduate Degrees Awarded by Private Post-secondary Institutions2005-2006 Academic Year
***New Horizons Computer Learning Center awards certificates for each short-term technical training course
Health Professions (including naturopathy, massage therapy, dental assistant, respiratory therapy, radiography, hypnotherapy, medical lab techs, nursing, psychoterapy, counseling)
Computing and data processing (including computer software, systems, computer science, engineering, MIS) Business Administration, Business Management and Communications (including accounting, hr mgmt, marketing, public relations, MIS, administrative support)
Liberal Arts, Fine Arts, Performing Arts, General Studies and Humanities
Note: Individual institutions submitted data in response to the Department's request for information. Categories are based on established federal CIP codes. See the appendix for key to federal CIP codes. Some institutionalresponses were not categorized and are not shown on this table.
Health Professions (including naturopathy, massage therapy, dental assistant, respiratory therapy, radiography, hypnotherapy, medical lab techs, nursing, psychoterapy, counseling)
Computing and data processing (including computer software, systems, computer science, engineering, MIS)Business Administration, Business Management and Communications (including accounting, hr mgmt, marketing, public relations, MIS, administrative support)
Liberal Arts, Fine Arts, Performing Arts, General Studies and Humanities
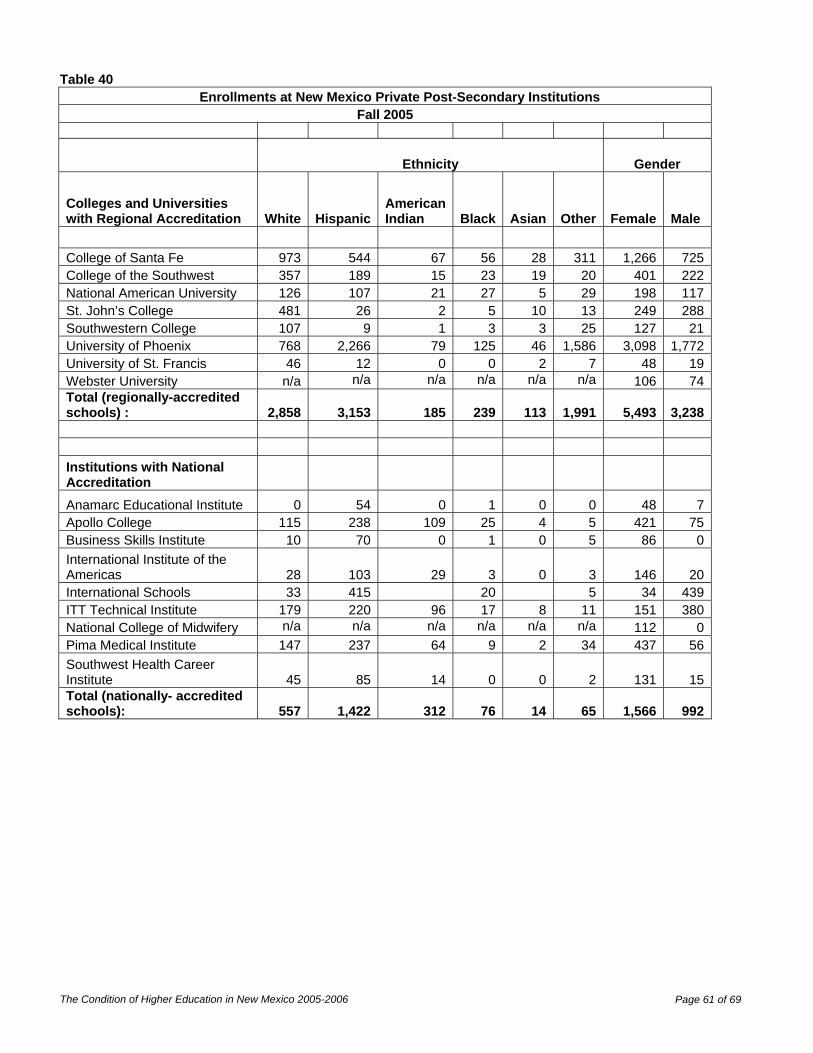
The Condition of Higher Education in New Mexico 2005-2006 Page 61 of 69
Table 40 Enrollments at New Mexico Private Post-Secondary Institutions
Fall 2005
Ethnicity Gender
Colleges and Universities with Regional Accreditation White Hispanic
American Indian Black Asian Other Female Male
College of Santa Fe 973 544 67 56 28 311 1,266 725College of the Southwest 357 189 15 23 19 20 401 222National American University 126 107 21 27 5 29 198 117St. John’s College 481 26 2 5 10 13 249 288Southwestern College 107 9 1 3 3 25 127 21University of Phoenix 768 2,266 79 125 46 1,586 3,098 1,772University of St. Francis 46 12 0 0 2 7 48 19Webster University n/a n/a n/a n/a n/a n/a 106 74Total (regionally-accredited schools) : 2,858 3,153 185 239 113 1,991 5,493 3,238 Institutions with National Accreditation
Anamarc Educational Institute 0 54 0 1 0 0 48 7Apollo College 115 238 109 25 4 5 421 75Business Skills Institute 10 70 0 1 0 5 86 0International Institute of the Americas 28 103 29 3 0 3 146 20International Schools 33 415 20 5 34 439ITT Technical Institute 179 220 96 17 8 11 151 380National College of Midwifery n/a n/a n/a n/a n/a n/a 112 0Pima Medical Institute 147 237 64 9 2 34 437 56Southwest Health Career Institute 45 85 14 0 0 2 131 15Total (nationally- accredited schools): 557 1,422 312 76 14 65 1,566 992

The Condition of Higher Education in New Mexico 2005-2006 Page 62 of 69
Enrollments at New Mexico Private Postsecondary Institutions - Fall 2005
(continued) Ethnicity Gender Licensed Schools - Unaccredited White Hispanic
American Indian Black Asian Other Female Male
A Cat & Dog Styling Academy n/a n/a Albuquerque Career Institute n/a n/a Aquila Travel Academy 1 2 0 2 0 0 5 0Artesia Training Academy 16 23 1 3 0 0 4 39Aviation & Electronic Schools of America 0 0 0 0 0 0 n/a n/aThe Ayurvedic Institute n/a n/a Casino Dealer School n/a n/a n/a n/a n/a n/a n/a n/aCentury University n/a n/a Comp USA - Albuquerque
n/a n/a n/a n/a n/a n/a 31 8
Culinary Business Academy
n/a n/a n/a n/a n/a n/a 115 28
Ecoversity 13 0 0 1 1 0 9 6EMI, Inc. 67 13 1 0 0 0 9 72Employment Training Svs., Inc. n/a n/a Hypnotherapy Academy of America
n/a n/a n/a n/a n/a n/a 41 16
International Institute for Counterterrorism Studies n/a n/a n/a n/a n/a n/a n/a n/aJohn Robert Powers School of Albuquerque 115 139 60 40 25 271 421 229The Kemtah Group n/a n/a n/a n/a n/a n/a n/a n/a Life Design International n/a n/a n/a n/a n/a n/a 10 5Maharishi College of Vedic Medicine n/a n/a n/a n/a n/a n/a n/a n/aThe Medicine Wheel 2 0 1 0 0 0 3 0Mesilla Valley Training Institute 14 28 0 1 0 0 7 36Mission Career Institute n/a n/a Subtotal (Licensed Schools): 228 205 63 47 26 271 655 439
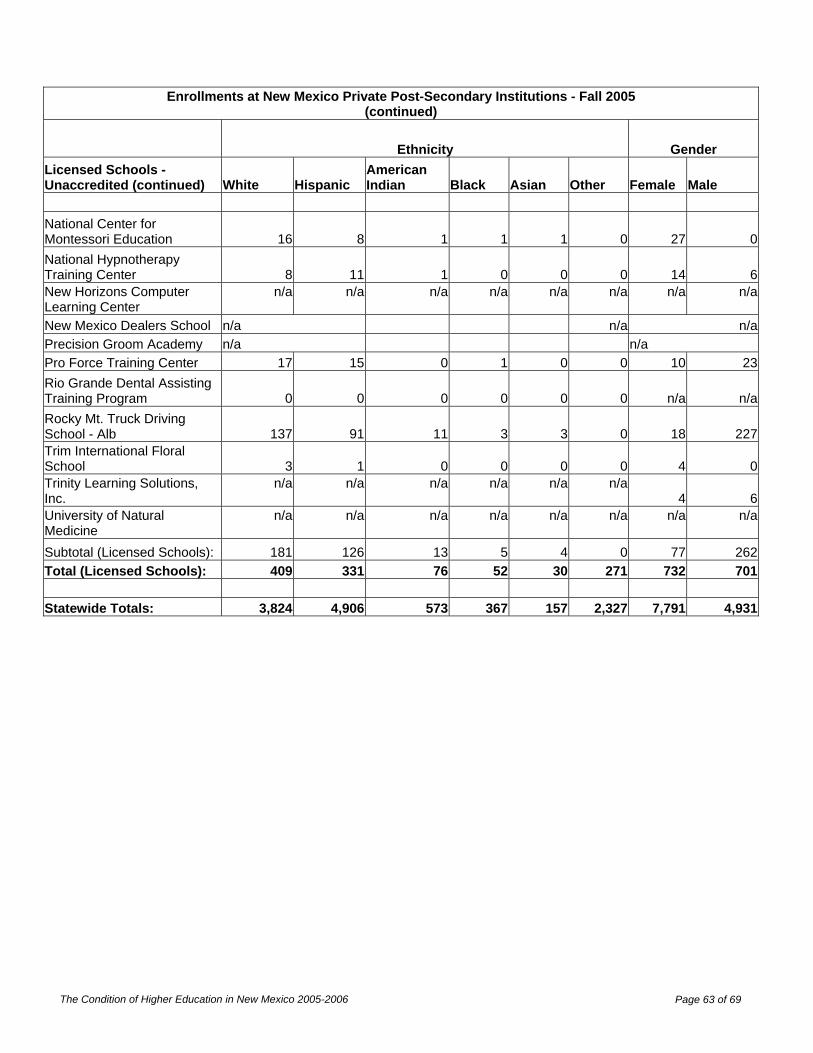
The Condition of Higher Education in New Mexico 2005-2006 Page 63 of 69
Enrollments at New Mexico Private Post-Secondary Institutions - Fall 2005
(continued)
Ethnicity Gender Licensed Schools - Unaccredited (continued) White Hispanic
American Indian Black Asian Other Female Male
National Center for Montessori Education 16 8 1 1 1 0 27 0National Hypnotherapy Training Center 8 11 1 0 0 0 14 6New Horizons Computer Learning Center
n/a n/a n/a n/a n/a n/a n/a n/a
New Mexico Dealers School n/a n/a n/aPrecision Groom Academy n/a n/a Pro Force Training Center 17 15 0 1 0 0 10 23Rio Grande Dental Assisting Training Program 0 0 0 0 0 0 n/a n/aRocky Mt. Truck Driving School - Alb 137 91 11 3 3 0 18 227Trim International Floral School 3 1 0 0 0 0 4 0Trinity Learning Solutions, Inc.
n/a n/a n/a n/a n/a n/a 4 6
University of Natural Medicine
n/a n/a n/a n/a n/a n/a n/a n/a
Subtotal (Licensed Schools): 181 126 13 5 4 0 77 262Total (Licensed Schools): 409 331 76 52 30 271 732 701 Statewide Totals: 3,824 4,906 573 367 157 2,327 7,791 4,931

The Condition of Higher Education in New Mexico 2005-2006 Page 64 of 69
Table 41 Enrollments at New Mexico Private Post-secondary Institutions
Fall 2005
Headcount on campus
Headcount off campus Total
Median Age
Colleges and Universities with Regional Accreditation College of Santa Fe 1991 0 1991 n/aCollege of the Southwest 592 31 623 37National American University 315 0 315 n/aSt. John’s College 537 0 537 n/aSouthwestern College 148 0 148 39University of Phoenix 4121 749 4870 33University of St. Francis 63 4 67 36Webster University 219 0 219 n/a Total (regionally-accredited schools): 7,986 784 8,770 36
Institutions with National Accreditation
Anamarc Educational Institute 55 0 55 30Apollo College 496 0 496 25Business Skills Institute 86 0 86 n/a
International Institute of the Americas 157 9 166 25International Schools 473 0 473 35ITT Technical Institute 531 0 531 26National College of Midwifery 0 112 112 n/aPima Medical Institute 493 0 493 n/a
Southwest Health Career Institute 146 0 146 30
Totals (nationally-accredited schools): 2,437 121 2,558 29
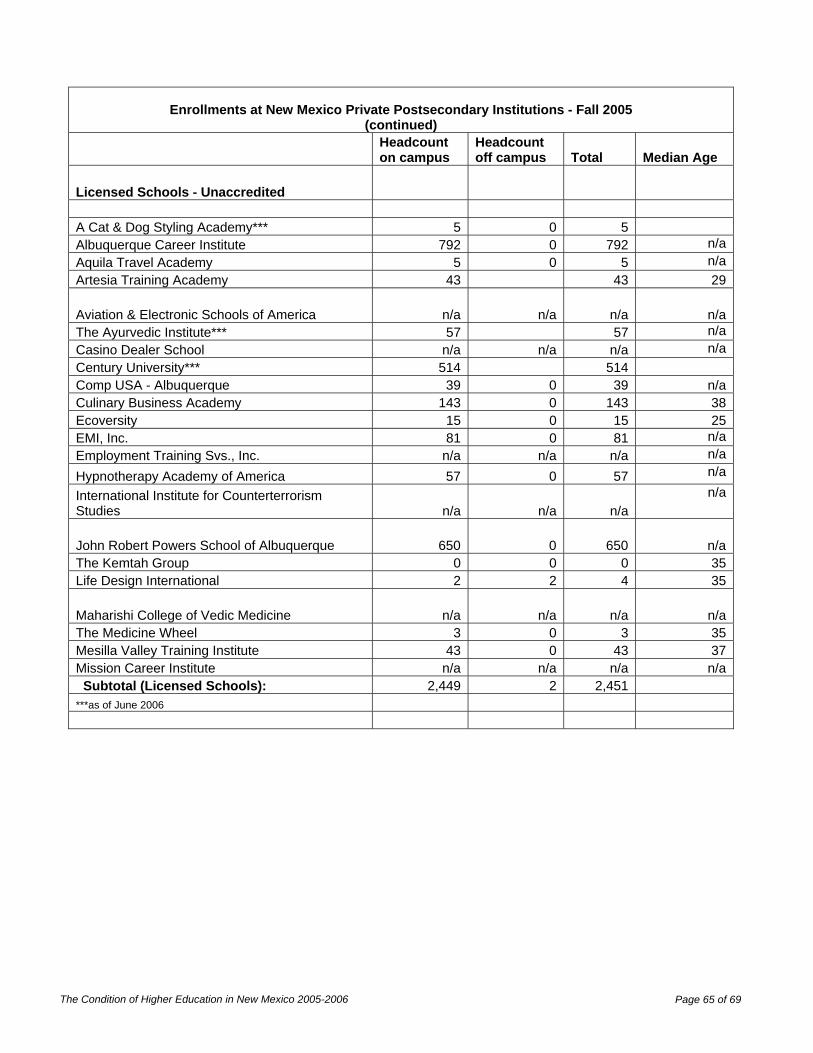
The Condition of Higher Education in New Mexico 2005-2006 Page 65 of 69
Enrollments at New Mexico Private Postsecondary Institutions - Fall 2005 (continued)
Headcount on campus
Headcount off campus Total Median Age
Licensed Schools - Unaccredited A Cat & Dog Styling Academy*** 5 0 5 Albuquerque Career Institute 792 0 792 n/aAquila Travel Academy 5 0 5 n/aArtesia Training Academy 43 43 29
Aviation & Electronic Schools of America n/a n/a n/a n/aThe Ayurvedic Institute*** 57 57 n/aCasino Dealer School n/a n/a n/a n/aCentury University*** 514 514 Comp USA - Albuquerque 39 0 39 n/aCulinary Business Academy 143 0 143 38Ecoversity 15 0 15 25EMI, Inc. 81 0 81 n/aEmployment Training Svs., Inc. n/a n/a n/a n/a
Hypnotherapy Academy of America 57 0 57 n/a
International Institute for Counterterrorism Studies n/a n/a n/a
n/a
John Robert Powers School of Albuquerque 650 0 650 n/aThe Kemtah Group 0 0 0 35Life Design International 2 2 4 35
Maharishi College of Vedic Medicine n/a n/a n/a n/aThe Medicine Wheel 3 0 3 35Mesilla Valley Training Institute 43 0 43 37Mission Career Institute n/a n/a n/a n/a Subtotal (Licensed Schools): 2,449 2 2,451 ***as of June 2006
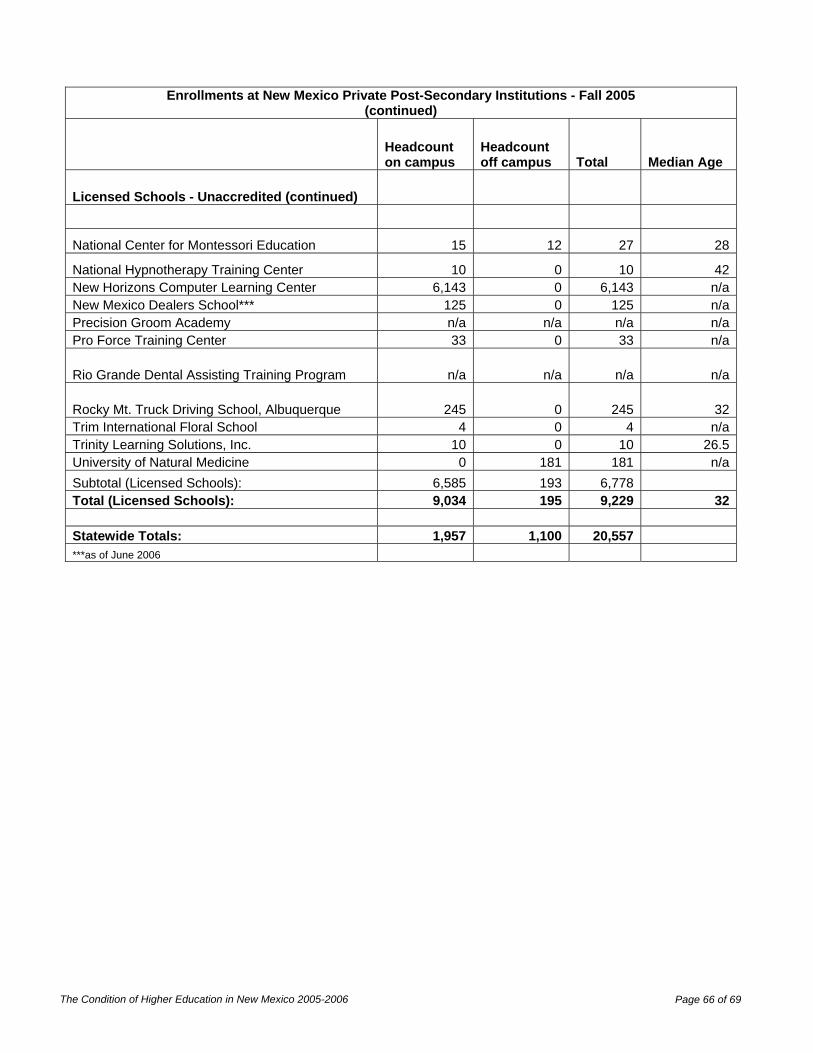
The Condition of Higher Education in New Mexico 2005-2006 Page 66 of 69
Enrollments at New Mexico Private Post-Secondary Institutions - Fall 2005
(continued)
Headcount on campus
Headcount off campus Total Median Age
Licensed Schools - Unaccredited (continued)
National Center for Montessori Education 15 12 27 28
National Hypnotherapy Training Center 10 0 10 42New Horizons Computer Learning Center 6,143 0 6,143 n/aNew Mexico Dealers School*** 125 0 125 n/aPrecision Groom Academy n/a n/a n/a n/aPro Force Training Center 33 0 33 n/a
Rio Grande Dental Assisting Training Program n/a n/a n/a n/a
Rocky Mt. Truck Driving School, Albuquerque 245 0 245 32Trim International Floral School 4 0 4 n/aTrinity Learning Solutions, Inc. 10 0 10 26.5University of Natural Medicine 0 181 181 n/aSubtotal (Licensed Schools): 6,585 193 6,778 Total (Licensed Schools): 9,034 195 9,229 32 Statewide Totals: 1,957 1,100 20,557 ***as of June 2006

The Condition of Higher Education in New Mexico 2005-2006 Page 67 of 69
Table 42 Number of Graduates at New Mexico's Private Postsecondary Institutions
Colleges / Universities Certificates Diploma Associate Bachelor's Graduate TOTALRegionally Accredited
College of Santa Fe 6 308 115 429 College of the Southwest 95 32 127
National American University-ABQ 17 57 74 St. John's College 83 47 130
Southwestern College 13 33 46 University of Phoenix 25 7 764 426 1,222
University of St. Francis 1 28 29 Webster University 98 98
Subtotals: 38 - 30 1,308 779 2,155 Nationally Accredited
Apollo College 376 4 380 Business Skills Institute 70 70
International Institute of the Americas 104 27 5 136 International Schools 473 473 ITT Technical Institute 125 24 149
National College of Midwifery 2 17 15 1 1 36 PIMA Medical Institute 450 54 504
Southwest Health Career Institute 123 123 Subtotals: 1,048 567 225 30 1 1,871
Licensed Schools - Not AccreditiedEcoversity 1 - - - - 1
The Medicine Wheel 1 1 - - - 2 Aquila Travel Academy 5 - - - - 5
National Ctr for Montessori Education 6 - - - - 6 University of Natural Medicine 9 - - 7 8 24
Casino Dealer School 16 - - - - 16 Natl. Hypnotherapy Training Center 19 - - - - 19
Life Design International 20 20 - - - 40 Mesilla Valley Training Institute 22 - - - - 22
Pro Force Training Center 33 - - - - 33 Comp USA - Albuquerque 39 - - - - 39 Artesia Training Academy 41 - - - - 41
EMI Incorporated 81 - - - - 81 Trinity Learning Solutions, Inc. 87 - - - - 87
Culinary Business Academy 143 - - - - 143 John Robert Powers School of Albuquerque 160 - - - - 160
The Kemtah Group 600 - - - - 600 Hypnotherapy Academy of America 57 57
Rocky Mt. Truck Driving School 245 245 Trim Internatl Floral School 4 4
Subtotals: 1,283 327 - 7 8 1,625 Statewide Totals 2,599 654 - 14 16 3,283
Non-reporting Schools: A Cat & Dog Grooming Academy, Albuquerque Career Institute, Century University Employment Training Svs., Inc., Mission Career Institute, New Mexico Dealers School, Precision Groom Academy, and The Ayurvedic Institute did not respond to the Department's surevy request.
No Graduates Reported Academic Year 2004: Anamarc Educational Institute, Aviation & Electronic Schools of America, EC-Council University, International Institute for Counter-Terrorism, Maharishi College of Vedic Medicine, Rio Grande Dental Assisting Training Program, and New Horizons Computer Learning Center.
2005-2006 Academic YearAwards by Degree Level
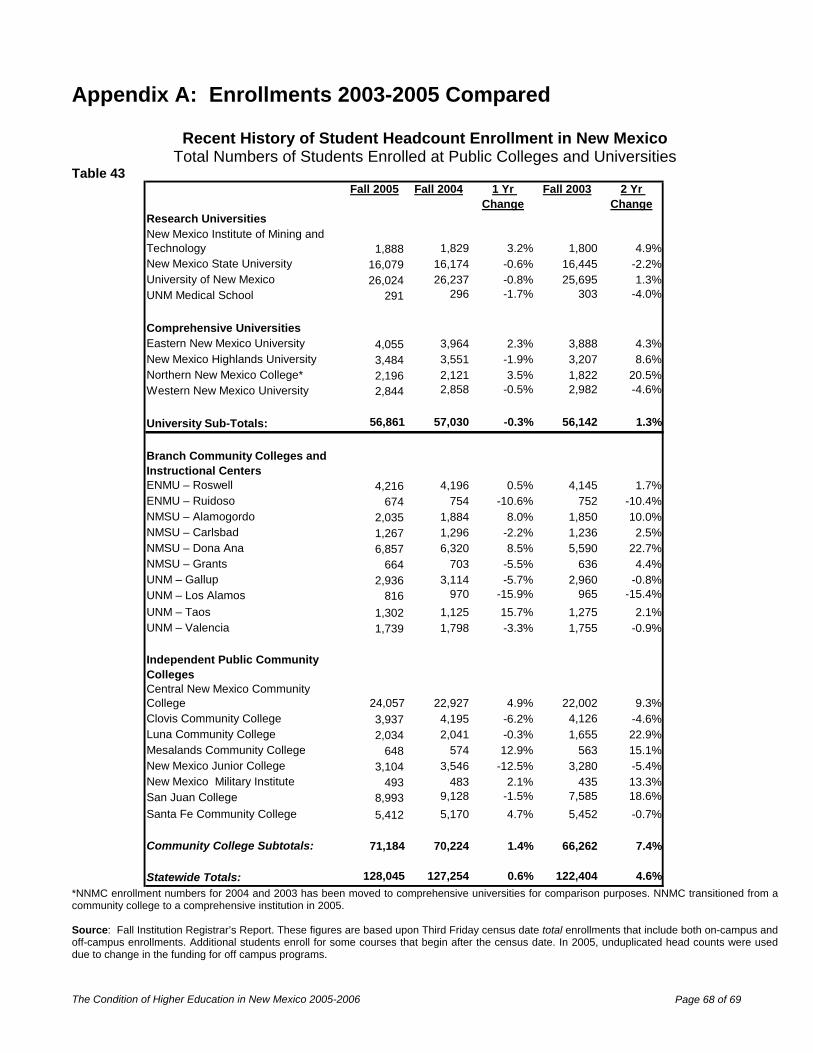
The Condition of Higher Education in New Mexico 2005-2006 Page 68 of 69
Appendix A: Enrollments 2003-2005 Compared
Recent History of Student Headcount Enrollment in New Mexico Total Numbers of Students Enrolled at Public Colleges and Universities
Table 43 Fall 2005 Fall 2004 1 Yr
ChangeFall 2003 2 Yr
ChangeResearch UniversitiesNew Mexico Institute of Mining and Technology 1,888 1,829 3.2% 1,800 4.9%New Mexico State University 16,079 16,174 -0.6% 16,445 -2.2%University of New Mexico 26,024 26,237 -0.8% 25,695 1.3%UNM Medical School 291 296 -1.7% 303 -4.0%
Comprehensive UniversitiesEastern New Mexico University 4,055 3,964 2.3% 3,888 4.3%New Mexico Highlands University 3,484 3,551 -1.9% 3,207 8.6%Northern New Mexico College* 2,196 2,121 3.5% 1,822 20.5%Western New Mexico University 2,844 2,858 -0.5% 2,982 -4.6%
University Sub-Totals: 56,861 57,030 -0.3% 56,142 1.3%
Branch Community Colleges and Instructional CentersENMU – Roswell 4,216 4,196 0.5% 4,145 1.7%ENMU – Ruidoso 674 754 -10.6% 752 -10.4%NMSU – Alamogordo 2,035 1,884 8.0% 1,850 10.0%NMSU – Carlsbad 1,267 1,296 -2.2% 1,236 2.5%NMSU – Dona Ana 6,857 6,320 8.5% 5,590 22.7%NMSU – Grants 664 703 -5.5% 636 4.4%UNM – Gallup 2,936 3,114 -5.7% 2,960 -0.8%UNM – Los Alamos 816 970 -15.9% 965 -15.4%UNM – Taos 1,302 1,125 15.7% 1,275 2.1%UNM – Valencia 1,739 1,798 -3.3% 1,755 -0.9%
Independent Public Community CollegesCentral New Mexico Community College 24,057 22,927 4.9% 22,002 9.3%Clovis Community College 3,937 4,195 -6.2% 4,126 -4.6%Luna Community College 2,034 2,041 -0.3% 1,655 22.9%Mesalands Community College 648 574 12.9% 563 15.1%New Mexico Junior College 3,104 3,546 -12.5% 3,280 -5.4%New Mexico Military Institute 493 483 2.1% 435 13.3%San Juan College 8,993 9,128 -1.5% 7,585 18.6%Santa Fe Community College 5,412 5,170 4.7% 5,452 -0.7%
Community College Subtotals: 71,184 70,224 1.4% 66,262 7.4%
Statewide Totals: 128,045 127,254 0.6% 122,404 4.6% *NNMC enrollment numbers for 2004 and 2003 has been moved to comprehensive universities for comparison purposes. NNMC transitioned from a community college to a comprehensive institution in 2005. Source: Fall Institution Registrar’s Report. These figures are based upon Third Friday census date total enrollments that include both on-campus and off-campus enrollments. Additional students enroll for some courses that begin after the census date. In 2005, unduplicated head counts were used due to change in the funding for off campus programs.

The Condition of Higher Education in New Mexico 2005-2006 Page 69 of 69
Recent History of Full-Time-Equivalent Student Enrollment in New Mexico Total Student FTE Enrolled at Public Colleges and Universities
Table 44
Fall 2005 Fall 2004 1 Yr Change
Fall 2003 2 Yr Change
1,504 1,474 2.0% 1,459 3.1%12,652 12,950 -2.3% 12,739 -0.7%20,542 20,291 1.2% 19,889 3.3%
466 494 -5.7% 527 -11.6%
3,134 3,105 0.9% 2,955 6.1%2,217 2,324 -4.6% 2,077 6.7%1,139 1,003 13.6% 941 21.0%1,878 1,846 1.7% 2,043 -8.1%
43,532 42,484 2.5% 41,689 4.4%
2,390 2,337 2.3% 2,057 16.2%296 314 -5.7% 314 -5.7%
1,100 1,075 2.3% 1,073 2.5%817 814 0.4% 771 6.0%
3,759 3,422 9.8% 3,008 25.0%415 414 0.2% 368 12.8%
1,662 1,694 -1.9% 1,608 3.4%398 439 -9.3% 465 -14.4%577 511 12.9% 579 -0.3%973 1,027 -5.3% 1,037 -6.2%
12,482 12,259 1.8% 11,777 6.0%1,773 1,899 -6.6% 1,904 -6.9%
936 916 2.2% 767 22.0%341 344 -0.9% 316 7.9%
1,687 1,857 -9.2% 1,766 -4.5%544 515 5.6% 467 16.5%
4,196 4,259 -1.5% 3,890 7.9%2,067 1,958 5.6% 2,039 1.4%
36,413 37,056 -1.7% 34,774 4.7%
79,945 79,540 0.5% 76,463 4.6%
New Mexico TechNew Mexico State
Research Universities
Comprehensive Institutions
University of New MexicoUNM Medical School
Western New Mexico
Eastern New MexicoNew Mexico Highlands
Branch Community Collegesand Instructional Centers
University Sub-Totals:
NMSU – AlamogordoNMSU – Carlsbad
ENMU – RoswellENMU – Ruidoso
UNM – GallupUNM – Los Alamos
NMSU – Dona AnaNMSU – Grants
Independent Public
UNM – TaosUNM – Valencia
San Juan CollegeSanta Fe Community College
New Mexico Military Institute
Northern New Mexico College
Mesalands Community CollegeNew Mexico Junior College
Clovis Community CollegeLuna Community College
Community CollegesCentral New Mexico Community College
Statewide Totals:
Community College Sub-Totals:
*NNMC enrollment numbers for 2004 and 2003 has been moved to comprehensive universities for comparison purposes. NNMC transitioned from a community college to a comprehensive institution in 2005. Source: Fall Institution Registrar’s Report. These figures are based upon Third Friday census date enrollments for both on-campus and off-campus students. Full-time-equivalent enrollment is calculated by dividing the total undergraduate credit hours taken by 15 and dividing the total graduate credit hours taken by 12, the minimum numbers of credit hours required for full-time status at those two levels, respectively.
Related Documents