Feature Article The comprehensive frailty assessment instrument: Development, validity and reliability Nico De Witte, RN, MSc a, b, * , Robbert Gobbens, PhD, RN, MSc c, d , Liesbeth De Donder, PhD, MSc b , Sarah Dury, MSc b , Tine Buffel, PhD, MSc b , Jos Schols, MD, PhD e, f , Dominique Verté, PhD, RN, MSc b a Faculty of Education, Health and Social Work, University College Ghent, Ghent, Belgium b Faculty of Psychology and Educational Sciences, Vrije Universiteit Brussel, Brussels, Belgium c Rotterdam University of Applied Sciences, Rotterdam, The Netherlands d Department of Tranzo, Scientific Center for Care and Welfare, Tilburg University, Tilburg, The Netherlands e Department of General Practice, CAPHRI School for Public Health and Primary Care, Maastricht University, The Netherlands f Department of Health Services Research, CAPHRI School for Public Health and Primary Care, Maastricht University, The Netherlands article info Article history: Received 18 October 2012 Received in revised form 6 March 2013 Accepted 11 March 2013 Available online 19 April 2013 Keywords: Frailty Older persons Elderly Validation study Community abstract Population aging forces governments to change their policy on elderly care. Older people, even if they are frail and disabled, are motivated to stay in their own homes and environment for as long as possible. Consequently, the early detection of frail older persons is appropriate to avoid adverse outcomes. Several instruments to detect frailty exist, but none use environmental indicators. This study addresses the development and psychometric properties of the Comprehensive Frailty Assessment Instrument (CFAI). This new self-reporting instrument includes physical, psychological, social and environmental domains. The CFAI showed good fit indices and a high reliability. The underlying structure of the CFAI demon- strates the multidisciplinary nature of frailty. Using the CFAI can stimulate nurses and other community healthcare providers toward a more holistic approach of frailty and can guide them to take appropriate interventions to prevent adverse outcomes such as disabilities or hospitalization. Ó 2013 Mosby, Inc. All rights reserved. 1. Introduction Population aging, a phenomenon in which the distribution of a country’s population shifts toward older ages, is affecting all Western societies. 1 To cope with the challenges of a rapidly aging population, several governments have substantially changed their policies on elderly care. Older people, even if they are frail and disabled, are motivated to stay in their own homes and environment for as long as possible. As a consequence, the early detection of frail community-dwelling older persons becomes a significant issue. Several instruments for detection exist, but most have a biomedical emphasis. In most cases, frail older people are detected in clinical settings by screening biomedical indicators (e.g., Fried et al 2 ). However, some efforts have been made to broaden the concept by adding psychological 3 and social indicators 4 or by using these detection instruments in other settings. 5 Indeed, screen- ing all community-dwelling older persons clinically for frailty will be impossible, particularly for organizational and financial consequences. Moreover, by placing the most emphasis on biomedical indicators, the multidimensional character of frailty is disregarded. According to Gobbens et al, 5 an overly narrow definition of frailty, focusing exclusively on physical problems in older people, can lead to the fragmentation of care, thereby jeopardizing the attention for the whole person. Problems such as poor-quality housing, 6 deprived environments and changing social networks 7 are neglected. Indeed, while aging, older people will depend highly on the sustainability of their own housing conditions, their environment and their network. 8 If problems arise within these, older people can also become frail. Against this background, this article aims to broaden the body of knowledge regarding the concept of frailty by introducing a multi- dimensional, self-administrated instrument capturing 4 domains of frailty: physical, psychological, social and environmental. To the best of our knowledge, this study is the first to include the envi- ronmental domain in the assessment of frailty. 1.1. A model for measuring frailty in older persons As mentioned above, most frailty assessments are dominated by biomedical indicators. Clinicians, for example, use and evaluate * Corresponding author. Faculty of Education, Health and Social Work, University College Ghent, Keramiekstraat 80, 9000 Ghent, Belgium. Tel.: þ32 93212138. E-mail address: [email protected] (N. De Witte). Contents lists available at SciVerse ScienceDirect Geriatric Nursing journal homepage: www.gnjournal.com 0197-4572/$ e see front matter Ó 2013 Mosby, Inc. All rights reserved. http://dx.doi.org/10.1016/j.gerinurse.2013.03.002 Geriatric Nursing 34 (2013) 274e281

Welcome message from author
This document is posted to help you gain knowledge. Please leave a comment to let me know what you think about it! Share it to your friends and learn new things together.
Transcript

at SciVerse ScienceDirect
Geriatric Nursing 34 (2013) 274e281
Contents lists available
Geriatric Nursing
journal homepage: www.gnjournal .com
Feature Article
The comprehensive frailty assessment instrument: Development, validity andreliability
Nico De Witte, RN, MSc a,b,*, Robbert Gobbens, PhD, RN, MSc c,d, Liesbeth De Donder, PhD, MSc b,Sarah Dury, MSc b, Tine Buffel, PhD, MSc b, Jos Schols, MD, PhD e,f, Dominique Verté, PhD, RN, MSc b
a Faculty of Education, Health and Social Work, University College Ghent, Ghent, Belgiumb Faculty of Psychology and Educational Sciences, Vrije Universiteit Brussel, Brussels, BelgiumcRotterdam University of Applied Sciences, Rotterdam, The NetherlandsdDepartment of Tranzo, Scientific Center for Care and Welfare, Tilburg University, Tilburg, The NetherlandseDepartment of General Practice, CAPHRI School for Public Health and Primary Care, Maastricht University, The NetherlandsfDepartment of Health Services Research, CAPHRI School for Public Health and Primary Care, Maastricht University, The Netherlands
a r t i c l e i n f o
Article history:Received 18 October 2012Received in revised form6 March 2013Accepted 11 March 2013Available online 19 April 2013
Keywords:FrailtyOlder personsElderlyValidation studyCommunity
* Corresponding author. Faculty of Education, HealtCollege Ghent, Keramiekstraat 80, 9000 Ghent, Belgiu
E-mail address: [email protected] (N. De W
0197-4572/$ e see front matter � 2013 Mosby, Inc. Ahttp://dx.doi.org/10.1016/j.gerinurse.2013.03.002
a b s t r a c t
Population aging forces governments to change their policy on elderly care. Older people, even if they arefrail and disabled, are motivated to stay in their own homes and environment for as long as possible.Consequently, the early detection of frail older persons is appropriate to avoid adverse outcomes. Severalinstruments to detect frailty exist, but none use environmental indicators. This study addresses thedevelopment and psychometric properties of the Comprehensive Frailty Assessment Instrument (CFAI).This new self-reporting instrument includes physical, psychological, social and environmental domains.The CFAI showed good fit indices and a high reliability. The underlying structure of the CFAI demon-strates the multidisciplinary nature of frailty. Using the CFAI can stimulate nurses and other communityhealthcare providers toward a more holistic approach of frailty and can guide them to take appropriateinterventions to prevent adverse outcomes such as disabilities or hospitalization.
� 2013 Mosby, Inc. All rights reserved.
1. Introduction
Population aging, a phenomenon in which the distribution ofa country’s population shifts toward older ages, is affecting allWestern societies.1 To cope with the challenges of a rapidly agingpopulation, several governments have substantially changed theirpolicies on elderly care. Older people, even if they are frail anddisabled, are motivated to stay in their own homes and environmentfor as long as possible. As a consequence, the early detection offrail community-dwelling older persons becomes a significantissue. Several instruments for detection exist, but most havea biomedical emphasis. In most cases, frail older people are detectedin clinical settings by screening biomedical indicators (e.g., Friedet al2). However, some efforts have been made to broaden theconcept by adding psychological3 and social indicators4 or by usingthese detection instruments in other settings.5 Indeed, screen-ing all community-dwelling older persons clinically for frailtywill be impossible, particularly for organizational and financial
h and Social Work, Universitym. Tel.: þ32 93212138.itte).
ll rights reserved.
consequences. Moreover, by placing the most emphasis onbiomedical indicators, the multidimensional character of frailty isdisregarded. According to Gobbens et al,5 an overly narrow definitionof frailty, focusing exclusively on physical problems in older people,can lead to the fragmentation of care, thereby jeopardizing theattention for the whole person. Problems such as poor-qualityhousing,6 deprived environments and changing social networks7
are neglected. Indeed, while aging, older people will dependhighly on the sustainability of their own housing conditions, theirenvironment and their network.8 If problems arise within these,older people can also become frail.
Against this background, this article aims to broaden the body ofknowledge regarding the concept of frailty by introducing a multi-dimensional, self-administrated instrument capturing 4 domains offrailty: physical, psychological, social and environmental. To thebest of our knowledge, this study is the first to include the envi-ronmental domain in the assessment of frailty.
1.1. A model for measuring frailty in older persons
As mentioned above, most frailty assessments are dominated bybiomedical indicators. Clinicians, for example, use and evaluate

N. De Witte et al. / Geriatric Nursing 34 (2013) 274e281 275
a wide range of physical problems. This article aims to providea correction to what has been termed the biomedical domination9
by using a multidimensional approach to measure the concept offrailty. This approach is supported by studies showing that whenolder women are asked how they perceive frailty, most of theiranswers are linked not only to physical descriptions (e.g., beingsmall, skinny, rather immobile) but also to contextual, social andemotional problems. This observation suggests that older peoplethemselves may have other impressions about frailty than clini-cians.10 Some scholars therefore include psychological11 and socialindicators12 in addition to the biomedical indicators to measure theconcept. Others consider frailty from a live course perspective.Gobbens’12 model of frailty, for example, expresses relationshipsbetween life-course determinants, diseases, frailty and adverseoutcomes. Based on this model, the Tilburg Frailty Indicator5
was developed, which is an instrument for measuring frailty incommunity-dwelling older persons in three domainsdphysical,psychological and social.
The model of Gobbens was used as the basis for the develop-ment of the Comprehensive Frailty Assessment Instrument (CFAI),which will be further elaborated in this paper. To meet Markle-Reid’s and Browne’s13 guidelines regarding multidimensionality infrailty, Gobbens’ model (see Fig. 1), which was based on a model ofBergman, was used and adapted by introducing the environmentaldomain of frailty in addition to the physical, psychological andsocial domains. To the best of our knowledge, the environment inwhich an older individual lives has never been assessed in frailtyresearch. Schröder-Butterfill,6 however, indicates that older peoplecan be confronted with environmental challenges, such as poor-quality housing. Moreover, as older people spend more time athome and in the vicinity of their homes, they will become highlydependent on the sustainability of their own housing conditionsand on the spatial context therein.8 The relationship of an agingindividual with this spatial context is assumed to be essential andto contribute to an aging individual’s quality of life.14 Similarly,Wahl et al15 argue that the maintenance of independence in theactivities of daily life (ADL) and well-being-related outcomes inlater life are also related to the utilization and optimization of
Fig. 1. The model of frailty used during the develo
environmental resources. Evidence also suggests that the proximityof amenities and services may promote health either directly orindirectly through the possibilities they provide for people to livehealthy lives.16
In addition to the inclusion of the environmental domain, fiveother restrictions and requirements were taken into account in thedevelopment of the CFAI. First, the new instrument should not beage related as that would suggest a negative and stereotypicalview of aging.6 Therefore, age was not included as an indicator offrailty but was viewed as a life-course determinant (see Fig. 1).Second, the lived experiences9 of older persons themselves wereincluded. Older people were invited to give their judgment aboutthe physical, psychological, social and environmental domains offrailty. Meeting these requirements and expanding the modelbeyond biomedical variables will withstand Robertson’s remarksregarding the medicalization and gerontologization of old age,where aging is reconceptualized as a new ‘medical space’.17 Third,as the new self-reporting instrument focuses on frailty in olderpersons, the instrumentmust be user friendly, not too long and notcomplicated. Fourth, the time and effort needed to complete thetask must be limited. Finally, the accessibility and usability of theinstrument should also be a priority, in particular with regards tofont size, layout, language and time taken to complete the survey.
2. Methods
2.1. Data collection and participants
For this validation study, the data originating from the BelgianAgeing Studies (BAS) were used. The BAS, which has been con-ducted in the Dutch-speaking part of Belgium since 2004, collectsinformation on community-dwelling older people aged 60 andover about their perceptions on various aspects related to thequality of life and living conditions in later life through a highlystructured survey. In 2006, the indicators of the CFAI were intro-duced in the questionnaire. In addition to these questions,descriptive information, such as age, gender, income, maritalstatus and educational level, were obtained. All questions were
pment of the CFAI, based on Gobbens et al.12
N. De Witte et al. / Geriatric Nursing 34 (2013) 274e281276
included in a self-administered questionnaire. All questionnaireswere entered using Microsoft Access, and the analyses were per-formed using IBM SPSS 20 and IBM SPSS Amos 18 (IBM, SPSS,Armonk, NY: IBM Corp).
To maximize the response, an interview-design was developed.Through an intensive recruitment campaign, older volunteers whowere willing to interview respondents were identified. Aftertraining, those volunteers invited their assigned persons toparticipate, handed over the self-administered questionnaire andprovided help when needed. When the respondents refused orwere hampered to fill-in the questionnaire, the volunteers receivedreplacement addresses in the same quota category to obtain theintended sample size. The respondents were free to participate, andtheir anonymity was guaranteed. The respondents were assured oftheir right to refuse to answer and of the privacy of their responses.A more complete description of the interview-design can be foundin Verté et al.18 Since the project started, older respondents living in142 municipalities have been interviewed. In each municipality,addresses were randomly selected from population registries.The sample was stratified, using quotas for gender and age (60e69,70e79 and 80þ years) to ensure that the sample matched themakeup of the underlying population in the community. This typeof sampling ensured that the 80þ age group was adequately rep-resented. The sampling fraction depended on the size of themunicipality and varied between N ¼ 182 and N ¼ 1592, and thefirst response rate was between 65 and 85%.
Data screening of this sample (with CFAI indicators, N ¼ 54,243)to identify possible response patterns and outliers andmissing dataanalysis were performed. Respondents who presented question-able response patterns or did not respond to at least one of the 31indicators were withdrawn, resulting in a final sample of 33,629respondents, which represents 62% of the original sample.
2.2. Measures and statistical strategy
2.2.1. MeasuresThe CFAI captures frailty on 4 domains: physical, psychological,
social and environmental. For the “physical domain of frailty” in theCFAI, limitations in physical activities because of health problemswere included, which contrasts with Gobbens et al,5 who usedmore biomedical indicators such as nutrition, mobility, physicalactivity, strength, endurance, balance and sensory functions. Theindex of general physical health from the ‘MOS Short-form GeneralHealth Survey’19 was used for this purpose. The participants wereasked to indicate how long (not at all, 3 months or less or more than3 months) they had been hampered by their health status in per-forming the following activities: ‘Very demanding activities likelifting up heavy objects’, ‘Less demanding activities like carryingshopping bags’, ‘Walking up a hill/stairs’, ‘Bending or lifting’, ‘Goingfor a walk’ and ‘Activities of daily living like eating, dressing ortaking a shower’. As mentioned above, by introducing the healthmeasurement instead of diseases or limitations, the negativestereotype that associates aging with disease was eliminated.
For the “psychological domain of frailty” in the CFAI, twomeasurements were used. First, a 6 item mood-disorder index wasused. Research has shown that even minor depressive symptomsthat do not meet the diagnostic criteria for depression are associ-ated with the increased use of health services20,21 and increasedmortality.22e24 More than 10% of older adults seen in a primary caresetting should suffer from minor or major depressive disorders,25
making it an important issue for detection.26 As depression mustbe evaluated by clinicians, a mood-disorder index to detect distresswas used.
The participants were asked to what extent they agree withitems related to mood-disorders: ‘Troubles with sleeping’, ‘Feeling
unhappy’, ‘Losing self-confidence’, ‘Unable to cope with problems’,‘Feeling pressure’ and ‘Feeling worth nothing anymore’. Each itemranged on a 5-point Likert scale from completely disagree (1) tocompletely agree (5), with higher scores reflecting strongerpsychological problems. Second, as mentioned above, frailty wasassociated with emotional problems by the older persons them-selves.10 Therefore, these were assessed using 3 propositions of theshortened Loneliness Scale27measuring emotional problems. Thesepropositions were the following: ‘I experience a general sense ofemptiness’, ‘I miss having people around me’ and ‘I often feelrejected’. All propositions ranged on a 5-point Likert scale fromcompletely disagree (1) to completely agree (5), with higher scoresreflecting more severe problems.
The “social domain of frailty” included twomeasurements. First,similar to Gobbens,5 social loneliness and social support wereincluded but operationalized differently. Social loneliness wasmeasured through 3 propositions of the shortened LonelinessScale.27 Those propositions were the following: ‘There are plenty ofpeople I can lean onwhen I have problems’, ‘There are many peopleI can trust completely‘ and ‘There are enough people I feel close to’.Prior to the analysis, these items were negatively recoded.Furthermore, to obtain an insight into the social support, theparticipants were asked which of the following persons they couldrely on for help if necessary. Based on an exploratory factor analysiswith Varimax rotation, the members of the respondents’ socialnetwork were classified into 3 groups. Social Support Network 1consisted of partner, son and daughter-in-law. Daughter, son-in-law and grandchildren were classified in Social Support Network2, while brother or sister (-in-law), family, neighbors and friendswere categorized in Social Support network 3. For each indicatorthe number of persons the participants could rely on was counted.Afterward, these scores were recoded, with higher scores referringto a decreased network.
Finally, the “environmental domain” consisted of propositionsregarding the push factors of the respondent’s actual housing andenvironmental conditions. Push factors28 refer to the conditions ofa physically inadequate environment, threatening the mobility ofaging individuals due to a lack of comfort. To capture these pushfactors, the following indicators were used: ‘My house is in a badcondition’, ‘I have to walk stairs before entering my house’, ‘Thethresholds are too high both inside and outside my house’, ’Thereare stairs in my house’, ‘I have to walk up stairs to go to the toilet’,‘My house is not comfortable’, ‘It is difficult to heath my house’,‘There is insufficient comfort in my house’, ‘I do not like theneighborhood’ and ‘The distance to facilities is too far’. All itemscould be scored on a 5-point Likert scale, ranging from stronglydisagree to strongly agree, with higher scores demonstrating morehousing and environmental problems. With the thirty-one indica-tors mentioned above, the CFAI instrument was constructed (seeFig. 2).
2.2.2. Statistical strategyTo determine the construct validity of the CFAI by confirmatory
factor analysis, the data were screened for outliers, responsepatterns, missing data and sampling adequacy. Then, an explor-atory factor analysis was conducted to explore the underlyingtheoretical structure. Third, to assess construct validity of thedifferent measurements, first order confirmatory factor analyseswere performed. Fourth, all indicators were introduced in thetheoretical model (see Fig. 2), and a second-order confirmatoryfactor analysis was used to evaluatewhether themodel fits the datawell. All confirmatory factor analyses were performed in IBM SPSSAmos 18.0 (Arbuckle 1983e2009).
To evaluate whether the theoretical model fit the data, differenttypes of fit indices were reported. Working with a large sample set

Fig. 2. The theoretical Comprehensive Frailty Assessment Instrument.
N. De Witte et al. / Geriatric Nursing 34 (2013) 274e281 277
requires attention to the effects of sample size. Therefore, fit indiceswere chosen that are insensitive to sample size: the Root MeanSquare Error of Approximation (RMSEA), the Comparative Fit Index(CFI) and the Tucker-Lewis index (TLI). First, the RMSEA is a widelyused and recommended index.29 Models with RMSEA values lessthan .05 indicate a good fit, and values as high as .08 representa reasonable fit.30e32 RMSEA is insensitive to sample size.29,33 Inaddition to the RMSEA, the lower boundary (RMSEA-LO) and upperboundary (RMSEA-HI) of a two-sided 90% confidence interval werecalculated. Second, the CFI assesses the fit to a null model usingnon-centrality parameters and ranges from 0 to 1, with values of .9or greater indicating a good fit.34 The CFI is also insensitive tosample size.33 Third, the TLI compares a proposed model’s fit toa nested baseline or null model and measures parsimony byassessing the degrees of freedom from the proposed model to thedegrees of freedom of the null model. It is resilient against samplesize variations.33 In the past, the cut-off for the TLI was set at .90,but recently there appears to be consensus that this value shouldincrease to .95.35 Widely used fit indices such as the c2 test,goodness-of-fit index (GFI), adjusted goodness-of-fit (AGFI) andnormed fit index (NFI)36 tend to be influenced by sample size37 andwere therefore not used as fit indices herein. Finally, internalconsistency was assessed through Cronbach’s a coefficients. A scalewas considered adequate if the alpha value was at least .50.38
3. Results
3.1. Preliminary analysis
The sample was screened for items with limited discriminatingcharacteristics or with high positive or negative kurtosis andskewness values. As no such items were found, all items could be
included. Furthermore, no problems with multicollinearity weredetected. Finally, the ‘Kaiser-Meyer-Olkin measure of samplingadequacy’ (.884) was considered to be good, and Bartlett’s test ofsphericity was significant (p < .001), indicating that all items couldbe included and that the factor analysis was appropriate.39
3.2. Respondents characteristics
The age range of the respondents was 60e107 years, witha median of 70 years. Additionally, 51.0% of the respondents werefemale, 39.9% had no or only primary education, and 18.9% had anincome less than V1000. Regarding the marital status, 71.8% of therespondents were married, 19.9% were widowed, and 3.2% weredivorced.
3.3. CFAI: testing the measurements
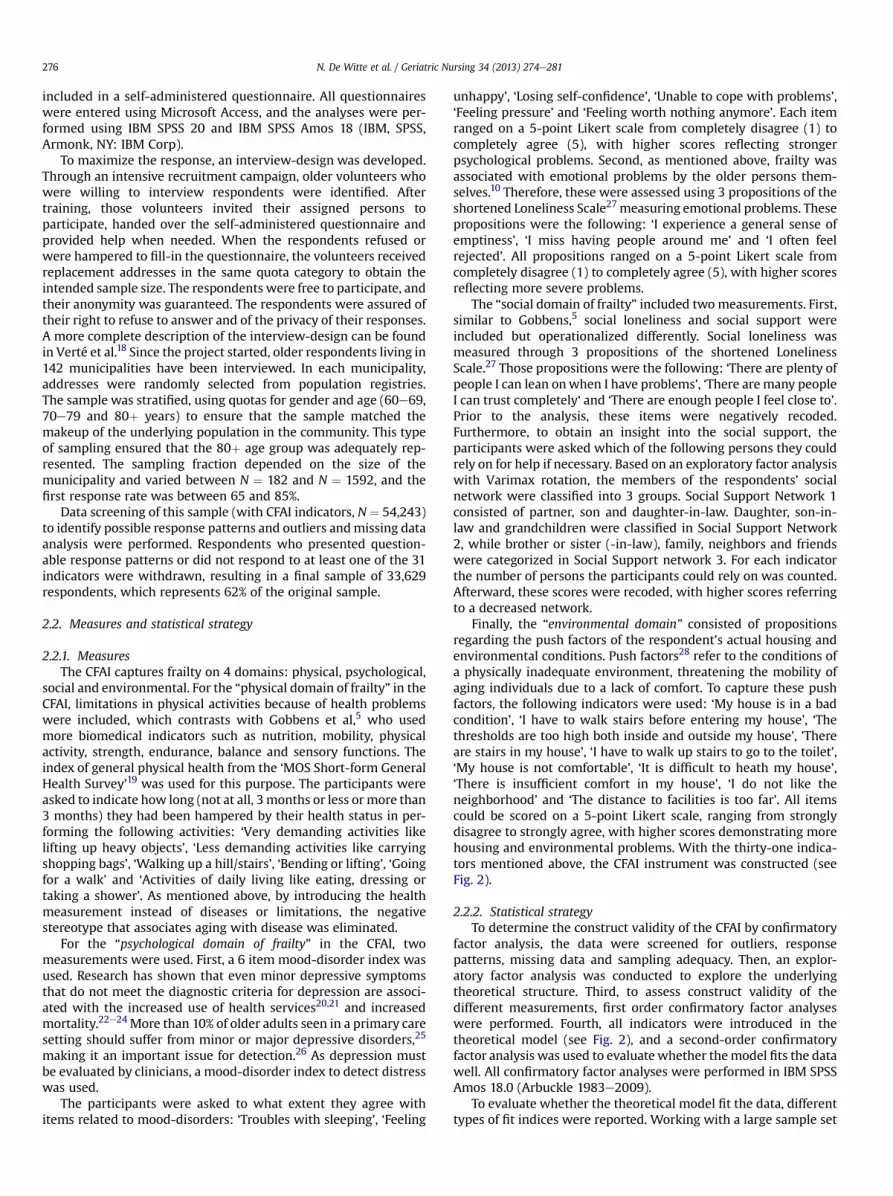
An exploratory factor analysis was performed on the differentmeasurements of the CFAI. Exploratory factor analysis is a methodused to uncover the underlying structure of a set of variables and iscommonly used in scale development. As shown in Table 1, allfactor-loadings were greater than .30. Next, a reliability analysiswas used to evaluate the internal consistency and the totalexplained variance. The reliability ranged from mediocre for thesocial support network (Cronbach’s a ¼ .527) to high for thephysical limitations (Cronbach’s a ¼ .891). The total explainedvariance ranged from 34.5% to 70% (see Table 1).
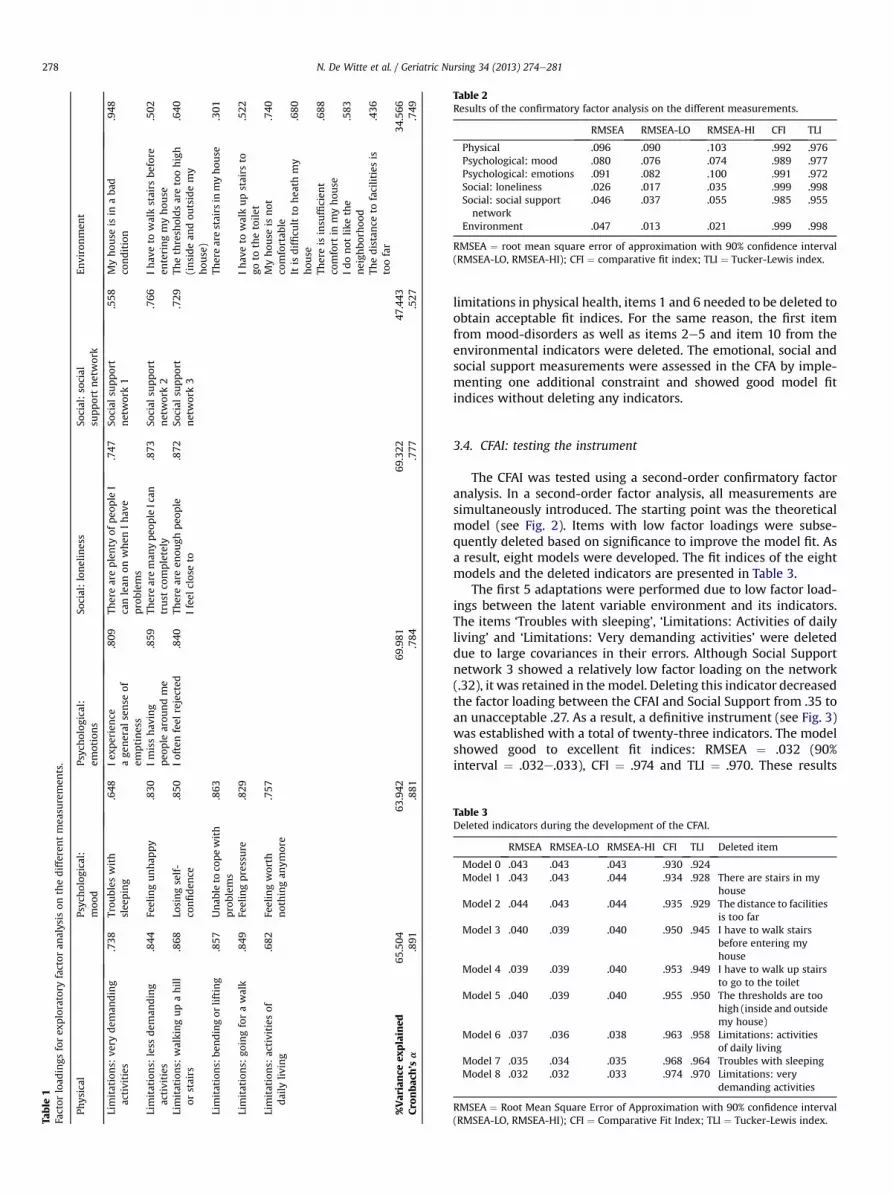
As the results of the exploratory factor analysis were shown tobe satisfactory, a confirmatory factor analysis was performed on allmeasurements. Confirmatory factor analysis is used to test whetherthe data fit a hypothesized measurement model. The results of thisconfirmatory factor analysis are shown in Table 2. For the
Table
1Factor
load
ings
forex
ploratory
factor
analysis
onthedifferentmea
suremen
ts.
Physical
Psyc
holog
ical:
moo
dPsyc
holog
ical:
emotions
Social:loneliness
Social:social
supportnetwork
Environmen
t
Limitations:
very
dem
anding
activities
.738
Trou
bles
with
slee
ping
.648
Iex
perience
age
neral
sense
ofem
ptiness
.809
Thereareplenty
ofpeo
ple
Icanlean
onwhen
Ihav
eproblem
s
.747
Social
supp
ort
network1
.558
Myhou
seis
inaba
dco
ndition
.948
Limitations:
less
dem
anding
activities
.844
Feelingunhap
py
.830
Imisshav
ing
peo
ple
arou
ndme
.859
Thereareman
ypeo
ple
Ican
trust
completely
.873
Social
supp
ort
network2
.766
Ihav
eto
walkstairs
before
enteringmyhou
se.502
Limitations:
walkingupahill
orstairs
.868
Losingself-
confiden
ce.850
Ioftenfeel
rejected
.840
Thereareen
ough
peo
ple
Ifeel
closeto
.872
Social
supp
ort
network3
.729
Thethresh
oldsaretoohigh
(insidean
dou
tsidemy
hou
se)
.640
Limitations:
bendingor
lifting
.857
Unab
leto
copewith
problem
s.863
Therearestairs
inmyhou
se.301
Limitations:
goingforawalk
.849
Feelingpressure
.829
Ihav
eto
walkupstairs
togo
tothetoile
t.522
Limitations:
activities
ofdaily
living
.682
Feelingworth
nothingan
ymore
.757
Myhou
seis
not
comfortab
le.740
Itis
difficu
ltto
hea
thmy
hou
se.680
Thereis
insu
fficien
tco
mfort
inmyhou
se.688
Idonot
likethe
neigh
borh
ood
.583
Thedistance
tofacilitiesis
toofar
.436
%Variance
explained
65.504
63.942
69.981
69.322
47.443
34.566
Cronbac
h’sa
.891
.881
.784
.777
.527
.749
Table 2Results of the confirmatory factor analysis on the different measurements.
RMSEA RMSEA-LO RMSEA-HI CFI TLI
Physical .096 .090 .103 .992 .976Psychological: mood .080 .076 .074 .989 .977Psychological: emotions .091 .082 .100 .991 .972Social: loneliness .026 .017 .035 .999 .998Social: social supportnetwork
.046 .037 .055 .985 .955
Environment .047 .013 .021 .999 .998
RMSEA ¼ root mean square error of approximation with 90% confidence interval(RMSEA-LO, RMSEA-HI); CFI ¼ comparative fit index; TLI ¼ Tucker-Lewis index.
Table 3Deleted indicators during the development of the CFAI.
RMSEA RMSEA-LO RMSEA-HI CFI TLI Deleted item
Model 0 .043 .043 .043 .930 .924Model 1 .043 .043 .044 .934 .928 There are stairs in my
houseModel 2 .044 .043 .044 .935 .929 The distance to facilities
is too farModel 3 .040 .039 .040 .950 .945 I have to walk stairs
before entering myhouse
Model 4 .039 .039 .040 .953 .949 I have to walk up stairsto go to the toilet
Model 5 .040 .039 .040 .955 .950 The thresholds are toohigh (inside and outsidemy house)
Model 6 .037 .036 .038 .963 .958 Limitations: activitiesof daily living
Model 7 .035 .034 .035 .968 .964 Troubles with sleepingModel 8 .032 .032 .033 .974 .970 Limitations: very
demanding activities
RMSEA ¼ Root Mean Square Error of Approximation with 90% confidence interval(RMSEA-LO, RMSEA-HI); CFI ¼ Comparative Fit Index; TLI ¼ Tucker-Lewis index.
N. De Witte et al. / Geriatric Nursing 34 (2013) 274e281278
limitations in physical health, items 1 and 6 needed to be deleted toobtain acceptable fit indices. For the same reason, the first itemfrom mood-disorders as well as items 2e5 and item 10 from theenvironmental indicators were deleted. The emotional, social andsocial support measurements were assessed in the CFA by imple-menting one additional constraint and showed good model fitindices without deleting any indicators.
3.4. CFAI: testing the instrument
The CFAI was tested using a second-order confirmatory factoranalysis. In a second-order factor analysis, all measurements aresimultaneously introduced. The starting point was the theoreticalmodel (see Fig. 2). Items with low factor loadings were subse-quently deleted based on significance to improve the model fit. Asa result, eight models were developed. The fit indices of the eightmodels and the deleted indicators are presented in Table 3.
The first 5 adaptations were performed due to low factor load-ings between the latent variable environment and its indicators.The items ‘Troubles with sleeping’, ‘Limitations: Activities of dailyliving’ and ‘Limitations: Very demanding activities’ were deleteddue to large covariances in their errors. Although Social Supportnetwork 3 showed a relatively low factor loading on the network(.32), it was retained in themodel. Deleting this indicator decreasedthe factor loading between the CFAI and Social Support from .35 toan unacceptable .27. As a result, a definitive instrument (see Fig. 3)was established with a total of twenty-three indicators. The modelshowed good to excellent fit indices: RMSEA ¼ .032 (90%interval ¼ .032e.033), CFI ¼ .974 and TLI ¼ .970. These results

Fig. 3. The finalized Comprehensive Frailty Assessment Instrument.
N. De Witte et al. / Geriatric Nursing 34 (2013) 274e281 279
indicate that the model fits the data well. Emotions contributedmost to frailty (.80), followed by mood-disorders (.69) and limita-tions in physical health (.36). Social (.33), Social Support (.35) andEnvironment (.32) all contributed to frailty. Finally, we examinedthe reliability of the CFAI. The Cronbach’s a of the entire scale was.812, explaining 63.6% of the variance in frailty.
4. Discussion
The focus of the present study was to develop and assess thepsychometric properties of a new multidimensional frailty instru-ment including four domains of frailty; physical, psychological,social and environmental. This instrument, the CFAI, containstwenty-three indicators and demonstrates a high overall internalconsistency and high consistency of its scales, thus supporting thevalidity and reliability of the instrument and highlighting to themultidimensionality of frailty as described by Markle-Reid andBrowne.13 The CFAI has been proven to be internally consistent,with a Cronbach’s a of .812 that explains 63.6% of the variance infrailty.
This study provides evidence for the contribution of all fourdomains to frailty. The psychological domain added the most tofrailty. These results confirm what several studies have alreadyaddressed,13,40e42 that frailty is more than just a purely physicalphenomenon. Although the contribution of environmental indica-tors to frailty is rather moderate, it contributes almost as much asthe social indicators or physical indicators. Environmental indica-tors include the bad condition of the house, the house beinguncomfortable, problems with heating the house and aversionagainst the neighborhood. These factors are in line with Walker,14
Costa-Font8 and Wahl,15 who all highlighted the importance ofthe spatial context and environmental resources on which anindividual depends when aging. As suggested by Crooks,7 socialsupport also contributed to frailty.
Some items for the physical, psychological and environmentaldomains did not fit as anticipated in the theoretical model. To thebest of our knowledge, there has been no prior research regarding
these items. As a consequence, possible explanations for the non-fitof these items were sought. For the physical limitations, verydemanding activities such as lifting heavy objects and the activitiesof daily living were not included in the instrument. For the verydemanding activities, a possible explanation may be that onlycommunity-dwelling older persons were interviewed. Indeed,people with severe physical problems are often institutionalizedand were thus not included in our sample. Activities of daily livingwere also not included in the CFAI. Once again, this omission can bea consequence of the inclusion criteria of the sample. Anotherexplanation is that for activities of daily living, substitute servicesare available. As Belgium has a well-developed network ofcommunity nurses, older people receiving support for their activ-ities of daily living may not feel frail anymore. A longitudinal studyfor this issue could confirm this hypothesis.
For the mood-disorders, trouble with sleeping was not included.In the environmental assessment, five indicators were notincluded: ‘I have to walk stairs before entering my house’, ‘Thethresholds are too high both inside and outside my house’, ’Thereare stairs in my house’, ‘I have to walk up stairs to go to the toilet’and ‘The distance to facilities is too far’. All of the excluded indi-cators were connected to mobility in and around the house. Apossible explanation for the deletion of these items in the second-order confirmatory factor analysis can be that those mobilityproblems are assessed by items 2e5 from the physical domain.Indeed, when someone indicated having problems with lessdemanding activities such as carrying shopping bags or going fora walk, he or she also had problems with the distance to facilitiesbeing too far.
The CFAI is developed as a screening instrument for assessingfrailty in the community and does not rely on clinical judgments byhigh skilled caregivers. Indeed, the CFAI can be filled in by the olderperson him/herself or his/her carer or if this is no longer possible,also by lower skilled caregivers. The great advantage of the CFAI isthat it is a fast, easy and inexpensive assessment tool for use in thecommunity. Most frailty instruments are based on clinical judg-ments and are therefore not directly applicable in community care.

N. De Witte et al. / Geriatric Nursing 34 (2013) 274e281280
Moreover, as the underlying structure of the CFAI demonstrates themultidisciplinary nature of frailty, the use of the CFAI can stimulatenurses and other community healthcare providers toward a moreholistic approach to frailty and can guide them toward taking theappropriate interventions to prevent adverse outcomes such asdisabilities or hospitalization.
4.1. Strengths and limitations
The CFAI has some advantages over most other frailty in-struments. The scale is not too long. It comprises 23 items andcaptures physical, psychological, social and environmental aspectsof frailty, thereby changing the vision toward frailty as proposed byMarkle-Reid,13 Hogan43 and Levers et al.44
The major strength of this study is the large sample size uponwhich our validation results are based. The analyses were per-formed on a large dataset of the Belgian Ageing Studies, witha better size and representativeness than most studies capturingfrailty in the aged. Moreover, the dataset was of a high quality witha stratified representative sample (for age and gender) of 33,629community-dwelling older persons.
Finally, this study has contributed to our knowledge of frailtywith respect to emotional loneliness, social support and the envi-ronmental domain, thereby extending the concept of frailty towarda more holistic measure.
Despite the strengths of the present study, there are somelimitations. A first shortcoming might be that only Dutch-speakingBelgians have participated. Cross-validating the CFAI by includinginternational samples would enrich the external validity of thismeasurement instrument. Second, validating the scale againsta gold standard would strengthen the evidence that the CFAIactually captures frailty. Third, although the overall internalconsistency (Cronbach’s a ¼ .81) and explained variance (63.58%)are high, some factor loadings proved to be mediocre. Futureresearch might offer further insights here.
4.2. Implications and directions for further research
This study provides support for using the CFAI as a measure offrailty in community-dwelling older persons. As mentioned above,further research should include the validation of the CFAI againsta gold standard. To obtain more insight into frailty-related prob-lems, research should also focus on its individual and contextualdeterminants. Further research could also focus on the predictivevalidity of the CFAI for adverse outcomes (see Fig. 1) and addressthe question of to what extent the environmental aspects of frailtypredict these outcomes.
Conflict of interest
None of the authors have any conflicting interests to report.
Ethical approval
This study was conducted according to the ethical guidelineslaid down in the Declaration of Helsinki. Because no experimentson humans were conducted, no ethics committee was involved.
Acknowledgments
The Research fund of the University College Ghent is acknowl-edged for its financial contribution.
References
1. Eurostat. Europe in FiguresdEurostat Yearbook 2011; 2011.2. Fried LP, Ferruci L, Darer J, Williamson JD, Anderson G. Untangling the concepts
of disability, frailty, and comorbidity: implications for improved targeting andcare. J Gerontol A Biol Sci Med Sci. 2004;59:255e263.
3. Puts M, Lips P, Deeg D. Static and dynamic measures of frailty predicted declinein performance-based and self-reported physical functioning. J Clin Epidemiol.2005;58:1188e1198.
4. Rolfson DB, Majumdar SR, Tsuyuki RT, Tahir A, Rockwood K. Validity andreliability of the Edmonton Frail Scale. Age Ageing. 2006;35:526e529.
5. Gobbens RJ, van Assen MA, Luijkx KG, Wijnen-Sponselee MT, Schols JM. TheTilburg Frailty Indicator: psychometric properties. J Am Med Dir Assoc. 2010;11:344e355.
6. Schröder-Butterfill E, Marianti R. A framework for understanding old-agevulnerabilities. Ageing Soc. 2006;26:9e35.
7. Crooks D. Development and Testing of the Elderly Social Vulnerability Index(ESVI): A Composite Indicator to Measure Social Vulnerability in the JamaicanElderly Population. Miami: Florida International University; 2009.
8. Costa-Font J, Elvira D, Mascarilla-Miro O. ‘Ageing in Place’? Exploring elderlypeople’s housing preferences in Spain. Urban Stud. 2009;46:295e316.
9. Grenier A. Constructions of frailty in the English language, care practice and thelived experience. Ageing Soc. 2007;27:425e444.
10. Grenier A, Hanley J. Older women and ‘Frailty’: aged, gendered and embodiedresistance. Curr Sociol. 2007;55:211e228.
11. Bravell M, Westerlind B, Midlöv P, et al. How to assess frailty and the needfor care? Report from the Study of Health and Drugs in the Elderly(SHADES) in community dwellings in Sweden. Arch Gerontol Geriatr.2011;53:40e45.
12. Gobbens RJ, Luijkx KG, Wijnen-Sponselee MT, Schols JM. Toward a conceptualdefinition of frail community dwelling older people. Nurs Outlook. 2010;58:76e86.
13. Markle-Reid M, Brown G. Conceptualizations of frailty in relation to olderadults. J Adv Nurs. 2003;44:58e68.
14. Walker A. A European perspective on quality of life in old age. Eur J Ageing.2005;2:2e12.
15. Wahl H-W, Schilling O, Oswald F, Iwarsson S. The home environment andquality of life-related outcomes in advanced old age: findings of the ENABLE-AGE project. Eur J Ageing. 2009;6:101e111.
16. Buffel T, Phillipson C, Scharf T. Ageing in urban environments: developing age-friendly cities. Crit Soc Pol; 2012; http://dx.doi.org/10.1177/0261018311430457.Published online before print May 22, 2012.
17. Robertson ANN. Beyond apocalyptic demography: towards a moral economy ofinterdependence. Ageing Soc. 1997;17:425e446.
18. Verté D, De Witte N, De Donder L. Schaakmat of aan zet. Monitor voor lokaalouderenbeleid in Vlaanderen. [Guidelines for Local Policy Towards Older People inFlanders]. Brugge: Vanden Broele; 2007 [In Dutch].
19. Kempen GI. Het meten van de gezondheidstoestand van ouderen; een toe-passing van de Nederlandse versie van de MOS-schaal. [Measuring healthstatus in the aged. An application of the Dutch version of the MOS]. TijdschrGerontol Geriatr; 1992;132e140 [in Dutch].
20. Johnson J, Weissman MM, Klerman GL. Service utilization and social morbidityassociated with depressive symptoms in the community. JAMA. 1992;267:1478e1483.
21. Unutzer J, Patrick DL, Simon G, et al. Depressive symptoms and the cost ofhealth services in HMO patients aged 65 years and older. A 4-year prospectivestudy. JAMA. 1997;277:1618e1623.
22. Whooley MA, Browner WS. Association between depressive symptoms andmortality in older women. Study of Osteoporotic Fractures Research Group.Arch Intern Med. 1998;158:2129e2135.
23. Penninx BW, Guralnik JM, Ferrucci L, Simonsick EM, Deeg DJ, Wallace RB.Depressive symptoms and physical decline in community-dwelling olderpersons. JAMA. 1998;279:1720e1726.
24. Takeida K, Nishi M, Miyake H. Zung’s depression scale as a predictor of dea-th in elderly people: a cohort study in Hokkaido, Japan. J Epidemiol. 1999;9:240e244.
25. Lyness JM, Yu Q, Tang W, Tu X, Conwell Y, et al. Risks for depression onset inprimary care elderly patients: potential targets for preventive interventions.Am J Psychiatry. 2009;166:1375e1383.
26. Park M, Unutzer J. Geriatric depression in primary care. Psychiatr Clin North Am.2011;34:469e487. ix-x.
27. de Jong-Gierveld J, van Tilburg T. De ingekorte schaal voor algemene, emo-tionele en sociale eenzaamheid. [The shortened scale for overall, emotional andsocial loneliness]. Tijdschr Gerontol Geriatr. 2008;39:4e15 [in Dutch].
28. Stimson RJ, McCrea R. A pushepull framework for modelling the relocation ofretirees to a retirement village: the Australian experience. Environ Plann.2004;36:1451e1470.
29. Brown T. Confirmatory Factor Analysis for Applied Research. New York, London:The Guilford Press; 2006.
30. Browne MW, Cudeck R. Alternative ways of assessing model fit. In: Bollen KA,Long JS, eds. Testing Structural Equation Models. Newbury Park, CA: Sage; 1993:136e162.
31. Hair J, Black W, Babin B, Anderson RE. Multivariate Data Analysis. Upper SaddleRiver, New Jersey: Prentice Hall; 2007.

N. De Witte et al. / Geriatric Nursing 34 (2013) 274e281 281
32. Browne MW, Cudeck R. Alternative ways of assessing model fit. Socio Meth Res.1992;21:230e258.
33. Hoe S. Issues and procedures in adopting structural equation modeling tech-nique. J Appl Quant Meth. 2008;3:76e83.
34. Bentler PM. Comparative fit indexes in structural model. Psychol Bull.1988;107:238e246.
35. Hu LT, Bentler PM. Cutoff criteria for fit indexes in covariance structure anal-ysis: conventional criteria versus new alternatives. Struct Equ Modeling.1999;6:1e55.
36. Hu L-T, Bentler PM. Evaluating model fit. In: Hoyle RH, ed. Structural EquationModeling: Concepts, Issues and Applications. Thousand Oaks, CA: Sage; 1995:76e99.
37. Tanguma J. Effects of sample size on the distribution of selected fit indices:a graphical approach. Educ Psychol Meas. 2001;61:759e776.
38. Bowling A. Research Methods in Health. Berkshire: Open University PressMcGraw-Hill International; 2009.
39. Field A. Discovering Statistics Using SPSS. ed. Los Angeles, London, New Delhi,Singapore, Washington DC: Sage; 2009.
40. Gobbens RJ, Luijkx KG, Wijnen-Sponselee MT, Schols JM. Towardsan integral conceptual model of frailty. J Nutr Health Aging. 2010;14:175e181.
41. Grundy E. Ageing and vulnerable elderly people: European perspectives. AgeingSoc; 2006;105e134.
42. Walston J, Hadley EC, Ferrucci L, et al. Research agenda for frailty in olderadults: toward a better understanding of physiology and etiology:summary from the American Geriatrics Society/National Institute on AgingResearch Conference on Frailty in Older Adults. J Am Geriatr Soc. 2006;54:991e1001.
43. Hogan DB, MacKnight C, Bergman H. Models, definitions, and criteria of frailty.Aging Clin Exp Res. 2003;15:1e29.
44. Levers M-J, Estabrooks CA, Ross Kerr JC. Factors contributing to frailty: litera-ture review. J Adv Nurs. 2006;56:282e291.
Related Documents