The Complete Mitochondrial Genome of Gossypium hirsutum and Evolutionary Analysis of Higher Plant Mitochondrial Genomes Guozheng Liu 1. , Dandan Cao 2. , Shuangshuang Li 1. , Aiguo Su 1 , Jianing Geng 2 , Corrinne E. Grover 3 , Songnian Hu 2 *, Jinping Hua 1 * 1 Department of Plant Genetics and Breeding, College of Agronomy and Biotechnology, Key Laboratory of Crop Heterosis and Utilization of Ministry of Education, Beijing Key Laboratory of Crop Genetic Improvement, China Agricultural University, Beijing, China, 2 CAS Key Laboratory of Genome Sciences and Information, Beijing Institute of Genomics, Chinese Academy of Sciences, Beijing, China, 3 Department of Ecology, Evolution, and Organismal Biology, Iowa State University, Ames, Iowa, United States of America Abstract Background: Mitochondria are the main manufacturers of cellular ATP in eukaryotes. The plant mitochondrial genome contains large number of foreign DNA and repeated sequences undergone frequently intramolecular recombination. Upland Cotton (Gossypium hirsutum L.) is one of the main natural fiber crops and also an important oil-producing plant in the world. Sequencing of the cotton mitochondrial (mt) genome could be helpful for the evolution research of plant mt genomes. Methodology/Principal Findings: We utilized 454 technology for sequencing and combined with Fosmid library of the Gossypium hirsutum mt genome screening and positive clones sequencing and conducted a series of evolutionary analysis on Cycas taitungensis and 24 angiosperms mt genomes. After data assembling and contigs joining, the complete mitochondrial genome sequence of G. hirsutum was obtained. The completed G.hirsutum mt genome is 621,884 bp in length, and contained 68 genes, including 35 protein genes, four rRNA genes and 29 tRNA genes. Five gene clusters are found conserved in all plant mt genomes; one and four clusters are specifically conserved in monocots and dicots, respectively. Homologous sequences are distributed along the plant mt genomes and species closely related share the most homologous sequences. For species that have both mt and chloroplast genome sequences available, we checked the location of cp-like migration and found several fragments closely linked with mitochondrial genes. Conclusion: The G. hirsutum mt genome possesses most of the common characters of higher plant mt genomes. The existence of syntenic gene clusters, as well as the conservation of some intergenic sequences and genic content among the plant mt genomes suggest that evolution of mt genomes is consistent with plant taxonomy but independent among different species. Citation: Liu G, Cao D, Li S, Su A, Geng J, et al. (2013) The Complete Mitochondrial Genome of Gossypium hirsutum and Evolutionary Analysis of Higher Plant Mitochondrial Genomes. PLoS ONE 8(8): e69476. doi:10.1371/journal.pone.0069476 Editor: Ying Xu, University of Georgia, United States of America Received January 25, 2013; Accepted June 10, 2013; Published August 5, 2013 Copyright: ß 2013 Liu et al. This is an open-access article distributed under the terms of the Creative Commons Attribution License, which permits unrestricted use, distribution, and reproduction in any medium, provided the original author and source are credited. Funding: This work was supported by grants from the National Natural Science Foundation of China (NSFC grant number 31171591), the National High Technology Research and Development Program (grant number 2011AA10A102), Key Project of MOE (grant number 107012), and Training Program Foundation for the New Century Excellent Talents in University (NCET-06-0106) to J. Hua, and the support by the Innovation Fund for Graduate Student of China Agricultural University (KYCX2010024) to S. Li. The funders had no role in study design, data collection and analysis, decision to publish, or preparation of the manuscript. Competing Interests: The authors have declared that no competing interests exist. * E-mail: [email protected] (JH); [email protected] (SH) . These authors contributed equally to this work. Introduction Mitochondria, where the oxidative phosphorylation and the various biochemical processes take place throughout metabolism, are the main manufacturers of cellular ATP in eukaryotes. The plant mitochondrial genome contains large number of foreign DNA and repeated sequences undergone frequently intramolec- ular recombination, making it extraordinarily difficult to sequence plant mitochondrial (mt) genomes, particularly those of angio- sperms [1,2]. With the sequencing efforts over the past decade, the number of complete mt genomes has been greatly increased [3–5]. These finished mt genomes allow a deep analysis on the evolution of the higher plant mt genomes in aspects of gene orders, genome structure, and migration sequences as well as phylogenetic analysis. Angiosperm mt genomes vary dramatically in size [6]. The size variation likely stems from their tendency to integrate DNA from other genomes [7–11] and the propensity for repeated sequences PLOS ONE | www.plosone.org 1 August 2013 | Volume 8 | Issue 8 | e69476

Welcome message from author
This document is posted to help you gain knowledge. Please leave a comment to let me know what you think about it! Share it to your friends and learn new things together.
Transcript

The Complete Mitochondrial Genome of Gossypiumhirsutum and Evolutionary Analysis of Higher PlantMitochondrial GenomesGuozheng Liu1., Dandan Cao2., Shuangshuang Li1., Aiguo Su1, Jianing Geng2, Corrinne E. Grover3,
Songnian Hu2*, Jinping Hua1*
1 Department of Plant Genetics and Breeding, College of Agronomy and Biotechnology, Key Laboratory of Crop Heterosis and Utilization of Ministry of Education, Beijing
Key Laboratory of Crop Genetic Improvement, China Agricultural University, Beijing, China, 2 CAS Key Laboratory of Genome Sciences and Information, Beijing Institute of
Genomics, Chinese Academy of Sciences, Beijing, China, 3 Department of Ecology, Evolution, and Organismal Biology, Iowa State University, Ames, Iowa, United States of
America
Abstract
Background: Mitochondria are the main manufacturers of cellular ATP in eukaryotes. The plant mitochondrial genomecontains large number of foreign DNA and repeated sequences undergone frequently intramolecular recombination.Upland Cotton (Gossypium hirsutum L.) is one of the main natural fiber crops and also an important oil-producing plant inthe world. Sequencing of the cotton mitochondrial (mt) genome could be helpful for the evolution research of plant mtgenomes.
Methodology/Principal Findings: We utilized 454 technology for sequencing and combined with Fosmid library of theGossypium hirsutum mt genome screening and positive clones sequencing and conducted a series of evolutionary analysison Cycas taitungensis and 24 angiosperms mt genomes. After data assembling and contigs joining, the completemitochondrial genome sequence of G. hirsutum was obtained. The completed G.hirsutum mt genome is 621,884 bp inlength, and contained 68 genes, including 35 protein genes, four rRNA genes and 29 tRNA genes. Five gene clusters arefound conserved in all plant mt genomes; one and four clusters are specifically conserved in monocots and dicots,respectively. Homologous sequences are distributed along the plant mt genomes and species closely related share the mosthomologous sequences. For species that have both mt and chloroplast genome sequences available, we checked thelocation of cp-like migration and found several fragments closely linked with mitochondrial genes.
Conclusion: The G. hirsutum mt genome possesses most of the common characters of higher plant mt genomes. Theexistence of syntenic gene clusters, as well as the conservation of some intergenic sequences and genic content among theplant mt genomes suggest that evolution of mt genomes is consistent with plant taxonomy but independent amongdifferent species.
Citation: Liu G, Cao D, Li S, Su A, Geng J, et al. (2013) The Complete Mitochondrial Genome of Gossypium hirsutum and Evolutionary Analysis of Higher PlantMitochondrial Genomes. PLoS ONE 8(8): e69476. doi:10.1371/journal.pone.0069476
Editor: Ying Xu, University of Georgia, United States of America
Received January 25, 2013; Accepted June 10, 2013; Published August 5, 2013
Copyright: � 2013 Liu et al. This is an open-access article distributed under the terms of the Creative Commons Attribution License, which permits unrestricteduse, distribution, and reproduction in any medium, provided the original author and source are credited.
Funding: This work was supported by grants from the National Natural Science Foundation of China (NSFC grant number 31171591), the National HighTechnology Research and Development Program (grant number 2011AA10A102), Key Project of MOE (grant number 107012), and Training Program Foundationfor the New Century Excellent Talents in University (NCET-06-0106) to J. Hua, and the support by the Innovation Fund for Graduate Student of China AgriculturalUniversity (KYCX2010024) to S. Li. The funders had no role in study design, data collection and analysis, decision to publish, or preparation of the manuscript.
Competing Interests: The authors have declared that no competing interests exist.
* E-mail: [email protected] (JH); [email protected] (SH)
. These authors contributed equally to this work.
Introduction
Mitochondria, where the oxidative phosphorylation and the
various biochemical processes take place throughout metabolism,
are the main manufacturers of cellular ATP in eukaryotes. The
plant mitochondrial genome contains large number of foreign
DNA and repeated sequences undergone frequently intramolec-
ular recombination, making it extraordinarily difficult to sequence
plant mitochondrial (mt) genomes, particularly those of angio-
sperms [1,2]. With the sequencing efforts over the past decade, the
number of complete mt genomes has been greatly increased [3–5].
These finished mt genomes allow a deep analysis on the evolution
of the higher plant mt genomes in aspects of gene orders, genome
structure, and migration sequences as well as phylogenetic
analysis.
Angiosperm mt genomes vary dramatically in size [6]. The size
variation likely stems from their tendency to integrate DNA from
other genomes [7–11] and the propensity for repeated sequences
PLOS ONE | www.plosone.org 1 August 2013 | Volume 8 | Issue 8 | e69476

[12,13]. Even so, large numbers of homologous sequences are
distributed through the plant mt genome, including many
noncoding sequences. Compared the mt genome of Brassica napus
with that of Arabidopsis thaliana and Beta vulgaris, the values of shared
sequences were in good agreement with the phylogenetic
relationship among these three species [14].
Because of low rates of nucleotide substitution [15,16], the
mitochondrial genes are often used in plant evolutionary analysis,
especially for construction of ancient phylogenetic relationships
[5,17,18]. MtDNA trees are largely congruent with those
constructed with chloroplast genes and nuclear genes, showing
that mt genes are informative markers for evolution analysis across
Figure 1. Genome map of Gossypium hirsutum mitochondrial genome. The map shows both the gene map (outer circle) and repeat map(inner map). Genes exhibited on the inside of outer circle are transcribed in a clockwise direction, while genes on the outside of outer circle aretranscribed in a reverse direction. The inner circle reveals the distribution of repeats in G. hirsutum mt genome. The yellow lines represent . = 1 kbrepeats, the blue lines represent ,100 bp repeat and the red lines represent repeat between 100 bp and 1 kb.doi:10.1371/journal.pone.0069476.g001
Mitochondrial Genome of Gossypium hirsutum
PLOS ONE | www.plosone.org 2 August 2013 | Volume 8 | Issue 8 | e69476

angiosperms. Gene orders are frequently not conserved across
species [16,19], possibly due to the mitochondrial penchant for
recombination [12,20]. Conservation of gene clusters are fre-
quently used to infer evolution relationship among animal mt
genomes [21], however, little researches have been performed in
plant mt genomes [22,23].
Here we report the first complete Gossypium mt genome derived
from the widely cultivated upland species, Gossypium hirsutum. This
sequence represents a major circular molecule that is 621,884 bp
in length. The upland cotton mt genome possesses most of the
common characters of higher plant mt genomes and maintains
essential protein-coding genes and tRNA genes. Phylogenetic
analyses, as well as analyses of conserved sequences, tRNAs and
gene clusters among 25 mt genomes (24 angiosperms and Cycas
taitungensis), indicate that (1) evolution of mt genomes is indepen-
dent among different species, and (2) the evolution of the mt
genomes is consistent with plant taxonomy as a whole (the upland
cotton mt genome is much closer with Carica papaya than other
angiosperms).
Results and Discussion
Genome assembly and features of Gossypium hirsutummitochondrial genome
1. Genome assembly. The Gossypium hirsutum mt genome
was sequenced using the Roche 454 GS FLX platform, which
generated 286,792 reads with an average length of 399 bp.
Cleaned reads were assembled by Newbler (Version 2.53), and
contigs were subsequently joined via PCR into three scaffolds
according to the from-to relationship among contigs (Table S1).
Primers were designed and used to screen a Fosmid library [24] for
clones to join the three scaffolds. Of the eight identified positive
clones, two clones were selected for shotgun sequencing to finish
the gaps, while end-sequencing of the remaining six clones were
performed to verify the finished genome. Finally, the upland
cotton mt genome was assembled into a single, circular molecule,
with the length 621,884 bp and GC content 45.0% (Accession
Number JX065074).
2. Gene annotation. 68 genes were annotated in the cotton
mt genome, including 35 protein-coding genes, four rRNA genes
and 29 tRNA genes (Figure 1, Table S2). Among the eight multi-
copy genes (i.e., nad1, rps3, rrn26, trnW, trnS(GCT), trnP, trnfM and
trnM), nad1 gene contains an additional copy with exon b and exon
c, and rps3 gene has an extra pseudogene-like copy which lacks
544 bp on the 39 end of exon 2. Five genes (rps1, rps2, rps11, rps13
and rps19) are partially deleted and several remnant fragments of
those deleted loci are annotated in the genome, with the largest
fragment only 54 bp in length (derived from rps19). The 1.5 kb
intron of rpl2 gene reported in other sequenced higher plant mt
genomes is not found in the G. hirsutum mt genome.
The protein-coding genes in the upland cotton mt genome
comprise a total length of 61,582 bp (9.9%), nearly half of which is
intronic sequence (exons = 31,721 bp; introns = 29,861 bp), while
tRNA genes and rRNA genes only represent 2,234 bp and
8,826 bp of the genome. The percentages of genic contents except
the tRNA content differ significantly due to the variation of mt
genome size in angiosperms (Figure 2A). However, the sequence
length distribution is very similar to other sequenced seed plant mt
genomes, with the exception of the rRNA content (Figure 2B); it is
slightly elevated in the G. hirsutum mt genome due to the
duplication of rrn26 (3,374 bp).
3. Gene clusters. Except the tRNA genes, ten gene clusters
are annotated in the upland cotton mt genome (Table 1). Genes
that comprise such clusters are usually separated by short
intergenic regions or even partially overlapped in coding
sequences and transcribed from the same strand. The gene orders
differ markedly in higher plant mt genomes and four plant mt
genomes are chosen to compare the gene orders with G. hirsutum
mt genome. As showed in Figure 3, the G. hirsutum mt genome
shares 10 clusters with C. papaya (Figure 3A), seven with R.
communis (Figure 3B), six and four with A. thaliana (Figure 3C) and
Z. mays (Figure 3D).
Figure 2. Gene composition of different mitochondrial genomes. The percentage of different genic sequence (A) and the length of differentgenic sequence (B).doi:10.1371/journal.pone.0069476.g002
Mitochondrial Genome of Gossypium hirsutum
PLOS ONE | www.plosone.org 3 August 2013 | Volume 8 | Issue 8 | e69476

4. Repeated sequence. 343 repeat sequences larger than
20 bp were detected in G. hirsutum mt genome (Figure 1). In total,
the detected repeats occupied 22.9% of the mt genome. Of the
343 repeats, most of them exist as short (20 bp to 39 bp), scattered
repeats, about 10% (35 repeats) are larger than 100 bp (Table 2)
and 1% (four repeats) larger than 10 kb, (R1, 27,495 bp; R2,
10,623 bp; R3 10,302 bp; and R4, 10,251 bp). Copy number for
the larger repeats (100+ bp) varied narrowly from two (22 repeats)
to four (two repeats) copies. The smaller repeats were also
tabulated, and appeared to have distinct distributions and copy
number variations (Table 3).
Figure 3. Gene order and existed clusters between the mitochondrial gene maps of Gossypium and other four angiosperms. Geneorder of the protein-coding and rRNA-coding genes, and the former’s trans-spliced exons were based on the mt genome of G. hirsutum arrangingfrom top to bottom. Genes of other four mt genomes were indicated by the corresponding numbers given to cotton genes listed on the left margin.Duplicate genes carried the same number. From left to right for (A) C. papaya, (B) R. communis, (C) A. thaliana and (D) Z. mays.doi:10.1371/journal.pone.0069476.g003
Mitochondrial Genome of Gossypium hirsutum
PLOS ONE | www.plosone.org 4 August 2013 | Volume 8 | Issue 8 | e69476

5. Cp-like sequences. Integration of cp-like sequences is a
common occurrence in plant mitochondrial genomes, and G.
hirsutum is no exception. 27 chloroplast-derived sequences (80% or
higher identity to the G. hirsutum chloroplast genome) are found in
the mt genome, contributing 6,833 bp (1.1% of the genome size)
with segments ranging from 36 bp to 2,185 bp. 12 of the 27
chloroplast-derived sequences are tRNA related sequences, three
are photosynthesis related sequences and the rest are other type of
chloroplast sequences.
Migration of cpDNA in plant mt genomesChloroplast-derived sequences play an important role in plant
mt genomes. Many researches have shown that cp-like tRNA
genes are essential to maintain normal translation [18,25–27] and
cp-like sequences can act as functional genes and gene promoters
[28,29]. Besides, mitochondrial plastid DNA also contributes
codons to mitochondrial protein-coding sequences and has a role
in posttranscriptional RNA processing [10].
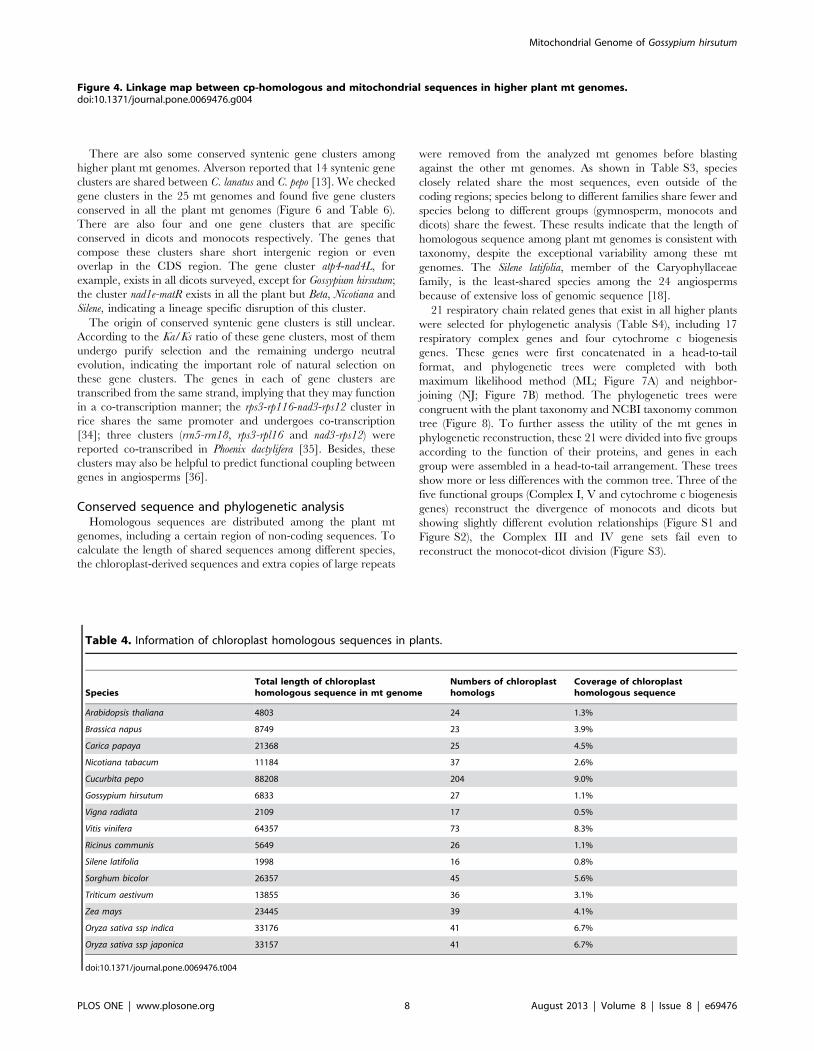
14 species that chloroplast genomes are available were chosen to
analyze cp-like migration in plant mt genomes (Table 4). The
length of individually integrated sequences varies widely, from
20 bp to 12 kb. The capacity of cpDNA in plant mt genomes also
differs greatly; the total amount of cpDNA exceeds 60 kb in Vitis
vinifera mt genome, whereas it represents less than 2 kb in Silene
latifolia and Vigna radiate. Besides, the size of the largest integrated
fragment varied from 275 bp (Silene latifolia) to 12 kb (Carica
papaya). Based on the above data, the migration of cpDNA in plant
mt genomes seems to be an independent and random event.
Blast was performed to check the homology of cp-like migration
in plant mt genomes. Five cp-derived fragments (trnH, trnM, trnN,
trnP and trnW) were found conserved in all analyzed mt genomes
and one (trnD) and two (trnC and trnF) cp-derived fragment were
found conserved in dicots and monocots, respectively. In addition,
some of these conserved cp-derived fragments maintain the same
sequence arrangement relationship with mitochondrial genes
(Figure 4), indicating these migration events are very ancient
and occurred before the species differentiation.
Origin and distribution of tRNAs in plant mt genomesThe ancestral mt genome possesses an intact set of transfer
RNAs (tRNAs), however, a large number of tRNAs undergo loss,
migration and inactivation during mt genome evolution [27].
Different with the human mt genome, which keeps a minimal but
complete set of tRNA genes, the number of tRNA genes in
numerous plant mt genomes is insufficient for translation,
although a certain number of tRNA genes have been brought in
via DNA migration [30–32].
To evaluate the origin and distribution of tRNA genes,
tRNAscan-SE [33] was adopted to predict the number and types
of tRNA genes. Most of the analyzed species keep 16–21 kinds of
tRNA genes and because of extensive loss of genes in Silene latifolia
[18], only 10 were annotated. These results suggest that nuclear
encoded tRNAs are necessary to maintain the normal translation
in higher plant mt genomes.
Based on chloroplast genomes, 19 native (mitochondria-
originated) tRNA genes and 19 cp-like tRNA genes are defined
in higher plant mt genomes (Figure 5A). As showed in Figure 5B
and 5C, although we found the uptake of four cp-like tRNAs (trnD,
trnF, trnN, and trnW) and lose of four native tRNAs (trnD, trnF, trnN,
and trnW) seems to occur during the same period, the uptake and
lose of the rest cp-like tRNA genes (Figure 5B) and native tRNA
genes (Figure 5C) are more likely to be occurred in different period
of evolution. Besides, some cp-like tRNA genes have scattered
distribution and some native tRNA genes are irregularly lost
among higher plant mt genomes, showing the gain and lose of
tRNA genes occurred independently during the evolution.
Gene orders and gene clusters in plant mt genomesThe gene orders differ tremendously among plant mt genomes.
In this research, we compared the gene orders across the 25
species and counted the number of syntenic gene clusters (genes
that keep the same order; Table 5). In general, the closer species in
evolution share more clusters. However, there are also some
inconsistent cases, C. taitungensis and C. lanatus share 13 gene
clusters, much more than the number between C. lanatus and the
Table 1. Information of gene clusters in Gossypium hirsutum mt genome.
Gene cluster Location and Interval Type
rpl16-rps3 593447..593881-(-28bp)-593853..597250 III
cob-rps14 547956..549134-(1363bp)-550498..550800 II
rpl2-rpl5-nad5c 532722..533726-(497bp)-534224..534805-(1117bp)-535923..535944 II
nad2abc-sdh3 418598..420365-(999bp)-421265..421699 I
mttB-nad9 308702..309502-(184bp)-309687..310259 IV
sdh4-cox3 258268..258666-(-72bp)-258594..259391 I
cox1-rps10 260808..262400-(186bp)-262587..263768 II
atp9-nad5ab 162829..163140-(220bp)-163361..165659 I
nad3-rps12 129383..129754-(48bp)-129803..130159 II
nad1e-matR-nad1d 81154..81412-(806bp)-82219..84186-(661bp)-84848..84905 IV
Boldface: Interval length between two genes.Type I represents gene cluster composed of respiratory genes; Type II represents gene cluster composed of respiratory genes; Type III represents gene cluster composedof respiratory genes; Type IV represents gene cluster compose of respiratory genes.doi:10.1371/journal.pone.0069476.t001
Mitochondrial Genome of Gossypium hirsutum
PLOS ONE | www.plosone.org 5 August 2013 | Volume 8 | Issue 8 | e69476

other angiosperms; the cluster number between T. aestivum and C.
lanatus is larger than that between C. lanatus and the other dicots.
These exceptions probably were due to the frequently recombi-
nation during the plant mt genomes. Recombination can break
the previous clusters and result in novel ones, while multiple
recombination events can lead to generate the same synteny gene
clusters too.
Table 2. Repeats (.100 bp) in Gossypium hirsutum mt genome.
No. Size (bp)Identity(%) Copy-1 Copy-2a Copy-3a Copy-4a
Typeb
start end start end start end start End
R01 27495 99.92 437002 464489 594397 621884 DR
R02 10623 99.81 224949 235564 532802 522190 IR
R03 10302 99.98 130185 140486 340674 330373 IR
R04 10251 99.86 64505 74747 247693 257941 DR
R05 879 100 140497 141375 330372 329494 IR
R06 399 99.5 225720 226118 421200 420802 532032 531634 IR/DR
R07 349 99.43 81010 81358 226466 226118 531286 531634 IR/DR
R08 260 86.54 519189 519438 555385 555140 IR
R09 259 98.07 226519 226775 273990 273734 531233 530978 IR/DR
R10 256 83.2 56397 56644 68151 67904 251342 251095 IR/DR
R11 229 99.13 39574 39802 119894 119666 IR
R12 203 99.51 260466 260668 430908 430706 IR
R13 194 100 70998 71191 254191 254384 427256 427449 DR
R14 175 100 147589 147763 495709 495883 DR
R15 174 98.85 455621 455794 550847 551020 613016 613189 DR
R16 168 91.07 378953 379120 536243 536080 IR
R17 166 94.58 162194 162357 310412 310248 IR
R18 162 91.98 278372 278532 506946 506786 IR
R19 160 97.5 225357 225515 439973 439816 532394 532236 597366 597208 IR/DR
R20 159 99.37 278884 279042 455305 455463 612700 612858 DR
R21 151 100 427472 427622 486639 486489 IR
R22 145 87.59 246993 247137 409294 409158 IR
R23 138 97.1 260510 260645 430864 430729 495627 495763 IR/DR
R24 136 96.32 285066 285201 534095 533960 IR
R25 135 90.37 519189 519320 555385 555255 IR
R26 133 94.74 161921 162053 351301 351169 IR
R27 128 84.38 278561 278686 506757 506635 IR
R28 127 92.91 279043 279168 455473 455598 612868 612993 DR
R29 123 88.62 260519 260638 430855 430736 495636 495755 578212 578092 IR/DR
R30 118 99.15 185254 185371 309736 309619 IR
R31 113 100 81796 81908 438852 438740 596247 596135 IR/DR
R32 113 98.23 86305 86417 307767 307655 IR
R33 107 100 70936 71042 254129 254235 502859 502753 IR/DR
R34 101 85.15 302711 302803 513954 514053 DR
R35 101 97.03 425155 425255 555258 555158 IR
aBoldface: IR copy, compared with copy-1 as control.bDR and IR: direct and reverse repeats, respectively; IR/DR: both direct repeat and reverse repeat among multiple copies.doi:10.1371/journal.pone.0069476.t002
Table 3. Frequency distribution of repeat lengths in the mtgenome of Gossypium hirsutum.
Size, bp 20–39 40–59 60–79 80–99 100–999 . = 1000
Number 192 69 35 11 32 4
Total length ofrepeats, bp
10,747
9,667
9,567
8,365
18,368
117,300
Coverage, % 1.7 1.6 1.5 1.3 3.0 18.9
doi:10.1371/journal.pone.0069476.t003
Mitochondrial Genome of Gossypium hirsutum
PLOS ONE | www.plosone.org 6 August 2013 | Volume 8 | Issue 8 | e69476

Mitochondrial Genome of Gossypium hirsutum
PLOS ONE | www.plosone.org 7 August 2013 | Volume 8 | Issue 8 | e69476
There are also some conserved syntenic gene clusters among
higher plant mt genomes. Alverson reported that 14 syntenic gene
clusters are shared between C. lanatus and C. pepo [13]. We checked
gene clusters in the 25 mt genomes and found five gene clusters
conserved in all the plant mt genomes (Figure 6 and Table 6).
There are also four and one gene clusters that are specific
conserved in dicots and monocots respectively. The genes that
compose these clusters share short intergenic region or even
overlap in the CDS region. The gene cluster atp4-nad4L, for
example, exists in all dicots surveyed, except for Gossypium hirsutum;
the cluster nad1e-matR exists in all the plant but Beta, Nicotiana and
Silene, indicating a lineage specific disruption of this cluster.
The origin of conserved syntenic gene clusters is still unclear.
According to the Ka/Ks ratio of these gene clusters, most of them
undergo purify selection and the remaining undergo neutral
evolution, indicating the important role of natural selection on
these gene clusters. The genes in each of gene clusters are
transcribed from the same strand, implying that they may function
in a co-transcription manner; the rps3-rp116-nad3-rps12 cluster in
rice shares the same promoter and undergoes co-transcription
[34]; three clusters (rrn5-rrn18, rps3-rpl16 and nad3-rps12) were
reported co-transcribed in Phoenix dactylifera [35]. Besides, these
clusters may also be helpful to predict functional coupling between
genes in angiosperms [36].
Conserved sequence and phylogenetic analysisHomologous sequences are distributed among the plant mt
genomes, including a certain region of non-coding sequences. To
calculate the length of shared sequences among different species,
the chloroplast-derived sequences and extra copies of large repeats
were removed from the analyzed mt genomes before blasting
against the other mt genomes. As shown in Table S3, species
closely related share the most sequences, even outside of the
coding regions; species belong to different families share fewer and
species belong to different groups (gymnosperm, monocots and
dicots) share the fewest. These results indicate that the length of
homologous sequence among plant mt genomes is consistent with
taxonomy, despite the exceptional variability among these mt
genomes. The Silene latifolia, member of the Caryophyllaceae
family, is the least-shared species among the 24 angiosperms
because of extensive loss of genomic sequence [18].
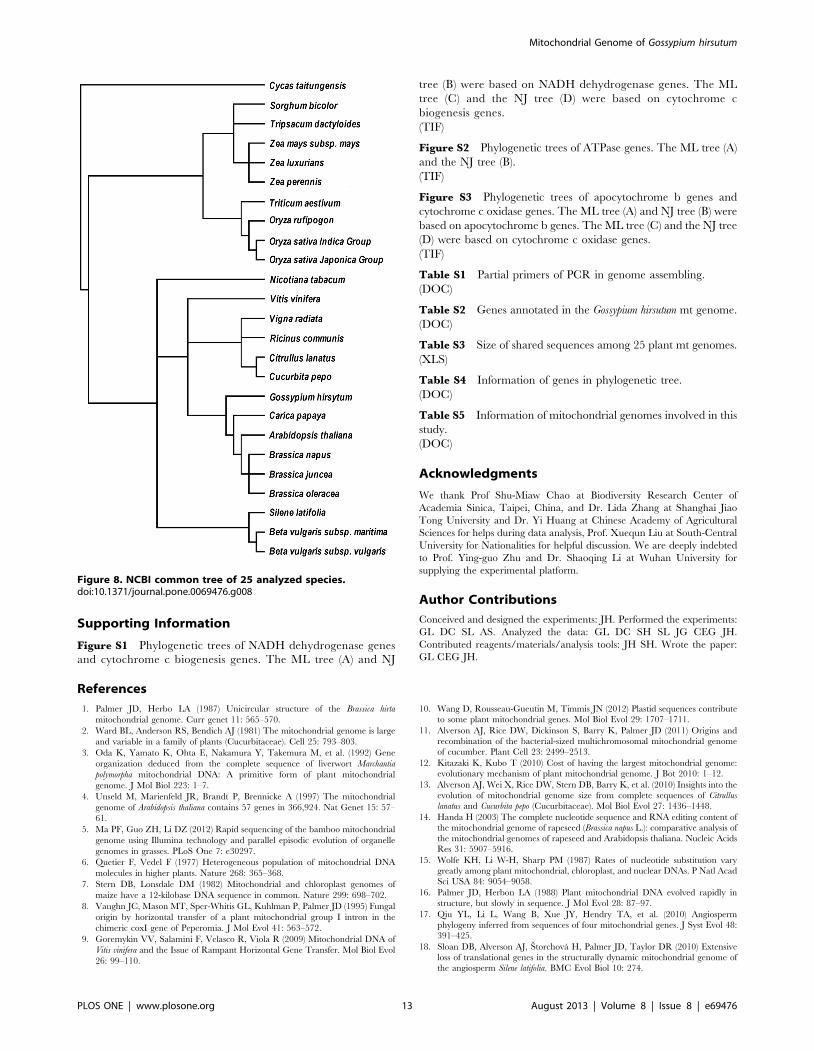
21 respiratory chain related genes that exist in all higher plants
were selected for phylogenetic analysis (Table S4), including 17
respiratory complex genes and four cytochrome c biogenesis
genes. These genes were first concatenated in a head-to-tail
format, and phylogenetic trees were completed with both
maximum likelihood method (ML; Figure 7A) and neighbor-
joining (NJ; Figure 7B) method. The phylogenetic trees were
congruent with the plant taxonomy and NCBI taxonomy common
tree (Figure 8). To further assess the utility of the mt genes in
phylogenetic reconstruction, these 21 were divided into five groups
according to the function of their proteins, and genes in each
group were assembled in a head-to-tail arrangement. These trees
show more or less differences with the common tree. Three of the
five functional groups (Complex I, V and cytochrome c biogenesis
genes) reconstruct the divergence of monocots and dicots but
showing slightly different evolution relationships (Figure S1 and
Figure S2), the Complex III and IV gene sets fail even to
reconstruct the monocot-dicot division (Figure S3).
Figure 4. Linkage map between cp-homologous and mitochondrial sequences in higher plant mt genomes.doi:10.1371/journal.pone.0069476.g004
Table 4. Information of chloroplast homologous sequences in plants.
SpeciesTotal length of chloroplasthomologous sequence in mt genome
Numbers of chloroplasthomologs
Coverage of chloroplasthomologous sequence
Arabidopsis thaliana 4803 24 1.3%
Brassica napus 8749 23 3.9%
Carica papaya 21368 25 4.5%
Nicotiana tabacum 11184 37 2.6%
Cucurbita pepo 88208 204 9.0%
Gossypium hirsutum 6833 27 1.1%
Vigna radiata 2109 17 0.5%
Vitis vinifera 64357 73 8.3%
Ricinus communis 5649 26 1.1%
Silene latifolia 1998 16 0.8%
Sorghum bicolor 26357 45 5.6%
Triticum aestivum 13855 36 3.1%
Zea mays 23445 39 4.1%
Oryza sativa ssp indica 33176 41 6.7%
Oryza sativa ssp japonica 33157 41 6.7%
doi:10.1371/journal.pone.0069476.t004
Mitochondrial Genome of Gossypium hirsutum
PLOS ONE | www.plosone.org 8 August 2013 | Volume 8 | Issue 8 | e69476

Figure 5. Distribution map of tRNA genes in 25 plants. Figure 5A shows distribution of tRNA genes in higher plant mt genomes: the yellowboxs represented native tRNA genes, the green cells represent cp-like tRNA genes; Figure B shows uptake of cp-like tRNA genes during differentevolutionary period; Figure C shows loss of native tRNA genes during different evolutionary period. The three Oryza genomes: 1, Oryza rufipogon; 2,Oryza sativa subsp indica; 3, Oryza sativa subsp japonica. The two Beta genomes are: 1, Beta vulgaris subsp maritima; 2, Beta vulgaris subsp vulgaris.doi:10.1371/journal.pone.0069476.g005
Mitochondrial Genome of Gossypium hirsutum
PLOS ONE | www.plosone.org 9 August 2013 | Volume 8 | Issue 8 | e69476

The evolutionary rate of mitochondrial genes varies greatly
among plant species [5], phylogenetic analysis of single gene differs
with the plant taxonomy. In this research, we tried phylogenetic
analysis of functional groups and 21 conserved genes. Compared
with previous reports [5,17,18], phylogenetic tree of 21 conserved
mitochondrial genes shows best coincidence with NCBI taxonomy
common tree.
Conclusion
Plant mitochondrial genomes are fascinating molecules, whose
lability and striking differences in evolutionary rates among genic
and intergenic regions have generated significant interest. The G.
hirsutum mt genome possesses most of the common characters of
higher plant mt genomes. The comparative analysis presented
here allows a more comprehensive understanding of mitochon-
drial genome evolution in higher plant. The existence and
conservation of gene clusters, origin and distribution of tRNA
genes, as well as the conservation of some intergenic sequences
and genic contents suggest that evolution of mt genomes is
consistent with plant taxonomy. But the highly dynamic genome
structures (genome size, gene orders and gene content) reflects that
recombination of higher plant mt molecular is independent and
random among different species.
Table 5. Numbers of synteny gene clusters across 25 plant mt genomes.
Species Ct At Bvm Bvv Bj Bn Bo Cap Cl Cup Gh Nt Rc Sl Vr Vv Or Ori Orj Sb Td Ta Zl Zm
A. thaliana 8
Beta1 8 6
Beta2 7 6 39
B. juncea 8 19 6 7
B. napus 8 19 6 7 39
B. oleracea 8 19 6 7 39 39
C. papaya 11 11 8 8 11 11 11
C. lanatus 13 9 10 10 10 10 11 16
C. pepo 13 10 9 10 9 9 10 16 23
G. hirsutum 9 8 4 4 9 9 9 11 12 12
N. tabacum 10 8 9 9 8 8 8 14 14 16 11
R.communis 12 10 11 11 10 9 10 14 18 16 8 15
S. latifolia 7 7 10 10 7 7 7 10 8 9 6 12 9
V. radiata 10 10 6 6 11 10 11 11 11 11 10 12 13 8
V. vinifera 12 10 10 10 12 12 12 12 17 14 7 12 13 9 10
O. rufipogon 9 6 5 5 5 6 6 7 10 9 6 6 7 5 6 10
Oryza1 9 5 5 5 5 6 6 7 10 9 6 5 7 5 6 10 40
Oryza2 9 5 5 5 5 6 6 7 10 9 6 5 7 5 6 10 40
S. bicolor 7 4 6 5 5 4 4 6 8 5 5 5 5 2 5 9 8 9 9
T. dactyloides 6 6 4 4 6 5 5 7 6 5 6 5 7 2 5 6 8 9 9 7
T. aestivum 7 6 5 5 8 6 6 10 11 10 6 8 9 4 7 8 11 11 11 9 10
Z. luxurians 7 7 5 5 5 5 5 7 8 6 5 6 6 3 5 7 9 9 9 11 17 11
Z. mays 6 6 6 6 6 6 6 9 8 7 4 5 6 4 5 8 11 9 9 10 13 11 20
Z. perennis 7 8 6 6 6 7 7 7 9 7 4 8 6 3 5 8 10 11 11 11 15 11 30 17
Note: Numbers of synteny gene clusters differed across C. taitungensis (Ct), A. thaliana (At), Beta vulgaris subsp maritima (Bvm), Beta vulgaris subsp vulgaris (Bvv), B.juncea (Bj), B. napus (Bn), B. oleracea (Bo), C. papaya (Cap), C. lanatus (Cl), C. pepo (Cup), G. hirsutum (Gh), N. tabacum (Nt), R.communis (Rc), S. latifolia (Sl), V. radiata (Vr), V.vinifera (Vv), O. rufipogon (Or), Oryza sativa subsp indica (Ori), Oryza sativa subsp japonica (Orj), S. bicolor (Sb), T. dactyloides (Td), T. aestivum (Ta), Z. luxurians (Zl), Z. mays(Zm) and Z. perennis. The two Beta genomes in the first row were: 1, Beta vulgaris subsp maritima; 2, Beta vulgaris subsp vulgaris, and the two Oryza genomes in the firstrow were: 1, Oryza sativa subsp indica; 2, Oryza sativa subsp japonica. Any two genes linked were counted as one synteny gene cluster.doi:10.1371/journal.pone.0069476.t005
Figure 6. Distribution of conserved gene clusters.doi:10.1371/journal.pone.0069476.g006
Mitochondrial Genome of Gossypium hirsutum
PLOS ONE | www.plosone.org 10 August 2013 | Volume 8 | Issue 8 | e69476

Materials and Methods
Plant material and mitochondrial DNA extractionMitochondria were obtained from 7-days-old etiolated
seedlings of a variety of upland cotton (Gossypium hirsutum
L.), ‘Sumian No. 20 (Xu244)’. Etiolated seedlings were ground
with homogenate buffer in the proper proportion and after
pulping, nuclei and debris were removed by centrifugation at
3,000 rpm for 16 min at 4uC, the supernatant was transferred
to a new tube and centrifugation was carried out for 40 min at
8,500 rpm at 4uC to isolate mitochondria. Purified mitochon-
dria were obtained by discontinuous sucrose density gradient
centrifugation. After digestion of nuclear DNA with DNase I,
mitochondria were lysed by CTAB at 65uC for 30 min. The
lysis solution was extracted by chloroform: isoamyl alcohol for
2–3 times and then absolute ethyl alcohol was used to
precipitate the mitochondrial DNA (mtDNA).
Genome sequencing and assemblyUpland cotton mtDNA were sequenced using 454 in Beijing
Institute of Genomics, Chinese Academy of Sciences. Purified
mtDNA was used to construct sequencing library, according to the
manufacturer’s manual for the 454 GS FLX Titanium. The reads
were assembled into contigs by 454 GS FLX platform after
removing the adaptor and contaminant sequences [37].
The relationship among contigs was acquired according to the
from-to relationship. Then, primers were designed to join the
contigs and fill the genomic gaps. After sequencing of PCR bands,
the contig were assembled in scaffolds.
Table 6. Distribution of closely linked clusters in Gossypium hirsutum and other plant mt genomes.
rrn5-rrn18
nad3-rps12
rps3-rpl16
nad1d-matR-nad1e
nad1d-matR
matR-nad1e
sdh4-cox3
cob-rps14
nad1bc-rps13
atp4-nad4L
ccmFn-rps1-matR-nad1e
ccmFN-rps1
C.taitungensis + + + + + + + + + 2 2 +
A.thaliana + + + + + + + + # + # #
Beta1 + + # 2 + 2 + # + + 2 #
Beta2 + + # 2 + 2 + # + + 2 #
B.juncea + + + + + + + + # + # #
B.napus + + + + + + + + # + # #
B.oleracea + + + + + + + + # + # #
C.papaya + + + + + + + + + + 2 +
C.lanatus + + + + + + + + + + 2 +
C.pepo + + + + + + + + + + 2 2
G.hirsutum + + + + + + + + # 2 # #
N.tabacum + + + 2 + 2 + + + + 2 2
R.communis + + + + + + + + + + 2 2
S. latifolia + # # 2 + 2 # + + + 2 #
V. radiata + + + + + + + + # + 2 2
V. vinifera + + + + + + + + + + 2 2
O.rufipogon + + + 2 2 + # 2 + 2 + +
Oryza1 + + + 2 2 + # 2 + 2 + +
Oryza2 + + + 2 2 + # 2 + 2 + +
S.bicolor + + + 2 2 + # 2 + 2 + +
T.dactyloides + + + 2 2 + # # + 2 + +
T.aestivum + + + 2 2 + # 2 + 2 + +
Z.luxurians + + + 2 2 + # # + 2 + +
Z.mays + + + 2 2 + # # + 2 + +
Z.perennis + + + 2 2 + # # + 2 + +
Note:+, presence of the gene cluster; 2, absence of the gene cluster; #, absence for gene lose.The two Oryza genomes are: 1, Oryza sativa Indica Group; 2, Oryza sativa Japonica Group.The two Beta genomes are: 1, Beta vulgaris subsp. maritima; 2, Beta vulgaris subsp. vulgaris.doi:10.1371/journal.pone.0069476.t006
Mitochondrial Genome of Gossypium hirsutum
PLOS ONE | www.plosone.org 11 August 2013 | Volume 8 | Issue 8 | e69476

Mitochondrial genome library construction and clonesequencing
Mitochondrial genome Fosmid library for G. hirsutum was
constructed following CopyControl Fosmid Library Production
Kit (Epicentre, Cat. No. CCFOS110). Mitochondria genomic
DNA was random mechanical sheared, size-fractioned by pulsed
field gel electrophoresis, and ligated to pCC1FOS vector. The
packaged phage infected the EpI300-T1R host cell and then well-
separated colonies were randomly picked to accomplish the fosmid
library construction [24].
The library was screened by primers designed on the
conserved genes and scaffold terminals. The positive clones
were chose for shotgun sequencing in Beijing Institute of
Genomics, Chinese Academy of Sciences. The terminal
sequencing of positive clones operated in Invitrogen Life
Technologies Corporation.
Genome annotation and sequence analysisJust like the method described in Alverson’s report [13], a
local database was built with mt genome sequences available
in NCBI, which contained all protein and ribosomal RNA
(rRNA) of previously sequenced plant mitochondrial genomes.
Protein coding genes and ribosomal RNA genes were
identified by performing local blast searches against the
database. The tRNAscan-SE [33] was used to predict the
tRNA genes. NCBI blast and local blast was used to identify
putatively conserved regions among different plant mt
genomes. The gene map was created by OGDraw (http://
ogdraw.mpimp-golm.mpg.de/).
AB-blast was used to identify repeat sequences in G. hirsutum
and other plant mt genomes (Table S5) as described previously
[4,9,13–14,18–19,38–45]. The repeat sequence distribution map
was drawn by Circos. The genome was searched against itself and
local Perl scripts were adopted to run detail analysis. We used
local R scripts to identify gene clusters by comparing every two
mt genomes. Then we used the MEGA 5.0 to draw phylogenetic
tree based on clustered genes. These 21 genes were 17 respiratory
complex genes (atp1, atp4, atp6, atp8, atp9, cob, cox1, cox3, nad1,
nad2, nad3, nad4, nad4L, nad5, nad6, nad7, nad9) and four
cytochrome c biogenesis genes (ccmB, ccmC, ccmFC, ccmFN)
(Table S4).
Figure 7. Phylogenetic trees of 21 respiratory related genes. The ML tree (A) and the NJ tree (B). Genes used were listed in Table S4, including17 respiratory complex genes and four cytochrome c biogenesis genes.doi:10.1371/journal.pone.0069476.g007
Mitochondrial Genome of Gossypium hirsutum
PLOS ONE | www.plosone.org 12 August 2013 | Volume 8 | Issue 8 | e69476
Supporting Information
Figure S1 Phylogenetic trees of NADH dehydrogenase genes
and cytochrome c biogenesis genes. The ML tree (A) and NJ
tree (B) were based on NADH dehydrogenase genes. The ML
tree (C) and the NJ tree (D) were based on cytochrome c
biogenesis genes.
(TIF)
Figure S2 Phylogenetic trees of ATPase genes. The ML tree (A)
and the NJ tree (B).
(TIF)
Figure S3 Phylogenetic trees of apocytochrome b genes and
cytochrome c oxidase genes. The ML tree (A) and NJ tree (B) were
based on apocytochrome b genes. The ML tree (C) and the NJ tree
(D) were based on cytochrome c oxidase genes.
(TIF)
Table S1 Partial primers of PCR in genome assembling.
(DOC)
Table S2 Genes annotated in the Gossypium hirsutum mt genome.
(DOC)
Table S3 Size of shared sequences among 25 plant mt genomes.
(XLS)
Table S4 Information of genes in phylogenetic tree.
(DOC)
Table S5 Information of mitochondrial genomes involved in this
study.
(DOC)
Acknowledgments
We thank Prof Shu-Miaw Chao at Biodiversity Research Center of
Academia Sinica, Taipei, China, and Dr. Lida Zhang at Shanghai Jiao
Tong University and Dr. Yi Huang at Chinese Academy of Agricultural
Sciences for helps during data analysis, Prof. Xuequn Liu at South-Central
University for Nationalities for helpful discussion. We are deeply indebted
to Prof. Ying-guo Zhu and Dr. Shaoqing Li at Wuhan University for
supplying the experimental platform.
Author Contributions
Conceived and designed the experiments: JH. Performed the experiments:
GL DC SL AS. Analyzed the data: GL DC SH SL JG CEG JH.
Contributed reagents/materials/analysis tools: JH SH. Wrote the paper:
GL CEG JH.
References
1. Palmer JD, Herbo LA (1987) Unicircular structure of the Brassica hirta
mitochondrial genome. Curr genet 11: 565–570.
2. Ward BL, Anderson RS, Bendich AJ (1981) The mitochondrial genome is large
and variable in a family of plants (Cucurbitaceae). Cell 25: 793–803.
3. Oda K, Yamato K, Ohta E, Nakamura Y, Takemura M, et al. (1992) Gene
organization deduced from the complete sequence of liverwort Marchantia
polymorpha mitochondrial DNA: A primitive form of plant mitochondrial
genome. J Mol Biol 223: 1–7.
4. Unseld M, Marienfeld JR, Brandt P, Brennicke A (1997) The mitochondrial
genome of Arabidopsis thaliana contains 57 genes in 366,924. Nat Genet 15: 57–
61.
5. Ma PF, Guo ZH, Li DZ (2012) Rapid sequencing of the bamboo mitochondrial
genome using Illumina technology and parallel episodic evolution of organelle
genomes in grasses. PLoS One 7: e30297.
6. Quetier F, Vedel F (1977) Heterogeneous population of mitochondrial DNA
molecules in higher plants. Nature 268: 365–368.
7. Stern DB, Lonsdale DM (1982) Mitochondrial and chloroplast genomes of
maize have a 12-kilobase DNA sequence in common. Nature 299: 698–702.
8. Vaughn JC, Mason MT, Sper-Whitis GL, Kuhlman P, Palmer JD (1995) Fungal
origin by horizontal transfer of a plant mitochondrial group I intron in the
chimeric coxI gene of Peperomia. J Mol Evol 41: 563–572.
9. Goremykin VV, Salamini F, Velasco R, Viola R (2009) Mitochondrial DNA of
Vitis vinifera and the Issue of Rampant Horizontal Gene Transfer. Mol Biol Evol
26: 99–110.
10. Wang D, Rousseau-Gueutin M, Timmis JN (2012) Plastid sequences contribute
to some plant mitochondrial genes. Mol Biol Evol 29: 1707–1711.
11. Alverson AJ, Rice DW, Dickinson S, Barry K, Palmer JD (2011) Origins and
recombination of the bacterial-sized multichromosomal mitochondrial genome
of cucumber. Plant Cell 23: 2499–2513.
12. Kitazaki K, Kubo T (2010) Cost of having the largest mitochondrial genome:
evolutionary mechanism of plant mitochondrial genome. J Bot 2010: 1–12.
13. Alverson AJ, Wei X, Rice DW, Stern DB, Barry K, et al. (2010) Insights into the
evolution of mitochondrial genome size from complete sequences of Citrullus
lanatus and Cucurbita pepo (Cucurbitaceae). Mol Biol Evol 27: 1436–1448.
14. Handa H (2003) The complete nucleotide sequence and RNA editing content of
the mitochondrial genome of rapeseed (Brassica napus L.): comparative analysis of
the mitochondrial genomes of rapeseed and Arabidopsis thaliana. Nucleic Acids
Res 31: 5907–5916.
15. Wolfe KH, Li W-H, Sharp PM (1987) Rates of nucleotide substitution vary
greatly among plant mitochondrial, chloroplast, and nuclear DNAs. P Natl Acad
Sci USA 84: 9054–9058.
16. Palmer JD, Herbon LA (1988) Plant mitochondrial DNA evolved rapidly in
structure, but slowly in sequence. J Mol Evol 28: 87–97.
17. Qiu YL, Li L, Wang B, Xue JY, Hendry TA, et al. (2010) Angiosperm
phylogeny inferred from sequences of four mitochondrial genes. J Syst Evol 48:
391–425.
18. Sloan DB, Alverson AJ, Storchova H, Palmer JD, Taylor DR (2010) Extensive
loss of translational genes in the structurally dynamic mitochondrial genome of
the angiosperm Silene latifolia. BMC Evol Biol 10: 274.
Figure 8. NCBI common tree of 25 analyzed species.doi:10.1371/journal.pone.0069476.g008
Mitochondrial Genome of Gossypium hirsutum
PLOS ONE | www.plosone.org 13 August 2013 | Volume 8 | Issue 8 | e69476
19. Ogihara Y (2005) Structural dynamics of cereal mitochondrial genomes as
revealed by complete nucleotide sequencing of the wheat mitochondrial genome.Nucleic Acids Res 33: 6235–6250.
20. Palmer JD, Shields CR (1984) Tripartite structure of the Brassica campestris
mitochondrial genome. Nature 307: 437–440.21. Boore JL, Brown WM (1998) Big trees from little genomes: mitochondrial gene
order as a phylogenetic tool. Curr Opin Genet Dev 8: 668–674.22. Liu Y, Wang B, Cui P, Li L, Xue JY, et al. (2012) The mitochondrial genome of
the lycophyte Huperzia squarrosa: the most archaic form in vascular plants.
PLoS One 7: e35168.23. Liu Y, Xue J-Y, Wang B, Li L, Qiu Y-L (2011) The mitochondrial genomes of
the early land plants Treubia lacunosa and Anomodon rugelii: dynamic andconservative evolution. PLoS One 6: e25836.
24. Li SS, Liu GZ, Chen ZW, Wang YM, Li PB, et al. (2013) Construction andinitial analysis of five Fosmid libraries of mitochondrial genomes of cotton
(Gossypium). Chin Sci Bull 58: 1–7.
25. Clifton SW (2004) Sequence and comparative analysis of the maize NBmitochondrial genome. Plant Physiol 136: 3486–3503.
26. Sugiyama Y, Watase Y, Nagase M, Makita N, Yagura S, et al. (2004) Thecomplete nucleotide sequence and multipartite organization of the tobacco
mitochondrial genome: comparative analysis of mitochondrial genomes in
higher plants. Mol Genet Genomics 272: 603–615.27. Dietrich A, Small I, Cosset A, Weil J, Marechal-Drouard L (1996) Editing and
import: strategies for providing plant mitochondria with a complete set offunctional transfer RNAs. Biochimie 78: 518–529.
28. Nakazono M, Nishiwaki S, Tsutsumi N, Hirai A (1996) A chloroplast-derivedsequence is utilized as a source of promoter sequences for the gene for subunit 9
of NADH dehydrogenase (nad9) in rice mitochondria. Mol Gen Genet 252: 371–
378.29. Adams KL, Daley DO, Whelan J, Palmer JD (2002) Genes for two
mitochondrial ribosomal proteins in flowering plants are derived from theirchloroplast or cytosolic counterparts. Plant Cell 14: 931–943.
30. Marechal-Drouard L, Guillemaut P, Cosset A, Arbogast M, Weber F, et al.
(1990) Transfer RNAs of potato (Solanum tuberosum) mitochondria have differentgenetic origins. Nucleic Acids Res 18: 3689–3696.
31. Marechal-Drouard L, Weil J, Dietrich A (1993) Transfer RNAs and transferRNA genes in plants. Annu Rev Plant Biol 44: 13–32.
32. Salinas T, Duchene A-M, Marechal-Drouard L (2008) Recent advances intRNA mitochondrial import. Trends Biochem Sci 33: 320–329.
33. Lowe TM, Eddy SR (1997) tRNAscan-SE: a program for improved detection of
transfer RNA genes in genomic sequence. Nucleic Acids Res 25: 0955–0964.34. Nakazono M, Itadani H, Wakasugi T, Tsutsumi N, Sugiura M, et al. (1995) The
rps3-rpl16-nad3-rps12 gene cluster in rice mitochondrial DNA is transcribed
from alternative promoters. Curr Genet 27: 184–189.35. Fang Y, Wu H, Zhang T, Yang M, Yin Y, et al. (2012) A complete sequence and
transcriptomic analyses of date palm (Phoenix dactylifera L.) mitochondrialgenome. PLoS One 7: e37164.
36. Overbeek R, Fonstein M, D’souza M, Pusch GD, Maltsev N (1999) The use of
gene clusters to infer functional coupling. P Natl Acad Sci USA 96: 2896–2901.37. Zhang T, Zhang X, Hu S, Yu J (2011) An efficient procedure for plant
organellar genome assembly, based on whole genome data from the 454 GSFLX sequencing platform. Plant Methods 7: 38.
38. Chaw S-M, Chun-Chieh Shih A, Wang D, Wu Y-W, Liu S-M (2008) Themitochondrial genome of the gymnosperm Cycas taitungensis contains a novel
family of short interspersed elements, Bpu sequences, and abundant RNA
editing sites. Mol Biol Evol 25: 603–615.39. Fujii S, Kazama T, Yamada M, Toriyama K (2010) Discovery of global genomic
re-organization based on comparison of two newly sequenced rice mitochondrialgenomes with cytoplasmic male sterility-related genes. BMC Genomics 11: 209.
40. Tian X (2006) The rice mitochondrial genomes and their variations. Plant
Physiol 140: 401–410.41. Notsu Y, Masood S, Nishikawa T, Kubo N, Akiduki G, et al. (2002) The
complete sequence of the rice (Oryza sativa L.) mitochondrial genome: frequentDNA sequence acquisition and loss during the evolution of flowering plants. Mol
Genet Genomics 268: 434–445.42. Allen JO, Fauron CM, Minx P, Roark L, Oddiraju S, et al. (2007) Comparisons
among two fertile and three male-sterile mitochondrial genomes of maize. Genet
177: 1173–1192.43. Kubo T, Nishizawa S, Sugawara A, Itchoda N, Estiati A, et al. (2000) The
complete nucleotide sequence of the mitochondrial genome of sugar beet (Beta
vulgaris L.) reveals a novel gene for tRNACys (GCA). Nucleic Acids Res 28:
2571–2576.
44. Rivarola M, Foster JT, Chan AP, Williams AL, Rice DW, et al. (2011) Castorbean organelle genome sequencing and worldwide genetic diversity analysis.
PLoS One 6: e21743.45. Alverson AJ, Zhuo S, Rice DW, Sloan DB, Palmer JD (2011) The mitochondrial
genome of the legume Vigna radiata and the analysis of recombination acrossshort mitochondrial repeats. PLoS One 6: e16404.
Mitochondrial Genome of Gossypium hirsutum
PLOS ONE | www.plosone.org 14 August 2013 | Volume 8 | Issue 8 | e69476
Related Documents