This article appeared in a journal published by Elsevier. The attached copy is furnished to the author for internal non-commercial research and education use, including for instruction at the authors institution and sharing with colleagues. Other uses, including reproduction and distribution, or selling or licensing copies, or posting to personal, institutional or third party websites are prohibited. In most cases authors are permitted to post their version of the article (e.g. in Word or Tex form) to their personal website or institutional repository. Authors requiring further information regarding Elsevier’s archiving and manuscript policies are encouraged to visit: http://www.elsevier.com/copyright

Welcome message from author
This document is posted to help you gain knowledge. Please leave a comment to let me know what you think about it! Share it to your friends and learn new things together.
Transcript
This article appeared in a journal published by Elsevier. The attachedcopy is furnished to the author for internal non-commercial researchand education use, including for instruction at the authors institution
and sharing with colleagues.
Other uses, including reproduction and distribution, or selling orlicensing copies, or posting to personal, institutional or third party
websites are prohibited.
In most cases authors are permitted to post their version of thearticle (e.g. in Word or Tex form) to their personal website orinstitutional repository. Authors requiring further information
regarding Elsevier’s archiving and manuscript policies areencouraged to visit:
http://www.elsevier.com/copyright
Author's personal copyJournal Identification = FIELD Article Identification = 5463 Date: May 18, 2011 Time: 4:42 pm
Field Crops Research 122 (2011) 264–272
Contents lists available at ScienceDirect
Field Crops Research
journa l homepage: www.e lsev ier .com/ locate / fc r
The competitive ability of pea–barley intercrops against weeds and theinteractions with crop productivity and soil N availability
G. Corre-Helloua,∗, A. Dibeta, H. Hauggaard-Nielsenb, Y. Crozata, M. Goodingc, P. Ambusb,C. Dahlmannd, P. von Fragsteind, A. Pristeri e, M. Montie, E.S. Jensenb,f
a LUNAM Université, Groupe ESA, Laboratoire d’Ecophysiologie Végétale et Agroécologie 55 rue Rabelais F-49007 Angers, Franceb Risø National Laboratory for Sustainable Energy, Technical University of Denmark, 4000 Roskilde, Denmarkc Department of Agriculture, The University of Reading, Reading RG6 1AR, UKd University of Kassel, D-37213 Witzenhausen, Germanye University Mediterranea of Reggio Calabria, I-89060 Reggio Calabria, Italyf Swedish University of Agricultural Sciences, SE-230 53 Alnarp, Sweden
a r t i c l e i n f o
Article history:Received 26 August 2010Received in revised form 5 April 2011Accepted 6 April 2011
Keywords:IntercroppingWeedsNitrogenPeaBarleyOrganic farming
a b s t r a c t
Grain legumes, such as peas (Pisum sativum L.), are known to be weak competitors against weeds whengrown as the sole crop. In this study, the weed-suppression effect of pea–barley (Hordeum vulgare L.)intercropping compared to the respective sole crops was examined in organic field experiments acrossWestern Europe (i.e., Denmark, the United Kingdom, France, Germany and Italy). Spring pea (P) and barley(B) were sown either as the sole crop, at the recommended plant density (P100 and B100, respectively),or in replacement (P50B50) or additive (P100B50) intercropping designs for three seasons (2003–2005).The weed biomass was three times higher under the pea sole crops than under both the intercrops andbarley sole crops at maturity. The inclusion of joint experiments in several countries and various growingconditions showed that intercrops maintain a highly asymmetric competition over weeds, regardless ofthe particular weed infestation (species and productivity), the crop biomass or the soil nitrogen availabil-ity. The intercropping weed suppression was highly resilient, whereas the weed suppression in pea solecrops was lower and more variable. The pea–barley intercrops exhibited high levels of weed suppres-sion, even with a low percentage of barley in the total biomass. Despite a reduced leaf area in the caseof a low soil N availability, the barley sole crops and intercrops displayed high weed suppression, prob-ably because of their strong competitive capability to absorb soil N. Higher soil N availabilities entailedincreased leaf areas and competitive ability for light, which contributed to the overall competitive abilityagainst weeds for all of the treatments. The contribution of the weeds in the total dry matter and soil Nacquisition was higher in the pea sole crop than in the other treatments, in spite of the higher leaf areasin the pea crops.
© 2011 Elsevier B.V. All rights reserved.
1. Introduction
Grain legumes, such as peas (Pisum sativum L.), should play akey role in organic cropping methods; they provide nitrogen (N)to the system and the soil for succeeding crops via their symbio-sis with N2-fixing bacteria, and they produce grain that is rich inprotein. However, most legumes are known to have a weak compet-itive ability towards weeds (Wall et al., 1991; Townley-Smith andWright, 1994; Mcdonald, 2003), and weed infestations have beenshown to severely limit the N nutrition and grain yield of organi-cally grown grain legumes (Corre-Hellou and Crozat, 2005). Weedmanagement is a key issue in organic cropping systems, and weed
∗ Corresponding author. Tel.: +33 2 41 23 55 55; fax: +33 2 41 23 55 50.E-mail address: [email protected] (G. Corre-Hellou).
control should be tackled primarily by altering the competitive bal-ance between the crop and the weeds through such measures as thecorrect choice of rotation, the choice of crop species and cultivar orthe appropriate sowing arrangements (Younie and Litterick, 2002).The infestation of weeds may also be markedly reduced by spatialdiversification. Indeed, the results of a literature survey (Liebmanand Dyck, 1993) indicated that weed density and biomass produc-tion may be markedly reduced by using intercropping. The authorsnoted that when intercrops were composed of two or more maincrops, the weed biomass in the intercrop was shown to be lowerthan all of the component sole crops in twelve cases, intermediatebetween the component sole crops in ten cases, and higher than allof the sole crops in two cases. Several studies have demonstratedthat weed biomass is often significantly reduced in intercrops com-pared to the legume crop alone in crop mixtures combining a cerealand a grain legume. However, it should be noted that intercrops and
0378-4290/$ – see front matter © 2011 Elsevier B.V. All rights reserved.doi:10.1016/j.fcr.2011.04.004
Author's personal copyJournal Identification = FIELD Article Identification = 5463 Date: May 18, 2011 Time: 4:42 pm
G. Corre-Hellou et al. / Field Crops Research 122 (2011) 264–272 265
cereal sole crops have often displayed similar competitive abili-ties against weeds (Mohler and Liebman, 1987; Rauber et al., 2000;Hauggaard-Nielsen et al., 2001; Deveikyte et al., 2009).
Nevertheless, the factors that promote the greater competi-tive ability of intercrops compared to legume sole crops are notwell known. According to Liebman and Dyck (1993), less weedgrowth may occur if intercrops are more effective than the solecrops in competing for resources with weeds or suppressing theweed growth through allelopathy. Moreover, intercrops may pro-vide yield advantages without suppressing the weed growth belowthe levels observed in the component sole crops if the intercrops useresources that are not exploitable by weeds or convert resourcesmore efficiently than the sole crops (Liebman and Dyck, 1993).
It is possible that intercrops promote the use of the availableresources, thus, leaving less opportunity for the establishmentand growth of weeds. Indeed, many crop mixtures, particularlycereal–legume combinations, show substantial yield advantagesover sole crops, suggesting that the intercrops use the availableresources more completely and/or effectively (Hauggaard-Nielsenet al., 2009). Some authors have studied how weed suppressionis affected by an increase of biomass and the corresponding lightinterception for intercrops, assuming that both weeds and cropsare mainly competing for aboveground resources (Carr et al., 1995;Baumann et al., 2000). However, several studies have revealed thatthe effect of belowground competition is often greater than that ofaboveground competition (Wilson, 1988). Nevertheless, competi-tion between species for both light and soil resources, such as N,is clearly interrelated. The solar radiation reaching weeds may bemodulated, at least in part, by the different ability of a crop speciesto take up the soil N. The leaf area of the dominant species (crop orweed) in the community may increase when more N is available,enhancing its ability to intercept the solar radiation and, therefore,to shade the subordinate species (Corre-Hellou et al., 2006).
Although both legumes and non-legumes utilise inorganic soilresources, because of the ability of legumes to fix atmospheric N2,in co-culture, the crops tend to balance each other in the overall Nconsumption. Indeed, previous studies have shown an increase of30% in the N acquisition by cereal–legume intercrops, under variousgrowing conditions, due to an increase in both the soil N acquisi-tion and the N2 fixation compared to either crop grown in sole crops(Hauggaard-Nielsen et al., 2009). A more complete soil N exploita-tion by the co-cultured crops probably diminishes the competitiveability of the weeds by leaving less N available (Hauggaard-Nielsenet al., 2001).
Barley is described as more competitive for inorganic soil Nthan pea (Jensen, 1996), likely due to a deeper root growth and arapid early growth and N demand (Hauggaard-Nielsen et al., 2001;Bellostas et al., 2003; Corre-Hellou et al., 2007). Moreover, observedincreases in the contribution of N2 fixation to the total N accu-mulation are explained by the strong competition of cereals forN (Jensen, 1996). In pea monocrops, it has also been shown thatthe percentage of N that was derived from N2 fixation, in relationto the N taken up by the weeds, increased with the biomass of theinvading weeds (Corre-Hellou and Crozat, 2005).
The poor competitive ability of pea compared to other species(crops or weeds) could also be related to the energetic cost of noduleformation and activity.
Soil N availability has been demonstrated to increase the com-petitive ability of cereals for light, and their N demand then reducesthe growth of the pea crop in co-culture (Jensen, 1996; Corre-Hellouet al., 2006). Because the responses to nutrient enrichment oftendiffer among species, the increase in the soil N availability can shiftthe balance of competitive relationships between crops and weeds.
The aims of the study presented here were the following: (i) todetermine the ability of pea–barley intercrops to suppress weeds,as compared to the sole crops, under various, contrasting condi-
tions of soil, climate, and weed potential and under different cropproductivities in organic farming systems throughout a Europeanset of trials conducted during three years in five countries; and (ii)to investigate the effects on the soil N availability on the crop andweed growth in both intercrops and sole crops.
2. Materials and methods
2.1. Experimental design and management practices
Field trials were carried out in 2003, 2004 and 2005 in fivecountries: Denmark (Taastrup, 55◦40′N, 12◦18′E), the UK (Read-ing, 51◦45′N, 0′93′W), France (Thorigné d’Anjou, 47◦37′N, 0◦39′W),Germany (Kassel, 51◦25′N, 9◦25′E) and Italy (San Marco Argentano,39◦18′N, 21◦12′E). For further information about the experimen-tal conditions, see Gooding et al. (2007) and Hauggaard-Nielsenet al. (2009). In all of the countries, the crops on the experimentalsites were established as the second ‘cereal’ after a fertility-buildingclover-rich ley. The crops were managed according to organic farm-ing practices without pesticide or fertiliser use. No mechanicalweeding was performed after sowing, and no irrigation was sup-plied.
Field pea (P. sativum L., cv Baccara) and spring barley (Hordeumvulgare L., cv Scarlett) were sown at the recommended seed den-sity of 90 and 300 plants m−2 for pea (P100) and barley (B100),respectively. Row intercrops were established in an additive and areplacement design. The additive design involved the same plantpopulation of pea in sole crops and in intercrops; this was sup-plemented with the barley component at a density of 150 plantsm−2. The replacement design involved the replacement of a pro-portion of the plants of one species with the other species; in thepresent study each species was sown at 50% of its sole crop popula-tion (P50B50). A fallow treatment was included in the experimentaldesign specifically to assess the weed potential.
The experimental plots were drilled (125 mm row width) ina complete, one-factorial randomised design with four replicates.The experiments were arranged in a randomised block design withfour replications.
2.2. Sampling and analysis
The aboveground weeds were harvested twice throughout thecrop cycle. The first and the second harvests were respectively car-ried out at the beginning of flowering of the pea plants and at cropmaturity. At each harvest, the weeds were collected on three plotsof 0.25 m2 per treatment and replicate to take into account the spa-tial distribution of the weeds. Each subsample was oven dried at70 ◦C to a constant weight, and the weight of the dry matter (DM)was determined. The three subsamples for each treatment andreplicate were pooled for grinding. The total N content of the weedswas determined on finely ground plant material at Risø NationalLaboratory for Sustainable Energy (Roskilde, Denmark) using anelemental analyser (CE Instruments, EA 1110).
The most dominant weed species in terms of biomass were visu-ally determined for each plot (Table 1). Samples of the crops wereharvested on the same date as the weeds to determine the totaldry matter. All of the plant materials were dried at 70 ◦C to a con-stant weight to determine the total DM produced. The total N and�15N were determined at Risø National Laboratory for SustainableEnergy on 5–10 mg of the subsamples of the finely ground mate-rial using an elemental analyser (CE Instruments, EA 1110) coupledin continuous-flow mode to an isotope ratio mass spectrometer(Finnigan, MAT DeltaPlus). The leaf area index (LAI) of the pea andbarley was determined at the beginning of flowering of the peaplants by measuring the green leaf area on 5–10 plants.
Author's personal copyJournal Identification = FIELD Article Identification = 5463 Date: May 18, 2011 Time: 4:42 pm
266 G. Corre-Hellou et al. / Field Crops Research 122 (2011) 264–272
Table 1The dominant weed species observed each year (recurrent species) or in particularyears, at the five experimental sites in Denmark (DK), the United Kingdom (UK),France (FR), Germany (GER) and Italy (IT).
Recurrent species Other species, according to year
DK Sinapis arvensis Cerastium fontanum, Cirsiumarvense (2004)Matricaria discoidea, Stellaria media(2004–2005)
UK Chenopodium album, Viola arvensis,Polygonum aviculare,Chrysanthemum segetum (2003)
FR Chenopodiumalbum
Stellaria media (2003–2005)Atriplex patula (2004)Viola arvensis (2005)
GER Chenopodiumalbum
Thlaspi arvense, Cirsium arvense(2003)Matricaria chamomilla, Stellariamedia (2004)
IT Chenopodiumalbum
Xanthium strumarium (2003)Cirsium arvense, Datura stramonium(2004)
2.3. Calculations and statistics
The amount of N in the weeds (weed N) was calculated as theproduct of the weed dry matter (weed DM) and the %N content.
The weed suppression (WS) due to crop competition wasintended to compare the weed biomass in each crop treatmentand in the fallow plots. The WS characterised the ability of thecrop to reduce weeds. It was determined according to the followingequation:
WS(%) = 100 × weed DM in fallow plots − weed DM in crop treatmentweed DM in fallow plots
The potential soil N availability (Corre-Hellou et al., 2006) wasdetermined as the maximum soil N acquisition obtained either inthe sole crops or in the intercrops for each year and for each site.
The amount of N2 fixed was calculated as the product of thepea biomass, %N content and the proportion of the plant N derivedfrom N2 fixation. The percentage of N derived from N2 fixation(%Ndfa) was determined using the abundance of 15N in the pea andthe barley sole crop. Before initiating the field experiments, weedsamples were harvested to measure the natural 15N abundance oneach site. In France and Germany, these samples indicated that thenatural 15N abundance in the plant-available soil N did not dif-fer significantly from the abundance of atmospheric N2 to allowits accurate measurement. Thus, the enrichment technique (Chalk,1998) was used there. In the other countries, the natural abundancetechnique was used with the levels of barley �15N between 2.5 and6.5% (for further details, see Hauggaard-Nielsen et al., 2009). Thesoil N acquisition in pea sole crop and pea–barley intercrops wasestimated as the difference between the total N accumulated andthe amount of N2 fixed.
The stability of the competitive ability of the weeds was assessedby the coefficient of variation (CV) over the three years and differentsites; the greater the CV, the lower was the stability.
Some results were analysed in relation to the different levels ofpotential key variables.
Probabilities for significant effects were tested using an analysisof variance. The data were transformed in log10 values when theywere not normally distributed. The differences between the treat-ments were evaluated using the Newman and Keuls test with a 0.05confidence level.
3. Results
3.1. Weed suppression
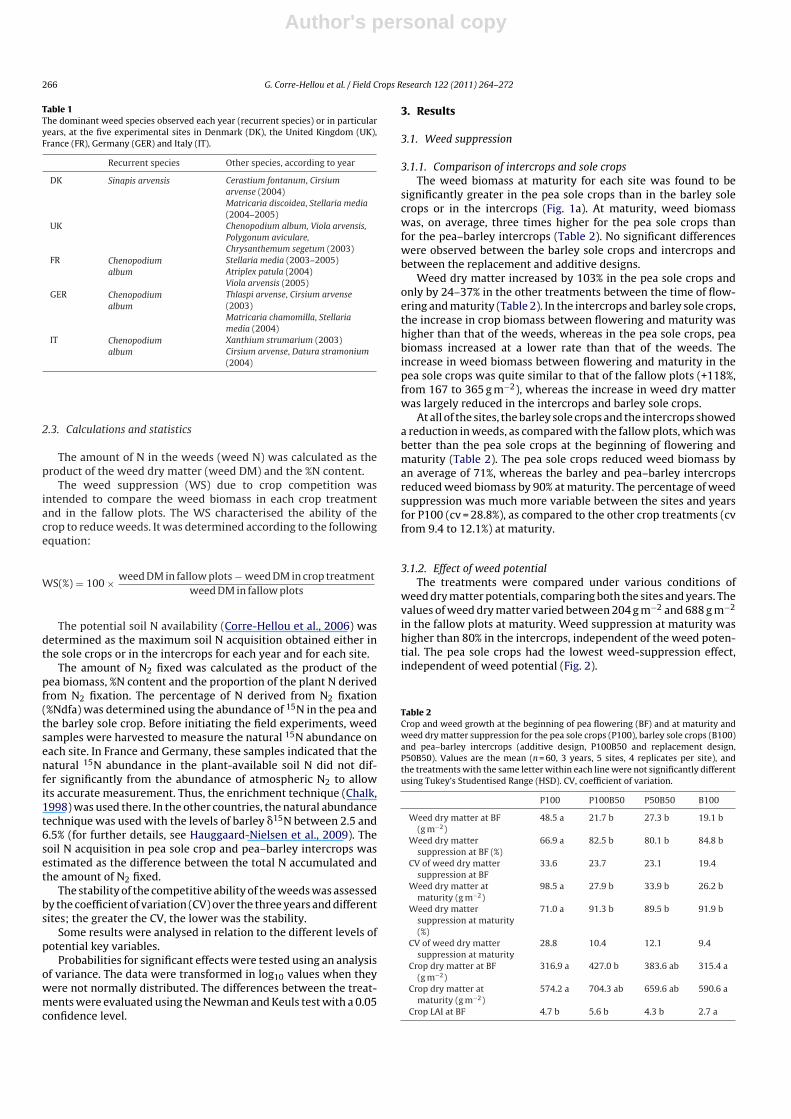
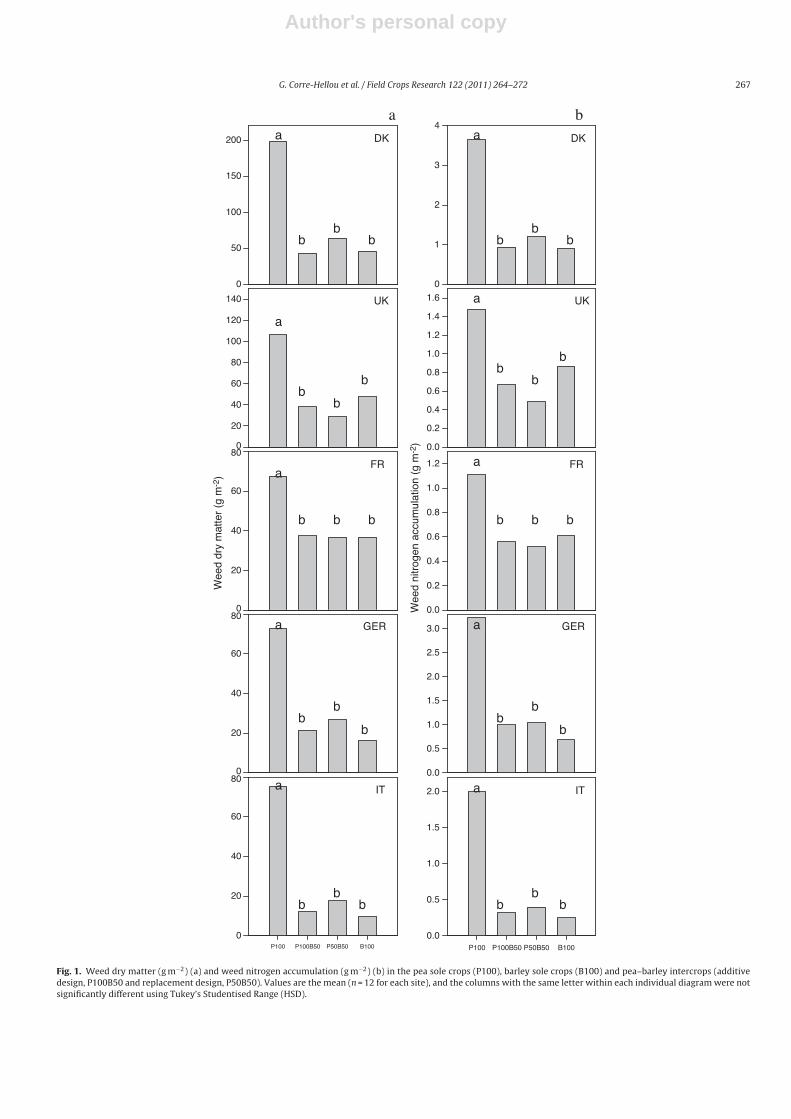
3.1.1. Comparison of intercrops and sole cropsThe weed biomass at maturity for each site was found to be
significantly greater in the pea sole crops than in the barley solecrops or in the intercrops (Fig. 1a). At maturity, weed biomasswas, on average, three times higher for the pea sole crops thanfor the pea–barley intercrops (Table 2). No significant differenceswere observed between the barley sole crops and intercrops andbetween the replacement and additive designs.
Weed dry matter increased by 103% in the pea sole crops andonly by 24–37% in the other treatments between the time of flow-ering and maturity (Table 2). In the intercrops and barley sole crops,the increase in crop biomass between flowering and maturity washigher than that of the weeds, whereas in the pea sole crops, peabiomass increased at a lower rate than that of the weeds. Theincrease in weed biomass between flowering and maturity in thepea sole crops was quite similar to that of the fallow plots (+118%,from 167 to 365 g m−2), whereas the increase in weed dry matterwas largely reduced in the intercrops and barley sole crops.
At all of the sites, the barley sole crops and the intercrops showeda reduction in weeds, as compared with the fallow plots, which wasbetter than the pea sole crops at the beginning of flowering andmaturity (Table 2). The pea sole crops reduced weed biomass byan average of 71%, whereas the barley and pea–barley intercropsreduced weed biomass by 90% at maturity. The percentage of weedsuppression was much more variable between the sites and yearsfor P100 (cv = 28.8%), as compared to the other crop treatments (cvfrom 9.4 to 12.1%) at maturity.
3.1.2. Effect of weed potentialThe treatments were compared under various conditions of
weed dry matter potentials, comparing both the sites and years. Thevalues of weed dry matter varied between 204 g m−2 and 688 g m−2
in the fallow plots at maturity. Weed suppression at maturity washigher than 80% in the intercrops, independent of the weed poten-tial. The pea sole crops had the lowest weed-suppression effect,independent of weed potential (Fig. 2).
Table 2Crop and weed growth at the beginning of pea flowering (BF) and at maturity andweed dry matter suppression for the pea sole crops (P100), barley sole crops (B100)and pea–barley intercrops (additive design, P100B50 and replacement design,P50B50). Values are the mean (n = 60, 3 years, 5 sites, 4 replicates per site), andthe treatments with the same letter within each line were not significantly differentusing Tukey’s Studentised Range (HSD). CV, coefficient of variation.
P100 P100B50 P50B50 B100
Weed dry matter at BF(g m−2)
48.5 a 21.7 b 27.3 b 19.1 b
Weed dry mattersuppression at BF (%)
66.9 a 82.5 b 80.1 b 84.8 b
CV of weed dry mattersuppression at BF
33.6 23.7 23.1 19.4
Weed dry matter atmaturity (g m−2)
98.5 a 27.9 b 33.9 b 26.2 b
Weed dry mattersuppression at maturity(%)
71.0 a 91.3 b 89.5 b 91.9 b
CV of weed dry mattersuppression at maturity
28.8 10.4 12.1 9.4
Crop dry matter at BF(g m−2)
316.9 a 427.0 b 383.6 ab 315.4 a
Crop dry matter atmaturity (g m−2)
574.2 a 704.3 ab 659.6 ab 590.6 a
Crop LAI at BF 4.7 b 5.6 b 4.3 b 2.7 a
Author's personal copyJournal Identification = FIELD Article Identification = 5463 Date: May 18, 2011 Time: 4:42 pm
G. Corre-Hellou et al. / Field Crops Research 122 (2011) 264–272 267
DK
0
50
100
150
200
UK
0
20
40
60
80
100
120
140
FR
Wee
d dr
y m
atte
r (g
m-2
)
0
20
40
60
80
GER
0
20
40
60
80
B100P50B50P100B50P100
0
20
40
60
80
DK
0
1
2
3
4
UK
0.0
0.2
0.4
0.6
0.8
1.0
1.2
1.4
1.6
FR
Wee
d ni
trog
en a
ccum
ulat
ion
(g m
-2)
0.0
0.2
0.4
0.6
0.8
1.0
1.2
GER
0.0
0.5
1.0
1.5
2.0
2.5
3.0
IT
B100P50B50P100B50P100
0.0
0.5
1.0
1.5
2.0
a
a
a
a
a
bb
b
bb
b
b b b
bb
b
bb
b
a
a
a
a
a
bb
b
bb
b
b b b
bb
b
bb
b
IT
a b
Fig. 1. Weed dry matter (g m−2) (a) and weed nitrogen accumulation (g m−2) (b) in the pea sole crops (P100), barley sole crops (B100) and pea–barley intercrops (additivedesign, P100B50 and replacement design, P50B50). Values are the mean (n = 12 for each site), and the columns with the same letter within each individual diagram were notsignificantly different using Tukey’s Studentised Range (HSD).
Author's personal copyJournal Identification = FIELD Article Identification = 5463 Date: May 18, 2011 Time: 4:42 pm
268 G. Corre-Hellou et al. / Field Crops Research 122 (2011) 264–272
weed potential (g m-2)>500400-500300-400<300
Wee
d dr
y m
atte
r su
ppre
ssio
n (%
)
0
20
40
60
80
100P100
P100B50
P50B50
B100
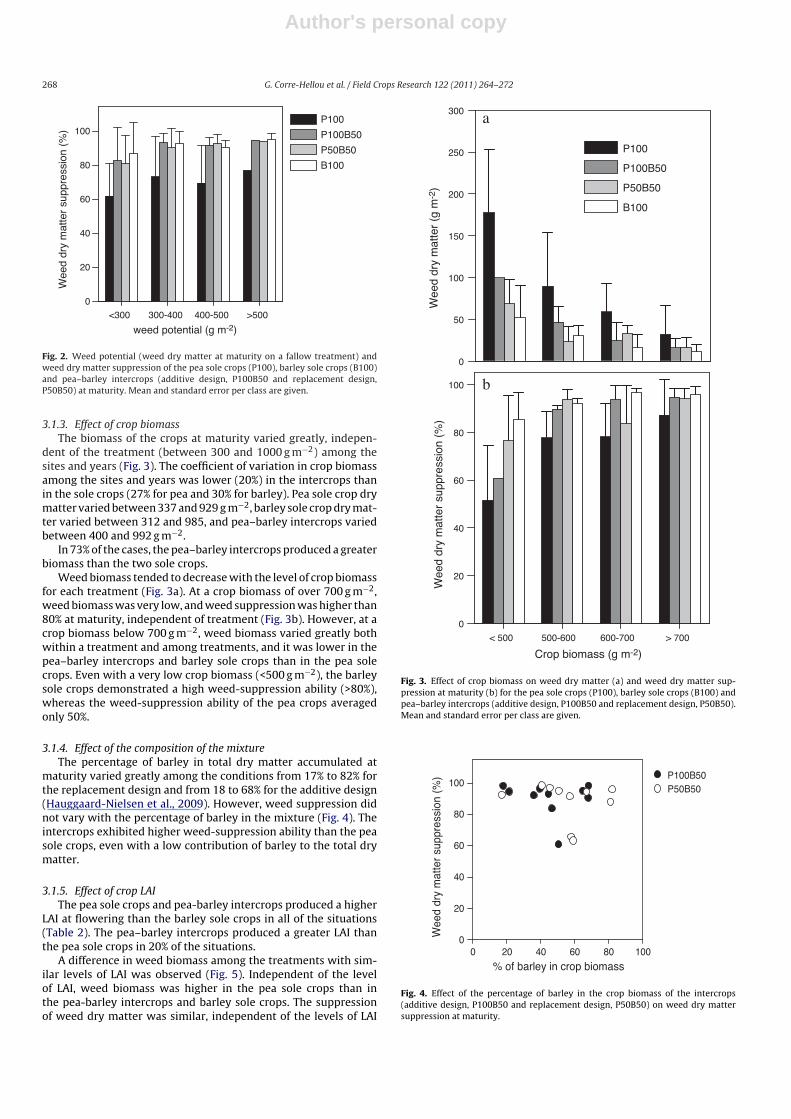
Fig. 2. Weed potential (weed dry matter at maturity on a fallow treatment) andweed dry matter suppression of the pea sole crops (P100), barley sole crops (B100)and pea–barley intercrops (additive design, P100B50 and replacement design,P50B50) at maturity. Mean and standard error per class are given.
3.1.3. Effect of crop biomassThe biomass of the crops at maturity varied greatly, indepen-
dent of the treatment (between 300 and 1000 g m−2) among thesites and years (Fig. 3). The coefficient of variation in crop biomassamong the sites and years was lower (20%) in the intercrops thanin the sole crops (27% for pea and 30% for barley). Pea sole crop drymatter varied between 337 and 929 g m−2, barley sole crop dry mat-ter varied between 312 and 985, and pea–barley intercrops variedbetween 400 and 992 g m−2.
In 73% of the cases, the pea–barley intercrops produced a greaterbiomass than the two sole crops.
Weed biomass tended to decrease with the level of crop biomassfor each treatment (Fig. 3a). At a crop biomass of over 700 g m−2,weed biomass was very low, and weed suppression was higher than80% at maturity, independent of treatment (Fig. 3b). However, at acrop biomass below 700 g m−2, weed biomass varied greatly bothwithin a treatment and among treatments, and it was lower in thepea–barley intercrops and barley sole crops than in the pea solecrops. Even with a very low crop biomass (<500 g m−2), the barleysole crops demonstrated a high weed-suppression ability (>80%),whereas the weed-suppression ability of the pea crops averagedonly 50%.
3.1.4. Effect of the composition of the mixtureThe percentage of barley in total dry matter accumulated at
maturity varied greatly among the conditions from 17% to 82% forthe replacement design and from 18 to 68% for the additive design(Hauggaard-Nielsen et al., 2009). However, weed suppression didnot vary with the percentage of barley in the mixture (Fig. 4). Theintercrops exhibited higher weed-suppression ability than the peasole crops, even with a low contribution of barley to the total drymatter.
3.1.5. Effect of crop LAIThe pea sole crops and pea-barley intercrops produced a higher
LAI at flowering than the barley sole crops in all of the situations(Table 2). The pea–barley intercrops produced a greater LAI thanthe pea sole crops in 20% of the situations.
A difference in weed biomass among the treatments with sim-ilar levels of LAI was observed (Fig. 5). Independent of the levelof LAI, weed biomass was higher in the pea sole crops than inthe pea-barley intercrops and barley sole crops. The suppressionof weed dry matter was similar, independent of the levels of LAI
Wee
d dr
y m
atte
r (g
m-2
)
0
50
100
150
200
250
300
P100
P100B50
P50B50
B100
Crop biomass (g m-2)
> 700600-700500-600< 500
0
20
40
60
80
100
Wee
d dr
y m
atte
r su
ppre
ssio
n (%
)
a
b
Fig. 3. Effect of crop biomass on weed dry matter (a) and weed dry matter sup-pression at maturity (b) for the pea sole crops (P100), barley sole crops (B100) andpea–barley intercrops (additive design, P100B50 and replacement design, P50B50).Mean and standard error per class are given.
% of barley in crop biomass100806040200
Wee
d dr
y m
atte
r su
ppre
ssio
n (%
)
0
20
40
60
80
100P100B50P50B50
Fig. 4. Effect of the percentage of barley in the crop biomass of the intercrops(additive design, P100B50 and replacement design, P50B50) on weed dry mattersuppression at maturity.
Author's personal copyJournal Identification = FIELD Article Identification = 5463 Date: May 18, 2011 Time: 4:42 pm
G. Corre-Hellou et al. / Field Crops Research 122 (2011) 264–272 269
P100
P100B50
P50B50
B100
LAI>4 3-4 2-3<2
Wee
d dr
y m
atte
r su
ppre
ssio
n (%
)
0
20
40
60
80
100
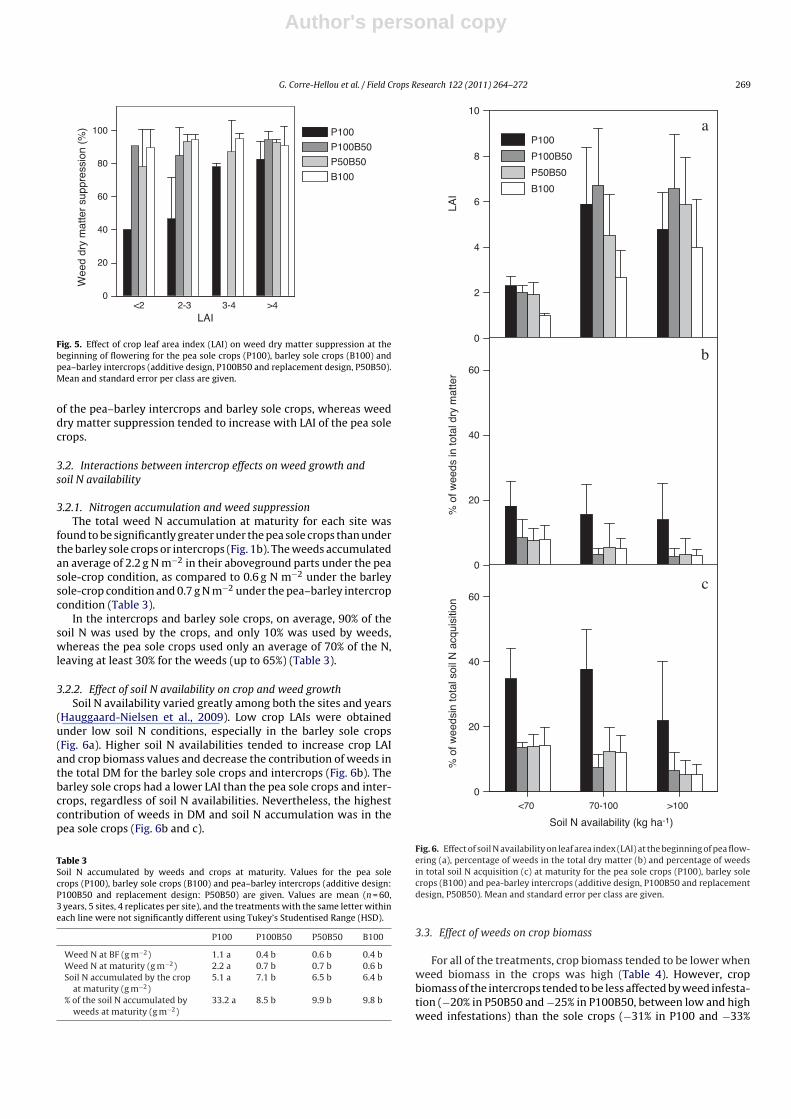
Fig. 5. Effect of crop leaf area index (LAI) on weed dry matter suppression at thebeginning of flowering for the pea sole crops (P100), barley sole crops (B100) andpea–barley intercrops (additive design, P100B50 and replacement design, P50B50).Mean and standard error per class are given.
of the pea–barley intercrops and barley sole crops, whereas weeddry matter suppression tended to increase with LAI of the pea solecrops.
3.2. Interactions between intercrop effects on weed growth andsoil N availability
3.2.1. Nitrogen accumulation and weed suppressionThe total weed N accumulation at maturity for each site was
found to be significantly greater under the pea sole crops than underthe barley sole crops or intercrops (Fig. 1b). The weeds accumulatedan average of 2.2 g N m−2 in their aboveground parts under the peasole-crop condition, as compared to 0.6 g N m−2 under the barleysole-crop condition and 0.7 g N m−2 under the pea–barley intercropcondition (Table 3).
In the intercrops and barley sole crops, on average, 90% of thesoil N was used by the crops, and only 10% was used by weeds,whereas the pea sole crops used only an average of 70% of the N,leaving at least 30% for the weeds (up to 65%) (Table 3).
3.2.2. Effect of soil N availability on crop and weed growthSoil N availability varied greatly among both the sites and years
(Hauggaard-Nielsen et al., 2009). Low crop LAIs were obtainedunder low soil N conditions, especially in the barley sole crops(Fig. 6a). Higher soil N availabilities tended to increase crop LAIand crop biomass values and decrease the contribution of weeds inthe total DM for the barley sole crops and intercrops (Fig. 6b). Thebarley sole crops had a lower LAI than the pea sole crops and inter-crops, regardless of soil N availabilities. Nevertheless, the highestcontribution of weeds in DM and soil N accumulation was in thepea sole crops (Fig. 6b and c).
Table 3Soil N accumulated by weeds and crops at maturity. Values for the pea solecrops (P100), barley sole crops (B100) and pea–barley intercrops (additive design:P100B50 and replacement design: P50B50) are given. Values are mean (n = 60,3 years, 5 sites, 4 replicates per site), and the treatments with the same letter withineach line were not significantly different using Tukey’s Studentised Range (HSD).
P100 P100B50 P50B50 B100
Weed N at BF (g m−2) 1.1 a 0.4 b 0.6 b 0.4 bWeed N at maturity (g m−2) 2.2 a 0.7 b 0.7 b 0.6 bSoil N accumulated by the crop
at maturity (g m−2)5.1 a 7.1 b 6.5 b 6.4 b
% of the soil N accumulated byweeds at maturity (g m−2)
33.2 a 8.5 b 9.9 b 9.8 b
LAI
0
2
4
6
8
10
0
20
40
60
P100
P100B50
P50B50
B100
Soil N availability (kg ha-1)
>10070-100<70
0
20
40
60
a
b
c
% o
f wee
ds in
tota
l dry
mat
ter
% o
f wee
dsin
tota
l soi
l N a
cqui
sitio
n
Fig. 6. Effect of soil N availability on leaf area index (LAI) at the beginning of pea flow-ering (a), percentage of weeds in the total dry matter (b) and percentage of weedsin total soil N acquisition (c) at maturity for the pea sole crops (P100), barley solecrops (B100) and pea-barley intercrops (additive design, P100B50 and replacementdesign, P50B50). Mean and standard error per class are given.
3.3. Effect of weeds on crop biomass
For all of the treatments, crop biomass tended to be lower whenweed biomass in the crops was high (Table 4). However, cropbiomass of the intercrops tended to be less affected by weed infesta-tion (−20% in P50B50 and −25% in P100B50, between low and highweed infestations) than the sole crops (−31% in P100 and −33%
Author's personal copyJournal Identification = FIELD Article Identification = 5463 Date: May 18, 2011 Time: 4:42 pm
270 G. Corre-Hellou et al. / Field Crops Research 122 (2011) 264–272
Table 4Crop biomass (dry matter g m−2) at maturity according to the level of weed infes-tation under the pea sole crops (P100), barley sole crops (B100) and pea–barleyintercrops (additive design, P100B50 and replacement design, P50B50). Low, weeddry matter <12 g m−2; medium, 12–36 g m−2; high, >36 g m−2. The means per classand standard errors (se) are given.
Weed pressure at pea flowering
Low Medium High
Mean se Mean se Mean se
P100 730.6 140.4 649.6 114.2 505.6 111.4P100-B50 775.5 101.2 667.6 121.3 580.5 150.0P50-B50 716.1 149.1 638.4 61.5 576.0 128.3B100 623.5 239.4 594.2 101.3 420.3 22.5
in B100). Thus, the differences in crop biomass between the inter-crops and the sole crops tended to be higher under a high weedinfestation.
4. Discussion
4.1. The weed-suppression effect and interactions with cropbiomass
This work demonstrates that pea–barley intercropping is a rel-evant strategy when trying to reduce weed infestations in organicfarming systems. Our results are consistent with previously pub-lished studies (e.g., Hauggaard-Nielsen et al., 2001; Bulson et al.,1997). Peas have a relatively low competitive strength towardsweeds and intercropping can be a way to successfully produce peasin organic farming. The use of joint experiments, conducted undervarious growing conditions across Europe, showed the generalability of pea–barley intercrops to maintain a highly asymmetriccompetition over weeds (Fig. 1), despite variation in weed infesta-tion (species and productivity) (Fig. 2), crop biomass (Fig. 3), andsoil N availability (Fig. 6). The weed suppression of intercroppingwas highly resilient, whereas the weed suppression of the pea solecrops was lower and displayed a higher variability.
The barley and pea crops had a synergistic effect on the weedpopulations when intercropped, as shown by the replacementintercrop with a lower weed biomass than the average biomassof the two corresponding sole crops (Table 2). Moreover, a differ-ence in weed biomass was observed between intercrops and solecrops with similar biomasses. Compared to the pea sole crops, theaddition of barley (additive design) increased the crop biomass by22% and decreased the weed biomass by 72%.
Crop biomass is often considered as a key factor that explainsdifferences between species in their competitive abilities towardweeds (Mohler and Liebman, 1987; Poggio, 2005). However, inmost of these studies, different species were rarely compared atthe same level of crop productivity, thus preventing the isolationof other main factors. In our study, crop biomass was not the mainfactor explaining the differences in competitive ability between theintercrops and sole crops and within the treatments. The intercropshad a high weed-suppression effect, even with a low crop biomass(approximately 500 g m−2). The pea sole crops may have obtaineda weed suppression comparable to the intercrops and barley solecrops if its productivity had been higher than 700 g m−2. However,such pea growth is only rarely obtained in organic cropping sys-tems (Hauggaard-Nielsen et al., 2009). A crop biomass thresholdof approximately 700 g m−2 is consistent with the results of Poggio(2005) regarding the relationship between the crop biomass andweed biomass using the same species (peas and barley) under con-ditions different than those presented here.
The weed-suppression effect was not correlated with the per-centage of barley in the total biomass. Even with a low percentage
of barley (20%) in the total crop biomass, the weed biomass wasreduced by 90% (Fig. 4). The percentage of each species in a cropmixture is usually quite variable and poorly correlated with plantdensities at sowing, as was confirmed in this study. Thus, it is dif-ficult for farmers to predict the final composition. However, thisstudy revealed that the efficiency of pea–barley intercrops againstweeds was not influenced by variability in the contribution of eachspecies.
The control of weeds was relatively similar in the replacementand additive designs. Over the three years and five experimen-tal sites, only one case was reported (in Denmark, 2003) wherethe additive intercrop had less weed dry-matter accumulation atmaturity than the replacement design (data not shown). In thatparticular situation, the weed biomasses were particularly high,irrespective of the crop treatment, which suggests that the additiveintercrop may control weeds better than the replacement design inthe presence of highly competitive weeds.
At pea flowering, the weed biomass in the pea sole crops was, onaverage, twice that of the barley crops and intercrops, independentof the design. Pea has been reported to exhibit a low competitiveability against weeds at the beginning of the crop cycle (Hauggaard-Nielsen et al., 2001). Furthermore, the weed biomass increasedsignificantly between the flowering and maturity stages in the peasole crops, in contrast to the weed biomass in the other treatments,which remained quite constant after the flowering stage. In addi-tion, the pea sole crops had high LAIs at flowering compared tothe other treatments. Nevertheless, the pea sole crops were sen-sitive to lodging, in contrast to the pea intercropped with barley,likely allowing a higher growth of weeds at the end of the cropcycle. Apart from contributing to yield loss, greater weed growth atthe end of the cycle will exacerbate weed problems for subsequentcrops through increased seed production. Following organic farm-ing principles, such temporal patterns need to be dealt with, andintercropping seems to be a cropping strategy worth considering.
4.2. Interactions with the soil N availability and N acquisition
Even with a low leaf area, a high weed-suppression effect wasobserved in the intercrops and barley sole crops compared to thepea sole crops. The leaf area of the barley was particularly low whenthe soil N availability was low (Fig. 6). At a low soil N availability,light is probably not the main factor limiting weed growth, whereasthe competition for N probably is the driving force; under such con-ditions, barley has a competitive advantage. Pea crops are knownto be less competitive than barley crops for soil N, probably due totheir shallow rooting depth and low N demand, especially at thebeginning of the crop cycle when soil N availability is low (Corre-Hellou et al., 2007). In our experiments, we observed that the weedstook advantage of the low soil N uptake of the pea plants.
The competition for light and N has been proposed to be inter-related (Corre-Hellou et al., 2006). At high soil N availabilities,leaf area and crop biomass increased, regardless of the treatment,likely creating a stronger competition for light that partly drovethe competitive abilities of the crops against the weeds. Under suchconditions, the percentage of weeds in DM and N acquisition tendedto decrease in the barley sole crops and intercrops, yet this percent-age remained high for the pea sole crops. Although the pea plantshad a higher leaf area, they displayed a lower weed-suppressioncapability.
Weeds with a high growth rate at early stages can gain an ini-tial advantage, and small competitive advantages during growthearly in the season can translate into large differences in size andlight-interception ability later in the season. Pea, which is knownto have a slow crop establishment (shoot and root growth), is prob-ably affected very early by weed pressure, whereas, at flowering, itappeared to have a high competitive ability for light, as shown by its
Author's personal copyJournal Identification = FIELD Article Identification = 5463 Date: May 18, 2011 Time: 4:42 pm
G. Corre-Hellou et al. / Field Crops Research 122 (2011) 264–272 271
high LAI. Early responses to soil conditions can be critical for deter-mining competitive interactions between weeds and crops. Furtherexperiments will be needed to characterise the early growth ofcrops and weeds in their interactions with soil N availabilities andthe consequences to interspecific competition.
Weed species differ in their responses to N (Blackshaw et al.,2003). The nitrogen requirements of Chenopodium album, one ofthe major species in our experiments, were observed to be rela-tively low, in comparison with both other weed species and barley(Jornsgard et al., 1996), perhaps explaining its low competitive abil-ity with crops when N availability increased.
The amount of soil N that is available and the dynamic of soilN availability during the crop cycle have been shown to affect thedominance of pea and cereal in intercrops (Naudin et al., 2010)and may also affect weed dominance. We found that availabil-ity of soil N was one main factor that influenced the interactionsof the species in the intercrops; however, other factors, suchas water deficits, may have limited weed and crop growth atseveral of the sites because no irrigation was applied in theseexperiments. Low soil N availability was probably linked to alow water availability at several of the sites, partly explainingthe decrease in pea growth with decreased soil N availability.Pea plants are usually unaffected by soil N availability becauseof their complementary use of inorganic N and atmospheric N(i.e., soil N and N2) (Voisin et al., 2002). Our results were clearlyobtained under the limiting growth conditions that are usuallyobserved in organic cropping systems. The range of crop biomassthat we observed was particularly low, as compared to previ-ously published results that were obtained using the same species,but with N as the only limiting factor (e.g., Corre-Hellou et al.,2006).
4.3. Tolerance to weed competition
This study was mainly focused on the effect of crops on weedsuppression, whereas the effect of weeds on crop growth wasless investigated. Indeed, these two effects are rarely studiedseparately in the same study. However, differences in toleranceto weed competition may be expected between intercrops andsole crops (Liebman and Dyck, 1993), thus increasing the advan-tages of the intercrops in the case of excessive weed infestations.In our experiments, the pea sole crops had a lower weed-suppression effect than the intercrops and also tended to have alower tolerance to weed competition. We found that high weedinfestation caused a greater decrease in the biomass of the peasole crops (Table 4). Moreover, the intercrops and barley solecrops demonstrated similar weed-suppression abilities; however,under a high weed infestation, the intercrops in the replacementdesign, in particular, seemed more tolerant to weeds than thebarley sole crops. Nevertheless, a control setting with no weedsgrowing with the crops would be needed to investigate moreprecisely the differences in tolerance to weeds between treat-ments.
Other studies have also investigated the effect of intercrops onweed composition. It has been reported that diversity of weedstended to decrease in intercrops, in comparison with sole crops(Mohler and Liebman, 1987; Poggio, 2005; Gharineh and MoosaviI,2010). These studies have demonstrated that species richness par-alleled weed productivity, with the fewest species in the barley solecrops and the highest in the pea sole crops; in general, the mostdominant species were more suppressed than the other species ascrop biomass increased. Furthermore, the reduction in weed diver-sity appears to be more stable in intercrops than in pea sole crops(Mohler and Liebman, 1987; Poggio, 2005).
5. Conclusion
The study presented here reveals the high resilience of inter-crops in the suppression of weeds. Moreover, this work contributesto the expansion of our current understanding of how crops andweeds may interact in both cereal–pea intercrops and in the cor-responding sole crops in low input systems, and it may help indeveloping weed-management practices that are environmentallysound. Weed suppression effects and the dynamic use of light andN sources in cereal-legume intercrops were shown to be interre-lated. Some of the hypotheses emerging from this network shouldbe further investigated. Intercrops offer additional ecological ser-vices (such as reduction of pests and diseases), which need to bestudied together with their weed-suppression ability in order toclarify the benefits for farmers and improve the development ofsuch cropping strategies.
Acknowledgement
The presented study was a part of the EU shared-cost project,INTERCROP (see www.Intercrop.dk), funded by the 5th FrameworkProgramme of RTD, Key Action 5 – Sustainable Agriculture.
References
Baumann, D.T., Kropff, M.J., Bastiaans, L., 2000. Intercropping leeks to suppressweeds. Weed Res. 40, 359–374.
Bellostas, N., Hauggaard-Nielsen, H., Andersen, M.K., Jensen, E.S., 2003. Early inter-ference dynamics in intercrops of pea, barley and oilseed rape. Biol. Agric. Hortic.21, 337–348.
Blackshaw, R.E., Randall, N., Brandt, H., Janzen, H., Entz, T., Grant, C.A., Derksen, D.A.,2003. Differential response of weed species to added nitrogen. Weed Sci. 51 (4),532–539.
Bulson, H.A., Snaydon, R.W., Stopes, C.E., 1997. Effects of plant density on inter-cropped wheat and field beans in organic farming system. J. Agric. Sci. 128 (1),59–71.
Carr, P.M., Gardner, J.C., Schatz, B.G., Zwinger, S.W., Guldan, S.J., 1995.Grain yield and weed biomass of a wheat-lentil intercrop. Agron. J. 87,574–579.
Chalk, P.M., 1998. Dynamics of biologically fixed N in legume–cereal rotations: areview. Aust. J. Agric. Res. 49, 303–316.
Corre-Hellou, G., Crozat, Y., 2005. N2 fixation and N supply in organic pea (Pisumsativum L.) cropping systems as affected by weeds and pea weevil (Sitona lineatusL.). Eur. J. Agron. 22, 449–458.
Corre-Hellou, G., Fustec, J., Crozat, Y., 2006. Interspecific competition for soil N andits interactions with N2 fixation, leaf expansion and crop growth in pea–barleyintercrops. Plant Soil 282, 195–208.
Corre-Hellou, G., Brisson, N., Launay, M., Fustec, J., Crozat, Y., 2007. Effect of rootdepth penetration on soil nitrogen competitive interactions and dry matter pro-duction in pea–barley intercrops given different soil nitrogen supplies. FieldCrop Res. 103 (1), 76–85.
Deveikyte, I., Kadziuliene, Z., Sarunaite, L., 2009. Weed suppression ability of springcereal crops and peas in pure and mixed stands. Agron. Res. 7, 239–244 (specialissue I).
Gharineh, M.H., MoosaviI, S.A., 2010. Effects of intercropping (Canola-Faba Bean) on density and diversity of weeds. Not. Sci. Biol. 2 (1),109–112.
Gooding, M.J., Kasynova, E., Ruske, R., Hauggaard-Nielsen, H., Jensen, E.S., Dahlman,C., Von Fragstein, P., Dibet, A., Corre-Hellou, G., Crozat, Y., Pristeri, A., Romeo, M.,Monti, M., Launay, M., 2007. Intercropping with pulses to concentrate nitrogenand sulphur in wheat. J. Agric. Sci. 145, 469–479.
Hauggaard-Nielsen, H., Ambus, P., Jensen, E.S., 2001. Interspecific competition, N useand interference with weeds in pea–barley intercropping. Field Crops Res. 70,101–109.
Hauggaard-Nielsen, H., Gooding, M., Ambus, P., Corre-Hellou, G., Crozat, Y.,Dahlmann, C., Dibet, A., von Fragstein, P., Pristeri, A., Monti, M., Jensen, E.S., 2009.Pea–barley intercropping for efficient symbiotic N2-fixation, soil N acquisitionand use of other nutrients in European organic cropping systems. Field Crop Res.113, 64–71.
Jensen, E.S., 1996. Grain yield, symbiotic N2 fixation and interspecific competitionfor inorganic N in pea–barley intercrops. Plant Soil. 182, 25–38.
Jornsgard, B., Rasmussen, K., Hill, J., Christiansen, J.L., 1996. Influence of nitrogen oncompetition between cereals and their natural weed populations. Weed Res. 36,461–470.
Liebman, M., Dyck, E., 1993. Crop rotation and intercropping strategies for weedmanagement. Ecol. Appl. 3 (1), 92–122.
Mcdonald, G.K., 2003. Competitiveness against grass weeds in field pea genotypes.Weed Res. 43, 48–58.

Author's personal copyJournal Identification = FIELD Article Identification = 5463 Date: May 18, 2011 Time: 4:42 pm
272 G. Corre-Hellou et al. / Field Crops Research 122 (2011) 264–272
Mohler, C.L., Liebman, M., 1987. Weed productivity and composition in sole cropsand intercrops of barley and field pea. J. Appl. Ecol. 24, 685–699.
Naudin, C., Corre-Hellou, G., Pineau, S., Crozat, Y., Jeuffroy, M.H., 2010. The effect ofvarious dynamics of N availability on winter pea–wheat intercrops: crop growth,N partitioning and symbiotic N2 fixation. Field Crop Res. 119 (1), 2–11.
Poggio, S.L., 2005. Structure of weed communities occurring in monoculture andintercropping of field pea and barley. Agric. Ecosyst. Environ. 109, 48–58.
Rauber, R., Schmidtke, K., Kimpel-Freund, H., 2000. Competition and yield advantagein mixtures of pea (Pisum sativum L.) and oats (Avena sativa L.). J. Agron. CropSci. 185 (1), 33–47.
Townley-Smith, L., Wright, A.T., 1994. Field pea cultivar and weed response to cropseed rate in western Canada. Can. J. Plant Sci. 76, 907–914.
Voisin, A.S., Salon, C., Munier-Jolain, N., Ney, B., 2002. Effect of mineral nitrogen onnitrogen nutrition and biomass partioning between the shoot and roots of pea(Pisum sativum L.). Plant Soil 242, 251–262.
Younie, D., Litterick, A., 2002. Crop protection in organic farming. Pest Outlook 13(4), 158–159.
Wall, D., Friesen, G.H., Bhati, T.K., 1991. Wild mustard interference in traditional andsemi-leafless field peas. Can. J. Plant Sci. 71, 473–480.
Wilson, J.B., 1988. Shoot competition and root competition. J. Appl. Ecol. 25, 279–296.
Related Documents