The Commonwealth Fund 2006 International Health Policy Survey of Primary Care Physicians in Seven Countries Cathy Schoen, Robin Osborn, Phuong Trang Huynh, and Michelle M. Doty November 2006 THE COMMONWEALTH FUND

The Commonwealth Fund 2006 International Health Policy Survey of Primary Care Physicians in Seven Countries Cathy Schoen, Robin Osborn, Phuong Trang Huynh,
Dec 25, 2015
Welcome message from author
This document is posted to help you gain knowledge. Please leave a comment to let me know what you think about it! Share it to your friends and learn new things together.
Transcript
The Commonwealth Fund2006 International Health Policy Survey of
Primary Care Physicians in Seven Countries
Cathy Schoen, Robin Osborn,Phuong Trang Huynh, and Michelle M. Doty
November 2006
THE COMMONWEALTH
FUND
THECOMMONWEALTH
FUND
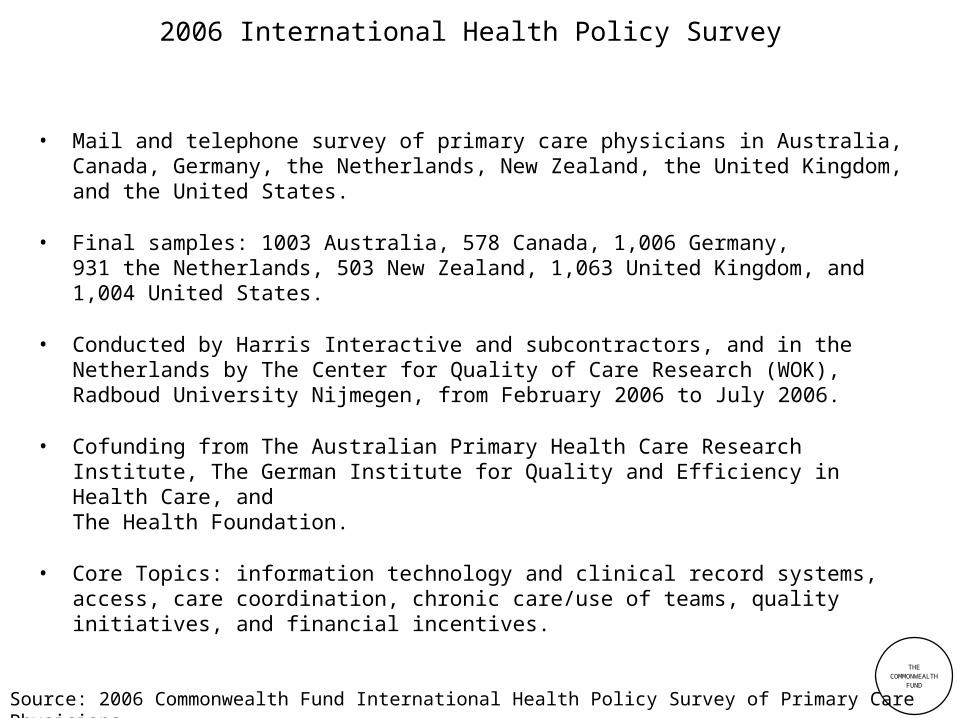
2006 International Health Policy Survey
• Mail and telephone survey of primary care physicians in Australia, Canada, Germany, the Netherlands, New Zealand, the United Kingdom, and the United States.
• Final samples: 1003 Australia, 578 Canada, 1,006 Germany,931 the Netherlands, 503 New Zealand, 1,063 United Kingdom, and 1,004 United States.
• Conducted by Harris Interactive and subcontractors, and in the Netherlands by The Center for Quality of Care Research (WOK), Radboud University Nijmegen, from February 2006 to July 2006.
• Cofunding from The Australian Primary Health Care Research Institute, The German Institute for Quality and Efficiency in Health Care, andThe Health Foundation.
• Core Topics: information technology and clinical record systems, access, care coordination, chronic care/use of teams, quality initiatives, and financial incentives.
Source: 2006 Commonwealth Fund International Health Policy Survey of Primary Care Physicians.

Primary Care Practices:Use of Information Technology and
Clinical Information Systems
THECOMMONWEALTH
FUND

THECOMMONWEALTH
FUND
Figure 1. Primary Care Doctors’ Use ofElectronic Patient Medical Records, 2006
79
23
42
9892 89
28
0
25
50
75
100
AUS CAN GER NETH NZ UK US
Percent
Source: 2006 Commonwealth Fund International Health Policy Survey of Primary Care Physicians.

THECOMMONWEALTH
FUND
Figure 2. Electronic Medical Record System Access
Percent with capability to:
AUS CAN GER NETH NZ UK US
Share records electronically with clinicians outside your practice
10 6 9 45 17 15 12
Access records from outside the office
19 11 16 32 36 22 22
Provide patients with easy access to their records
36 6 15 8 32 50 10
Source: 2006 Commonwealth Fund International Health Policy Survey of Primary Care Physicians.
THECOMMONWEALTH
FUND
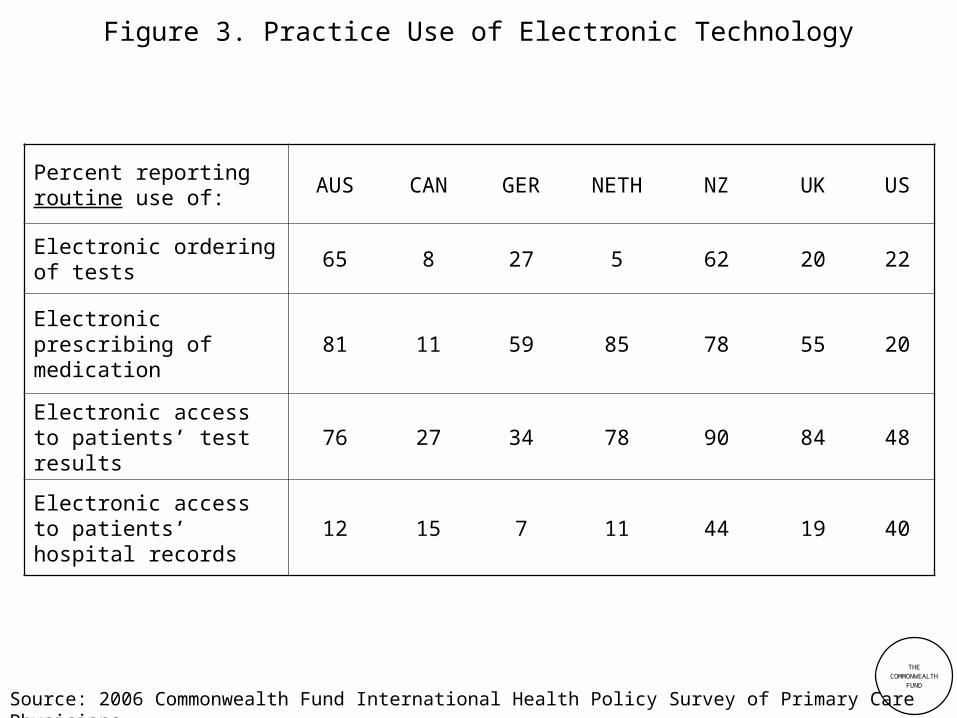
Figure 3. Practice Use of Electronic Technology
Percent reporting routine use of:
AUS CAN GER NETH NZ UK US
Electronic ordering of tests
65 8 27 5 62 20 22
Electronic prescribing of medication
81 11 59 85 78 55 20
Electronic access to patients’ test results
76 27 34 78 90 84 48
Electronic access to patients’ hospital records
12 15 7 11 44 19 40
Source: 2006 Commonwealth Fund International Health Policy Survey of Primary Care Physicians.
THECOMMONWEALTH
FUND
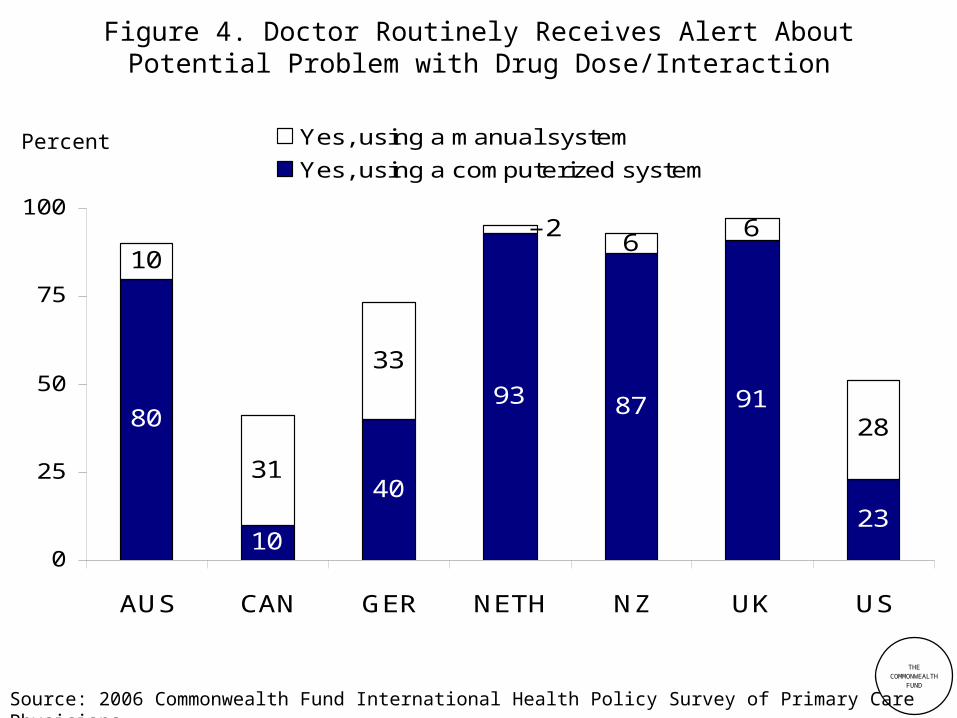
10
40
93 87 91
23
80 28
66
2
33
31
10
0
25
50
75
100
AUS CAN GER NETH NZ UK US
Yes, using a manual system
Yes, using a computerized system
Figure 4. Doctor Routinely Receives Alert AboutPotential Problem with Drug Dose/Interaction
Percent
Source: 2006 Commonwealth Fund International Health Policy Survey of Primary Care Physicians.
THECOMMONWEALTH
FUND
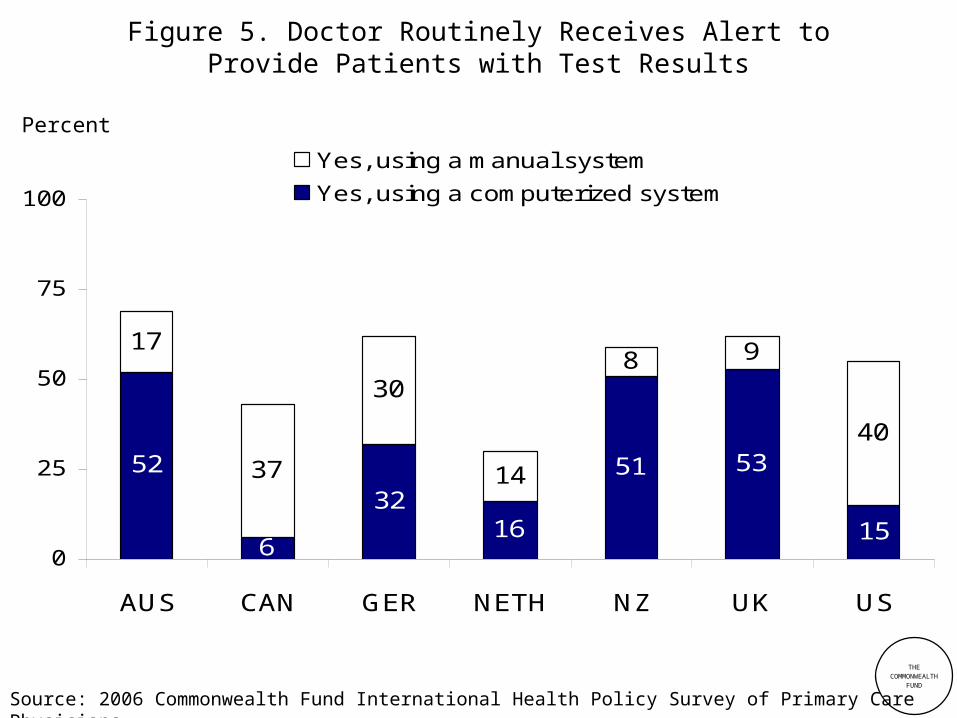
15
5351
1632
6
5240
98
14
30
37
17
0
25
50
75
100
AUS CAN GER NETH NZ UK US
Yes, using a manual system
Yes, using a computerized system
Figure 5. Doctor Routinely Receives Alert toProvide Patients with Test Results
Percent
Source: 2006 Commonwealth Fund International Health Policy Survey of Primary Care Physicians.
THECOMMONWEALTH
FUND
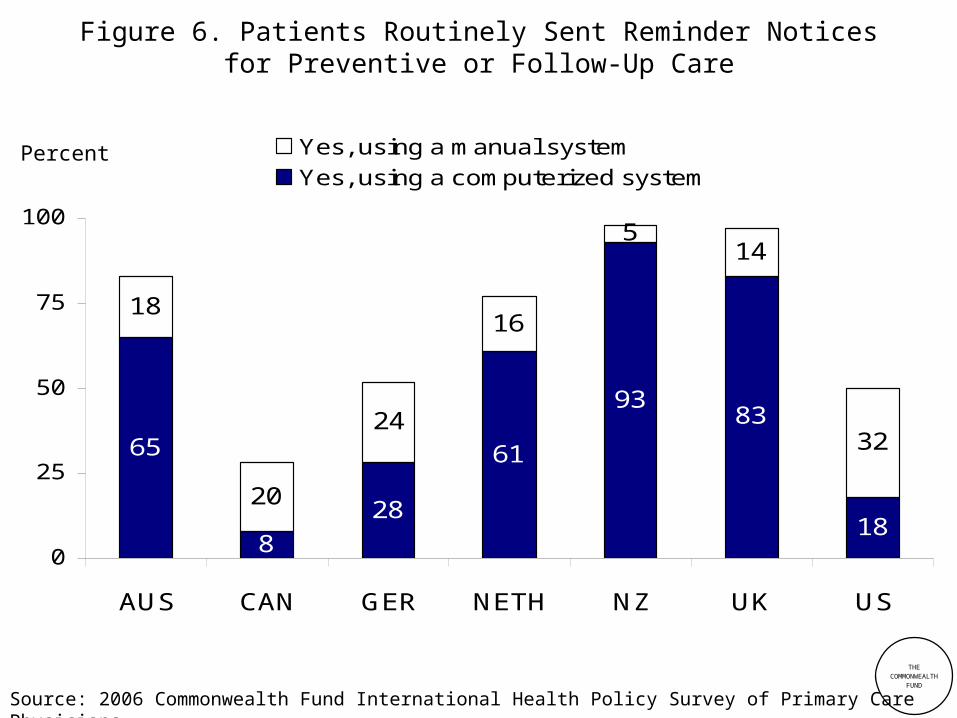
18
8393
61
288
65 32
145
16
24
20
18
0
25
50
75
100
AUS CAN GER NETH NZ UK US
Yes, using a manual systemYes, using a computerized system
Figure 6. Patients Routinely Sent Reminder Noticesfor Preventive or Follow-Up Care
Percent
Source: 2006 Commonwealth Fund International Health Policy Survey of Primary Care Physicians.
THECOMMONWEALTH
FUND
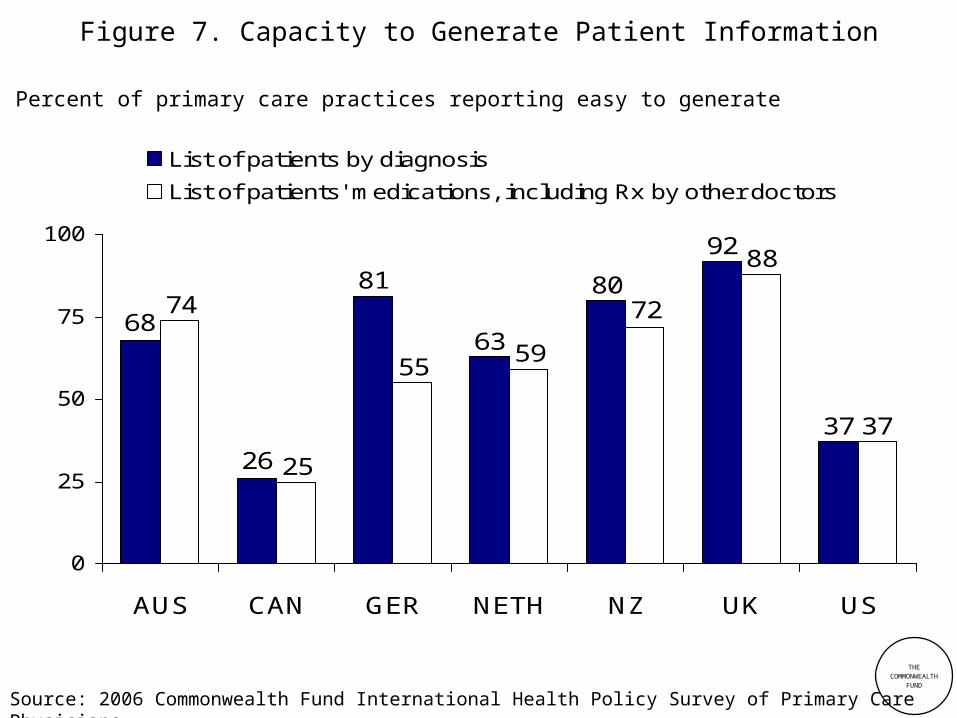
Figure 7. Capacity to Generate Patient Information
37
92
80
63
81
26
6874
25
5559
72
88
37
0
25
50
75
100
AUS CAN GER NETH NZ UK US
List of patients by diagnosis
List of patients' medications, including Rx by other doctors
Percent of primary care practices reporting easy to generate
Source: 2006 Commonwealth Fund International Health Policy Survey of Primary Care Physicians.
THECOMMONWEALTH
FUND
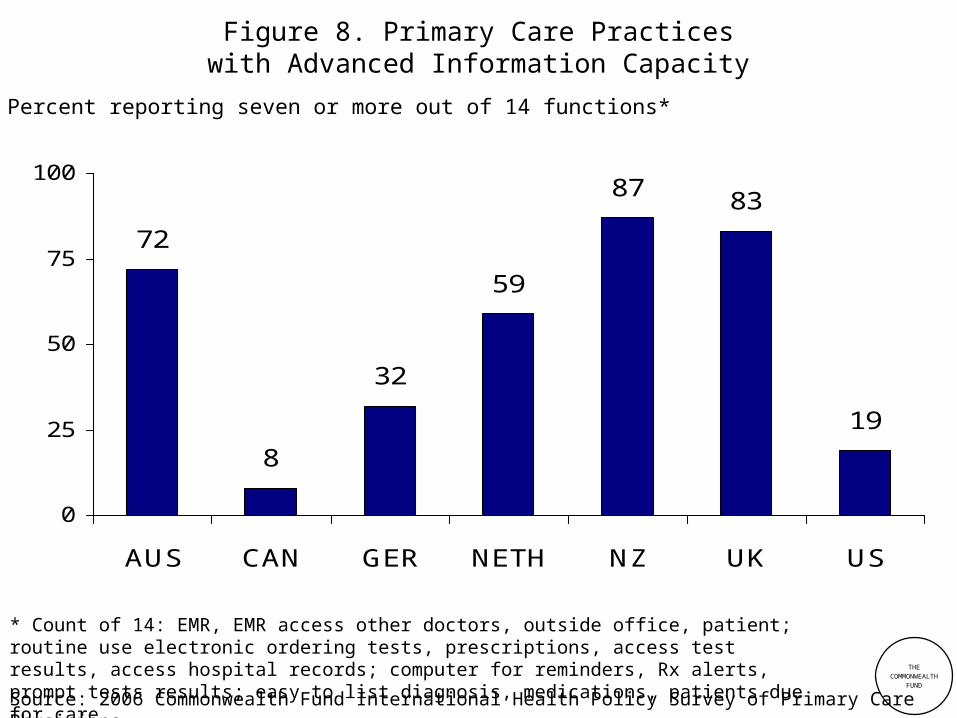
Figure 8. Primary Care Practiceswith Advanced Information Capacity
* Count of 14: EMR, EMR access other doctors, outside office, patient; routine use electronic ordering tests, prescriptions, access test results, access hospital records; computer for reminders, Rx alerts, prompt tests results; easy to list diagnosis, medications, patients due for care.
Percent reporting seven or more out of 14 functions*
72
8
32
59
87 83
19
0
25
50
75
100
AUS CAN GER NETH NZ UK US
Source: 2006 Commonwealth Fund International Health Policy Survey of Primary Care Physicians.

Access Experiences and Office Hours
THECOMMONWEALTH
FUND
THECOMMONWEALTH
FUND
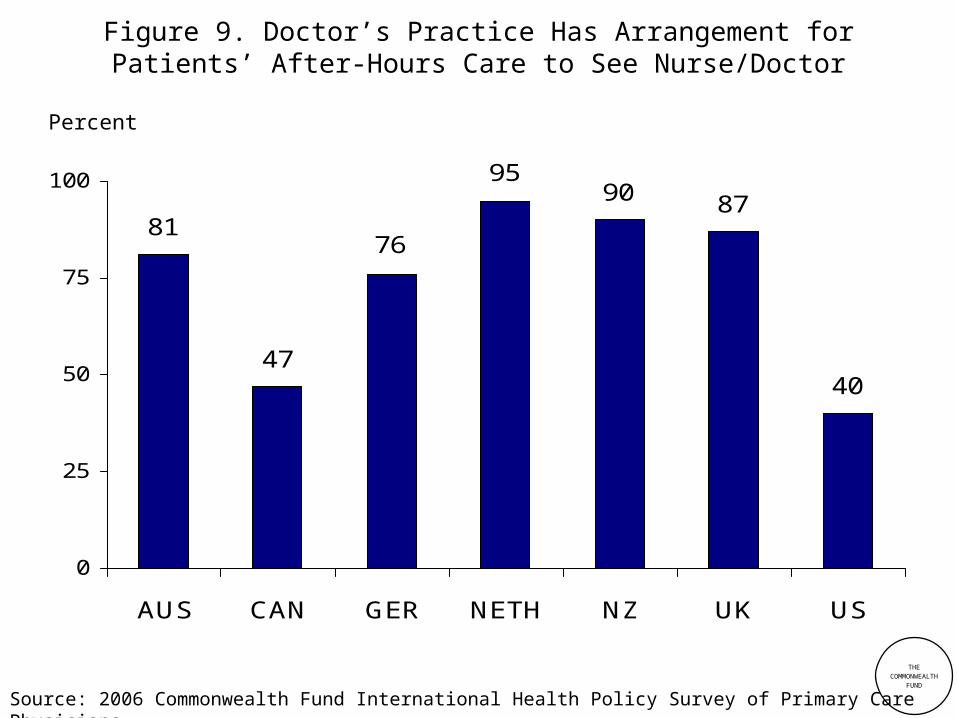
Figure 9. Doctor’s Practice Has Arrangement forPatients’ After-Hours Care to See Nurse/Doctor
40
879095
76
47
81
0
25
50
75
100
AUS CAN GER NETH NZ UK US
Percent
Source: 2006 Commonwealth Fund International Health Policy Survey of Primary Care Physicians.

THECOMMONWEALTH
FUND
Figure 10. Physicians’ Perception of Patient Access
15
24 23
7
27
13
51
0
25
50
75
AUS CAN GER NETH NZ UK US
6
51
8
2628
57
9
0
25
50
75
AUS CAN GER NETH NZ UK US
Patients Often Have DifficultyPaying for Medications
Patients Often ExperienceLong Waits for Diagnostic Tests
Percent Percent
Source: 2006 Commonwealth Fund International Health Policy Survey of Primary Care Physicians.

Coordination of Care
THECOMMONWEALTH
FUND
THECOMMONWEALTH
FUND
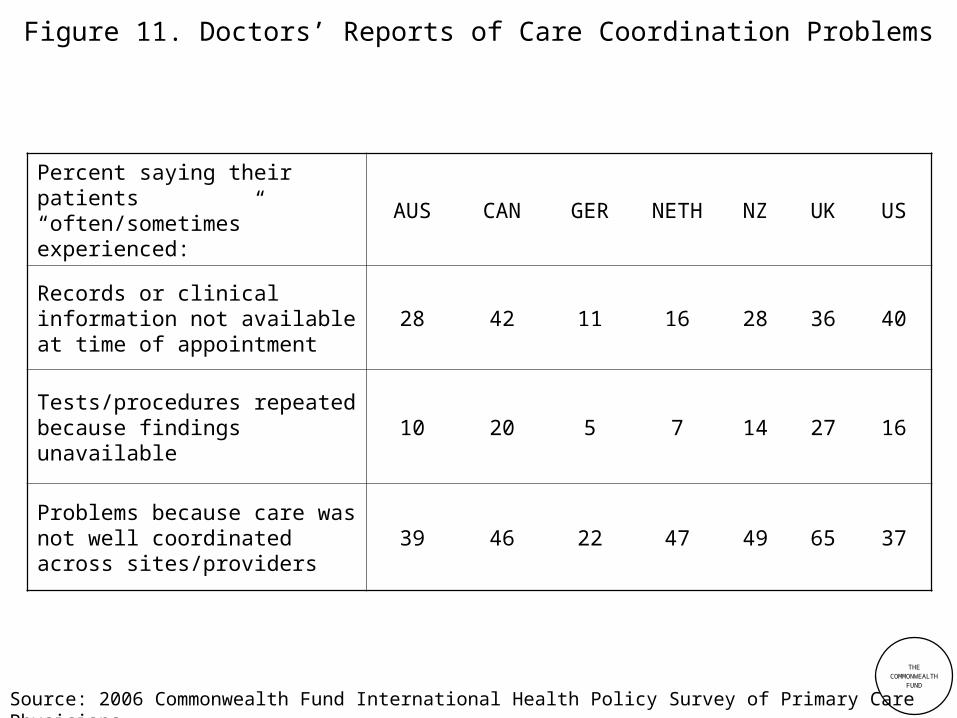
Figure 11. Doctors’ Reports of Care Coordination Problems
Percent saying their patients “often/sometimes” experienced:
AUS CAN GER NETH NZ UK US
Records or clinical information not available at time of appointment
28 42 11 16 28 36 40
Tests/procedures repeated because findings unavailable
10 20 5 7 14 27 16
Problems because care was not well coordinated across sites/providers
39 46 22 47 49 65 37
Source: 2006 Commonwealth Fund International Health Policy Survey of Primary Care Physicians.
THECOMMONWEALTH
FUND
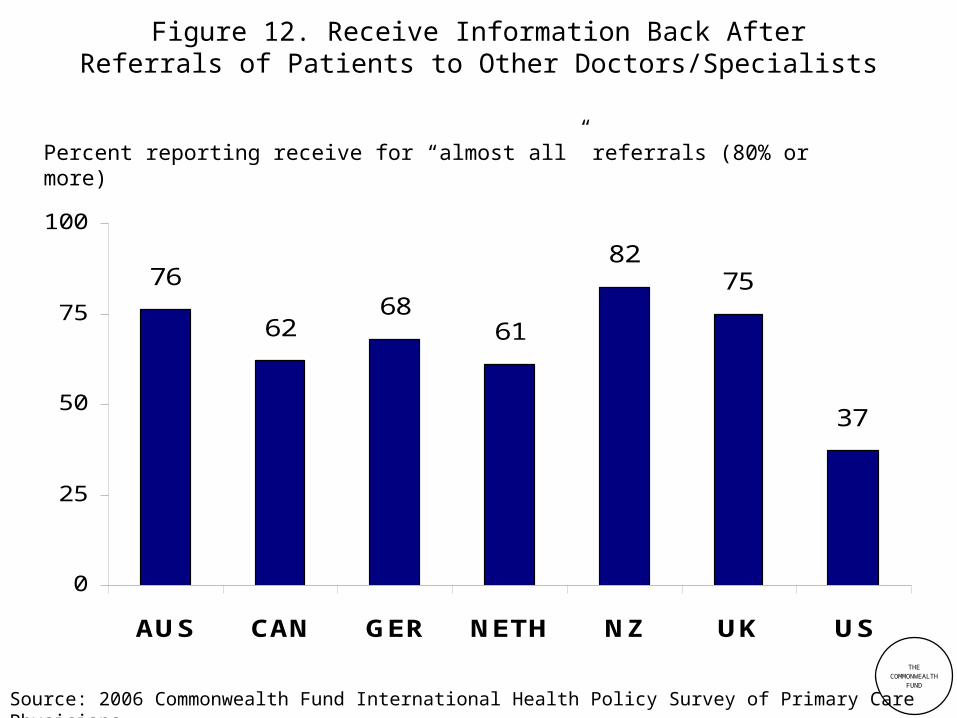
37
7582
6168
62
76
0
25
50
75
100
AUS CAN GER NETH NZ UK US
Figure 12. Receive Information Back AfterReferrals of Patients to Other Doctors/Specialists
Percent reporting receive for “almost all” referrals (80% or more)
Source: 2006 Commonwealth Fund International Health Policy Survey of Primary Care Physicians.
THECOMMONWEALTH
FUND
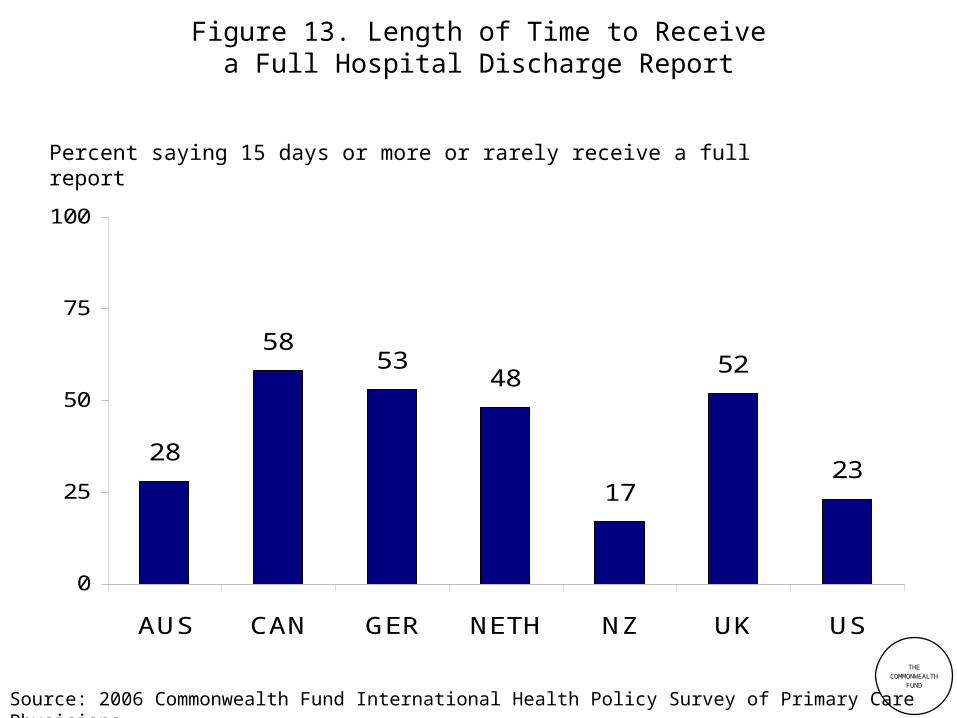
Figure 13. Length of Time to Receivea Full Hospital Discharge Report
28
5853
48
17
52
23
0
25
50
75
100
AUS CAN GER NETH NZ UK US
Percent saying 15 days or more or rarely receive a full report
Source: 2006 Commonwealth Fund International Health Policy Survey of Primary Care Physicians.

Care for Chronically Ill Patientsand Use of Teams
THECOMMONWEALTH
FUND
THECOMMONWEALTH
FUND
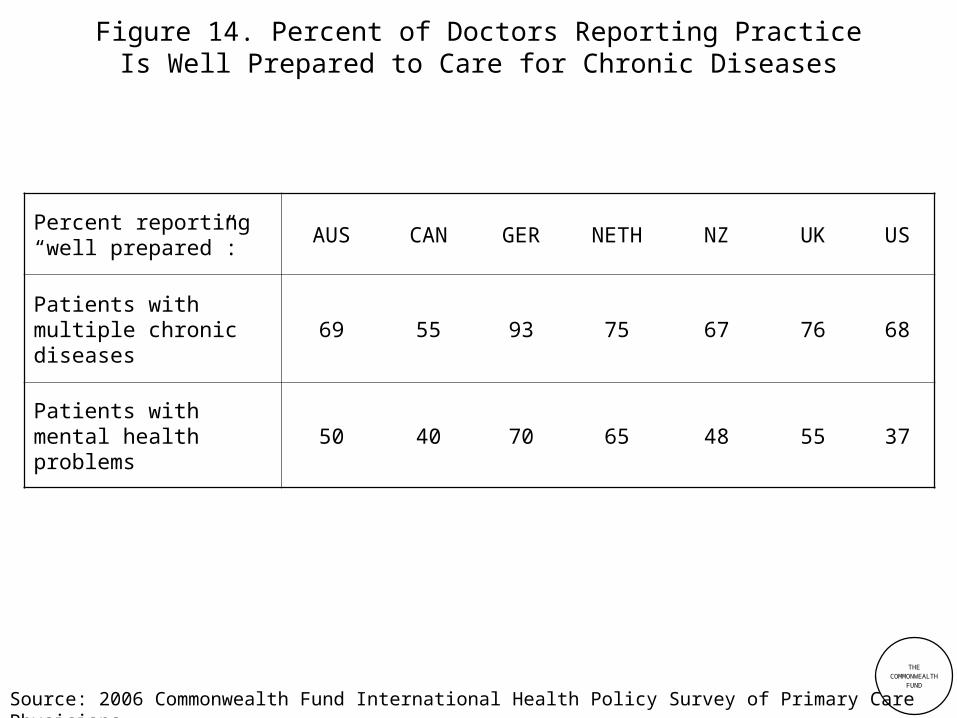
Figure 14. Percent of Doctors Reporting PracticeIs Well Prepared to Care for Chronic Diseases
Percent reporting “well prepared”:
AUS CAN GER NETH NZ UK US
Patients with multiple chronic diseases
69 55 93 75 67 76 68
Patients with mental health problems
50 40 70 65 48 55 37
Source: 2006 Commonwealth Fund International Health Policy Survey of Primary Care Physicians.

THECOMMONWEALTH
FUND
Figure 15. Capacity to Generate List of Patients by Diagnosis
Percent reporting very difficult or cannot generate
14
43
107 6
1
33
0
25
50
75
AUS CAN GER NETH NZ UK US
Source: 2006 Commonwealth Fund International Health Policy Survey of Primary Care Physicians.

THECOMMONWEALTH
FUND
Figure 16. Doctor Routinely Gives Patients withChronic Diseases Plan to Manage Care at Home
Percent giving written plan
29
14
63
2518 21
33
0
25
50
75
100
AUS CAN GER NETH NZ UK US
Source: 2006 Commonwealth Fund International Health Policy Survey of Primary Care Physicians.
THECOMMONWEALTH
FUND
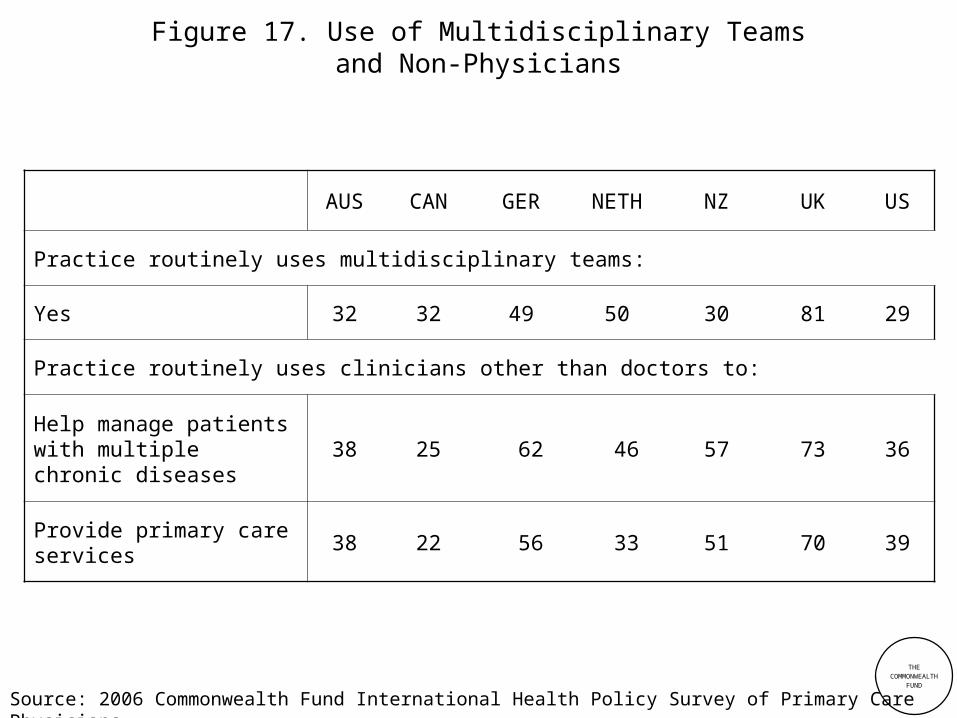
Figure 17. Use of Multidisciplinary Teamsand Non-Physicians
AUS CAN GER NETH NZ UK US
Practice routinely uses multidisciplinary teams:
Yes 32 32 49 50 30 81 29
Practice routinely uses clinicians other than doctors to:
Help manage patients with multiple chronic diseases
38 25 62 46 57 73 36
Provide primary care services
38 22 56 33 51 70 39
Source: 2006 Commonwealth Fund International Health Policy Survey of Primary Care Physicians.

Quality Initiatives
THECOMMONWEALTH
FUND

THECOMMONWEALTH
FUND
Figure 18. Physician Participation in Activitiesto Improve Quality of Care
AUS CAN GER NETH NZ UK US
Percent in past two years who:
Participated in collaborative QI efforts
58 48 76 70 78 58 49
Conducted clinical audit of patient care
76 45 69 46 82 96 70
Percent reporting their practice:
Sets formal targets for clinical performance
26 27 70 35 41 70 50
Source: 2006 Commonwealth Fund International Health Policy Survey of Primary Care Physicians.

THECOMMONWEALTH
FUND
Figure 19. Availability of Data on Clinical Outcomesor Performance
Percent reporting yes: AUS CAN GER NETH NZ UK US
Patients’ clinical outcomes
36 24 71 37 54 78 43
Surveys of patient satisfaction and experiences
29 11 27 16 33 89 48
Source: 2006 Commonwealth Fund International Health Policy Survey of Primary Care Physicians.
THECOMMONWEALTH
FUND
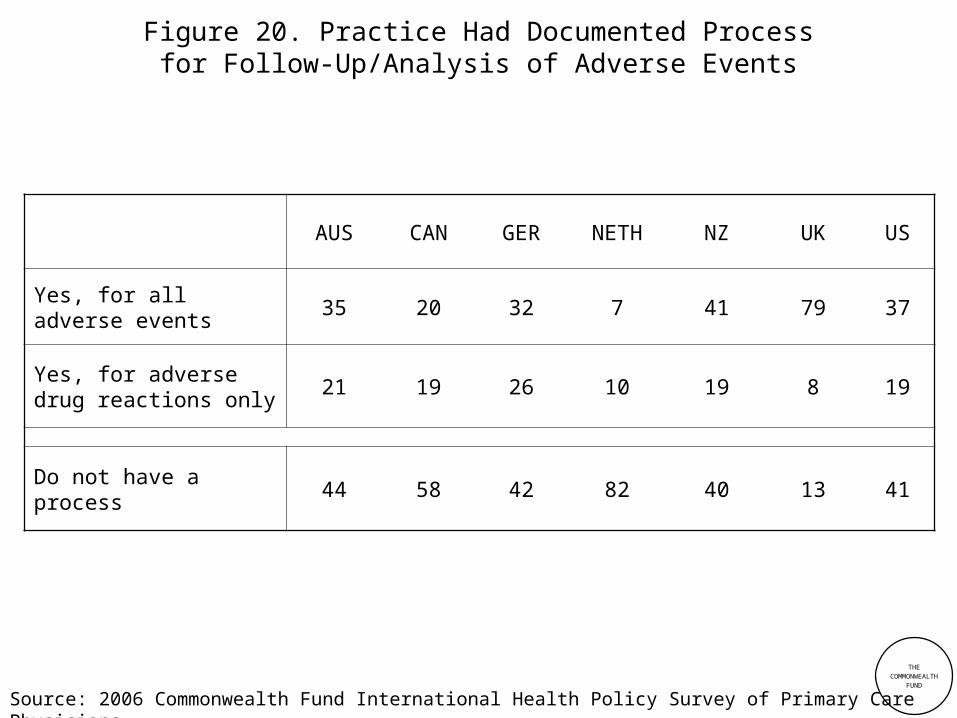
Figure 20. Practice Had Documented Processfor Follow-Up/Analysis of Adverse Events
AUS CAN GER NETH NZ UK US
Yes, for all adverse events
35 20 32 7 41 79 37
Yes, for adverse drug reactions only
21 19 26 10 19 8 19
Do not have a process 44 58 42 82 40 13 41
Source: 2006 Commonwealth Fund International Health Policy Survey of Primary Care Physicians.

THECOMMONWEALTH
FUND
Figure 21. Primary Care Doctors’ Reports ofFinancial Incentives Targeted on Quality of Care
Percent receive financial incentive:*
AUS CAN GER NETH NZ UK US
Achieving certain clinical care targets
33 10 9 6 43 92 23
High ratings for patient satisfaction
5 — 5 1 2 52 20
Managing patients with chronic disease/complex needs
62 37 24 47 68 79 8
Enhanced preventive care activities
53 13 28 18 42 72 12
Participating in quality improvement activities
35 7 21 28 47 82 19
* Receive or have the potential to receive.
Source: 2006 Commonwealth Fund International Health Policy Survey of Primary Care Physicians.
THECOMMONWEALTH
FUND
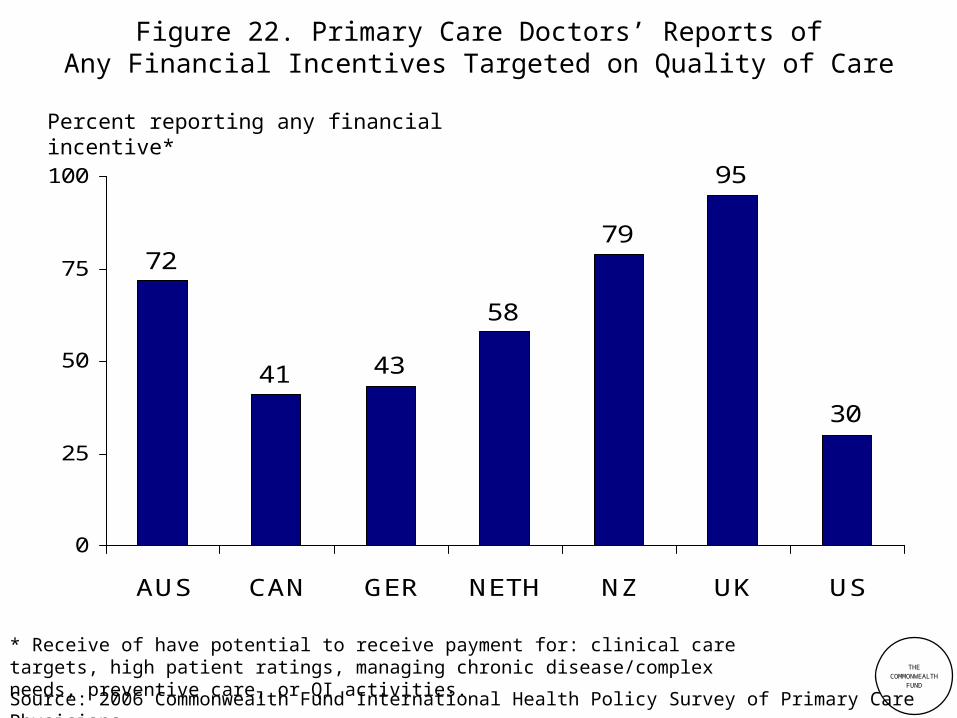
30
95
79
58
4341
72
0
25
50
75
100
AUS CAN GER NETH NZ UK US
Percent reporting any financial incentive*
Figure 22. Primary Care Doctors’ Reports ofAny Financial Incentives Targeted on Quality of Care
* Receive of have potential to receive payment for: clinical care targets, high patient ratings, managing chronic disease/complex needs, preventive care, or QI activities.
Source: 2006 Commonwealth Fund International Health Policy Survey of Primary Care Physicians.

Health System Views and Practice Satisfaction
THECOMMONWEALTH
FUND
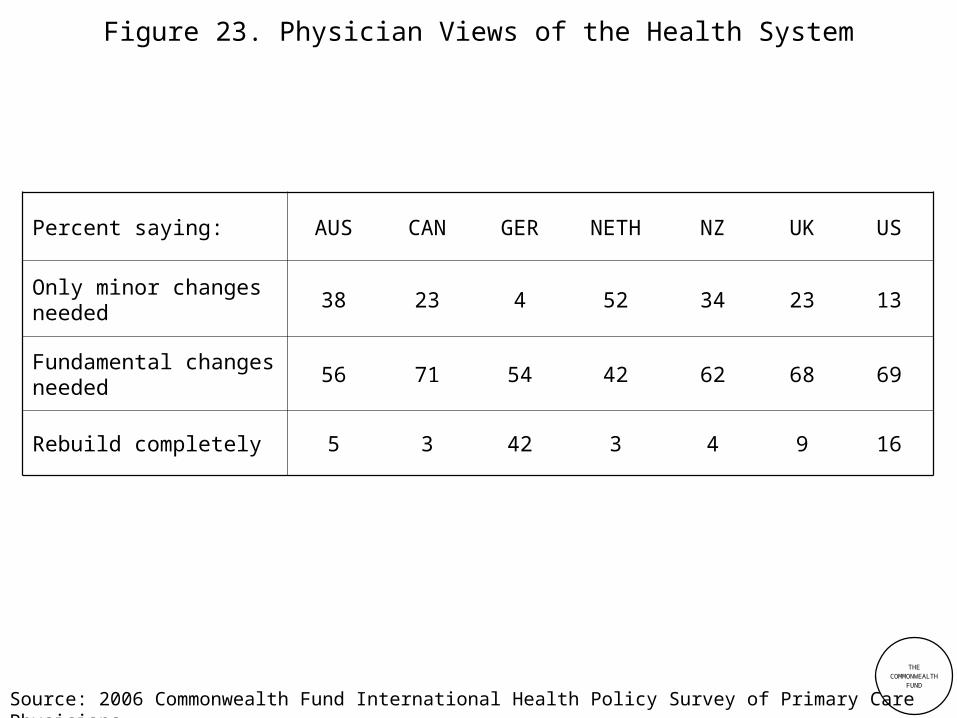
Figure 23. Physician Views of the Health System
Percent saying: AUS CAN GER NETH NZ UK US
Only minor changes needed
38 23 4 52 34 23 13
Fundamental changes needed
56 71 54 42 62 68 69
Rebuild completely 5 3 42 3 4 9 16
Source: 2006 Commonwealth Fund International Health Policy Survey of Primary Care Physicians.
THECOMMONWEALTH
FUND
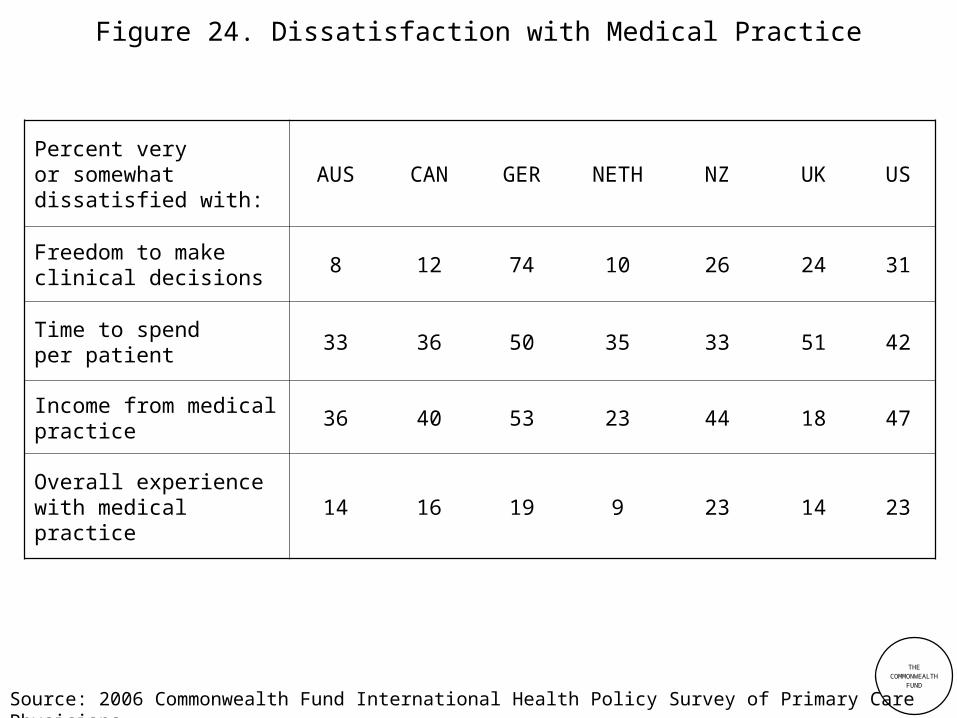
Figure 24. Dissatisfaction with Medical Practice
Percent veryor somewhat dissatisfied with:
AUS CAN GER NETH NZ UK US
Freedom to make clinical decisions
8 12 74 10 26 24 31
Time to spendper patient
33 36 50 35 33 51 42
Income from medical practice
36 40 53 23 44 18 47
Overall experience with medical practice
14 16 19 9 23 14 23
Source: 2006 Commonwealth Fund International Health Policy Survey of Primary Care Physicians.

THECOMMONWEALTH
FUND
Figure 25. Ability to Provide Quality Medical CareCompared with Five Years Ago
45
22
5
26
37
48
2117
36
83
39
25 27
40
0
25
50
75
100
AUS CAN GER NETH NZ UK US
Improved Become worse
Percent
Source: 2006 Commonwealth Fund International Health Policy Survey of Primary Care Physicians.
THECOMMONWEALTH
FUND
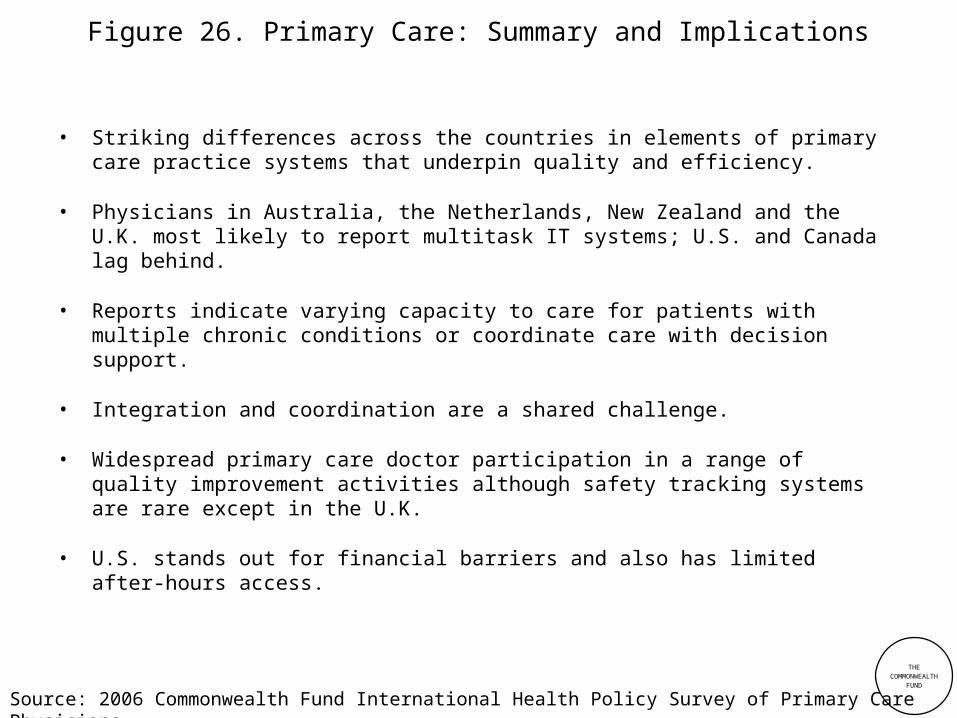
Figure 26. Primary Care: Summary and Implications
• Striking differences across the countries in elements of primary care practice systems that underpin quality and efficiency.
• Physicians in Australia, the Netherlands, New Zealand and the U.K. most likely to report multitask IT systems; U.S. and Canada lag behind.
• Reports indicate varying capacity to care for patients with multiple chronic conditions or coordinate care with decision support.
• Integration and coordination are a shared challenge.
• Widespread primary care doctor participation in a range of quality improvement activities although safety tracking systems are rare except in the U.K.
• U.S. stands out for financial barriers and also has limited after-hours access.
Source: 2006 Commonwealth Fund International Health Policy Survey of Primary Care Physicians.
THECOMMONWEALTH
FUND
Figure 27. Opportunities to Learn to Inform Policy
• Country patterns reflect underlying strategic policy choices and extent to which policies are national in scope:
– Payment policies for quality and care management.
– IT: Investing in primary care capacity and interconnectedness.
– After-hours access.
– Chronic disease management and use of teams.
• Primary care “redesign” is central to initiatives to improve health care system performance internationally.
• Evidence that national “system” focus is essential to build capacity.
• Striking country differences in primary care practices and national initiatives offer rich opportunities to learn.
Source: 2006 Commonwealth Fund International Health Policy Survey of Primary Care Physicians.

THECOMMONWEALTH
FUND
Acknowledgments
With appreciation to:
• Coauthors: Phuong Trang Huynh, Michelle M. Doty, Jordon Peugh, and Kinga Zapert, “On the Front Lines of Care: Primary Care Doctors’ Office Systems, Experiences, and Views in Seven Countries,” Health Affairs Web Exclusive (Nov. 2, 2006):w555–w571.
• Developing and Conducting Survey:Harris Interactive and Associates.
• Conducting Survey in the Netherlands: The Center for Quality of Care Research (WOK), Radboud University Nijmegen.
• Cofunders: The Australian Primary Health Care Research Institute,The German Institute for Quality and Efficiency in Health Care, andThe Health Foundation.
Source: 2006 Commonwealth Fund International Health Policy Survey of Primary Care Physicians.
Related Documents