THE COMMON CORE OF UNDERSTANDING AMONGST THE MICHIGAN EDUCATION COMMUNITY REGARDING THE IMPLEMENTATION OF THE COMMON CORE STATE STANDARDS FOR MATHEMATICS By Daniel Lee Clark A DISSERTATION Submitted to Michigan State University in partial fulfillment of the requirements for the degree of Mathematics Education—Doctor of Philosophy 2016

Welcome message from author
This document is posted to help you gain knowledge. Please leave a comment to let me know what you think about it! Share it to your friends and learn new things together.
Transcript

THE COMMON CORE OF UNDERSTANDING AMONGST THE MICHIGAN EDUCATION COMMUNITY REGARDING THE IMPLEMENTATION OF THE
COMMON CORE STATE STANDARDS FOR MATHEMATICS
By
Daniel Lee Clark
A DISSERTATION
Submitted to Michigan State University
in partial fulfillment of the requirements for the degree of
Mathematics Education—Doctor of Philosophy
2016

ABSTRACT
THE COMMON CORE OF UNDERSTANDING AMONGST THE MICHIGAN EDUCATION COMMUNITY REGARDING THE IMPLEMENTATION OF THE
COMMON CORE STATE STANDARDS FOR MATHEMATICS
By
Daniel Lee Clark
The current effort to implement the Common Core State Standards for
Mathematics (CCSSM) is the latest in a series of mathematics standards
implementation efforts in the United States over the last half century. When
implemented, previous standards efforts have either failed or been less
successful than anticipated for a variety of reasons. Two oft cited reasons are
(1) a lack of a shared understanding about what the standards are and how to
incorporate them effectively at various levels of an existing education system,
and (2) perceived and/or real flaws in the standards themselves. With this past
in mind, this study sought to document whether and to what extent these
problems exist within Michigan’s education system as the state implements the
CCSSM. More specifically, this study sought answers to two research questions:
(1) To what degree is there alignment between Michigan Department of
Education (MDE) officials’, regional professional development providers’, and
teachers’ views of the goals of CCSSM implementation? (2) Do those outside
MDE charged with the implementation feel adequately supported in effecting
their part of the transition to the CCSSM? MDE officials, regional professional
development providers, and teachers were surveyed and interviewed in order to
gather their thoughts on what they believe the goals of the CCSSM to be, what
they believe their roles in the implementation effort are, and how they are
supported in that effort. Responses were analyzed for commonalities and
differences in the perceptions of individuals at the varying levels of the state’s
education system. While elementary teachers were confident in their abilities to
implement the CCSSM effectively, they still desired more professional resources
and were generally unfamiliar with several resources others in Michigan’s
education system were promoting.

Copyright by DANIEL LEE CLARK 2016

v
This dissertation is dedicated to the memory of my grandparents,
Rovona and Orval Miller, who desperately wanted to see me graduate.
I love you. Sorry I’m slow.
vi
ACKNOWLEDGMENTS
A journey this long always involves a great many people who need to be
thanked. I’ll begin with the Program in Mathematics Education at Michigan State
University. Thank you to my advisor, Jack Smith, and mentor, Kristen Bieda,
who were both expert at pushing me when I needed it while also meeting me
where I was at and believing in me when it seemed like few others did. Thank
you to each of my guidance committee members, Sandra Crespo, Bob Floden,
Corey Drake, and Glenda Lappan, for your contributions that helped to make this
dissertation both a meaningful document and a manageable process. I’m also
grateful to Lisa Keller for many things in my time at Michigan State, but most
important among them is her guidance in helping me become a better
mathematics teacher.
Outside the faculty ranks, I’d also like to thank the students of the Program
in Mathematics Education at Michigan State University. When I sat down to write
the individual acknowledgments that so many of you deserve, I soon realized I
was working on another practicum-sized document. So, I hope you can accept
my thanks here en masse. Finally, with respect to Michigan State, I’d also like to
thank the Graduate Employees Union and Jacquelyn Lloyd. Thanks for the work
you do on behalf of graduate students, the encouragement, and showing me how
much difference an individual can make.
I also need to thank my parents, Maureen and Dick Clark. The process of
getting this degree in education has shown me what a big deal it is for two

vii
parents who had not gone to college at the time to tell a kid that he was going to
college so much from such an early age that it just became an assumption that
was never questioned. I didn’t always appreciate what a huge difference that
made. Thank you for instilling that desire in me.
Thank you to the teachers and professors who inspired my interest and
got me competing in mathematics, including Janet Ritchhart, Jane Abington,
Wanda Grimes, Bill Pawling, and Steve Smith. Thank you also to the friends
who competed with me and alongside me, always challenging me to do better
and be better, including Jackie Dechongkit, John Haney, and Matt Wright.
More broadly, thank you to many faculty in the mathematics, physics, and
psychology departments at Truman State University. Also, thank you to a great
many people involved with the Joseph Baldwin Academy over the last two
decades. I learned a great deal about education and leadership working with
you. Special thanks to Kevin Minch, Adam Davis, Rachel Brown, Laura
Provance, and Ashley Ramsey who have each been great sounding boards and
taught me how to look at various aspects of leadership and decision making.
Also, thanks to the many great JBA students over the years, including Allie
Ehrlich and Neal Johnson, as well as the tolerable repeat offenders like Amanda
Stamer and Emma Rush.
Slightly more miscellaneous gratitude also needs to be expressed to the
following individuals: Thank you to Kate Johnson, Amy Shipp, and Bethany Zier
for encouraging me to keep communicating. Thanks to Tim Deveney and
Jonathan Self of their insightful comments. Thanks to Chris Ross for the prayers.

viii
Thanks to Michael Morissette and Kevin Lawrence for inviting me to become a
member of #PrimeSteeleheads for a much needed weekly respite. Thanks to
Ryan Turner for a lot of text-based support over the years, and to the community
at roboracer.net for providing a great forum for it.
And, of course, thank you to my newly minted fiancée, Julie Hanch.
Thanks for all your support and for making this dissertation only my second
biggest accomplishment of the last month. I’m excited to see where the next few
score take us.
Oh, and thanks to Stephen Chanderbhan for his steadfast entertainment
via crayon brackets…don’t ask.

ix
TABLE OF CONTENTS
LIST OF TABLES xi KEY TO ABBREVIATIONS xii Chapter I: Introduction, Literature Review, and Motivation 1 Common Core State Standards for Mathematics’ Place in the Mathematics Education Landscape 1
Michigan’s initial situation with respect to the CCSSM 1 Subsequent legislation 2
Literature Review and Background 4 History of mathematics standards movement 4
New Math 6 A Nation at Risk and the 1980s 8 California Framework 10 The accountability movement and the CCSSM 12
Theory of standards-based reforms 17 Framework 17
Models of the education system 17 Perspective 19
Motivation 20 Problem Statement 22 Research Questions 23 Chapter II: Method 24 General Approach 24 Methods of Data Collection 24
State level data collection and snowball sampling 25 Regional level data collection 28
Regional survey instrument 28 Regional participants 29 Regional interviews 32
Local level data collection 33 Local survey instrument 33 Local participants 34 Local interviews 38 Limitations 39
Methods of Data Analysis 41 Qualitative analysis 41 Quantitative analysis 41 Combining the survey and interview data 41
Chapter III: Results 44
x
Organization of the Chapter 44 Goals of the CCSSM 46
Changes in standards related to CCSSM implementation 46 Reception of the CCSSM 54
Methods of Support for Teachers 58 Crosswalk documents 59 MAISA sample units 62 SBAC released items 66 Additional resources 71
CCSSM Readiness 73 Teacher readiness 73 Student and school readiness 76
Interactions with the State 80 Interactions with MDE 80 Political aspects of the CCSSM implementation 82
Chapter IV: Discussion 87 Organization of the Chapter 87 Summary 87
Goals of the CCSSM 87 Methods of support for teachers 90 CCSSM readiness 93 Interactions with the state 95
Recommendations 98 Treat shifts in content as significant 98 Crosswalk documents should address content and practices 98
Limitations and Recommendations for Further Research 99 APPENDICES 100
APPENDIX A: Regional Survey 101 APPENDIX B: Local Survey 106
REFERENCES 117

xi
LIST OF TABLES
Table 1: Teacher Survey Sample 37 Table 2: Teacher Interview Sample 38 Table 3: New Content and Content Shifts 49 Table 4: Transition in Teaching Versus Content 49 Table 5: Level of Depth and Rigor 50 Table 6: Content Coverage Comparison 50 Table 7: Disposition Toward CCSSM Transition 55 Table 8: Crosswalk Familiarity and Usefulness 60 Table 9: MAISA Sample Unit Familiarity and Usefulness 63 Table 10: SBAC Released Items Familiarity and Usefulness 68 Table 11: SBAC Usefulness Changes 68 Table 12: Necessity of Additional Financial and Professional Resources 72 Table 13: Teacher Readiness for CCSSM Implementation 74 Table 14: Teacher Readiness for CCSSM Aligned Assessments 76 Table 15: Student Readiness for CCSSM Aligned Assessment Content 77 Table 16: Student Readiness for Computerized Assessments 77 Table 17: Technology Infrastructure Readiness 78 Table 18: Interactions with MDE 81 Table 19: CCSSM Political Issues Affecting Work 83

xii
KEY TO ABBREVIATIONS
CCSSM Common Core State Standards for Mathematics NCTM National Council of Teachers of Mathematics SBE State Board of Education ISD Intermediate School District SBAC Smarter Balanced Assessment Consortium MDE Michigan Department of Education NCEE National Commission on Excellence in Education NAEP National Assessment of Educational Progress NGA National Governors Association CCSSO Council of Chief State School Officers OEII (MDE’s) Office of Education Improvement and Innovation RESA Regional Educational Service Agency M2C2 Michigan Mathematics Consultants and Coordinators GLCEs (Michigan’s) Grade Level Content Expectations PD Professional Development MAISA Michigan Association of Intermediate School Administrators ELA English Language Arts

1
Chapter I: Introduction, Literature Review, and Motivation
Common Core State Standards for Mathematics’ Place in the Mathematics
Education Landscape
The Common Core State Standards for Mathematics (CCSSM) is the
latest iteration of standards in the standards movement of mathematics
education. The CCSSM contain both content standards that outline the specific
things that students should learn and practice standards that are general
processes and dispositions students should develop as learners of mathematics
(National Governors Association & Council of Chief State School Officers, 2010).
While previous standards efforts have existed on a national scale, such as the
National Council of Teachers of Mathematics’ (NCTM) Principles and Standards
for School Mathematics (2000), each state still had its own set of mathematics
standards, which aligned with NCTM’s standards to varying degrees. Developed
as a collaboration between states, the CCSSM have been adopted in 45 states.
While what exactly adoption means has begun to vary in a number of states, this
represents the most comprehensive effort to date to get most of the nation’s
schools and students on the same path with respect to mathematics standards.
Michigan’s initial situation with respect to the CCSSM.
Shortly after the final CCSSM document came out, Michigan’s State Board
of Education (SBE) voted to adopt the CCSSM as the state’s new mathematics
standards in June 2010 (Michigan Department of Education, n.d.a). Like many
other states, individuals from Michigan were involved in the development of the
CCSSM (NGA & CCSSO, n.d.). After the SBE adopted the CCSSM, the initial

2
process of implementation began later that year (MDE, n.d.b). The plan for
implementation included the SBE working with intermediate school districts
(ISDs) and math and science centers “to provide ongoing professional
development that supports the transition” (p. 3). Initially, districts were expected
to have curricula and instruction that aligned with the CCSSM in place for the
2012-13 school year. New CCSSM-aligned assessments would follow and be in
place for the 2014-15 school year.
With the adoption and intended implementation timeline, Michigan had
been in a relatively similar place to many other states. In fact, Michigan had
joined with 24 other states as members of the Smarter Balanced Assessment
Consortium (SBAC) and was one of 23 governing states in SBAC (SBAC, 2012).
Each of these states expected to have the new CCSSM-aligned assessment in
place for the 2014-15 school year.
Subsequent legislation.
While other states continued with their CCSSM implementation as
planned, Michigan and a few other states were slowed down due to backlash
against the CCSSM and their implementation. On June 13, 2013, Governor Rick
Snyder signed Michigan’s state budget for the fiscal year beginning on the
following October 1 into law (Keesler & Martineau, 2013). Included in that budget
was a provision that no state money could be used to implement the CCSSM.
Despite approving the budget, the Governor publically expressed support for the
CCSSM and encouraged the legislature to reconsider the implementation funding
ban (Oosting, 2013). Ahead of the new fiscal year, both houses of the state

3
legislature debated whether to lift than ban on the use of state funds for CCSSM
implementation and held hearings on the issue. Ultimately, the House decided to
lift the ban on funding on September 26, by a vote of 85 – 21 (Ujifusa, 2013).
By October 1, the state Senate had not voted. Because the new fiscal
year had begun, the state began halting any expenditures on CCSSM
implementation (Smith, 2013a). That resulted in the removal of CCSSM related
resources from the MDE website. Interestingly, during the time while the state
could not spend money on CCSSM implementation, there was no such
prohibition for individual school districts (Keesler & Martineau, 2013). On
October 24, the Senate voted in favor of funding CCSSM implementation (Smith,
2013b). Immediately thereafter, the state superintendent ordered the
continuation of all previously stalled CCSSM implementation efforts (Smith,
2013c). At that point, it was unclear what effect that relatively brief hiccup at the
state level would have on the CCSSM implementation process. As will be seen
in the results of this study, some aspects of CCSSM implementation were
affected a great deal, particularly the roll out of the new assessments.
As a result of the compromise that allowed renewed CCSSM funding, the
legislature required the Michigan Department of Education (MDE) to prepare a
report that considered other CCSSM aligned testing options besides SBAC. The
report showed that due to time constraints SBAC was the only option available
that could be implemented properly (Smith, 2014a). The legislature disagreed
with that assessment and discussed appropriations language that would require
that state to use their previous assessment for the 2014-15 school year (Smith,
4
2014b). That previous assessment was not aligned with the CCSSM, though.
Ultimately, the legislature removed Michigan from the SBAC and ordered the
creation of a new assessment for the 2014-15 school year (Ujifusa, 2014). This
test was ultimately called the M-STEP. It was developed during the beginning of
the 2014-15 school year for use statewide in the spring of that school year.
Even with the issue of the assessment seemingly settled, there are still renewed
calls in the Michigan legislature for the state to drop the CCSSM as of this writing
(McVicar, 2016). It is within this statewide political context that this study was
conducted.
Literature Review and Background
History of mathematics standards movement.
Choosing a specific event so that one can point to a timeline and say,
“The first true efforts at implementing mathematics standards to reform
mathematics education began here,” is a difficult task that has no definitively
correct answer. On the one hand, the Common Core State Standards for
Mathematics are clearly not the beginning of the standards movement. On the
other hand, if the meaning of “standards” is stripped all the way down to mean
merely what it is that learners are expected to learn, then textbook authors have
at least implicitly incorporated their own standards, perhaps reflective of the
mathematical communities of which they were members, into textbooks for
centuries.
That the beginning of the standards movement is so difficult to pinpoint
can at least partially be attributed to the fact that standards have grown

5
incrementally in both robustness and influence over time. Broadly speaking, by
“robustness” I mean the general care with which the standards were crafted.
This can take into account how many people were involved in writing the
standards, and how much the standards were based on research. For example,
by the late nineteenth and early twentieth centuries, various smaller groups
began writing about what should be learned by students in American
mathematics classrooms. At the time, though, education research, and even
more so mathematics education research, was in its infancy. Standards of the
time were much more based on extant practices and perceived societal needs
and norms than on any theories of learning. As the twentieth century
progressed, standards came to more reflect the learning theories of their times.
As previously stated, standards also grew in terms of influence as well.
Originally, textbook authors aimed the ideas they thought were important at the
elite few who got to study mathematics. As access to education grew, education
came to be seen as a right for all citizens. As more and larger education
systems grew and became interconnected, it became necessary for various
reasons to attempt to standardize what it was that students in those systems
should be learning. Lone schoolhouses turned into school districts. School
districts became coordinated by state departments of education. Later, the
federal Office of Education was elevated to the Department of Education in 1979.
Even though education has remained chiefly controlled at the local and state
levels, the federal Department of Education assists the state and local education
system and can exert influence through funding for those systems. As the

6
nation’s education systems and channels of influence became more centralized,
the opportunity for standards to influence more classrooms and students grew.
With these ideas in mind, we’ll begin our brief look at the history of the
mathematics standards movement with New Math.
New Math.
Changes in mathematics standards often accompany a perceived crisis
affecting the country. When the USSR launched Sputnik 1, the prevailing
wisdom was that the country must produce more professionals proficient in
mathematics and science to keep up with and ultimately surpass the USSR. This
shook up American attitudes regarding science and technology enough that new
ideas for mathematics and how to teach it were much more openly embraced
than they had been previously (Walmsley, 2007). This paved the way for New
Math to gain prominence.
New Math was one of the first large scale, nationwide efforts to change
what was learned in mathematics classrooms and how it was learned. Unlike
more recent standards efforts that we will consider, New Math did not involve a
single, widely publicized document of exactly what should be learned and when
(Walmsley, 2007). Rather, it was a group of many different mathematics
curricula projects promoting similar new ideas about K-12 mathematics content
(Walmsley, 2003).
The main idea of New Math was that K-12 students should be taught to
think about and do mathematics like professional mathematicians do. Emphasis
was placed on the learning of logic, set theory, and mathematical critical thinking

7
skills (Walmsley, 2007). There was also an increased emphasis on getting
students to conceptually understand the mathematics they were doing
(Walmsley, 2003). Some of these ideas are present in the reform efforts of the
present day.
Ultimately, New Math had its day in the sun for most of the 1960s. By the
end of that decade, several problems were becoming more apparent and less
avoidable. First, several important groups of people were not able to cope with
New Math (Walmsley, 2003; Schoenfeld, 2003). “If teachers feel uncomfortable
with a curriculum they have not been prepared to implement, they will either shy
away from it or bastardize it. If parents feel disenfranchised because they do not
feel competent to help their children, and they do not recognize what is in the
curriculum as being of significant value…they will ultimately demand change,”
(Schoenfeld, 2003, p. 5). Despite funding for summer institutes for teachers to
learn about New Math, there was not enough to go around (Walmsley, 2003).
Combining frustrated teachers with parents who did not see the mathematics
their children were doing as useful helped lead to an unsuccessful end for New
Math.
Also, one will recall that New Math did not have a single standards
document that informed all the curricula efforts. This made evaluating and
comparing New Math curricula projects quite difficult (Walmsley, 2003).
Standardized tests of the time, such as the SAT, were not aligned to the goals of
New Math. Furthermore, each of the New Math curriculum efforts had goals that

8
differed from the other projects’ goals by enough that finding a test to fairly
compare groups of children using different curricula was difficult.
In summary, New Math suffered from a lack of shared understanding in
the education community with regard to what should be taught in large part
because there was no single standards document. This lack or shared
understanding, combined with a lack of resources, led to an inability to
incorporate New Math effectively into schools. Also, the shift to New Math
resulted in many people feeling the ideas of New Math themselves were flawed
in general. In the end, though, the New Math movement gave way to the Back to
Basics era (Walmsley, 2003, 2007; Schoenfeld, 2003). More emphasis was
placed on rote arithmetic, while less emphasis was placed on problem solving
and nontraditional topics. Previously, standardized test scores had eroded at
least partially because the tests were not aligned with the New Math curricula.
Through the 1970s, scores continued to decline despite the shift of focus to
arithmetic and computation. This led to the educational crises of the 1980s.
A Nation at Risk and the 1980s.
As stated earlier, changes in mathematics standards often accompany a
perceived crisis affecting the country. If the declining mathematics scores on
standardized tests were not enough of a crisis, the late 1970s and early 1980s
also found America in an economic crisis (Schoenfeld, 2003). This economic
downturn and relative rise of other countries’ economies caused another
refocusing of American attention on education, specifically mathematics and
science.

9
By this time, though, the sources for standards of what students should
learn and the organizations weighing in on the process had become much more
centralized. This was true at both the national and state level. In 1980, the
NCTM released its Agenda for Action. While acknowledging that arithmetic skills
were important, this document did push back against the Back to Basics
paradigm. It advocated for the use of newly available technology in the
classroom, increased focus on problem solving, development of assessments
that would test students for more authentic understanding, and working to gain
the support of the public (NCTM, 1980). This document also informed the
standards work that the NCTM pursued in the 1980s.
NCTM was not the only organized body attempting to spur reform of
mathematics education for perceived national needs. In 1983, the National
Commission on Excellence in Education (NCEE) released their report on the
quality of the country’s education entitled A Nation at Risk. In forming the report,
the commission reviewed current research and convened several panels. As the
title implies, the content of the report was quite dire. Among many other things,
the report recommended a more rigorous curriculum of mathematics for all
students based on understanding, more rigorous standards for achievement at
the high school and college levels, more educated mathematics teachers, and
more of a central role for federal and state governments in helping local school
districts make sure the more rigorous standards could be met (NCEE, 1983).
The report proved to be quite influential. Within just three years, “forty-one states
had increased their high school graduation requirements, thirty-three states
10
developed competency tests, thirty states initiated teacher competency tests, and
twenty-four states had started teacher salary enhancement programs”
(Walmsley, 2007, p. 42).
California Framework.
One state that had already begun working on some of these issues was
California. That state published a new mathematics framework for its schools in
1985 (Wilson, 2003). The writing of these standards was done by teachers,
educators, and curriculum developers who addressed many of the issues raised
by NCTM (1980) and NCEE (1983). In addition to computational skills, the
framework called for emphasis on problem solving and using computers to do
mathematics (California State Department of Education, 1985). It also called for
new testing procedures, textbooks, and professional development opportunities
for teachers. Finally, expectations for what students should learn within certain
grade bands were discussed.
While the framework’s writing process was contentious, and it had its
share of initial detractors, it was published in 1985 to a mostly positive reception.
During the next revision cycle in 1992, it was expanded on (Wilson, 2003). This
was true in several ways. In terms of the framework’s size, it more than
quadrupled. A few new content areas were added, and previous content was
elaborated. Also, the types of people included in the authorship team and review
process increased. This time, mathematicians were explicitly included, and the
document received over 500 reviews before it was ultimately published.

11
By the early 1990s, though, this standards effort had clearly begun to go
downhill. In 1992 and 1994, California students performed unusually poorly
compared to students from other states on the National Assessment of
Educational Progress (NAEP) (Wilson, 2003). This, in part, fueled a backlash
against the new mathematics framework. Little thought was given to how the
aims of the NAEP exam aligned with the goals of other states’ mathematics
standards versus California’s. Nevertheless, the content of the standards and
what they expressed as what it meant to do mathematics came under attack.
Part of the parents’ frustration with homework and grading was due to
teachers’ own frustration with the new standards. Most teachers tasked with
teaching mathematics within the new framework had been taught in a traditional,
rote fashion. They had also rarely, if ever, interacted with the framework
document itself (Wilson, 2003). Naturally, being asked to teach mathematics in a
way that was unfamiliar to them, including some topics that were unfamiliar to
them, proved to be difficult. Initially, there was money set aside, and concerted
efforts at mass professional development were made. Ultimately, the
professional development efforts were not big enough to begin with, and the
money funding them ebbed. In 1990, a series of case studies was published in
Educational Evaluation and Policy Analysis that sought to show how individual
teachers in California classrooms were working with the framework (Ball, 1990;
Cohen, 1990; Wilson, 1990). One fifth grade teacher whose district adopted new
textbooks aligned with the framework still held quite traditional beliefs about
mathematics teaching and learning, did not understand certain topics in the book,

12
fit the book into a very traditional presentation of mathematics in his classroom,
and was openly hostile to the reform efforts (Wilson, 1990). The other case
studies showed teachers who thought they were teaching in a reform-oriented
way in keeping with the framework; however, when educators observed their
teaching over the course of a year, they saw largely traditional mathematics
classrooms with only glimmers of the ideas for which the new framework
advocated.
Ultimately, the California framework headed down the same path as New
Math. While there were some innovations compared to New Math, such as
actual codified standards with an attempted inclusive author and review team,
this standards effort could not avoid the same fate. Teachers who were
unfamiliar with aspects of content they were to teach and pedagogy they were to
use were in a difficult position with respect to implementing the new standards.
Perceived flaws with the standards themselves combined with a lack of shared
understanding amongst policy makers, professional developers, and teachers
about what the standards were and how to implement them effectively
contributed greatly to the lack of success of these standards.
The accountability movement and the CCSSM.
Due in part to publications like Agenda for Action (NCTM, 1980) and A
Nation at Risk (NCEE, 1983), a push came not just for standards but also for
increased accountability on the part of the education system. Through this time,
standards had come to be seen as necessary, but each state worked to create
and maintain its own set of standards. The NCTM sought to bring some clarity

13
and consistency to the situation by developing a set of standards that states
across the country could use. As a result, NCTM published its Curriculum and
Evaluation Standards for School Mathematics in 1989.
This new set of standards published by the NCTM (1989) had some new
advantages over previous standards efforts, but also suffered from some of the
same criticisms. The document once again emphasized a focus on problem
solving as the less formal New Math had. They also advocated for more of a
student-centered mathematics classroom and the widespread introduction of new
technologies, such as calculators, into the nation’s mathematics classrooms.
The same arguments that had been lodged against New Math were sounded
again, though (Walmsley, 2007). Many stakeholders, including some
mathematicians, parents, and teachers, did not want the focus on basic concepts
and arithmetic procedures to be decreased.
Perhaps one of the largest advantages of the new standards (NCTM,
1989) was that they were the first codified document that was nationwide in
scope on which states could base their own mathematics standards. It is
important to note, though, that these standards were not imposed at a national
level. There was no legal weight behind them compelling states to adopt them or
any part of them. Furthermore, the document was written in quite general terms,
and not designed to be a grade-by-grade list of what students should learn and
when they should learn it. Rather, it broke the K-12 years into three grade bands
and discussed broadly what students should be learning during each of those
bands. Many states then took this and devised their own standards in a way that

14
they thought was aligned with the NCTM document. As the document was
general in nature, different states could have K-12 mathematics standards that
were aligned to it yet quite different from each other. Again, this shows that there
was not necessarily much specific shared understanding of what the NCTM
standards meant.
The latter part of the document (NCTM, 1989) discussed how
mathematical learning should be evaluated and assessed. Chiefly, it said that
assessments needed to be aligned to standards to get worthwhile data. Also,
while still calling for assessment of students’ abilities to use mathematical
procedures, the document called for students’ knowledge of mathematical
concepts as well as their abilities to communicate and reason mathematically to
be assessed. In that same vein, and with increasing public demand for
educational accountability, NCTM published its Assessment Standards for
School Mathematics in 1995.
After a decade, NCTM released a revised version of its standards called
Principles and Standards for School Mathematics in 2000. While responding to
previous criticism, NCTM spoke much more specifically about what should be
learned in each grade band in this version of standards. Still, this book was
designed to be a document with which states could inform themselves and base
their grade specific standards on rather than a specific standards document itself.
Throughout the decade of the 2000s, the demand for accountability on the
part of the education system only increased. Much of this demand was codified
into law with No Child Left Behind in 2001. As part of the law, students in all
15
states were required to be tested regularly to determine if their progress was
meeting their states’ standards. The law called for an increasing percentage of
students to be proficient relative to each state’s standards every year.
Eventually, the disparity in different states’ standards became more and more
apparent. States that did well on the National Assessment of Educational
Progress (NAEP) relative to other states were found to have fewer of their
students meeting proficiency standards. Other states lowered standards so that
the percentage of students meeting standards would necessarily increase.
Partially as a result of this, the states came together through the National
Governors Association and the Council of Chief State School Officers to develop
the Common Core State Standards. Standards were developed for both literacy
and mathematics. Technically, the two groups mentioned above are the authors
of the standards; however, groups of experts in the relevant fields were charged
with actually writing the standards.
The CCSSM represent a large step in development, specificity, and
adherence. Experts from many states were involved in the development of the
CCSSM (NGA & CCSSO, n.d.). The chief writing group consisted of university
mathematics educators, state education officials, mathematicians, and teachers.
A feedback group consisting of similar types of people gave feedback to the
original author group (MDE, n.d.b). An advisory group consisting of
representatives from other organizations such as the College Board and the
National Association of State Boards of Education also gave input. Finally, other

16
national organizations, industry experts, and the public at large had a chance to
offer input before the final standards document was published.
With respect to specificity, the CCSSM greatly expanded upon NCTM’s
previous documents (1989, 2000). As for content, the CCSSM no longer made
use of grade bands. Rather, it discussed each grade individually. Also, the
CCSSM specify much more specifically what students should learn in each grade
than NCTM previously had. The CCSSM also builds on elements of NCTM’s
previous standards and the National Research Council’s Adding It Up (2001) with
the inclusion of eight practice standards. These practice standards state overall
attitudes and abilities that students should exhibit while doing mathematics
throughout their education.
With respect to adherence, this document (with its increased specificity)
was designed for states to use and adopt as their state’s mathematics standards
rather than as something for the states to use when designing their own
standards. Rather quickly after their final release, most states adopted the
CCSSM as their new mathematics standards, with similar timelines for textbook
adoption, professional development, assessment development, and full
implementation. Along the assessment line, the adopting states joined one of
two assessment consortia to develop standardized assessments. As a result,
most states will be using nearly identical standards, and their students will be
evaluated using similar assessments.

17
Theory of standards-based reforms.
In several of the examples discussed above, one can see the intent of
standards-based reform in mathematics education. First, codify in standards
what students should learn. Then use policy as a lever to make various parts of
the education system work together to achieve that goal (Walmsley, 2003, 2007;
Wilson, 2003). For example, one policy lever is student assessment. When new
standards are introduced, new assessments (or new versions of existing
assessments) that are aligned to the standards are necessary to discern whether
student learning goals are achieved. Models of the parts of the education system
used to conceptualize these actions are discussed in the next section.
Perhaps the most important promise of these standardization efforts was
an increase in educational equity in the states that adopted them (Gamoran,
2007; Vogel, 2010). When the development of learning objectives was left to
individual districts or teachers, learning outcomes could vary greatly for students
based on the schools they attended. Standardization efforts seek to level that
playing field by equalizing expectations for all schools. Of course, the degree to
which the playing field is leveled is subject to how equitably the standards are
implemented across a state. The present study takes care to consider views on
CCSSM implementation from across the state of Michigan.
Framework.
Models of the education system.
Weiss, Knapp, Hollweg, and Burrill (2002, p. 31) proposed a model of the
United States education system, including three “channels through which

18
national reform ideas might flow to various layers of the system and eventually
influence teaching and learning,” as a way to develop a framework to study the
influence of standards. Their model consisted of concentric circles. At the center
of this model are students and their learning. Encompassing their experience are
the teachers. As the model progresses outward, successively higher level pieces
of the education system with progressively less direct contact to student
experience are shown: the school, district, state, and federal levels. The three
channels of influence each separately cut across all the previously mentioned
layers. They consist of curriculum, assessment and accountability, and teacher
development. The resulting picture shows the nested structure of the social and
political context of the nation’s education system.
In her methodological appendix, Wilson (2003, pp. 232-233) discussed a
general approach to studying mathematics reform efforts in California that used a
similar model:
[I]nvestigate the ‘system’ in systemic reform, up and down. Interview and
observe teachers, principals, school district staff, local school board
members, state department staff, policy makers…Ours focused, in one
study, on the California Department of Education to the classroom…We
took a robust (but not comprehensive) ‘slice’ through that system…We
were interested in how policy shaped and was shaped by multiple actors
in nested contexts.
While Weiss et al. (2002) visually represented the nested structure of the
education system with concentric circles, Wilson represented it with the

19
branching diagram. At the top was the state department of education. Several
school districts branched off from the state department, then schools branched
off from the school districts, and finally teachers branched off from the schools.
Taken together, these two models for the structure of the education
system closely resemble the model for Michigan’s education system used in this
study and discussed in the methods chapter. Starting from the levels of students
and teachers, there are successively higher levels of administration with broader
spheres of influence and less direct contact with students. People occupying
each of these positions in the education system have a role in the
implementation of the CCSSM in Michigan, and they have ideas about what
proper implementation entails.
Perspective.
The phenomenon under consideration in this study was that of the
implementation of the CCSSM in Michigan. By that I mean the preparation for
and expected effect on day-today practice of the standards for several actors in
Michigan’s education system. The process of this transition and implementation
may involve changes for individuals with jobs at various levels of the Michigan
education system. Those changes happen within a context of all of those
individuals’ professional expertise about mathematics and its teaching, their
beliefs about mathematics and its teaching, and other perceptions and external
factors concerning how they do their jobs.
The primary goal of the CCSSM is to have a set of strong standards that
leads to better student learning. Implementing new standards to achieve this

20
goal would be meaningless if all the actors in the situation change nothing about
what they do or how they do it. Capturing the views of those actors regarding
those changes, regardless of the perceived degree of change, is important to the
field.
This study focused on learning the meaning that implementing the
CCSSM holds for various stakeholders in order to create a semi-holistic account
of what this implementation process looks like across a slice of Michigan’s
education system. Creswell (2009, p. 176) describes a holistic account as
involving the “reporting of multiple perspectives, identifying the many factors
involved in a situation, and generally sketching the larger picture that emerges.”
Here, I use semi-holistic rather than holistic because only three types of
stakeholders participated in the study. An account of the phenomenon of
CCSSM implementation in Michigan is documented in this study, but not as full of
an account as possible. Therefore, I use semi-holistic.
Motivation
For a large scale, top down policy implementation effort to be effective and
successful, the needs and expertise of people at all levels of the system who are
charged with some piece of the task of implementation must be considered. This
is a personal belief I hold, but it is also born out in the literature (Scott, 1999).
Wilson (2003) and Weiss et al. (2002) have shown the nested structure of the
education system and demonstrated how policy can be interpreted in varying
ways based on one’s location within that structure. Therefore, using an approach
that seeks to understand the meaning of CCSSM implementation for people at
21
various levels of the education system in Michigan would be appropriate to help
determine how effective this process may be for Michigan.
Studies of this nature have been solicited from the field of mathematics
education research. Weiss et al. proposed that their framework could be used to
study “how aware teachers are of national standards, whether—and in what
ways—they believe they are orienting their professional practices to these
standards, and in what ways they are supported in their efforts to realize the
standards,” (2002, p. 84). Floden and Wilson noted that “[e]ffects of standards
based reform have varied within and across organizations (states, districts,
schools)…The variation in effects has been related to: capacity for change,
clarity and consistency of standards, teachers’ beliefs about the possibilities for
change, assessment policies and practices, and professional development,”
(2003, p. 34). This led them to conclude that “[s]tudies of the influence of
standards should thus aim at describing, with depth and generality, how
particular configurations of factors are connected to changes in teaching
practice,” (p. 40).
While those types of studies have been requested by the field to study the
influence of standards in general, Heck, Weiss, and Pasley (2011) have called
for studies answering questions specifically about the implementation of the
CCSSM. In particular they call for case studies of states’ and teachers’
responses to the task of implementing the CCSSM. At the state and district
levels, several questions the authors solicit answers to include “What policy
levers…are states using to influence which parts of the system (e.g., curriculum,

22
teacher development, assessment and at what level…?”, “How are
states/districts modifying policies and programs to support implementation of the
CCSSM…?”, “How do specific policies, programs, and resources intended to
support implementation of the CCSSM play out?”, and “Within the state/district,
what variations in implementation of the CCSSM are evident?” (pp. 30-31). With
respect to teachers, the authors wish to know “What opportunities do teachers
have to learn about the CCSSM and their implementation? What messages do
teachers take from these opportunities?”, “What implications do teachers see for
their mathematics instruction?”, and “[T]o what extent and in what ways do
teachers perceive their practice aligning with the expectations of the CCSSM
standards…?” (p. 32).
This study provides a snapshot case study of CCSSM implementation in
Michigan that attempts to determine how well the views of the goals of CCSSM
implementation in Michigan align amongst different members of the state’s
education system.
Problem Statement
The CCSSM is a major new policy initiative being implemented in
Michigan schools. In order to better effect this particular transition and the
certain subsequent standards transitions to follow in the future, it is important to
understand the views, perceptions, and experiences of those within the
education system who are tasked with implementing the CCSSM. For this
purpose, this study will investigate the following research questions.

23
Research Questions
1) To what degree is there alignment between Michigan Department of
Education officials’, regional professional development providers’, and
teachers’ views of the goals of CCSSM implementation?
2) Do those outside MDE charged with the implementation feel adequately
supported in effecting their part of the transition to the CCSSM?

24
Chapter II: Method
General Approach
This study employed a mixed methods design with surveys and
interviews. The purpose of using a mixed methods design was to combine the
types of conclusions that quantitative and qualitative methods allow a researcher
to draw, thereby making the overall study stronger. The qualitative approach
allows the researcher to focus on and learn the meaning that implementing the
CCSSM holds for various stakeholders in their own words in order to create a
thorough, well-rounded account of what this implementation process looks like
across a slice of Michigan’s education system. The quantitative approach allows
the researcher to argue about the generalizability of the results that were
described in detail in the qualitative approach.
Methods of Data Collection
Data collection for this study occurred exclusively within the state of
Michigan and was carried out in three phases. Phase I of data collection
(hereafter referred to as state level data collection) occurred during March and
April of 2014. Phase II (hereafter referred to as regional level data collection)
occurred during September through November of 2014. Phase III (hereafter
referred to as local level data collection) occurred during January through May of
2015. As will be explained below, each phase of data collection depended on
the results of the phase(s) that preceded it. Therefore, the phases necessarily
had to occur sequentially and not concurrently.

25
Due to the nature of the various positions in the education system that the
participants in this study occupied, a three-pronged sampling and recruitment
approach was pursued. For participants at the statewide level of Michigan’s
education system, snowball sampling was used to facilitate access to highly
networked individuals within MDE. To sample regional professional development
providers level, I drew on two existing leadership structures to contact nearly all
such individuals in the state: Michigan’s regional Mathematics and Science
Centers and the Michigan Mathematics Consultants and Coordinators group.
The two groups are composed of mathematics professional development
providers and, therefore, were well positioned to address the issue of the
preparation and support of teachers with respect to the transition to the CCSSM.
Finally, at the local level, a branching sampling scheme was used to contact
elementary teachers based on the responses of the regional professional
development providers.
State level data collection and snowball sampling.
In snowball sampling, a researcher talks to individuals who he believes to
be relevant to the given phenomenon. Then, the researcher solicits suggestions
of who to talk to next from the original participants. The process then repeats
itself: the researcher talks to those people, solicits recommendations of further
people to talk to from them, etc. This type of sampling has been used effectively
in communities that are difficult to penetrate, including communities of somewhat
closed off but highly networked individuals. State level education professionals

26
appeared to fall into this category. So the snowball sampling scheme was
employed.
Snowball sampling requires a first individual to talk to in order to be able to
get other potential participants. This process began with an individual the
researcher had a previous relationship with in the Curriculum and Instruction unit
in MDE’s Office of Education Improvement and Innovation (OEII) who also had
previous mathematics consulting experience. That individual agreed to an
interview with me and brought another individual from OEII who works in the
areas of urban education and mathematics. At the end of my interview with
those individuals, I brought up the names of other individuals at MDE who I
thought might be able to contribute to this study. They told me which of those
they believed to be potentially fruitful interviews and suggested some other
individuals as well.
After successive iterations of snowball sampling, there were a total of
eight state level interview participants who worked for the following offices,
departments, or other bodies in addition to those discussed above: the Michigan
State Board of Education, the MDE Accountability Services, the MDE School
Reform Office, the MDE Office of Standards and Assessment, and the MDE
Statewide System of Support. All interviews were conducted in March and April,
2014. All interviews were conducted at a place of the participant’s choosing. For
most participants this entailed an office or conference room at MDE. One
interview was conducted at a coffee shop.

27
Interviews at the state level were semi-structured in nature. The interview
protocol had four main questions:
1) As [job title], what is your sense of the goals of the CCSSM, both in
general and specifically with respect to elementary school?
2) What is your view of the implementation process?
3) What do teachers need to do to effectively make this transition?
4) How are teachers supported in doing this?
All interviews were recorded on a voice recorder while the researcher
simultaneously typed notes.
During the interviews, redirect questions and follow up questions were
employed based on the participants’ responses. For example, redirect questions
were employed when a participant would respond to a question by referring to
aspects of CCSSM implementation that seemed to relate directly to English
language arts and not to mathematics. In this example, a participant would have
been asked, “What you just said sounded like it dealt specifically with the literacy
standards. Was the process the same or different for mathematics? How so?”
When this happened, it tended to be early in the interviews.
Furthermore, when participants discussed an aspect of implementation
that a previous interviewee had discussed, clarifying questions were asked in
order for the researcher to ascertain whether the participants were talking about
the topic in the same way. This pertains to both whether participants agreed on
a view about a topic and whether participants were using terms related to a topic
to mean the same thing.

28
Once the state level data collection was completed, all interviews were
transcribed. The transcriptions were then analyzed for the purpose of creating a
survey to be distributed to Michigan’s network of regional professional
development providers. As discussed in more detail in the results chapter, the
state level participants provided a generally unified view of the CCSSM and its
implementation. Their views were used to construct the survey for the
professional development providers as described in the next section.
Regional level data collection.
Regional survey instrument.
Based on the data gathered at the state level, a web-based survey with six
item categories was made for distribution to Michigan’s network of regional
mathematics professional development providers. The full survey can be found
in Appendix A. The first set of items gathered demographic information on the
professional development providers. The second set of items assessed
participants’ levels of agreement with MDE officials’ views of the nature of the
CCSSM. Generally, a five-point Likert scale ranging from “Strongly Disagree” to
“Strongly Agree” was used for these items. The third set of items assessed
participants’ levels of familiarity with various resources that MDE officials stated
were available and useful for the transition to the CCSSM. Generally, a five-point
Likert scale ranging from “Not at all familiar” to “Extremely familiar” was used for
these items. Unless participants marked “Not at all familiar” for a particular
resource, they were presented with another item asking about their views of that
particular resource’s usefulness. A five-point Likert scale ranging from “Not at all

29
useful” to “Extremely useful” was used for these items. The fourth set of items
assessed participants’ views of their regions’ readiness for the transition to the
CCSSM. A five-point Likert scale ranging from “Strongly Disagree” to “Strongly
Agree” was used for these items. The fifth set of items was a miscellaneous set
of items about topics that were discussed by MDE officials but did not fall into
one of the previous categories. For example, this section included the item
“Interacting with the various offices at MDE about CCSSM has been confusing
and/or frustrating.” A five-point Likert scale ranging from “Strongly Disagree” to
“Strongly Agree” was used for these items. The sixth set of items consisted of
two open-ended questions asking participants if they would like to elaborate on
any of their previous answers, and if they would like to discuss aspects of
CCSSM implementation that were important to them but that were not discussed
in the survey.
Regional participants.
Among Michigan’s network of regional mathematics professional
development providers, educators in this sample generally fell into one of two
roles, and often both. First, they may have been Directors of one of Michigan’s
regional Mathematics and Science Centers. There are 33 such Centers in the
state. The Director of each Center was emailed and asked to complete the
survey, or, in the case that the Director was focused on science and had a
partner who was a more focused on mathematics, to forward the survey to the
senior mathematics educator in the Center to complete the survey.

30
Second, they may have been mathematics consultants for Intermediate
School Districts (ISDs). ISDs, which in some locations are referred to as
Regional Educational Service Agencies (RESAs) or another similar name,
generally provide services to districts within their boundaries that would be too
expensive for individual districts to fund on their own. Among many other
support and technical services offered to school districts by their ISDs, these
services often include subject-specific professional development provided by
employees of the ISD. In many regions in the state, Mathematics and Science
Center Directors are also mathematics consultants for their local ISDs.
Aside from contacting Mathematics and Science Center Directors
individually, subjects at this level were recruited through the Michigan
Mathematics Consultants and Coordinators (M2C2) group. This group is largely
comprised of the Mathematics and Science Center Directors (or senior
mathematics educators) and ISD mathematics consultants. This group meets
monthly during the school year via computer-aided conference call, with one in
person meeting per year, in order for members to discuss items of mutual
interest and collaborate on ongoing work. The researcher contacted the
organizer of this group, who then allowed the researcher to attend one phone
meeting to recruit for the study in September, 2014. Following that meeting, the
M2C2 organizer sent a link to the survey out to all the individuals on their listserv.
The surveys were completed in September and October, 2014. In all, 28
individuals responded by completing the survey. Of those, three were deemed to
have fallen outside the intended sample. Those three respondents listed

31
occupational titles that were not directly related to mathematics professional
development, and brief web searches confirmed that mathematics professional
development was not a primary component of their jobs. Their removal from the
sample resulted in an overall sample size of 25 for the survey of regional
mathematics professional development providers, all of whom were either
Mathematics and Science Center Directors (or senior mathematics educators),
ISD mathematics consultants, or both.
Due to several factors, an exact response rate cannot be calculated for
this sample. There are 33 Mathematics and Science Centers with readily
identifiable mathematics professional development personnel. There are 56
ISDs in Michigan. Information on mathematics professional development
personnel in those ISDs is less readily available, particularly in ISDs where there
is not personnel overlap with the Mathematics and Science Centers and in ISDs
where there are no such personnel. Some ISDs also had multiple mathematics
professional development providers who qualified to take the survey.
Furthermore, use of the M2C2 listserv gave an unknown number of potential
participants the opportunity to take the survey; however, the M2C2 has a high
degree of overlap with mathematics educators in the Mathematics and Science
Centers and ISDs. So, while an exact response rate cannot be calculated for this
sample, it is likely that the response rate was well over 50%.
From this sample of survey respondents, three were selected for follow up
interviews. In order to reflect Michigan’s diversity of settings, including the
disparate availability of educational resources across the state, the researcher

32
aimed to select one respondent each from an ISD/Mathematics and Science
Center that 1) served a primarily urban area, 2) served a mostly suburban area,
and 3) served an entirely rural area. The urban participant came from an
ISD/Mathematics and Science Center containing a city with a population over
100,000 that was also the largest city in its county. The suburban participant
came from an ISD/Mathematics and Science Center with a county population
over 180,000, but no cities with a population over 100,000. The rural participant
came from a multi-county ISD/Mathematics and Science Center, the largest
constituent county of which has a population of fewer than 40,000.
Regional interviews.
The follow up interviews were semi-structured in nature, centering on the
same four questions the state level participants were asked. In addition,
participants were asked follow up questions regarding some of their survey
responses, particularly in instances where they disagreed with the state or with
their colleagues. As with the state level interviews, redirect questions and follow
up questions were employed based on the participants’ responses. When
participants would discuss an aspect of implementation that a previous
interviewee had discussed, clarifying questions were asked to ascertain whether
the participants were talking about the topic in the same way. This pertains to
both whether participants agreed on a view about a topic and whether
participants were using terms related to a topic to mean the same thing.
All interviews were conducted in October and November, 2014. All
interviews were conducted at a place of the participant’s choosing. Two of the

33
interviews were conducted at local ISD offices. One interview was conducted at
a coffee shop. All interviews were recorded on a voice recorder while the
researcher simultaneously typed notes.
Once the regional level data collection was completed, all interviews were
transcribed. The transcriptions were then analyzed for the purpose of creating a
survey to be distributed to elementary teachers in the regions of the professional
development providers who participated in follow up interviews. Both state level
and regional level participants’ views were used to construct the survey for the
local level elementary teachers as described in the next section; however, the
content of the regional level survey was preserved in the local level survey.
Local level data collection.
Local survey instrument.
Based on the data gathered in Phases I and II, a web-based survey with
six question categories was made for distribution to elementary teachers in the
regions of the professional development providers who participated in follow up
interviews. These surveys were substantially similar to the regional level
surveys. The same six question categories were used with a small number of
questions added or adjusted for the targeted sample. Most of these were in the
demographics category of questions. For example, teachers were asked what
grade they currently taught, as well as what grades they had taught previously.
In addition, the interviews with the regional professional development
providers indicated that some teachers in the suburban region may have had
some much more prolonged and substantive experiences with respect to

34
implementing the CCSSM than their counterparts in other regions. For example,
some teachers in that region served on committees that wrote, piloted, and
reviewed sample lessons that were ultimately to be provided to other teachers in
the state as a resource. Questions were added to the survey given to the
teachers in that region to see if respondents participated in any such activities.
The full surveys can be found in Appendix B.
Local participants.
The intended sample for this level of data collection was elementary
teachers within the regions of the professional development providers who were
interviewed. At the end of each regional level interview, the researcher asked
what the best way to contact and reach teachers in their respective regions
would be. In each case it was agreed that if the researcher prepared the survey
and an invitation email to potential teacher participants, that the highest level of
response would be obtained if the professional development providers forwarded
the survey to elementary teachers in their regions. In some cases, the survey
email went straight from the professional development providers to the teachers
in their regions; in other cases, the survey passed through an intermediary.
Often the intermediary was a school administrator. Those administrators may or
may not have forwarded the survey email to their teachers. Due to the
forwarding of the surveys to the teachers through the professional development
providers, and sometimes other individuals as well, exact response rates could
not be calculated in all cases; however, within the regions, response rates were

35
able to be calculated for certain subsets of teachers. The details of these
calculations are discussed in the following paragraphs.
Following that initial contact by the professional development providers,
teacher recruitment proceeded in different ways for the three regions. In the
urban region, 40 teachers responded to the survey. Of those, two completed
little more than the demographic questions at the beginning and were ultimately
excluded from the sample. This left the urban region teacher sample size at 38.
Note, though, that this is simply the number of teachers from the region with an
urban area. Few of those teachers taught in an urban school.
In the rural region, teacher response to the survey was quite limited. After
the initial invitation sent through the professional development provider, seven
teachers responded, with five completing enough of the survey to be included in
the data set. Given the low response rate, the researcher used district websites
to compile an email list for all elementary homeroom teachers in the ISD, which
totaled 168 teachers. Another invitation to participate was sent directly from the
researcher to all of those teachers. This effort garnered one more survey
response. The professional development provider sent one more email message
that garnered no responses. So the teacher survey data sample size for the rural
region was six. This amounts to a teacher response rate of four percent for the
rural region.
In the suburban region, teachers’ response to the survey was also limited.
After the initial invitation sent through the professional development provider, five
teachers responded, each completing enough of the survey to be included in the

36
data set. When the researcher looked at the schools and districts of those five
teachers, it seemed that most responses came from relatively well-performing
schools and districts, based on Michigan’s Top to Bottom school ranking list. Of
the five respondents, none came from districts whose elementary schools
averaged out to be in the bottom or second quartiles of the rankings, one came
from the third quartile, and four came from the fourth quartile.
While more overall participation from teachers in the suburban region was
desired, it was also important to get a well-rounded sample of teachers within the
ISD. So the researcher sampled two districts from each of the bottom three
quartiles, and attempted to contact elementary teachers in those districts. In one
district, teacher email addresses could not be located online. The elementary
building principals and secretaries were contacted in that district; however, no
response was returned. In the other five districts, the researcher used district
websites to prepare an email list for all elementary teachers in those districts,
and sent an email invitation to complete the survey to all of those teachers. In
these five districts, the email was sent to 259 teachers. This garnered 25
additional responses, of which 23 completed enough of the survey to be included
in the data set. So, the overall suburban survey data set sample contained 28
teachers. Among the teachers to whom the researcher sent a direct email, the
teacher response rate was nine percent for the suburban region.
Therefore, between the three regions, the total teacher sample size for the
teacher survey was 72. The table that follows summarizes this information as
well as provides information regarding the grades those teachers currently teach.

37
Because some teachers marked that they were currently teaching more than one
grade, the numbers of teachers in each grand band will not always sum to the
total number of teachers. Also, the two sixth grade teachers in the sample taught
in self-contained classrooms.
Teacher Survey Sample by Grade Band
Region K-2 3-5 6 Total
Urban 18 21 2 38
Rural 4 2 0 6
Suburban 10 18 0 28
Total 32 41 2 72
Table 1: Teacher Survey Sample
Originally, the planned procedure for teacher follow up interview
participant selection was to contact two teachers from each of two schools in
each of the three regions; however, this proved impossible for several reasons.
First, most respondents didn’t have another teacher in the building who
completed the survey. In instances where two or more teachers did complete the
survey, usually at most one would agree to participate in the interview.
Furthermore, in the rural region, there were only six survey responses from
teachers in the region. After contacting all six respondents, one agreed to be
interviewed.

38
Not having the desired survey and interview participation caused the
researcher to alter the interview recruitment procedure. In order to make the
results as generalizable as possible with the given survey sample, the researcher
used the quartiles described in the survey sampling process for the suburban
and urban regions. Ultimately, follow up interviews were conducted with ten
teachers. These respondents covered the four quartiles for both the suburban
and urban regions. Also, one teacher from the city in the urban region was
interviewed.
Teacher Interview Sample by Grade Band
Region K-2 3-5 6 Total
Urban 3 2 0 5
Rural 1 0 0 1
Suburban 1 3 0 4
Total 5 5 0 10
Table 2: Teacher Interview Sample
Local interviews.
The follow up interviews were semi-structured in nature, centering on the
same four questions the state and regional level participants were asked. In
addition, participants were asked follow up questions regarding some of their
survey responses, particularly in instances where they disagreed with the state,
with the professional development providers, or with their colleagues. As with

39
the previous interviews, redirect questions and follow up questions were
employed based on the participants’ responses. When participants spoke to an
aspect of implementation that a previous interviewee had discussed, clarifying
questions were asked in order for the researcher to ascertain whether the
participants were talking about the topic in the same way. This pertains to both
whether participants agreed on a view about a topic and whether participants
were using terms related to a topic to mean the same thing.
All interviews were conducted between March and May, 2015. All
interviews were conducted at a place of the participant’s choosing. Usually
interviews were conducted in participants’ classrooms during or after school.
Some interviews were conducted in coffee shops or local restaurants. All
interviews were recorded on a voice recorder while the researcher
simultaneously typed notes. Once the local level data collection was completed,
all interviews were transcribed. The transcriptions were then analyzed as
discussed below.
Limitations.
Of course, each of these local level survey and interview samples has its
limitations. First, the lack of participation among teachers in the rural region was
much lower than desired. The weak response could reflect a lack of resources
and time to devote to such matters, which could be pertinent for this study. Also,
resources to reward participants for their participation could have improved the
response rate. With such a small survey response rate from the region, it was

40
not possible to compare the rural region’s survey results to the other regions
because no argument for representativeness could be made.
Next, the suburban region survey sample was ultimately adequate after
the recruitment procedure was adjusted; however, the original recruitment for the
teacher survey had to flow through various layers of administration that did not
exist in the other regions. This could have affected the original response rate
from that region. Furthermore, the ISD has a group of teachers formally
identified as a group of leading mathematics teachers. Part of the distribution
procedure in that region involved sending the survey to them, and for them to
share it with their colleagues. A question was included on the survey in this
region to identify members of this group. After looking at those responses, and
the next phases of recruitment in this region, it does not appear that members of
that team had undue influence on the results as only two participants indicated
membership in that group.
Finally, school and district level math coaches were originally intended to
be part of this study. Their numbers proved to be exceptionally low, though. The
rural region professional development provider told me that no such personnel
existed anywhere in her region. No responses from coaches came in from the
urban region. A small number of coaches took the survey in the suburban
region; however, it was too few to do any analysis with their data.

41
Methods of Data Analysis
Qualitative analysis.
All interviews were transcribed shortly after the data was collected. After
the first two levels of interview data collection, the transcriptions were analyzed
for the purpose of creating a survey to be distributed to the next level of
respondents. Interviews were analyzed with an emergent coding scheme to
uncover areas of coherence and dissonance between the various participants’
responses. After the teacher level interview data had been gathered, the
process was repeated with all three levels of data at once.
Quantitative analysis.
Initially, the survey responses of the 25 professional development
providers were analyzed by determining the mean response and standard
deviation for each question. After the local level survey was conducted, the
survey responses of the 25 professional development providers and 72 teachers
were analyzed using SPSS. For each survey question, the mean response was
computed for both groups. An analysis of variance test was run to discern any
significant differences in the mean responses of the professional development
providers and the teachers. In the results chapter, significant differences are
noted at the p < 0.05 level.
Combining the survey and interview data.
The results of both types of analyses were used to inform further analysis
and the progression of the study. Qualitative analysis of data gathered at the

42
state level informed the construction of the regional level survey, including the
entirety of the non-demographic items.
State level qualitative data analysis and regional level quantitative data
analysis from the survey informed the interviews conducted with the regional
participants. For example, state level participants thought one particular
resource would be extremely useful for teachers. The regional level surveys
showed that the professional development providers generally disagreed on that
point. Therefore, the regional level participants who were interviewed were
asked about the disparity.
Qualitative analysis of the regional level interviews combined with the
previous analyses informed the construction of the local survey of elementary
teachers. Quantitative analysis of the local survey combined with the previous
analyses informed the interviews with local level teachers.
As previously stated, all the data was analyzed with the aim of discovering
areas of coherence and dissonance between the various participants’ responses.
The analysis was carried out with an awareness of the vertical structure of
Michigan’s K-12 educational system, where it is typically assumed that
information and directives flow from the MDE through regional leadership to
teachers in local communities. These three groups (MDE, the regional
professional development providers, and the local elementary teachers) were
compared to each other with careful attention given to the idea that information
and directives may not flow as typically assumed.

43
Originally, a horizontal analysis was planned to compare the responses of
teachers in rural, urban, and suburban regions to each other. Given the
difficulties in participant recruitment and the low response rate in both the city of
the urban region and the rural region as a whole, this analysis was not
conducted.

44
Chapter III: Results
Organization of the Chapter
The results of this study generally fell into four topic categories regarding
participants’ views of: the goals of the CCSSM, methods of support for teachers,
CCSSM readiness, and interactions with the state by various stakeholders.
Results are presented below within each of these four categories. The results
regarding the goals of the CCSSM most directly answer the first research
question: To what degree is there alignment between Michigan Department of
Education (MDE) officials’, regional professional development providers’, and
teachers’ views of the goals of CCSSM implementation? The results regarding
the methods of support for teachers most directly answer the second research
question: Do those outside MDE charged with the implementation feel
adequately supported in effecting their part of the transition to the CCSSM?
The results from the remaining two categories, CCSSM readiness and
interactions with the state, provide supporting information for the previously
discussed results as well as context for the answers to both research questions.
For example, participants’ responses about CCSSM readiness help to shed light
on what they believe the goals of the CCSSM to be by their descriptions of what
they are ready to do. Participants also discussed their readiness for the CCSSM
in the context of various support mechanisms. Finally, while discussing
interactions with the state, participants were able to discuss views of CCSSM
implementation and its goals within the state’s political system, as well as their
interactions with MDE when they sought support.

45
Throughout this chapter, and within each of the category sections, results
will be presented in the following fashion. First, data from state level interviews
will be presented and interpreted. Next, the survey items for the regional and
local level surveys that resulted from that state level data will be introduced.
Then, the results of those survey items will be introduced, followed by supporting
representative quotes from regional professional development providers and
teachers to assist in interpreting them. The order in which the teacher and
professional development provider interview data and interpretation are given
varies by section and usually depends on flow and explanatory power of one for
the other.
One important general result to note before proceeding into individual
results is that the regional professional development providers generally had
lower standard deviations on their survey responses than the elementary
teachers did. This could be the case for a variety of reasons. First, the regional
professional development providers were a rather homogenous group with
similar high levels of interest in mathematics who were regularly in
communication with each other. The teachers varied on each of these
dimensions. Also, the levels of support and professional development that
teachers had access to in order to prepare for the CCSSM varied greatly across
the state and, sometimes, within districts.
Finally, several of the mean responses in the section that follow have
standard deviations over 1.00, which is rather high for a five-point Likert scale
survey item. Despite that, statistical differences will still able to be discerned

46
between the regional professional development providers and teachers in a
number of areas. These differences will be the focus of the analysis.
Goals of the CCSSM
In this section, participants’ views and beliefs about the goals of the
CCSSM will be discussed. This was done largely in comparison to the previous
Grade Level Content Expectations (GLCEs) with the idea that if the transition to
the CCSSM is worthwhile, then it must offer some advantage over the previous
GLCEs. This section addresses the first research question: To what degree is
there alignment between Michigan Department of Education officials’, Math and
Science Center Directors’, and teachers’ views of the goals of CCSSM
implementation?
Changes in standards related to CCSSM implementation.
First and foremost, there was agreement at the state level that even
though Michigan was shifting from its previous Grade Level Content Expectations
(GLCEs) to the CCSSM, there really was neither much new mathematics in the
CCSSM nor many grade level shifts in when mathematical topics should be
taught. One MDE official stated that, “I personally love the Common Core, not
only because the messaging was right on what we felt was good math education,
[but] it actually aligned…with what we set content-wise across the state anyway.
It was not out of whack from [the GLCEs] content-wise.” Another MDE official
noted a “97% concurrence between the old standards and the new standards.”
Other data from the state level interviews, which will be discussed in more detail
in later sections, substantiates this belief from MDE officials that the content of

47
the CCSSM did not vary greatly from the GLCEs, nor did the grades in which
individual pieces of content were introduced.
Each time this view was stated by an MDE official, though, it was done in
comparison to the Standards for Mathematical Practice and/or the new level of
depth and rigor that would be required to teach and learn mathematics properly
according to the new standards. One MDE official commenting on the student
learning aspect said, “The level of rigor, the depth of knowledge, that we’re
asking students to analyze and apply rather than recognize, you know, the verbs
that are used in the Common Core are higher level verbs.” Another MDE official
noted how the introduction of the CCSSM Standards for Mathematical Practice
helped them to push teaching in a positive direction that they were already trying
to facilitate among the teaching force:
Common Core made the practices much more explicit. When we were
developing the high school content expectations, we really had
conversations around how do we embed in our standards somehow these
ideas of the mathematical habits of mind. And so we weren’t successful in
that until the Common Core was really an improvement on that.
So, while state level participants generally viewed content changes and grade
level shifts between the previous GLCEs and the new CCSSM to be relatively
minor, they viewed the explicit listing of the Standards for Mathematical Practice
as a full fledged part of the CCSSM as an important piece of the new standards
with respect to improving the teaching and learning of mathematics in the state.

48
The views of the state level participants led to the creation of the following
questions for the regional and local level survey. Three items were statements
that participants could use a five-point Likert scale with which to express their
level of agreement: (1) “There really is not much new mathematics in the
CCSSM, nor are there that many grade level shifts in when mathematics topics
should be taught.” (2) “The transition to the CCSSM is less about a transition in
mathematical content for teachers and students than it is about a transition in
teaching as expressed in the Practice Standards.” (3) “Compared to Michigan’s
previous GLCEs, a greater level of depth and rigor in mathematics is needed for
teachers and students to meet the CCSSM’s standards.” Finally, a fourth item
was included regarding the relative amount of content in the CCSSM as
compared to the previous GLCEs. Participants could indicate whether they
thought the new standards had less content than, about the same amount of
content as, or more content than the previous standards. The results from the
regional (PD provider) and local (teacher) participants follow. When there is a
statistically significant difference at the p < 0.05 level between the mean
responses of the regional and local participants, it is indicated with an asterisk
(*). Standard deviations for each mean response are indicated parenthetically
next to the means.

49
“There really is not much new mathematics in the CCSSM, nor are there that
many grade level shifts in when mathematics topics should be taught.”
PD Providers Teachers
2.20 (0.96) 2.35 (1.00)
1: Strongly disagree, 2: Disagree, 3: Neither agree nor disagree, 4: Agree, 5:
Strongly agree
Table 3: New Content and Content Shifts
“The transition to the CCSSM is less about a transition in mathematical content
for teachers and students than it is about a transition in teaching as expressed in
the Practice Standards.”
PD Providers Teachers
3.44 (0.92) 3.56 (0.84)
1: Strongly disagree, 2: Disagree, 3: Neither agree nor disagree, 4: Agree, 5:
Strongly agree
Table 4: Transition in Teaching Versus Content

50
“Compared to Michigan’s previous GLCEs, a greater level of depth and rigor in
mathematics is needed for teachers and students to meet the CCSSM’s
standards.”
PD Providers Teachers
4.52 (0.59) 4.17 (0.93)
1: Strongly disagree, 2: Disagree, 3: Neither agree nor disagree, 4: Agree, 5:
Strongly agree
Table 5: Level of Depth and Rigor
“Compared to Michigan’s previous Grade Level Content Expectations (GLCEs),
the CCSSM covers “
PD Providers Teachers
1.78 (0.52) 2.15* (0.76)
1: Less content, 2: About the same amount of content, 3: More content
Table 6: Content Coverage Comparison
These data show that the regional professional development providers
and teachers both disagreed with the notion that there was not much new
mathematics in the CCSSM, or that there were many grade level shifts in when
topics should be taught. This disagreement occurred despite both groups
showing slight agreement to the statement that the transition to the CCSSM was
less about a transition in content are more about a transition in teaching. Both
the professional development providers and the teachers rather strongly agreed

51
that a greater level of depth and rigor with respect to both teaching and learning
would be needed to meet the new standards in the CCSSM. Finally, there was
some disagreement between the professional development providers and the
teachers about the amount of content in the CCSSM as compared to the GLCEs,
with the teachers believing more content exists in the CCSSM while the
professional development providers thought there was somewhat less.
Professional development provider and teacher interviews were used to further
understand and interpret these data.
When the regional professional development providers and elementary
teachers were asked during interviews about the amount of new content and
grade level shifts in content, while they agreed about the importance of the
Standards for Mathematical Practice, they still found the content changes to be
significant.
For the teachers, especially those who had taught a particular grade for
some years, the content changes were significant and important to learn about.
Each of the ten teachers who were interviewed spoke about topics similar to
those identified by the three teachers who are quoted in the paragraphs to follow.
For example, one teacher noted a shift in when her district introduced
multiplication that coincided with the transition to the CCSSM:
Multiplication, for us anyway, at our district, has been, like, I know a lot of
districts do third, but ours was more fourth, and now I see where third
graders really have to know multiplication facts. So I think that there’s

52
actually been a lot of moving things down so that they’re getting exposed
earlier on to a lot of concepts.
Teachers gave more examples, though, where the new content they
referred to was content they had taught previously on the surface, but now had to
learn to teach in new forms. One kindergarten teacher spoke about the shift in
focus of numeracy education in her classroom:
The Common Core has set some more concrete boundaries of
kindergarten is really going to focus through five, and first grade is really
going to deeply focus through ten, and second grade is going to focus
through twenty. And we talk about math facts or breaking down a number,
decomposing a number, constructing a number, we’re really going to
focus on five at the kindergarten level…And I don’t feel that that was
stressed as much in the previous … GLCEs. So I do see that there was a
shift of, ‘No, we’re not going to really get the kids just to count up to 20
and do some adding in kindergarten. Let’s just focus on the five frame,
and building five, really understanding five and how to build it.’
Similarly, a first grade teacher spoke about new approaches to teaching and
learning addition and subtraction:
I think that there are a lot of new concepts that are being taught. Like
making ten to subtract instead of just teaching kids subtraction, we have to
do make ten to subtract. I think I gave you a specific example…about
adding with doubles, and how you can split the number in half, and then
add two more once you have your answer, or you can split the number in

53
half and add one to each half, and then add the two new numbers
together. And I think that’s new mathematics to me. That’s not anything
I’ve ever taught before, not a way that we’ve ever taught before. And so
although we’re teaching addition and subtraction, it’s completely different,
and it’s done in such a way that the teachers don’t fully understand it. And
so it’s hard for us to deliver quality instruction to the students.
So, when comparing the amount of new content or the amount of content
shifts for a particular grade level, it appears MDE and the teachers may have
viewed the term content in two different ways. The evidence suggests that MDE
viewed content as what students should learn at a particular grade level, which
did not change much between the GLCEs and the CCSSM. The teachers, on
the other hand, viewed these new ways of teaching or understanding that same
content as new content. The ways of teaching with more depth and rigor and
adhering to the Standards for Mathematical Practice were taken by numerous
teachers as new content for them to learn. This led them to view the CCSSM as
having a lot more content changes than MDE did.
For their part, the professional development providers viewed the issue in
a similar way because of their close work with the teachers. The following is
representative of what all three professional development providers had to say
on the matter:
[T]opic-wise, no, there’s not a huge shift topic-wise, but there are huge
shifts in the content in terms of ‘What is it I really need to teach at my
grade level?’ And the depth. So, at a topic level, I agree [that there hasn’t

54
been much change in content], but when you go beyond the topic level
and to the making sense and saying this is really what this means, and
making that sense from looking at the progressions documents and
looking at TurnOnCCMath.net, Jere Confrey’s site, it’s pretty significant in
terms of, and then you layer with that the practices.
This closely echoes what the teachers had said: the teachers were needing new
ways to teach and understand the same content.
In summary, all three groups of participants (MDE, the professional
development providers, and the teachers) were largely in agreement that content
topics had not shifted much, but that a new level of depth and rigor would be
required to teach them well in accordance with the standards. However, the
different ways in which the groups spoke about this issue, specifically what they
meant when they referred to content, could be the source of some confusion.
That confusion could arise when members of these three groups attempt to
communicate with each other, or when educators tasked with facilitating
communication between these groups, such as building administrators, become
involved.
Reception of the CCSSM.
Together, these previous findings lead to the last result of this section:
participants’ views on whether the transition to the CCSSM was a positive
change. As noted in the initial chapter, policy initiatives are more successful
when those tasked with implementing the change view the change as worthwhile.
So each survey and interview participant at every level was asked if they viewed

55
Michigan’s transition to the CCSSM as a positive change. Their answers to this
query provide a view of the participants’ overall feelings toward the CCSSM and
its goals.
In general, all three groups thought the transition to the CCSSM was a
positive change. The MDE and professional development providers viewed the
change, particularly with respect to the Standards for Mathematical Practice, as
productive for providing the opportunity to instill more research-based teaching
practices in the state. One MDE official, referring to the Standards for
Mathematical Practice, said, “We didn’t have any piece on that in the GLCEs.
Those of us, those that were good teachers had that in the back of their mind and
always looked at the GLCEs through that lens, but the Common Core made that
really explicit in those practices.”
“I view Michigan’s transition to the CCSSM as a positive change.”
PD Providers Teachers
4.56 (0.65) 3.59* (0.97)
1: Strongly disagree, 2: Disagree, 3: Neither agree nor disagree, 4: Agree, 5:
Strongly agree
Table 7: Disposition Toward CCSSM Transition
As the table above shows, while teachers viewed the change positively,
they did so at a significantly lower level than the professional development
providers (and MDE) did. The teachers who viewed the change positively did so

56
for largely the same reasons MDE and the professional development providers
did. Several of the teachers believed the CCSSM would be a good change for
students in the long run and enjoyed having more time to go more deeply into
mathematics content with students. For example, one said, “I like the idea of
going into more in depth. At my level there’s lots of exposure to lots of things,
and sometimes it’s fun to just be able to dig deeper, and make sure they have it.”
Another teacher thought the new standards made her students more
mathematically powerful, stating, “I believe this shift gives students the power to
be mathematical problem solvers.”
The teachers who disagreed that the change to CCSSM was positive did
so for a number of reasons. The follow up interviews with teachers helped to
shed light onto their views. Some were concerned about developmental
appropriateness:
[T]hey take the kids and they want them to perform higher and higher and
higher. And so the demands are higher, but developmentally, a kid’s
brain, like an eight year old’s brain, is still an eight year old’s brain. And I
feel like we try to cram too much down their throats instead of just letting
them have more time with a few concepts.
Another raised similar concerns, citing students’ basic abilities:
It’s a double edged sword…I understand what the initiative is attempting,
what it wants to do. It wants to get these kids thinking about these
multiple ways and discussing early on so that they don’t have to learn to
do that in the upper grades. But I’m dealing with kids that can’t speak,

57
and kids that can’t write, and they’re still learning these basic fundamental
skills just to communicate period. And so, to try and teach them to do that
with math, and they can’t do it during reading time, or any other time, it’s a
big challenge.
So while one of these teachers was concerned with the level of mathematical
content and the other was concerned students’ basic abilities to work across
content areas, they were both wary of what they perceived as high—and
apparently too high—expectations for their students. Additionally, other teachers
cited issues with parents not understanding new methods involved with learning
certain topics.
One teacher who supported the transition to the CCSSM but was still
working through some difficulties with respect to it said,
I think some fear it because we’re constantly wary of the change, and
having to keep up with the change, and it takes a lot of time and energy on
our part. And, you know, we want to see results, and sometimes we want
to see them right away. And if we don’t, we get discouraged. But
sometimes things take a little bit of time. But I really do think we are going
to reach kids in the longer run on a deeper level.
Within this one quote, several stresses on teachers with respect to the change to
the CCSSM can be seen. First, the teaching profession demands a great deal of
time and energy even in years when new standards are not being implemented.
So there is the time stress for teachers of both becoming acquainted with the
new standards and learning how to teach appropriately with respect to them—

58
especially when expectations on their teaching are not reduced. Second, the
quote referenced the teacher’s desire for immediate results in terms of student
success. While this could refer to aspects of the teacher accountability era, it
can also simply refer to an impediment to change. If teachers are relatively
comfortable with what they are doing and feel successful with it, then if they
change to something and are not immediately successful, the change is called
into doubt.
Methods of Support for Teachers
In this section, various methods of supporting teachers in making the
transition to the CCSSM will be discussed. This section addresses the second
research question: Do those outside MDE charged with the implementation feel
adequately supported in effecting their part of the transition to the CCSSM?
As this study began with interviews of state level education officials, much
of the data collection in this area at the regional and local levels centers on
devices the state level officials hoped would be useful for CCSSM
implementation. In particular, these include MDE’s Crosswalk documents,
sample units and lessons from the Michigan Association of Intermediate School
Administrators, and released items from the Smarter Balanced Assessment
Consortium. Finally, participants were asked if and what kinds of further financial
and professional resources would be helpful. The overarching finding in this area
is that teachers generally were not as familiar with various devices designed to
help them make the transition as state education leaders hoped they would be.

59
Crosswalk documents.
The first example of this is a series of Crosswalk documents made by
MDE. These Crosswalks were “intended to show the alignment of Michigan’s
current mathematics Grade Level Content Expectations (GLCEs) to the
Standards for Mathematical Content to assist with the transition to instruction and
assessment based on the CCSS” (MDE, 2010, p. 1). The documents consisted
largely of lining up the GLCEs and corresponding CCSSM standards side by side
in tables. MDE hoped that making this direct comparison for teachers regarding
the content of the two sets of standards would help ease the transition for them.
These views of the state level participants led to the creation of the
following questions for the regional and local level surveys. First, participants
were presented with the question: “How familiar are you with the Michigan
Department of Education’s (MDE’s) Crosswalk documents that compare the prior
Michigan GLCEs with the CCSSM?” Participants used a five-point Likert scale
with which to express their level of familiarity. If they responded that they were at
least slightly familiar, participants were then presented with a second question:
“How useful have MDE’s Crosswalk documents been for you?” Participants used
a five-point Likert scale to express their level of familiarity. The results from the
regional (PD provider) and local (teacher) participants follow. When there is a
statistically significant difference at the p < 0.05 level between the mean
responses of the regional and local participants, it is indicated with an asterisk
(*). Other survey items in this section that will be discussed in future paragraphs
were formatted similarly.

60
“How familiar are you with the Michigan Department of Education’s (MDE’s)
Crosswalk documents that compare the prior Michigan GLCEs with the
CCSSM?”
“How useful have MDE’s Crosswalk documents been for you?”
PD Providers Teachers
Familiarity 3.88 (1.09) 2.33* (1.41)
Usefulness 2.79 (1.32) 2.79 (1.11)
1: Not at all familiar/useful, 2: Slightly familiar/useful, 3: Somewhat familiar/useful,
4: Moderately familiar/useful, 5: Extremely familiar/useful
Table 8: Crosswalk Familiarity and Usefulness
The table above shows that the state’s professional development
providers were moderately familiar with the Crosswalks, but were more dubious
about their usefulness. The reasons for this were rather uniform among the
professional development providers with whom I spoke, despite the somewhat
high degree of variability in their survey responses. For example, one stated,
I don’t like the Crosswalk documents. I have not hidden how I feel about
that at all because I do not believe that there is a one-to-one
correspondence first of all from the GLCEs to the Common Core
Standards. And the standards are asking students to do different things
with those topics. And I feel that those Crosswalk documents, that the
work that’s been done around those has attempted to just map a content

61
topic to another one, and I’m afraid teachers will look at that and say, ‘Oh,
we keep doing the same thing we used to around [whatever topic].’
The professional development providers noted a lack of exact one-to-one
correspondence as well as a fear that teachers would use the Crosswalks to
rationalize not changing the content they were teaching or how they were
teaching it. Therefore, the professional development providers viewed the
Crosswalk documents as a state provided resource that impeded one of the
goals of the CCSSM: to improve the way mathematics is taught.
In particular, the professional development providers feared the Crosswalk
documents would facilitate the new standards becoming a checklist in teachers’
minds:
[The Crosswalks] were helpful to a certain degree in terms of, ‘OK, where
can I connect? Where can we show relationships to the old and the new?’
But where they weren’t helpful is where with Common Core we don’t want
to treat it like a checklist. And I think the Crosswalk documents kind of
maybe encouraged that.
The professional development providers wanted the Standards for Mathematical
Practice to be in the front of teachers’ minds as much as possible. Much of the
disdain they had for teachers perceiving the CCSSM as a checklist was rooted in
the idea that that orientation toward to CCSSM was too focused on the content
standards alone. While one professional development provider did note a
usefulness in helping teachers see content shifts between grade levels, the
overall view of the Crosswalk documents among this group was negative.

62
This dislike of the Crosswalks among the professional development
providers may account for the low level of familiarity with the Crosswalks on the
part of the teachers noted in the table above. Few of the teachers who
completed the survey or who I conducted follow up interviews with had heard of
the Crosswalk documents. The few who were familiar with them noted that they
had mostly found them somewhat useful early on in the transition process. One
teacher stated,
Well, when I was comparing, at the very beginning, ‘OK, this is what was
in my old program, and this is what’s in my new program,’ it made it very
easy for me to see which things were missing and which things I needed
to at least identify with my kids. Do they have this? Do they not have it?
Before I build on it. So I did find that very helpful to read that, and go, ‘OK,
here’s this. Oh it’s not over here.’
Another noted, “I enjoyed the experience of knowing where the foundations are,
where it’s going, where they were, identifying my piece in it. But once that was
done, it didn’t need to be revisited.” These representative quotes from the
teacher interviews substantiate what the professional development providers
feared: teachers using the Crosswalk documents as an introduction to a highly
content-focused view of the CCSSM.
MAISA sample units.
MDE officials also noted that the Michigan Association of Intermediate
School Administrators (MAISA) had developed sample units for teachers to use
in conceptualizing their own units and lessons with the new content and practice

63
standards. This led to the creation of the following questions for the regional and
local level surveys: “How familiar are you with the sample units and/or lessons
from the Michigan Association of Intermediate School Administrators (MAISA)?”,
and “How useful have MAISA’s sample units and/or lessons been for you?”
These questions were presented identically to how the Crosswalk questions were
presented previously. The results from the regional (PD provider) and local
(teacher) participants follow in the same format as the data from the previous
section.
“How familiar are you with the sample units and/or lessons from the Michigan
Association of Intermediate School Administrators (MAISA)?”
“How useful have MAISA’s sample units and/or lessons been for you?”
PD Providers Teachers
Familiarity 4.36 (0.86) 2.99* (1.53)
Usefulness 3.71 (1.12) 2.92* (1.24)
1: Not at all familiar/useful, 2: Slightly familiar/useful, 3: Somewhat familiar/useful,
4: Moderately familiar/useful, 5: Extremely familiar/useful
Table 9: MAISA Sample Unit Familiarity and Usefulness
As shown in the table above, the professional development providers were
quite familiar with these sample units and found them highly useful in working
with teachers. In part this may have been due to a number of them being
64
involved in the development process of the lessons. One professional
development provider spoke about the aims of the MAISA sample units:
So the way that they’re set up is that there’s an overarching question and
a graphic organizer that then pulls together these sets of coherent, of
connected ideas. There are questions, focus questions that can focus
instruction, and assessment. There are key concepts that are truly meant
to be concepts, not vocabulary. And then within, so you have this
overarching unit overview, and then there’s one pilot lesson and one
sample formative assessment task in each of the math units. They were
never intended to be day-to-day lessons.
This quote encapsulates several of the reasons the professional
development providers found the MAISA sample units useful. First, they thought
the sample units were strong exemplars that would illustrate how teachers should
approach units with respect to the CCSSM. Second, this participant highlighted
the difference between concepts in the sample units as opposed to mere
vocabulary. This emphasizes the professional development providers’ desire for
teachers to teach more deeply for understanding. Finally, the participant notes
the conscious decision that was made for these MAISA samples to be units and
not day-to-day lessons. The professional development providers thought it would
be useful and instructive for teachers to develop their own lessons with both the
content and practice standards in mind.
As seen in the table above, though, teachers were once again less familiar
with this particular resource than the MDE officials or professional development

65
providers might have hoped. In fact, the mean familiarity for the teachers may be
somewhat overinflated. When follow up interviews were conducted with teachers
after the survey, some expressed confusion about the existence of MAISA units
in mathematics. For example, when I brought up the topic with one teacher, he
said, “Well, MAISA, are you talking about the language arts one, or there’s
MAISA math?” I responded that there were MAISA mathematics sample units, to
which he responded, “Yeah, I’m familiar with the language arts MAISA units. I’m
not familiar with MAISA mathematics units.” Teachers were more familiar with
the MAISA English language arts samples than their mathematical counterparts.
This reason may be due to the ELA samples including day-to-day lessons where
the authors of the mathematics units chose not to do so.
With that said, those teachers who were familiar with the MAISA sample
units did find them useful. Seven of the ten interview participants said they were
at least slightly familiar with the MAISA units on the survey. Of those seven,
three were only slightly familiar and exhibited the English language arts
confusion discussed above. The other four found the samples quite useful. One
teacher discussed one of the fourth grade sample lessons:
MAISA, One Grain of Rice, and the factor boards and things. They’re not
black and white sheets of paper. They’re critical thinking, teamwork
projects, discussions that get thought provoking happening. Those kids
will never look at a grain of rice the same way ever again. You know? It’s
pretty cool. Changing their lives. Instead of practicing a million times in
black and white, we have this pretty colorful chart, which is wonderful. But

66
at the end of the day, they get to discuss it, talk about it, write about it,
model it, draw it. All of those things that are going to help them internalize
and carry that skill on to something else in their life.
In this sample lesson, One Grain of Rice, MAISA targets three content
standards and four practice standards, including looking for and making use of
structure when developing strategies and looking for and expressing regularity in
repeated reasoning. The main portion of the lesson involves students using rice
to make and verify conjectures about how large the pattern 1, 2, 4, 8, … gets
after 30 terms. The teacher quoted above found using this lesson to be a
rewarding experience. Despite briefly referring to skill acquisition at the end of
her thought, she valued all the modes the lesson provided for her students to
think about, discuss, and interact with the material. While not citing the practice
standards by name, she valued including those aspects of instruction in her
lesson.
SBAC released items.
Another resource that MDE thought would be useful for teachers was the
set of Smarter Balanced Assessment Consortium (SBAC) released items.
Michigan was a governing state in SBAC, and MDE officials were among the
assessment’s authors, before legislative action in 2013 made MDE pull out of the
process. One state official noted the usefulness of SBAC released items in
working with teachers in this way:
Once the sample items from the tests were made available, teachers
began to see that there’s a different kind of instructional model needed.

67
We’ve been telling them that, and that there are all manner of things that
need to change. It can’t be business as usual. Seeing the assessment
models helped drive that home to them. So it will take a different kind of
instruction.
Essentially, this state official saw the released items for the new CCSSM aligned
assessment as a way to combat the complacency some of the professional
development providers feared existed among the teachers, particularly after the
teachers had worked with the Crosswalk documents. This led to the creation of
the following questions for the regional and local level surveys: “How familiar are
you with the Smarter Balanced Assessment Consortium (SBAC) program and its
released items?”, and “How useful have the SBAC released items been for you?”
These questions were presented identically to how the previous questions in this
section were presented. In addition, because Michigan changed assessments at
a rather late date with respect to CCSSM implementation and the first
administration of the assessments, the following question was added to the
surveys: “In the time since the decision was made to not use the SBAC test
during the 2014-15 school year, how have your views of the usefulness of the
SBAC released items changed?” Participants used a five-point Likert scale to
express the level to which their views of the usefulness of the SBAC released
items had changed. The results from the regional (PD provider) and local
(teacher) participants follow in the same format as the data from the previous
section.

68
“How familiar are you with the Smarter Balanced Assessment Consortium
(SBAC) program and its released items?”
“How useful have the SBAC released items been for you?”
PD Providers Teachers
Familiarity 4.48 (0.71) 2.89* (1.21)
Usefulness 4.43 (0.79) 2.52* (1.17)
1: Not at all familiar/useful, 2: Slightly familiar/useful, 3: Somewhat familiar/useful,
4: Moderately familiar/useful, 5: Extremely familiar/useful
Table 10: SBAC Released Items Familiarity and Usefulness
“In the time since the decision was made to not use the SBAC test during the
2014-15 school year, how have your views of the usefulness of the SBAC
released items changed?”
PD Providers Teachers
2.46 (1.38) 2.02 (1.21)
1: Not at all changed, 2: Slightly changed, 3: Somewhat changed, 4: Moderately
changed, 5: Changed a great deal
Table 11: SBAC Usefulness Changes
The professional development providers enjoyed having access to the
SBAC released items and used them with teachers for similar reasons. One
noted that an important aspect of the released items was that they showed how
the practice standards would be assessed as well as the content standards:
69
That’s what it’s supposed to look like, you know? So that’s really making
sure you’re getting to what you’re supposed to be teaching in the
classroom. So I’d say that was the first time we had a feel for what is this
really going to look like, where we saw evidence of the practice standards
being assessed.
This echoes what the MDE official had to say with respect to needing a new
instructional model and not simply conducting “business as usual.” Both MDE
and the regional professional development providers viewed the SBAC released
items as a way to push teachers in a positive direction with respect to teaching
with the Standards for Mathematical Practice in mind.
Even when Michigan ultimately permanently pulled out of the SBAC, MDE
officials and regional professional development providers still thought the SBAC
released items would be useful for teachers. Essentially, the MDE officials who
had been working on writing the SBAC assessment were now charged with
writing Michigan’s new assessment. Therefore, they knew it would appear rather
similar to what the SBAC assessment would have. Also, the regional level
participants mean usefulness rating for the released items was 4.43 on a five-
point scale, and their views of that usefulness changed only slightly when the
assessment was replaced.
Teachers’ views were again mixed, though, mostly due to a lack of
familiarity with the SBAC released items. The mean familiarity rating among the
surveyed teachers for the released items was 2.89, which was less below the
midpoint of the five-point familiarity scale. In some cases, they simply had not

70
encountered them. In others, they dismissed the possible usefulness of the
items because, during the school year the teacher interviews were conducted,
legislation caused many aspects of the assessment process (including what
assessment would be used) to be highly uncertain.
Those who had more familiarity with the released items generally found
them more useful. One teacher spoke about how she used her knowledge of the
released items in her lesson enactment: “So just even the types of questions that
I ask during a discussion, trying to use the right vocabulary and language that’s
going to be used on the test so that the kids are familiar with it.” While the MDE
officials and professional development providers may not have liked this teacher
thinking at the vocabulary “that’s going to be used on the test” level, MDE and
the professional development providers thought highly enough of the new test
that they were open to teachers teaching to it. So this quote from a teacher
shows what would likely be perceived by them as a move in the right direction.
Another teacher spoke of a professional development experience where
she encountered some released items, how they were used, and what they made
her consider:
I felt the Smarter Balanced released items, as we explored them at the
ISD, we tried to identify the grade level. So we really understood this is
what’s expected at that grade level. As you tried to look at where the
entry points were, ‘How does a kid even get started with a problem like
this?’ That experience itself helped me understand how to build my own
math workshop.

71
This teacher was subsequently able to make further math workshops for students
at her school based on what she learned about the SBAC released items and
how to use them at her ISD.
Additional resources.
To conclude this section, I asked participants about what types of
additional resources would be useful to them in effectively implementing the
CCSSM. To help scaffold the question, I asked it twice with respect to two broad
categories: additional financial resources and additional professional resources.
There is some overlap between these two categories; however, it was useful to
see how the various participants interpreted the distinction when responding to
the questions. For this section, because the MDE and regional professional
development provider responses were so similar, the survey items and
responses are presented first. The items were: (1) “To implement the CCSSM
effectively, those in my occupation need more financial resources from the state
(potentially including the ability to hire more staff, for example).” (2) “To
implement the CCSSM effectively, those in my occupation need more
professional (that is, non-financial) resources from the state.” Participants could
rate their levels of agreement with these statements on five-point Likert scales.

72
“To implement the CCSSM effectively, those in my occupation need more
financial resources from the state (potentially including the ability to hire more
staff, for example).”
“To implement the CCSSM effectively, those in my occupation need more
professional (that is, non-financial) resources from the state.”
PD Providers Teachers
Financial 4.46 (0.66) 3.86* (1.06)
Professional 4.12 (0.67) 4.28 (0.68)
1: Strongly disagree, 2: Disagree, 3: Neither agree nor disagree, 4: Agree, 5:
Strongly agree
Table 12: Necessity of Additional Financial and Professional Resources
Officials at MDE and the regional professional development providers
generally agreed that both additional financial and professional resources would
be useful. These beliefs mostly centered on the ability to hire more people to
lead more teacher professional development, or the ability to buy substitute
teacher time in order to get teachers to such professional development sessions.
One may notice in the table above that while the teachers did agree that
more financial resources would be helpful, their level of agreement was at a
significantly lower level than that of the professional development providers.
When asked about this disparity, teachers would note the major expense of
buying new CCSSM-aligned curricula (which, depending on when they were
bought, may have exhibited dubious levels of CCSSM-alignment). Now that

73
those curricula were in place, they didn’t view themselves as having many more
financial needs with respect to implementing the standards. They just wanted
more professional development to learn how to best use the new curricula their
districts had purchased.
CCSSM Readiness
In this section, various aspects of readiness amongst the teachers,
students, and schools will be discussed. In particular, this includes perceptions
of teacher readiness to teach with respect to the CCSSM and perceptions of
student and school readiness for the new CCSSM-aligned assessments. This
section provides supplemental data to address both of the research questions.
The overarching findings in this area were that MDE and the professional
development providers largely thought readiness would vary from district to
district, school to school, even teacher to teacher. Meanwhile, the teachers were
confident about their own capabilities regarding implementing the CCSSM well;
however, they were less confident when considering their students’ potential
performance on the new assessments.
Teacher readiness.
The first survey item in this section for the professional development
providers and teachers was: “Teachers in my region are (/I am) generally
successfully implementing the CCSSM or are ready to do so.” Note that the
main text was the version of the item given to the professional development
providers, and the parenthetical text was the version of the item given to the
teachers. Participants responded with their level of agreement on a five-point

74
Likert scale. Other survey items in this section were formatted similarly and will
be presented similarly.
“Teachers in my region are (/I am) generally successfully implementing the
CCSSM or are ready to do so.”
PD Providers Teachers
3.44 (0.65) 4.00* (0.68)
1: Strongly disagree, 2: Disagree, 3: Neither agree nor disagree, 4: Agree, 5:
Strongly agree
Table 13: Teacher Readiness for CCSSM Implementation
When the professional development providers were asked about teacher
readiness in their region to teach with respect to the CCSSM, they knew there
was a large degree of variance. With that in mind, a response like this from one
of the professional development providers captures aspects of what all three
interviewed professional development providers said:
Yeah, I think we are giving ourselves too much credit by saying that
teachers are ready, and I don’t know that, when I look at the data of our
school districts prior to the Common Core, and how much they were
struggling, and knowing how much professional development and support
services have been in our school districts, I’m not convinced that they’re
ready. I think there are still some teachers who haven’t so much as

75
unpacked their standards. So I’m a little, I’m not just a little, I’m quite
nervous about the results of the upcoming assessment in the spring.
As one can see in the table above, though, teachers were generally more
confident about their readiness to successfully implement the CCSSM. If they
expressed any hesitance about being ready in terms of their own teaching, it was
expressed through qualifying their perceived amount of readiness based on the
amount of professional development they had had regarding the CCSSM. In one
case even a teacher who admitted to having had a good deal of professional
development related to the CCSSM still felt as though she needed more:
I would also say that I would like a continued professional development in
[the CCSSM] because these, the kiddos are getting very savvy, and they
are learning math in a whole new way than what my generation was
taught. So my foundations are different than their foundations, and so
when they’re meeting together I am having to re-think the way I am
teaching the kiddos and the, even the words I use, yeah, the rhetoric.
Next, professional development providers and teachers were asked if they
were ready for the new assessments with the following survey item: “Teachers in
my region are (/I am) generally ready for the new CCSSM aligned assessments.”

76
“Teachers in my region are (/I am) generally ready for the new CCSSM aligned
assessments.”
PD Providers Teachers
2.64 (0.70) 3.31* (0.95)
1: Strongly disagree, 2: Disagree, 3: Neither agree nor disagree, 4: Agree, 5:
Strongly agree
Table 14: Teacher Readiness for CCSSM Aligned Assessments
When the new CCSSM aligned assessments were brought up, the
professional development providers’ perceptions of teacher readiness and
teachers’ own perceptions of readiness dropped, as can be seen in the above
table. This was partially due to the uncertainty regarding what assessment would
be given to students.
Student and school readiness.
The other fears among professional development providers and teachers
about readiness for the new assessments fell into two categories: those
regarding the content of the assessments, and those regarding the computerized
format of the assessments. To capture participants’ perceptions of these issues,
three survey items were developed: (1) “Students in my region (/classes) are
generally ready for the content of the new CCSSM aligned assessments.” (2)
“Students in my region (/classes) are generally ready to take the new CCSSM
aligned assessments on computers.” (3) “Technology infrastructure in my region

77
(/school) is generally ready for the new CCSSM aligned assessments.” The
survey results for each of these questions follow.
“Students in my region (/classes) are generally ready for the content of the new
CCSSM aligned assessments.”
PD Providers Teachers
2.75 (0.90) 3.01 (0.98)
1: Strongly disagree, 2: Disagree, 3: Neither agree nor disagree, 4: Agree, 5:
Strongly agree
Table 15: Student Readiness for CCSSM Aligned Assessment Content
“Students in my region (/classes) are generally ready to take the new CCSSM
aligned assessments on computers.”
PD Providers Teachers
2.60 (0.82) 2.23 (1.17)
1: Strongly disagree, 2: Disagree, 3: Neither agree nor disagree, 4: Agree, 5:
Strongly agree
Table 16: Student Readiness for Computerized Assessments

78
“Technology infrastructure in my region (/school) is generally ready for the new
CCSSM aligned assessments.”
PD Providers Teachers
2.76 (0.78) 2.57 (1.23)
1: Strongly disagree, 2: Disagree, 3: Neither agree nor disagree, 4: Agree, 5:
Strongly agree
Table 17: Technology Infrastructure Readiness
While teachers thought they were doing the best they could in terms of
teaching the new standards, some were still skeptical that their students were
understanding the mathematics to the extent demanded by the new
assessments. One teacher commented, “I don’t feel that they can, I don’t feel
that they’re ready for the assessments because they have not had enough time
or experience in a classroom that has embraced those mathematical standards.
They don’t view themselves as mathematicians,” while saying that her students
still requested more rote, computational types of problems. Again, while not
mentioning the Standards for Mathematical Practice by name, the above quote
shows that this teacher is worried about aspects of the new assessments that
assess those practice standards.
Much more hesitancy was expressed about the computerized aspects of
the assessments, though. When asked about readiness of schools across the
state for the computerized tests, MDE officials knew that not all schools were
ready, but that the state was moving in the right direction. One state official

79
noted that one strategy used to increase readiness for computerized testing was
to spread the window for testing wider than had been the case for previous paper
and pencil assessments. “If you look at the readiness for computer adaptive
testing, you can spread it over three weeks as compared to a fixed form testing,
everyone testing on the same day. Seventy-five percent of the schools [would
be] ready [compared] to less than 10% of the schools ready.”
Despite MDE’s optimism, though, teachers in individual schools had mixed
perceptions with respect to their schools’ technological readiness. One teacher
was in a school that had technology resources that she viewed as being more
than adequate:
I feel like, at least in my district, that we’ve been really lucky with the
amount of technology we have. We’ve had a full computer lab for longer
than I can remember. I have four student computers. This year I got an
iPad. And the district bought seventy Chromebooks. So, third, fourth, and
fifth was the only ones, we got them in January or February, and third,
fourth, and fifth were the only ones allowed to use the Chromebooks, and
we were doing the practice M-STEP tests online and stuff, so that the kids
got used to the tools, what was going to be available, and how to use
them.
That view was shared by three other teachers who were interviewed. On the
other hand, a teacher from a school with fewer technological resources was
concerned about her students’ chances: “I don’t think the tests are accurate
information because if you can’t use the equipment maybe you know the answer,

80
you just don’t know how to make the equipment work.” This sentiment was also
shared by three other teachers who were interviewed.
Interactions with the State
In this section, participants’ views with respect to interacting with the state
regarding CCSSM implementation are examined. This refers to both direct
interactions participants might have had with MDE as well as their perceptions of
the political feud that emerged regarding the CCSSM within the state. This
section provides supplemental data to address both of the research questions.
Interactions with MDE.
Early in the study, some members of MDE were concerned that others
outside MDE might be frustrated by the compartmentalized nature of the
organization. Because of the way MDE is structured, there are people working
on curriculum and instruction, assessment, and school reform; however, they do
not get the opportunity to work collaboratively as often as they wish. There was
concern that that was potentially giving off a less than united message about
CCSSM implementation. One state level participant spoke about this
phenomenon in this way: “The School Reform Office does their work with priority
schools. And, for example, the curriculum unit that’s embedded within OEII does
their work with curriculum and instruction. But it’s very rare to have us really
working collaboratively together.” When later asked if this caused any problems
with the schools MDE was working with, the participant continued:
They absolutely have confusion over who’s asking what, and we often
hear how we’re asking them to do redundant things in many offices. Not

81
knowing how to navigate MDE and where to go to ask questions. We’ve
actually had this feedback several times with some evaluation work that
we’ve been doing with the field, that we have poor communication inter-
office, we’re asking them to do redundant work, and then it’s just difficult to
navigate the various levels here.
Several state level participants echoed this concern about wanting to give a
united message and being more accessible to schools. This led to the creation
of the following survey item for the regional and local level participants:
“Interacting with the various offices at MDE about CCSSM has been confusing
and/or frustrating.” Participants were asked to express their level of agreement
with this statement on a five-point Likert scale.
“Interacting with the various offices at MDE about CCSSM has been confusing
and/or frustrating.”
PD Providers Teachers
2.72 (0.94) 3.42* (1.41)
1: Strongly disagree, 2: Disagree, 3: Neither agree nor disagree, 4: Agree, 5:
Strongly agree
Table 18: Interactions with MDE
When asked about this issue, the professional development providers
were largely neutral, with a mean rating of 2.72 (close to neither agree nor
disagree) on the item. Most of them were connected to MDE well enough and

82
knew whom they could go to for information and resources. So the
compartmentalized nature of MDE was not an issue for them. While the
teachers, on average, expressed a slightly higher level of frustration regarding
trying to contact MDE, only a very small number of them had tried to do so.
Therefore, while this was not a large problem for teachers in terms of the volume
of them attempting to contact MDE, the small minority who did attempt to contact
MDE became frustrated by the structure.
Political aspects of the CCSSM implementation.
Lastly, the effects of the political aspects of the CCSSM implementation
on these three groups of people will be discussed. At the state level, there was
frustration and disillusionment at the political nature of discussions of the
CCSSM. For example, as mentioned earlier, assessment personnel at MDE had
taken a leading role in authoring new assessments associated with SBAC.
During the fall of 2013, the state legislature passed a bill saying that state money
could not be used for anything related to the CCSSM. Therefore, all MDE
involvement in authoring the SBAC or providing teacher professional
development had to cease. The funding impasse ultimately lasted for six weeks;
however, the duration was unknown during the time it was happening. Officials
at MDE noted that these six weeks had a lasting impact. One commented that,
We are now many months behind other states in getting people ready to
do professional development around Common Core, particularly on
assessment practices in Common Core because of that pause. We didn’t

83
get in when they were doing it. Now the time has kind of passed, and
we’re playing catch up.
Similar concerns were voiced by other officials at MDE. They were professional
educators hired to do meaningful work in education, but they felt micromanaged
and deprofessionalized by the legislature.
Given these concerns from MDE and the political context the CCSSM
occupied, the following survey item was developed for the regional and local
participants: “The political issues pertaining to the CCSSM and the CCSSM
aligned assessments have affected my work over the past year.” Again,
participants expressed their level of agreement using a five-point Likert scale.
“The political issues pertaining to the CCSSM and the CCSSM aligned
assessments have affected my work over the past year.”
PD Providers Teachers
4.36 (0.81) 3.48* (1.08)
1: Strongly disagree, 2: Disagree, 3: Neither agree nor disagree, 4: Agree, 5:
Strongly agree
Table 19: CCSSM Political Issues Affecting Work
As can be seen in the table above, the political issues affected the
professional development providers and teachers, too, although at different
levels and in different ways. Both groups generally agreed that they were
affected, but the professional development providers agreed much more strongly

84
than the teachers, with a 4.36 rating versus 3.48. In general, the professional
development providers said that the political issues pertaining to the CCSSM had
affected them a great deal. One spoke about how complications involving the
legislature inserting itself into the assessment process affected their ability to
engage teachers:
Well, it just makes it more challenging when you’re working with districts
for teacher buy in. So it seems like you have to always make sure that
you’re getting teachers to buy into what you’re doing before you can even
get them…you have to get them on the same page with you before you
can even start working on improving skills and/or content knowledge, or
whatever it may be. And so that’s, that is how it has complicated it. I was
referring primarily to the assessment, because I just feel like we’ve been
jerked around way too much with the whole assessment issue. I, like I
said, continue to plow forward, but it makes your work that much more
difficult.
The professional development providers were having some level of difficulty
getting the teachers to commit to the professional development when the
assessments were still up in the air. In a high stakes testing environment where
student assessment outcomes mean a great deal to teachers, it was important
for the teachers to have some certainty about what the assessments would look
like. Without that, the professional development providers felt somewhat
handicapped.

85
Another professional development provider spoke about how these issues
had changed her role in terms of what it meant to be a strong advocate for
effective mathematics education:
The support that we need right now from MDE is a common message.
And they’re trying to give us a common message, but the legislators are
impeding their ability to give a common message right now. You know,
when there’s questions of whether these standards are going to be our
standards, and part of my job then becomes coming and having to testify
to the senate, that was not something, I’m not a political person. That’s
not my strength, but I had to testify in front of a group of senators about
what was in the Common Core and why they’re a good thing. That’s not
something I’m comfortable doing, and that is a change in my job, that I
now have to be an advocate in a different way for education than I ever
thought I’d have to be. Given the political environment, writing to
legislators, and trying to get meetings with them and realizing they really
have already made up their minds, and so they’re not going to talk to me
anyway. That’s been a very enlightening process, but a very discouraging
process of what’s really happening.
This professional development provider echoes the sentiments of disillusionment
that some members of MDE expressed. She had been a mathematics educator
for years, but this was a new form of advocacy for quality mathematics education
that she had never envisioned taking on. When she did so, she found it
frustrating and discouraging that so many influential non-professional educators

86
had made up their minds with respect to the CCSSM based on dubious
information.
While the teachers agreed that the political issues had affected their work,
their level of agreement was significantly less than that of the professional
development providers. When questioned about how they had been affected,
most reported having fielded questions and concerns from parents of students or
even their own family members. They differed from the professional
development providers in their willingness to view themselves as apolitical
actors. One representative quote from a teacher is,
Yeah, it’s a little frustrating. But to add to that, I’m still going to go and do
my job every single day. And I feel like I know my kids, and I know what
they need. And no matter what changes come in, they’ve always, in the
last fifteen years, they’ve always seemed to be similar.
Teachers would say that they “weren’t political people”, seemingly as a way to
avoid publically taking a side on the issue, and that they just wanted to do what
they knew was best for their students despite whatever was happening in the
legislature. Given their interactions with parents with views across the political
spectrum with respect to the CCSSM, they may have viewed this as the safest
public statement they could make with respect to the CCSSM to stay out of the
fray. This seems to imply that they felt staying out of the discussion would allow
them to be more effective teachers than publically taking a side.

87
Chapter IV: Discussion
Organization of the Chapter
The results of this study will be summarized sequentially within the four
main results categories from the previous chapter (goals of the CCSSM, methods
of support for teachers, CCSSM readiness, and interactions with the state) and
placed in the context of extant literature. Next, recommendations and limitations
of this study will be discussed.
Summary
Goals of the CCSSM.
The results regarding the goals of the CCSSM most directly answered the
first research question: To what degree is there alignment between Michigan
Department of Education (MDE) officials’, regional professional development
providers’, and teachers’ views of the goals of CCSSM implementation? Among
the three groups of stakeholders considered in this study, there were areas of
shared understanding and areas of disagreement regarding the goals of the
CCSSM. First, there was disagreement between the stakeholders about whether
the amount of new topics and grade level shifts in content were significant.
Officials at MDE held a unified view that there were few new topics and grade
level shifts in content. They especially downplayed the new topics and grade
level shifts in content in comparison to changes in teaching promoted by the
CCSSM’s Standards for Mathematical Practice. The teachers, however, found
the changes in content to be significant. Furthermore, they viewed learning new
ways of teaching familiar content as new content that they had to learn. The

88
professional development providers largely agreed with the teachers on this
point, citing that they directly worked with teachers who were struggling with
content issues. Related to these findings, there was disagreement about the
amount of content covered by the CCSSM compared to Michigan’s previous
GLCEs. For the reasons discussed previously, teachers viewed the new
standards as containing more content. This view was not shared by the MDE
officials or the professional development providers.
On the other hand, there were significant areas of shared understanding
among the three groups of stakeholders regarding the goals of the CCSSM as
well. The MDE officials, professional development providers, and teachers all
agreed that the transition to the CCSSM was more about a transition with respect
to the teaching and learning of mathematics than a transition in content to be
taught. More specifically, all three groups agreed that the CCSSM demanded
more depth and rigor with respect to both how teachers conceptualize their
teaching of mathematics and how students engage with and understand
mathematics. All three groups generally viewed the transition to the CCSSM as
a positive change; however, the degree to which the teachers agreed with this
position was lower. Several teachers cited concerns about the CCSSM’s
developmental appropriateness for students at their grade levels, a lack of time
for themselves to prepare properly for the change, and a lack of immediate
positive success with students.
As described in the first chapter, knowing the views of various
stakeholders regarding what the CCSSM and its goals are is an important piece

89
of understanding the implementation process. Ghods (2014) echoes this, saying
that one reason reforms sometimes fail is a lack of shared understanding
between teachers and other members of the education system. In her study of
fourth grade teachers in Illinois, Indiana, and Michigan, Ghods also noted that
one important aspect of teachers’ decision making with respect to implementing
a reform is if the teachers valued the reform. Reece (2014) found that teacher
perceptions of the CCSSM directly influenced the success of the implementation
of the standards. Here, there was general agreement that the change to the
CCSSM was positive, and that teachers would have to learn to teach for more
depth and understanding. The results of this study show that the teachers do
value the reform. Matlock et al. (2016) showed that teachers had a positive
attitude with respect to implementing the CCSSM, particularly at the elementary
level. Reece (2014) also found that teachers in Nevada viewed the change to
the CCSSM positively, and that teachers knew they would have to teach with
greater levels of depth. Walker (2016) also found strong positive feelings among
teachers with respect to the CCSSM, and specifically with respect to the
Standards for Mathematical Practice. Unlike some teachers in this study,
teachers in her study had positive results with students when they were first
trying to focus on the practice standards in their teaching.
With respect to similarity to previous standards, Porter et al. (2011)
studied the degree of alignment between the CCSSM and many states’ previous
standards. Across all the states whose previous standards they compared to the
CCSSM, they found only low to moderate alignment with the CCSSM. Porter et
90
al.’s results do not stand entirely in contrast to this study, though. First, for
Michigan, the authors compared the second, third, fourth, and fifth grade GLCEs
to the CCSSM. For each of those four grades, with an average of 16 states
being compared at each grade level, Michigan’s previous standards were the
most closely aligned to the CCSSM of any state in the study at all four grade
levels. Furthermore, Porter et al. determined alignment along two axes: content
topics and levels of cognitive demand. Although the authors did not present
state-by-state data broken out along these two dimensions, they noted that much
of the non-alignment with states’ previous standards was due to the CCSSM’s
focus on higher levels of cognitive demand. This correlates well with this study’s
participants at all levels voicing a need for higher levels of depth and rigor in
mathematics teaching.
Methods of support for teachers.
The results regarding the methods of support for teachers most directly
answered the second research question: Do those outside MDE charged with the
implementation feel adequately supported in effecting their part of the transition
to the CCSSM? One main finding in this section of results was that the teachers
were generally less familiar with various support mechanisms than officials at
MDE hoped they would be. The three support mechanisms cited most often by
MDE officials were the Crosswalk documents, sample CCSSM units created by
MAISA, and sample released items from the new CCSSM aligned SBAC
assessment. The other main finding in this section was that all stakeholders

91
would like for teachers to have more professional development opportunities as
well as more time to thoughtfully implement the CCSSM.
The Crosswalk documents were made to show teachers in Michigan that
the content of the CCSSM aligned closely with the content of Michigan’s previous
GLCEs. Relatively few teachers had heard of the Crosswalk documents, and the
teachers who had only found them to be somewhat useful. This lack of teacher
familiarity may have been partially due to the professional development
providers’ negative views of the Crosswalk documents. They thought the
Crosswalk documents would allow teachers to think few changes needed to be
made, which counteracted their effort to raise the level of mathematics teaching
in their regions.
MDE officials and professional development providers thought highly of
the sample CCSSM units prepared by MAISA. Teachers’ views on the units
were split. Among the teachers who had heard of the sample units and used
them, they were highly regarded. Still, many of the teachers did not know
sample units existed for the CCSSM. Many more teachers knew that sample
units existed for the new English language arts standards, though. This may
have been due to the latter samples providing day-to-day lessons.
Finally, stakeholders’ views of the SBAC released items were similar to
their views of the MAISA sample units. The MDE officials and professional
development providers thought highly of them, particularly because they were
well aligned to the CCSSM and showed how the Standards for Mathematical
practice would be assessed. Teachers were, again, less familiar with the SBAC

92
released items, and there was split opinion on them among the teachers who
were familiar with them. Some teachers who found the released items to not be
useful did so because of the amount of uncertainty regarding what assessment
would be given in the state.
The most general finding of teachers desiring more professional
development with respect to the CCSSM is well substantiated in the literature.
Romero (2015) found that such professional development was most effective
when teachers found the presenters to be credible based on the presenters’ past
teaching experience. In this study of Michigan, teachers who were interviewed
had only positive things to say regarding the regional professional development
providers. The teachers in Walker’s (2016) study desired professional
development that took care to engage them at their level of understanding when
the new standards were introduced. McGurn’s (2014) study of teachers in Iowa,
Kansas, Missouri, Oregon, and Vermont found that teachers most desired
resources with respect to CCSSM implementation were more time to thoughtfully
implement the standards and more professional development to help them do so.
All of these findings align well with the results of this study.
With respect to one of the support mechanisms specifically considered in
this study, Michigan’s Crosswalk documents, one other study considered the
analogous documents in another state. Sheppard (2013) studied teachers’ views
of Arkansas’s Crosswalk documents. She found substantially similar results to
this study: Few teachers had heard of the Arkansas Crosswalk documents, and
those who had heard of them only found them somewhat helpful.

93
CCSSM readiness.
MDE officials and the regional professional development providers viewed
CCSSM readiness as very mixed from district to district, school to school, and
teacher to teacher. In contrast, both teachers who took the survey and those
who completed follow up interviews were generally optimistic regarding their
success at implementing the CCSSM in their classrooms. Despite this, all
stakeholders were unsure how ready students were for the content of the new
CCSSM aligned assessment. Content aside, state level participants were
confident about students’ readiness to take the new assessment on computers.
The professional development providers and teachers generally expressed more
trepidation about students’ abilities to succeed on a computer-based
assessment. The concerns centered on students’ levels of familiarity with
computers and on schools’ technology infrastructure relative to the amount of
testing.
Sheppard’s (2013) study found that teachers in Arkansas reported widely
varying levels of readiness to implement the CCSSM in their own classrooms.
While that disagrees with the self reports of teachers in this study, it does align
with MDE and professional development providers’ views. The Arkansas
teachers’ self reported levels of readiness varied considerably with whether they
felt their district had a strong commitment to professional development around
the standards. In addition, it is possible that the Arkansas teachers received
substantially different professional development support in comparison to the
teachers in the present study. In this study of Michigan, while the teachers

94
generally desired more professional development, they were generally confident
about their ability to implement the CCSSM well regardless of how much
professional development they had had.
Studies have shown mixed findings with respect to teachers’ perceptions
of readiness for the CCSSM, though. While Sheppard (2013) found the teachers
to have mixed views of their own readiness, and this study found teachers
perceiving themselves as implementing the standards well but unsure of their
students’ readiness for the level of academic rigor, Ghods (2014) found teachers
to be optimistic with respect to both their own readiness and that of their
students. She reported that 88% of teachers reported implementing the
standards in their teaching, and 94% of the teachers thought the CCSSM was at
the appropriate level for their students’ mathematical abilities. More akin to
Sheppard’s (2013) results, Walker (2016) found teachers to be wary of both their
own level of familiarity with the CCSSM and with the challenges they perceived
students to be having with the new standards. Similarly, McGurn (2014) found
that only 67% of teachers felt at least somewhat prepared to use the CCSSM.
While the teachers in her study did not express worry about the grade level
appropriateness of the CCSSM, they were concerned about their students not
having the background knowledge to succeed with the CCSSM while the
transition was happening.
One important aspect of CCSSM implementation that the various results
discussed in this section serve to highlight is the varied timeframes for
implementation in different locations. While states generally adopted the

95
CCSSM as their mathematics standards within a relatively short window of time,
a great deal of variance in readiness can be seen within and across states three
to five years after that time.
Interactions with the state.
During the first phase of the study, MDE officials expressed concern that
the department’s compartmentalized structure might confuse or otherwise
negatively affect other members of Michigan’s education system who might be
seeking information about the CCSSM from the state. The professional
development providers had relatively few problems in this area as they generally
knew who to get into contact with and how to contact them about specific
questions. Few of the teachers tried contacting the MDE with concerns about the
CCSSM; however, those who did were often frustrated by the experience.
Also, the political controversy regarding CCSSM implementation affected
all three groups of stakeholders, but in different ways. First, the professional
educators at MDE felt somewhat hamstrung in their ability to do their job with
respect to CCSSM implementation as well as possible because of all the political
and legislative actions regarding the standards at the state level. Next, the
professional development providers indicated that their work was greatly affected
by the controversy. While being career-long advocates of quality mathematics
education, testifying at sometimes hostile legislative hearings and lobbying
legislators was not a form of advocacy that they were accustomed to or enjoyed.
They also found it difficult to get engagement from some teachers at professional
development sessions due to the uncertainty of the status of the standards and

96
the new assessments. Meanwhile, teachers agreed that the controversy around
the CCSSM affected their work, but to a lesser degree. When asked about the
issue during follow up interviews, teachers would consistently say two things.
First, they said they would teach their students whatever the standards were in
the best way that they knew how to do so. Second, they would extricate
themselves from the controversy by identifying themselves as apolitical and not
publically taking a side.
With respect to the teachers, the teachers in Romero’s (2015) study felt
similarly in control of their classrooms and expressed that they knew what was
best for their students regardless of the current policy context. Romero’s
teachers differed, though, in that rather than calmly removing themselves from
the contentious situation they were more emotionally involved.
The frustration found in this study on the part of the MDE officials and the
regional professional development providers regarding the politically contentious
environment the CCSSM came to occupy correlates with other literature. What
they widely perceived to be a well constructed set of mathematics standards was
adopted by the state board of education in 2010. Only two to three years later,
during crucial stages of implementation, did the controversy appear to reach a
critical mass. McDonnell and Weatherford (2016) discussed this phenomenon by
comparing what they referred to as the politics of enactment versus the politics of
implementation. Their argument was that it is relatively easy to enact a policy
(here, adopt the CCSSM) with broad support from high level organizations that
represent many stakeholders. Once the policy begins to be implemented,

97
though, organizations that originally gave their full-throated support to the reform
moderate their stance as their constituents communicate with them about their
experiences with the reform. This is what happened with some leading teacher
organizations following the enactment and implementation of the CCSSM.
Finally, one of the professional development providers cited in the results
chapter expressed difficulty regarding speaking to legislators about the CCSSM
when it seemed they had already made their decisions. Results from a study in
California by Polikoff, Hardaway, Marsh, and Plank (2016) support this
professional development provider’s view. They found some of the leading
predictors of disposition toward the CCSSM were participants’ approval levels for
President Obama and for the state’s current school funding scheme. With these
associations, support for the CCSSM fell largely along partisan lines.
Unfortunately, many of these problems all too closely parallel the paths of
previous mathematics education standards reform efforts. For an example of
this, one can once again consider the California framework of the late 1980s and
early 1990s (Wilson, 2003). This was a standards reform effort that sought
strong alignment between standards, enacted curriculum, and assessments.
Just as with the CCSSM, the policy levers affecting each of these aspects of
implementation initially moved in harmony, but later began to move with less
synchrony as controversy grew. In the cases of both the California framework
and the CCSSM, McDonnell and Weatherford’s (2016) treatment of the politics of
enactment versus the politics of implementation seems apt. Both reform efforts
began strongly, then suffered significant setbacks as the reforms began to enter

98
classrooms. In the end, the California framework lasted little longer than one
seven-year revision cycle. It remains to be seen how long the CCSSM will
endure.
Recommendations
This section will suggest recommendations for future standards
implementation efforts in Michigan and elsewhere.
Treat shifts in content as significant.
Agencies charged with assisting teachers in implementing new standards
should treat all shifts in content as significant. This is not to say that the shifts
should be treated as overly significant if they are minimal; however, they need to
be directly acknowledged and discussed. If, as all stakeholders agreed was the
case with the CCSSM, the change in standards is more about changes in
teaching and learning than it is changes in content, the professional development
experiences focused on changes in teaching can use lessons involving new
content as a context for their discussions.
Crosswalk documents should address content and practices.
The MDE and other state education agencies made Crosswalk documents
to highlight the relatively small shifts in content from their previous standards to
the CCSSM. A fear arose among the professional development providers that
these documents would turn the new standards into a checklist. To avoid this
happening in the future, Crosswalk documents could highlight both shifts in
content and shifts in teaching and learning related to practice standards.
Granted, Michigan’s previous GLCEs did not have practice standards; however,

99
if there is fear about the new standards being treated as “business as usual” as
one MDE official put it, then the Crosswalk documents could be used to highlight
desired changes in practice as well.
Limitations and Recommendations for Further Research
Aside from the limitations already discussed in the methods chapter, it
must be acknowledged that this is a case study of only one state.
Generalizability to other states could depend on how similar those states are to
Michigan. For example, Michigan has a robust intermediate school district
system that employs full time, subject specific professional development
providers. The experiences of those in other states that do not have an analog to
the ISD structure or similar consistent access to professional development
providers may differ. Therefore, similar studies should continue to be done in
other states. In that fashion, this study will become part of a mosaic of results
regarding differing stakeholders’ views of the implementation of the CCSSM.
With respect to stakeholders, the scale of this study only allowed for the
inclusion of MDE officials, professional development providers, and elementary
teachers. Ideally, studies with a wider variety of stakeholders should be
conducted. These other stakeholders include teachers from across the K-12
spectrum, building administrators, district administrators, parents, and policy
makers.

100
APPENDICES

101
APPENDIX A
Regional Survey
1) Place of Employment:
2) Job Title:
3) Years of experience in present job:
4) Degree(s) obtained and major(s):
5) There really is not much new mathematics in the CCSSM, nor are there
that many grade level shifts in when mathematics topics should be taught.
(Strongly Disagree, Disagree, Neither Agree nor Disagree, Agree, Strongly
Agree)
6) The transition to the CCSSM is less about a transition in mathematical
content for teachers and students than it is about a transition in teaching as
expressed in the Practice Standards. (Strongly Disagree, Disagree, Neither
Agree nor Disagree, Agree, Strongly Agree)
7) Compared to Michigan’s previous Grade Level Content Expectations
(GLCEs), I think the CCSSM covers (less content., about the same amount of
content., more content.)
8) Compared to Michigan’s previous GLCEs, a greater level of depth and
rigor in mathematics is needed for teachers and students to meet the CCSSM’s
standards. (Strongly Disagree, Disagree, Neither Agree nor Disagree, Agree,
Strongly Agree)

102
9) I view Michigan’s transition to the CCSSM as a positive change. (Strongly
Disagree, Disagree, Neither Agree nor Disagree, Agree, Strongly Agree)
10) How familiar are you with the Michigan Department of Education’s
(MDE’s) Crosswalk documents that compare the prior Michigan GLCEs with the
CCSSM? (Not at all familiar, Slightly familiar, Somewhat familiar, Moderately
familiar, Extremely familiar)
10a) (If “Not at all familiar” was not selected:) How useful have MDE’s Crosswalk
documents been for you? (Not at all useful, Slightly useful, Somewhat useful,
Moderately useful, Extremely useful)
11) How familiar are you with the sample units and/or lessons from the
Michigan Association of Intermediate School Administrators (MAISA)? (Not at all
familiar, Slightly familiar, Somewhat familiar, Moderately familiar, Extremely
familiar)
11a) (If “Not at all familiar” was not selected:) How useful have MAISA’s sample
units and/or lessons been for you? (Not at all useful, Slightly useful, Somewhat
useful, Moderately useful, Extremely useful)
12) How familiar are you with the Smarter Balanced Assessment Consortium
(SBAC) program and its released items? (Not at all familiar, Slightly familiar,
Somewhat familiar, Moderately familiar, Extremely familiar)
12a) (If “Not at all familiar” was not selected:) How useful have the SBAC
released items been for you? (Not at all useful, Slightly useful, Somewhat useful,
Moderately useful, Extremely useful)

103
12b) (If “Not at all familiar” was not selected:) In the time since the decision was
made to use the M-STEP test during the 2014-15 school year, how have your
views of the usefulness of the SBAC released items changed? (Not at all
changed, Slightly changed, Somewhat changed, Moderately changed, Changed
a great deal)
13) Did you attend one of MDE’s regional CCSSM Rollout sessions in 2010?
(No, No because I was not in my current position in 2010, Yes)
13a) (If “Yes” was selected:) How useful was the MDE Rollout session for you?
(Not at all useful, Slightly useful, Somewhat useful, Moderately useful, Extremely
useful)
14) How familiar are you with MTRAx Interactive? (Not at all familiar, Slightly
familiar, Somewhat familiar, Moderately familiar, Extremely familiar)
14a) (If “Not at all familiar” was not selected:) How useful has MTRAx Interactive
been for you? (Not at all useful, Slightly useful, Somewhat useful, Moderately
useful, Extremely useful)
15) I have worked with a Mathematics and Science Partnership grant in my
region. (No, Yes)
16) To implement the CCSSM effectively, those in my occupation need more
financial resources from the state (potentially including the ability to hire more
staff, for example). (Strongly Disagree, Disagree, Neither Agree nor Disagree,
Agree, Strongly Agree)
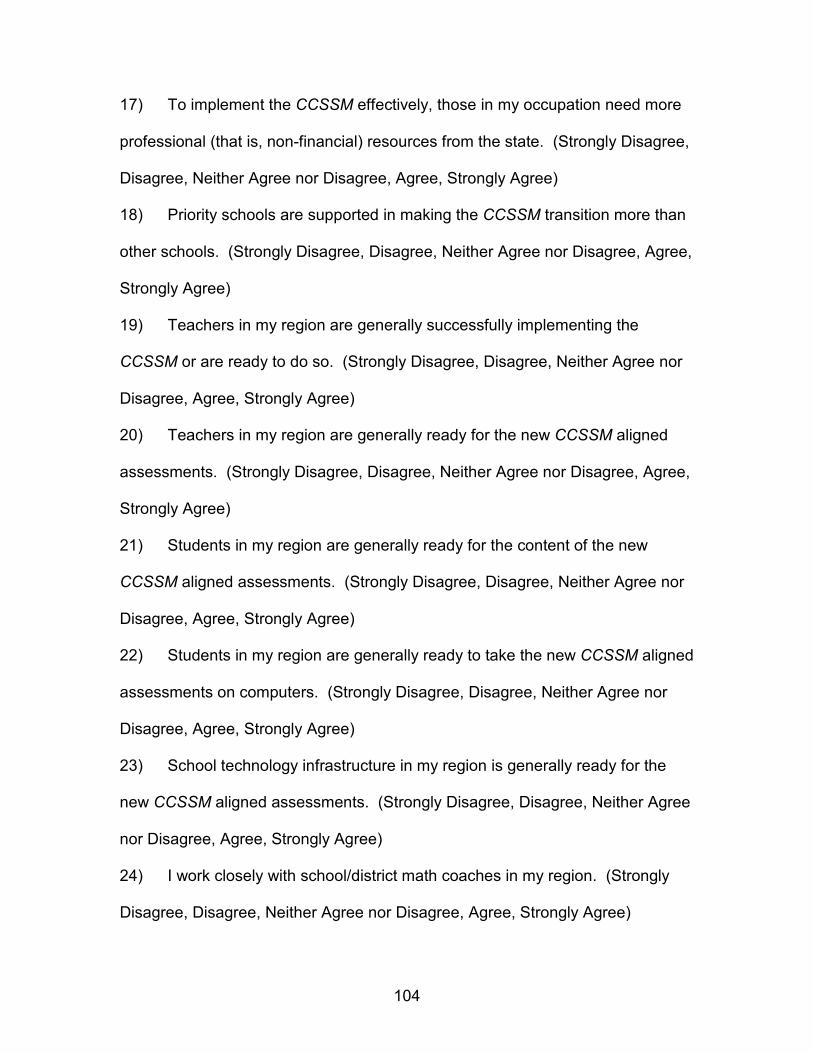
104
17) To implement the CCSSM effectively, those in my occupation need more
professional (that is, non-financial) resources from the state. (Strongly Disagree,
Disagree, Neither Agree nor Disagree, Agree, Strongly Agree)
18) Priority schools are supported in making the CCSSM transition more than
other schools. (Strongly Disagree, Disagree, Neither Agree nor Disagree, Agree,
Strongly Agree)
19) Teachers in my region are generally successfully implementing the
CCSSM or are ready to do so. (Strongly Disagree, Disagree, Neither Agree nor
Disagree, Agree, Strongly Agree)
20) Teachers in my region are generally ready for the new CCSSM aligned
assessments. (Strongly Disagree, Disagree, Neither Agree nor Disagree, Agree,
Strongly Agree)
21) Students in my region are generally ready for the content of the new
CCSSM aligned assessments. (Strongly Disagree, Disagree, Neither Agree nor
Disagree, Agree, Strongly Agree)
22) Students in my region are generally ready to take the new CCSSM aligned
assessments on computers. (Strongly Disagree, Disagree, Neither Agree nor
Disagree, Agree, Strongly Agree)
23) School technology infrastructure in my region is generally ready for the
new CCSSM aligned assessments. (Strongly Disagree, Disagree, Neither Agree
nor Disagree, Agree, Strongly Agree)
24) I work closely with school/district math coaches in my region. (Strongly
Disagree, Disagree, Neither Agree nor Disagree, Agree, Strongly Agree)

105
25) There is a significant movement to “opt out” of the CCSSM and/or the
CCSSM aligned assessments in my region. (Strongly Disagree, Disagree,
Neither Agree nor Disagree, Agree, Strongly Agree)
26) Interacting with the various offices at MDE about CCSSM has been
confusing and/or frustrating. (Strongly Disagree, Disagree, Neither Agree nor
Disagree, Agree, Strongly Agree)
27) Teachers in my region have had difficulty unpacking what CCSSM
standards mean. (Strongly Disagree, Disagree, Neither Agree nor Disagree,
Agree, Strongly Agree)
28) The political issues pertaining to the CCSSM and the CCSSM aligned
assessments have affected my work over the past year. (Strongly Disagree,
Disagree, Neither Agree nor Disagree, Agree, Strongly Agree)
29) Would you like to say more about anything pertaining to any of the
questions I have asked? If so, please do so here.
30) Are there aspects of CCSSM implementation that are important to you in
your job that were not discussed in this survey? If so, please describe them.

106
APPENDIX B
Local Survey
1) Job Title:
2) What grade(s) do you currently teach? Please check all that apply: (Pre-
K, Kindergarten, First, Second Third, Fourth, Fifth, Sixth (all subjects, self-
contained classroom), Sixth (mathematics), Seventh (all subjects, self-contained
classroom), Seventh (mathematics), Eighth (all subjects, self-contained
classroom), Eighth (mathematics), Other (please specify on the next question))
2a) (If “Other” was selected:) Please specify what you mean by responding
“Other” to the question “What grade(s) do you currently teach?”
3) Including this year, how many years of experience do you have teaching
the grade(s) you are currently teaching?
4) Over the course of your career, what grades have you taught? Please
check all that apply: (Pre-K, Kindergarten, First, Second Third, Fourth, Fifth, Sixth
(all subjects, self-contained classroom), Sixth (mathematics), Seventh (all
subjects, self-contained classroom), Seventh (mathematics), Eighth (all subjects,
self-contained classroom), Eighth (mathematics))
5) Including this year, how many total years of teaching experience do you
have?
6) Place of Employment:
7) Is your school a priority school? (No, Yes)
8) Degree(s) obtained and major(s):

107
9) During your professional experience, have you worked under other
standards prior to the Common Core State Standards for Mathematics
(CCSSM)? (Yes, I have worked under previous standards; No, my entire career
has been under the CCSSM)
10) (Suburban region only:) Are you a member of the [teacher math
committee]?
11) (Suburban region only:) For tracking purposes that will help me to
characterize survey respondents, who forwarded you the email for this survey?
Please answer with a name.
12) How familiar are you with the CCSSM Content Standards for the grade(s)
you teach? (Not at all familiar, Slightly familiar, Somewhat familiar, Moderately
familiar, Extremely familiar)
13) How familiar are you with the CCSSM Standards for Mathematical
Practice? (Not at all familiar, Slightly familiar, Somewhat familiar, Moderately
familiar, Extremely familiar)
14) When planning lessons, with respect to the CCSSM Content Standards, I
think the Standards for Mathematical Practice are (much less important., less
important., equally important., more important., much more important.)
15) There really is not much new mathematics in the CCSSM, nor are there
that many grade level shifts in when mathematics topics should be taught.
(Strongly Disagree, Disagree, Neither Agree nor Disagree, Agree, Strongly
Agree)

108
16) The transition to the CCSSM is less about a transition in mathematical
content for teachers and students than it is about a transition in teaching and
learning (as expressed in the Standards for Mathematical Practice). (Strongly
Disagree, Disagree, Neither Agree nor Disagree, Agree, Strongly Agree)
17) Compared to Michigan’s previous Grade Level Content Expectations
(GLCEs), I think the CCSSM covers (less content., about the same amount of
content., more content.)
18) The transition to the CCSSM allows me to explore mathematical topics
more deeply with my students. (Strongly Disagree, Disagree, Neither Agree nor
Disagree, Agree, Strongly Agree)
19) Compared to Michigan’s previous GLCEs, a greater level of depth and
rigor in mathematics is needed for teachers and students to meet the CCSSM’s
standards. (Strongly Disagree, Disagree, Neither Agree nor Disagree, Agree,
Strongly Agree)
20) I perceive the CCSSM Content Standards to be less like a checklist than I
did Michigan’s previous GLCEs. (Strongly Disagree, Disagree, Neither Agree
nor Disagree, Agree, Strongly Agree)
21) There are more clear learning progressions in the CCSSM than in
Michigan’s previous GLCEs. (Strongly Disagree, Disagree, Neither Agree nor
Disagree, Agree, Strongly Agree)
22) I view Michigan’s transition to the CCSSM as a positive change. (Strongly
Disagree, Disagree, Neither Agree nor Disagree, Agree, Strongly Agree)

109
23) It has been easier to find and/or access useful resources related to the
CCSSM than to Michigan’s previous GLCEs. (Strongly Disagree, Disagree,
Neither Agree nor Disagree, Agree, Strongly Agree)
24) Have CCSSM aligned professional development (PD) opportunities been
available to you? (Note: This is not asking whether you ultimately attended them,
merely if the opportunity to do so was available.) (No, Yes)
25) I have had adequate opportunities for PD related to the CCSSM.
(Strongly Disagree, Disagree, Neither Agree nor Disagree, Agree, Strongly
Agree)
26) Have you attended CCSSM aligned PD? (No, Yes)
27) (If “Yes” was selected:) Have you attended CCSSM aligned PD provided
by your intermediate school district (ISD) and/or regional Math and Science
Center? (No, Yes)
28) (If “Yes” was selected on question 24:) Have you attended CCSSM
aligned PD provided by your school and/or district? (No, Yes)
29) In general, my CCSSM aligned PD experiences have been (Not at all
useful, Slightly useful, Somewhat useful, Moderately useful, Extremely useful)
30) Does your school and/or district have a math coach/consultant? (No, Yes)
31) How familiar are you with the Michigan Department of Education’s
(MDE’s) Crosswalk documents that compare the prior Michigan GLCEs with the
CCSSM? (Not at all familiar, Slightly familiar, Somewhat familiar, Moderately
familiar, Extremely familiar)

110
31a) (If “Not at all familiar” was not selected:) How useful have MDE’s Crosswalk
documents been for you? (Not at all useful, Slightly useful, Somewhat useful,
Moderately useful, Extremely useful)
32) How familiar are you with the sample units and/or lessons from the
Michigan Association of Intermediate School Administrators (MAISA)? (Not at all
familiar, Slightly familiar, Somewhat familiar, Moderately familiar, Extremely
familiar)
32a) (If “Not at all familiar” was not selected:) How useful have MAISA’s sample
units and/or lessons been for you? (Not at all useful, Slightly useful, Somewhat
useful, Moderately useful, Extremely useful)
33) How familiar are you with the Smarter Balanced Assessment Consortium
(SBAC) program and its released items? (Not at all familiar, Slightly familiar,
Somewhat familiar, Moderately familiar, Extremely familiar)
33a) (If “Not at all familiar” was not selected:) How useful have the SBAC
released items been for you? (Not at all useful, Slightly useful, Somewhat useful,
Moderately useful, Extremely useful)
33b) (If “Not at all familiar” was not selected:) In the time since the decision was
made to not use the SBAC test during the 2014-15 school year, how have your
views of the usefulness of the SBAC released items changed? (Not at all
changed, Slightly changed, Somewhat changed, Moderately changed, Changed
a great deal)
34) Did you attend one of MDE’s regional CCSSM Rollout sessions in 2010?
(No, No (I was not in my current position in 2010), Yes)

111
34a) (If “Yes” was selected:) How useful was the MDE Rollout session for you?
(Not at all useful, Slightly useful, Somewhat useful, Moderately useful, Extremely
useful)
34b) (If “No” was selected:) Did someone ever present to you about one of
MDE’s regional CCSSM Rollout sessions? (No, I don’t remember, Yes)
34c) (If “Yes” was selected:) How useful was the presentation about the MDE
Rollout session for you? (Not at all useful, Slightly useful, Somewhat useful,
Moderately useful, Extremely useful)
35) How familiar are you with MTRAx interactive? (Not at all familiar, Slightly
familiar, Somewhat familiar, Moderately familiar, Extremely familiar)
35a) (If “Not at all familiar” was not selected:) How useful has MTRAx Interactive
been for you? (Not at all useful, Slightly useful, Somewhat useful, Moderately
useful, Extremely useful)
36) I have done work and/or PD associated with a Mathematics and Science
Partnership grant? (No, I don’t know, Yes)
37) To implement the CCSSM effectively, those in my occupation need more
financial resources from the state. (Strongly Disagree, Disagree, Neither Agree
nor Disagree, Agree, Strongly Agree)
38) To implement the CCSSM effectively, those in my occupation need more
professional (that is, non-financial) resources from the state. (Strongly Disagree,
Disagree, Neither Agree nor Disagree, Agree, Strongly Agree)

112
39) To implement the CCSSM effectively, those in my occupation need more
professional resources from the ISD. (Strongly Disagree, Disagree, Neither
Agree nor Disagree, Agree, Strongly Agree)
40) To implement the CCSSM effectively, those in my occupation need more
resources from the school and/or district. (Strongly Disagree, Disagree, Neither
Agree nor Disagree, Agree, Strongly Agree)
41) To implement the CCSSM effectively, those in my occupation need more
professional resources from the school and/or district. (Strongly Disagree,
Disagree, Neither Agree nor Disagree, Agree, Strongly Agree)
42) Priority schools are supported in making the CCSSM transition more than
other schools. (Strongly Disagree, Disagree, Neither Agree nor Disagree, Agree,
Strongly Agree)
43) My teaching has changed, or will need to change, in a way that is
significant to me because of CCSSM implementation. (Strongly Disagree,
Disagree, Neither Agree nor Disagree, Agree, Strongly Agree)
43a) (If “Agree” or “Strongly Agree” was selected:) That significant change in
your teaching is (exclusively about content., more about content than how you
teach., equally about content and how you teach., more about how you teach
than content., exclusively about how you teach.)
44) Currently, I am confident in my knowledge of mathematics. (Strongly
Disagree, Disagree, Neither Agree nor Disagree, Agree, Strongly Agree)
45) As a result of the transition to the CCSSM and any associated PD I have
done, my confidence in my knowledge of mathematics has (greatly decreased.,

113
somewhat decreased., neither increased nor decreased., somewhat increased.,
greatly increased.)
46) Currently, I am confident in my teaching of mathematics. (Strongly
Disagree, Disagree, Neither Agree nor Disagree, Agree, Strongly Agree)
47) As a result of the transition to the CCSSM and any associated PD I have
done, my confidence in my teaching of mathematics has (greatly decreased.,
somewhat decreased., neither increased nor decreased., somewhat increased.,
greatly increased.)
48) My curriculum is well aligned to the CCSSM. (Strongly Disagree,
Disagree, Neither Agree nor Disagree, Agree, Strongly Agree)
49) I am generally successfully implementing the CCSSM or am ready to do
so. (Strongly Disagree, Disagree, Neither Agree nor Disagree, Agree, Strongly
Agree)
50) I am generally ready for the new CCSSM aligned assessments. (Strongly
Disagree, Disagree, Neither Agree nor Disagree, Agree, Strongly Agree)
51) Students in my class(es) are generally ready for the content of the new
CCSSM aligned assessments. (Strongly Disagree, Disagree, Neither Agree nor
Disagree, Agree, Strongly Agree)
52) Students in my class(es) are generally ready to take the new CCSSM
aligned assessments on computers. (Strongly Disagree, Disagree, Neither
Agree nor Disagree, Agree, Strongly Agree)

114
53) Technology infrastructure in my school(s) is generally ready for the new
CCSSM aligned assessments. (Strongly Disagree, Disagree, Neither Agree nor
Disagree, Agree, Strongly Agree)
54) Which option best describes your view of your school’s (or schools’)
CCSSM implementation process? (Relatively smooth transition over several
years, Relatively abrupt transition a few years ago, Relatively abrupt transition
this year and/or last year, There hasn’t really been any transition, Other (please
specify on the next question))
54a) (If “Other” was selected:) What did you mean by “Other” on the previous
question?
55) How familiar do you believe your school’s (or schools’) administrators are
with the CCSSM Content Standards? (Not at all familiar, Slightly familiar,
Somewhat familiar, Moderately familiar, Extremely familiar)
56) How familiar do you believe your school’s (or schools’) administrators are
with the CCSSM Standards for Mathematical Practice? (Not at all familiar,
Slightly familiar, Somewhat familiar, Moderately familiar, Extremely familiar)
57) With respect to the CCSSM Content Standards, I believe my school’s (or
schools’) administrators think the Standards for Mathematical Practice are (much
less important., less important., equally important., more important., much more
important.)
58) I work closely with ISD level mathematics consultants and/or PD
providers. (Strongly Disagree, Disagree, Neither Agree nor Disagree, Agree,
Strongly Agree)

115
59) There is a significant movement to “opt out” of the CCSSM and/or the
CCSSM aligned assessments in my school(s). (Strongly Disagree, Disagree,
Neither Agree nor Disagree, Agree, Strongly Agree)
60) Interacting with the various offices at MDE about CCSSM has been
confusing and/or frustrating. (Strongly Disagree, Disagree, Neither Agree nor
Disagree, Agree, Strongly Agree, I haven’t attempted to interact with MDE about
CCSSM)
61) I have had difficulty unpacking what CCSSM standards mean. (Strongly
Disagree, Disagree, Neither Agree nor Disagree, Agree, Strongly Agree)
62) With respect to various other initiatives happening in my school(s), I
consider the transition to the CCSSM to be a relatively high priority. (Strongly
Disagree, Disagree, Neither Agree nor Disagree, Agree, Strongly Agree)
63) With respect to various other initiatives happening in my school(s), my
school’s (or schools’) administrators consider the transition to the CCSSM a
relatively high priority. (Strongly Disagree, Disagree, Neither Agree nor
Disagree, Agree, Strongly Agree)
64) The political issues pertaining to the CCSSM aligned assessments have
affected my work over the past year. (Strongly Disagree, Disagree, Neither
Agree nor Disagree, Agree, Strongly Agree)
65) (Suburban region only:) Did you participate in the pilot and review of the
MAISA sample units?
66) Would you like to say more about anything pertaining to any of the
questions I have asked? If so, please do so here.

116
67) Are there aspects of CCSSM implementation that are important for you in
your job that were not discussed in this survey? If so, please describe them.

117
REFERENCES
118
REFERENCES
Ball, D. L. (1990). Reflections and deflections of policy: The case of Carol Turner. Educational Evaluation and Policy Analysis, 12(3), 263-275.
California State Department of Education. (1985). Mathematics Framework for
California Public Schools, Kindergarten through Grade Twelve. Sacramento, CA: Author.
Cohen, D. K. (1990). A revolution in one classroom: The case of Mrs. Oublier.
Educational Evaluation and Policy Analysis, 12(3), 311-329. Creswell, J. W. (2009). Research Design: Qualitative, Quantitative, and Mixed
Methods Approaches. Los Angeles, CA: Sage Publications. Floden, R. E., & Wilson, S. M. (2003). Recent research on the influence of
standards: Insights and methodological approaches. In F. K. Lester & J. Ferrini-Mundy (Eds.), Proceedings of the NCTM Research Catalyst Conference (pp. 33-42). Reston, VA: National Council of Teachers of Mathematics.
Gamoran, A. (2007). Introduction: Can standards-based reform help reduce the
poverty gap in education? In A. Gamoran (Ed.), Standards-based reform and the poverty gap: Lessons for No Child Left Behind (pp. 3-16). Washington, DC: Brookings Institution.
Ghods, H. H. (2014). How Teachers Prioritize Reform: The Common Core State
Standards. Ann Arbor, MI: ProQuest. Heck, D. J., Weiss, I. R., & Pasley, J. D. (2011). A Priority Research Agenda for
Understanding the Influence of the Common Core State Standards for Mathematics. Chapel Hill, NC: Horizon Research, Inc.
Keesler, V., & Martineau, J. (2013, July 22). Status of Common Core State
Standards. Michigan.gov. Retrieved November 24, 2013, from http://www.michigan.gov/documents/mde/Status_of_CCSS_427970_7.pdf
Matlock, K. L., Goering, C. Z., Endacott, J., Collet, V. S., Denny, G. S., Jennings-
Davis, J., & Wright, G. P. (2016). Teachers’ views of the Common Core State Standards and its implementation. Educational Review, 68(3), 291-305.
McDonnell, L. M., & Weatherford, M. S. (2016). Recognizing the political in
implementation research. Educational Researcher, 45(4), 233-242.

119
McGurn, L. (2014). Understanding Teacher Concerns About the Implementation
of Common Core State Standards (CCSS). Ann Arbor, MI: ProQuest. McVicar, B. (2016, April 19). Michigan lawmaker pushes to dump Common Core.
Mlive.com. Retrieved June 10, 2016, from http://www.mlive.com/news/index.ssf/2016/04/michigan_lawmaker_pushes_to_du.html
Michigan Department of Education. (n.d.a). Common core standards fact sheet.
Michigan.gov. Retrieved November 24, 2013, from http://www.michigan.gov/documents/mde/FAQ_4.10.13_418299_7.pdf
Michigan Department of Education. (n.d.b). Common core standards – questions
and answers. Michigan.gov. Retrieved November 24, 2013, from http://www.michigan.gov/documents/mde/Common_Core_QandA_311926_7.pdf
National Commission on Excellence in Education. (1983). A Nation at Risk.
Cambridge, MA: USA Research. National Council of Teachers of Mathematics. (1980). An Agenda for Action:
Recommendations for School Mathematics of the 1980s. Reston, VA: Author.
National Council of Teachers of Mathematics. (1989). Curriculum and Evaluation
Standards for School Mathematics. Reston, VA: Author. National Council of Teachers of Mathematics. (1995). Assessment Standards for
School Mathematics. Reston, VA: Author. National Council of Teachers of Mathematics. (2000). Principles and Standards
for School Mathematics. Reston, VA: Author. National Governors Association & Council of Chief State School Officers. (n.d.).
Common Core State Standards initiative K-12 standards development teams. Nga.org. Retrieved November 24, 2013, from http://www.nga.org/files/live/sites/NGA/files/pdf/2010COMMONCOREK12TEAM.PDF
National Governors Association, & Council of Chief State School Officers. (2010).
Common Core State Standards for Mathematics. Washington, DC: Authors.

120
National Governors Association, & Council of Chief State School Officers. (2012). Common Core State Standards initiative – frequently asked questions. Corestandards.org. Retrieved November 24, 2013, from http://www.corestandards.org/resources/frequently-asked-questions
National Governors Association, & Council of Chief State School Officers. (2013,
April 9). K-8 publishers’ criteria for the Common Core State Standards for Mathematics. Corestandards.org. Retrieved November 24, 2013, from http://www.corestandards.org/assets/Math_Publishers_Criteria_K-8_Spring%202013_FINAL.pdf
National Research Council. (2001). Adding It Up: Helping Children Learn
Mathematics. J. Kilpatrick, J. Swafford, and B. Findell (Eds.). Mathematics Learning Study Committee, Center for Education, Division of Behavioral and Social Sciences and Education. Washington, DC: National Academy Press.
No Child Left Behind Act of 2001, 20 U.S.C. 6319 (2008). Oosting, J. (2013, June 13). Michigan Gov. Rick Snyder signs ‘solid’ $49.5 billion
budget short on money for Medicaid expansion. Mlive.com. Retrieved November 24, 2013, from http://www.mlive.com/politics/index.ssf/2013/06/michigan_gov_rick_snyder_signs_3.html
Polikoff, M. S., Hardaway, T., Marsh, J. A., & Plank, D. N. (2016). Who is
opposed to Common Core and why? Educational Researcher, 45(4), 263-266.
Porter, A., McMaken, J., Hwang, J., & Yang, R. (2011). Common Core
Standards: The new U.S. intended curriculum. Educational Researcher, 40(3), 103-116.
Reece, L. (2014). The Impact of Teacher Perception on Implementation of
Common Core State Standards in Mathematics Curriculum. Ann Arbor, MI: ProQuest.
Romero Jr., M. (2015). The Impact of Educational Policy Changes Upon
Elementary School Teachers’ Instructional Practices. Ann Arbor, MI: ProQuest.
Saavedra, A. R., & Steele, J. L. (2012). Implementation of the Common Core
State Standards. Santa Monica, CA: RAND. Schoenfeld, A. H. (2003, August 5). Math wars. Cornell.edu. Retrieved
November 24, 2013, from

121
http://www.math.cornell.edu/~henderson/courses/EdMath-F04/MathWars.pdf
Scott, J. C. (1999). Seeing Like a State: How Certain Schemes to Improve the
Human Condition Have Failed. New Haven, CT: Yale University Press. Sheppard, J. T. (2013). Examining Perceptions Over the Effectiveness of
Professional Development and Available Resources on the Common Core State Standards Implementation in Arkansas. Ann Arbor, MI: ProQuest.
Smarter Balanced Assessment Consortium. (2012). Governance.
Smarterbalanced.org. Retrieved November 24, 2013, from http://www.smarterbalanced.org/about/governance/
Smith, B. (2013d, August 14). Common core hearing lasts nearly 6 hours as
educators, public speak. Mlive.com. Retrieved November 24, 2013, from http://www.mlive.com/education/index.ssf/2013/08/marathon_hearing_on_common_cor.html
Smith, B. (2013a, October 1). Common core budget delay takes effect today as
Michigan senate considers vote. Mlive.com. Retrieved November 24, 2013, from http://www.mlive.com/education/index.ssf/2013/10/common_core_budget_delay_takes.html
Smith, B. (2013b, October 24). Common core approval sails through Michigan
senate on voice vote. Mlive.com. Retrieved November 24, 2013, from http://www.mlive.com/education/index.ssf/2013/10/common_core_approval_sails_thr.html
Smith, B. (2013c, October 24). Work on common core resuming immediately,
Michigan education superintendent says. Mlive.com. Retrieved November 24, 2013, from http://www.mlive.com/education/index.ssf/2013/10/work_on_common_core_resuming_i.html
Smith, B. (2014a, January 7). Michigan has only one option for student testing,
education officials say. Mlive.com. Retrieved June 10, 2016, from http://www.mlive.com/education/index.ssf/2014/01/michigan_has_only_one_option_f.html
Smith, B. (2014b, June 10). MEAP testing requirement in Michigan’s budget
creates more questions than answers. Mlive.com. Retrieved June 10, 2016, from http://www.mlive.com/lansing-news/index.ssf/2014/06/meap_requirement_in_michigans.html

122
Ujifusa, A. (2013, September 26). Common Core given boost by key Michigan house vote. Edweek.org. Retrieved November 24, 2013, from http://blogs.edweek.org/edweek/state_edwatch/2013/09/common_core_given_boost_by_key_michigan_house_vote.html
Ujifusa, A. (2014, June 30). Michigan drops Common Core test, but might still
use its questions. Edweek.org. Retrieved June 10, 2016, from http://blogs.edweek.org/edweek/state_edwatch/2014/06/common-core_test_dropped_.html
Vogel, L. R. (2010). Leading Standards-Based Education Reform: Improving
Implementation of Standards to Increase Student Achievement. Lanham, MD: Rowman & Littlefield Education.
Walker, V. L. (2016). Implementation of Common Core State Standards & the
Standards of Mathematical Practices: How Can Professional Development Support this Process?. Ann Arbor, MI: ProQuest.
Walmsley, A. L. E. (2003). A History of the New Mathematics Movement and Its
Relationship with Current Mathematical Reform. Lanham, MD: University Press of America.
Walmsley, A. L. E. (2007). A History of Mathematics Education During the
Twentieth Century. Lanham, MD: University Press of America. Weiss, I. R., Knapp, M. S., Hollweg, K. S., & Burrill, G. (Eds.). (2002).
Investigating the Influence of Standards: A Framework for Research in Mathematics, Science, and Technology Education. Washington, DC: National Academy Press.
Wilson, S. M. (1990). A conflict of interests: The case of Mark Black. Educational
Evaluation and Policy Analysis, 12(3), 293-310. Wilson. S. M. (2003). California Dreaming: Reforming Mathematics Education.
New Haven, CT: Yale University Press.
Related Documents


