The Co-operative Bank Update & Warwick Finance Residential Mortgages Number 1 PLC (WFRM1) Review Global ABS 2015 – Barcelona 16 th – 18 th June 2015 1

Welcome message from author
This document is posted to help you gain knowledge. Please leave a comment to let me know what you think about it! Share it to your friends and learn new things together.
Transcript
0
39
105
0
158
255
101
178
227
10
155
217
146
196
234
165
179
171
159
207
103
178
8
56
236
0
140
174
220
219
The Co-operative Bank Update & Warwick Finance
Residential Mortgages Number 1 PLC (WFRM1)
Review
Global ABS 2015 – Barcelona
16th – 18th June 2015
1
0
39
105
0
158
255
101
178
227
10
155
217
146
196
234
165
179
171
159
207
103
178
8
56
236
0
140
174
220
219
Disclaimer This presentation is the property of The Co-operative Bank p.l.c. (the Bank). By accessing this presentation you represent, warrant and agree that you will not attempt to reproduce or transmit the contents (in whole or part), directly or indirectly, of this presentation by any
means. For the purposes of this notice, "presentation" means this document, its contents or any part of it, any oral presentation, any question or answer session and any written or oral material discussed or distributed during the presentation meeting. The contents of this
presentation must be kept confidential by attendees at such presentation and must not be reproduced, printed, distributed, passed on directly or indirectly, to any person or otherwise.
This presentation does not constitute or form part of any offer or invitation to sell or issue, or any solicitation of any offer to purchase or subscribe for any shares or any other securities nor shall it (or any part of it) or the fact of its distribution, form the basis of, or be relied on
in connection with, any contract therefor.
This presentation does not constitute or form part of any offer or invitation to sell or issue, or any solicitation of any offer to purchase or subscribe for any shares or any other securities nor shall it (or any part of it) or the fact of
its distribution, form the basis of, or be relied on in connection with, any contract therefor.
This presentation does not constitute an offer for, sale of, or a solicitation to purchase or subscribe for, any securities in the United States. No securities of the Bank have been, or will be, registered under the US Securities Act of 1933, as amended (the Securities Act), and
securities of the Bank may not be offered or sold in the United States absent an exemption from, or in a transaction not subject to, the registration requirements of the Securities Act and in compliance with any applicable securities laws of any state or other jurisdiction of the
United States. No money, securities or other consideration is being solicited and, if sent in response to the information contained herein, will not be accepted. Subject to limited exceptions, neither this presentation nor any copy of it may be taken, transmitted or distributed,
directly or indirectly, into the United States, its territories or possessions. Any failure to comply with this restriction may constitute a violation of U.S. securities laws.
Neither this presentation nor any copy hereof may be accessed or distributed in any jurisdiction where its access or distribution may be restricted by law. Persons who access or receive this presentation should make themselves aware of and observe and adhere to such
restrictions. Any failure to comply with these restrictions may constitute a violation of the laws of any such jurisdictions. In particular, neither this presentation nor any copy of the information contained in it is for access or distribution directly or indirectly in Canada, Australia,
New Zealand, South Africa, Switzerland or Japan.
Although the statements of fact in this presentation have been obtained from and are based upon sources that are believed to be reliable, their accuracy is not guaranteed by the Bank or any of its advisers and any such information may be incomplete or condensed. All
opinions and estimates included in this presentation are subject to change without notice. None of the Bank, its advisers or any other party is under any duty to update or inform you of any changes to such information, provide you with access to additional information or
correct any inaccuracies in any such information which may become apparent.
Basel III has been implemented in the EU through the new Capital Requirements Regulation and a further iteration of the Capital Requirements Directive. Together the new rules are known as CRD IV and came into effect from 1 January 2014. The European Banking
Authority is providing technical standards relating to CRD IV, some of which are not yet finalised. CRD IV disclosures in this presentation are based on the Bank's interpretation of published rules. There is a risk that the final content of the technical standards may differ
materially from current expectations and that the Bank may become subject to regulatory capital requirements not currently anticipated or provided for.
In the December 2013 PS7/13 Policy Statement PRA announced that, with the exception of available-for-sale unrealised gains, CRD IV deductions and filters would be implemented in full from 1 January and there would be no transition to full implementation. All CRD IV
disclosures in this presentation are shown on a fully loaded basis.
By receiving and/or attending this presentation, you agree to be bound by the restrictions in this disclaimer and will be taken to have given the representations, warranties and undertakings contained in this presentation, including that (i) you have read and agree to comply
with the contents of this presentation including, without limitation, the obligation to keep this presentation and its contents confidential; and (ii) you will not at any time have any discussion, correspondence or contact concerning the information in this presentation with any of
the directors or employees of the Bank or its subsidiaries nor with any of their suppliers, or any governmental or regulatory body without the prior written consent of the Bank.
Recipients of this presentation (and any related materials) should not base any behaviour in relation to qualifying investments or relevant products (as defined in the Financial Services and Markets Act 2000 ("FSMA") and the Code of Market Conduct made pursuant to
FSMA), which would amount to "market abuse" for the purposes of FSMA, on the information in this presentation (and any related materials) until after the information has been made generally available. Nor should the recipient use the information in this presentation (and
any related materials) in any way which would constitute market abuse.
This presentation is published solely for informational purposes and should not be treated as giving investment advice. It has no regard to the specific investment objectives, financial situation or particular needs of any recipient. This presentation speaks as of the date hereof
and has not been independently verified. No representation, warranty or other assurance, express or implied, is or will be made in relation to, and no responsibility is or will be accepted by the Bank or any of its advisers as to the accuracy, correctness, fairness or
completeness of the information or opinions contained in this presentation. The Bank and its respective affiliates, agents, directors, partners and employees, accept no liability whatsoever for any loss or damage howsoever arising from any use of this presentation or its
content or otherwise arising in connection therewith.
This presentation and any related materials may contain or incorporate by reference certain "forward-looking statements" regarding the belief or current expectations of the Bank or the Bank Board (as applicable) about the Bank's financial condition, results of operations and
business described in this presentation. Generally, but not always, words such as "aim", "target", "will", "would", "expect", "propose", "intend", "plan", "estimate", "endeavour", "indicate", "anticipate", "project", "achieve" or their negative variations or similar expressions identify
forward-looking statements. Examples of forward-looking statements include, among others, statements regarding the Bank's future financial position, income growth, assets impairment charges and provisions, business strategy, capital, leverage and other regulatory ratios,
estimates of profitability, projected levels of growth in the banking and financial markets, projected costs, original and revised commitments and targets in connection with the turn-around plan, deleveraging actions, estimates of capital expenditures and plans and objectives
for future operations and other statements that are not historical fact. Such forward-looking statements are not guarantees of future performance. Rather, they are based on current views and assumptions and involve known and unknown risks, uncertainties and other factors
that may cause the actual results, performance, achievements or developments of the Bank or the industry in which it operates to differ materially from any future results, performance, achievements or developments expressed or implied from the forward-looking statements.
The principal risks and uncertainties to the ability of the Bank to implement its revised plan and to achieve the results set out in the plan were set out in the Bank’s Interim Financial Report 2014 and continue to apply to the revised plan. The Bank faces particular challenges
including (but not limited to): market conditions persisting; ability to achieve the targeted cost savings; completing the remediation programme; support from third parties in remediating its IT platform; the PRA not exercising its wide-ranging powers in respect of the Bank or
the plan; ability to retain customers and deposits; the timing and quantum of impacts to capital from its asset reduction exercise; meeting its planned improvements in net interest margin; a possible further deterioration in the quality of the Bank’s asset portfolio; unplanned
costs from (for example) conduct risk matters; ability to maintain the Bank’s access at an appropriate cost to liquidity and funding and the ability of the Bank to raise further capital assumed in its forecasts.
Many of the risks and uncertainties also relate to factors that are beyond the Bank's ability to control or estimate precisely which include (without limitation) factors such as: UK domestic and global economic and business conditions; the Bank's ability to implement
successfully its revised business plan to improve its financial, operational performance and capital position; market related risks, including but not limited to, changes in interest rates and exchange rates; changes to law, regulation, accounting standards or taxation, including
changes to regulatory capital or liquidity requirements and the Bank's ability to meet those requirements; the ability to access sufficient funding to meet the Bank's liquidity needs including through retail deposits; instability in the global financial markets, including Eurozone
instability and the impact of any sovereign credit rating downgrade or sovereign financial issues; changes to the Bank's credit rating; the effect of competition and the actions of competitors; the impact of potential disruption to the Bank's IT and communications systems; the
ability to attract and retain skilled personnel; uncertainties regarding the extent of the Bank's exposure to pensions related liabilities; exposure to increased and ongoing regulatory scrutiny, legal proceedings, regulatory investigations or complaints, including with respect to
conduct issues and other factors. A number of material factors could cause actual results to differ materially from those contemplated by the forward-looking statements. The forward-looking statements contained in this presentation speak only as of the date of this
presentation. Except as required by law, neither the Bank nor any of its respective affiliates or representatives undertakes any obligation to update or revise forward-looking statements, whether as a result of new information, future events or otherwise. Recipients of this
presentation should not place any reliance on the forward-looking statements and are advised to make their own independent analysis and determination with respect to the forecast periods. Furthermore, you should consult with your own legal, regulatory, tax, business,
investment, financial and accounting advisors to the extent that you deem it necessary, and make your own investments, hedging and trading decisions based upon your own judgement and advice from such advisers as you deem necessary and not upon any view
expressed in this material.
Certain data in this presentation has been rounded. As a result of such rounding, the totals of data presented in this presentation may vary slightly from the arithmetic totals of such data.
2

0
39
105
0
158
255
101
178
227
10
155
217
146
196
234
165
179
171
159
207
103
178
8
56
236
0
140
174
220
219
3
Agenda
Optimum Asset Overview
Warwick Finance Residential Mortgages Number 1 PLC (WFRM1) Review
Co-operative Bank
RMBS Investor Reporting & Contact Information
WMS Mortgage Servicing
WFRM1 Portfolio Overview
Appendix - Leek & RMAC RMBS Performance

0
39
105
0
158
255
101
178
227
10
155
217
146
196
234
165
179
171
159
207
103
178
8
56
236
0
140
174
220
219
Co-operative Bank
4
Operational resilience • Continuing focus on strengthening platform and processes
• Significant IT investment announced in January 2015
Non-core Business deleveraging • Deleveraging is ahead of plan enhancing capital resilience
• Bank completed its inaugural whole structure RMBS
securitisation (Warwick) in May 2015
Co-operative values and ethics • Embedding of Co-operative values
• New Ethical Policy launched in January 2015
Core Business rebuild started
• Asset origination improving
• Managed reduction in deposit levels to £28.4bn alongside
ongoing reduction in funding costs
• Brand re-launch and improved digital offering
Cost reduction • Programme on track - rationalisation of branch network,
simplification of product offering, efficiency improvements
Liquidity and capital
• Rebuilt CET1 ratio to 13.0% in order to execute plan
• WFRM1 pro forma impact would have increased YE 2014
CET1 capital position by approximately 0.9% to 13.9%
• Plan assumes additional non-CET1 capital of £400m
• Stable liquidity – liquid asset buffer reduced by £1.0bn to
£6.6bn from 30 June 2014
Key Highlights

0
39
105
0
158
255
101
178
227
10
155
217
146
196
234
165
179
171
159
207
103
178
8
56
236
0
140
174
220
219
Conduct • Planned conduct remediation activities to be substantially progressed in 2015
Continued progress in implementing the turnaround plan
5
KPIs
• Mortgage applications and completions above plan expectations during Q1 2015 with completions
totalling £0.5bn
• Redemptions at £0.5bn have trended downwards in Q1 2015 compared to H2 2014
• Current account portfolio remained broadly stable
Income • Net interest income slightly ahead of expectations due to pricing actions on retail deposits, lowering
funding costs
Costs • Cost reduction programme remains on track
• Project portfolio being managed to budget with ongoing prioritisation of project portfolio
Liquidity • Retail deposit pricing actions, notably in re-pricing Selected Access Saver products, led to managed
reductions in deposits thus lowering surplus liquidity
Co-operative Bank Q1 2015 Trading Update

0
39
105
0
158
255
101
178
227
10
155
217
146
196
234
165
179
171
159
207
103
178
8
56
236
0
140
174
220
219 2013 2014
31.4
28.4
2012 2013 2014 2014 proforma
5.1
7.2
13.0 1
13.9
2012 2013 2014
(652.4) (632.8) (264.2)
6
2012 2013 2014
17.9
15.1
12.6
Note: 2012 and 2013 figures have been restated, please see note 3 of the FY 2014 Annual
Accounts for details
2013 2014
8.9
15
2013 2014
43.4
37.6
1. WFRM1 transaction’s pro forma impact would have increased the Bank’s 31 December 2014
core equity tier one (“CET1”) capital position by approximately 0.9% to 13.9%
Common Equity Tier 1 (CET1) Ratio (%) Total Capital Ratio (Fully Loaded) (%) Total RWAs (£bn)
Statutory Profit (Loss) Before Tax (£m) Total Assets (£bn) Customer Deposits (£bn)
Co-operative Bank Financial Highlights

0
39
105
0
158
255
101
178
227
10
155
217
146
196
234
165
179
171
159
207
103
178
8
56
236
0
140
174
220
219
7
Note: Excludes Treasury / Other
Customer Deposits (£bn) Net Customer Loans6 (£bn)
Other Selected Balance Sheet Data Current Accounts (thousands)
Co-operative Bank Balance Sheet Highlights
Balance sheet has reduced during the year
5.1 3.5 2.6 2.8
28.0 27.9 27.2 25.6
H1 13 H2 13 H1 14 H2 14BACB Retail
31.4 29.8 28.4
33.1
19.1 18.1 16.6 15.7
13.8 12.5 11.5 10.3
H1 13 H2 13 H1 14 H2 14
Core Non-core
32.9 30.6
28.1 26.0
680 665 650 651
851 833 783 781
H1 13 H2 13 H1 14 H2 14
Prime Other
1,498 1,531 1,432 1,433 31/12/13 31/12/14 Change
Equity (£bn) 1.81 2.0 0.2
Loan-to-deposit ratio5 92% 85% (7)pp
NPL ratio2,4 11.4% 10.0% (1.4)pp
NPL coverage ratio3,4 32.1% 26.8% (5.3)pp
1 31-Dec-13 equity include Group's 2014 Contribution in full
2 Calculated as impaired customer balances (incl. watchlist) / gross customer balances
3 Calculated as allowance for losses (excluding losses for hedging risk) on customer balances /
impaired customer balances (including watchlist)
4 Defined as… loans Management reporting basis
5 LTD ratio calculated as net customer loans including fair value adjustments for hedged risk /customer
deposits.
6 Core Business numbers include Unity Trust Bank (UTB)

0
39
105
0
158
255
101
178
227
10
155
217
146
196
234
165
179
171
159
207
103
178
8
56
236
0
140
174
220
219
Faster deleveraging going forward enhancing capital resilience
Leverage brand strength and high
levels of customer satisfaction
Reduce overall
risk profile
Capital and resilience of its day-to-day
business, liquidity
Reduce risk-
weighted assets
Minimise impact
on capital
CORE BUSINESS
Simplify and focus
on retail & SME customers
Enhance returns
NON-CORE BUSINESS
Actively manage to achieve the most appropriate
value for each portfolio
or target for run down or exit
Taking into consideration liquidity
and capital requirements
To become an efficient and financially sustainable UK Retail and SME Bank that is distinguished by its
values and ethics
Act in accordance with Co-operative values and ethical principles
Doing the right thing by our customers
8
Can now move towards building profitability in the longer term
Co-operative Bank Overarching Strategy Remains The Same

0
39
105
0
158
255
101
178
227
10
155
217
146
196
234
165
179
171
159
207
103
178
8
56
236
0
140
174
220
219
9
Agenda
Optimum Asset Overview
Warwick Finance Residential Mortgages Number 1 PLC (WFRM1) Review
Co-operative Bank
RMBS Investor Reporting & Contact Information
WMS Mortgage Servicing
WFRM1 Portfolio Overview
Appendix - Leek & RMAC RMBS Performance

0
39
105
0
158
255
101
178
227
10
155
217
146
196
234
165
179
171
159
207
103
178
8
56
236
0
140
174
220
219
A4 FORMAT
Please don’t
change page set
up to A3, print to
A3 paper and fit
to scale
31
45
96
3
153
205
138
194
64
249
185
28
201
181
125
204
235
245
The Co-operative Bank plc’s (“The Bank’s”) first whole structure securitisation of non-conforming UK mortgages, structured to achieve SRT and de-consolidation,
assisting the Bank in managing its risk weighted assets by reducing its non-core Optimum portfolio
BofAML was Sole Arranger & Joint Lead Manager across all tranches. Morgan Stanley and Citibank were appointed Joint Lead Managers for the Investment
Grade tranches.
WFRM 1 is backed by a pool of mortgages from the “Optimum” residential mortgage portfolio originated by Platform Funding Limited (“PFL”) and GMAC-RFC
Limited (“GMAC”)
Given 100% of the pool are floating rate mortgages, the transaction did not require a swap agreement
New Issue April 28, 2015
£1,500,000,000
Warwick Finance Residential
Mortgages Number 1
Class A Notes: £1,088,000,000
Class B Notes: £180,090,000
Class C Notes: £52,480,000
Class D Notes: £30,000,000
Class E Notes: £40,530,000
Class F Notes: £46,550,000
Structuring Bookrunner
The inaugural issuance, WFRM1, generated significant investor demand and represented a
market first as the largest fully marketed placement of U.K. Non-Conforming RMBS paper
post-crisis
The deal was upsized to a final issuance of £1.5BN from £1.2BN originally, with Co-op
retaining 65% of Class A, which was less than the 70% originally envisaged
The books were received strong investor interest with Classes A to C oversubscribed
by 1.1 to 1.4x, and Classes D to F well oversubscribed at 4.1 – 5.5x
WFRM1 Class B tranche is the largest mezzanine double-A rated public placement
across all asset classes in either Sterling or Euro post-crisis
The transaction represented the largest UK non-conforming deal ever securitised in
Sterling RegS format
The transaction priced on Tuesday, April 28th, and attracted 27 unique investors
All tranches priced in line or tighter than Initial Price Thoughts
Transaction Highlights
U.K. non-conforming RMBS Product Issuance: Transaction Highlights
Warwick Finance Residential Mortgages Number 1 Plc (WFRM1)
10

0
39
105
0
158
255
101
178
227
10
155
217
146
196
234
165
179
171
159
207
103
178
8
56
236
0
140
174
220
219
A4 FORMAT
Please don’t
change page set
up to A3, print to
A3 paper and fit
to scale
31
45
96
3
153
205
138
194
64
249
185
28
201
181
125
204
235
245 Optimum Portfolio
Following the merger between Britannia Building Society (“Britannia”) and The Bank (in
August 2009), the Optimum Portfolio was established to focus on the management of pre-
2009 Platform intermediary lending and purchased mortgage books including GMAC
originated assets
Capital Structure
Transaction Overview
Key Structural Features
Class A to F Notes were listed with the UKLA and issued under Reg S format
The expected maturity date is on the step-up date, June 2020, after which, if the Portfolio
Option is not exercised, the margins on the Class A to F Notes will increase
General Reserve Fund of 2% funded upfront
The first interest payment date is 21 September 2015
Class Expected Rating
(M/S)(sf)
CCY Size % of Total(1) Credit
Enhancement(2)
WAL
(yrs)(3) Coupon (bps)
Step-up Coupon
(bps) Issue Price
Final Spread
(bps)
A (Placed) Aaa / AAA GBP 380,800,000 72.50% 29.50% 3.81 3M £L + 100 3m £L + 150 99.10% 3M £L + 125
A (Retained) Aaa / AAA GBP 707,200,000 72.50% 29.50% 3.81 3M £L + 100 3m £L + 150 99.10% 3M £L + 125
B Aa2 / AA GBP 180,090,000 12.00% 17.50% 5.14 3M £L + 120 3m £L + 190 96.93% 3M £L + 185
C A2/ A+ GBP 52,480,000 3.50% 14.00% 5.14 3M £L + 150 3m £L + 225 96.95% 3M £L + 215
D Baa2 / A GBP 30,000,000 2.00% 12.00% 5.14 3M £L + 180 3m £L + 270 96.06% 3M £L + 265
E Ba2 / BBB GBP 40,530,000 2.70% 9.30% 5.14 3M £L + 220 3m £L + 370 93.45% 3M £L + 365
F B3 / BB GBP 46,550,000 3.10% 6.20% 5.14 3M £L + 270 3m £L + 455 93.10% 3M £L + 425
Principal Residual
Certificates N/A GBP 62,995,004 4.20% N/A N/A N/A
Revenue Residual
Certificates N/A GBP N/A N/A N/A N/A N/A
General Reserve
Fund
GBP
29,874,206
2%
Total: 1,500,645,004
(1) Total being Current Balance and Borrower Overpayments
(2) Credit Enhancement includes subordination of the Notes and the Principal Residual Certificates, the availability of the General Reserve Fund (subject to certain Cumulative Default Triggers), excess Available Revenue Receipts and the Overpayment
Ledger
(3) WALs assumes 6% CPR, no defaults or delinquencies and the Portfolio Option is exercised on the step-up date
Warwick Finance Residential Mortgages Number 1 Plc (WFRM1) U.K. non-conforming RMBS Product Issuance: Capital Structure
11

0
39
105
0
158
255
101
178
227
10
155
217
146
196
234
165
179
171
159
207
103
178
8
56
236
0
140
174
220
219
A4 FORMAT
Please don’t
change page set
up to A3, print to
A3 paper and fit
to scale
31
45
96
3
153
205
138
194
64
249
185
28
201
181
125
204
235
245
Warwick Finance Residential Mortgages Number 1 Plc (WFRM1) U.K. non-conforming RMBS Product Issuance: Timeline & Book Building
Significant investor interest allowed WFRM1 to price at the tight end of the IPTs across all tranches
Investor strengthened from IPT through to pricing reflected in the overall structure being 1.8x oversubscribed
Announcement Initial Price Thoughts Guidance Launch &
Price
2:00pm
Monday,
13th April
4:30pm
Monday,
20th April
Sub
scrip
tion
Leve
l
.0x
1.0x
3.0x
IPTs
Size & spread:
A: £[872.6]m + [125a] bps
B: £[144.4]m + [185a] bps
C: £[42.1]m + [215a] bps
D: £[24.1]m + [265a] bps
E: £[32.5]m + [mid-high 300] bps
F: £[37.3]m + [mid-400s] bps
PRC £ [ ]m
RRC: £ [ ]m Mandate
Announced
Roadshow for 3 days:
Wed 15th –
Fri 17th April
5.30pm
Tuesday
28th April
3:30pm
Thursday,
23rd April
Formal Guidance
Size & spread: A: £[872.6]m + [125] bps
B: £[144.4]m + [185] bps
C: £[42.1]m + [215] bps
D: £[24.1]m + [265] bps
E: £[32.5]m + [365] bps
F: £[37.3]m + [425-450] bps
PRC £ [ ]m
RRC: £ [ ]m
2.0x
4.0x
5.0x
6.0x
1.8x
6.2x 6.0x
Launch and Price
Size & spread:
A: £1088m + 125 bps
B: £180.09m + 185 bps
C: £52.48m + 215 bps
D: £30m + 265 bps
E: £40.53m + 365 bps
F: £46.55m + 425 bps
PRC £ [ ]m
RRC: £ [ ]m
E
A
B C
D
Note Subscription Level
1.2x 1.4x
5.0x
5.5x
F
1.3x
1.7x
5.2x
Capital
Structure
Announced
Size & spread: A: £[]m + [ ] bps
B: £[]m + [ ] bps
C: £[]m + [ ] bps
D: £[]m + [ ] bps
E: £[]m + [ ] bps
F: £[]m + [ ] bps
9:30am
Wednesday,
15th April
Deal upsized
announcement:
Mon, 27 April
1.1x
4.1x
Timeline & Book Building Chronology
12
0
39
105
0
158
255
101
178
227
10
155
217
146
196
234
165
179
171
159
207
103
178
8
56
236
0
140
174
220
219
A4 FORMAT
Please don’t
change page set
up to A3, print to
A3 paper and fit
to scale
31
45
96
3
153
205
138
194
64
249
185
28
201
181
125
204
235
245
Class A
Class B
Class C
Class D
Class E
Class F
Issuer
(Orphan SPV)
HML
(Back-up
Servicer)
SFM
(Back-Up Servicer
Facilitator and Back-up
Cash Manager
Facilitator)
Issuance
Back-up
Servicing
Agreement
Servicing
Agreement
PFL
(Seller)
MAS4
(Seller)
MAS5
(Seller)
Originators
Sale of Beneficial
Interest in Portfolio
Borrowers
NatWest
(Collection Account
Bank)
Citibank and BNP
Paribas
(Account Banks)
U.S. Bank
Trustees Limited
(Security Trustee)
Citibank N.A.,
London Branch
(Cash Manager)
Mortgage
Payments Cash
Transfer
Cash Management
Agreement
Deed of Charge
U.S. Bank
Trustees Limited
(Note Trustee)
Note Trust
Deed
WMS
(Servicer)
Purchase Price =
Cash + Residual
Certificates
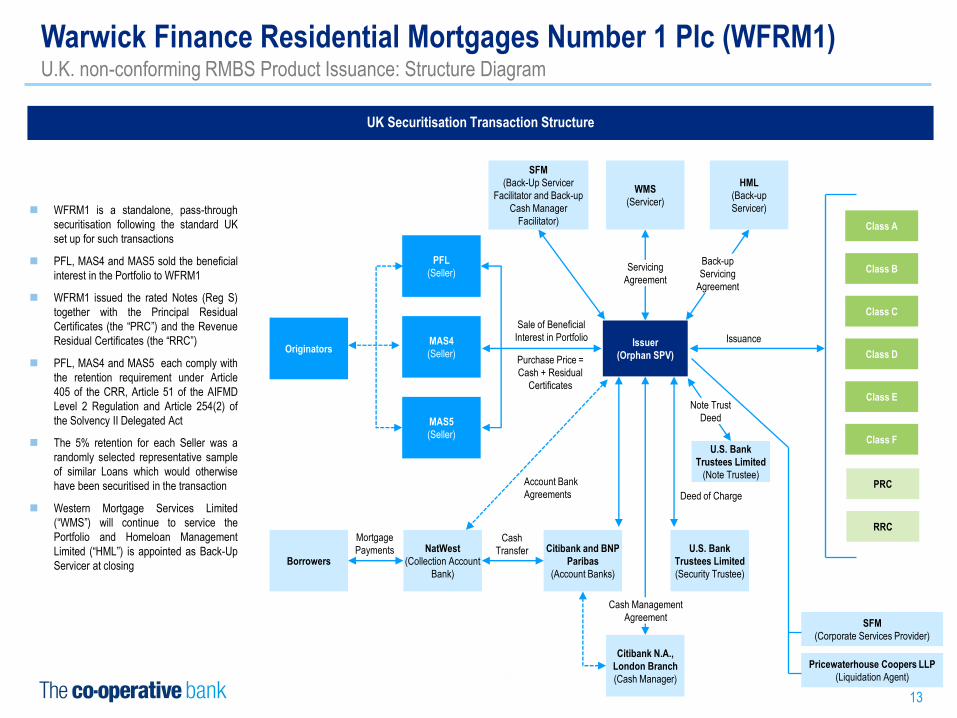
UK Securitisation Transaction Structure
WFRM1 is a standalone, pass-through
securitisation following the standard UK
set up for such transactions
PFL, MAS4 and MAS5 sold the beneficial
interest in the Portfolio to WFRM1
WFRM1 issued the rated Notes (Reg S)
together with the Principal Residual
Certificates (the “PRC”) and the Revenue
Residual Certificates (the “RRC”)
PFL, MAS4 and MAS5 each comply with
the retention requirement under Article
405 of the CRR, Article 51 of the AIFMD
Level 2 Regulation and Article 254(2) of
the Solvency II Delegated Act
The 5% retention for each Seller was a
randomly selected representative sample
of similar Loans which would otherwise
have been securitised in the transaction
Western Mortgage Services Limited
(“WMS”) will continue to service the
Portfolio and Homeloan Management
Limited (“HML”) is appointed as Back-Up
Servicer at closing
PRC
RRC
Pricewaterhouse Coopers LLP
(Liquidation Agent)
SFM
(Corporate Services Provider)
Account Bank
Agreements
Warwick Finance Residential Mortgages Number 1 Plc (WFRM1) U.K. non-conforming RMBS Product Issuance: Structure Diagram
13

0
39
105
0
158
255
101
178
227
10
155
217
146
196
234
165
179
171
159
207
103
178
8
56
236
0
140
174
220
219
14
Agenda
Optimum Asset Overview
Warwick Finance Residential Mortgages Number 1 PLC (WFRM1) Review
Co-operative Bank
RMBS Investor Reporting & Contact Information
WMS Mortgage Servicing
WFRM1 Portfolio Overview
Appendix - Leek & RMAC RMBS Performance

0
39
105
0
158
255
101
178
227
10
155
217
146
196
234
165
179
171
159
207
103
178
8
56
236
0
140
174
220
219
A4 FORMAT
Please don’t
change page set
up to A3, print to
A3 paper and fit
to scale
31
45
96
3
153
205
138
194
64
249
185
28
201
181
125
204
235
245
£2.5bn
£1.6bn (2) WFRM1
WFRM1 Provisional Pool Selection
£2.4bn
£7.3bn
£6.5bn
£3.9bn
Co-op Bank Mortgage Portfolio (£bn)
Optimum
Portfolio
(32%)
Platform Funding(1)
(12%)
Britannia(1)
(37%)
Co-op Bank(1)
(19%)
£0.4bn
£1.7bn
£4.3bn
Unencumbered
(67%)
Cambric 1
(7%)
Leek 17-19,22
(27%)
Optimum Portfolio (£bn) Optimum Unencumbered (£bn)
Residual
(59%)
£1.8bn Provisional
WFRM1 Pool
(41%)
Step 1 Step 2 Step 3
Note: figures may not sum to totals due to rounding
(1) Core Bank residential mortgage assets
(2) £1.6bn Deal Size includes the 5% retained by the Sellers
WFRM1 Portfolio Overview U.K. non-conforming RMBS – Provisional Pool
15

0
39
105
0
158
255
101
178
227
10
155
217
146
196
234
165
179
171
159
207
103
178
8
56
236
0
140
174
220
219
A4 FORMAT
Please don’t
change page set
up to A3, print to
A3 paper and fit
to scale
31
45
96
3
153
205
138
194
64
249
185
28
201
181
125
204
235
245
Provisional Pool Key Characteristics
PFL GMAC Total:
Cut-off Date 31/12/2014 31/12/2014 31/12/2014
Balance (£) 992,199,906 795,588,135 1,787,788,041
Number of Loans 9,455 6,388 15,843
Number of Loan Parts 9,862 6,573 16,435
Average Loan Balance (£) 104,939 124,544 112,844
WA OLTV (%) 77.33 84.48 80.51
WA Indexed CLTV (%)1 70.18 79.18 74.19
WAC (%) 2.73 3.95 3.27
WA Seasoning (Years) 8.33 8.12 8.24
WA Time to Reset (Months) 0 0 0
WA Remaining Term (Years) 14.33 14.32 14.32
3M LIBOR Index (%) 42.92 24.82 34.87
BBR Index (%) 57.01 35.96 47.64
SVR Index (%) 0.07 39.22 17.49
BTL (%) 26.44 21.79 24.37
IO (%) 70.27 80.78 74.95
CCJs (%) 6.02 9.06 7.37
Bankruptcy or IVA (%) 1.99 2.16 2.07
Self Certified (%) 50.82 41.9 46.85
Current Loans (%) 82.42 91.46 86.44
30-60 Days in Arrears (%) 6.53 4.06 5.43
60-90 Days in Arrears (%) 3.08 1.62 2.43
90+ Days in Arrears (%) 7.97 2.86 5.70
WFRM1 Portfolio Overview U.K. non-conforming RMBS – Provisional Pool
16
0
39
105
0
158
255
101
178
227
10
155
217
146
196
234
165
179
171
159
207
103
178
8
56
236
0
140
174
220
219
A4 FORMAT
Please don’t
change page set
up to A3, print to
A3 paper and fit
to scale
31
45
96
3
153
205
138
194
64
249
185
28
201
181
125
204
235
245
Comparison of WFRM1 with Market Comparables
WFRM1 Celeste(1) RMS 28(2) Slate No.2(1)
Thrones
2014-1(1)
Moorgate
2014-1(1)
Rochester Financing
No.1(2)
Closing May-15 Mar-15 Mar-15 Oct-14 Jul-14 Apr-14 Oct-13
Collateral Balance (GBP) 1,787,788,041 254,567,336 513,292,458 408,257,444 311,042,283 510,045,026 376,216,372
Avg CBAL (GBP) 112,844 177,895 120,237 120,867 146,995 133,765 109,017
WA OLTV (%) 80.51 83.20 76.89 81.67 84.68 81.46 76.20
WA CLTV (%) 76.88 83.10 75.17 81.67 82.43 79.34 75.00
WA Indexed CLTV (%) 74.19 79.60 75.29 66.39 78.26 89.60 77.04
WA Seasoning (months) 98.88 86.51 76.00 91.32 81.24 83.04 54.80
CCJs (%) 7.37 1.09 24.59 13.28 10.30 8.03 30.80
BO/IVA (%) 2.07 0.00 0.84 7.20 1.95 2.93 6.50
90+ Arrears (%) 5.70 0.38 0.58 0.00 0.50 3.21 0.00
Self Certified (%) 46.85 2.75 61.08 0.00 46.93 56.43 39.82
Buy to Let (%) 24.37 94.66 13.62 1.00 26.27 35.91 5.10
Interest Only (%) 74.95 98.95 70.29 60.23 86.20 83.58 59.60
WAC (%) 3.27 2.67 4.83 3.85 3.10 2.95 3.67
AAA’s
CE% 29.50 37.15 30.00 20.00 41.00 34.65 37.50
OWAL 3.81 3.69 3.78 5.40 4.33 3.87 3.40
Spread 3m£L + 125 3m£L +115 3m£L +115 3m£L +110 3m£L +105 1m£L +105 3m£L +145
(1) Source: Transaction Prospectus
(2) Source: Rating Agency Pre-sale and New Issue Reports
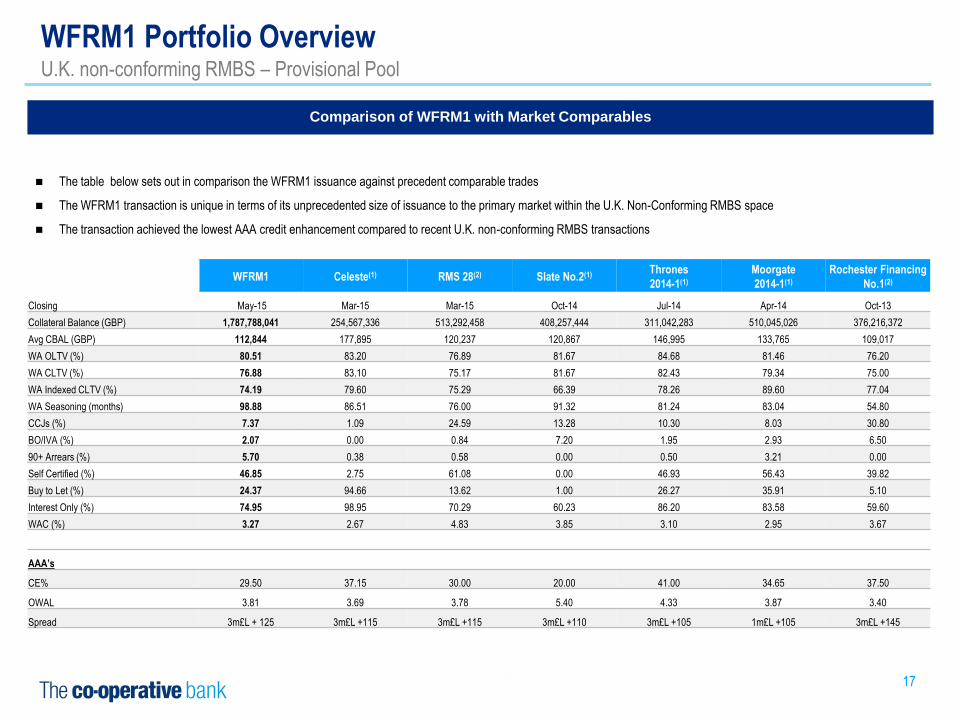
The table below sets out in comparison the WFRM1 issuance against precedent comparable trades
The WFRM1 transaction is unique in terms of its unprecedented size of issuance to the primary market within the U.K. Non-Conforming RMBS space
The transaction achieved the lowest AAA credit enhancement compared to recent U.K. non-conforming RMBS transactions
WFRM1 Portfolio Overview U.K. non-conforming RMBS – Provisional Pool
17

0
39
105
0
158
255
101
178
227
10
155
217
146
196
234
165
179
171
159
207
103
178
8
56
236
0
140
174
220
219
18
Agenda
Optimum Asset Overview
Warwick Finance Residential Mortgages Number 1 PLC (WFRM1) Review
Co-operative Bank
RMBS Investor Reporting & Contact Information
WMS Mortgage Servicing
WFRM1 Portfolio Overview
Appendix - Leek & RMAC RMBS Performance

0
39
105
0
158
255
101
178
227
10
155
217
146
196
234
165
179
171
159
207
103
178
8
56
236
0
140
174
220
219
A4 FORMAT
Please don’t
change page set
up to A3, print to
A3 paper and fit
to scale
31
45
96
3
153
205
138
194
64
249
185
28
201
181
125
204
235
245
Optimum Overview and Strategy
Following WFRM1, the Non-Core Optimum Portfolio on a pro-forma basis is a £5.0bn* legacy residential mortgage book comprised of BTL and owner occupied
loans originated by PFL, or acquired from 3rd parties pre 2009. Optimum will be substantially disposed of by 2018 through a series of transactions
Gross Customer Balances (£bn)
2.1 2.0 2.0 1.9
2.6 2.5 2.4 2.3
0.7 0.6 0.6 0.6
1.9 1.9 1.8 1.7
30-Jun-13 31-Dec-13 30-Jun-14 31-Dec-14
Buy to let Non-conforming Prime Self-cert
7.0 6.5 6.8
7.3
Bank of England Stress Tests
The Optimum Portfolio was particularly vulnerable to the Bank of England
hypothetical severe stress tests in 2014 and consumes significant capital
The Bank remains committed to the continued de-leverage of it’s Optimum Portfolio
Optimum Asset Overview Summary Overview
Portfolio Overview
Predominantly interest-only loans – 79.7%
Average indexed LTV – 73.1%
90+ days past due and default balance has reduced from £579.9m
(8.3% of total customer balances) in 2013 to £473.2m (7.3%) in 2014
Strategy
In the revised plan submitted to and accepted by the PRA, the overarching
strategy of the Bank remains the same, however the Bank has committed
to an earlier deleverage of the Optimum Portfolio
Following the successful securitisation of WFRM1, the Bank will continue
to execute a series of transactions to substantially dispose of Optimum by
the end of 2018
Pro-forma Optimum Position Following the Securitisation of WFRM1
(£bn)*
£0.4m
£0.4m
£1.4m £2.7m
Cambric 1^
Leek 17-19 Unencumbered
Leek 22^
* Figures may not sum to total due to rounding
^ Cambric and Leek 22 RMBS transactions fully retained by the Bank
19

0
39
105
0
158
255
101
178
227
10
155
217
146
196
234
165
179
171
159
207
103
178
8
56
236
0
140
174
220
219
A4 FORMAT
Please don’t
change page set
up to A3, print to
A3 paper and fit
to scale
31
45
96
3
153
205
138
194
64
249
185
28
201
181
125
204
235
245
0.0%
5.0%
10.0%
15.0%
20.0%
25.0%
30.0%
35.0%
40.0%
Jan-08 Jul-08 Jan-09 Jul-09 Jan-10 Jul-10 Jan-11 Jul-11 Jan-12 Jul-12 Jan-13 Jul-13 Jan-14 Jul-14 Jan-15
Optimum Portfolio - Loss Severity
0
2
4
6
8
10
12
0%
2%
4%
6%
8%
10%
12%
14%
16%
18%
20%
Jan-08 Jul-08 Jan-09 Jul-09 Jan-10 Jul-10 Jan-11 Jul-11 Jan-12 Jul-12 Jan-13 Jul-13 Jan-14 Jul-14 Jan-15
90+ Days Balance Outstanding
Optimum Portfolio - Loss Severity
Optimum Portfolio – Outstanding Balance and 90+ Days Arrears
% Arrears of
Total
Outstanding
Balance
Total Balance
Outstanding
(£ Billion)
Optimum Asset Overview Historical Portfolio Performance
Optimum Portfolio – Monthly Default Rate (Annualised)
0.0%
1.0%
2.0%
3.0%
4.0%
5.0%
6.0%
7.0%
8.0%
9.0%
10.0%
Jan-08 Jul-08 Jan-09 Jul-09 Jan-10 Jul-10 Jan-11 Jul-11 Jan-12 Jul-12 Jan-13 Jul-13 Jan-14 Jul-14 Jan-15
Optimum Portfolio - Monthly Default Rate (Annualised)
Optimum Portfolio – Historical Annualised Principal (scheduled & unscheduled) Payment Rate
0.0%
1.0%
2.0%
3.0%
4.0%
5.0%
6.0%
7.0%
8.0%
9.0%
10.0%
Feb-10 May-10 Aug-10 Nov-10 Feb-11 May-11 Aug-11 Nov-11 Feb-12 May-12 Aug-12 Nov-12 Feb-13 May-13 Aug-13 Nov-13 Feb-14 May-14 Aug-14 Nov-14 Feb-15
Optimum Portfolio - Historical Annualised PPR Data From 2010
20

0
39
105
0
158
255
101
178
227
10
155
217
146
196
234
165
179
171
159
207
103
178
8
56
236
0
140
174
220
219
21
Agenda
Optimum Asset Overview
Warwick Finance Residential Mortgages Number 1 PLC (WFRM1) Review
Co-operative Bank
RMBS Investor Reporting & Contact Information
WMS Mortgage Servicing
WFRM1 Portfolio Overview
Appendix - Leek & RMAC RMBS Performance
0
39
105
0
158
255
101
178
227
10
155
217
146
196
234
165
179
171
159
207
103
178
8
56
236
0
140
174
220
219
A4 FORMAT
Please don’t
change page set
up to A3, print to
A3 paper and fit
to scale
31
45
96
3
153
205
138
194
64
249
185
28
201
181
125
204
235
245
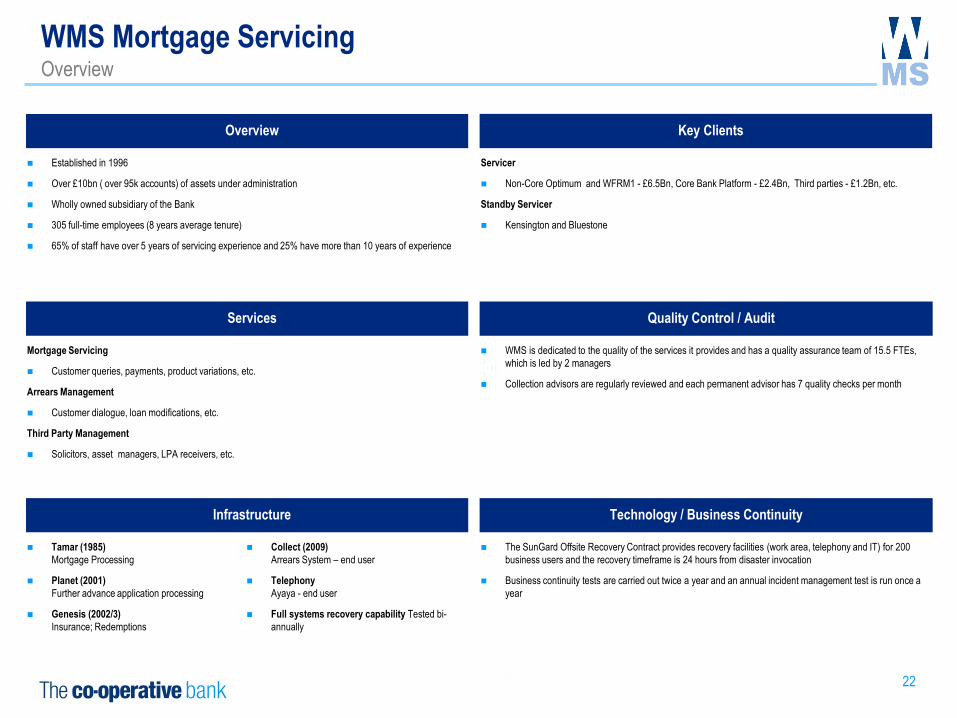
Overview
Established in 1996
Over £10bn ( over 95k accounts) of assets under administration
Wholly owned subsidiary of the Bank
305 full-time employees (8 years average tenure)
65% of staff have over 5 years of servicing experience and 25% have more than 10 years of experience
Key Clients
Servicer
Non-Core Optimum and WFRM1 - £6.5Bn, Core Bank Platform - £2.4Bn, Third parties - £1.2Bn, etc.
Standby Servicer
Kensington and Bluestone
Services
Mortgage Servicing
Customer queries, payments, product variations, etc.
Arrears Management
Customer dialogue, loan modifications, etc.
Third Party Management
Solicitors, asset managers, LPA receivers, etc.
Quality Control / Audit
WMS is dedicated to the quality of the services it provides and has a quality assurance team of 15.5 FTEs,
which is led by 2 managers
Collection advisors are regularly reviewed and each permanent advisor has 7 quality checks per month
Infrastructure
Tamar (1985)
Mortgage Processing
Planet (2001)
Further advance application processing
Genesis (2002/3)
Insurance; Redemptions
Collect (2009)
Arrears System – end user
Telephony
Ayaya - end user
Full systems recovery capability Tested bi-
annually
Technology / Business Continuity
The SunGard Offsite Recovery Contract provides recovery facilities (work area, telephony and IT) for 200
business users and the recovery timeframe is 24 hours from disaster invocation
Business continuity tests are carried out twice a year and an annual incident management test is run once a
year
WMS Mortgage Servicing Overview
22

0
39
105
0
158
255
101
178
227
10
155
217
146
196
234
165
179
171
159
207
103
178
8
56
236
0
140
174
220
219
A4 FORMAT
Please don’t
change page set
up to A3, print to
A3 paper and fit
to scale
31
45
96
3
153
205
138
194
64
249
185
28
201
181
125
204
235
245
Capita
As announced in November 2014, the Bank intends to outsource its mortgage servicing operations and to sell its mortgage servicing subsidiary, WMS, to a third
party mortgage servicer
The Bank has selected Capita plc (“Capita”) as its preferred bidder to undertake the Bank’s mortgage servicing operations
The agreed heads of terms envisage that Capita will acquire WMS.
The Bank will continue to determine and set the servicing policies and underwriting applicable to all mortgage loans to which its subsidiaries hold legal title- including
arrears, default and enforcement procedures
WMS Mortgage Servicing Capita Overview
23

0
39
105
0
158
255
101
178
227
10
155
217
146
196
234
165
179
171
159
207
103
178
8
56
236
0
140
174
220
219
A4 FORMAT
Please don’t
change page set
up to A3, print to
A3 paper and fit
to scale
31
45
96
3
153
205
138
194
64
249
185
28
201
181
125
204
235
245
2014(1)
Optimum Loans Subject to
Forbearance (£ MM) % Optimum Book (£6.5Bn)
Concessions 16.7 0.26%
Arrangements 169.6 2.63%
Term Extensions 7.5 0.12%
Assisted Voluntary Sale 1.2 0.02%
Interest Only Switches 5.0 0.08%
Capitalisations 0.2 0.00%
200.2 3.10%
2013 (Restated) (1)
Optimum Loans Subject to Forbearance
(£ MM) % Optimum Book (£7.0Bn)
Concessions 30.5 0.43%
Arrangements 286.1 4.08%
Term Extensions 19.9 0.28%
Assisted Voluntary Sale – –
Interest Only Switches 10.1 0.14%
Capitalisations 0.4 0.01%
347.0 4.95%
Loan modification techniques include:
Term Extensions
The maturity of the loan is extended to reduce the monthly payment
Assisted Voluntary Sale (AVS)
Unlike a repossession, the borrower can live in the property until it is sold
Concessions
The borrower us allowed to make reduced payments on a temporary basis to assist
with a short term financial hardship
Arrangements
The borrower repays the outstanding arrears over a period of time by making
payments above the contractual amount
Arrears Capitalisation (Infrequent)
Outstanding arrears are added to the capital value of the loan to be repaid over the
remaining term
Following customer dialogue, the selected modification avenue, if suitable, is employed on a
case by case basis by an individually assigned and experienced collector following an
extensive review process
Product Switches are no longer permitted under the Sellers' lending criteria for the Optimum
portfolio. For the avoidance of doubt, the following variations will not be considered Product
Switches. Variations -
(a) agreed with a Borrower to control or manage arrears on the Loan
(b) from interest-only to repayment or part-repayment to control or manage repayment of capital
shortfalls
(c) in the maturity date of the Loan unless the maturity date would be extended to a date later
than three years before the Final Maturity Date of the Notes
Loan Modifications Forbearance Details
(1) Source: Annual Report and Accounts 2014 (page105)
WMS Mortgage Servicing Loan Modifications
24

0
39
105
0
158
255
101
178
227
10
155
217
146
196
234
165
179
171
159
207
103
178
8
56
236
0
140
174
220
219
25
Agenda
Optimum Asset Overview
Warwick Finance Residential Mortgages Number 1 PLC (WFRM1) Review
Co-operative Bank
WMS Mortgage Servicing
WFRM1 Portfolio Overview
Appendix - Leek & RMAC RMBS Performance
RMBS Investor Reporting & Contact Information
0
39
105
0
158
255
101
178
227
10
155
217
146
196
234
165
179
171
159
207
103
178
8
56
236
0
140
174
220
219
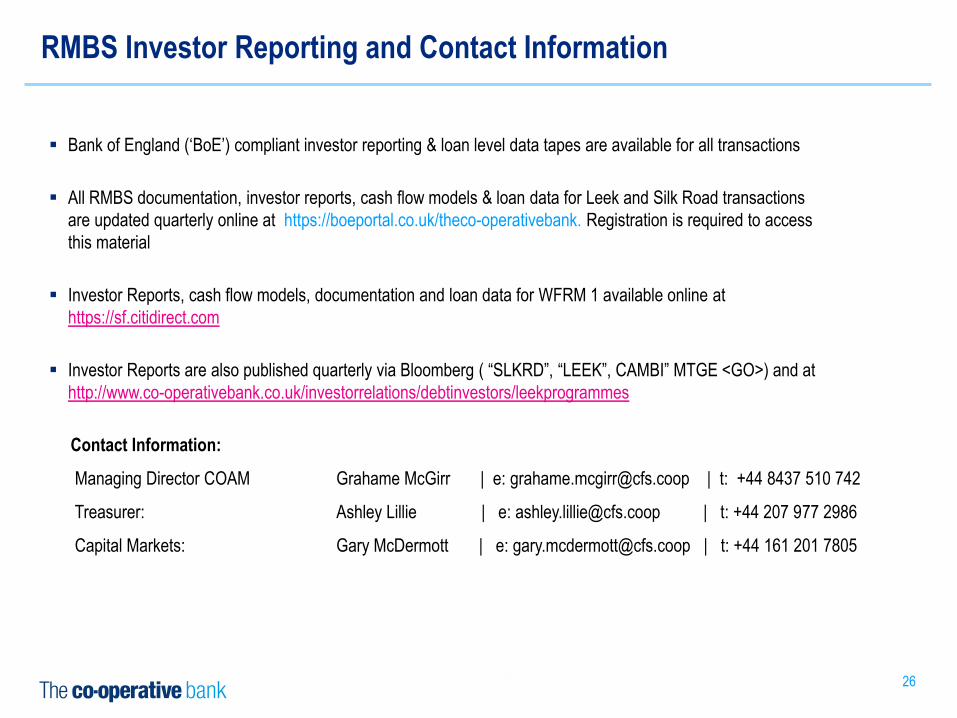
Bank of England (‘BoE’) compliant investor reporting & loan level data tapes are available for all transactions
All RMBS documentation, investor reports, cash flow models & loan data for Leek and Silk Road transactions
are updated quarterly online at https://boeportal.co.uk/theco-operativebank. Registration is required to access
this material
Investor Reports, cash flow models, documentation and loan data for WFRM 1 available online at
https://sf.citidirect.com
Investor Reports are also published quarterly via Bloomberg ( “SLKRD”, “LEEK”, CAMBI” MTGE <GO>) and at
http://www.co-operativebank.co.uk/investorrelations/debtinvestors/leekprogrammes
26
Contact Information:
Managing Director COAM Grahame McGirr | e: [email protected] | t: +44 8437 510 742
Treasurer: Ashley Lillie | e: [email protected] | t: +44 207 977 2986
Capital Markets: Gary McDermott | e: [email protected] | t: +44 161 201 7805
RMBS Investor Reporting and Contact Information
26

0
39
105
0
158
255
101
178
227
10
155
217
146
196
234
165
179
171
159
207
103
178
8
56
236
0
140
174
220
219
27
Agenda
Optimum Asset Overview
Warwick Finance Residential Mortgages Number 1 PLC (WFRM1) Review
Co-operative Bank
WMS Mortgage Servicing
WFRM1 Portfolio Overview
Appendix - Leek & RMAC RMBS Performance
RMBS Investor Reporting & Contact Information

0
39
105
0
158
255
101
178
227
10
155
217
146
196
234
165
179
171
159
207
103
178
8
56
236
0
140
174
220
219
A4 FORMAT
Please don’t
change page set
up to A3, print to
A3 paper and fit
to scale
31
45
96
3
153
205
138
194
64
249
185
28
201
181
125
204
235
245
UK Non-Conforming RMBS 90+ Days Delinquency - Trend by Series UK Non-Conforming RMBS Cum Repossessions - Trend by Series
Source: Moody’s Investors Service, periodic investor/servicer reports
UK Non-Conforming RMBS OS Repossessions - Trend by Series UK Non-Conforming RMBS Cum Losses - Trend by Series
-
0.50
1.00
1.50
2.00
2.50
3.00
Cu
mu
lati
ve L
oss
es
[% o
f O
B]
Chart 14: UK Non-Conforming RMBS Cum Losses - Trend by series
Leek RMAC Index
-
5.00
10.00
15.00
20.00
25.00
De
linq
ue
ncy
90
+ [%
of
CB
]
-
2.00
4.00
6.00
8.00
10.00
12.00
Re
po
sse
ssio
ns
(C
um
) [%
of
OB
]
-
0.50
1.00
1.50
2.00
2.50
3.00
3.50
4.00
O/S
Re
po
sse
ssio
ns
[% o
f C
B]
-
0.50
1.00
1.50
2.00
2.50
3.00
Cu
mu
lati
ve L
oss
es
[% o
f O
B]
Leek & RMAC RMBS Performance
28

0
39
105
0
158
255
101
178
227
10
155
217
146
196
234
165
179
171
159
207
103
178
8
56
236
0
140
174
220
219
A4 FORMAT
Please don’t
change page set
up to A3, print to
A3 paper and fit
to scale
31
45
96
3
153
205
138
194
64
249
185
28
201
181
125
204
235
245
UK Non-Conforming RMBS Loss Severities - Trend by Series UK Non-Conforming RMBS CPR - Trend by Series
Source: Moody’s Investors Service, periodic investor/servicer reports
UK Non-Conforming RMBS 3M CDR - Trend by Series UK Non-Conforming RMBS Total Redemption Rate - Trend by Series
-
0.50
1.00
1.50
2.00
2.50
3.00
Cu
mu
lati
ve L
oss
es
[% o
f O
B]
Chart 14: UK Non-Conforming RMBS Cum Losses - Trend by series
Leek RMAC Index
-
5.00
10.00
15.00
20.00
25.00
30.00
35.00
40.00
45.00
Loss
Se
veri
ty [
%]
-
1.00
2.00
3.00
4.00
5.00
6.00
7.00
CD
R 3
Mth
[%
]
-
5.00
10.00
15.00
20.00
25.00
30.00
35.00
40.00
45.00
CP
R [
%]
-
10.00
20.00
30.00
40.00
50.00
60.00
TRR
[%
]
Leek & RMAC RMBS Performance
29
Related Documents