THE CO-EVOLUTION OF THE NITROGEN, CARBON AND OXYGEN CYCLES IN THE PROTEROZOIC OCEAN KATJA FENNEL*, MICK FOLLOWS**, PAUL G. FALKOWSKI* ABSTRACT. Geochemical evidence suggests that there was a delay of several hundred million years between the evolution of oxygenic photosynthesis and the accumulation of oxygen in Earth’s atmosphere. The deep ocean appears to have remained euxenic for several hundred million years after the atmosphere became oxygenated. In this paper we examine the possibility that the extraordinary delay in the oxidation of the atmosphere and oceans was caused by a biogeochemical “bottleneck” imposed by metabolic feedbacks between carbon burial, net oxygen production, and the evolution of the nitrogen cycle in the Proterozoic oceans. Whereas under anoxic conditions oceanic ammonium would have been relatively stable, as oxygen concentra- tions rose, nitrification and subsequent denitrification would have rapidly removed fixed inorganic nitrogen from the oceans. Denitrification would have imposed a strong constraint on the further rise of free oxygen by depriving oxygenic photoautotrophs of an essential nutrient (that is, fixed inorganic nitrogen). To examine the dynamic interactions between oxygen and nitrogen cycling, we developed a five box model that incorporates the salient features of the oxygen, nitrogen and carbon cycles, ocean circulation, and ocean-atmosphere gas-exchange. Model simulations, initiated under anaerobic conditions with no free oxygen in the atmosphere or ocean, are character- ized by an initially reduced deep ocean with abundant ammonium, followed by an extended period when neither form of fixed nitrogen is stable, and a fully oxidized phase with abundant nitrate. We infer that, in the process of oxidizing the early Proterozoic ocean, the system had to go through a nitrogen-limited phase during which time export production was severely attenuated. Our studies suggest that the presence of shallow seas with increased organic matter burial was a critical factor determining the concentration of oxygen in the ocean and atmosphere, while the phosphate concentration played a key role in determining the rate of oxygenation of the deep ocean. introduction The evolution of oxygenic photosynthesis in the late Archean or early Proterozoic eon ultimately led to the rise of oxygen in Earth’s atmosphere and ocean. However, there appears to have been an extraordinary delay of several hundred million years between the rise of oxygenic photosynthesis (before 2700 Ma; Summons and others, 1999; Brocks and others, 1999) and the accumulation of oxygen in the atmosphere (not until 2300 Ma; Farquhar and others, 2000; Bekker and others, 2004). The deep ocean remained anoxic for several hundred million years longer (Holland, 1984; Canfield, 1998; Anbar and Knoll, 2002). Oxygenation has been conceptualized as a three-stage process (Walker and others, 1983; Kasting and others, 1992). In the first, reducing stage during the Archean, the ocean-atmosphere system was essentially free of oxygen except for trace amounts derived from high energy photolysis of water coupled to hydrogen escape to space (Catling and others, 2001). Even after the advent of oxygenic photosynthesis free oxygen levels in the atmosphere would have remained low for as long as the supply of reduced substances (H 2 , CO, H 2 S from volcanoes and Fe 2 from hydrothermal inputs at oceanic ridges) exceeded the net production of oxygen (Holland, 1994), except in localized microenvironments in the ocean (for example, in stromatolitic mats; Buick, *Institute of Marine and Coastal Sciences and Department of Geological Sciences, Rutgers University, 71 Dudley Road, New Brunswick, New Jersey 08901, USA; [email protected] **Department of Earth and Planetary Science, Massachusetts Institute of Technology, 77 Massachusetts Avenue, Cambridge, Massachusetts 02139, USA [American Journal of Science, Vol. 305, June, September, October, 2005, P. 526 –545] 526

Welcome message from author
This document is posted to help you gain knowledge. Please leave a comment to let me know what you think about it! Share it to your friends and learn new things together.
Transcript
THE CO-EVOLUTION OF THE NITROGEN, CARBON AND OXYGENCYCLES IN THE PROTEROZOIC OCEAN
KATJA FENNEL*, MICK FOLLOWS**, PAUL G. FALKOWSKI*
ABSTRACT. Geochemical evidence suggests that there was a delay of severalhundred million years between the evolution of oxygenic photosynthesis and theaccumulation of oxygen in Earth’s atmosphere. The deep ocean appears to haveremained euxenic for several hundred million years after the atmosphere becameoxygenated. In this paper we examine the possibility that the extraordinary delay in theoxidation of the atmosphere and oceans was caused by a biogeochemical “bottleneck”imposed by metabolic feedbacks between carbon burial, net oxygen production, andthe evolution of the nitrogen cycle in the Proterozoic oceans. Whereas under anoxicconditions oceanic ammonium would have been relatively stable, as oxygen concentra-tions rose, nitrification and subsequent denitrification would have rapidly removedfixed inorganic nitrogen from the oceans. Denitrification would have imposed a strongconstraint on the further rise of free oxygen by depriving oxygenic photoautotrophs ofan essential nutrient (that is, fixed inorganic nitrogen). To examine the dynamicinteractions between oxygen and nitrogen cycling, we developed a five box model thatincorporates the salient features of the oxygen, nitrogen and carbon cycles, oceancirculation, and ocean-atmosphere gas-exchange. Model simulations, initiated underanaerobic conditions with no free oxygen in the atmosphere or ocean, are character-ized by an initially reduced deep ocean with abundant ammonium, followed by anextended period when neither form of fixed nitrogen is stable, and a fully oxidizedphase with abundant nitrate. We infer that, in the process of oxidizing the earlyProterozoic ocean, the system had to go through a nitrogen-limited phase during whichtime export production was severely attenuated. Our studies suggest that the presenceof shallow seas with increased organic matter burial was a critical factor determiningthe concentration of oxygen in the ocean and atmosphere, while the phosphateconcentration played a key role in determining the rate of oxygenation of the deepocean.
introductionThe evolution of oxygenic photosynthesis in the late Archean or early Proterozoic
eon ultimately led to the rise of oxygen in Earth’s atmosphere and ocean. However,there appears to have been an extraordinary delay of several hundred million yearsbetween the rise of oxygenic photosynthesis (before 2700 Ma; Summons and others,1999; Brocks and others, 1999) and the accumulation of oxygen in the atmosphere(not until 2300 Ma; Farquhar and others, 2000; Bekker and others, 2004). The deepocean remained anoxic for several hundred million years longer (Holland, 1984;Canfield, 1998; Anbar and Knoll, 2002).
Oxygenation has been conceptualized as a three-stage process (Walker andothers, 1983; Kasting and others, 1992). In the first, reducing stage during theArchean, the ocean-atmosphere system was essentially free of oxygen except for traceamounts derived from high energy photolysis of water coupled to hydrogen escape tospace (Catling and others, 2001). Even after the advent of oxygenic photosynthesis freeoxygen levels in the atmosphere would have remained low for as long as the supply ofreduced substances (H2, CO, H2S from volcanoes and Fe2� from hydrothermal inputsat oceanic ridges) exceeded the net production of oxygen (Holland, 1994), except inlocalized microenvironments in the ocean (for example, in stromatolitic mats; Buick,
*Institute of Marine and Coastal Sciences and Department of Geological Sciences, Rutgers University,71 Dudley Road, New Brunswick, New Jersey 08901, USA; [email protected]
**Department of Earth and Planetary Science, Massachusetts Institute of Technology, 77 MassachusettsAvenue, Cambridge, Massachusetts 02139, USA
[American Journal of Science, Vol. 305, June, September, October, 2005, P. 526–545]
526
1992). At some point during the Archean or early Proterozoic, either the supply ofreduced substances decreased or net oxygen production increased, or both, such thatoxygen began to accumulate in the atmosphere and surface ocean, while the deepocean remained anoxic. This simultaneous presence of an oxidized surface andreduced deep ocean signifies stage two. Data from red beds (Chandler, 1980),cyanobacterial microfossils (Knoll, 1996), detrital mineral deposits (Des Marais andothers, 1992), biomarkers (Summons and others, 1999; Brocks and others, 1999) andsulfur isotopes (Farquhar and others, 2000; Bekker and others, 2004) indicate that thesecond stage had began by 2300 Ma.
The third stage is characterized by an oxidized deep ocean and was probablyinitiated by a decrease in the supply of reductants to the deep sea and/or a furtherincrease in the rate of oxygen production. Transition from the second to the thirdstage has conventionally been assumed to coincide with the disappearance of bandediron formations (BIFs)—the formation of which requires anoxic deep water—at 1800Ma (Holland, 1984). In a different interpretation based on Proterozoic sulfur isotopedata, Canfield (1998) suggests that the BIFs disappeared due to rising sulfide levels andthat the deep ocean remained anoxic until about 800 Ma (Canfield and Teske, 1996).Recent molybdenum isotope data supports this view (Arnold and others, 2004).Despite these different interpretations of when the deep ocean became oxidized, itappears that it did remain anoxic for several hundred million years (Myr) afteroxygenic photosynthesis became established.
The accumulation of oxygen in the atmosphere is generally thought to haveresulted from permanent burial of organic matter (see, for example, Des Marais andothers, 1992). An alternative and not mutually exclusive hypothesis involves the escapeof hydrogen to interplanetary space (Catling and others, 2001; Holland, 2002). Catlingand co-workers suggested that methane photolysis in the upper atmosphere coupledwith hydrogen escape to space increased the oxidation state of the atmosphere.However, this mechanism does not explain the large change in isotopic composition ofcarbonates at the time, which is consistent with burial of organic carbon in thelithosphere (Des Marais and others, 1992). Regardless of the mechanism, a gradualincrease of the overall oxidation state of the mantle would have decreased the supply ofreductants to the ocean and atmosphere (Holland, 2002).
In discussions of why the deep ocean remained anoxic for so long, the geochemis-try of carbon, sulfur and iron are generally considered, and a shift in the balancebetween the influx of reductants to the deep ocean and the rate of oxygen supply isinvoked. Nitrogen cycling—although highly relevant to the rate of net oxygen produc-tion—is generally ignored. In a discussion of the evolution of the nitrogen cycle,Falkowski (1997) suggested that with oxygen becoming available in the early Protero-zoic: (i) the balance between N2 fixation and denitrification would have shifted towarddenitrification, and (ii) the decrease in the availability of iron would have diminishedN2 fixation. Both of these environmental changes would have contributed to areduction of the fixed inorganic nitrogen inventory in the ocean, resulting in alimitation of photoautotrophic production, and, hence, a slowdown of oxygen evolu-tion. Limitation of N2 fixation by trace metals in a sulfidic ocean after the disappear-ance of BIFs was further contemplated by Anbar and Knoll (2002). Here we explorethe possibility that feedbacks between the nitrogen, oxygen and carbon cycles posed amajor constraint on oxygenating the deep ocean by changing the balance between N2fixation and denitrification.
Over 99 percent of the nitrogen on Earth’s surface is N2 gas, which must bereduced to the level of ammonium in order to be assimilated by organisms for proteinsynthesis. The reduction is biochemically catalyzed by nitrogenases, a heterodimericgroup of closely related enzymes found in a small number of taxonomically diverse
527K. Fennel, M. Follows, and P. G. Falkowski 527
procaryotes. Nitrogenases contain iron-sulfur clusters that are essential for catalyticactivity. Upon exposure to molecular oxygen, the iron-sulfur clusters become oxidizedand the enzyme is irreversibly inhibited. Numerous strategies have evolved to protectnitrogenase from exposure to molecular oxygen; all strategies ultimately decrease theefficiency of the process. Nonetheless, once ammonium is formed, in the presence ofmolecular oxygen it is oxidized by nitrifying bacteria to form nitrite and nitrate.Denitrification, resulting from the anaerobic reduction of nitrate by heterotrophicbacteria, regenerates N2. In the evolution of the nitrogen cycle, a feedback emergedwhen oxygenic photosynthesis led to the production of free oxygen. Whereas underanoxic conditions oceanic ammonium would have been relatively stable, with risingoxygen concentrations in the ocean, coupled nitrification-denitrification would haveprovided a conduit for the loss of fixed nitrogen from the oceans in a sub- or anoxicwater column, and in reducing sediment environments. Hence a paradox emerges: ifthe anoxic/oxic transition led to a loss of fixed nitrogen from the oceans, how didoxygenic photoautotrophs continue to supply molecular oxygen without a supply of anessential nutrient?
To examine the dynamic interactions between the nitrogen, oxygen and carboncycles, we have developed a simple box model that incorporates the fundamentalfeatures of biogeochemistry, ocean circulation and ocean-atmosphere gas-exchange.
model concept and description
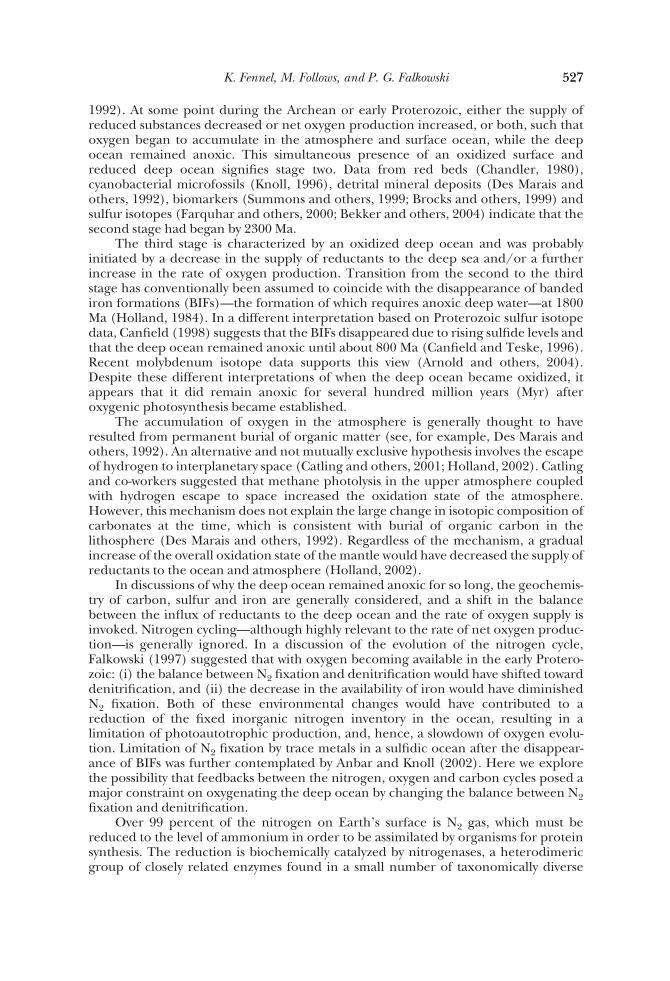
ConceptOur model consists of 4 ocean boxes representing the continental shelf seas, the
high and low latitude surface open ocean, a deep ocean reservoir, and the atmosphere(fig. 1). The biogeochemical parameterizations of the model describe the dynamicbehavior of nitrate, ammonium, phosphate and oxygen concentrations in each of theocean boxes (fig. 2). All of these tracers are subject to the same transport processes by aprescribed ocean circulation, and oxygen exchange between the surface ocean andatmosphere driven by differences in partial pressure.
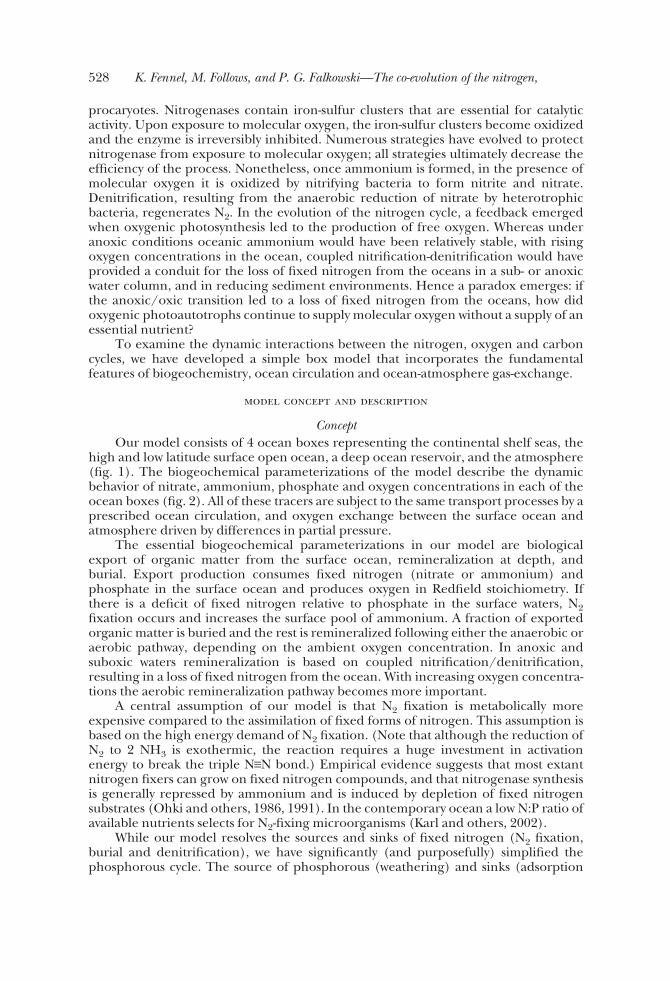
The essential biogeochemical parameterizations in our model are biologicalexport of organic matter from the surface ocean, remineralization at depth, andburial. Export production consumes fixed nitrogen (nitrate or ammonium) andphosphate in the surface ocean and produces oxygen in Redfield stoichiometry. Ifthere is a deficit of fixed nitrogen relative to phosphate in the surface waters, N2fixation occurs and increases the surface pool of ammonium. A fraction of exportedorganic matter is buried and the rest is remineralized following either the anaerobic oraerobic pathway, depending on the ambient oxygen concentration. In anoxic andsuboxic waters remineralization is based on coupled nitrification/denitrification,resulting in a loss of fixed nitrogen from the ocean. With increasing oxygen concentra-tions the aerobic remineralization pathway becomes more important.
A central assumption of our model is that N2 fixation is metabolically moreexpensive compared to the assimilation of fixed forms of nitrogen. This assumption isbased on the high energy demand of N2 fixation. (Note that although the reduction ofN2 to 2 NH3 is exothermic, the reaction requires a huge investment in activationenergy to break the triple N§N bond.) Empirical evidence suggests that most extantnitrogen fixers can grow on fixed nitrogen compounds, and that nitrogenase synthesisis generally repressed by ammonium and is induced by depletion of fixed nitrogensubstrates (Ohki and others, 1986, 1991). In the contemporary ocean a low N:P ratio ofavailable nutrients selects for N2-fixing microorganisms (Karl and others, 2002).
While our model resolves the sources and sinks of fixed nitrogen (N2 fixation,burial and denitrification), we have significantly (and purposefully) simplified thephosphorous cycle. The source of phosphorous (weathering) and sinks (adsorption
528 K. Fennel, M. Follows, and P. G. Falkowski—The co-evolution of the nitrogen,
onto iron oxides and formation of apatite) are not included explicitly. The only loss ofphosphorous in the model is through burial of organic matter, which we assume to bebalanced by a continuous re-supply of phosphate, essentially conserving the totalocean phosphorus inventory. Oxygen sources and sinks, related to the production andremineralization of organic matter and nitrification, are resolved; however, other sinksof oxygen due to, for example, continental weathering and the oxidation of hydrother-mal reductants, are not accounted for explicitly in this model. Although most of thepresented simulations neglect external oxygen sinks such as the inflow of mantlereductants, we examine the effect of this flux in a final simulation by prescribing anexternal oxygen sink that decreases over time. While this treatment is clearly asimplification, it allows us to assess the effect of such unresolved oxygen sinks onnitrogen cycling.
Aspects of our model formulation have been used previously. For example, boxmodels with a similar spatial set-up (a high latitude and low latitude surface ocean, adeep ocean and an atmosphere) have been used by Toggweiler and Sarmiento (1985)and Christensen (1994) in order to explore the partitioning of CO2 between theatmosphere and ocean during glacial and interglacial intervals. Toggweiler andSarmiento (1985) focused on the relative roles of overturning circulation and biologi-cal carbon export in determining atmospheric CO2 levels. Christensen (1994) ex-panded their model by including a shallow continental shelf box and by consideringnitrogen cycling and denitrification. Both studies explored only steady-state solutionsto the model equations. There are parallels in the time-dependent representation ofbiogeochemical processes in the model presented here and that of Lenton and Watson
Fig. 1. Schematic depiction of the model configuration and transport schemes.
529carbon and oxygen cycles in the Proterozoic ocean
(2000a, 2000b) who also considered the coupling between carbon, nitrogen, phospho-rous and oxygen cycling. However, their model does not resolve any circulationprocesses or shallow shelves and, most significantly, does not explicitly representammonium and nitrification, which are necessary elements of our hypothesis.
Our model represents features commonly neglected in models of early oxygenevolution, in particular an oxygen-dependent nitrogen cycle, while simplifying factorsthat have been explored previously, for example, sulfur, iron and phosphorous cycling(see, for example, Holland, 1984; Canfield, 1998; Canfield and others, 2000). Likewise,we have simplified or excluded a number of biogeochemical processes, such as thefeedback of oxygen on the efficiency of organic matter burial. Also, for the sake ofheuristic simplicity, ocean circulation and mixing parameters and the phosphateinventory are imposed as constant values over the entire simulation period. The highlyidealized nature of the model allows us to perform integrations of hundreds of millionsof years duration, and to explore sensitivities to certain processes and parameters.
Fig. 2. Schematic of the biogeochemical processes included in our model.
530 K. Fennel, M. Follows, and P. G. Falkowski—The co-evolution of the nitrogen,
ParameterizationsThe model state variables are nitrate (NO3,i), ammonium (NH4,i), phosphate
(PO4,i) and oxygen (O2,i) concentrations defined in each of the ocean boxes i (i �shelf, high latitude, low latitude, deep ocean), and the atmospheric oxygen mixingratio, AO2. The time rate of change of the state variables is given by
dCdt
�mix�C� � bgc �C� � air-sea�C�, (1)
where C is the vector of all state variables and mix, bgc, and air-sea are operatorsrepresenting transport by ocean circulation, biogeochemical processes and air-seaexchange of oxygen, respectively.
Ocean advection and mixing are described by
mix�Ci� � ��kij�Ci � Cj� � kik�Ci � Ck� � kil�Ci � Cl��/voli, (2)
where Ci is a tracer concentration in box i, kij are the volume fluxes between boxes iand j associated with advection and mixing processes, voli is the volume of box i, andsubscripts i, j, k, l denote shelf, high and low latitude surface, and deep ocean boxes.
Export production is supported by fixed nitrogen and N2 fixation (export � E1 �E2). The fraction of export production based on fixed nitrogen (E1) is parameterizedby a prescribed maximum export rate, �1, and limited by either fixed nitrogen orphosphate depending on their relative abundances:
E1�i� � �1 � PO4,i � min�PO4,i/�kP � PO4,i�, �NO3,i � NH4,i�/�kN � NO3,i � NH4,i��. (3)
kP and kN are the half-saturation concentrations for the uptake of phosphate and fixednitrogen, respectively. Production based on N2 fixation (E2) only occurs when fixednitrogen concentrations are low in terms of absolute values (NO3,i � NH4,i 1 �M)and with respect to available phosphate ((NO3,i � NH4,i)/PO4,i 16). In this case
E2�i� � �2 � PO4,i � PO4,i/�kP � PO4,i�. (4)
Note that the maximum rate of production based on N2 fixation, �2, is smaller than �1to account for its higher metabolic cost. This parameterization of export productionessentially follows Fennel and others (2002). Production occurs in all surface boxes(i � shelf, high and low latitude surface) and reduces the surface pools of nitrogen andphosphate according to Redfield stoichiometry. Consumption of nitrogen is dividedbetween nitrate and ammonium in proportion to their relative abundance. Oxygenproduction is described by
O2prod�i� � RO :P�NO3� � E1 � NO3i/�NO3,i � NH4,i�
� RO :P�NH4� � E1 � NH4,i/�NO3,i � NH4,i� � RO :P�NH4� � E2 (5)
where RO:P(NO3) and RO:P(NH4) are oxygen-to-phosphorus ratios for the photosyntheticproduction of organic matter based on nitrate or ammonium, respectively.
Organic matter produced in the surface boxes is instantaneously exported,remineralized and buried. Remineralization of phosphate in the deep ocean follows
PO4remin�deep� � �1 � fbur� � �volhigh � export�high� � vollow � export�low��/voldeep, (6)
with the burial fraction fbur � exp(�z(deep)/z*) which assumes an exponential verticalprofile for the decay of organic matter with z* as the length scale. Nitrogen remineral-ization is partitioned between the aerobic and anaerobic pathway depending on theanoxic fraction, fanox, which represents the volume fraction of the deep ocean that issuboxic or anoxic. We parameterize the suboxic/anoxic fraction as an exponential
531carbon and oxygen cycles in the Proterozoic ocean
function of the deep oxygen concentration (fanox � exp(�O2,deep/kanox)). While theform of this parameterization is unconstrained, it seems likely that the volume ofanoxic waters is related to the mean deep ocean oxygen concentration. In the oxicfraction, (1 � fanox), of the deep ocean, remineralization consumes and regeneratesnitrate. In the suboxic or anoxic fraction, fanox, ammonium is regenerated and nitrate isconsumed. If nitrate concentrations are too low to support anaerobic remineraliza-tion, we assume that the oxidation of organic matter is facilitated by other electrondonors, for example, sulphate. Thus organic matter can always be oxidized in themodel, though the active oxidant may vary. The parameterizations of aerobic andanaerobic nitrogen remineralization then follow as
NO3remin�deep� � �1 � fbur� � �1 � fanox� � RN:P � �volhigh � export�high�
� vollow � export�low��/voldeep (7)
and
NH4remin�deep� � �1 � fbur� � fanox � RN :P � �volhigh � export�high� � vollow � export�low��/voldeep,
(8)
respectively. The consumption of oxygen and nitrate during the remineralization oforganic matter is described as
O2sink�deep� � RO :P�NO3�/RN :P � NO3remin�deep� (9)
and
NO3sink�deep� � RNO3denit � NH4remin�deep�. (10)
Remineralization and burial are treated analogously in the shelf box. Nitrification ofammonium to nitrate is limited by the availability of oxygen according to
nitri�i� � �nitri � NH4 � O2,i/�kO � O2,i�, (11)
where �nitri and kO are the maximum nitrification rate and half-saturation concentra-tion, respectively, in all ocean boxes.
Gas exchange of oxygen between the surface ocean and atmosphere is parameter-ized simply as a Newtonian damping towards the saturation concentration, that is
O2exch�i� � �oeq � O2,i�/�, (12)
assuming that the equilibrium concentration, oeq, scales linearly with the atmosphericoxygen mixing rate as oeq � oeqpresent � AO2/0.21. The damping timescale, �, is on theorder of one year.
The model is integrated using a Runge-Kutta solver with adaptive stepsize control(Press and others, 2002).
results and discussionWe first consider the results of a set of sensitivity simulations where the configura-
tion of the model’s ocean-atmosphere system was held constant over the course of eachsimulation (that is, all model parameters were constant) but multiple simulations withdifferent choices for model parameters were performed (for example, different valuesfor the phosphate inventory, shelf size et cetera). Comparison of these simulationsallows us to identify the model’s principal modes of behavior. All simulations wereinitiated under anaerobic conditions with no free oxygen in the atmosphere or ocean,without nitrate in the ocean, and with an initially uniform ammonium concentrationof 0.1 �M. The model was integrated for 50 Myr with the parameter values given in
532 K. Fennel, M. Follows, and P. G. Falkowski—The co-evolution of the nitrogen,
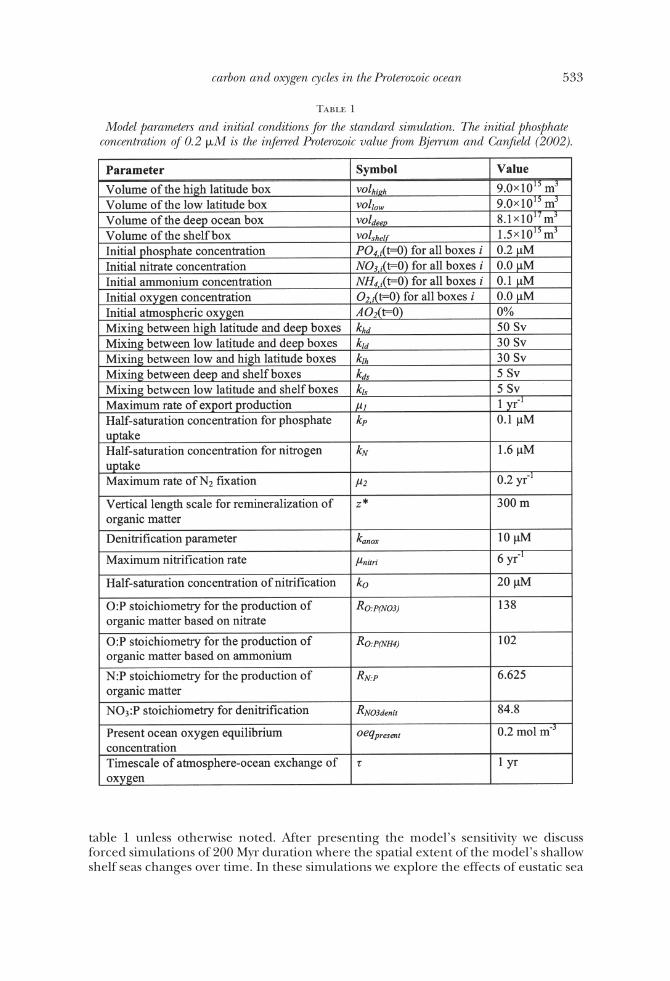
table 1 unless otherwise noted. After presenting the model’s sensitivity we discussforced simulations of 200 Myr duration where the spatial extent of the model’s shallowshelf seas changes over time. In these simulations we explore the effects of eustatic sea
Table 1
Model parameters and initial conditions for the standard simulation. The initial phosphateconcentration of 0.2 �M is the inferred Proterozoic value from Bjerrum and Canfield (2002).
533carbon and oxygen cycles in the Proterozoic ocean
level changes on organic matter burial and oxygen evolution. Finally, we discuss theeffect of an external supply of reductants in modulating the simulated course of theoxygenation process.
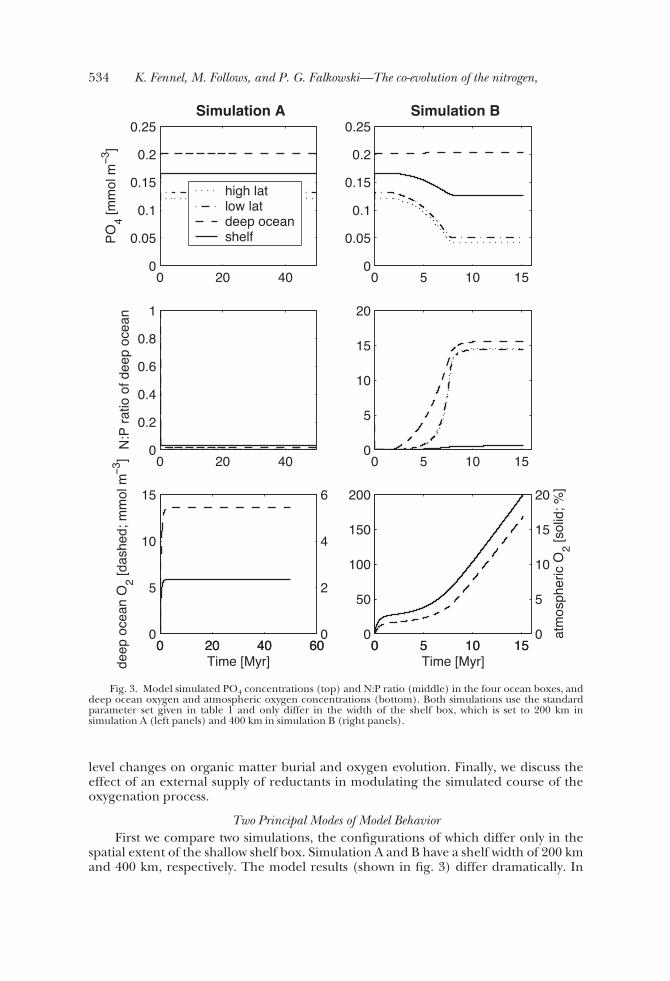
Two Principal Modes of Model BehaviorFirst we compare two simulations, the configurations of which differ only in the
spatial extent of the shallow shelf box. Simulation A and B have a shelf width of 200 kmand 400 km, respectively. The model results (shown in fig. 3) differ dramatically. In
Fig. 3. Model simulated PO4 concentrations (top) and N:P ratio (middle) in the four ocean boxes, anddeep ocean oxygen and atmospheric oxygen concentrations (bottom). Both simulations use the standardparameter set given in table 1 and only differ in the width of the shelf box, which is set to 200 km insimulation A (left panels) and 400 km in simulation B (right panels).
534 K. Fennel, M. Follows, and P. G. Falkowski—The co-evolution of the nitrogen,
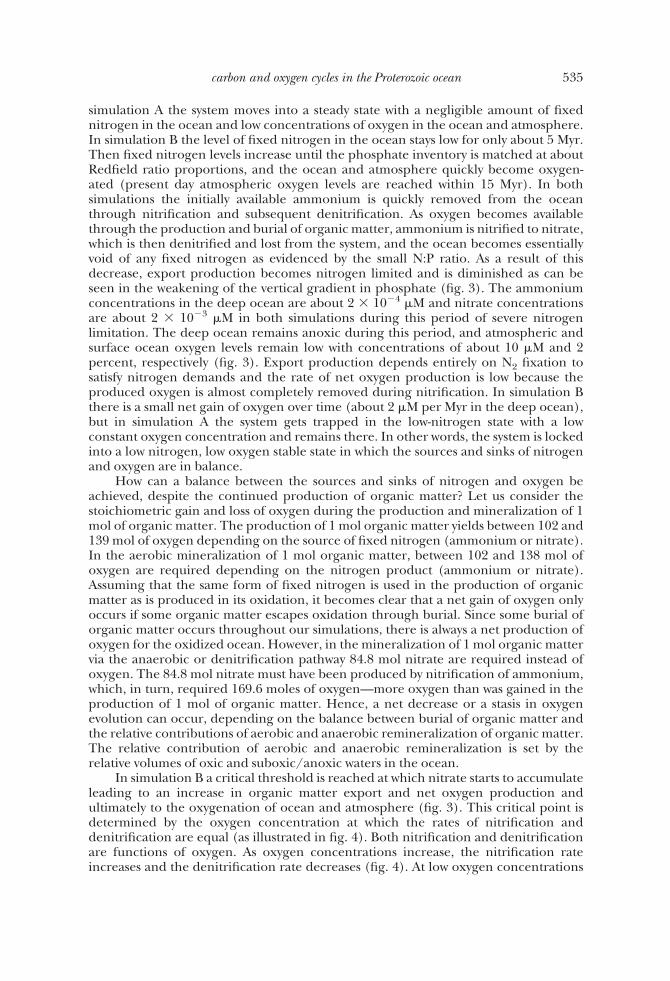
simulation A the system moves into a steady state with a negligible amount of fixednitrogen in the ocean and low concentrations of oxygen in the ocean and atmosphere.In simulation B the level of fixed nitrogen in the ocean stays low for only about 5 Myr.Then fixed nitrogen levels increase until the phosphate inventory is matched at aboutRedfield ratio proportions, and the ocean and atmosphere quickly become oxygen-ated (present day atmospheric oxygen levels are reached within 15 Myr). In bothsimulations the initially available ammonium is quickly removed from the oceanthrough nitrification and subsequent denitrification. As oxygen becomes availablethrough the production and burial of organic matter, ammonium is nitrified to nitrate,which is then denitrified and lost from the system, and the ocean becomes essentiallyvoid of any fixed nitrogen as evidenced by the small N:P ratio. As a result of thisdecrease, export production becomes nitrogen limited and is diminished as can beseen in the weakening of the vertical gradient in phosphate (fig. 3). The ammoniumconcentrations in the deep ocean are about 2 � 10�4 �M and nitrate concentrationsare about 2 � 10�3 �M in both simulations during this period of severe nitrogenlimitation. The deep ocean remains anoxic during this period, and atmospheric andsurface ocean oxygen levels remain low with concentrations of about 10 �M and 2percent, respectively (fig. 3). Export production depends entirely on N2 fixation tosatisfy nitrogen demands and the rate of net oxygen production is low because theproduced oxygen is almost completely removed during nitrification. In simulation Bthere is a small net gain of oxygen over time (about 2 �M per Myr in the deep ocean),but in simulation A the system gets trapped in the low-nitrogen state with a lowconstant oxygen concentration and remains there. In other words, the system is lockedinto a low nitrogen, low oxygen stable state in which the sources and sinks of nitrogenand oxygen are in balance.
How can a balance between the sources and sinks of nitrogen and oxygen beachieved, despite the continued production of organic matter? Let us consider thestoichiometric gain and loss of oxygen during the production and mineralization of 1mol of organic matter. The production of 1 mol organic matter yields between 102 and139 mol of oxygen depending on the source of fixed nitrogen (ammonium or nitrate).In the aerobic mineralization of 1 mol organic matter, between 102 and 138 mol ofoxygen are required depending on the nitrogen product (ammonium or nitrate).Assuming that the same form of fixed nitrogen is used in the production of organicmatter as is produced in its oxidation, it becomes clear that a net gain of oxygen onlyoccurs if some organic matter escapes oxidation through burial. Since some burial oforganic matter occurs throughout our simulations, there is always a net production ofoxygen for the oxidized ocean. However, in the mineralization of 1 mol organic mattervia the anaerobic or denitrification pathway 84.8 mol nitrate are required instead ofoxygen. The 84.8 mol nitrate must have been produced by nitrification of ammonium,which, in turn, required 169.6 moles of oxygen—more oxygen than was gained in theproduction of 1 mol of organic matter. Hence, a net decrease or a stasis in oxygenevolution can occur, depending on the balance between burial of organic matter andthe relative contributions of aerobic and anaerobic remineralization of organic matter.The relative contribution of aerobic and anaerobic remineralization is set by therelative volumes of oxic and suboxic/anoxic waters in the ocean.
In simulation B a critical threshold is reached at which nitrate starts to accumulateleading to an increase in organic matter export and net oxygen production andultimately to the oxygenation of ocean and atmosphere (fig. 3). This critical point isdetermined by the oxygen concentration at which the rates of nitrification anddenitrification are equal (as illustrated in fig. 4). Both nitrification and denitrificationare functions of oxygen. As oxygen concentrations increase, the nitrification rateincreases and the denitrification rate decreases (fig. 4). At low oxygen concentrations
535carbon and oxygen cycles in the Proterozoic ocean
the denitrification rate exceeds nitrification, hence all produced nitrate is denitrified.Only when oxygen levels increase to the point where nitrification exceeds denitrifica-tion (at 11 �M O2 for the normalized rates shown in fig. 4), does nitrate accumulate. Insimulation A, a critical ratio between aerobic and anaerobic mineralization without netoxygen production is reached before nitrification exceeds denitrification. Hence thesystem gets locked in the low nitrogen, low oxygen state. In simulation B net oxygenproduction is sufficient to push the model into the regime, which favors nitrificationand further oxygenation.
Simulations A and B illustrate the two qualitatively different stable states themodel system can attain. The first is a low nitrogen, low oxygen steady state at whichoceanic nitrogen and oxygen levels remain constant over time. The second is anoxygenated state at which the oceanic inventory of fixed nitrogen matches thephosphate inventory in Redfield proportion and net oxygen production occurs.
Model SensitivityThe rate of oxygenation of the ocean and atmosphere in our model is strongly
determined by the size of the continental shelf box (fig. 3). This dependency resultsfrom the higher burial efficiency of organic matter on the shallow continental shelf,which leads to higher net oxygen production. Without burial, oxygen evolution duringthe photosynthetic production of organic matter would be balanced by oxygenconsumption during its mineralization. The distribution of organic matter in the watercolumn is determined by the mineralization of sinking matter and is well approxi-mated by an exponential decay function with depth (Suess, 1980; Martin and others,1987). Consequently, the fraction of exported organic matter that reaches the sea floorand can be buried is a function of the depth of the water column. Our model calculatesthe burial fraction of organic matter based on this exponential decay with a given
Fig. 4. Normalized nitrification and denitrification rates as a function of dissolved oxygen concentra-tion.
536 K. Fennel, M. Follows, and P. G. Falkowski—The co-evolution of the nitrogen,
e-folding scale. Burial of organic matter in our model is hence more efficient on theshallow continental shelves than in the deep ocean. A relative increase in shelf areathus leads to an increase in organic matter burial and consequently in net oxygenproduction. In the narrow shelf case (simulation A; 200 km) the ocean gets locked in asteady state in which neither oxygen nor fixed nitrogen levels increase. In this case thefixation of nitrogen is balanced by denitrification and net oxygen production is zero.In case of a wider shelf (simulation B; 400 km) the relative increase in organic matterburial is sufficient to overcome the nitrification-denitrification sink.
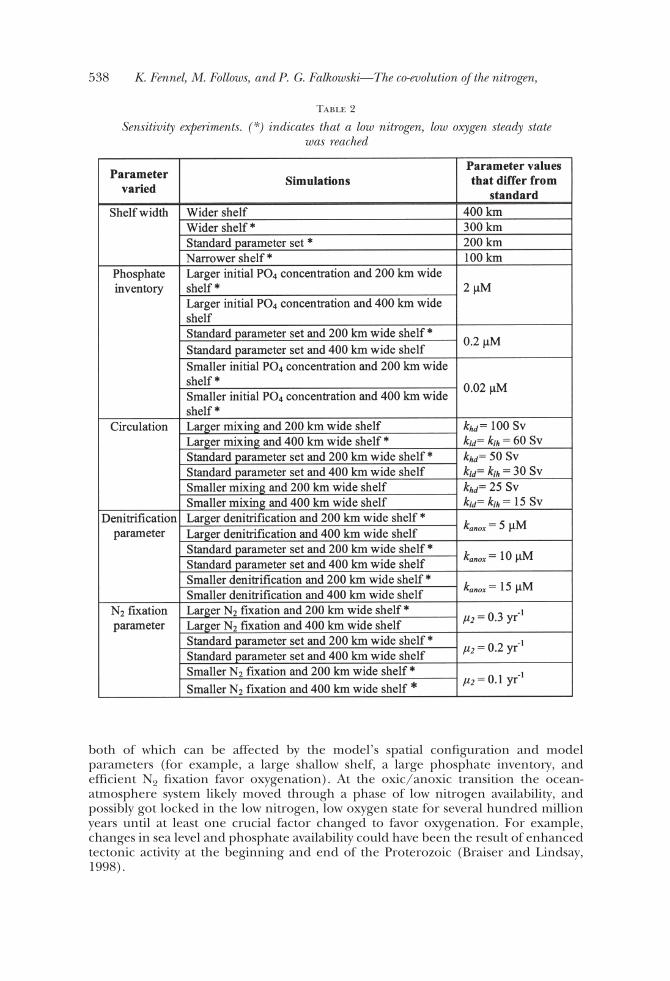
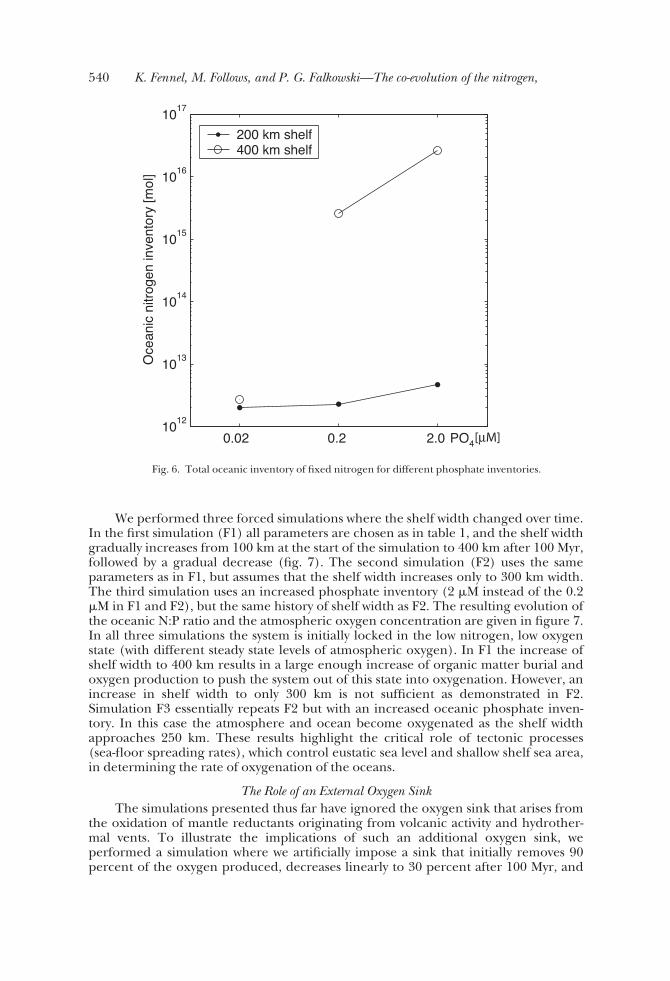
Let us now examine sensitivity to the phosphate inventory, the denitrification andnitrogen fixation parameters, and vertical mixing by perturbing each of these parame-ters from their “standard” values for both cases discussed above, that is, for a shelfwidth of 200 km and a shelf width of 400 km (see list in table 2). The sensitivity in themodel is assessed by comparing the steady state concentration of atmospheric oxygenin cases where a steady state is reached, and the duration until atmospheric oxygenlevels reach 20 percent in cases where the systems becomes oxygenated (figs. 5Aand 5B).
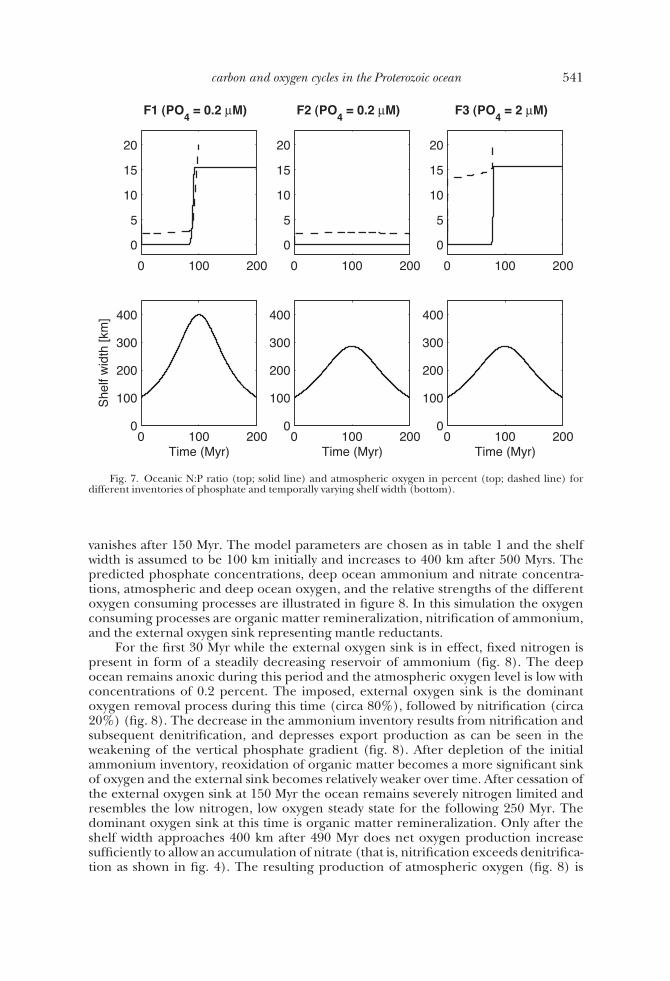
In the case of the narrow shelf, perturbation of denitrification, N2-fixation andmixing parameters produce relatively small changes in the steady state concentrationof atmospheric oxygen (fig. 5A). With the exception of vertical mixing, an increase ofthe parameter value leads to small increases of the oxygen concentration. However, anincrease in phosphate concentration to the present day level has a more pronouncedeffect, increasing steady state oxygen by an order of magnitude. In the case of a wideshelf, an increase of the phosphate inventory to the present day level speeds up theoxygenation process from the predicted 15 Myr in the standard case to less than 1 Myr(fig. 5B). The decrease in phosphate inventory depresses oxygen evolution such thatthe system remains in the nitrogen limited state despite a 400 km wide shelf (fig. 5A).The model’s sensitivity to differences in phosphate inventory can be best understoodby illustrating the effect on the fixed nitrogen inventory. In both cases, the steady stateand oxygenated case, the nitrogen inventory scales with the phosphate inventory (fig.6). This relation is obvious for the oxidized ocean where the phosphate and thenitrogen inventories will be matched stoichiometrically with respect to the Redfieldratio. This stoichiometric match is maintained because N2 fixation will occur if theoceanic N:P ratio is below the Redfield ratio, but will cease when Redfield proportionsare reached because N2-fixers are competitive only in a nitrogen-limited ocean. In thelow oxygen state, nitrogen fixation and hence the nitrogen inventory will dependdirectly on both the phosphate inventory and the N2 fixation rate (that is, itsefficiency). That is, for a constant N2 fixation rate an increase in the phosphateinventory leads to an increase in the nitrogen fixation flux and inventory. Changes inthe N2 fixation rate lead to similar changes in the nitrogen inventory. In the case of awide shelf an efficient N2 fixation speeds up oxygenation (fig. 5B), while an inefficientN2 fixation depresses oxygen evolution and the system remains in the low oxygensteady state.
These analyses demonstrate that changes in the areal extent of the continentalshelf, the concentration of phosphate, and the efficiency of nitrogen fixation deter-mine whether the system remains in a low nitrogen, low oxygen state.
Forced SimulationsWe have seen that due to the non-linear interaction between export production,
oxygen evolution, nitrification and denitrification the ocean-atmosphere system canhave two dramatically different stable states, namely a low oxygen, low nitrogen state inwhich the photosynthesis and net oxygen production are depressed, and an oxidizedstate. Net oxygen production depends on factors like the ratio of export production toburial of organic matter, and the rate of oxygen consumption during nitrification,
537carbon and oxygen cycles in the Proterozoic ocean
both of which can be affected by the model’s spatial configuration and modelparameters (for example, a large shallow shelf, a large phosphate inventory, andefficient N2 fixation favor oxygenation). At the oxic/anoxic transition the ocean-atmosphere system likely moved through a phase of low nitrogen availability, andpossibly got locked in the low nitrogen, low oxygen state for several hundred millionyears until at least one crucial factor changed to favor oxygenation. For example,changes in sea level and phosphate availability could have been the result of enhancedtectonic activity at the beginning and end of the Proterozoic (Braiser and Lindsay,1998).
Table 2
Sensitivity experiments. (*) indicates that a low nitrogen, low oxygen steady statewas reached
538 K. Fennel, M. Follows, and P. G. Falkowski—The co-evolution of the nitrogen,
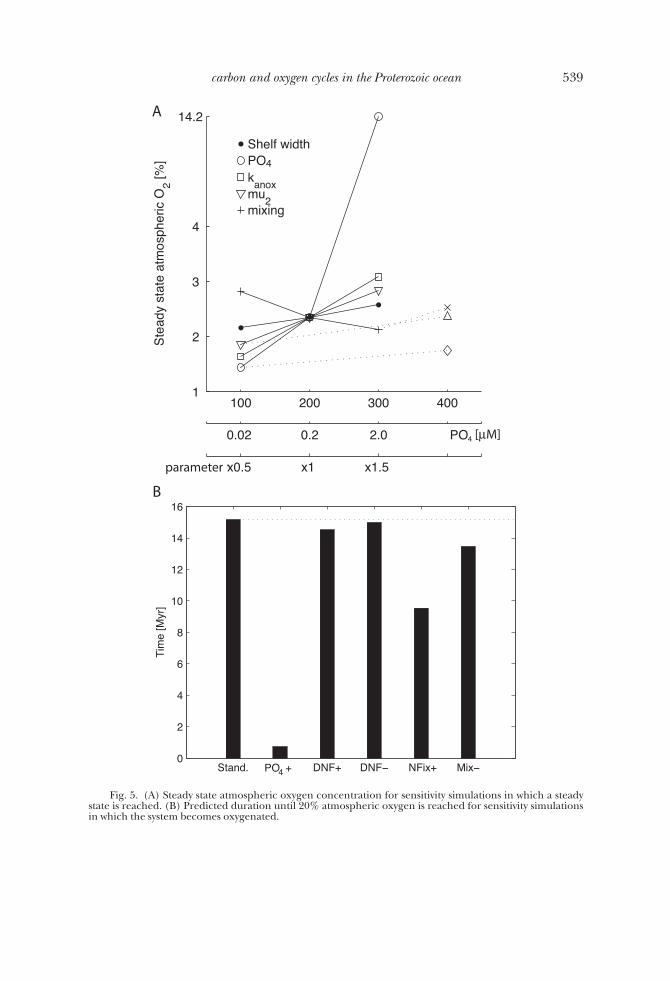
Fig. 5. (A) Steady state atmospheric oxygen concentration for sensitivity simulations in which a steadystate is reached. (B) Predicted duration until 20% atmospheric oxygen is reached for sensitivity simulationsin which the system becomes oxygenated.
539carbon and oxygen cycles in the Proterozoic ocean
We performed three forced simulations where the shelf width changed over time.In the first simulation (F1) all parameters are chosen as in table 1, and the shelf widthgradually increases from 100 km at the start of the simulation to 400 km after 100 Myr,followed by a gradual decrease (fig. 7). The second simulation (F2) uses the sameparameters as in F1, but assumes that the shelf width increases only to 300 km width.The third simulation uses an increased phosphate inventory (2 �M instead of the 0.2�M in F1 and F2), but the same history of shelf width as F2. The resulting evolution ofthe oceanic N:P ratio and the atmospheric oxygen concentration are given in figure 7.In all three simulations the system is initially locked in the low nitrogen, low oxygenstate (with different steady state levels of atmospheric oxygen). In F1 the increase ofshelf width to 400 km results in a large enough increase of organic matter burial andoxygen production to push the system out of this state into oxygenation. However, anincrease in shelf width to only 300 km is not sufficient as demonstrated in F2.Simulation F3 essentially repeats F2 but with an increased oceanic phosphate inven-tory. In this case the atmosphere and ocean become oxygenated as the shelf widthapproaches 250 km. These results highlight the critical role of tectonic processes(sea-floor spreading rates), which control eustatic sea level and shallow shelf sea area,in determining the rate of oxygenation of the oceans.
The Role of an External Oxygen SinkThe simulations presented thus far have ignored the oxygen sink that arises from
the oxidation of mantle reductants originating from volcanic activity and hydrother-mal vents. To illustrate the implications of such an additional oxygen sink, weperformed a simulation where we artificially impose a sink that initially removes 90percent of the oxygen produced, decreases linearly to 30 percent after 100 Myr, and
[µM]
Fig. 6. Total oceanic inventory of fixed nitrogen for different phosphate inventories.
540 K. Fennel, M. Follows, and P. G. Falkowski—The co-evolution of the nitrogen,
vanishes after 150 Myr. The model parameters are chosen as in table 1 and the shelfwidth is assumed to be 100 km initially and increases to 400 km after 500 Myrs. Thepredicted phosphate concentrations, deep ocean ammonium and nitrate concentra-tions, atmospheric and deep ocean oxygen, and the relative strengths of the differentoxygen consuming processes are illustrated in figure 8. In this simulation the oxygenconsuming processes are organic matter remineralization, nitrification of ammonium,and the external oxygen sink representing mantle reductants.
For the first 30 Myr while the external oxygen sink is in effect, fixed nitrogen ispresent in form of a steadily decreasing reservoir of ammonium (fig. 8). The deepocean remains anoxic during this period and the atmospheric oxygen level is low withconcentrations of 0.2 percent. The imposed, external oxygen sink is the dominantoxygen removal process during this time (circa 80%), followed by nitrification (circa20%) (fig. 8). The decrease in the ammonium inventory results from nitrification andsubsequent denitrification, and depresses export production as can be seen in theweakening of the vertical phosphate gradient (fig. 8). After depletion of the initialammonium inventory, reoxidation of organic matter becomes a more significant sinkof oxygen and the external sink becomes relatively weaker over time. After cessation ofthe external oxygen sink at 150 Myr the ocean remains severely nitrogen limited andresembles the low nitrogen, low oxygen steady state for the following 250 Myr. Thedominant oxygen sink at this time is organic matter remineralization. Only after theshelf width approaches 400 km after 490 Myr does net oxygen production increasesufficiently to allow an accumulation of nitrate (that is, nitrification exceeds denitrifica-tion as shown in fig. 4). The resulting production of atmospheric oxygen (fig. 8) is
Fig. 7. Oceanic N:P ratio (top; solid line) and atmospheric oxygen in percent (top; dashed line) fordifferent inventories of phosphate and temporally varying shelf width (bottom).
541carbon and oxygen cycles in the Proterozoic ocean
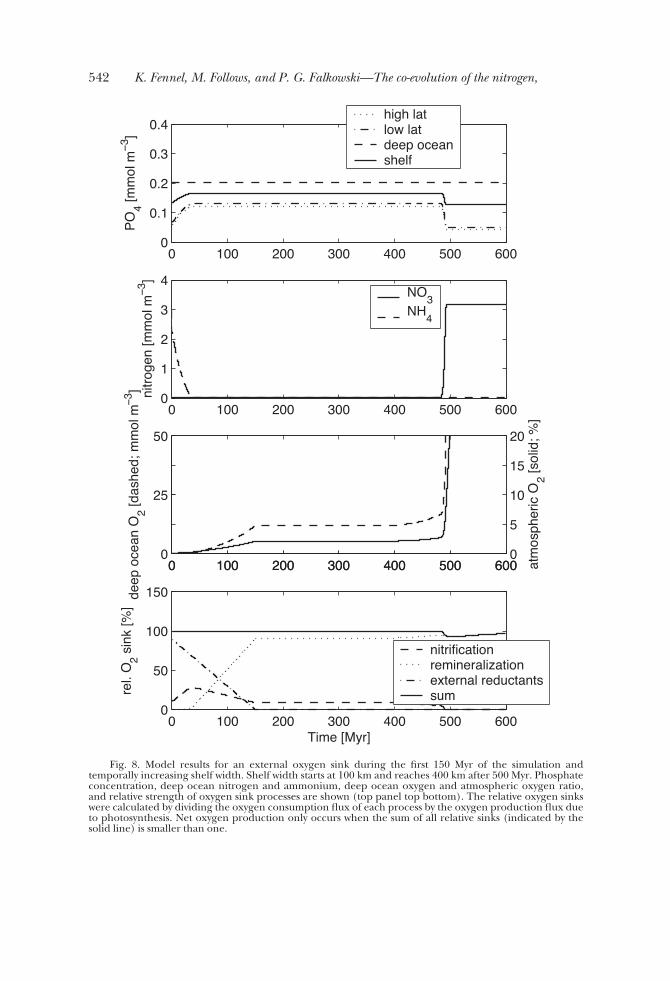
Fig. 8. Model results for an external oxygen sink during the first 150 Myr of the simulation andtemporally increasing shelf width. Shelf width starts at 100 km and reaches 400 km after 500 Myr. Phosphateconcentration, deep ocean nitrogen and ammonium, deep ocean oxygen and atmospheric oxygen ratio,and relative strength of oxygen sink processes are shown (top panel top bottom). The relative oxygen sinkswere calculated by dividing the oxygen consumption flux of each process by the oxygen production flux dueto photosynthesis. Net oxygen production only occurs when the sum of all relative sinks (indicated by thesolid line) is smaller than one.
542 K. Fennel, M. Follows, and P. G. Falkowski—The co-evolution of the nitrogen,
unrealistically optimistic because oxygen sinks, like the oxidation of organic matter atsubductive margins and continental oxidative weathering are not included (after 150Myr the only oxygen sinks present in the model are the oxidation of sinking organicmatter and nitrification of ammonium).
This simulation produces three biogeochemical stages over time: (i) a reduceddeep ocean, (ii) a low nitrogen ocean, and (iii) a fully oxidized ocean. In the initialstage, when the surface ocean and atmospheric oxygen levels are low and the deepocean remains anoxic, ammonium is a stable nutrient and abundant. In the second,low nitrogen stage, when oxygen is low but present in the deep ocean, neitherammonium nor nitrate are stable and the ocean is severely nitrogen limited. In thethird, fully oxidized stage, nitrate is stable and abundant. We infer that in the processof oxidizing the Proterozoic ocean the system had to go through a phase where neitherform of fixed nitrogen was stable, which must have resulted in severe limitation ofphytoplankton production and, hence, represented a negative feedback on oxygenproduction.
conclusionsThe results of our simple box model clearly suggest that the rise of oxygen in
Earth’s atmosphere could have been significantly delayed due to oxygen feedbacks onthe nitrogen cycle. When free oxygen became available, it permitted ammonium to beconverted to nitrate, which can be rapidly reduced to N2 gas, decreasing the pool ofbioavailable nitrogen in the ocean and thus providing a negative feedback on oxygenproduction. The loss of fixed nitrogen would have resulted in a low nitrogen state ofthe ocean at the anoxic/oxic transition, and represented a barrier to oxidizing theplanet. Only after the ocean-atmosphere system moved past the denitrification feed-back was a new stable state with abundant nitrate reached. It has been suggestedpreviously that low phosphate availability during the Archean and early Proterozoiceras contributed to low atmospheric oxygen levels by depressing the photosyntheticproduction of organic matter and hence organic matter burial and net oxygenproduction (Bjerrum and Canfield, 2002). Bjerrum and Canfield (2002) estimatedthat phosphate removal due to adsorption onto iron oxide deposits reduced phos-phate availability by 90 to 75 percent compared to its present day value. Our resultssuggest that nitrogen removal due to denitrification at the oxic/anoxic transition was aparallel process that depleted fixed nitrogen in the ocean.
The history of organic matter burial can be inferred from sedimentary records ofthe 13C signal of carbonates (for example, Des Marais and others, 1992). Relativelylarge variations in 13C of carbonates have been reported at the beginning (before1850 Ma) and the end (after 1250 Ma) of the Proterozoic eon, both times of increasedoxidation of the biosphere, but variations in the intervening interval are relativelysmall (Knoll and others, 1986; Kaufman and Knoll, 1995; Buick and others, 1995;Karhu and Holland, 1996; Braiser and Lindsay, 1998; Bartley and others, 2001). Themid-Proterozoic stasis has been suggested to indicate low overall productivity due to achange in nutrient regime (Anbar and Knoll, 2002). We propose that such a change innutrient regime could have resulted from the negative feedback of the nitrogen cycleon the early evolution of oxygen and our model results are consistent with thishypothesis. Major continental rifting and orogenesis appear to have occurred after1250 Ma, ending the stasis in carbonate 13C (Braiser and Lindsay, 1998). An increasein sea level and in phosphate inputs could have resulted from the tectonic activity. Ourmodel system is sensitive to such changes, in particular, increases in shallow shelf areaand phosphate inventory can lead to net oxygen production consistent with theapparent increase of Earth’s oxidation state at that time (Des Marais and others, 1992).
Evidence for Proterozoic changes in the nitrogen cycle, which we suggest wouldhave had a major influence on the oxidation of the earth, should be recorded in the
543carbon and oxygen cycles in the Proterozoic ocean
nitrogen isotopic composition of sedimentary organic matter because denitrificationresults in an isotopic fractionation of nitrogen between the atmosphere and ocean.While there is no marked fractionation during N2 fixation, denitrification preferen-tially returns 14N to the atmosphere thus enriching the oceanic nitrogen inventory in15N, which is recorded by marine organisms. Unfortunately, 15N records from theArchean and early Proterozoic are sparse. Available measurements of nitrogen isotopiccomposition from Archean and Proterozoic sedimentary rocks show a shift of theaverage 15N from negative values in the early Archean (3500 – 3400 Myr) to positivevalues in the early Proterozoic (2100 – 1600 Myr) but also a large range of values from�7 to 30 percent (Papineau and others, 2005, and references therein). The shift tomore positive values has been interpreted as evidence that denitrification began tocontrol the biospheric nitrogen isotope distribution when the oxidation state of theocean increased at about 2500 Myr ago (Beaumont and Robert, 1999). In contrast, Jiaand Kerrich (2004) suggested the positive 15N values to be the result of a secondaryArchean atmosphere derived from CI-chondrite-like material and comets with 15N of30 to 42 permil. Filling the time gap between upper Archean and the Paleoproterozoicdata that are currently available would be of great value, allowing a more criticalevaluation of the role of the nitrogen cycle in the rise of oxygen on Earth.
acknowledgmentsOur research is supported by grants from the National Science Foundation and
NASA. We wish to thank Jim Kasting, two anonymous reviewers and Larry Anderson forthoughtful comments on an earlier version of the manuscript. We also thank IlanaBerman-Frank, Christian Bjerrum, Donald Canfield and Jim Miller for discussions.
References
Anbar, A. D., and Knoll, A. H., 2002, Proterozoic Ocean Chemistry and Evolution: A Bioinorganic Bridge?:Science, v. 297, p. 1137–1142.
Arnold, G. L., Anbar, A. D., Barling, J., and Lyons, T. W., 2004, Molybdenum Isotope Evidence forWidespread Anoxia in Mid-Proterozoic Oceans: Science, v. 304, p. 87–90.
Bartley, J. K., Semikhatov, M. A., Kaufman, A. J., Knoll, A. H., Pope, M. C., and Jacobsen, S. B., 2001, Globalevents across the Mesoproterozoic–Neoproterozoic boundary: C and Sr isotopic evidence from Siberia:Precambrian Research, v. 111, p. 165–202.
Beaumont, V., and Robert, F., 1999, Nitrogen isotope ratios of kerogens in Precambrian cherts: a record ofthe evolution of atmosphere chemistry?: Precambrian Research, v. 96, p. 63–82.
Bekker, A., Holland, H. D., Wang, P. L., Rumble, D., Stein, H. J., Hannah, J. L., Coetzee, L. L., and Beukes,N. J., 2004, Dating the rise of atmospheric oxygen: Nature, v. 427, p. 117–120.
Bjerrum, C. J., and Canfield, D. E., 2002, Ocean productivity before about 1.9 Gyr ago limited by phosphorusadsorption onto iron oxides: Nature, v. 417, p. 159–162.
Braiser, M. D., and Lindsay, J. F., 1998, A billion years of environmental stability and the emergence ofeukaryotes; new data from northern Australia: Geology, v. 26, p. 555–558.
Brocks, J. J., Logan, G. A., Buick, R., and Summons, R. E., 1999, Archean Molecular Fossils and the Early Riseof Eukaryotes: Science, v. 285, p. 1033–1036.
Buick, R., 1992, The Antiquity of Oxygenic Photosynthesis: Evidence from Stromatolites in Sulphate-Deficient Archaean Lakes: Science, v. 255, p. 74–77.
Buick, R., Des Marais, D. J., and Knoll, A. H., 1995, Stable isotopic compositions of carbonates from theMesoproterozoic Bangemall Group, northwestern Australia: Chemical Geology, v. 123, p. 153–171.
Canfield, D. E., 1998, A new model for Proterozoic ocean chemistry: Nature, v. 396, p. 450–453.Canfield, D. E., and Teske, A., 1996, Late Proterozoic rise in atmospheric oxygen concentration inferred
from phylogenetic and sulphur-isotope studies: Nature, v. 382, p. 127–132.Canfield, D. E., Habicht, K. S., and Thamdrup, B., 2000, The Archean Sulfur Cycle and the Early History of
Atmospheric Oxygen: Science, v. 288, p. 658–661.Catling, D. C., Zahnle, K. J., and McKay, C. P., 2001, Biogenic Methane, Hydrogen Escape, and the
Irreversible Oxidation of Early Earth: Science, v. 293, p. 839–843.Chandler, F. W., 1980, Proterozoic redbed sequences of Canada: Canada Geological Survey, Geological
Survey Bulletin, v. 311, 53 p.Christensen, J. P., 1994, Carbon export from continental shelves, denitrification and atmospheric carbon
dioxide: Continental Shelf Research, v. 14, p. 547–576.Des Marais, D. J., Strauss, H., Summons, R. E., and Hayes, J. M., 1992, Carbon isotope evidence for the
stepwise oxidation of the Proterozoic environment: Nature, v. 359, p. 605–609.
544 K. Fennel, M. Follows, and P. G. Falkowski—The co-evolution of the nitrogen,
Falkowski, P. G., 1997, Evolution of the nitrogen cycle and its influence on the biological sequestration ofCO2 in the ocean: Nature, v. 387, p. 272–275.
Farquhar, J., Bao, H., and Thiemens, M., 2000, Atmospheric Influence of Earth’s Earliest Sulfur Cycle:Science, v. 289, p. 756–758.
Fennel, K., Spitz, Y. H., Letelier, R. M., Abbott, M. R., and Karl, D. M., 2002, A deterministic model for N2fixation at stn. ALOHA in the subtropical North Pacific Ocean: Deep-Sea Research II, v. 49, p. 149–174.
Holland, H. D., 1984, The Chemical Evolution of the Atmosphere and Oceans: Princeton, PrincetonUniversity Press, 582 p.
–––––– 1994, Early Proterozoic atmosphere change, in Bengston, S., editor. Early Life on Earth, NobelSymposium no. 84: New York, Columbia University Press, p. 237–244.
–––––– 2002, Volcanic gases, black smokers, and the Great Oxidation Event: Geochimica et CosmochimicaActa, v. 66, p. 3811–3826.
Jia, Y., and Kerrich, R., 2004, Nitrogen 15-enriched Precambrian kerogen and hydrothermal systems:Geochemistry, Geophysics, Geosystems, v. 5, Q07005, doi:10.1029/2004GC000716.
Karhu, J. A., and Holland, H. D., 1996, Carbon isotopes and the rise of atmospheric oxygen: Geology, v. 24,p. 867–870.
Karl, D., Michaels, A., Bergman, B., Capone, D., Carpenter, E., Letelier, R., Lipschultz, F., Pearl, H., Sigman,D., and Stal, L., 2002, Dinitrogen fixation in the world’s oceans: Biogeochemistry, v. 57/58, p. 47–98.
Kasting, J. F., Holland, H. D., and Kump, L. R., 1992, Atmospheric evolution: the rise of oxygen, in Schopf,J. W., and Klein, C., editors, The Proterozoic Biosphere: New York, Cambridge University Press,p. 159–163.
Kaufman, A. J., and Knoll, A. H., 1995, Neoproterozoic variations in the C-isotopic composition of seawater:stratigraphic and biogeochemical implications: Precambrian Research, v. 73, p. 27–49.
Knoll, A. H., 1996, Archaen and Proterozoic paleontology, in Jansonius, J., and MacGregor, D. C., editors,Palynology: Principles and Applications: Dallas, Texas, American Association of Stratigraphic Palynolo-gists Foundation, v. 1, p. 51–80.
Knoll, A. H., Hayes, J. M., Kaufman, A. J., Swett, K., and Lambert, I. B., 1986, Secular variation in carbonisotope ratios from Upper Proterozoic successions of Svalbard and East Greenland: Nature, v. 321,p. 832 - 838.
Lenton, T. M., and Watson, A. J., 2000a, Redfield revisited 1. Regulation of nitrate, phosphate, and oxygen inthe ocean: Global Biogeochemical Cycles, v. 14, p. 225–248.
–––––– 2000b, Redfield revisited 2. What regulates the oxygen content of the atmosphere?: Global Biogeo-chemical Cycles, v. 14, p. 249–268.
Martin, J. H., Knauer, G. A., Karl, D. M., and Broenkow, W. W., 1987, VERTEX: carbon cycling in thenortheast Pacific: Deep-Sea Research, v. 34, p. 267–285.
Ohki, K., Rueter, J. G., and Fujita, Y., 1986, Cultures of the cyanophytes Trichodesmium erythraeum and T.thiebautii in a synthetic medium: Marine Biology, v. 91, p. 9–13.
Ohki, K., Zehr, J. P., Falkowski, P. G., and Fujita, F., 1991, Regulation of nitrogen fixation by differentnitrogen sources in the marine non-heterocystous cyanobacterium Trichodesmium sp. NIBB 1067:Archives of Microbiology, v. 156, p. 335–337.
Papineau, D., Mojzsis, S. J., Kahru, J. A., and Marty, B., 2005, Nitrogen isotopic composition of ammoniatedphyllosilicates: case studies from Precambrian metamorphosed sedimentary rocks: Chemical Geology,v. 216, p. 37–58.
Press, W. H., Teukolsky, S. A., Vetterling, W. T., and Flannery, B. P., 2002, Numerical Recipes in C��,Second Edition: New York, Cambridge University Press, 1002 p.
Suess, E., 1980, Particulate organic carbon flux in the oceans-surface productivity and oxygen utilization:Nature, v. 288, p. 260–263.
Summons, R. E., Jahnke, L. L., Hope, J. M., and Logan, G. A., 1999, 2-Methylhopanoids as biomarkers forcyanobacterial oxygenic photosynthesis: Nature, v. 400, p. 554 - 557.
Toggweiler, J. R., and Sarmiento, J. L., 1985, Glacial to interglacial changes in atmospheric carbon dioxide:The critical role of ocean surface water at high latitudes, in Sundquist, E., and Broecker, W. S., editors,The Carbon Cycle and Atmospheric CO2: Natural variations Archean to Present: American GeophysicalUnion, Geophysical Monograph, n. 52, p. 163–184.
Walker, J. C. G., Klein, C., Schidlowski, M., Schopf, J. W., Stevenson, D. J., and Walter, M. R., 1983,Environmental evolution of the Archean—Early Proterozoic earth, in Schopf, J. W., editor, Earth’searliest biosphere: Its origin and evolution: Princeton, Princeton University Press, p. 260–290.
545carbon and oxygen cycles in the Proterozoic ocean
Related Documents