arXiv:0911.4592v1 [astro-ph.SR] 24 Nov 2009 Mon. Not. R. Astron. Soc. 000, 1–?? (2009) Printed 24 November 2009 (MN L A T E X style file v2.2) The circumstellar disk, envelope, and bi-polar outflow of the Massive Young Stellar Object W33A Ben Davies 1,2 , Stuart L. Lumsden 1 , Melvin G. Hoare 1 , Ren´ e D. Oudmaijer 1 , Willem-Jan de Wit 1 1 School of Physics & Astronomy, University of Leeds, Woodhouse Lane, Leeds LS2 9JT, UK 2 Chester F. Carlson Center for Imaging Science, Rochester Institute of Technology, 54 Lomb Memorial Drive, Rochester, NY 14623, USA Accepted ... Received ... ABSTRACT The Young Stellar Object (YSO) W33A is one of the best known examples of a massive star still in the process of forming. Here we present Gemini North ALTAIR/NIFS laser- guide star adaptive-optics assisted K-band integral-field spectroscopy of W33A and its inner reflection nebula. In our data we make the first detections of a rotationally- flattened outer envelope and fast bi-polar jet of a massive YSO at near-infrared wave- lengths. The predominant spectral features observed are Br γ ,H 2 , and a combination of emission and absorption from CO gas. We perform a 3-D spectro-astrometric anal- ysis of the line emission, the first study of its kind. We find that the object’s Br γ emission reveals evidence for a fast bi-polar jet on sub-milliarcsecond scales, which is aligned with the larger-scale outflow. The hybrid CO features can be explained as a combination of hot CO emission arising in a disk close to the central star, while cold CO absorption originates in the cooler outer envelope. Kinematic analysis of these features reveals that both structures are rotating, and consistent with being aligned perpendicularly to both the ionised jet and the large-scale outflow. Assuming Kep- lerian rotation, we find that the circumstellar disk orbits a central mass of ∼ >10M ⊙ , while the outer envelope encloses a mass of ∼15M ⊙ . Our results suggest a scenario of a central star accreting material from a circumstellar disk at the centre of a cool extended rotating torus, while driving a fast bi-polar wind. These results therefore provide strong supporting evidence for the hypothesis that the formation mechanism for high-mass stars is qualitatively similar to that of low-mass stars. Key words: ISM: individual: W33a – stars: pre-main-sequence – ISM: Hii regions 1 INTRODUCTION It is still unclear how massive stars (M⋆ ∼ > 8M⊙) are formed. This is due in part to the rapid formation timescales of such stars ( ∼ < 10 5 yrs), which mean that the star can reach the main-sequence (MS) while it is still heavily embedded in its natal molecular cloud. Also, it is still unknown how a mas- sive protostar can continue to accrete despite the emmense outward radiation pressure it exerts on its surroundings (for reviews of massive star formation see e.g. Beuther et al. 2007; Hoare et al. 2007). It has been suggested that massive stars may form through a mechanism similar to that of lower mass stars, whereby matter is accreted from a circumstellar disk, with the outward radiative force escaping via the poles and driv- ing a fast bipolar wind. Several numerical studies have succeeded in creating stars with masses ∼ >30M⊙this way (e.g. Yorke & Sonnhalter 2002; Krumholz et al. 2009), while it has been shown that the fast bipolar winds should strongly influence the infalling material from the envelope (Parkin et al. 2009). The observational evidence to sup- port this scenario however is limited and circumstantial. The CO bandhead emission at 2.3μm has been modelled as arising in a circumstellar disk (e.g. Chandler et al. 1993, 1995; Bik & Thi 2004a; Blum et al. 2004); large-scale bi- polar outflows have been observed to originate from heavily embedded objects (e.g. Beuther et al. 2002); and some au- thors have found evidence of accretion disks in individual massive protostars (Patel et al. 2005; Beltr´an et al. 2006; Torrelles et al. 2007). Massive Young Stellar Objects (MYSOs) are thought to represent the phase in a massive star’s formation imme- diately before the star reaches the main-sequence (MS) but whilst it is still accreting, and as such are important objects with which to study the formation of massive stars. W33A

Welcome message from author
This document is posted to help you gain knowledge. Please leave a comment to let me know what you think about it! Share it to your friends and learn new things together.
Transcript
arX
iv:0
911.
4592
v1 [
astr
o-ph
.SR
] 2
4 N
ov 2
009
Mon. Not. R. Astron. Soc. 000, 1–?? (2009) Printed 24 November 2009 (MN LATEX style file v2.2)
The circumstellar disk, envelope, and bi-polar outflow of
the Massive Young Stellar Object W33A
Ben Davies1,2, Stuart L. Lumsden1, Melvin G. Hoare1, Rene D. Oudmaijer1,
Willem-Jan de Wit11School of Physics & Astronomy, University of Leeds, Woodhouse Lane, Leeds LS2 9JT, UK2Chester F. Carlson Center for Imaging Science, Rochester Institute of Technology, 54 Lomb Memorial Drive, Rochester,
NY 14623, USA
Accepted ... Received ...
ABSTRACT
The Young Stellar Object (YSO) W33A is one of the best known examples of a massivestar still in the process of forming. Here we present Gemini North ALTAIR/NIFS laser-guide star adaptive-optics assisted K-band integral-field spectroscopy of W33A andits inner reflection nebula. In our data we make the first detections of a rotationally-flattened outer envelope and fast bi-polar jet of a massive YSO at near-infrared wave-lengths. The predominant spectral features observed are Br γ, H2, and a combinationof emission and absorption from CO gas. We perform a 3-D spectro-astrometric anal-ysis of the line emission, the first study of its kind. We find that the object’s Br γemission reveals evidence for a fast bi-polar jet on sub-milliarcsecond scales, which isaligned with the larger-scale outflow. The hybrid CO features can be explained as acombination of hot CO emission arising in a disk close to the central star, while coldCO absorption originates in the cooler outer envelope. Kinematic analysis of thesefeatures reveals that both structures are rotating, and consistent with being alignedperpendicularly to both the ionised jet and the large-scale outflow. Assuming Kep-lerian rotation, we find that the circumstellar disk orbits a central mass of
∼>10M⊙,
while the outer envelope encloses a mass of ∼15M⊙. Our results suggest a scenarioof a central star accreting material from a circumstellar disk at the centre of a coolextended rotating torus, while driving a fast bi-polar wind. These results thereforeprovide strong supporting evidence for the hypothesis that the formation mechanismfor high-mass stars is qualitatively similar to that of low-mass stars.
Key words: ISM: individual: W33a – stars: pre-main-sequence – ISM: Hii regions
1 INTRODUCTION
It is still unclear how massive stars (M⋆∼> 8M⊙) are formed.This is due in part to the rapid formation timescales of suchstars (∼< 105yrs), which mean that the star can reach themain-sequence (MS) while it is still heavily embedded in itsnatal molecular cloud. Also, it is still unknown how a mas-sive protostar can continue to accrete despite the emmenseoutward radiation pressure it exerts on its surroundings (forreviews of massive star formation see e.g. Beuther et al.2007; Hoare et al. 2007).
It has been suggested that massive stars may formthrough a mechanism similar to that of lower mass stars,whereby matter is accreted from a circumstellar disk, withthe outward radiative force escaping via the poles and driv-ing a fast bipolar wind. Several numerical studies havesucceeded in creating stars with masses ∼>30M⊙this way(e.g. Yorke & Sonnhalter 2002; Krumholz et al. 2009), while
it has been shown that the fast bipolar winds shouldstrongly influence the infalling material from the envelope(Parkin et al. 2009). The observational evidence to sup-port this scenario however is limited and circumstantial.The CO bandhead emission at 2.3µm has been modelledas arising in a circumstellar disk (e.g. Chandler et al. 1993,1995; Bik & Thi 2004a; Blum et al. 2004); large-scale bi-polar outflows have been observed to originate from heavilyembedded objects (e.g. Beuther et al. 2002); and some au-thors have found evidence of accretion disks in individualmassive protostars (Patel et al. 2005; Beltran et al. 2006;Torrelles et al. 2007).
Massive Young Stellar Objects (MYSOs) are thoughtto represent the phase in a massive star’s formation imme-diately before the star reaches the main-sequence (MS) butwhilst it is still accreting, and as such are important objectswith which to study the formation of massive stars. W33A
2 B. Davies et al.
1.0 0.5 0.0 -0.5RA Offset (arcmin)
-1.0
-0.5
0.0
0.5
DE
C O
ffse
t (a
rcm
in)
Centre = 18 14 39.3 -17 52 06.70.0
0.2
0.4
0.6
0.8
1.0
1.2
1.4
1.6
1.8
2.0
2.2
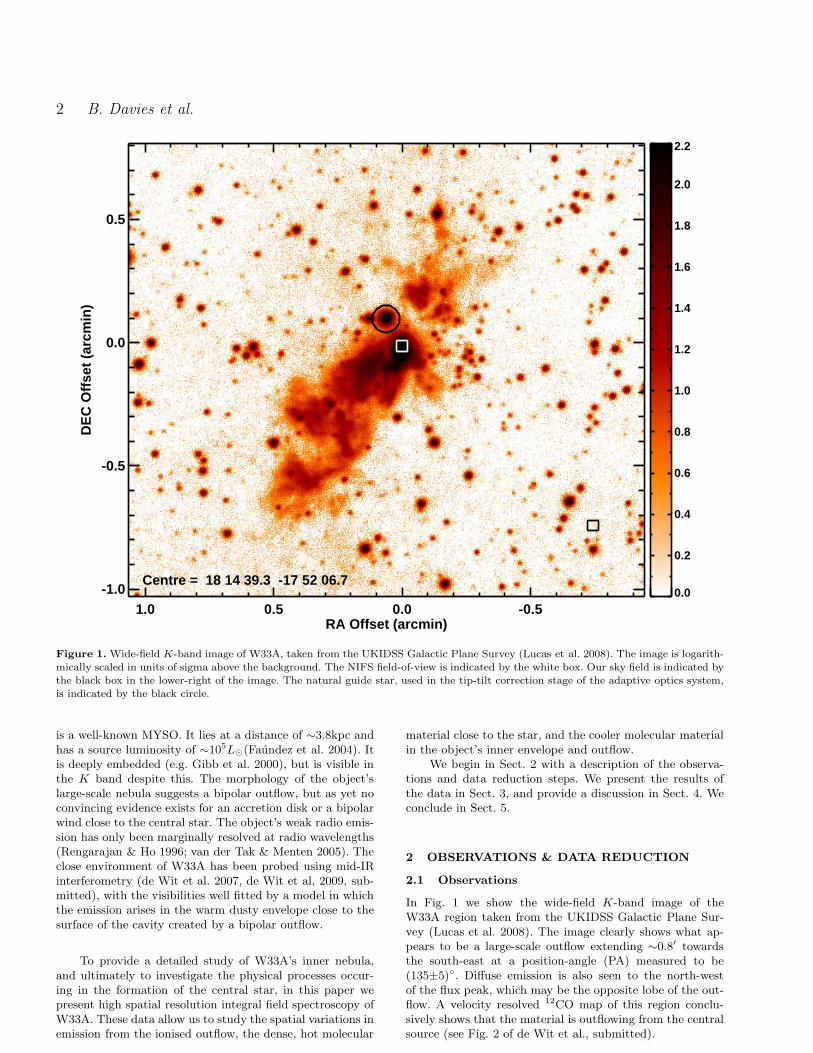
Figure 1. Wide-field K-band image of W33A, taken from the UKIDSS Galactic Plane Survey (Lucas et al. 2008). The image is logarith-mically scaled in units of sigma above the background. The NIFS field-of-view is indicated by the white box. Our sky field is indicated bythe black box in the lower-right of the image. The natural guide star, used in the tip-tilt correction stage of the adaptive optics system,is indicated by the black circle.
is a well-known MYSO. It lies at a distance of ∼3.8kpc andhas a source luminosity of ∼105L⊙(Faundez et al. 2004). Itis deeply embedded (e.g. Gibb et al. 2000), but is visible inthe K band despite this. The morphology of the object’slarge-scale nebula suggests a bipolar outflow, but as yet noconvincing evidence exists for an accretion disk or a bipolarwind close to the central star. The object’s weak radio emis-sion has only been marginally resolved at radio wavelengths(Rengarajan & Ho 1996; van der Tak & Menten 2005). Theclose environment of W33A has been probed using mid-IRinterferometry (de Wit et al. 2007, de Wit et al, 2009, sub-mitted), with the visibilities well fitted by a model in whichthe emission arises in the warm dusty envelope close to thesurface of the cavity created by a bipolar outflow.
To provide a detailed study of W33A’s inner nebula,and ultimately to investigate the physical processes occur-ing in the formation of the central star, in this paper wepresent high spatial resolution integral field spectroscopy ofW33A. These data allow us to study the spatial variations inemission from the ionised outflow, the dense, hot molecular
material close to the star, and the cooler molecular materialin the object’s inner envelope and outflow.
We begin in Sect. 2 with a description of the observa-tions and data reduction steps. We present the results ofthe data in Sect. 3, and provide a discussion in Sect. 4. Weconclude in Sect. 5.
2 OBSERVATIONS & DATA REDUCTION
2.1 Observations
In Fig. 1 we show the wide-field K-band image of theW33A region taken from the UKIDSS Galactic Plane Sur-vey (Lucas et al. 2008). The image clearly shows what ap-pears to be a large-scale outflow extending ∼0.8′ towardsthe south-east at a position-angle (PA) measured to be(135±5)◦. Diffuse emission is also seen to the north-westof the flux peak, which may be the opposite lobe of the out-flow. A velocity resolved 12CO map of this region conclu-sively shows that the material is outflowing from the centralsource (see Fig. 2 of de Wit et al., submitted).
The disk, envelope & outflow of W33A 3
Our data were taken using the Gemini Near-infraredIntegral Field Spectrograph (NIFS, McGregor et al. 2003)on the nights of 16 April and 25 May 2008. The observationswere pointed such that the bright flux centre was at thenorthern edge of the instrument field-of-view, in order toobtain data on the base of the outflow as well as the centralsource. The instrument applies the image-slicing techniqueto separate the 3′′×3′′ field-of-view into 29 slices, which arethen aligned on the detector and passed through a diffractiongrating. We employed the K grating in combination withthe HK filter and central wavelength set at 2.2µm. Thissetup achieved a spectral resolution of R ≈ 5300 over thewavelength range 2.0-2.4µm across the full NIFS field-of-view.
Our observations made use of the Gemini ALTAIRlaser-guide star (LGS) adaptive optics system. The systemuses a natural guide star for tip-tilt correction, and the laserguide star for wavefront sensing. For tip-tilt correction weused the star 2UCAC-25155527, which has mUC = 14.6 andis located 6.9′′ from the centre of our field-of-view (see Fig.1).
The observational strategy involved observing the tar-get and neighbouring sky in an ABBA pattern, the locationof the sky field is shown in Fig. 1. The integration time perindividual observation was 180s, with each integration read-out in the faint mode setting of 16 non-destructive reads.A total of 7 separate integrations were used, giving a totalintegration time of ∼20mins. In addition to the science tar-get, we observed the A0 V double HR6798 to characterizethe telluric absorption. The GCAL calibration unit was usedto take continuum lamp observations plus associated darkframes for flat-fielding purposes. Argon-Xenon arc exposureswere obtained for wavelength calibration, as well as ronchiflats which are used to characterize the spatial distortion ofNIFS data.
2.2 Data reduction
The preliminary stages of data-reduction were done usingthe Gemini instrument-specific pipeline which runs on theiraf platform. Science observations had their associated skyframes subtracted to remove the dark current and sky emis-sion lines. The data were then divided through by the nor-malized flat-field to correct for pixel-to-pixel variations insensitivity, and any bad pixels flagged in the earlier reduc-tion steps were interpolated over. The arc and ronchi flatframes were used to derive the transformation matrix of the2-dimensional ‘sliced’ image onto a 3-dimensional (x, y, λ)datacube. The application of this transformation rectifiesthe data both spatially and spectrally, and it is at this stepthat the wavelength calibration is applied.
Removal of telluric absorption and combination of theindividual datacubes was done in IDL, using custom-writtenroutines and the GSFC IDL library1. Correction for the Br γabsorption in the telluric standard was done by dividingthrough by a synthetic AO V template spectrum, interac-tively altering the centroid and absorption strength of theBr γ feature in the template until a satisfactory match to
1 http://idlastro.gsfc.nasa.gov
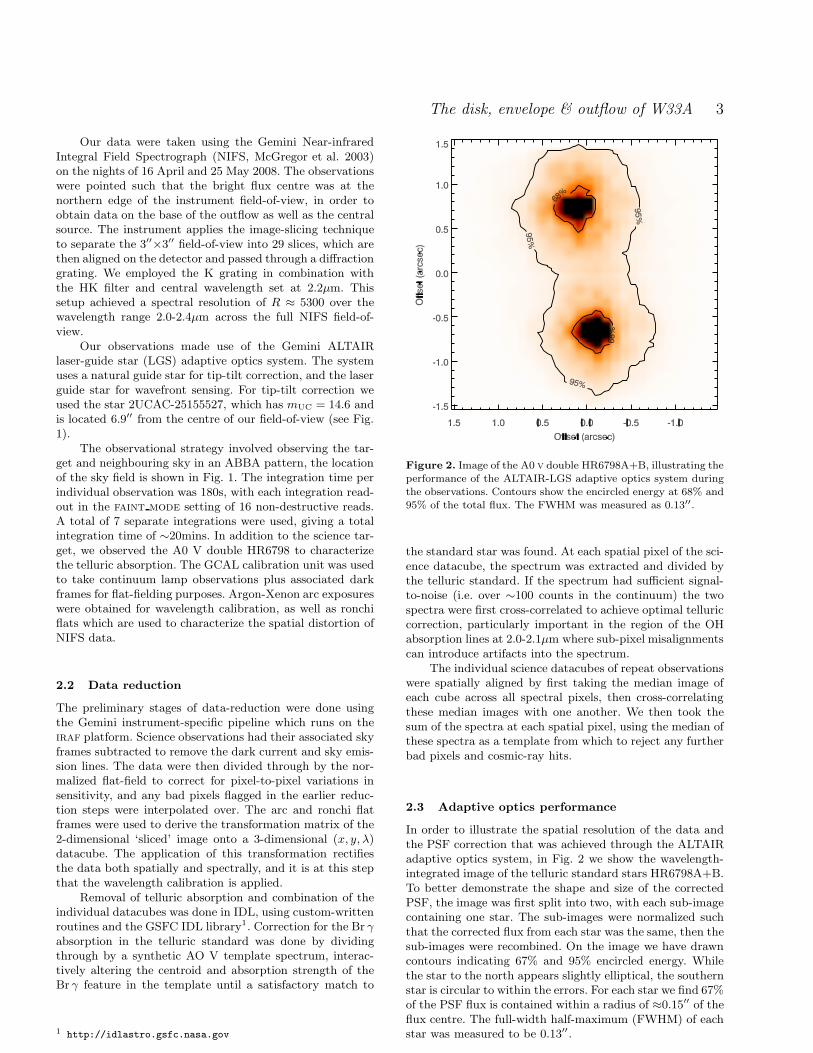
Figure 2. Image of the A0 v double HR6798A+B, illustrating theperformance of the ALTAIR-LGS adaptive optics system duringthe observations. Contours show the encircled energy at 68% and95% of the total flux. The FWHM was measured as 0.13′′.
the standard star was found. At each spatial pixel of the sci-ence datacube, the spectrum was extracted and divided bythe telluric standard. If the spectrum had sufficient signal-to-noise (i.e. over ∼100 counts in the continuum) the twospectra were first cross-correlated to achieve optimal telluriccorrection, particularly important in the region of the OHabsorption lines at 2.0-2.1µm where sub-pixel misalignmentscan introduce artifacts into the spectrum.
The individual science datacubes of repeat observationswere spatially aligned by first taking the median image ofeach cube across all spectral pixels, then cross-correlatingthese median images with one another. We then took thesum of the spectra at each spatial pixel, using the median ofthese spectra as a template from which to reject any furtherbad pixels and cosmic-ray hits.
2.3 Adaptive optics performance
In order to illustrate the spatial resolution of the data andthe PSF correction that was achieved through the ALTAIRadaptive optics system, in Fig. 2 we show the wavelength-integrated image of the telluric standard stars HR6798A+B.To better demonstrate the shape and size of the correctedPSF, the image was first split into two, with each sub-imagecontaining one star. The sub-images were normalized suchthat the corrected flux from each star was the same, then thesub-images were recombined. On the image we have drawncontours indicating 67% and 95% encircled energy. Whilethe star to the north appears slightly elliptical, the southernstar is circular to within the errors. For each star we find 67%of the PSF flux is contained within a radius of ≈0.15′′ of theflux centre. The full-width half-maximum (FWHM) of eachstar was measured to be 0.13′′.
4 B. Davies et al.
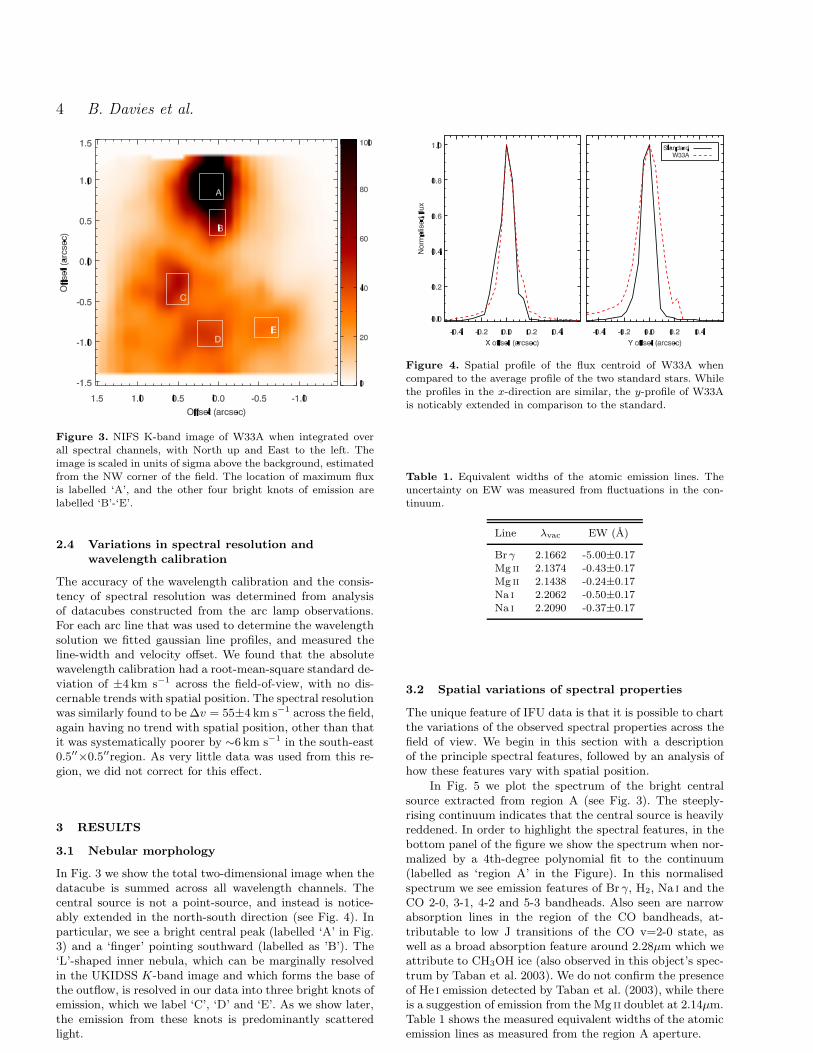
Figure 3. NIFS K-band image of W33A when integrated overall spectral channels, with North up and East to the left. Theimage is scaled in units of sigma above the background, estimatedfrom the NW corner of the field. The location of maximum fluxis labelled ‘A’, and the other four bright knots of emission arelabelled ‘B’-‘E’.
2.4 Variations in spectral resolution and
wavelength calibration
The accuracy of the wavelength calibration and the consis-tency of spectral resolution was determined from analysisof datacubes constructed from the arc lamp observations.For each arc line that was used to determine the wavelengthsolution we fitted gaussian line profiles, and measured theline-width and velocity offset. We found that the absolutewavelength calibration had a root-mean-square standard de-viation of ±4km s−1 across the field-of-view, with no dis-cernable trends with spatial position. The spectral resolutionwas similarly found to be ∆v = 55±4 km s−1 across the field,again having no trend with spatial position, other than thatit was systematically poorer by ∼6 km s−1 in the south-east0.5′′×0.5′′region. As very little data was used from this re-gion, we did not correct for this effect.
3 RESULTS
3.1 Nebular morphology
In Fig. 3 we show the total two-dimensional image when thedatacube is summed across all wavelength channels. Thecentral source is not a point-source, and instead is notice-ably extended in the north-south direction (see Fig. 4). Inparticular, we see a bright central peak (labelled ‘A’ in Fig.3) and a ‘finger’ pointing southward (labelled as ’B’). The‘L’-shaped inner nebula, which can be marginally resolvedin the UKIDSS K-band image and which forms the base ofthe outflow, is resolved in our data into three bright knots ofemission, which we label ‘C’, ‘D’ and ‘E’. As we show later,the emission from these knots is predominantly scatteredlight.
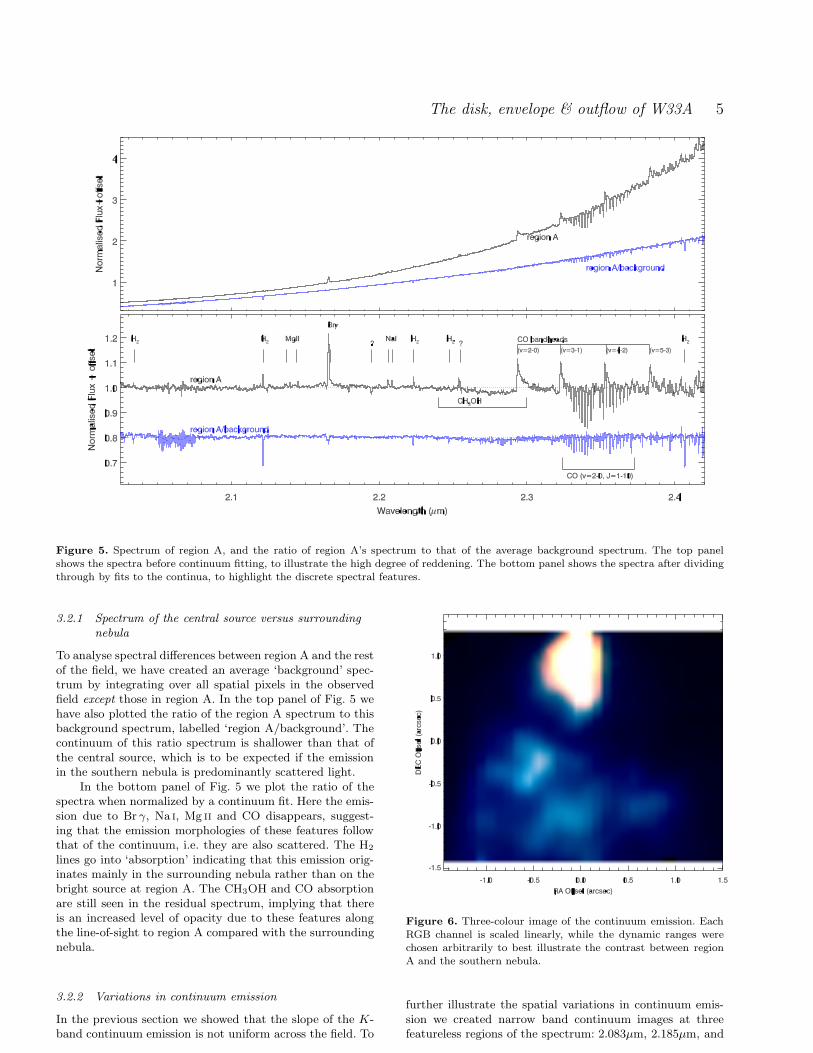
Figure 4. Spatial profile of the flux centroid of W33A whencompared to the average profile of the two standard stars. Whilethe profiles in the x-direction are similar, the y-profile of W33Ais noticably extended in comparison to the standard.
Table 1. Equivalent widths of the atomic emission lines. Theuncertainty on EW was measured from fluctuations in the con-tinuum.
Line λvac EW (A)
Br γ 2.1662 -5.00±0.17Mg ii 2.1374 -0.43±0.17Mg ii 2.1438 -0.24±0.17Na i 2.2062 -0.50±0.17Na i 2.2090 -0.37±0.17
3.2 Spatial variations of spectral properties
The unique feature of IFU data is that it is possible to chartthe variations of the observed spectral properties across thefield of view. We begin in this section with a descriptionof the principle spectral features, followed by an analysis ofhow these features vary with spatial position.
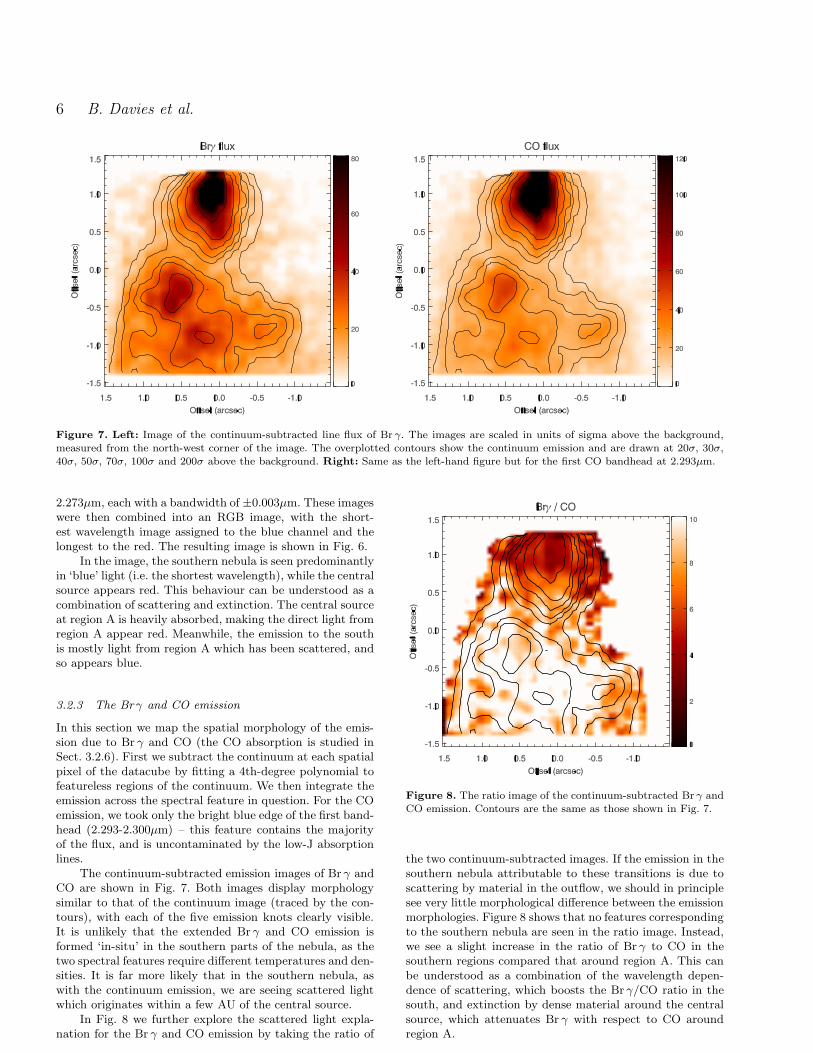
In Fig. 5 we plot the spectrum of the bright centralsource extracted from region A (see Fig. 3). The steeply-rising continuum indicates that the central source is heavilyreddened. In order to highlight the spectral features, in thebottom panel of the figure we show the spectrum when nor-malized by a 4th-degree polynomial fit to the continuum(labelled as ‘region A’ in the Figure). In this normalisedspectrum we see emission features of Br γ, H2, Na i and theCO 2-0, 3-1, 4-2 and 5-3 bandheads. Also seen are narrowabsorption lines in the region of the CO bandheads, at-tributable to low J transitions of the CO v=2-0 state, aswell as a broad absorption feature around 2.28µm which weattribute to CH3OH ice (also observed in this object’s spec-trum by Taban et al. 2003). We do not confirm the presenceof He i emission detected by Taban et al. (2003), while thereis a suggestion of emission from the Mg ii doublet at 2.14µm.Table 1 shows the measured equivalent widths of the atomicemission lines as measured from the region A aperture.
The disk, envelope & outflow of W33A 5
Figure 5. Spectrum of region A, and the ratio of region A’s spectrum to that of the average background spectrum. The top panelshows the spectra before continuum fitting, to illustrate the high degree of reddening. The bottom panel shows the spectra after dividingthrough by fits to the continua, to highlight the discrete spectral features.
3.2.1 Spectrum of the central source versus surrounding
nebula
To analyse spectral differences between region A and the restof the field, we have created an average ‘background’ spec-trum by integrating over all spatial pixels in the observedfield except those in region A. In the top panel of Fig. 5 wehave also plotted the ratio of the region A spectrum to thisbackground spectrum, labelled ‘region A/background’. Thecontinuum of this ratio spectrum is shallower than that ofthe central source, which is to be expected if the emissionin the southern nebula is predominantly scattered light.
In the bottom panel of Fig. 5 we plot the ratio of thespectra when normalized by a continuum fit. Here the emis-sion due to Br γ, Na i, Mg ii and CO disappears, suggest-ing that the emission morphologies of these features followthat of the continuum, i.e. they are also scattered. The H2
lines go into ‘absorption’ indicating that this emission orig-inates mainly in the surrounding nebula rather than on thebright source at region A. The CH3OH and CO absorptionare still seen in the residual spectrum, implying that thereis an increased level of opacity due to these features alongthe line-of-sight to region A compared with the surroundingnebula.
3.2.2 Variations in continuum emission
In the previous section we showed that the slope of the K-band continuum emission is not uniform across the field. To
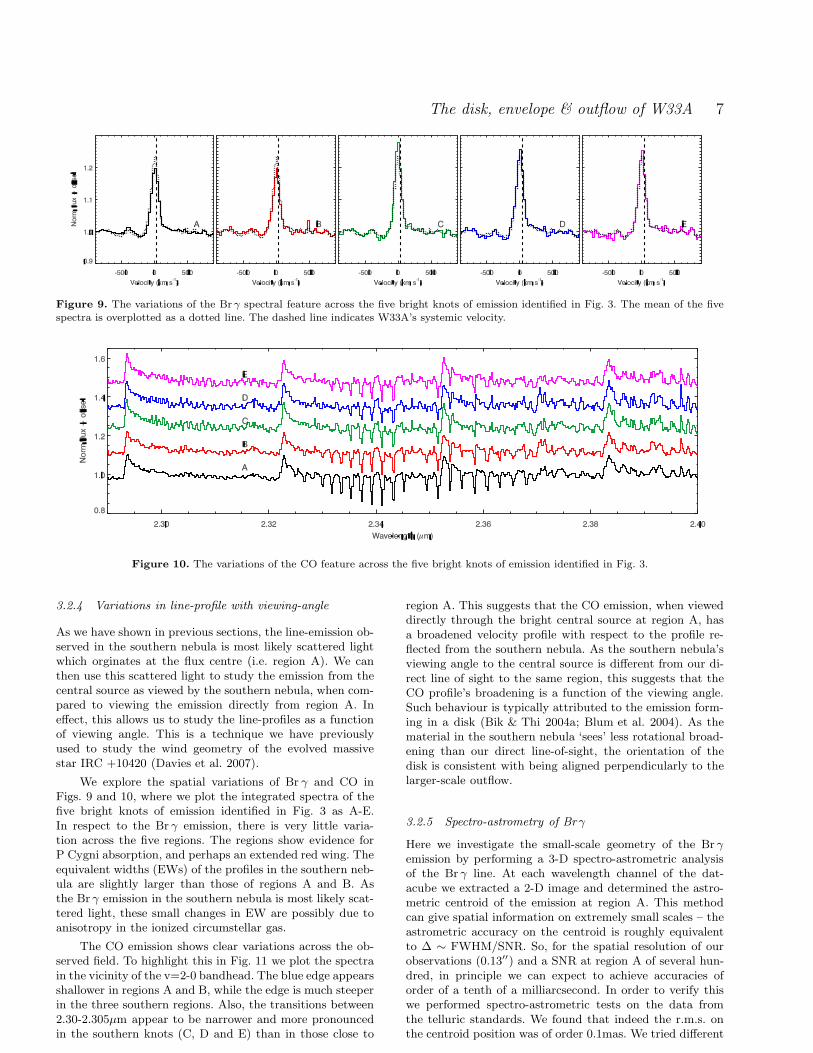
Figure 6. Three-colour image of the continuum emission. EachRGB channel is scaled linearly, while the dynamic ranges werechosen arbitrarily to best illustrate the contrast between regionA and the southern nebula.
further illustrate the spatial variations in continuum emis-sion we created narrow band continuum images at threefeatureless regions of the spectrum: 2.083µm, 2.185µm, and
6 B. Davies et al.
Figure 7. Left: Image of the continuum-subtracted line flux of Br γ. The images are scaled in units of sigma above the background,measured from the north-west corner of the image. The overplotted contours show the continuum emission and are drawn at 20σ, 30σ,40σ, 50σ, 70σ, 100σ and 200σ above the background. Right: Same as the left-hand figure but for the first CO bandhead at 2.293µm.
2.273µm, each with a bandwidth of ±0.003µm. These imageswere then combined into an RGB image, with the short-est wavelength image assigned to the blue channel and thelongest to the red. The resulting image is shown in Fig. 6.
In the image, the southern nebula is seen predominantlyin ‘blue’ light (i.e. the shortest wavelength), while the centralsource appears red. This behaviour can be understood as acombination of scattering and extinction. The central sourceat region A is heavily absorbed, making the direct light fromregion A appear red. Meanwhile, the emission to the southis mostly light from region A which has been scattered, andso appears blue.
3.2.3 The Br γ and CO emission
In this section we map the spatial morphology of the emis-sion due to Br γ and CO (the CO absorption is studied inSect. 3.2.6). First we subtract the continuum at each spatialpixel of the datacube by fitting a 4th-degree polynomial tofeatureless regions of the continuum. We then integrate theemission across the spectral feature in question. For the COemission, we took only the bright blue edge of the first band-head (2.293-2.300µm) – this feature contains the majorityof the flux, and is uncontaminated by the low-J absorptionlines.
The continuum-subtracted emission images of Br γ andCO are shown in Fig. 7. Both images display morphologysimilar to that of the continuum image (traced by the con-tours), with each of the five emission knots clearly visible.It is unlikely that the extended Br γ and CO emission isformed ‘in-situ’ in the southern parts of the nebula, as thetwo spectral features require different temperatures and den-sities. It is far more likely that in the southern nebula, aswith the continuum emission, we are seeing scattered lightwhich originates within a few AU of the central source.
In Fig. 8 we further explore the scattered light expla-nation for the Br γ and CO emission by taking the ratio of
Figure 8. The ratio image of the continuum-subtracted Br γ andCO emission. Contours are the same as those shown in Fig. 7.
the two continuum-subtracted images. If the emission in thesouthern nebula attributable to these transitions is due toscattering by material in the outflow, we should in principlesee very little morphological difference between the emissionmorphologies. Figure 8 shows that no features correspondingto the southern nebula are seen in the ratio image. Instead,we see a slight increase in the ratio of Br γ to CO in thesouthern regions compared that around region A. This canbe understood as a combination of the wavelength depen-dence of scattering, which boosts the Br γ/CO ratio in thesouth, and extinction by dense material around the centralsource, which attenuates Br γ with respect to CO aroundregion A.
The disk, envelope & outflow of W33A 7
Figure 9. The variations of the Br γ spectral feature across the five bright knots of emission identified in Fig. 3. The mean of the fivespectra is overplotted as a dotted line. The dashed line indicates W33A’s systemic velocity.
Figure 10. The variations of the CO feature across the five bright knots of emission identified in Fig. 3.
3.2.4 Variations in line-profile with viewing-angle
As we have shown in previous sections, the line-emission ob-served in the southern nebula is most likely scattered lightwhich orginates at the flux centre (i.e. region A). We canthen use this scattered light to study the emission from thecentral source as viewed by the southern nebula, when com-pared to viewing the emission directly from region A. Ineffect, this allows us to study the line-profiles as a functionof viewing angle. This is a technique we have previouslyused to study the wind geometry of the evolved massivestar IRC +10420 (Davies et al. 2007).
We explore the spatial variations of Br γ and CO inFigs. 9 and 10, where we plot the integrated spectra of thefive bright knots of emission identified in Fig. 3 as A-E.In respect to the Br γ emission, there is very little varia-tion across the five regions. The regions show evidence forP Cygni absorption, and perhaps an extended red wing. Theequivalent widths (EWs) of the profiles in the southern neb-ula are slightly larger than those of regions A and B. Asthe Br γ emission in the southern nebula is most likely scat-tered light, these small changes in EW are possibly due toanisotropy in the ionized circumstellar gas.
The CO emission shows clear variations across the ob-served field. To highlight this in Fig. 11 we plot the spectrain the vicinity of the v=2-0 bandhead. The blue edge appearsshallower in regions A and B, while the edge is much steeperin the three southern regions. Also, the transitions between2.30-2.305µm appear to be narrower and more pronouncedin the southern knots (C, D and E) than in those close to
region A. This suggests that the CO emission, when vieweddirectly through the bright central source at region A, hasa broadened velocity profile with respect to the profile re-flected from the southern nebula. As the southern nebula’sviewing angle to the central source is different from our di-rect line of sight to the same region, this suggests that theCO profile’s broadening is a function of the viewing angle.Such behaviour is typically attributed to the emission form-ing in a disk (Bik & Thi 2004a; Blum et al. 2004). As thematerial in the southern nebula ‘sees’ less rotational broad-ening than our direct line-of-sight, the orientation of thedisk is consistent with being aligned perpendicularly to thelarger-scale outflow.
3.2.5 Spectro-astrometry of Br γ
Here we investigate the small-scale geometry of the Br γemission by performing a 3-D spectro-astrometric analysisof the Br γ line. At each wavelength channel of the dat-acube we extracted a 2-D image and determined the astro-metric centroid of the emission at region A. This methodcan give spatial information on extremely small scales – theastrometric accuracy on the centroid is roughly equivalentto ∆ ∼ FWHM/SNR. So, for the spatial resolution of ourobservations (0.13′′) and a SNR at region A of several hun-dred, in principle we can expect to achieve accuracies oforder of a tenth of a milliarcsecond. In order to verify thiswe performed spectro-astrometric tests on the data fromthe telluric standards. We found that indeed the r.m.s. onthe centroid position was of order 0.1mas. We tried different
8 B. Davies et al.
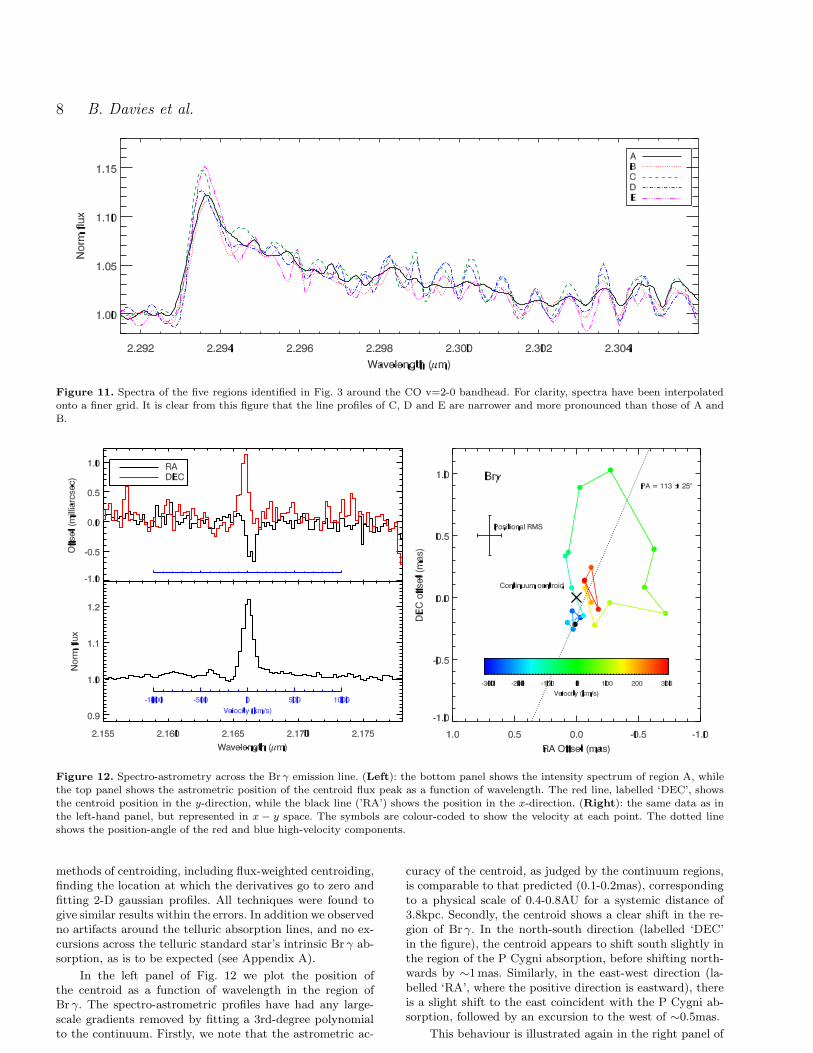
Figure 11. Spectra of the five regions identified in Fig. 3 around the CO v=2-0 bandhead. For clarity, spectra have been interpolatedonto a finer grid. It is clear from this figure that the line profiles of C, D and E are narrower and more pronounced than those of A andB.
Figure 12. Spectro-astrometry across the Br γ emission line. (Left): the bottom panel shows the intensity spectrum of region A, whilethe top panel shows the astrometric position of the centroid flux peak as a function of wavelength. The red line, labelled ‘DEC’, showsthe centroid position in the y-direction, while the black line (’RA’) shows the position in the x-direction. (Right): the same data as inthe left-hand panel, but represented in x − y space. The symbols are colour-coded to show the velocity at each point. The dotted lineshows the position-angle of the red and blue high-velocity components.
methods of centroiding, including flux-weighted centroiding,finding the location at which the derivatives go to zero andfitting 2-D gaussian profiles. All techniques were found togive similar results within the errors. In addition we observedno artifacts around the telluric absorption lines, and no ex-cursions across the telluric standard star’s intrinsic Br γ ab-sorption, as is to be expected (see Appendix A).
In the left panel of Fig. 12 we plot the position ofthe centroid as a function of wavelength in the region ofBr γ. The spectro-astrometric profiles have had any large-scale gradients removed by fitting a 3rd-degree polynomialto the continuum. Firstly, we note that the astrometric ac-
curacy of the centroid, as judged by the continuum regions,is comparable to that predicted (0.1-0.2mas), correspondingto a physical scale of 0.4-0.8AU for a systemic distance of3.8kpc. Secondly, the centroid shows a clear shift in the re-gion of Br γ. In the north-south direction (labelled ‘DEC’in the figure), the centroid appears to shift south slightly inthe region of the P Cygni absorption, before shifting north-wards by ∼1mas. Similarly, in the east-west direction (la-belled ‘RA’, where the positive direction is eastward), thereis a slight shift to the east coincident with the P Cygni ab-sorption, followed by an excursion to the west of ∼0.5mas.
This behaviour is illustrated again in the right panel of
The disk, envelope & outflow of W33A 9
Fig. 12. This time, the centroid is plotted in RA-DEC spacewith colour-coded symbols to indicate the velocity of eachpoint. The location of the continuum centroid is illustratedby the cross. The plot shows that the emission with thelargest red-shifted velocities (∼400 km s−1) is located to thenorth-west of the continuum location, while the emissionblue-shifted by a similar amount is located to the south-east of the continuum, indicating expansion. From analysisof those points with speeds between 300-400 km s−1 we findthat the statistical significance of the red- and blue-shiftedpoints being spatially separated from the continuum is 2.8σand 4.1σ respectively. In addition to this behaviour thereis a large excursion across the centre of the line with |v| <100 km s−1.
The observed behaviour can be explained if we makethe assumption that the Br γ emission line is made up oftwo or more components. The broad high-velocity emissionoriginates in an axisymmetric structure, most likely a bi-polar jet, while the narrow low velocity emission is formedin an extended structure such as a small, dense Hii-region.The nature of this narrow emission is difficult to disentan-gle, but it is possible that it is formed in an asphericalclumpy medium with much velocity-dependent extinctionand self-absorption. This is similar to the picture deducedby Drew et al. (1993) and Bunn et al. (1995) from velocity-resolved line-profile ratios.
In addition to the detection of an outflow, the spectro-astrometric data also indicate that the bright flux maximumobserved in the integrated image is indeed the location of thecentral star.
For the broad-line component of the emission we canmeasure the PA of this structure by taking the data at300 < |v/km s−1| < 400 and taking the mean positions ofthe red- and blue-shifted components. We measure the PAof this structure to be 113±25◦ (see right panel of Fig. 12),and so is aligned with the large-scale outflow seen in Fig. 1(PA=135±5◦). From the alignment of these angles it is likelythat in this small-scale structure we are seeing the base ofa bi-polar ionized wind or jet. In addition, the blue-shiftedportion of the Br γ emission is oriented towards the south-east, consistent with the hypothesis that the outflow seenin the wide-field image is the lobe coming towards us, whilethe red-shifted lobe to the north-west is largely obscured.
The outflow velocity, as measured from Fig. 12, appearsto be around voutflow cos i ∼ 300 km s−1. Assuming an incli-nation of 60◦ (de Wit et al., 2009 submitted), this gives anoutflow velocity measured from Br γ of ∼600 km s−1. Thisis likely an underestimate of the outflow’s terminal veloc-ity, as a large fraction of the Br γ emission may form inthe accelarating part of the wind. This value is consistentwith MYSO jet velocities measured by radio proper motionstudies (Marti et al. 1998; Curiel et al. 2006).
3.2.6 The CO absorption
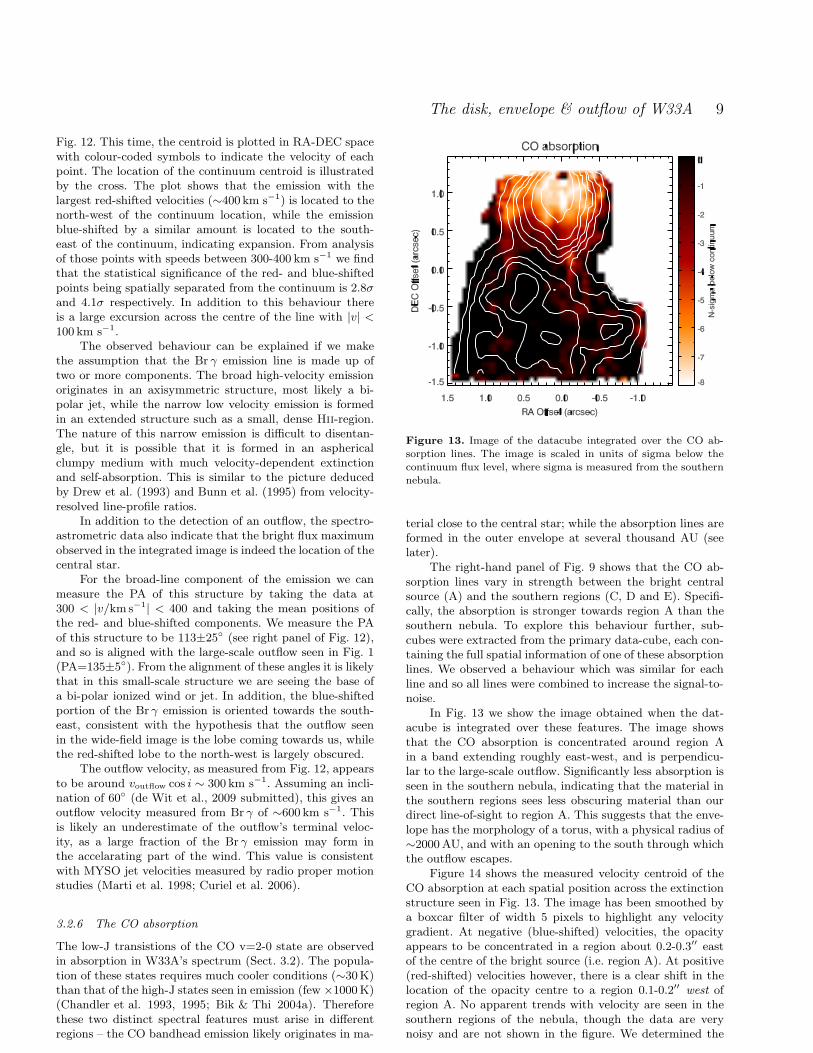
The low-J transistions of the CO v=2-0 state are observedin absorption in W33A’s spectrum (Sect. 3.2). The popula-tion of these states requires much cooler conditions (∼30K)than that of the high-J states seen in emission (few ×1000 K)(Chandler et al. 1993, 1995; Bik & Thi 2004a). Thereforethese two distinct spectral features must arise in differentregions – the CO bandhead emission likely originates in ma-
Figure 13. Image of the datacube integrated over the CO ab-sorption lines. The image is scaled in units of sigma below thecontinuum flux level, where sigma is measured from the southernnebula.
terial close to the central star; while the absorption lines areformed in the outer envelope at several thousand AU (seelater).
The right-hand panel of Fig. 9 shows that the CO ab-sorption lines vary in strength between the bright centralsource (A) and the southern regions (C, D and E). Specifi-cally, the absorption is stronger towards region A than thesouthern nebula. To explore this behaviour further, sub-cubes were extracted from the primary data-cube, each con-taining the full spatial information of one of these absorptionlines. We observed a behaviour which was similar for eachline and so all lines were combined to increase the signal-to-noise.
In Fig. 13 we show the image obtained when the dat-acube is integrated over these features. The image showsthat the CO absorption is concentrated around region Ain a band extending roughly east-west, and is perpendicu-lar to the large-scale outflow. Significantly less absorption isseen in the southern nebula, indicating that the material inthe southern regions sees less obscuring material than ourdirect line-of-sight to region A. This suggests that the enve-lope has the morphology of a torus, with a physical radius of∼2000 AU, and with an opening to the south through whichthe outflow escapes.
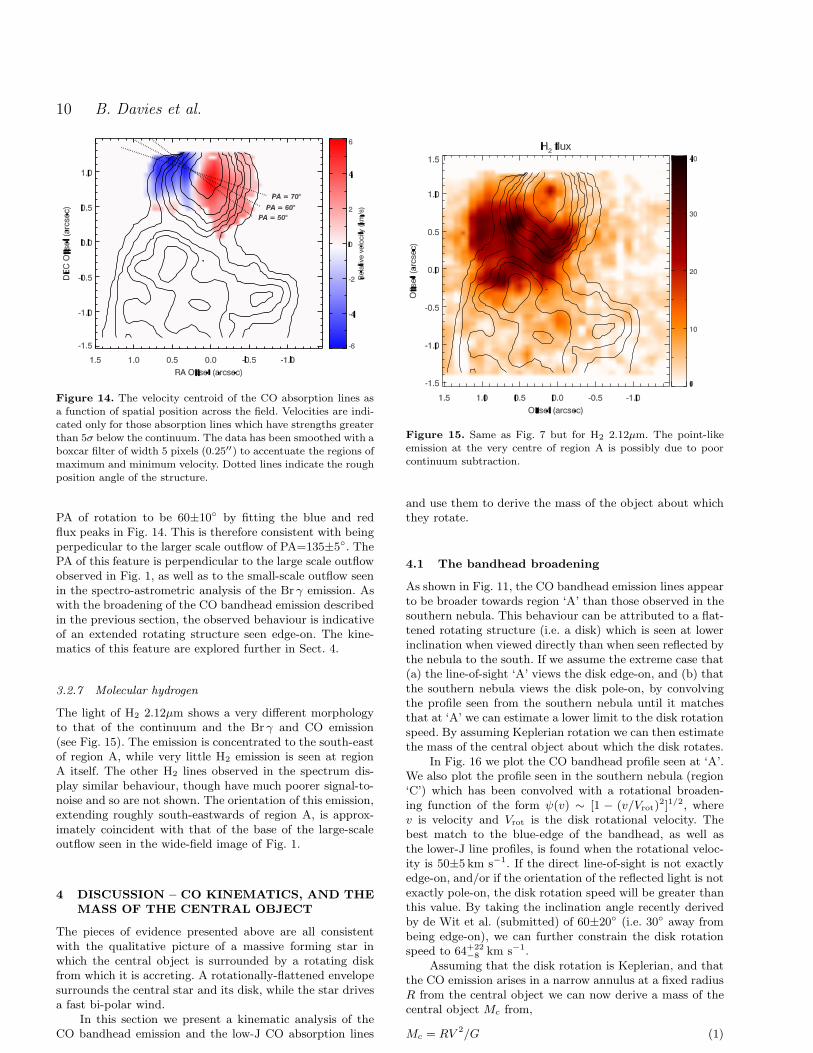
Figure 14 shows the measured velocity centroid of theCO absorption at each spatial position across the extinctionstructure seen in Fig. 13. The image has been smoothed bya boxcar filter of width 5 pixels to highlight any velocitygradient. At negative (blue-shifted) velocities, the opacityappears to be concentrated in a region about 0.2-0.3′′ eastof the centre of the bright source (i.e. region A). At positive(red-shifted) velocities however, there is a clear shift in thelocation of the opacity centre to a region 0.1-0.2′′ west ofregion A. No apparent trends with velocity are seen in thesouthern regions of the nebula, though the data are verynoisy and are not shown in the figure. We determined the
10 B. Davies et al.
Figure 14. The velocity centroid of the CO absorption lines asa function of spatial position across the field. Velocities are indi-cated only for those absorption lines which have strengths greaterthan 5σ below the continuum. The data has been smoothed with aboxcar filter of width 5 pixels (0.25′′) to accentuate the regions ofmaximum and minimum velocity. Dotted lines indicate the roughposition angle of the structure.
PA of rotation to be 60±10◦ by fitting the blue and redflux peaks in Fig. 14. This is therefore consistent with beingperpedicular to the larger scale outflow of PA=135±5◦. ThePA of this feature is perpendicular to the large scale outflowobserved in Fig. 1, as well as to the small-scale outflow seenin the spectro-astrometric analysis of the Br γ emission. Aswith the broadening of the CO bandhead emission describedin the previous section, the observed behaviour is indicativeof an extended rotating structure seen edge-on. The kine-matics of this feature are explored further in Sect. 4.
3.2.7 Molecular hydrogen
The light of H2 2.12µm shows a very different morphologyto that of the continuum and the Br γ and CO emission(see Fig. 15). The emission is concentrated to the south-eastof region A, while very little H2 emission is seen at regionA itself. The other H2 lines observed in the spectrum dis-play similar behaviour, though have much poorer signal-to-noise and so are not shown. The orientation of this emission,extending roughly south-eastwards of region A, is approx-imately coincident with that of the base of the large-scaleoutflow seen in the wide-field image of Fig. 1.
4 DISCUSSION – CO KINEMATICS, AND THE
MASS OF THE CENTRAL OBJECT
The pieces of evidence presented above are all consistentwith the qualitative picture of a massive forming star inwhich the central object is surrounded by a rotating diskfrom which it is accreting. A rotationally-flattened envelopesurrounds the central star and its disk, while the star drivesa fast bi-polar wind.
In this section we present a kinematic analysis of theCO bandhead emission and the low-J CO absorption lines
Figure 15. Same as Fig. 7 but for H2 2.12µm. The point-likeemission at the very centre of region A is possibly due to poorcontinuum subtraction.
and use them to derive the mass of the object about whichthey rotate.
4.1 The bandhead broadening
As shown in Fig. 11, the CO bandhead emission lines appearto be broader towards region ‘A’ than those observed in thesouthern nebula. This behaviour can be attributed to a flat-tened rotating structure (i.e. a disk) which is seen at lowerinclination when viewed directly than when seen reflected bythe nebula to the south. If we assume the extreme case that(a) the line-of-sight ‘A’ views the disk edge-on, and (b) thatthe southern nebula views the disk pole-on, by convolvingthe profile seen from the southern nebula until it matchesthat at ‘A’ we can estimate a lower limit to the disk rotationspeed. By assuming Keplerian rotation we can then estimatethe mass of the central object about which the disk rotates.
In Fig. 16 we plot the CO bandhead profile seen at ‘A’.We also plot the profile seen in the southern nebula (region‘C’) which has been convolved with a rotational broaden-ing function of the form ψ(v) ∼ [1 − (v/Vrot)
2]1/2, wherev is velocity and Vrot is the disk rotational velocity. Thebest match to the blue-edge of the bandhead, as well asthe lower-J line profiles, is found when the rotational veloc-ity is 50±5 km s−1. If the direct line-of-sight is not exactlyedge-on, and/or if the orientation of the reflected light is notexactly pole-on, the disk rotation speed will be greater thanthis value. By taking the inclination angle recently derivedby de Wit et al. (submitted) of 60±20◦ (i.e. 30◦ away frombeing edge-on), we can further constrain the disk rotationspeed to 64+22
−8 km s−1.Assuming that the disk rotation is Keplerian, and that
the CO emission arises in a narrow annulus at a fixed radiusR from the central object we can now derive a mass of thecentral object Mc from,
Mc = RV 2/G (1)
The disk, envelope & outflow of W33A 11
Figure 16. The observed profile of the CO bandhead in region ‘A’ (black solid line), as well as the profile seen in the southern nebula(from region ‘C’) when convolved with a PSF of various widths.
where G is the gravitational constant. Bik & Thi (2004b)who found that the CO typically forms at a distance fromthe central star of 1-3AU. Using R = 2±1AU, and a distanceto W33A of 3.8kpc (Faundez et al. 2004), we find that thelower limit to the central mass is Mc = 10+9
−5M⊙.
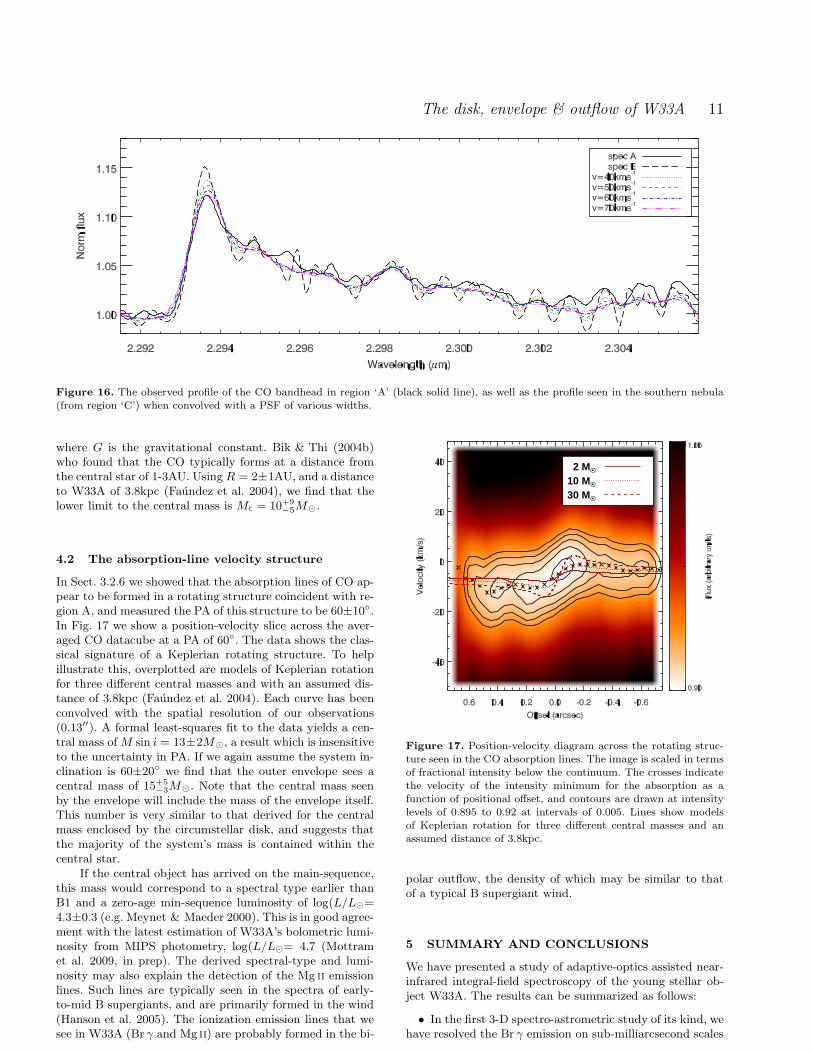
4.2 The absorption-line velocity structure
In Sect. 3.2.6 we showed that the absorption lines of CO ap-pear to be formed in a rotating structure coincident with re-gion A, and measured the PA of this structure to be 60±10◦.In Fig. 17 we show a position-velocity slice across the aver-aged CO datacube at a PA of 60◦. The data shows the clas-sical signature of a Keplerian rotating structure. To helpillustrate this, overplotted are models of Keplerian rotationfor three different central masses and with an assumed dis-tance of 3.8kpc (Faundez et al. 2004). Each curve has beenconvolved with the spatial resolution of our observations(0.13′′). A formal least-squares fit to the data yields a cen-tral mass of M sin i = 13±2M⊙, a result which is insensitiveto the uncertainty in PA. If we again assume the system in-clination is 60±20◦ we find that the outer envelope sees acentral mass of 15+5
−3M⊙. Note that the central mass seenby the envelope will include the mass of the envelope itself.This number is very similar to that derived for the centralmass enclosed by the circumstellar disk, and suggests thatthe majority of the system’s mass is contained within thecentral star.
If the central object has arrived on the main-sequence,this mass would correspond to a spectral type earlier thanB1 and a zero-age min-sequence luminosity of log(L/L⊙=4.3±0.3 (e.g. Meynet & Maeder 2000). This is in good agree-ment with the latest estimation of W33A’s bolometric lumi-nosity from MIPS photometry, log(L/L⊙= 4.7 (Mottramet al. 2009, in prep). The derived spectral-type and lumi-nosity may also explain the detection of the Mg ii emissionlines. Such lines are typically seen in the spectra of early-to-mid B supergiants, and are primarily formed in the wind(Hanson et al. 2005). The ionization emission lines that wesee in W33A (Br γ and Mg ii) are probably formed in the bi-
2 MO •
10 MO •
30 MO •
2 MO •
10 MO •
30 MO •
Figure 17. Position-velocity diagram across the rotating struc-ture seen in the CO absorption lines. The image is scaled in termsof fractional intensity below the continuum. The crosses indicatethe velocity of the intensity minimum for the absorption as afunction of positional offset, and contours are drawn at intensitylevels of 0.895 to 0.92 at intervals of 0.005. Lines show modelsof Keplerian rotation for three different central masses and anassumed distance of 3.8kpc.
polar outflow, the density of which may be similar to thatof a typical B supergiant wind.
5 SUMMARY AND CONCLUSIONS
We have presented a study of adaptive-optics assisted near-infrared integral-field spectroscopy of the young stellar ob-ject W33A. The results can be summarized as follows:
• In the first 3-D spectro-astrometric study of its kind, wehave resolved the Br γ emission on sub-milliarcsecond scales
12 B. Davies et al.
(physical scales <1AU), and find that the emission geome-try is that of a fast bipolar wind which is aligned with thelarge-scale outflow seen in wide-field images. The H2 2.12µmemission also traces an outflow with the same orientation outto ∼1′′.
• The extended nebulosity to the south is seen in thecontinuum, as well as in the light of Br γ and CO. We haveshown that this emission is light reflected by the outflowlobe, and so can be used as a ‘mirror’ with which to observethe emission from the central object from different angles.
• We interpret the CO emission as arising in a disk whichhas a low inclination with respect to our line-of-sight. In thesouthern nebula we see light reflected towards us from thedisk at a lower inclination angle (i.e. more pole-on), whichcauses the bandhead profile to be less velocity-broadened.This is consistent with the disk plane being perpendicularto the large-scale outflow. The velocity broadnening impliesa lower-limit to the central mass of Mc = 10+9
−5M⊙.• From the low-J v=2-0 transitions of CO at ∼2.35µm
we find evidence for a rotationally-flattened cool molecularenvelope, or ‘torus’, at a radius of ∼2000 AU from the centralstar. The plane of rotation is perpendicular to the small- andlarge-scale outflows. Analysis of the velocity structure of thetorus indicates that it is rotating about the outflow’s axis,and that it is orbiting a central mass of 15+5
−3M⊙.
Our findings suggest a picture of massive star forma-tion within W33A which is in excellent qualitative agree-ment with the accretion-disk-plus-bipolar wind paradigm.An accretion disk orbits a massive central star, which issurrounded by a cool molecular envelope which has beenrotationally-flattened into a torus. The central star is driv-ing a bipolar wind, seen on small scales in the ionized gas,and on larger scales as molecular / continuum emission. Thetwo measurements of the central mass indicate that at mostthe accretion disk makes up ∼30% of the system, and so thesystem mass is dominated by the central star.
ACKNOWLEDGMENTS
Based on observations obtained at the Gemini Observatory,which is operated by the Association of Universities for Re-search in Astronomy, Inc., under a cooperative agreementwith the NSF on behalf of the Gemini partnership: the Na-tional Science Foundation (United States), the Science andTechnology Facilities Council (United Kingdom), the Na-tional Research Council (Canada), CONICYT (Chile), theAustralian Research Council (Australia), Ministrio da Cin-cia e Tecnologia (Brazil) and Ministerio de Ciencia, Tec-nologa e Innovacin Productiva (Argentina).
REFERENCES
Beltran, M. T., Cesaroni, R., Codella, C., Testi, L., Furuya,R. S., & Olmi, L. 2006, Nature, 443, 427
Beuther, H., Churchwell, E. B., McKee, C. F., & Tan, J. C.2007, in Protostars and Planets V, ed. B. Reipurth, D. Je-witt, & K. Keil, 165–180
Beuther, H., Schilke, P., Sridharan, T. K., Menten, K. M.,Walmsley, C. M., & Wyrowski, F. 2002, A&A, 383, 892
Bik, A. & Thi, W. F. 2004a, A&A, 427, L13
—. 2004b, A&A, 427, L13Blum, R. D., Barbosa, C. L., Damineli, A., Conti, P. S., &Ridgway, S. 2004, ApJ, 617, 1167
Bunn, J. C., Hoare, M. G., & Drew, J. E. 1995, MNRAS,272, 346
Chandler, C. J., Carlstrom, J. E., & Scoville, N. Z. 1995,ApJ, 446, 793
Chandler, C. J., Carlstrom, J. E., Scoville, N. Z., Dent,W. R. F., & Geballe, T. R. 1993, ApJ, 412, L71
Curiel, S., Ho, P. T. P., Patel, N. A., Torrelles, J. M.,Rodrıguez, L. F., Trinidad, M. A., Canto, J., Hernandez,L., Gomez, J. F., Garay, G., & Anglada, G. 2006, ApJ,638, 878
Davies, B., Oudmaijer, R. D., & Sahu, K. C. 2007, ApJ,671, 2059
de Wit, W. J., Hoare, M. G., Oudmaijer, R. D., & Mottram,J. C. 2007, ApJ, 671, L169
Drew, J. E., Bunn, J. C., & Hoare, M. G. 1993, MNRAS,265, 12
Faundez, S., Bronfman, L., Garay, G., Chini, R., Nyman,L.-A., & May, J. 2004, A&A, 426, 97
Gibb, E. L., Whittet, D. C. B., Schutte, W. A., Boogert,A. C. A., Chiar, J. E., Ehrenfreund, P., Gerakines, P. A.,Keane, J. V., Tielens, A. G. G. M., van Dishoeck, E. F.,& Kerkhof, O. 2000, ApJ, 536, 347
Hanson, M. M., Kudritzki, R.-P., Kenworthy, M. A., Puls,J., & Tokunaga, A. T. 2005, ApJS, 161, 154
Hoare, M. G., Kurtz, S. E., Lizano, S., Keto, E., & Hofner,P. 2007, in Protostars and Planets V, ed. B. Reipurth,D. Jewitt, & K. Keil, 181–196
Krumholz, M. R., Klein, R. I., McKee, C. F., Offner,S. S. R., & Cunningham, A. J. 2009, Science, 323, 754
Lucas, P. W., Hoare, M. G., Longmore, A., Schroder, A. C.,Davis, C. J., Adamson, A., Bandyopadhyay, R. M., deGrijs, R., Smith, M., Gosling, A., Mitchison, S., Gaspar,A., Coe, M., Tamura, M., Parker, Q., Irwin, M., Hambly,N., Bryant, J., Collins, R. S., Cross, N., Evans, D. W.,Gonzalez-Solares, E., Hodgkin, S., Lewis, J., Read, M.,Riello, M., Sutorius, E. T. W., Lawrence, A., Drew, J. E.,Dye, S., & Thompson, M. A. 2008, MNRAS, 391, 136
Marti, J., Rodriguez, L. F., & Reipurth, B. 1998, ApJ, 502,337
McGregor, P. J., Hart, J., Conroy, P. G., Pfitzner, M. L.,Bloxham, G. J., Jones, D. J., Downing, M. D., Dawson,M., Young, P., Jarnyk, M., & Van Harmelen, J. 2003,in Society of Photo-Optical Instrumentation Engineers(SPIE) Conference Series, Vol. 4841, Society of Photo-Optical Instrumentation Engineers (SPIE) Conference Se-ries, ed. M. Iye & A. F. M. Moorwood, 1581–1591
Meynet, G. & Maeder, A. 2000, A&A, 361, 101Parkin, E. R., Pittard, J. M., Hoare, M. G., Wright, N. J.,& Drake, J. J. 2009, MNRAS, 1372
Patel, N. A., Curiel, S., Sridharan, T. K., Zhang, Q.,Hunter, T. R., Ho, P. T. P., Torrelles, J. M., Moran, J. M.,Gomez, J. F., & Anglada, G. 2005, Nature, 437, 109
Rengarajan, T. N. & Ho, P. T. P. 1996, ApJ, 465, 363Taban, I. M., Schutte, W. A., Pontoppidan, K. M., & vanDishoeck, E. F. 2003, A&A, 399, 169
Torrelles, J. M., Patel, N. A., Curiel, S., Ho, P. T. P., Garay,G., & Rodrıguez, L. F. 2007, ApJ, 666, L37
van der Tak, F. F. S. & Menten, K. M. 2005, A&A, 437,947
The disk, envelope & outflow of W33A 13
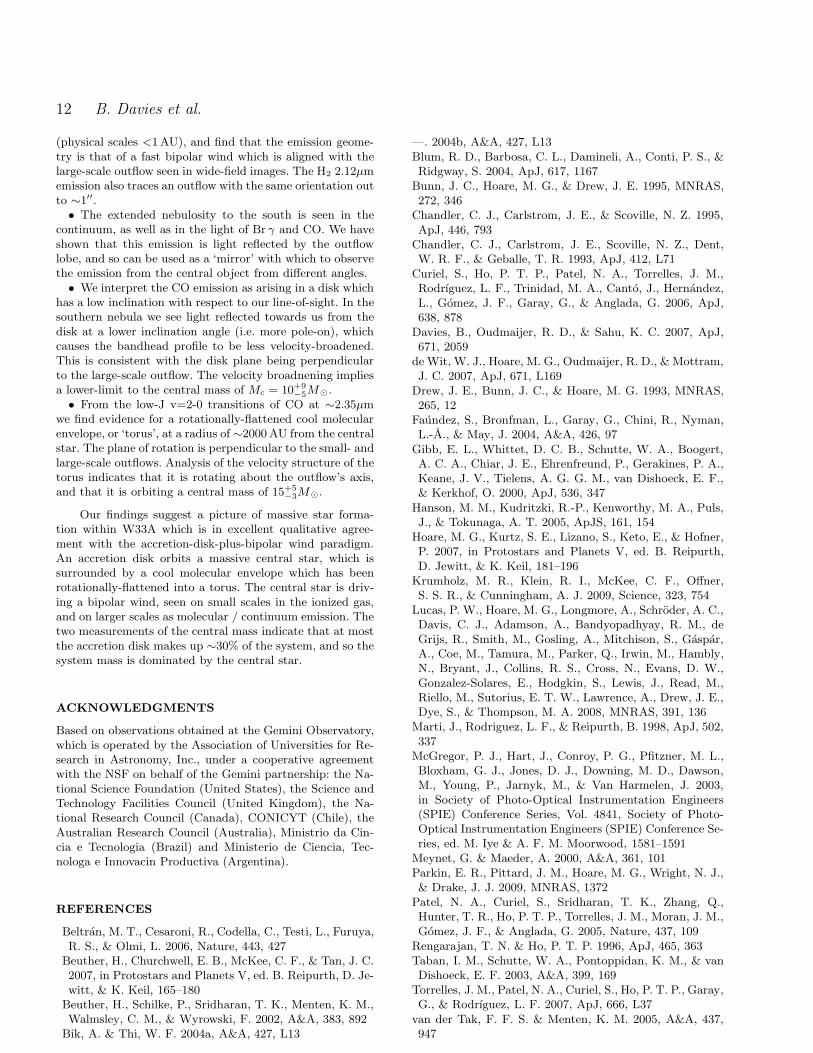
Figure A1. Spectro-astrometry of the Br γ line for the telluricstandard star used in our observations, similar to Fig. 12. Thelack of artifacts across the telluric features and the star’s Br γ
absorption, as well as the observed level of astrometric precision(∼0.2mas), validate the results of the similar analysis of W33A.
Yorke, H. W. & Sonnhalter, C. 2002, ApJ, 569, 846
APPENDIX A: SPECTRO-ASTROMETRY OF
THE TELLURIC STANDARD STAR
In Fig. A1 we show a spectro-astrometric analysis of the tel-luric standard star following a similar methodology to thatpresented in Sect. 3.2.5. The intensity spectrum (bottompanel) shows the Br γ absorption line, as well as the manytelluric features. The top panel shows the astrometry of thestar’s flux peak as a function of wavelength, illustrating thatno discernable variations are seen across neither the Br γline nor the telluric lines. This of course is to be expected,and the Figure serves to show that the technique we employproduces no spurious artifacts greater than the noise level(∼0.2mas) which could be misinterpreted.
Related Documents