RESEARCH ARTICLE The circulation analysis of substandard foods in China based on GIS and social network analysis Yakun He ID *, Jiadong Jiang, Shuo Li China Aero-Polytechnology Establishment, Key Laboratory of Quality Infrastructure Efficacy Research, SAMR, Beijing, China * [email protected] Abstract In China, the majority of food enterprises are small-sized and medium-sized. While the supervision costs are high, food safety issues are still emerging. Food circulation is an indis- pensable part in the entire food chain. At present, there are few studies on the regional spread of food safety risks in the circulation field from a macro perspective. This study com- bines GIS and social network analysis methods to deeply explore the regional circulation characteristics of substandard foods. First, we crawl the dataset of Food Safety Sampling Inspection Result Query System. Then we obtain the geographical locations of the manufac- turers and distributors by GIS. Finally, we construct the province-level and city-level sub- standard foods’ circulation networks, and employ social network analysis to target key cities and paths. The experimental results show that the circulations of substandard foods are characterized by dense province-level network and sparse city-level network, and they are mostly local and short-distance trafficking. 361 cities are divided into 13 city clusters consid- ering the network connection characteristics. Chongqing, Beijing, Zhengzhou, and Chang- sha are identified as key cities by all measurement indicators, and at least four indicators can identify Shanghai and Wuhan. These cities have the highest priority for combating sub- standard foods’ circulation networks. 1. Introduction China is the developing country who has an enormous population and great geographical het- erogeneity. During the past few decades, China has made a leap from food shortage to basically eradicating hunger. However, there are obvious conflicts between traditional agriculture and numerous food enterprises, and consumers’ demands for safe and high-quality foods are becoming stronger. A major difference between China’s food industry and that of developed countries is the scale of operations. More than 69% of China’s food companies are small-sized and medium-sized enterprises, which produce most of foods for the country [1]. China is in the transitional period of transition to developed country and is facing many deliberate food adulteration issues and food fraud issues. Many companies are still driven by the attitude of "fast profit is above everything", especially small-sized and medium-sized enterprises whose PLOS ONE PLOS ONE | https://doi.org/10.1371/journal.pone.0248037 March 5, 2021 1 / 17 a1111111111 a1111111111 a1111111111 a1111111111 a1111111111 OPEN ACCESS Citation: He Y, Jiang J, Li S (2021) The circulation analysis of substandard foods in China based on GIS and social network analysis. PLoS ONE 16(3): e0248037. https://doi.org/10.1371/journal. pone.0248037 Editor: Bing Xue, Institute for Advanced Sustainability Studies, GERMANY Received: September 16, 2020 Accepted: February 18, 2021 Published: March 5, 2021 Copyright: © 2021 He et al. This is an open access article distributed under the terms of the Creative Commons Attribution License, which permits unrestricted use, distribution, and reproduction in any medium, provided the original author and source are credited. Data Availability Statement: All relevant data are within the paper and its Supporting Information. Funding: This research was funded by Beijing Municipal Science & Technology Commission “Product Quality Safety Risk Warning Technology and Platform Construction based on Big Data”, grant number Z191100001419016. The funders had no role in study design, data collection and analysis, decision to publish, or preparation of the manuscript. Competing interests: The authors have declared that no competing interests exist.

Welcome message from author
This document is posted to help you gain knowledge. Please leave a comment to let me know what you think about it! Share it to your friends and learn new things together.
Transcript

RESEARCH ARTICLE
The circulation analysis of substandard foods
in China based on GIS and social network
analysis
Yakun HeID*, Jiadong Jiang, Shuo Li
China Aero-Polytechnology Establishment, Key Laboratory of Quality Infrastructure Efficacy Research,
SAMR, Beijing, China
Abstract
In China, the majority of food enterprises are small-sized and medium-sized. While the
supervision costs are high, food safety issues are still emerging. Food circulation is an indis-
pensable part in the entire food chain. At present, there are few studies on the regional
spread of food safety risks in the circulation field from a macro perspective. This study com-
bines GIS and social network analysis methods to deeply explore the regional circulation
characteristics of substandard foods. First, we crawl the dataset of Food Safety Sampling
Inspection Result Query System. Then we obtain the geographical locations of the manufac-
turers and distributors by GIS. Finally, we construct the province-level and city-level sub-
standard foods’ circulation networks, and employ social network analysis to target key cities
and paths. The experimental results show that the circulations of substandard foods are
characterized by dense province-level network and sparse city-level network, and they are
mostly local and short-distance trafficking. 361 cities are divided into 13 city clusters consid-
ering the network connection characteristics. Chongqing, Beijing, Zhengzhou, and Chang-
sha are identified as key cities by all measurement indicators, and at least four indicators
can identify Shanghai and Wuhan. These cities have the highest priority for combating sub-
standard foods’ circulation networks.
1. Introduction
China is the developing country who has an enormous population and great geographical het-
erogeneity. During the past few decades, China has made a leap from food shortage to basically
eradicating hunger. However, there are obvious conflicts between traditional agriculture and
numerous food enterprises, and consumers’ demands for safe and high-quality foods are
becoming stronger. A major difference between China’s food industry and that of developed
countries is the scale of operations. More than 69% of China’s food companies are small-sized
and medium-sized enterprises, which produce most of foods for the country [1]. China is in
the transitional period of transition to developed country and is facing many deliberate food
adulteration issues and food fraud issues. Many companies are still driven by the attitude of
"fast profit is above everything", especially small-sized and medium-sized enterprises whose
PLOS ONE
PLOS ONE | https://doi.org/10.1371/journal.pone.0248037 March 5, 2021 1 / 17
a1111111111
a1111111111
a1111111111
a1111111111
a1111111111
OPEN ACCESS
Citation: He Y, Jiang J, Li S (2021) The circulation
analysis of substandard foods in China based on
GIS and social network analysis. PLoS ONE 16(3):
e0248037. https://doi.org/10.1371/journal.
pone.0248037
Editor: Bing Xue, Institute for Advanced
Sustainability Studies, GERMANY
Received: September 16, 2020
Accepted: February 18, 2021
Published: March 5, 2021
Copyright: © 2021 He et al. This is an open access
article distributed under the terms of the Creative
Commons Attribution License, which permits
unrestricted use, distribution, and reproduction in
any medium, provided the original author and
source are credited.
Data Availability Statement: All relevant data are
within the paper and its Supporting Information.
Funding: This research was funded by Beijing
Municipal Science & Technology Commission
“Product Quality Safety Risk Warning Technology
and Platform Construction based on Big Data”,
grant number Z191100001419016. The funders
had no role in study design, data collection and
analysis, decision to publish, or preparation of the
manuscript.
Competing interests: The authors have declared
that no competing interests exist.
profits are so low that they would not afford additional costs to ensure their products’ quality.
Therefore, the supervision is more complicated and more difficult to perform than other coun-
tries. Food safety supervision is the joint responsibilities of national, provincial and local gov-
ernment departments. At the same time, the food industry (including production, processing,
sales and service industries) bears the major responsibilities for providing consumers with safe
foods [2, 3].
Food safety supervision and inspection began in 1949 when the People’s Republic of China
was founded, and it has always been an important part of national laws and regulations. Its
development has gone through several important periods, including technical management
without government power (disease prevention and quarantine), administrative supervision
(Ministry of Health), multi-government agency supervision and single government agency
supervision [4–6].
The state organizes food safety sampling inspections every year, and has accumulated a big
and authoritative food sampling quality and safety dataset. In recent years, the pass rate of
food sampling inspections has been climbing from 95.4% in 2014 [7] to 97.6% in 2019 [8].
However, food safety issues still exist in fragments and have certain geographical distribution
characteristics, which needs refined analysis and processing. Small-sized and medium-sized
food enterprises are usually distributed in rural areas, sometimes even beyond the supervision
of governments. Therefore, geographical spatial differences need to be considered for refined
analysis in food production and sales analysis [9]. At the same time, the government can cut
off the sales chain of counterfeit and inferior foods through refined supervision, so that related
small enterprises have no profit to be made. They will take the initiative to expand their scale
through mergers to achieve economies of scale. In this way, the proportion of small enterprises
will be greatly reduced, and food safety will also be improved.
The existing researches on food quality and safety in China mainly include the following
four aspects: (1) Food-borne diseases: food-borne pathogenic bacteria [10, 11], food-borne
mycotoxins [12, 13], food-borne viruses [14, 15], food-borne parasitic diseases [16, 17]; (2)
Food chemistry: food additives [18], pesticide and veterinary drug residues [19], heavy metal
contamination [20], food fraud [21, 22]; (3)Risk assessment and communication: microbiolog-
ical risk assessment in food [23, 24]; (4) Risk management: food safety laws and regulations
[25], food safety standards [26], food safety regulatory inspection [27]. The existing researches
mainly focus on the micro analysis of physical and chemical characteristics of the specific
food, the risk analysis of the specific food’s supply chain at the mesoscale, and the macro policy
analysis of food safety and law. At present, there are few studies on the regional dissemination
of food safety risks from a macro perspective.
Spatial data is a very important type of data. About 80% of the data in daily life is related to
geographic locations and attributes and spatial distributions [28]. There is a large amount of
geographic information in the food sampling quality and safety dataset. However, the geo-
graphic information of manufacturers and distributors in the dataset has not been fully used.
Lam et al. [29] propose that the key words for the future of China’s food safety should include
responsibility, accountability, and trackability. However, the geographical trackability depends
on the full spatialization of the food production and sales chain. In order to make full use of
the geographic information, this study employs social network analysis methods [30] to build
multi-level networks of food production and sales, and analyzes the regional geographic dis-
semination characteristics of substandard foods. In China, social network analysis theories
and methods are mainly applied to the researches on supply chain modeling of a certain prod-
uct and the spread of its network risks [31, 32]. These studies do not consider the spatial loca-
tion and spatial association of each node in the network, nor can they discover the regional
characteristics of the food production and sales chain. Without cutting off the potential
PLOS ONE The circulation analysis of substandard foods in China
PLOS ONE | https://doi.org/10.1371/journal.pone.0248037 March 5, 2021 2 / 17
regional economic chains, it will be difficult to fundamentally control substandard foods pro-
duction and sales driven by economic benefits. This study attempts to explore the regional dis-
semination risks of substandard foods from the circulation market, using social network
analysis methods to identify important network characteristics, such as key cities and routes.
According to the circulation characteristics of each region, we recommend governments for-
mulating prevention strategies based on the local conditions to minimize the circulation of
substandard foods.
In summary, from the research perspective, this study introduces geospatial concepts and
social network analysis methods into food quality research, and expands the connotation and
research methods of food quality research. From the data application perspective, the applica-
tion of current food sampling quality and safety dataset still stays at the data-managed level.
Due to the lack of effective means of data intelligent analysis, the value of the dataset has not
been fully utilized. From the technical perspective, this study applies social network analysis
methods to explore regional characteristics of multi-level circulation networks of substandard
foods, which realizes the spatial transformation of food quality information and provides new
perspectives for food quality analysis and supervision.
2. Materials and methods
2.1. Data collection and preprocessing
The database utilized in our work is the Food Safety Sampling Inspection Result Query System
(https://spcjsac.gsxt.gov.cn/), which has published all the qualified and substandard food safety
sampling inspection information since 2014. The system is managed by the State Administra-
tion for Market Regulation, and the data information is authoritative, comprehensive and reli-
able. We crawl all the data published on the website before July 9, 2019. There are 979,352
cases of the raw database, including 32,173 cases of substandard foods data. We eliminate
cases that do not contain manufacturers and distributors information and filter the duplicated
cases. After data preprocessing, 21,003 cases of substandard foods data are finally retained.
Since we collected data before July 2019, many sampling inspection results of 2019 have not
been uploaded to the system timely. Through the quarterly statistics and analysis of the website
data, it can be found that from 2014 to 2018, the number of sampling inspection has been
increasing year by year (Fig 1(A)). And on a quarterly basis, the proportion of substandard
foods in sampling inspection results generally shows a downward trend (Fig 1(B)).
Sampling inspection is the most important and mature method for market supervision in
China. China has implemented relevant food safety laws and regulations to standardize the
sampling inspection work, mainly including the Food Safety Law of the People’s Republic of
China and the Food Safety Sampling Inspection and Management Measures. In this study, we
only use substandard foods data instead of all sampling inspection data. We assume that the
sampling inspection is effective and can represent the current food safety situation, and we
believe that the country will sample as fairly as possible in order to fully control China’s food
safety situation.
2.2. Methods
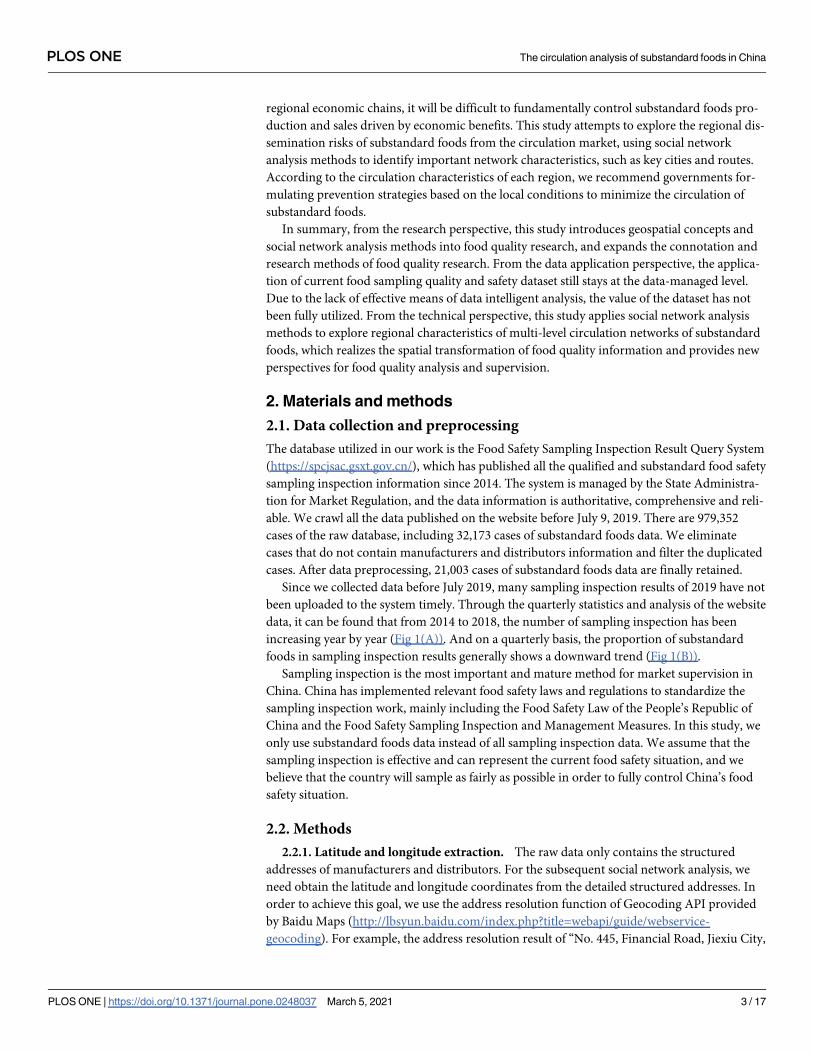
2.2.1. Latitude and longitude extraction. The raw data only contains the structured
addresses of manufacturers and distributors. For the subsequent social network analysis, we
need obtain the latitude and longitude coordinates from the detailed structured addresses. In
order to achieve this goal, we use the address resolution function of Geocoding API provided
by Baidu Maps (http://lbsyun.baidu.com/index.php?title=webapi/guide/webservice-
geocoding). For example, the address resolution result of “No. 445, Financial Road, Jiexiu City,
PLOS ONE The circulation analysis of substandard foods in China
PLOS ONE | https://doi.org/10.1371/journal.pone.0248037 March 5, 2021 3 / 17

Jinzhong City, Shanxi Province” is “lng:111.9083384, lat:37.0318653”. And the final spatial dis-
tributions of all substandard foods are shown in Fig 2.
2.2.2. Social network analysis. This study constructs a province-level network and a city-
level network to explore the regularities of substandard foods’ production and sales networks
in China, utilizing Gephi [33], R and Key Player software packages [34]. In our work, a node
denotes a province or a city, and a path represents a circulation route. The reason why we con-
struct these two levels of networks is that they are consistent with China’s two main hierarchies
of government. In this way, the analysis results can be combined with the hierarchy of govern-
ment to develop preventive strategies that can be implemented at the existing administrative
infrastructure. The indicators and methods used in this study are as follows.
Fig 1. Quarterly statistics and analysis of foods data. (a) Number of reporting data. (b) Proportion of qualified and substandard
foods.
https://doi.org/10.1371/journal.pone.0248037.g001
PLOS ONE The circulation analysis of substandard foods in China
PLOS ONE | https://doi.org/10.1371/journal.pone.0248037 March 5, 2021 4 / 17
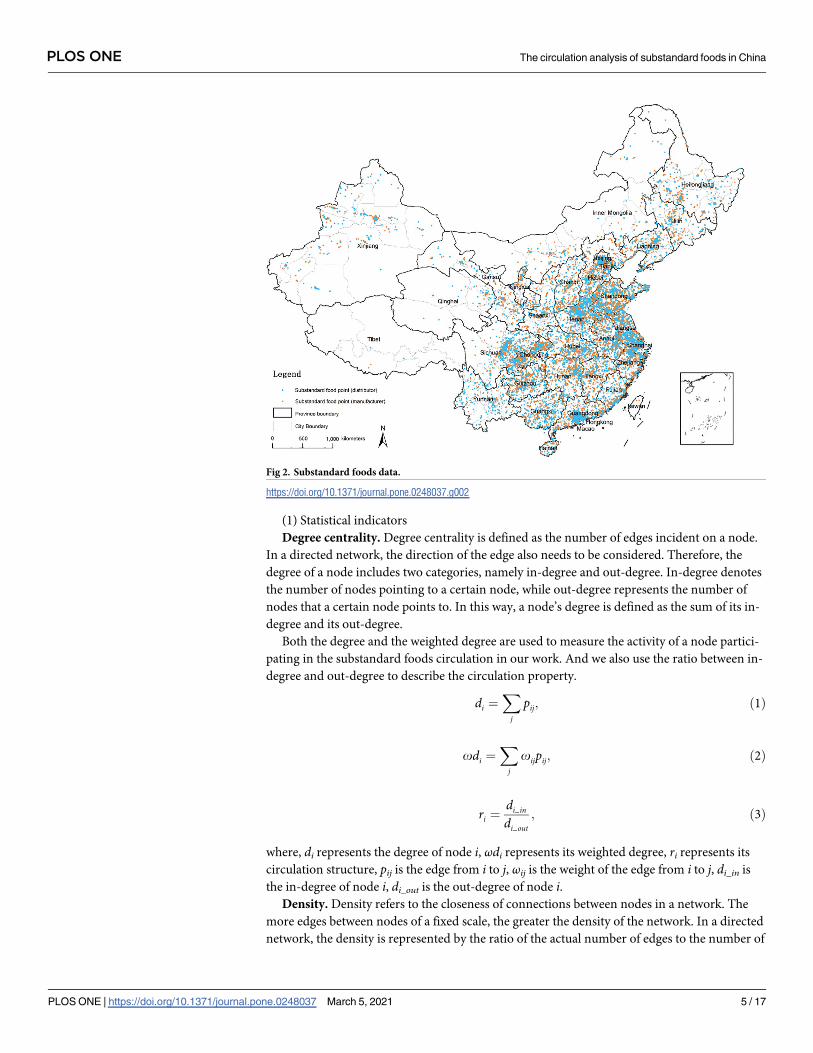
(1) Statistical indicators
Degree centrality. Degree centrality is defined as the number of edges incident on a node.
In a directed network, the direction of the edge also needs to be considered. Therefore, the
degree of a node includes two categories, namely in-degree and out-degree. In-degree denotes
the number of nodes pointing to a certain node, while out-degree represents the number of
nodes that a certain node points to. In this way, a node’s degree is defined as the sum of its in-
degree and its out-degree.
Both the degree and the weighted degree are used to measure the activity of a node partici-
pating in the substandard foods circulation in our work. And we also use the ratio between in-
degree and out-degree to describe the circulation property.
di ¼X
j
pij; ð1Þ
odi ¼X
j
oijpij; ð2Þ
ri ¼di in
di out; ð3Þ
where, di represents the degree of node i, ωdi represents its weighted degree, ri represents its
circulation structure, pij is the edge from i to j, ωij is the weight of the edge from i to j, di_in is
the in-degree of node i, di_out is the out-degree of node i.Density. Density refers to the closeness of connections between nodes in a network. The
more edges between nodes of a fixed scale, the greater the density of the network. In a directed
network, the density is represented by the ratio of the actual number of edges to the number of
Fig 2. Substandard foods data.
https://doi.org/10.1371/journal.pone.0248037.g002
PLOS ONE The circulation analysis of substandard foods in China
PLOS ONE | https://doi.org/10.1371/journal.pone.0248037 March 5, 2021 5 / 17
edges that are most likely to exist.
Density ¼e
n� ðn � 1Þ; ð4Þ
where, e represents the number of edges, and n represents the number of nodes. The density
value is between 0 and 1. The closer the value is to 1, the closer the relationship between nodes
is. It reflects the active degree that a node participates in the communication.
In this study, the calculations of the above statistical indicators are completed by Gephi.
(2) Node betweenness and edge betweenness
Degree centrality of a node depicts the local centrality of the node, measuring the transac-
tion ability of the node itself, without considering whether it can control the others. Between-
ness centrality of a node studies the degree of node controlling over resources. If a node is on
the shortest paths of many other nodes pairs, the node has a high betweenness centrality and
acts as a communicating bridge. Betweenness centrality is an important global geometric
quantity which can reflect the function of the corresponding node or edge in the entire net-
work. In the substandard foods circulation network, the distribution characteristics of the
betweenness centrality reflect the position of different nodes and paths in the circulation rela-
tionships, and have a certain early warning effect on the prevention and control of the substan-
dard foods transmission.
nbk ¼X
i
X
j
pikjpij; i 6¼ j 6¼ k; ð5Þ
ebm ¼X
i
X
j
pimj
pij; i 6¼ j; ð6Þ
where, nbk denotes the betweeness centrality of node k, and the shortest paths number that
node k is on the shortest path between i and j is expressed as pikj, ebm denotes the betweeness
centrality of edge m, and pimj represents the shortest paths number that edge m is on the short-
est path between i and j.In this study, node betweeness [35] and edge betweenness [36] are calculated by igraph
package in R.
(3) Community detection–the Louvain algorithm
The Louvain algorithm is a community detection method on base of multi-level optimiza-
tion modularity, and it is also a built-in algorithm in Gephi [37]. The advantage of this algo-
rithm is that it is efficient and accurate. Lancichinetti and Fortunato believe it is one of the best
performing community detection methods [38]. The modularity function is an optimization
function which can describe the closeness of the discovered community. If a node joins a cer-
tain community and the modularity of the community is maximized, then the node should
belong to the community. Otherwise, the node continues to stay in its current community.
The modularity is defined as follows:
Q ¼1
2m
X
i;j
Aij �kikj2m
� �
dðci; cjÞ; ð7Þ
where, m is the number of paths, A is the adjacency matrix. If ci and cj are the same, then δ(ci,cj) = 1, otherwise 0.
If the community where the current node is located only includes itself, the Louvain algo-
rithm employs a technique to speed up the calculation when computing modularity’s increase
PLOS ONE The circulation analysis of substandard foods in China
PLOS ONE | https://doi.org/10.1371/journal.pone.0248037 March 5, 2021 6 / 17

of adding it to other communities.
DQ ¼Sin þ ki;in
2m�
Stot þ ki2m
� �2" #
�Sin
2m�
Stot
2m
� �2
�ki
2m
� �2" #
; ð8Þ
where, Sin denotes the number of paths in the community, Stot represents the number of paths
incident on nodes of the community, ki,in is the number of paths from node i to nodes of the
community, ki is the number of paths incident on node i.The Louvain algorithm contains two steps. First, it traverses the nodes in the network and
add a node to a community which could make the community’s modularity upgrade the larg-
est, until it no longer changes. Second, the network is reconstructed by merging the existing
communities into a few super nodes. The new edge weight is the sum of the edge weights of all
the original nodes in the two super nodes. These two steps should be iterated until the algo-
rithm becomes stable.
Community detection can reveal and quantify the clustering structures of substandard
foods circulation network. By analyzing the relationships between circulation clusters and
geospatial clusters, this study discusses the characteristics of food industry in different clusters
and excavates different substandard foods circulation patterns.
(4) Key cities identification–the Borgatti’s method
The Borgatti’s method recognizes the key nodes set in a network which is maximally linked
to all the others. Information can be optimally diffused by the network through treating key
nodes as the seeds [34]. The method is useful to solve security issues, for example, in crime pre-
vention, by taking a few people as seeds could identify an undercover crime network. In this
method, the distance-weighted reach measure is defined as the sum of the reciprocal distances
from the key nodes set S to all nodes, where the distance from S to a node is measured by the
shortest distance. It maximizes the weights of nodes that are not belongs to S.
DR ¼
X
i
1
dSi
n; ð9Þ
where, DR represents the reciprocal distance indicator, n represents the total number of nodes,
DSi represents the shortest distance from S to node i.In this study, we use this method to find key cities for substandard foods circulation, so as
to conduct precise governance on these cities and to destroy the circulation network to the
greatest extent. The key cities are detected by Borgatti’s free software named the Key Player
Program (version 1.10).
3. Experimental results
3.1. Statistical characteristics
In this study, there are 34 provinces and regions and 361 cities participating in the circulation
of substandard foods. All provinces and cities are connected to other nodes, and there is no
province or city that is alone.
In the province-level network, an average of 196.529 substandard foods are circulated from
each province to an average of another 18.235 provinces, which indicates that the network
density is high (0.533). The city-level network has a larger scale, with 361 nodes and a network
diameter of 6. But the network density of the province-level network is 15 times that of the
city-level network (0.036). An average of 58.097 substandard foods are circulated from each
city to an average of another 12.912 cities. However, for the province-level network, the
PLOS ONE The circulation analysis of substandard foods in China
PLOS ONE | https://doi.org/10.1371/journal.pone.0248037 March 5, 2021 7 / 17
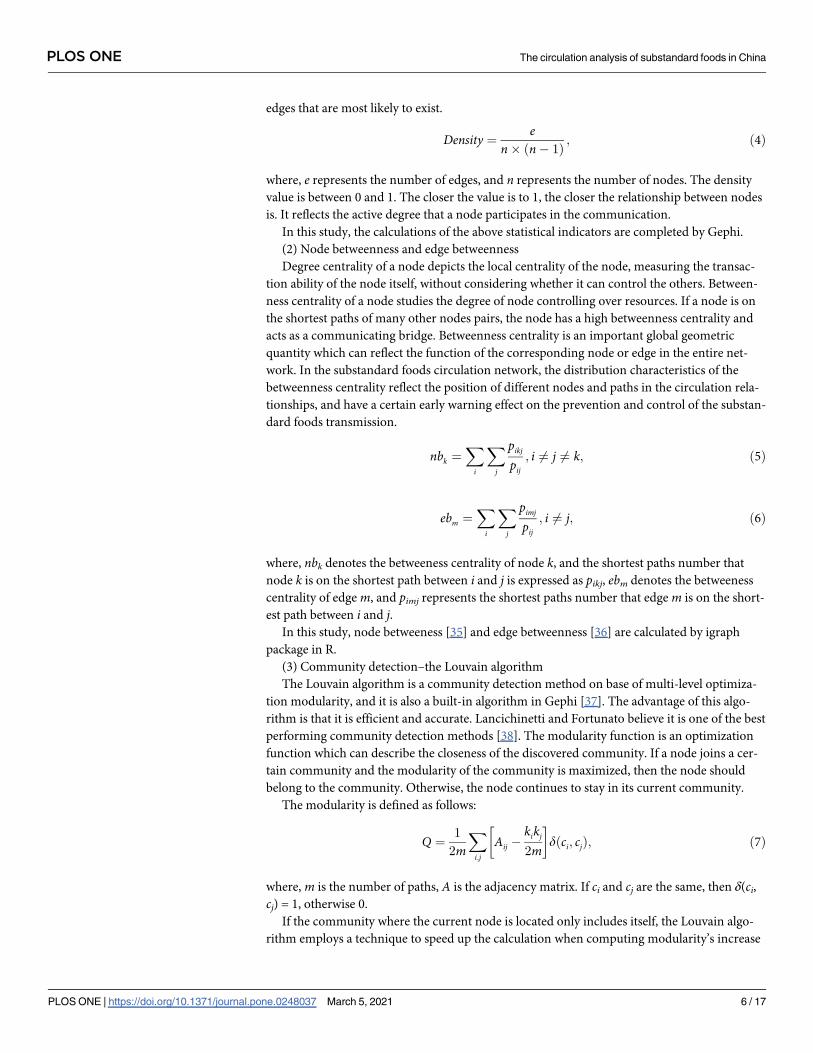
distribution of substandard foods numbers circulated in and out of the provinces is highly
skewed to the right, also called the long tail distribution. As shown in Table 1, the median of
in-degree and out-degree are bigger than the mean of degree namely, a large number of sub-
standard foods’ circulations are clustered on the left side of the distribution [39]. The circula-
tion gap between provinces is large, and the numbers of substandard foods circulation in most
provinces are small.
3.2. Circulation characteristics
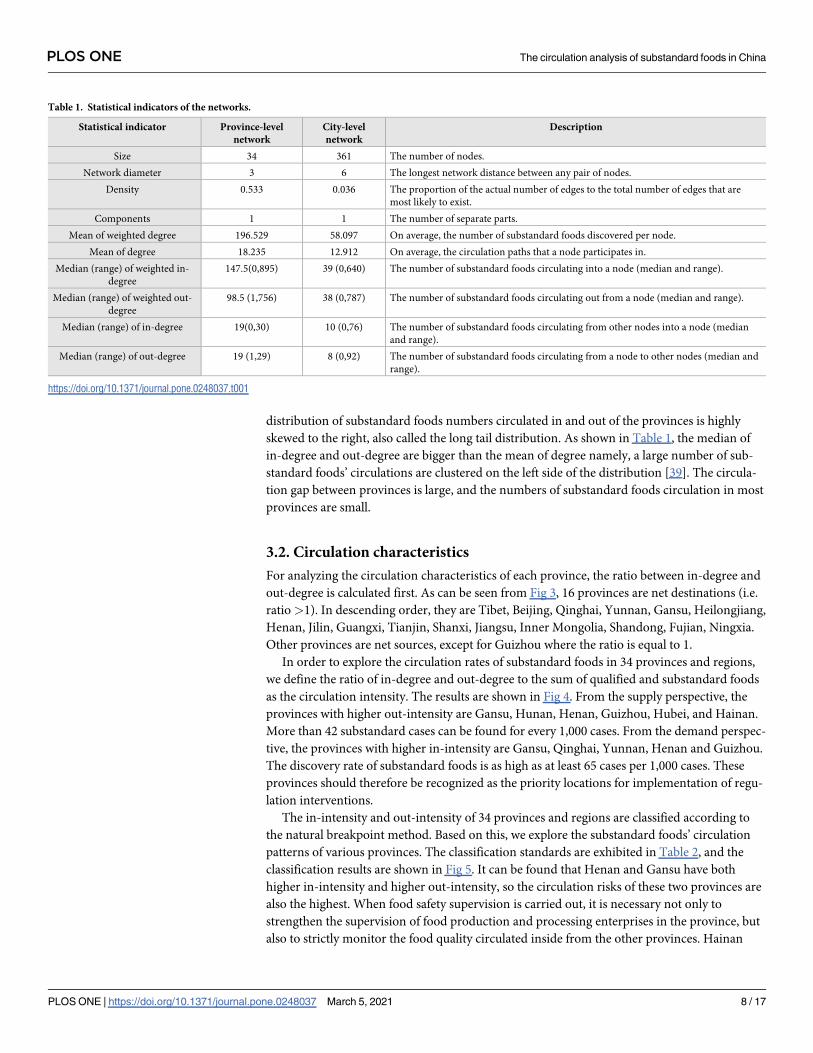
For analyzing the circulation characteristics of each province, the ratio between in-degree and
out-degree is calculated first. As can be seen from Fig 3, 16 provinces are net destinations (i.e.
ratio>1). In descending order, they are Tibet, Beijing, Qinghai, Yunnan, Gansu, Heilongjiang,
Henan, Jilin, Guangxi, Tianjin, Shanxi, Jiangsu, Inner Mongolia, Shandong, Fujian, Ningxia.
Other provinces are net sources, except for Guizhou where the ratio is equal to 1.
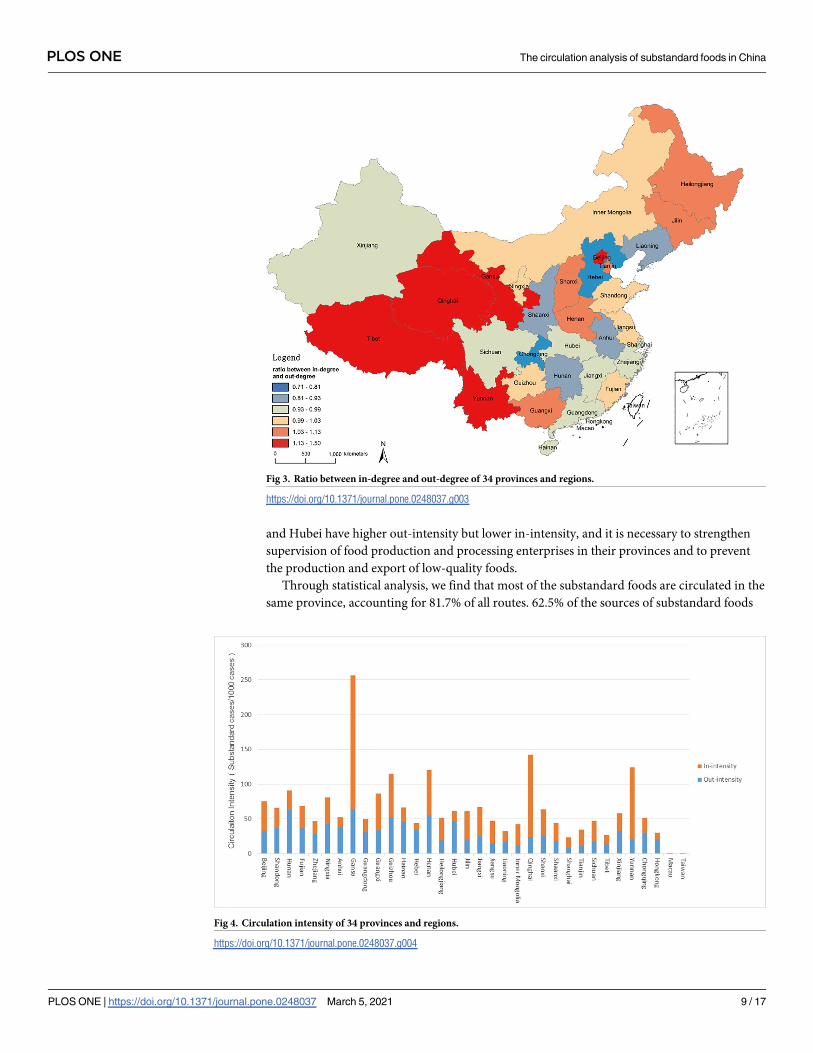
In order to explore the circulation rates of substandard foods in 34 provinces and regions,
we define the ratio of in-degree and out-degree to the sum of qualified and substandard foods
as the circulation intensity. The results are shown in Fig 4. From the supply perspective, the
provinces with higher out-intensity are Gansu, Hunan, Henan, Guizhou, Hubei, and Hainan.
More than 42 substandard cases can be found for every 1,000 cases. From the demand perspec-
tive, the provinces with higher in-intensity are Gansu, Qinghai, Yunnan, Henan and Guizhou.
The discovery rate of substandard foods is as high as at least 65 cases per 1,000 cases. These
provinces should therefore be recognized as the priority locations for implementation of regu-
lation interventions.
The in-intensity and out-intensity of 34 provinces and regions are classified according to
the natural breakpoint method. Based on this, we explore the substandard foods’ circulation
patterns of various provinces. The classification standards are exhibited in Table 2, and the
classification results are shown in Fig 5. It can be found that Henan and Gansu have both
higher in-intensity and higher out-intensity, so the circulation risks of these two provinces are
also the highest. When food safety supervision is carried out, it is necessary not only to
strengthen the supervision of food production and processing enterprises in the province, but
also to strictly monitor the food quality circulated inside from the other provinces. Hainan
Table 1. Statistical indicators of the networks.
Statistical indicator Province-level
network
City-level
network
Description
Size 34 361 The number of nodes.
Network diameter 3 6 The longest network distance between any pair of nodes.
Density 0.533 0.036 The proportion of the actual number of edges to the total number of edges that are
most likely to exist.
Components 1 1 The number of separate parts.
Mean of weighted degree 196.529 58.097 On average, the number of substandard foods discovered per node.
Mean of degree 18.235 12.912 On average, the circulation paths that a node participates in.
Median (range) of weighted in-
degree
147.5(0,895) 39 (0,640) The number of substandard foods circulating into a node (median and range).
Median (range) of weighted out-
degree
98.5 (1,756) 38 (0,787) The number of substandard foods circulating out from a node (median and range).
Median (range) of in-degree 19(0,30) 10 (0,76) The number of substandard foods circulating from other nodes into a node (median
and range).
Median (range) of out-degree 19 (1,29) 8 (0,92) The number of substandard foods circulating from a node to other nodes (median and
range).
https://doi.org/10.1371/journal.pone.0248037.t001
PLOS ONE The circulation analysis of substandard foods in China
PLOS ONE | https://doi.org/10.1371/journal.pone.0248037 March 5, 2021 8 / 17
and Hubei have higher out-intensity but lower in-intensity, and it is necessary to strengthen
supervision of food production and processing enterprises in their provinces and to prevent
the production and export of low-quality foods.
Through statistical analysis, we find that most of the substandard foods are circulated in the
same province, accounting for 81.7% of all routes. 62.5% of the sources of substandard foods
Fig 3. Ratio between in-degree and out-degree of 34 provinces and regions.
https://doi.org/10.1371/journal.pone.0248037.g003
Fig 4. Circulation intensity of 34 provinces and regions.
https://doi.org/10.1371/journal.pone.0248037.g004
PLOS ONE The circulation analysis of substandard foods in China
PLOS ONE | https://doi.org/10.1371/journal.pone.0248037 March 5, 2021 9 / 17

circulating and 43.6% of the destinations of substandard foods circulating are clustered in 8
provinces. In descending order, they are Henan, Shandong, Guangdong, Fujian, Hebei, Zhe-
jiang, Hunan and Hubei. These cities are located in eastern and central China. And this is
related to the geographical distributions of food production and processing enterprises across
the country. The eastern region accounts for 42.1%, the central for 26.8%, the western for
18.9%, and the northeast for 12.2% [40]. Except for Guangdong, most of the inter-provincial
circulation paths are between neighboring provinces, within short distances. Similar to the
province-level network, substandard foods are mostly circulated inside the same city, account-
ing for 57.2% of all routes, of which the provincial capitals account for 23.2%. The top 10 cities
in descending order are Chonqing, Beijing, Shanghai, Changsha, Zhengzhou, Wuhan, Qing-
dao, Linyi, Nanning and Shenyang. As shown in Table 3, from the city-level network perspec-
tive, substandard foods are mostly exported from prefecture cities to provincial capitals.
3.3. Substandard foods circulation cluster of cities
The highly networked spatial connection is the key element to form the city cluster. The cluster
with relatively higher cohesion has closer economic and social ties and has a higher degree of
centrality. Fig 5 shows the 13 clusters of 361 cities identified by the Louvain algorithm. The
obvious regional clusters indicate that there are differences in the circulation characteristics of
substandard foods. It is worth noting that there are connections between clusters, and some
clusters are not consistent with geographical distributions. Specifically, Chongqing, as a city in
the southwest, is considered to have a unified pattern (cluster 4) with southeastern coastal cit-
ies in Guangdong Province. Both the import number and export number of substandard foods
in this cluster are much higher than the other cities. Cities belonging to Jiangxi Province and
Table 2. Classification standards of provinces’ circulation patterns.
Indicator Lower Low High Higher
In-intensity [9.8–21.1) [21.1,38.4) [38.4,65.2) [65.2,192.7]
Out-intensity [8.4–16.6) [16.6,27.5) [27.5,42.4) [42.4,63.6]
https://doi.org/10.1371/journal.pone.0248037.t002
Fig 5. Circulation patterns of 34 provinces and regions. (A. Higher circulation intensity: Henan, Gansu; B. Net destination:
None; C. Net source: Hainan, Hubei; D. Lower circulation intensity: Liaoning, Tibet, Shanghai).
https://doi.org/10.1371/journal.pone.0248037.g005
PLOS ONE The circulation analysis of substandard foods in China
PLOS ONE | https://doi.org/10.1371/journal.pone.0248037 March 5, 2021 10 / 17
Hainan Province are not geographically adjacent, but they exhibit strong network relevances
(cluster 7). The city with the highest node betweenness in a cluster is usually closely connected
to cities in other clusters, which indicates that it is the main network gatekeeper. They are
Chongqing, Beijing, Zhengzhou, Shanghai, Guangzhou, Changsha, Wuhan, Linyi and Hefei.
With the exception of Linyi in Shandong Province, these cities are almost provincial capitals,
indicating cities with better economic conditions and convenient transport always serve as
centers of the circulation of substandard foods.
3.4. Key cities. The refined analysis in the city-level network is helpful to discover the
problems behind the substandard foods circulation network. We detect the cities which have
the largest number of substandard foods circulations. First, we identify the main cities partici-
pating in the circulation of substandard foods according to the indicator of degree centrality,
and the results are shown in Fig 7. In terms of weighted degree, Chongqing has the highest cir-
culation rate of substandard foods (1,427, accounting for 3.39% of the total), with both high
import and export. For the next 20 cities, these numbers dropped rapidly, from 825 to 303
cases (from 1.96% to 0.70%). Chongqing, Beijing, Zhengzhou, Shanghai, and Guangzhou each
have more than 600 cases (10.07%), followed by Changsha, Wuhan, Linyi, and Hefei, each
with more than 400 cases (4.67%).
In this study, we also identify key cities and paths by calculating the indicator of between-
ness centrality. Betweenness centrality can measure the global influence and function of a city
or a path in the whole circulation network. All the reported substandard foods’ circulation
paths’ lengths are only 1, missing the intermediate information. We assume that the quality of
foods will change during the circulation process, and this change will be transmitted through
the circulation networks. Under this assumption, we apply the node betweenness and edge
betweenness to find the key intermediate nodes and paths. As displayed in Fig 6, Beijing,
Zhengzhou, Chongqing, Changsha, Chengdu and Guangzhou have the greatest impacts on the
circulation of substandard foods, with node betweenness values ranging from 6.24% to 2.95%.
These cities are all provincial capitals. According to the results shown in Fig 6 and Fig 7,
underdeveloped regions always have less impacts on the network, including the northeast,
northwest and southwest regions. Next, we calculate edge betweenness to determine the key
intermediate paths, and the top 10 paths are listed in Table 4. These 10 paths control 34.98% of
the total paths. These paths mainly originate from the provincial capitals, for example, Zheng-
zhou, Beijing and Changsha.
In order to control and prevent the circulation of substandard foods to the greatest extent
from the perspective of information diffusing, we employ the Borgatti’s method to identify the
set of key cities, thereby formulating more precise policies to combat substandard foods’ circu-
lation. Through strengthening the supervision of relevant cities, government can investigate
deep-seated substandard foods’ production and sales chains. Table 5 shows the percentage of
nodes reached by each key city set according to the reciprocal distance index.
Although there are 361 cities involved in the production and sales of substandard foods, but
we only need to lock the target in 3 cities to connect more than 70% of the network.
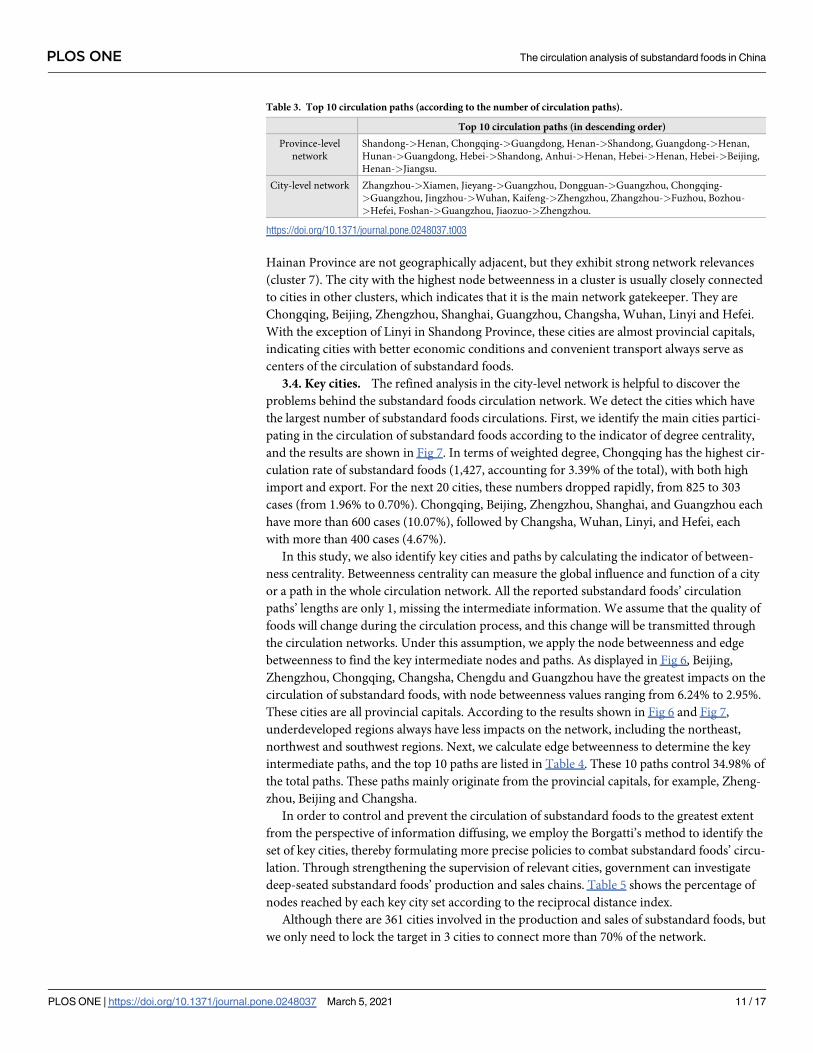
Table 3. Top 10 circulation paths (according to the number of circulation paths).
Top 10 circulation paths (in descending order)
Province-level
network
Shandong->Henan, Chongqing->Guangdong, Henan->Shandong, Guangdong->Henan,
Hunan->Guangdong, Hebei->Shandong, Anhui->Henan, Hebei->Henan, Hebei->Beijing,
Henan->Jiangsu.
City-level network Zhangzhou->Xiamen, Jieyang->Guangzhou, Dongguan->Guangzhou, Chongqing-
>Guangzhou, Jingzhou->Wuhan, Kaifeng->Zhengzhou, Zhangzhou->Fuzhou, Bozhou-
>Hefei, Foshan->Guangzhou, Jiaozuo->Zhengzhou.
https://doi.org/10.1371/journal.pone.0248037.t003
PLOS ONE The circulation analysis of substandard foods in China
PLOS ONE | https://doi.org/10.1371/journal.pone.0248037 March 5, 2021 11 / 17

Fig 6. Substandard foods circulation cluster of cities.
https://doi.org/10.1371/journal.pone.0248037.g006
Fig 7. Circulation patterns of 361 cities. (The lines indicate circulation routes. The size of the circle represents the
weighted out-degree of each city. The color of the circle represents the weighted in-degree of each city.).
https://doi.org/10.1371/journal.pone.0248037.g007
PLOS ONE The circulation analysis of substandard foods in China
PLOS ONE | https://doi.org/10.1371/journal.pone.0248037 March 5, 2021 12 / 17

Chongqing, which has the highest frequency, can reach nearly 57% of the network directly. If
we use diverse set sizes, other key cities except Chongqing can be detected, including Beijing,
Zhengzhou and Chengdu. There are certain overlaps between key cities detected by informa-
tion diffusing and the key cities determined by node betweenness. This is because these two
indicators are both designed to identify major nodes through which a large number of paths
flow. It can be seen from Table 6 that Xinxiang, Deyang, and Shijiazhuang have not been iden-
tified by the previous indicators, but they are important from the perspective of information
diffusing. As the total number of selected key cities increases, the reciprocal distance index
also increases. Nonetheless, only when 49 key cities are included, all cities in the network can
be covered.
4. Discussion
In China, the food industry is dominated by small-size and medium-size enterprises, food
safety issues are constantly emerging and the cost of supervision is very high. Food circulation
is an important part of the entire food chain. Because of the nature of foods, and trends of food
production, processing or consumption in other places, the factors affecting the quality and
safety of foods in the field of circulation have increased. The pass rate of foods sampling
Table 4. Top 10 key paths (according to the edge betweenness).
Key paths Edge betweenness(%)
Zhengzhou(Henan)-Urumqi(Xinjiang) 5.51
Wuhai(Inner Mongolia)- Hohhot(Inner Mongolia) 4.97
Beijing-Chongqing 3.98
Beijing- Hohhot(Inner Mongolia) 3.49
Dongfang(Hainan)-Lianyungang(Jiangsu) 3.18
Ordos(Inner Mongolia)-Zhengzhou(Henan) 2.87
Changsha(Hunan)-Yueyang(Hunan) 2.86
Shanghai-Jinzhou(Liaoning) 2.75
Haikou(Hainan)-Zhangzhou(Fujian) 2.70
Beijing-Wuhan(Hubei) 2.67
https://doi.org/10.1371/journal.pone.0248037.t004
Table 5. Key cities based on information diffusing.
DR (%) 56.9 64.8 70 73.9 76.8 79.2 81.3 83 84.6 86
Chongqing � � � � � � � � � �
Beijing � � � � � � � � �
Zhengzhou � � � � � � � �
Chengdu � � � � � � �
Tianjin � � � �
Jieyang � � � �
Changsha � � � �
Fuzhou �
Anyang �
Shanghai � �
Deyang � �
Shijiazhuang � �
Xinxiang �
https://doi.org/10.1371/journal.pone.0248037.t005
PLOS ONE The circulation analysis of substandard foods in China
PLOS ONE | https://doi.org/10.1371/journal.pone.0248037 March 5, 2021 13 / 17

inspection in the circulation part is increasing gradually, but problems are still emerging in an
endless stream [41].
This study carries out a series of analyses on the networks of substandard foods production
and sales. Although the circulation density of substandard foods is relatively dense at the pro-
vincial level (mainly concentrated in a few provinces), it is sparse and highly diffused at the
municipal level. Despite the circulation of substandard foods is concentrated in some prov-
inces, the circulation within and between provinces is relatively scattered. Such characteristics
also increase the difficulty of substandard foods’ supervision. It is urgent to study the in-depth
regional characteristics and to identify key cities of the production and sales of substandard
foods, thereby formulating targeted strategies to break the circulation network according to
local conditions and improving the efficiency of substandard foods’ supervision.
Because the circulation of substandard foods is mostly local circulation and short distance
trafficking, many problems are difficult to find and easier to cover up. We propose to publicize
and encourage the public participating in food safety supervision in key cities. In addition, a
platform should be established to facilitate the public reporting violations of substandard
foods’ production and sales.
This study constructs city clusters according to the network connection characteristics of
substandard foods’ production and sales. Specific to the core cities in different clusters, gov-
ernment can design corresponding supervision schemes. The successful experience of gover-
nance in the core city can be directly applied to other cities in the same cluster to reduce the
regulatory costs. The government can change the cluster from large to small through effective
supervision and cut off the circulation chain.
According to the results of key cities identification, underdeveloped regions always have
less impacts on the network, including the northeast, northwest and southwest regions. And
key paths always originate from provincial capitals. It is worth noting that Chongqing, Beijing,
Zhengzhou and Changsha are identified as key cities according to all indicators in this study.
At least four indicators can identify Shanghai and Wuhan. Clearly, the importance of these cit-
ies makes them a top priority in combating substandard foods’ circulation networks.
5. Conclusions
This study applies GIS and social network analysis methods to deeply explore the regional cir-
culation characteristics of substandard foods. Based on GIS method, the dataset of Food Safety
Sampling Inspection Result Query System is used to obtain the geographical locations of sub-
standard foods’ manufacturers and distributors. Then the province-level and city-level sub-
standard foods’ circulation networks are constructed and social network analysis methods are
applied to explore the characteristics of the circulation networks, aiming at detecting the key
Table 6. Summary of the key cities identified by various indicators.
Indicator Top 10 key cities
Weighted degree Chongqing, Beijing, Zhengzhou, Shanghai, Guangzhou, Changsha,
Wuhan, Linyi, Hefei, Hangzhou
Weighted in-degree Chongqing, Beijing, Zhengzhou, Guangzhou, Shanghai, Wuhan,
Changsha, Hefei, Ningbo, Linyi
Weighted out-degree Chongqing, Shanghai, Beijing, Zhengzhou, Changsha, Jieyang, Wuhan,
Chaozhou, Zhangzhou, Linyi
Node Betweenness Beijing, Zhengzhou, Chongqing, Changsha, Chengdu, Guangzhou,
Wuhan, Urumqi, Xi’an, Shanghai
Information diffusing (reciprocal
distance index = 86%)
Chongqing, Beijing, Zhengzhou, Chengdu, Shanghai, Xinxiang, Deyang,
Changsha, Jieyang, Shijiazhuang
https://doi.org/10.1371/journal.pone.0248037.t006
PLOS ONE The circulation analysis of substandard foods in China
PLOS ONE | https://doi.org/10.1371/journal.pone.0248037 March 5, 2021 14 / 17

cities and paths of substandard foods’ circulations. The experimental results show that the cir-
culations of substandard foods are characterized by dense province-level network and sparse
city-level network. The circulation paths of substandard foods are mostly local and short-dis-
tance. According to the network connection characteristics and indicator calculation results,
361 cities are divided into 13 city clusters and Chongqing, Beijing, Zhengzhou, Changsha,
Shanghai and Wuhan are identified as key cities.
There are some limitations in this research. First, there is the limitation of data quality. The
data we used lacks some detail information. For example, the intermediate cities along the cir-
culation routes are not listed. With this detailed information, we can design preventive mea-
sures more precisely. The results in this study may deviate from the actual situations due to the
limitation of data quality. The regional imbalances in the circulation of substandard foods sug-
gest that the regulation in underdeveloped regions may be weak. Second, this study only uses
the food sampling quality and safety dataset for analysis. In the subsequent study, we will try to
integrate other auxiliary data (such as socio-economic population data that can reflect spatial
heterogeneity, accessibility of transportation networks, etc.) to quantify the circulation charac-
teristics, so as to further explore the patterns and causes of substandard foods’ circulation.
Supporting information
S1 File.
(XLS)
Author Contributions
Conceptualization: Yakun He, Jiadong Jiang.
Data curation: Yakun He, Shuo Li.
Formal analysis: Yakun He.
Funding acquisition: Jiadong Jiang.
Investigation: Yakun He.
Methodology: Yakun He.
Project administration: Jiadong Jiang.
Resources: Yakun He, Jiadong Jiang.
Software: Yakun He.
Supervision: Jiadong Jiang.
Validation: Yakun He, Shuo Li.
Visualization: Yakun He, Shuo Li.
Writing – original draft: Yakun He.
Writing – review & editing: Yakun He, Shuo Li.
References1. Meng S.; Jen J. J. Development of the Food Industry in China. In Food Safety in China: Science, Tech-
nology, Management and Regulation; Jen J. J., Chen J. S., Eds.; John Wiley & Sons, Ltd., 2017; pp.
43–51.
2. Office of the UN Resident Coordinator in China. UN in China, Occasional report: Advancing food safety
in China, Beijing, China. 2008.
PLOS ONE The circulation analysis of substandard foods in China
PLOS ONE | https://doi.org/10.1371/journal.pone.0248037 March 5, 2021 15 / 17

3. Jen J. J. Shared Responsibility of Food Safety. In Food Safety in China: Science, Technology, Manage-
ment and Regulation; Jen J. J, Chen J. S., Eds.; John Wiley & Sons, Ltd., 2017; pp. 1–14.
4. Gu Z. H. Review of last 30 year’s food hygiene inspection development in Shanghai. Journal of China’s
Food Hygiene. 2009, (21) 4, 299–303.
5. Zhang J. C. The historical dynamics of China’s food safety regulatory inspection systems, actual evalu-
ation, and the future direction. Journal of Henan Finance and Law University. 2013, (4), 90–98.
6. Yang H.; Li C, G. The past, present and future of China’s food safety. Reference of Economics
Research. 2011, (45), 2–8.
7. Gu Z. H.; Qiu C.; Yan Z. Food Safety Regulatory Inspection in China. In Food Safety in China: Science,
Technology, Management and Regulation; Jen J. J., Chen J. S., Eds.; John Wiley & Sons, Ltd.,
2017; pp.397–415.
8. The State Administration for Market Regulation. The State Administration for Market Regulation
answered questions on the sampling inspection of China’s food safety supervision in 2019. Available
online: http://www.samr.gov.cn/spcjs/sjdt/202006/t20200608_316267.html (accessed 7 June 2020).
9. Sheng X. D. “Problematic food” designed for the rural market: Causes and countermeasures—analysis
of corporate food fraud. Enterprise Vitality. 2011, 12, 59–62.
10. Yang B.; Qu D.; Zhang X.; Shen J.; Cui S.; Shi Y. Prevalence and characterization of Salmonella sero-
vars in retail meats of marketplace in Shaanxi, China. Int J Food Microbiol. 2010, 141(1–2), 63–72.
https://doi.org/10.1016/j.ijfoodmicro.2010.04.015 PMID: 20493570
11. Garrido A.; Chapela M.; Ferreira M.; Atanassova M.; Fajardo P.; Lago J. Development of a multiplex
real-time PCR method for pathogenic Vibrio parahaemolyticus detection (tdh+and trh+). Food Control.
2012, 24 (1–2), 128–135.
12. Tao P.; Zhi M. L.; Tang W. L.; Le Q. L.; Min H. P.; Xue Q.; et al. Associated factors in modulating afla-
toxin B1-albumin adduct level in three Chinese populations. Dig. Dis. Sci. 2005, 50, 525–532. https://
doi.org/10.1007/s10620-005-2468-1 PMID: 15810636
13. Wang J.; Liu X. M.; Zhang Z. Q. Exposure assessment of liver cancer attributed to dietary aflatoxins
exposure in Chinese residents. Chin. J. Prev. Med. (Beijing). 2009, 43, 478–481. PMID: 19950713
14. Wong K.; Fong T. T.; Bibby K.; Molina M. Application of enteric viruses for fecal pollution source tracking
in environmental waters. Environ. Intnl. 2012, 45, 151–164. https://doi.org/10.1016/j.envint.2012.02.
009 PMID: 22537583
15. Wu W.; Yang H.; Zhang H. L.; Xian H. X.; Yao X. J.; Zhao D. J.; et al. Surveillance of pathogens causing
gastroenteritis and characterization of norovirus and sapovirus strains in Shenzhen, China, during
2011. Arch. Virol. 2014, 159(8), 1995–2002. https://doi.org/10.1007/s00705-014-1986-6 PMID:
24610551
16. Li Z. S. Food Pathogenic Microbiology. Chi na Light Industry Press, Beijing, China, 2007.
17. Zhou P.; Chen N.; Zhang R. L.; Lin R. Q.; Zhu X. Q. Food-borne parasitic zoonoses in China: perspec-
tive for control. Trends Parasitol. 2008, 24(4), 190–196. https://doi.org/10.1016/j.pt.2008.01.001 PMID:
18314393
18. Wang C. Z.; Wu J.; Gao X. Y. History, reality and future of food additives. China Food Addit. 2014, (1),
61–67.
19. Ministry of Agriculture. The Sector Standard of the Ministry of Agriculture of the People’s Republic of
China: Guideline on Pesticide Residue Trials, NY/T 788-2004. China Agriculture Press, Beijing, China,
2004.
20. He Z. L.; Yang Y. E.; Stoffella P. J. Trace elements in agroecosystems and impacts on the environment.
J. Trace Elem. Med Biol. 2005, 19, 2–3. https://doi.org/10.1016/j.jtemb.2005.02.010 PMID: 16325528
21. Wu Y.; Miao H.; Shao G. Food fraud in Food Safety in China: Past, Present, and Future. China Science
and Technology Press, Beijing, China. 2016, 172–192.
22. Tang X. C.; Li X. M.; Zhang B. Y. Comparative research between domestic and abroad about Food
Fraud. Food Science. 2015, 36 (15), 221–227.
23. Zhu J. H.; Wang Y. R.; Song X. Y. Prevalence and quantification of Salmonella contamination in raw
chicken carcasses at the retail in China. Food Control. 2014, 44, 198–202.
24. Huang J. L.; Zong Q.; Zhao F.; Zhu J.; Jiao X. A. Quantitative surveys of Salmonella and Campylobacter
on retail raw chicken in Yangzhou, China. Food Control. 2016, 59, 68–73.
25. Wang Y. L. Implementation issues of Food Safety Law of the People’s Republic of China. Chinese
Metrology Press, Beijing, China, 2009.
26. Li X. Y. The status quo and development trends of China’s Food Hygiene Standard. Food Science.
2006, 27(9), 275–277.
PLOS ONE The circulation analysis of substandard foods in China
PLOS ONE | https://doi.org/10.1371/journal.pone.0248037 March 5, 2021 16 / 17

27. Chen X.; Xie M. Q. Food Safety Regulatory Inspection for Restaurants. China Medical Science Press,
Beijing, China, 2013.
28. Li Q. Q.; Li D. R. Big Data GIS. Geomatics Inf. Sci. Wuhan Univ. 2014, (06), 641–644.
29. Lam H. M.; Remais J.; Fung M. C.; Xu L.; Sun S. S. M. Food supply and food safety issues in China.
The Lancet. 2013, 381(9882), 2044–2053. https://doi.org/10.1016/S0140-6736(13)60776-X PMID:
23746904
30. Wasserman S.; Fraust K. Scocial network analysis: Methods and applications. Cambridge university
press, 1994.
31. Wang X. Agri-food supply chain modeling and risk propagation based on complex network theory. Jilin
Uiniversity, China, 2017. (Doctoral dissertation).
32. Yu B.W. Research on dynamic behavior and robustness of dairy product supply chain based on com-
plex network theory. Beijing Jiaotong University, China, 2017. (Master Dissertation).
33. Bastian, M.; Heymann, S.; Jacomy, M. Gephi: an open source softeware for exploring and manipulating
networks. In Proceedings of the Third International Conference on Weblogs and Social Media, ICWSM
2009, San Jose, California, USA, May 17–20, 2009, 361–362.
34. Borgatti S. P. Identifying sets of key players in a social network. Comput. Math. Organ. Theor. 2006,
12, 21–34.
35. Freeman L.C. Centrality in social networks: Conceptual clarification. Social Networks. 1979, 1, 215–
239.
36. Csardi G.; Nepusz T. The igraph software package for complex network research, InterJournal, Com-
plex Systems 1695. 2006.
37. Blondel V. D.; Guillaume J. L.; Lambiotte R.; Lefebvre E. Fast unfolding of communities in large net-
works. J. Stat. Mech. 2008, P10008.
38. Lancichinetti A.; Fortunato S. Community detection algorithms: a comparative analysis. Phys. Rev. E.
2009, 80(5), 056117. https://doi.org/10.1103/PhysRevE.80.056117 PMID: 20365053
39. Wang Z.; Wei L. Y.; Peng S.; Deng L. C.; Niu B. B. Child-trafficking networks of illegal adoption in China.
Nat. Sustain. 2018, 1(5), 254–260.
40. Wang L.M. Report of Food Industry Development for 2014. Chinese Light Industry Publication Press,
Beijing, China, 2015, 4–7.
41. Wu L.H.; Yin S.J.; Wang J.H. Introduction to 2014 China development report on food safety. Peking
University Press, Beijing, China, 2014, 83.
PLOS ONE The circulation analysis of substandard foods in China
PLOS ONE | https://doi.org/10.1371/journal.pone.0248037 March 5, 2021 17 / 17
Related Documents