THE CIRCULAR PATH OF SOCIAL SUSTAINABILITY: AN EMPIRICAL ANALYSIS ABSTRACT The sustainable human resource management literature provides arguments linking the social sustainability dimensions of business and society, suggesting a circular or two-way relationship between them. The norm of reciprocity builds social sustainability by increasing trust and cooperation in any group of people and explains this complex relationship. In this study, we test the connection between society––poverty and inequality––and business––human resource investment strategy––using a large longitudinal data set with six time points. Findings showed that past poverty negatively contributes to a later investment human resource strategy and vice versa. This mutual relationship configures a positive feedback loop where environmental social sustainability and organizational social sustainability enhance each other. Results also show that investment human resource strategy negatively affects income inequality, revealing that corporate decisions on social sustainability can affect social sustainability of society. Keywords: sustainable human resource management, social sustainability, business and society, longitudinal structural equation modeling.

Welcome message from author
This document is posted to help you gain knowledge. Please leave a comment to let me know what you think about it! Share it to your friends and learn new things together.
Transcript
THE CIRCULAR PATH OF SOCIAL SUSTAINABILITY: AN EMPIRICAL
ANALYSIS
ABSTRACT
The sustainable human resource management literature provides arguments linking the social
sustainability dimensions of business and society, suggesting a circular or two-way relationship
between them. The norm of reciprocity builds social sustainability by increasing trust and
cooperation in any group of people and explains this complex relationship. In this study, we
test the connection between society––poverty and inequality––and business––human resource
investment strategy––using a large longitudinal data set with six time points. Findings showed
that past poverty negatively contributes to a later investment human resource strategy and vice
versa. This mutual relationship configures a positive feedback loop where environmental social
sustainability and organizational social sustainability enhance each other. Results also show
that investment human resource strategy negatively affects income inequality, revealing that
corporate decisions on social sustainability can affect social sustainability of society.
Keywords: sustainable human resource management, social sustainability, business and
society, longitudinal structural equation modeling.
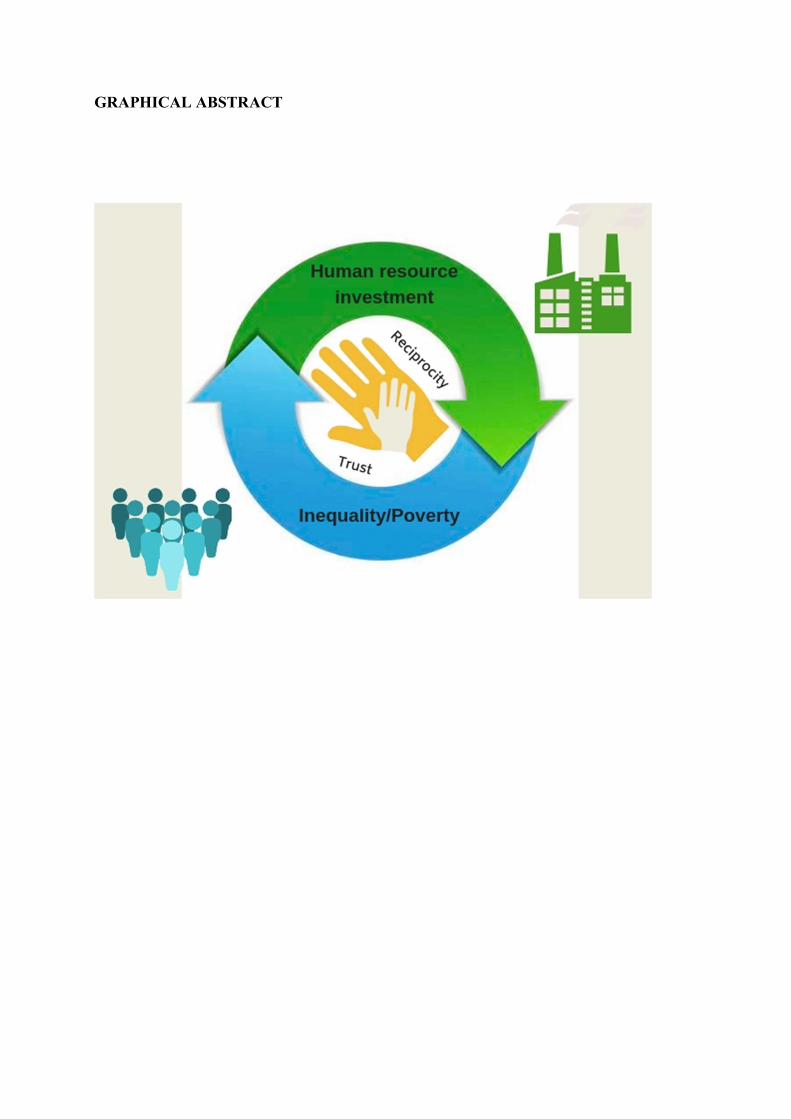
GRAPHICAL ABSTRACT
1. INTRODUCTION
Reducing countries’ poverty and income inequality are two of the priority objectives of
the 2030 Agenda for Sustainable Development, approved on September 25, 2015 by the
General Assembly of the United Nations (UN). Poverty refers to certain deprivations or
shortcomings suffered by people in a society that endanger their well-being (Bourguignon,
2004; Cobb, 2016). Poverty is manifested as the denial of the most fundamental opportunities
and options for human development. Inequality refers to the disparity in the distribution of
income among members of a society, which allows one group certain opportunities for human
development while denying them to another (Cobb, 2016). Although the two concepts represent
different and pernicious facets of the human or social dimension of a society’s sustainable
development (Florea et al., 2013; Hutchins & Sutherland, 2008; Rogers et al., 2012; Sharma &
Ruud, 2003), they have received scarce attention in the sustainability literature, which mainly
focuses on examining the physical or ecological dimensions of sustainability (Ajmal et al.,
2017; Athanasopoulou & Selsky, 2015; Hughes, et al., 2017; Pfeffer, 2010; Sharma & Ruud,
2003).
Despite the positive proposals of UN, poverty and income inequality within developed
countries, particularly among their different regions, have increased in recent years due to the
economic crisis that began in 2008 (Cobb &Stevens, 2017; Jiang & Probst, 2017; Piacentini,
2014). The level and disparity of the income of the population in the geographic area in which
an organization is located provides the context for the processes of social exchange between
people. This circumstance therefore affects the organizational behavior of the companies
located in that area and, at the same time, because employees and the organizations interact
with other people and agents in that territory, organizational behavior can contribute to the
socioeconomic development of that region (Leana & Meuris, 2015). In other words, there is a
bilateral or two-way relationship between society and business. Consequently, organizational

research is needed to introduce the environment’s socio-economic characteristics into the
management debate (Bapuji, 2015; Cobb, 2016; Cobb & Stevens, 2017, Leana & Meuris,
2015), especially in the area of human resources management, which represents the social
dimension of organizational sustainability (Hughes, et al., 2017; Pfeffer, 2010).
The marginalization and interpretative flexibility of social sustainability means that
there is still no clear definition of this concept and its components, which recommends
understanding it as a framework that can be used to communicate, make decisions, and assess
progress (Boström, 2012; Broman and Robèrt, 2017; Peterson, 2016). This frame can be
dynamic over time and encompass the identification of a variety of elements in different areas
and how they can mutually influence one other (Peterson, 2016), including clearly defined ideas
about what kinds of social values to promote (Boström, 2012). A common denominator of many
investigations has been to highlight some essential ethical values, such as equity, trust,
cooperation, justice, and fairness, as the heart of social sustainability (e.g., Ajmal et al., 2017,
Boström, 2012; Čiegis et al., 2008; Jabbour, & de Sousa Jabbour, 2016; Peterson, 2016). In this
regard, a group of researchers integrated under the project "Framework for Strategic Sustainable
Development" (Broman & Robèrt, 2015; Missimer et al., 2017a, b) identify social trust as the
central ethical value of social sustainability, therefore, understand how social trust is built is
key to maintaining social sustainability, being necessary to examine the mechanisms that hinder
(or favor) it and the possible interrelationship between them over time. Given that normally
social sustainability has been examined at societal and organizational scopes (e.g., Ajmal et al.,
2017; Missimer et al., 2017b), it would be especially important to study the potential mutual
effect between elements located in these two areas.
The sustainable human resource management (HRM) literature explicitly recognizes
this relationship of interdependence between society and companies’ human resources
strategies (e.g., Ehnert et al., 2014; 2016; Jabbour & Santos, 2008; Kramar, 2014; Renwick et
al., 2013). From this perspective, it is argued that the social dimension of society and the social
dimension of the company influence and support each other, forming a circular relationship
between them. However, most of the previous research is of a conceptual or merely exploratory
nature (Ehnert et al., 2016; Macke & Genari, 2019) and this link has been recognized only at a
theoretical level, thus creating a need for empirical studies to corroborate its existence (Ehnert
et al., 2016; Mariappanadar, 2014; Renwick et al., 2013). The purpose of this study is to
contribute to bridging this gap by focusing on the social dimension of sustainability and
analyzing the potential existence of a bidirectional relationship between poverty and income
inequality in a society and the human resources strategy of the companies located in that society.
In societal scope, poverty and income inequality are related to the lack of trust and in the
organizational sphere the investment in human resources is associated with trust. Only through
a better understanding of this relationship between business and society, we can make progress
on the path toward social sustainability (Hutchins & Sutherland, 2008). The empirical
corroboration of this relationship would therefore represent a significant advance in the field of
sustainable HRM.
From a methodological point of view, as a dynamic approach is necessary to examine
the interdependence between society and business (Ehnert et al., 2014), we designed a
longitudinal structural equation model that is capable of adequately representing a bidirectional
causal relationship between two variables at different points in time (Little, 2013). More
methodical and empirical efforts are required to continue understanding the cause-and-effect
relationships between various social sustainability elements over time (Mesmer-Magnus et al.,
2012; Rogers et al., 2012). Our empirical study is developed in the European context,
specifically in Spain. As the European Commission underlines in its "ImPRovE" project1,
sponsored by the European program "Horizon 2020", in Europe the economic crisis has not yet
been overcome and is generating high poverty and inequality in the population of certain
regions, considerably increasing the disparities between different geographical areas (Kis &
Gábos, 2015, Piacentini, 2014). Spain is an illustrative example of this circumstance, since the
disparity between Spanish regions in terms of poverty and inequality is much greater at present
(Ayala & Jurado, 2015, Llano, 2017). This high divergence is a necessary condition for
choosing a country as a territorial framework with the objective of examining the interrelation
between society and business (Cobb & Stevens, 2017).
2. THEORETICAL FRAMEWORK
2.1. Social sustainability
In 1987, the UN "World Commission on Environment and Development" produced the
Brundtland Report, which defined sustainability as development capable of meeting the needs
of the present without compromising the ability of future generations to satisfy your own needs.
In this report, sustainability refers to the ability to sustain over time in three basic dimensions
of a human system, namely, the protection of the environment, economic growth and social
inclusion. These three pillars are generally assumed to be compatible and mutually supportive
(Boström, 2012). Much of the debate on sustainability has been dominated by ecological and
economic factors, so when sustainable development is supported, the social dimension attracts
less attention and, as a result of this neglect, it is the least conceptually developed of the three
pillars, being difficult to define and operationalize (Ajmal et al., 2017; Boström, 2012;
1 “Poverty Reduction in Europe: Social Policy and Innovation” (ImPRovE) is an international research
project that brings together a broad network of researchers in a concerted effort to study poverty and
social policy in Europe.
Missimer et al., 2017a; Staniškienė & Stankevičiūtė, 2018). A reflection of this ambiguity is
the wide range of definitions of social sustainability that we find in the literature (Ajmal et al.,
2017). Many of these definitions share that social sustainability is a quality of a human system
that is based on a series of values or essential ethical principles (e.g., fairness, trust, equity,
justice, cooperation, engagement) that foster lasting conditions for human well-being ,
particularly for those most vulnerable people or groups (e.g., Ajmal et al., 2017, Boström, 2012,
Hollander et al., 2016, Sharma and Ruud, 2003). In that sense, social sustainability is not about
a bounteous human life, but about satisfy the basic conditions that are necessary for the human
system to not systematically degrade (Missimmer et al., 2017a),
Missimer et al., (2017a,b) observe social sustainability from a social system's
perspective and identify trust as he preponderant value of a vital human system. “Trust is
defined as an attitude that enables an agent to cope with situations of uncertainty and lack of
control, by making themselves vulnerable based on positive expectations towards another
agent, derived from the assessment of the trustworthiness of the trusted agent” (Missimer et al.,
2017b; p. 46). Like all living systems, human social systems can be considered complex
adaptive systems, and trust is seen as a quality of connection to deal with the risk and
uncertainty inherent in this complexity. Also, trust allows coordinate the system in its
adaptation and generate for collective action. It is no easy to conceive a sustainable social
system without trust relationships, the basis of a cooperative behavior and the glue that connects
the members of a social system, allowing the system to remain together. Social sustainability is
about the elimination of mechanisms of systematic degradation of social trust (Missimer et al.,
(2017a,b). Following this perspective within the societal context, some definitions of social
sustainability propose eliminating these mechanisms. Thus, for example, the 2030 Agenda for
Sustainable Development emphasizes that the eradication of poverty is an indispensable
condition for achieving sustainable development, in such a way that inclusive and equitable
economic growth must be promoted, reducing inequalities between people. Impoverished and
unequal societies are related to an absence of social trust (Haushofer & Fehr, 2014; Missimer
et al., 2017b, Wilkinson & Pickett, 2010, 2017).
Within the business context, social trust are related to job security, health and safety,
training and learning, wages that allow for a basic decent living, and professional growth
(Missimer et al., 2017b). These core human resources management practices are in line with
employee cooperation and involvement (Jabbbour & de Sousa Jabbour, 2016) and with social
exchange theory (Awan et al., 2018) largely underlined in the social sustainability literature.
Social exchange theory adheres to the rules of mutual commitment between members in an
organization and is established on the cultural values of trust and fairness that support
cooperative behavior, in such a way that the granting of a benefit creates the obligation of
reciprocate (Cropanzano & Mitchell, 2005; Gouldner, 1960). Employee cooperation is a key
component of social sustainability and enables reaching the synergy effect of sharing
experiences with colleagues lead to members involvement (Staniškienė & Stankevičiūtė, 2018).
Grounded on social exchange theory and in supply chain context, Awan et al., (2018) suggest
that social trust and cooperation are the basis for a relational governance in the buyer-supplier
relationship, being regulated by shared norms of reciprocity that originate obligations for
promote a mutual adjustment and joint action.
2.2. Sustainable HRM
As we explained above, the analysis of social sustainability leads us to observe society
and organizations as intrinsically human entities, in which the attitudes and values that guide
people’s behavior drive the social transformations necessary to ensure human well-being. Some
studies on sustainable HRM dealt with the link between human resources management and the
social dimension of sustainability, especially with regard to organizational social responsibility,
therefore, the principles of social sustainability are embedded in sustainable HRM (Macke and
Genari, 2019). Sustainable HRM implies social norms that contemplate the ethical principles
of loyalty, trust, mutual commitment and equity in labor relations and, therefore, stimulate
sustainable individual and organizational behavior (Athanasopoulou & Selsky; 2015; Gollan,
2005; Jabbour & Santos, 2008). In this regard, authors such as Florea et al., (2013), Hutchins
and Sutherland (2008) and Renwick et al., (2013) agree that the social dimension of
organizational sustainability is based on the “norm of reciprocity” (Gouldner, 1960), which
holds that people should help those who helped them and, thus, those you have helped have an
obligation to help you. According to Gouldner (1960), this moral principle contributes to the
long-term maintenance of any stable social group. The social norm of reciprocity is therefore
associated with the universal ethical values of trust and cooperation, typical of the definition of
sustainable development, applicable both in the sphere of organizations and in that of society.
In a poor and unequal society, the values of cooperation and trust on which reciprocal
behavior is based are weakened (Jiang & Probst, 2017; Leana & Meuris, 2015; Pitesa et al.,
2017; Wilkinson & Pickett, 2010, 2017). Income inequality creates a more competitive and less
cohesive social environment, and displaces us from social behavior characterized, at one
extreme, by exchange and reciprocity, to social behavior characterized by individual interest
and the dominant hierarchy. People are much more likely to feel that they can trust others in
more equitable societies (Leana & Meuris, 2015). Similar to inequality, poverty is a precursor
to the lack of trust among the members of a society (Pitesa et al., 2017). Those with scarce
material resources (e.g., people who earn a minimum wage) and who may be below the poverty
line established in a society have a lower capacity for trust, which in turn reduces reciprocity
between members of a society. This decreased cooperation can cause social division, contribute
to social stratification and reduce socioeconomic opportunities for people of all social groups
(Pitesa et al., 2017). In short, the social values of trust and inclusion integrated into the concept
of sustainable development are undermined in poor and unequal societies (Missimer et al.,
2017b; Rogers et al., 2012, Sharma & Ruud, 2003).
In the organizational sphere, the norm of reciprocity is reflected in the implementation
of an HR investment strategy. Although the specific HR practices to be considered as part of
an HR investment strategy vary among studies, many researchers agree that three main HR
practices reflect firms’ investments in their employees, namely, competitive remuneration,
training and job security (e.g., Batt & Colvin, 2011; Miller & Lee, 2001; Roca-Puig et al.,
2012,2018; Roh & Kim, 2016; Subramony et al., 2008). These HR investments can be
considered as inducements offered by the firm to its employees and are intended to send signals
about high levels of employer commitment to all employees. Investing in employees is repaid
in the form of employee commitment to the organization, and committed employees are more
likely to engage in positive employee attitudes and extra-role behaviors (e.g., cooperation, trust
and organizational citizenship behaviors), creating what Mesmer-Magnus et al. (2012) term “a
culture of citizenship and ethicality” (Miller & Lee, 2001; Subramony et al., 2008). HR
investments contribute to more positive attitudes among employees in light of the norm of
reciprocity premise. Authors such as Florea et al., (2013), Gollan (2005), Kramar (2014) and
Zink (2014) recognize that sustainable HRM overlaps with a socially responsible human
resources management in which the company’s investments in improving its employees’ well-
being will be matched in the form of greater effort and motivation in their work place,
generating a social climate of trust and collaboration between the organization and employees
that is sustainable in the long term. Sustainable organizations act in the expectation of receiving
the benefit of taking employee well-being into consideration (Kobayashi et al., 2018).
The social context within which the norm of reciprocity develops is too complex to be
contained in only one of these two spheres, so the integration of society and business becomes
more evident. The sustainability values of trust and cooperation inherent in the norm of
reciprocity that shape the social climate among a group of people, both a society and an
organization, allow a connection between the environment and business strategy, thus
regulating the mutual influence between poverty and inequality, and HR investments.
Athanasopoulou and Selsky (2015) explain that people are immersed simultaneously in two
basic social contexts, namely, the organization in which they work and the society in which
they live, and find it difficult to demarcate the two realities. For this reason, when a person
develops an attitude of trust or a cooperative behavior in one of these two spheres, it inevitably
transfers to the other. The respective social norms or ethical values developed in one of these
two areas influences the other, tending in the long term to a significant correspondence. In other
words, the values and behaviors of employees are shared by society and by the business.
Therefore, if employees are immersed in an impoverished and/or unequal socio-
economic environment, they transfer the values of lack of confidence and reduced cooperation
to their own work, limiting their involvement with the organization and hindering a social
climate of collaboration in the company. Obviously, this anti-cooperative behavior makes it
difficult to implement the HR investment strategy, which promotes the development of ethical
or positive values at the organizational level. In this sense, authors such as Bapuji (2015) and
Leana and Meuris (2015) indicate that the community around an organization can influence the
behavior of people within it and organizations might engage in less socially responsible
behavior when they are located in a poor and/or unequal socioeconomic environment.
In the reverse direction, the impact of HR practices on the social dimension of the
environment is one of the basic points of the sustainable HRM perspective (Ehnert et al., 2014;
Mariappanadar, 2014). As Zink (2014) states, as people spend more time in their jobs, this is
the most appropriate place to learn and apply sustainability. Why should people act sustainably
as citizens if they have never had the opportunity to do so as employees? Only people who work
in a company in a sustainable manner are able to prioritize and move towards the social
sustainability of society (Pfeffer, 2010). The development of positive values and attitudes in
people increasingly depends on how they are treated as relevant and valued human resources at
work. The HR investment strategy allows this set of human capacities, created in the workplace,
to be externalized to the society in which the organization operates, thus counteracting the non-
cooperative values generated by poverty and income inequality. Positive reciprocity between
an organization and employees improves the organizational social climate and, ultimately,
affects the welfare of society (Hutchins & Sutherland, 2008).
In addition, sustainable HRM adopts the general systems theory (Kast & Rosenzweig,
1972) and maintains that an organization is an open system in constant interaction with its
environment, which receives its inputs from and returns its outputs to the environment
(Athanasopoulou & Selsky, 2015; Jabbour & Santos, 2008, Kramar, 2014, Renwick et al.,
2013). It is therefore a continuous flow of inputs and outputs that forms a feedback loop
between the environment and the business that contributes to achieving a stable state of dynamic
equilibrium between both spheres in the long term. This interactive process implies the
recognition that society and business are interdependent (Ehnert et al., 2016, Kramar, 2014). If
we apply this systemic approach to social sustainability, then ethical values and positive
employee behaviors become the product (input/output) that flows between business and society.
The features of society (i.e., poverty and inequality) and business (i.e., HR investment strategy)
contribute to improve (or deteriorate) that product. While the HR investment strategy
“produces” ethical values in organizations, poverty and income inequality “produce” unethical
values in society. This input-output representation helps describe the social flow to/from
business in response to changes in society (Hutchins & Sutherland, 2008).
In this way, a positive feedback process is set up between the social sustainability of
society and business, where the greater the implementation of the HR investment strategy in
organizations, the lower the poverty and income inequality of society, and vice versa. This
circular relationship between society and business means that sustainable HRM develops
mutually beneficial relationships for both entities and that, in turn, they regenerate over time
(Ehnert et al., 2016). Thus, there is a positive bidirectional relationship between the social
sustainability of society and the social sustainability of the organizations located within that
society. This positive interdependence is expressed in our study in a negative sense, given that
we examine two characteristics that are contrary to a society’s social sustainability––namely
poverty and inequality––in such a way that we propose the following two hypotheses:
H1. There is a negative two-way relationship between the poverty of society and
businesses’ HR investment strategy
H2. There is a negative two-way relationship between the inequality of society and
businesses’ HR investment strategy
3. METHODOLOGY
3.1. Information sources and measures
To test the above hypotheses, data from two basic public information sources in Spain
were used: 1) the Survey on Business Strategies (Encuesta sobre Estrategias Empresariales,
ESEE) prepared by the SEPI (Sociedad Estatal de Participaciones Industriales) Foundation,
attached to the Ministry of Industry; and 2) the Living Conditions Survey (Encuesta de
Condiciones de Vida, ECV), from which the National Institute of Statistics (Instituto Nacional
de Estadística, INE) calculates the AROPE (At Risk of Poverty and/or Exclusion) index and
the Gini coefficient for Spanish regions (i.e., autonomous communities). Spain is a quasi-
federal country with extensively decentralized basic public services (health, education and
social protection) in its 17 autonomous communities, corresponding to NUTS 2 level regions
in Europe (Eurostat, 2015)2.
The ESEE is an annual survey whose statistical population is the Spanish industrial
firms with 10 or more workers. Firms are selected on the basis of a combination of
exhaustiveness and random sampling criteria. by SEPI Foundation. The ESEE is a high-quality
database representative of the Spanish context that provides information based on panel data,
and sustains a wide empirical economic research carried out by both the internal services of the
Ministry of Industry and a growing number of researchers who request such data from the SEPI
Foundation (SEPI Foundation, 2018). The SEPI Foundation is responsible for the survey’s
design and administration, and all information contained in the ESEE is subjected to quality
controls and logical consistence.
The ECV is an annual survey whose statistical population is Spanish households. In the
ECV, the incomes used to calculate the AROPE index and the Gini coefficient correspond to
the previous year. Both indicators are used by the European Commission to measure,
respectively, the degree of poverty and inequality of the regions in Europe (Piacentini, 2014).
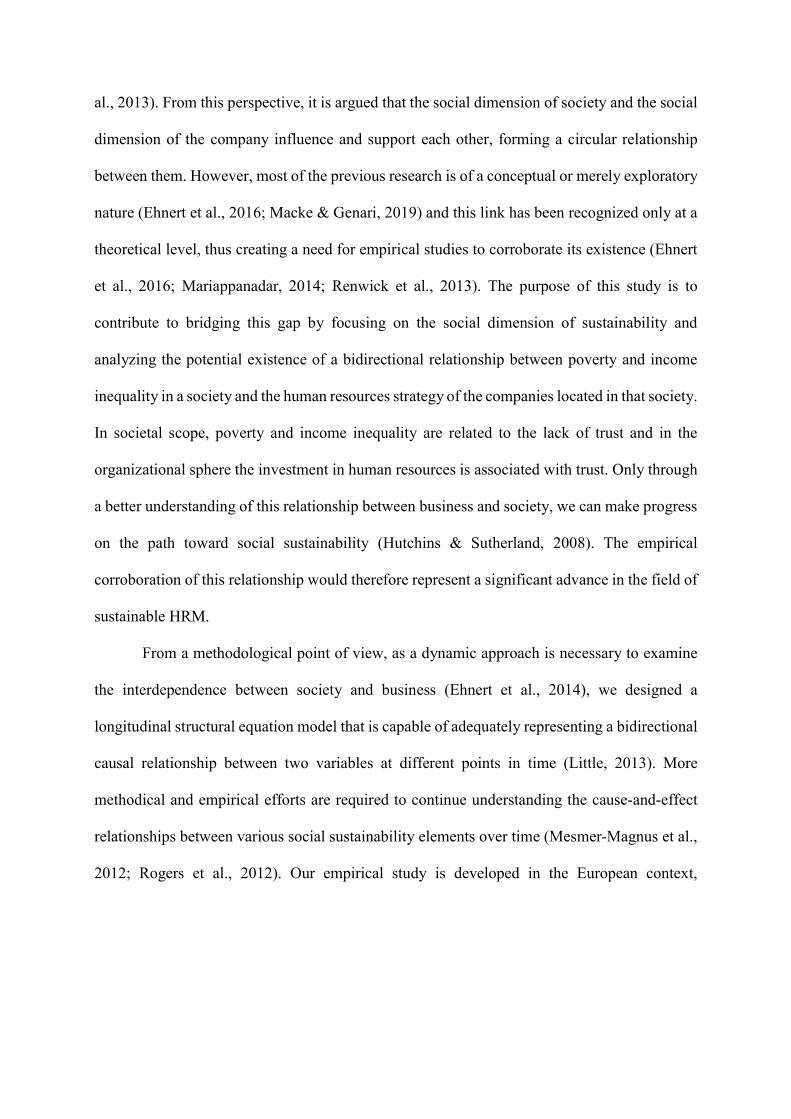
We use the ECV data for the 2011-2016 period. These six years were selected mainly because
in Europe (Piacentini, 2014), and particularly in Spain (Llano, 2017), the diversity of the regions
in terms of poverty and inequality is greater during this period than before the crisis. Figure 1
shows that there is no pattern of common evolution between Spanish regions. In addition,
similarly to Cobb and Steven’s (2017) analysis of the states in the USA, we chose the
2 Eurostat identifies the cities of Ceuta and Melilla as NUTS 2 territories, extending the Spanish regions
to 19. However, the INE does not calculate the Gini coefficient for these two territories given the limited
sample of population. Likewise, neither does ESEE include these two territories in its scope of study.
Our study is therefore limited to analyzing organizations in the 17 autonomous communities.

25
30
35
2011 2012 2013 2014 2015 2016
Gin
i co
eff
icie
nt
Year
Andalucía
Aragón
Asturias
Baleares
Canarias
Cantabria
Castilla y León
Castilla - La Mancha
Cataluña
Valencia
Extremadura
Galicia
Madrid
Murcia
Navarra
País Vasco
Rioja
8
18
28
38
2011 2012 2013 2014 2015 2016
AR
OP
E i
nd
ex
Year
Andalucía
Aragón
Asturias
Baleares
Canarias
Cantabria
Castilla y León
Castilla - La Mancha
Cataluña
Valencia
Extremadura
Galicia
Madrid
Murcia
Navarra
País Vasco
Rioja
autonomous communities in Spain because the annual historical data of poverty and inequality
for other subnational entities (e.g., provinces) are not available in the ECV.
Figure 1. Evolution of income inequality and poverty by autonomous communities
Source: INE
We combine the annual data from the ECV and the ESEE in such a way that the unit of
analysis is the company. This fusion requires identifying the region in which a firm performs
its productive activity in order to assign it the corresponding AROPE and Gini indices for each
of the six years analyzed. To do this, we only selected those companies located in a single
autonomous community and that did not change their location during the period of time
analyzed. Moreover, there is a time lag of one year between the ECV and the ESEE databases
that must be adjusted. As noted above, income in the ECV data always corresponds to the
previous year, while this is not the case for the ESEE, in which the annual data collected actually
correspond to the year indicated. Therefore, for the data to be temporally consistent, we use the
ESEE data corresponding to the 2010-2015 period and the ECV data for the years 2011-2016.
From the original ESEE sample for 2010-2015 period, we remove firms with industrial
premises located in more than one region and those that moved from one region to another
during the period studied (184 firms). Additionally, as the SEPI Foundation (2018) warns, we
eliminated firms affected by takeovers, divisions or mergers (206 firms), all of which prevent
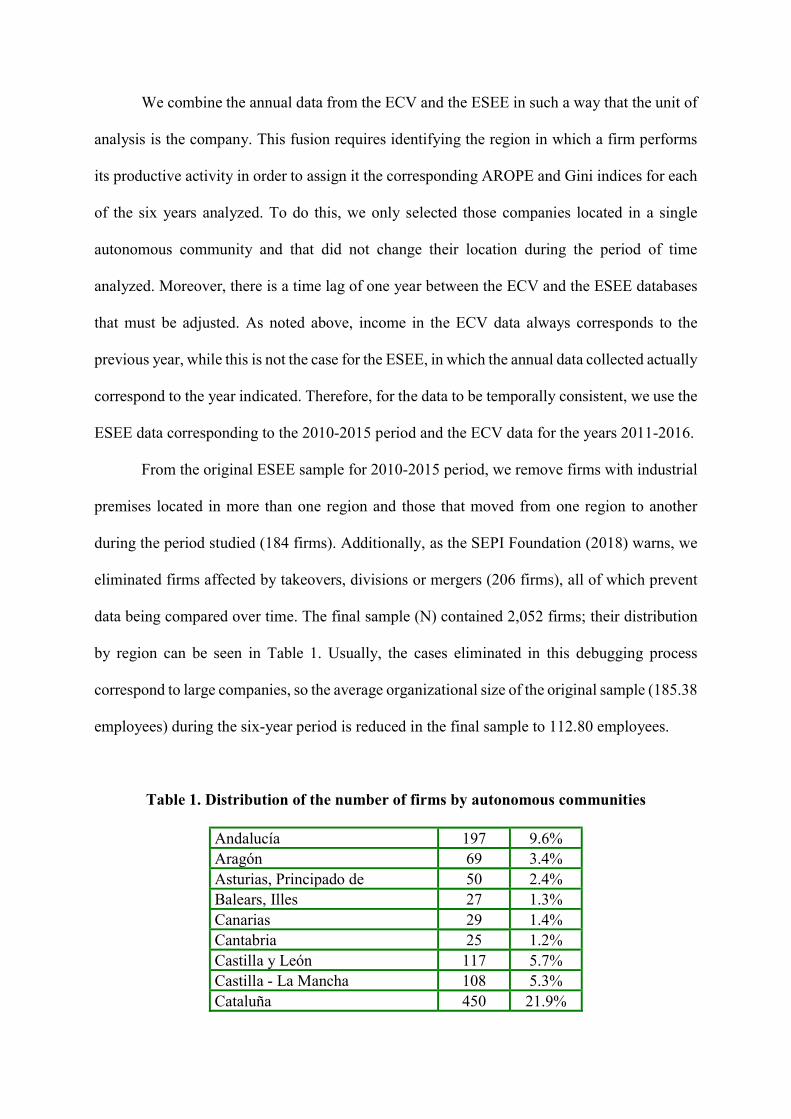
data being compared over time. The final sample (N) contained 2,052 firms; their distribution
by region can be seen in Table 1. Usually, the cases eliminated in this debugging process
correspond to large companies, so the average organizational size of the original sample (185.38
employees) during the six-year period is reduced in the final sample to 112.80 employees.
Table 1. Distribution of the number of firms by autonomous communities
Andalucía 197 9.6% Aragón 69 3.4% Asturias, Principado de 50 2.4% Balears, Illes 27 1.3% Canarias 29 1.4% Cantabria 25 1.2% Castilla y León 117 5.7% Castilla - La Mancha 108 5.3% Cataluña 450 21.9%
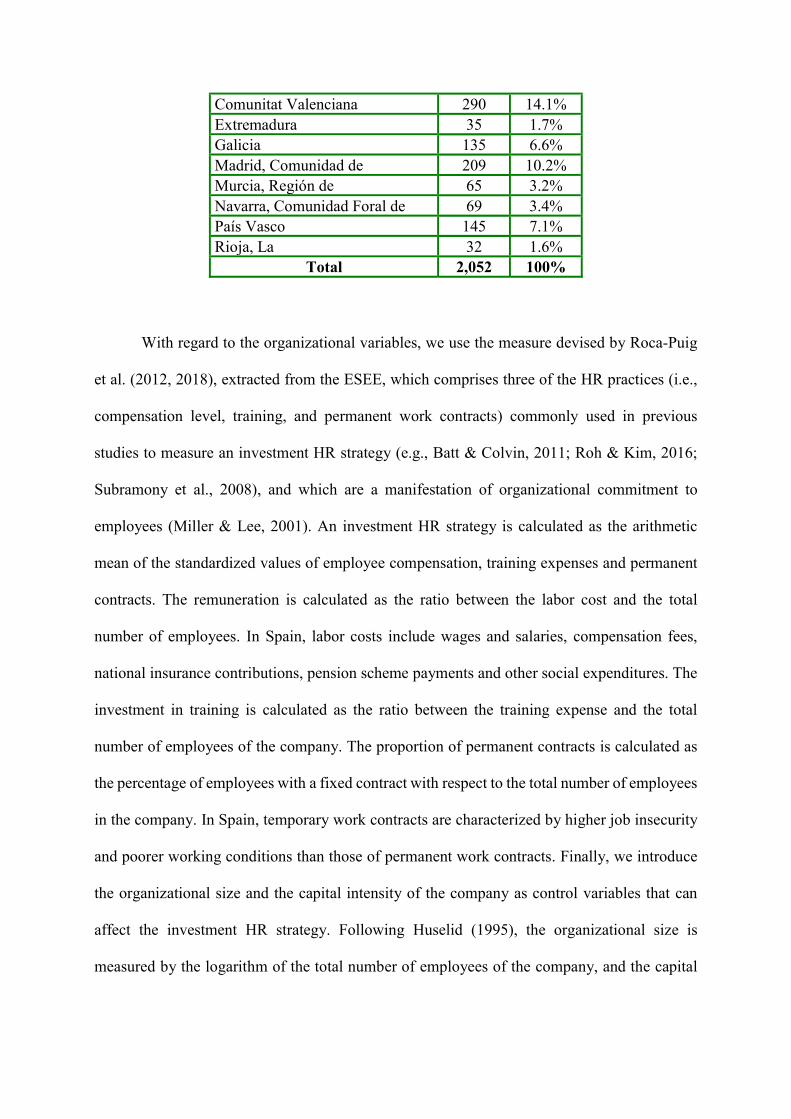
Comunitat Valenciana 290 14.1% Extremadura 35 1.7% Galicia 135 6.6% Madrid, Comunidad de 209 10.2% Murcia, Región de 65 3.2% Navarra, Comunidad Foral de 69 3.4% País Vasco 145 7.1% Rioja, La 32 1.6%
Total 2,052 100%
With regard to the organizational variables, we use the measure devised by Roca-Puig
et al. (2012, 2018), extracted from the ESEE, which comprises three of the HR practices (i.e.,
compensation level, training, and permanent work contracts) commonly used in previous
studies to measure an investment HR strategy (e.g., Batt & Colvin, 2011; Roh & Kim, 2016;
Subramony et al., 2008), and which are a manifestation of organizational commitment to
employees (Miller & Lee, 2001). An investment HR strategy is calculated as the arithmetic
mean of the standardized values of employee compensation, training expenses and permanent
contracts. The remuneration is calculated as the ratio between the labor cost and the total
number of employees. In Spain, labor costs include wages and salaries, compensation fees,
national insurance contributions, pension scheme payments and other social expenditures. The
investment in training is calculated as the ratio between the training expense and the total
number of employees of the company. The proportion of permanent contracts is calculated as
the percentage of employees with a fixed contract with respect to the total number of employees
in the company. In Spain, temporary work contracts are characterized by higher job insecurity
and poorer working conditions than those of permanent work contracts. Finally, we introduce
the organizational size and the capital intensity of the company as control variables that can
affect the investment HR strategy. Following Huselid (1995), the organizational size is
measured by the logarithm of the total number of employees of the company, and the capital
intensity is calculated as the logarithm of the ratio between the net fixed assets and the total
number of employees.
3.2. Statistical procedure
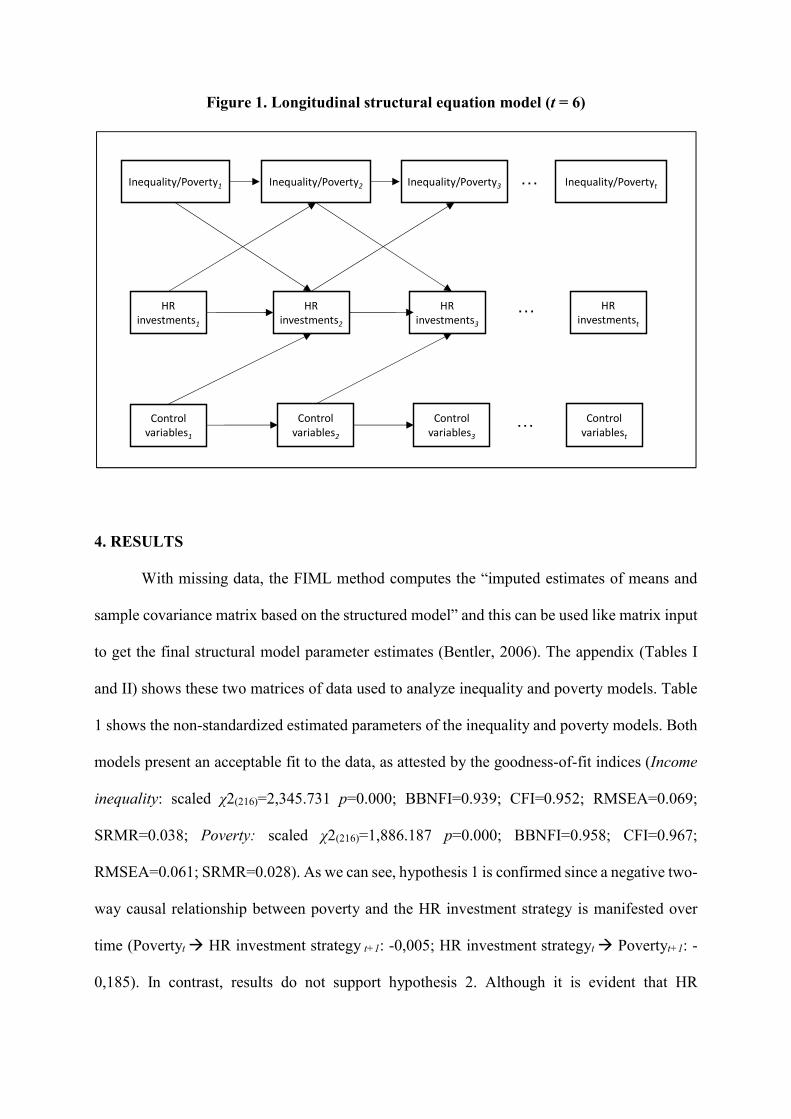
Following the indications of Little (2013), we estimate a cross-lagged panel model using
longitudinal structural equation modeling. Figure 1 shows the autoregressive effects (causal
relationships between the same variable over time) and the cross-effects (causal relationships
between different variables over time) typical of this kind of longitudinal model. We propose a
time lag of one year in these cross-lagged effects and, to ensure greater parsimony of the model,
the magnitude of all these effects was constrained to be equal over time. In longitudinal
analysis, researchers often specify such constraints to facilitate interpretation of the results
(Cole & Maxwell, 2003). We estimate one model for poverty and another similar model for
inequality, since the complexity in the design of longitudinal analysis suggests their separate
study. In addition, for various reasons, each year some firms disappear from the ESEE database
and new firms are included, so during the six-year period analyzed there are incomplete cases.
This situation is typical of longitudinal analysis, and as a result, the full-information maximum
likelihood (FIML) procedure is recommended for estimating the parameters of the model, in
order to take advantage of all the available information and to avoid bias in the estimated
parameters that the elimination of incomplete cases (i.e., listwise deletion) could imply (Little,
2013). The two cross-lagged panel models (poverty and inequality) were estimated using FIML
with EQS software (Bentler, 2006). In addition, robust standard errors were used to protect
inferences from non-normality of the data (Shin et al., 2009). To assess fit of the model to the
data, for each model we report the Yuan-Bentler scaled chi-square statistic (χ2), the Bentler-
Bonett non-normed fit index (BBNFI), the comparative fit index (CFI), the root mean square
error of approximation (RMSEA), and the standardized root mean square residual (SRMR).
HR investments1
Control variables1
Control variables2
Control variables3
HR investmentst
Control variablest
Inequality/Poverty1 Inequality/Poverty2 Inequality/Poverty3 Inequality/Povertyt…
…
…
HR investments2
HR investments3
Figure 1. Longitudinal structural equation model (t = 6)
4. RESULTS
With missing data, the FIML method computes the “imputed estimates of means and
sample covariance matrix based on the structured model” and this can be used like matrix input
to get the final structural model parameter estimates (Bentler, 2006). The appendix (Tables I
and II) shows these two matrices of data used to analyze inequality and poverty models. Table
1 shows the non-standardized estimated parameters of the inequality and poverty models. Both
models present an acceptable fit to the data, as attested by the goodness-of-fit indices (Income
inequality: scaled χ2(216)=2,345.731 p=0.000; BBNFI=0.939; CFI=0.952; RMSEA=0.069;
SRMR=0.038; Poverty: scaled χ2(216)=1,886.187 p=0.000; BBNFI=0.958; CFI=0.967;
RMSEA=0.061; SRMR=0.028). As we can see, hypothesis 1 is confirmed since a negative two-
way causal relationship between poverty and the HR investment strategy is manifested over
time (Povertyt HR investment strategy t+1: -0,005; HR investment strategyt Povertyt+1: -
0,185). In contrast, results do not support hypothesis 2. Although it is evident that HR
investment strategy has a negative and significant impact on inequality during the analyzed
period (HR investment strategyt Income inequalityt+1: -0,068), the reverse negative effect is
not significant (Income inequalityt HR investment strategyt+1: -0,002). Therefore, only one
unidirectional causal relationship appears between these two variables.
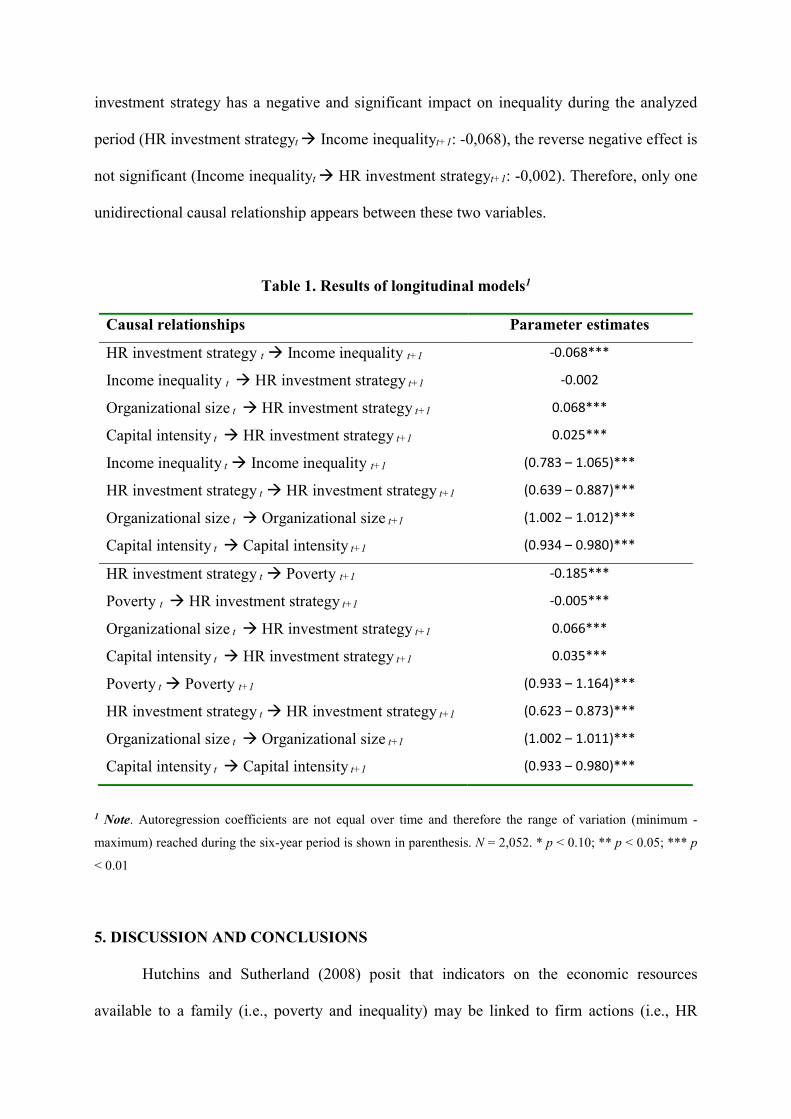
Table 1. Results of longitudinal models1
Causal relationships Parameter estimates
HR investment strategy t Income inequality t+1 -0.068***
Income inequality t HR investment strategy t+1 -0.002
Organizational size t HR investment strategy t+1 0.068***
Capital intensity t HR investment strategy t+1 0.025***
Income inequality t Income inequality t+1 (0.783 – 1.065)***
HR investment strategy t HR investment strategy t+1 (0.639 – 0.887)***
Organizational size t Organizational size t+1 (1.002 – 1.012)***
Capital intensity t Capital intensity t+1 (0.934 – 0.980)***
HR investment strategy t Poverty t+1 -0.185***
Poverty t HR investment strategy t+1 -0.005***
Organizational size t HR investment strategy t+1 0.066***
Capital intensity t HR investment strategy t+1 0.035***
Poverty t Poverty t+1 (0.933 – 1.164)***
HR investment strategy t HR investment strategy t+1 (0.623 – 0.873)***
Organizational size t Organizational size t+1 (1.002 – 1.011)***
Capital intensity t Capital intensity t+1 (0.933 – 0.980)***
1 Note. Autoregression coefficients are not equal over time and therefore the range of variation (minimum -
maximum) reached during the six-year period is shown in parenthesis. N = 2,052. * p < 0.10; ** p < 0.05; *** p
< 0.01
5. DISCUSSION AND CONCLUSIONS
Hutchins and Sutherland (2008) posit that indicators on the economic resources
available to a family (i.e., poverty and inequality) may be linked to firm actions (i.e., HR
investment strategy). The sustainable HRM approach emphasizes and develops this idea by
defending a mutual influence between these two dimensions of social sustainability. From this
theoretical approach, we empirically analyzed the presence of a negative bidirectional
relationship between them over time. Our results partially support this proposition. We reveal
that poverty and HR investment strategy influence each other, such that one of them is the cause
and effect of the other at different moments of time, establishing a circular relationship. In
contrast, the HR investment strategy is identified as a cause of income inequality, but income
inequality is not confirmed as an explanatory factor of the HR investment strategy. These results
validate the important role of companies, particularly their human resources management
strategy, in achieving a sustainable development of society, given that the HR investment
strategy reduces both poverty and inequality in society. Therefore, as Cobb (2016) and Pfeffer
(2010) postulate, in addition to the macroeconomic characteristics (e.g., technological progress,
globalization) that have usually been identified as causing the sustainable development of
society, human resource management emerges as another significant explanatory factor at the
microeconomic level. Individual corporate decisions on social sustainability can affect social
sustainability of society (Hutchins & Sutherland, 2008).
5.1. Theoretical and practical implications
Authors such as Mesmer-Magnus et al., (2012), Rogers et al., (2012) and
Athanasopoulou and Selsky (2015) claim that social sustainability is immersed in different
areas of analysis (i.e., society and business), and are inherently associated. We recognize the
norm of reciprocity, which regulates socio-economic exchanges and collaborative behavior
among members of a group, as a basic value of social sustainability that acts as an underlying
driver of social sustainability which can bridge the gap between organizational sustainability
and environmental sustainability and explain a societal/business circular relationship (Florea et
al., 2013; Mesmer-Magnus et al. 2012). Any variation in the degree of implementation of this
social principle in either of these two areas will produce a significant variation in the same
direction in the other.
This circular relationship draws a positive feedback loop that reinforces itself over time,
where inputs produce more outputs, which in turn produce more inputs. The presence of a
feedback loop constitutes a distinctive feature of the general system theory, adopted by the
sustainable HRM literature (e.g., Kramar, 2014). Organizational social sustainability and
societal social sustainability are mutually reinforcing (weakening) through this dynamic
process. An improvement (decline) of the societal social sustainability at a moment of time (t)
will produce an increase (reduction) in the organizational social sustainability in the future
(t+1), which in turn will subsequently (t+2) cause an improvement (decline) in societal social
sustainability. A similar feedback loop will occur if the organizational social sustainability is
improved (declined) in a moment of time (t). Therefore, this “spiral of social sustainability” can
lead to a virtuous (vicious) circle that is not easily modified because it is consolidated over time.
Recently, poverty and inequality have increased considerably in most developed countries
(Cobb, 2016, Piacentini, 2014), particularly in Spain (Llano, 2017). We may therefore be
witnessing the birth of a vicious circle between society (i.e., poverty) and business (i.e., HR
investment strategy) in the Spanish context. It will take a powerful external force to alter the
direction of this interactive process.
Public institutions, especially regional governments, could be this external agent, given
that they have sufficient capacity to significantly influence social sustainability. In the societal
sphere, they can encourage social assistance to reduce poverty and inequality. In the field of the
business, they can promote the HR investment strategy in firms, through reforms in labor
legislation or the creation of tax reductions and advantages when public administrations
contract firms that implement and improve this HR strategy. As Sharma and Ruud (2003) argue,
promoting sustainable development requires governments to incorporate the social principles
of equity, justice and cooperation into the design of public policies that encourage companies
to develop more sustainable strategies.
Likewise, organizations must assume their social responsibility in the form of greater
investment in employees, since if the company does not accept this role it will harm society,
which in turn will incur a social cost in terms of less equity and social inclusion (Pfeffer, 2010).
Our results provide empirical evidence to corroborate this statement. Moreover, due to the
feedback loop between poverty and HR investment strategy, employers should be aware that
this social cost, initially borne by the society, will have a negative impact on the companies
themselves in the long term, causing a “boomerang effect” in the form of less reciprocity and
lack of trust among citizens, who will bring these negative attitudes and values to their own job,
thus hindering the creation of a social climate of collaboration and cooperation in the company
that, according to authors such as Subramony (2008), Miller and Lee (2001), and Mesmer-
Magnus et al. (2012), is the source of a sustainable competitive advantage for companies.
According to the 2030 Agenda for Sustainable Development, public institutions and private
companies are all responsible for promoting social sustainability in their respective fields of
action, given that their interdependence makes it necessary to work together towards the
common goal of improving individuals’ well-being (Rogers et al., 2012).
Algo de HR practices y sociedad Cobb ….
Today the impact of business on environmental issues are more apparent and companies
have to effectively address moral and social obligations to protect both their interests and
the environment, and as demonstrated in our research, HR practices have a key role to
achieve it (Siyambalapitiya et al. ., 2018). Furthermore, social sustainability dimension have
a significant task to play in the uptake of cleaner production. As Stone states (2000), cleaner
production is not only about changing raw materials, processes and products, but it is also
about changing the corporate culture and the attitudes of people. In this sense, authors such
as Jabbour et al, (2015), Jabbbour and de Sousa Jabbour (2016), and Missimer et al.,
(2017a,b), underline that human resources management practices and social aspects are
critical in creating a sustainable organizational culture, based on trust and cooperative
values, which can facilitate the adoption of more advanced environmental practices, such as
green supply chain (Awan et al., 2018), sustainable product development (Gould et al.,
2017), and the implementation of an environmental management systems (Jabbour et al,
2015).
5.2. Limitations and future research
As we have indicated previously, the concept, indicators, and tools used to measure
social sustainability still lack clarity and maturity (Ajmal et al., 2017; Staniškienė &
Stankevičiūtė, 2018). We followed Hutchins and Sutherland’s (2008) approach to
operationalize organizational social sustainability through a few representative and quantifiable
indicators available from consistent and public corporate databases (i.e., ESEE). In our case,
these indicators focus on operationalizing an investment HR strategy, which promotes trust,
employee cooperation and, ultimately, employee well-being. They represent a starting point to
empirically examine the path of social sustainability between business and society over time.
Longitudinal studies are complex and scarce in sustainability HRM literature, so our
methodology can be useful for future research. Thus, one could deepen the proposed model by
comparing between different regions depending on their degree of industrialization or
competitiveness to examine whether the circular social path works equally or, on the contrary,
differences appear. Given the small number of regions in Spain, this segmentation is not
possible since the variability of the variables poverty and income inequality would be greatly
reduced and statistical problems appear, and it is therefore required to increase the number of
regions (for example, by expanding the geographical area to Europe and introducing regions of
different countries).
While much research has focused on sustainability to examine the ecological impact of
business activity (e.g., consumption of natural resources and energy) or to analyze the impact
of sustainability practices on a company’s balance sheet, few studies have reflected on what
sustainability means when dealing with people. The relevance of human resource management
in developing a sustainable organization has often been marginalized. However, taking
sustainability seriously as a business strategy soon or later leads us to human resources
management (Ehnert et al., 2014). In order to compensate this imbalance, we focused our
research on the social dimension rather than ecological and economic facets of sustainability.
Future research could incorporate these dimensions to form a comprehensive organizational
sustainability framework (Peterson, 2016). For example, Liu et al., (2018) confirm the link
between income inequality and environmental degradation, therefore if we introduce this
variable in our model, we could examine the indirect relationship, via income inequality,
between HR investment and environmental pollution. Likewise, Rao et al., (2017) defend the
influence of climate change and climate policies on poverty and income inequality of societies,
so by applying our model we could examine the indirect effect on companies of these
environmental variables. The opportunities and challenges that climate presents to
organizations and how they respond to it has recently been studied by Seles et al., (2018). In
short, applying our model we can invert the order of traditional priority in the sustainability
literature, putting social sustainability at the center of the enquiry.
Acknowledgments:
This work was supported by the Spanish Ministry of Science and Innovation (Ref. ECO2015-
66671-P (MINECO/FEDER)).

6. REFERENCES
Ajmal, M. M., Khan, M., Hussain, M., & Helo, P. (2018). Conceptualizing and incorporating
social sustainability in the business world. International Journal of Sustainable
Development & World Ecology, 25(4), 327-339.
Athanasopoulou, A., & Selsky, J. (2015). The social context of corporate social responsibility:
Enriching research with multiple perspectives and levels. Business & Society, 54, 322-
364. https://doi.org/10.1177/0007650312449260
Awan, U., Kraslawski, A., & Huiskonen, J. (2018). Buyer-supplier relationship on social
sustainability: Moderation analysis of cultural intelligence. Cogent Business &
Management, 5(1), 1429346.
Ayala, L. y Jurado, A. (2015). “Pro-poor economic growth, inequality and fiscal policy: The
case of spanish regions”. Regional Studies, 45, 103-121.
Bapuji, H. (2015). Individuals, interactions and institutions: How economic inequality affects
organizations. Human Relations, 68(7), 1059-1083.
https://doi.org/10.1177/0018726715584804
Batt, R., & Colvin, A.J. (2011). An employment systems approach to turnover: Human
resources practices, quits, dismissals, and performance. Academy of Management
Journal, 54(4), 695-717. https://doi.org/10.5465/amj.2011.64869448
Bentler, P.M. (2006). EQS 6 Structural Equation Program Manual. Encino, CA: Multivariate
software, Inc.
Boström, M. (2012). A missing pillar? Challenges in theorizing and practicing social
sustainability: introduction to the special issue. Sustainability: Science, practice and
policy, 8(1), 3-14.
Bourguignon, F. (2004). The poverty-growth-inequality triangle. Agence Française de
Développement, Paris.
Broman, G. I., & Robèrt, K. H. (2017). A framework for strategic sustainable
development. Journal of Cleaner Production, 140, 17-31.
Čiegis, R., Gavenauskas, A., Petkevičiūte, N., & Štreimikiene, D. (2008). Ethical values and
sustainable development: Lithuanian experience in the context of
globalisation. Technological and Economic Development of Economy, 14(1), 29-37.
Cobb, J.A. (2016). How firms shape income inequality: Stakeholder power, executive decision
making, and the structuring of employment relationships. Academy of Management
Review, 41, 324-348. https://doi.org/10.5465/amr.2013.0451
Cobb, J.A., & Stevens, F.G. (2017). These unequal states: Corporate organization and income
inequality in the United States. Administrative Science Quarterly, 62, 304-340.
https://doi.org/10.1177/0001839216673823
Cole, D.A., & Maxwell, S.E. (2003). Testing mediational models with longitudinal data:
Questions and tips in the use of structural equation modeling. Journal of Abnormal
Psychology, 112, 558-577. https://doi.org/10.1037/0021-843X.112.4.558
Cropanzano, R., and Mitchell, M.S. (2005). Social exchange theory: An interdisciplinary
review. Journal of Management, 31(6), 874-900.
Ehnert I., Harry W. & Zink K.J. (2014) Sustainability and HRM. In: Ehnert I., Harry W.
and Zink K.J. (eds.) Sustainability and Human Resource Management. CSR,
Sustainability, Ethics & Governance. Springer, Berlin Heidelberg, 3-32.
Ehnert, I., Parsa, S., Roper, I., Wagner, M., & Muller-Camen, M. (2016). Reporting on
sustainability and HRM: A comparative study of sustainability reporting practices by the
world's largest companies. International Journal of Human Resource Management, 27,
88-108. https://doi.org/10.1080/09585192.2015.1024157
Eurostat (2015). Regions in the European Union. Nomenclature of territorial units for statistics
NUTS, 2013/EU-28. European Union.
Florea, L., Cheung, Y.H., & Herndon, N.C. (2013). For all good reasons: Role of values in
organizational sustainability. Journal of Business Ethics, 114, 393-408.
https://doi.org/10.1007/s10551-012-1355-x
Gollan, P.J. (2005). High involvement management and human resource sustainability: The
challenges and opportunities. Asia Pacific Journal of Human Resources, 43, 18-33.
https://doi.org/10.1177/1038411105050305
Gould, R., Missimer, M., & Mesquita, P. L. (2017). Using social sustainability principles to
analyse activities of the extraction lifecycle phase: Learnings from designing support
for concept selection. Journal of cleaner production, 140, 267-276.
Gouldner, A. (1960). The norm of reciprocity: A preliminary statement. American Sociological
Review, 25, 161–178. https://doi.org/10.2307/2092623
Haushofer, J., and Fehr, E. (2014). On the psychology of poverty. Science, 344(6186), 862-867.
10.1126/science.1232491
Hughes, C.P., Semeijn, J., & Caniëls, M. (2017). The sustainability skew. Current opinion in
environmental sustainability, 28, 58-63. https://doi.org/10.1016/j.cosust.2017.08.004
Huselid, M.A. (1995). The impact of human resource management practices on turnover,
productivity, and corporate financial performance. Academy of Management Journal,
38, 635-672. https://doi.org/10.2307/256741
Hutchins, M.J., & Sutherland, J.W. (2008). An exploration of measures of social sustainability
and their application to supply chain decisions. Journal of Cleaner Production, 16,
1688-1698 https://doi.org/10.1016/j.jclepro.2008.06.001
Jabbour, C. J. C., & de Sousa Jabbour, A. B. L. (2016). Green human resource management
and green supply chain management: Linking two emerging agendas. Journal of Cleaner
Production, 112, 1824-1833.
Jabbour, C. J. C., Jugend, D., de Sousa Jabbour, A. B. L., Gunasekaran, A., & Latan, H. (2015).
Green product development and performance of Brazilian firms: measuring the role of
human and technical aspects. Journal of Cleaner Production, 87, 442-451.
Jabbour, C.J., & Santos, F.C. (2008). The central role of human resource management in the
search for sustainable organizations. International Journal of Human Resource
Management, 19, 2133-2154.https://doi.org/10.1080/09585190802479389
Jiang, L., & Probst, T. M. (2017). The rich get richer and the poor get poorer: Country-and
state-level income inequality moderates the job insecurity-burnout relationship. Journal
of Applied Psychology, 102, 672. https://doi.org/10.1037/apl0000179
Kast, F.E., & Rosenzweig, J.E. (1972). General systems theory: Applications for organization
and management. Academy of Management Journal, 15, 447-465.
https://doi.org/10.5465/255141
Kis, A. B. y Gábos, A. (2015). “Consistent poverty across the EU”. ImPRovE working Paper
No.15/22, University of Antwerp.
Kobayashi, K., Eweje, G., & Tappin, D. (2018). Employee wellbeing and human sustainability:
Perspectives of managers in large Japanese corporations. Business Strategy and the
Environment. https://doi.org/10.1002/bse.2032
Kramar, R. (2014). Beyond strategic human resource management: Is sustainable human
resource management the next approach? International Journal of Human Resource
Management, 25, 1069-1089.https://doi.org/10.1080/09585192.2013.816863
Leana, C.R., & Meuris, J. (2015). Living to work and working to live: Income as a driver of
organizational behavior. Academy of Management Annals, 9, 55-95.
https://doi.org/10.1080/19416520.2015.1007654
Little, T.D. (2013). Longitudinal structural equation modeling. Guilford Press, New York.
Liu, Q., Wang, S., Zhang, W., & Li, J. (2018). Income distribution and environmental quality
in China: A spatial econometric perspective. Journal of Cleaner Production, 205, 14-
26.
Llano, J.C. (2017). El estado de la pobreza. Seguimiento del indicador de riesgo de pobreza y
exclusión social en España. EAPN (European Anti-Poverty Network) España, Madrid.
Macke, J., & Genari, D. (2019). Systematic Literature Review on Sustainable Human Resource
Management. Journal of Cleaner Production., 208, 806-815.
Mariappanadar, S. (2014). The model of negative externality for sustainable HRM. In:
Ehnert I., Harry W. and Zink K.J. (eds.) Sustainability and Human Resource
Management. CSR, Sustainability, Ethics & Governance. Springer, Berlin Heidelberg,
181-203.
Mesmer-Magnus, J., Viswesvaran, C., & Wiernik, B. M. (2012). The role of commitment in
bridging the gap between organizational sustainability and environmental sustainability.
In Jackson, S.E., Ones, D.S., and Dilchert, S. (eds.), Managing human resources for
environmental sustainability. Jossey-Bass/Wiley, San Francisco, 155-186.
Miller, D., & Lee, J. (2001). The people make the process: commitment to employees, decision
making, and performance. Journal of Management, 27, 163-189.
https://doi.org/10.1177/014920630102700203
Missimer, M., Robèrt, K. H., & Broman, G. (2017a). A strategic approach to social
sustainability–Part 1: exploring the social system. Journal of Cleaner Production, 140,
32-41.
Missimer, M., Robèrt, K. H., & Broman, G. (2017b). A strategic approach to social
sustainability–Part 2: a principle-based definition. Journal of cleaner production, 140,
42-52.
Peterson, N. (2016). Introduction to the special issue on social sustainability: integration,
context, and governance. Sustainability: Science, Practice and Policy, 12(1), 3-7.
https://doi.org/10.1080/15487733.2016.11908148
Pfeffer, J. (2010). Building sustainable organizations: The human factor. Academy of
Management Perspectives, 24, 34-45. https://doi.org/10.5465/amp.24.1.34
Piacentini, M. (2014). Measuring income inequality and poverty at the regional level in OECD
countries, Statistics Working Papers, 2014/03, OECD (Organisation for Economic Co-
operation and development) Publishing, Paris.
Pitesa, M., Thau, S., & Pillutla, M. (2017). Workplace trust as a mechanism of employee (dis)
advantage: The case of employee socioeconomic status. Research in Organizational
Behavior, 37, 83-101. https://doi.org/10.1016/j.riob.2017.10.006
Rao, N. D., van Ruijven, B. J., Riahi, K., & Bosetti, V. (2017). Improving poverty and
inequality modelling in climate research. Nature Climate Change, 7(12), 857.
Renwick, D.W., Redman, T., & Maguire, S. (2013). Green human resource management: A
review and research agenda. International Journal of Management Reviews, 15, 1-14.
https://doi.org/10.1111/j.1468-2370.2011.00328.x
Roca-Puig, V., Beltrán-Martín, I., & Segarra-Ciprés, M. (2012). Commitment to employees,
labor intensity, and labor productivity in small firms: a non-linear approach. International
Journal of Manpower, 33, 938-954. https://doi.org/10.1108/01437721211280399
Roca-Puig, V., Bou-Llusar, J. C., Beltrán-Martín, I., and García-Juan, B. (2018) The virtuous
circle of human resource investments: A precrisis and postcrisis analysis. Human
Resource Management Journal. https://doi.org/10.1111/1748-8583.12213
Rogers, D.S., Duraiappah, A.K., Antons, D.C., Munoz, P., Bai, X., Fragkias, M., & Gutscher,
H. (2012). A vision for human well-being: transition to social sustainability. Current
Opinion in Environmental Sustainability, 4(1), 61-73.
https://doi.org/10.1016/j.cosust.2012.01.013
Roh, H., & Kim, E. (2016). The business case for gender diversity: examining the role of human
resource management investments. Human Resource Management, 55(3), 519-534.
https://doi.org/10.1002/hrm.21736
Seles, B. M. R. P., de Sousa Jabbour, A. B. L., Jabbour, C. J. C., de Camargo Fiorini, P., Mohd-
Yusoff, Y., & Thomé, A. M. T. (2018). Business opportunities and challenges as the
two sides of the climate change: Corporate responses and potential implications for big
data management towards a low carbon society. Journal of Cleaner Production, 189,
763-774.
SEPI Foundation (2018). “Survey on business strategy (ESEE)”. Retrieved from
https://www.fundacionsepi.es/investigacion/esee/en/spresentacion.asp. (Accessed 10
November 2018).
Sharma, S., & Ruud, A. (2003). On the path to sustainability: Integrating social dimensions into
the research and practice of environmental management. Business Strategy and the
Environment, 12, 205-214. https://doi.org/10.1002/bse.366
Shin, T., Davison, M.L., & Long, J.D. (2009). Effects of missing data methods in structural
equation modeling with nonnormal longitudinal data. Structural Equation
Modeling, 16(1), 70-98. https://doi.org/10.1080/10705510802569918
Siyambalapitiya, J., Zhang, X., & Liu, X. (2018). Green Human Resource Management: A
Proposed Model in the Context of Sri Lanka’s Tourism Industry. Journal of Cleaner
Production, 201, 542-555.
Staniškienė, E., & Stankevičiūtė, Ž. (2018). Social sustainability measurement framework: The
case of employee perspective in a CSR-committed organisation. Journal of Cleaner
Production, 188, 708-719. https://doi.org/10.1016/j.jclepro.2018.03.269
Stone, L. (2000). When case studies are not enough: the influence of corporate culture and
employee attitudes on the success of cleaner production initiatives. Journal of Cleaner
Production, 8(5), 353-359.
Subramony, M., Krause, N., Norton, J., & Burns, G.N. (2008). The relationship between human
resource investments and organizational performance: a firm-level examination of
equilibrium theory. Journal of Applied Psychology, 93(4), 778-788.
https://doi.org/10.1037/0021-9010.93.4.778
Wilkinson, R.G., & Pickett, K.E. (2010). The spirit level: Why equality is better for everyone.
Penguin UK.
Wilkinson, R.G., & Pickett, K.E. (2017). The enemy between us: The psychological and social
costs of inequality. European Journal of Social Psychology, 47, 11-24.
https://doi.org/10.1002/ejsp.2275
Zink K.J. (2014). Social sustainability and quality of working life. In: Ehnert I., Harry W.
and Zink K.J. (eds.) Sustainability and Human Resource Management. CSR,
Sustainability, Ethics & Governance. Springer, Berlin Heidelberg, 35-55.
Hollander, R., Amekudzi-Kennedy, A., Bell, S., Benya, F., Davidson, C., Farkos, C., Fasenfest,
D., Guyer, R., Hjarding, A., Lizotte, M., Quigley, D., Watts, D., & Whitefoot, K. (2016).
Network priorities for social sustainability research and education: Memorandum of the
Integrated Network on Social Sustainability Research Group. Sustainability: Science,
Practice and Policy, 12(1), 16-21. https://doi.org/10.1080/15487733.2016.11908150

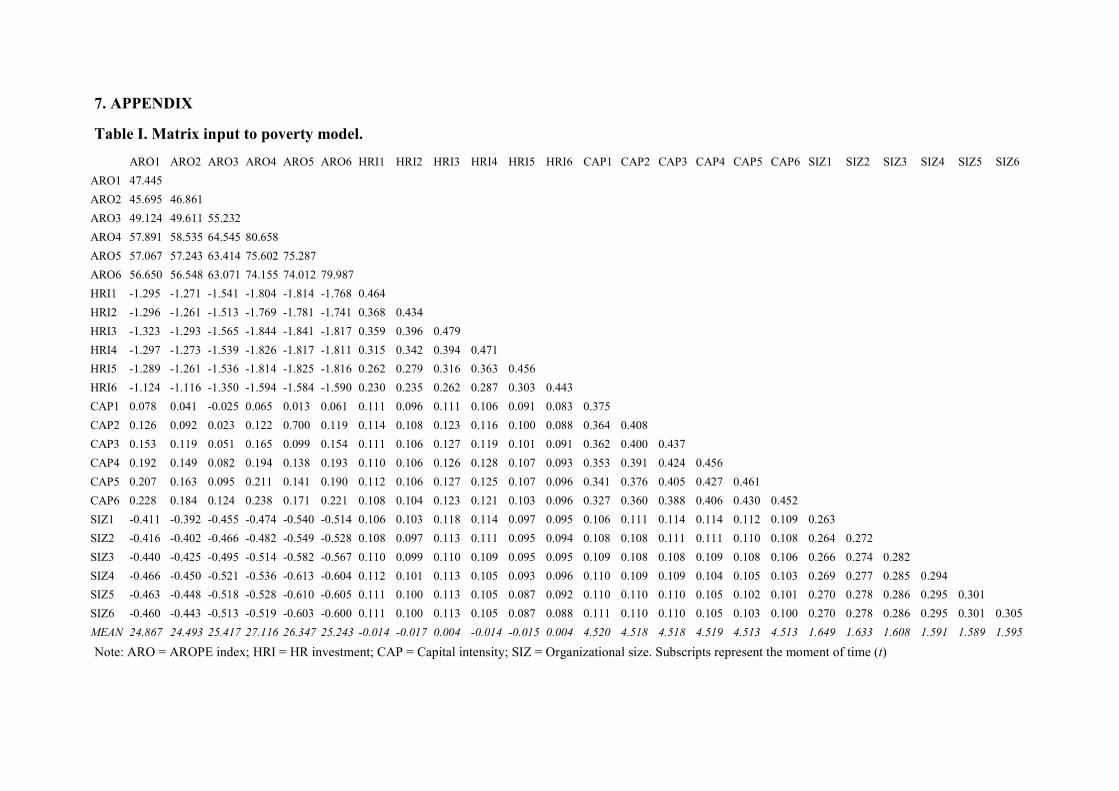
7. APPENDIX
Table I. Matrix input to poverty model.
ARO1 ARO2 ARO3 ARO4 ARO5 ARO6 HRI1 HRI2 HRI3 HRI4 HRI5 HRI6 CAP1 CAP2 CAP3 CAP4 CAP5 CAP6 SIZ1 SIZ2 SIZ3 SIZ4 SIZ5 SIZ6
ARO1 47.445
ARO2 45.695 46.861
ARO3 49.124 49.611 55.232
ARO4 57.891 58.535 64.545 80.658
ARO5 57.067 57.243 63.414 75.602 75.287
ARO6 56.650 56.548 63.071 74.155 74.012 79.987
HRI1 -1.295 -1.271 -1.541 -1.804 -1.814 -1.768 0.464
HRI2 -1.296 -1.261 -1.513 -1.769 -1.781 -1.741 0.368 0.434
HRI3 -1.323 -1.293 -1.565 -1.844 -1.841 -1.817 0.359 0.396 0.479
HRI4 -1.297 -1.273 -1.539 -1.826 -1.817 -1.811 0.315 0.342 0.394 0.471
HRI5 -1.289 -1.261 -1.536 -1.814 -1.825 -1.816 0.262 0.279 0.316 0.363 0.456
HRI6 -1.124 -1.116 -1.350 -1.594 -1.584 -1.590 0.230 0.235 0.262 0.287 0.303 0.443
CAP1 0.078 0.041 -0.025 0.065 0.013 0.061 0.111 0.096 0.111 0.106 0.091 0.083 0.375
CAP2 0.126 0.092 0.023 0.122 0.700 0.119 0.114 0.108 0.123 0.116 0.100 0.088 0.364 0.408
CAP3 0.153 0.119 0.051 0.165 0.099 0.154 0.111 0.106 0.127 0.119 0.101 0.091 0.362 0.400 0.437
CAP4 0.192 0.149 0.082 0.194 0.138 0.193 0.110 0.106 0.126 0.128 0.107 0.093 0.353 0.391 0.424 0.456
CAP5 0.207 0.163 0.095 0.211 0.141 0.190 0.112 0.106 0.127 0.125 0.107 0.096 0.341 0.376 0.405 0.427 0.461
CAP6 0.228 0.184 0.124 0.238 0.171 0.221 0.108 0.104 0.123 0.121 0.103 0.096 0.327 0.360 0.388 0.406 0.430 0.452
SIZ1 -0.411 -0.392 -0.455 -0.474 -0.540 -0.514 0.106 0.103 0.118 0.114 0.097 0.095 0.106 0.111 0.114 0.114 0.112 0.109 0.263
SIZ2 -0.416 -0.402 -0.466 -0.482 -0.549 -0.528 0.108 0.097 0.113 0.111 0.095 0.094 0.108 0.108 0.111 0.111 0.110 0.108 0.264 0.272
SIZ3 -0.440 -0.425 -0.495 -0.514 -0.582 -0.567 0.110 0.099 0.110 0.109 0.095 0.095 0.109 0.108 0.108 0.109 0.108 0.106 0.266 0.274 0.282
SIZ4 -0.466 -0.450 -0.521 -0.536 -0.613 -0.604 0.112 0.101 0.113 0.105 0.093 0.096 0.110 0.109 0.109 0.104 0.105 0.103 0.269 0.277 0.285 0.294
SIZ5 -0.463 -0.448 -0.518 -0.528 -0.610 -0.605 0.111 0.100 0.113 0.105 0.087 0.092 0.110 0.110 0.110 0.105 0.102 0.101 0.270 0.278 0.286 0.295 0.301
SIZ6 -0.460 -0.443 -0.513 -0.519 -0.603 -0.600 0.111 0.100 0.113 0.105 0.087 0.088 0.111 0.110 0.110 0.105 0.103 0.100 0.270 0.278 0.286 0.295 0.301 0.305
MEAN 24.867 24.493 25.417 27.116 26.347 25.243 -0.014 -0.017 0.004 -0.014 -0.015 0.004 4.520 4.518 4.518 4.519 4.513 4.513 1.649 1.633 1.608 1.591 1.589 1.595
Note: ARO = AROPE index; HRI = HR investment; CAP = Capital intensity; SIZ = Organizational size. Subscripts represent the moment of time (t)
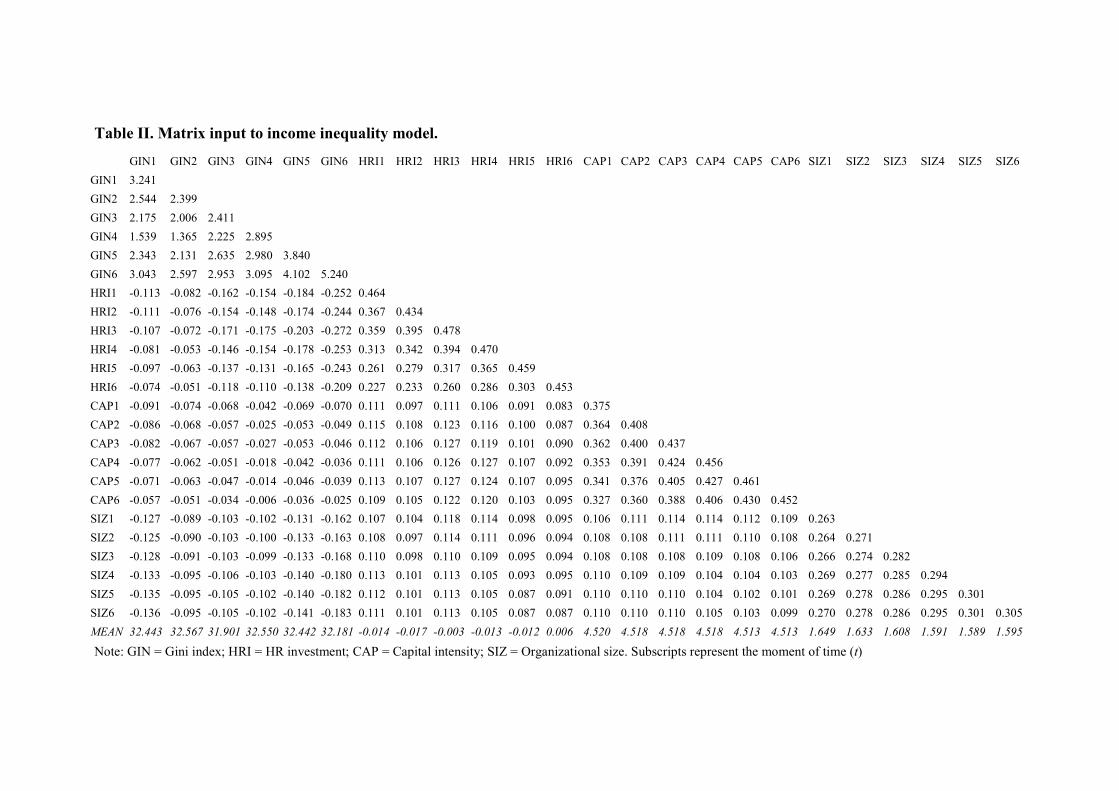
Table II. Matrix input to income inequality model.
GIN1 GIN2 GIN3 GIN4 GIN5 GIN6 HRI1 HRI2 HRI3 HRI4 HRI5 HRI6 CAP1 CAP2 CAP3 CAP4 CAP5 CAP6 SIZ1 SIZ2 SIZ3 SIZ4 SIZ5 SIZ6
GIN1 3.241
GIN2 2.544 2.399
GIN3 2.175 2.006 2.411
GIN4 1.539 1.365 2.225 2.895
GIN5 2.343 2.131 2.635 2.980 3.840
GIN6 3.043 2.597 2.953 3.095 4.102 5.240
HRI1 -0.113 -0.082 -0.162 -0.154 -0.184 -0.252 0.464
HRI2 -0.111 -0.076 -0.154 -0.148 -0.174 -0.244 0.367 0.434
HRI3 -0.107 -0.072 -0.171 -0.175 -0.203 -0.272 0.359 0.395 0.478
HRI4 -0.081 -0.053 -0.146 -0.154 -0.178 -0.253 0.313 0.342 0.394 0.470
HRI5 -0.097 -0.063 -0.137 -0.131 -0.165 -0.243 0.261 0.279 0.317 0.365 0.459
HRI6 -0.074 -0.051 -0.118 -0.110 -0.138 -0.209 0.227 0.233 0.260 0.286 0.303 0.453
CAP1 -0.091 -0.074 -0.068 -0.042 -0.069 -0.070 0.111 0.097 0.111 0.106 0.091 0.083 0.375
CAP2 -0.086 -0.068 -0.057 -0.025 -0.053 -0.049 0.115 0.108 0.123 0.116 0.100 0.087 0.364 0.408
CAP3 -0.082 -0.067 -0.057 -0.027 -0.053 -0.046 0.112 0.106 0.127 0.119 0.101 0.090 0.362 0.400 0.437
CAP4 -0.077 -0.062 -0.051 -0.018 -0.042 -0.036 0.111 0.106 0.126 0.127 0.107 0.092 0.353 0.391 0.424 0.456
CAP5 -0.071 -0.063 -0.047 -0.014 -0.046 -0.039 0.113 0.107 0.127 0.124 0.107 0.095 0.341 0.376 0.405 0.427 0.461
CAP6 -0.057 -0.051 -0.034 -0.006 -0.036 -0.025 0.109 0.105 0.122 0.120 0.103 0.095 0.327 0.360 0.388 0.406 0.430 0.452
SIZ1 -0.127 -0.089 -0.103 -0.102 -0.131 -0.162 0.107 0.104 0.118 0.114 0.098 0.095 0.106 0.111 0.114 0.114 0.112 0.109 0.263
SIZ2 -0.125 -0.090 -0.103 -0.100 -0.133 -0.163 0.108 0.097 0.114 0.111 0.096 0.094 0.108 0.108 0.111 0.111 0.110 0.108 0.264 0.271
SIZ3 -0.128 -0.091 -0.103 -0.099 -0.133 -0.168 0.110 0.098 0.110 0.109 0.095 0.094 0.108 0.108 0.108 0.109 0.108 0.106 0.266 0.274 0.282
SIZ4 -0.133 -0.095 -0.106 -0.103 -0.140 -0.180 0.113 0.101 0.113 0.105 0.093 0.095 0.110 0.109 0.109 0.104 0.104 0.103 0.269 0.277 0.285 0.294
SIZ5 -0.135 -0.095 -0.105 -0.102 -0.140 -0.182 0.112 0.101 0.113 0.105 0.087 0.091 0.110 0.110 0.110 0.104 0.102 0.101 0.269 0.278 0.286 0.295 0.301
SIZ6 -0.136 -0.095 -0.105 -0.102 -0.141 -0.183 0.111 0.101 0.113 0.105 0.087 0.087 0.110 0.110 0.110 0.105 0.103 0.099 0.270 0.278 0.286 0.295 0.301 0.305
MEAN 32.443 32.567 31.901 32.550 32.442 32.181 -0.014 -0.017 -0.003 -0.013 -0.012 0.006 4.520 4.518 4.518 4.518 4.513 4.513 1.649 1.633 1.608 1.591 1.589 1.595
Note: GIN = Gini index; HRI = HR investment; CAP = Capital intensity; SIZ = Organizational size. Subscripts represent the moment of time (t)

Related Documents