Mosello, R., B. Petriccione and A. Marchetto (Guest Editors) Long-term ecological research in Italian forest ecosystems J. Limnol., 61 (Suppl. 1): 77-92, 2002 The chemistry of atmospheric deposition in Italy in the framework of the National Programme for Forest Ecosystems Control (CONECOFOR) Rosario MOSELLO*, Maria Cristina BRIZZIO, Dimitrios KOTZIAS 1) , Aldo MARCHETTO, Diana REMBGES 1) and Gabriele TARTARI CNR Institute of Ecosystem Study (ISE), Research Unit of Hydrobiology and Freshwater Ecology, L.go V. Tonolli 50, 28922 Verbania Pallanza, Italy 1) EC-Joint Research Centre, Institute for Health and Consumer Protection, Via Fermi 1, 21020 Ispra, Italy *e-mail corresponding author: [email protected] ABSTRACT Under the CONECOFOR programme, allied to the UE and UN-ECE programme on forests (ICP Forests), the chemistry of open field, throughfall and stemflow deposition was measured in 15 permanent plots over a two year period. Characteristics of the plots, sampling methods, treatment and analyses are in strict agreement with those adopted in the European programme. The plots are representative of different geographical conditions, from the Mediterranean area of the southern plots to the Alpine environment. Results show the highest amount of ion deposition related to anthropogenic emissions in the northern (PIE1, VEN1, FRI2) and cen- tral (EMI1, TOS1) stations, while most of the central and southern sites show a net flux of alkalinity. The acidity is however buffered by dust and dry deposition present on the canopy, so that the throughfall deposition is always alkaline. Nitrogen, both as ammonium and nitrate, is an important component of precipitation and critical loads are exceeded in most of the areas. This situation is con- firmed by analyses of nitrate in runoff, performed in four plots, which show a release from the watershed in all seasons, indicating an overload of nitrogen compared to its possible uptake by vegetation and soil. N saturation is high in the northern and central plots of PIE1 and EMI2, moderate in the central and alpine plots of LAZ1 and FRI2. Key words: atmospheric deposition chemistry, forest, nitrogen saturation 1. INTRODUCTION The chemistry of atmospheric deposition and its transformation on contact with vegetation are of great importance in understanding its effects on vegetation. Italian research activity on these topics is co-ordinated by the Ministry for Agriculture and Forest Policy, Na- tional Forest Service, (MPA) through the National Inte- grated Programme for the Control of Forest Ecosystems (CONECOFOR) and forms part of a Pan-European Programme, based on both the European Scheme on the Protection of Forest against Atmospheric Pollution (Council Regulation (EEC) No 3528/86) and the Inter- national Co-operative Programme on Assessment and Monitoring of Air Pollution Effects on Forests (ICP Forests) under the Convention of Long-Range Trans- boundary Air Pollution (UN/ECE) (European Commis- sion, DG VI 1996; De Vries et al. 2000). On the scientific-technical side, the part of the Italian research involving the study of atmospheric depositions is co-ordinated by the Consiglio Nazionale delle Ricerche - Istituto Italiano di Idrobiologia (CNR- III), which is responsible for methodological aspects, collection, validation and elaboration of the results. The Joint Research Centre of Ispra (JRC) co-ordinated analytical quality controls/assurance, and directly performs part of the analytical work. The Research Centre of Brasimone of the Ente Nazionale Energie Alternative (CR-ENEA) is responsible for stemflow sampling. Methods of sampling, sample treatment and analysis were detailed in a manual distributed to the personnel of the different plot areas and laboratories before the be- ginning of the project (Allavena et al. 1997). This man- ual was of major importance for quality control, as it provided uniform, detailed methodologies for the vari- ous stages of sampling, sample treatment, mailing of samples to the analysing laboratories, and analyses. These techniques are in strict agreement with the "Man- ual on methods and criteria for harmonised sampling, assessment, monitoring and analysis of the effects of air pollution on forests", prepared for the period 1993-1996 (UN-ECE 1994). This paper aims to present the methodologies and discuss the results obtained during 1998 and 1999. 2. SAMPLING AND METHODS 2.1. Sampling sites and frequency Samples for the determination of atmospheric depo- sition chemistry were taken in 15 permanent plots (Fig. 1). Table 1 reports the codes of each station, which are used in the text to identify the sites. Typical permanent sites for sampling throughfall and stemflow (Fig. 2) are, ideally, located in very large areas which are homoge- neous from the point of view of geology and vegetation, Paper prepared within the CONECOFOR programme, by the contract with the Ministry for Agriculture and Forestry Policy – National Forest Service, Italy. CONECOFOR is part of the Pan-European Level II Intensive Monitoring of Forest Ecosystem and is co-sponsored by the European Commission.

Welcome message from author
This document is posted to help you gain knowledge. Please leave a comment to let me know what you think about it! Share it to your friends and learn new things together.
Transcript

Mosello, R., B. Petriccione and A. Marchetto (Guest Editors)Long-term ecological research in Italian forest ecosystemsJ. Limnol., 61 (Suppl. 1): 77-92, 2002
The chemistry of atmospheric deposition in Italy in the framework of theNational Programme for Forest Ecosystems Control (CONECOFOR)
Rosario MOSELLO*, Maria Cristina BRIZZIO, Dimitrios KOTZIAS1), Aldo MARCHETTO, Diana REMBGES1) andGabriele TARTARI
CNR Institute of Ecosystem Study (ISE), Research Unit of Hydrobiology and Freshwater Ecology, L.go V. Tonolli 50, 28922Verbania Pallanza, Italy1)EC-Joint Research Centre, Institute for Health and Consumer Protection, Via Fermi 1, 21020 Ispra, Italy*e-mail corresponding author: [email protected]
ABSTRACTUnder the CONECOFOR programme, allied to the UE and UN-ECE programme on forests (ICP Forests), the chemistry of open
field, throughfall and stemflow deposition was measured in 15 permanent plots over a two year period. Characteristics of the plots,sampling methods, treatment and analyses are in strict agreement with those adopted in the European programme. The plots arerepresentative of different geographical conditions, from the Mediterranean area of the southern plots to the Alpine environment.Results show the highest amount of ion deposition related to anthropogenic emissions in the northern (PIE1, VEN1, FRI2) and cen-tral (EMI1, TOS1) stations, while most of the central and southern sites show a net flux of alkalinity. The acidity is however bufferedby dust and dry deposition present on the canopy, so that the throughfall deposition is always alkaline. Nitrogen, both as ammoniumand nitrate, is an important component of precipitation and critical loads are exceeded in most of the areas. This situation is con-firmed by analyses of nitrate in runoff, performed in four plots, which show a release from the watershed in all seasons, indicating anoverload of nitrogen compared to its possible uptake by vegetation and soil. N saturation is high in the northern and central plots ofPIE1 and EMI2, moderate in the central and alpine plots of LAZ1 and FRI2.
Key words: atmospheric deposition chemistry, forest, nitrogen saturation
1. INTRODUCTION
The chemistry of atmospheric deposition and itstransformation on contact with vegetation are of greatimportance in understanding its effects on vegetation.Italian research activity on these topics is co-ordinatedby the Ministry for Agriculture and Forest Policy, Na-tional Forest Service, (MPA) through the National Inte-grated Programme for the Control of Forest Ecosystems(CONECOFOR) and forms part of a Pan-EuropeanProgramme, based on both the European Scheme on theProtection of Forest against Atmospheric Pollution(Council Regulation (EEC) No 3528/86) and the Inter-national Co-operative Programme on Assessment andMonitoring of Air Pollution Effects on Forests (ICPForests) under the Convention of Long-Range Trans-boundary Air Pollution (UN/ECE) (European Commis-sion, DG VI 1996; De Vries et al. 2000).
On the scientific-technical side, the part of theItalian research involving the study of atmosphericdepositions is co-ordinated by the Consiglio Nazionaledelle Ricerche - Istituto Italiano di Idrobiologia (CNR-III), which is responsible for methodological aspects,collection, validation and elaboration of the results. TheJoint Research Centre of Ispra (JRC) co-ordinatedanalytical quality controls/assurance, and directlyperforms part of the analytical work. The ResearchCentre of Brasimone of the Ente Nazionale Energie
Alternative (CR-ENEA) is responsible for stemflowsampling.
Methods of sampling, sample treatment and analysiswere detailed in a manual distributed to the personnel ofthe different plot areas and laboratories before the be-ginning of the project (Allavena et al. 1997). This man-ual was of major importance for quality control, as itprovided uniform, detailed methodologies for the vari-ous stages of sampling, sample treatment, mailing ofsamples to the analysing laboratories, and analyses.These techniques are in strict agreement with the "Man-ual on methods and criteria for harmonised sampling,assessment, monitoring and analysis of the effects of airpollution on forests", prepared for the period 1993-1996(UN-ECE 1994).
This paper aims to present the methodologies anddiscuss the results obtained during 1998 and 1999.
2. SAMPLING AND METHODS
2.1. Sampling sites and frequency
Samples for the determination of atmospheric depo-sition chemistry were taken in 15 permanent plots (Fig.1). Table 1 reports the codes of each station, which areused in the text to identify the sites. Typical permanentsites for sampling throughfall and stemflow (Fig. 2) are,ideally, located in very large areas which are homoge-neous from the point of view of geology and vegetation,
Paper prepared within the CONECOFOR programme, by the contract with the Ministry for Agriculture and Forestry Policy – National ForestService, Italy. CONECOFOR is part of the Pan-European Level II Intensive Monitoring of Forest Ecosystem and is co-sponsored by the EuropeanCommission.

R. Mosello et al.78
and comprise two plots of 2500 m2 (squares of 50×50m). The first of these, called the permanent observationplot, is where the various researches are performed; thesecond, the reference plot, situated close to the first, isleft untouched for the duration of the programme andserves as a comparison to highlight any changes deriv-ing from the impact of the research activity. Each per-manent plot (Fig. 3) comprises a central zone, sur-rounded by a buffer zone approximately 1 metre wide,fenced off to prevent theft or acts of vandalism, andfurther subdivided into 25 square plots with 10 m longsides.
Samples were collected weekly, on Tuesday morn-ing, with a tolerance interval of 12 hours (from Mondayafternoon to Tuesday afternoon), to avoid the start ofnew precipitation or to allow an on-going event to end.On expiry of the tolerance period on Tuesday afternoon,the samples were collected in any case. When bulksamples were collected, the collecting bottles were
changed, even when there was no precipitation, to avoidany accumulation of dust and detritus in the bulk col-lectors. Volume measurements were performed in thefield or, where possible, in a specially equipped roomnear the study area. The throughfall samples werepooled and the sample aliquots to be sent to the analys-ing laboratory were then taken.
2.2. Sampling
2.2.1. Bulk (rain or snow), collected in the open field(OF)
Open field depositions were sampled using continu-ously exposed collectors, comprising a 2-litre graduatedpolyethylene bottle, with a funnel of 19.5 cm diameter.A polyethylene net in the funnel prevents the collectionof coarse debris, insects and leaves. The volume ofwater collected is 30 ml per millimetre of precipitation.The bottle is inserted into a PVC cylinder of a slightly
PIE1
LOM1TRE1
VEN1FRI1
FRI2
EMI2
TOS1MAR1
LAZ1 ABR1
CAM1
SIC1
CAL1
EMI1
Spr uce - northern forest (3 plots )Picea abies
Beech - sub-Atlan tic forest ( 6 plots)Fagus sylvatica
Turkey oak - mid-European forest (3 plots)Qu ercus cerr is
Quercus robur acidip hilous fore st (1 plot)
Holm oak Mediterranean forest (1 plot) - Quercus ilex
Quercus petraea acidiphilous forest (1 plot)
Fig. 1. Location of the permanent plot for atmospheric deposition chemistry with the indication of dominant tree species.

The chemistry of atmospheric deposition in Italy 79
larger diameter, so as to leave an air jacket around thebottle and to shade the bottle. In each area three openfield collectors were placed according to the type ofsample collected, snow or rain. This meant that a greaternumber of deposition volume measurements could beobtained, but the chief advantage of using more thanone collector is that any samples which were clearlypolluted could be discarded, without the loss of thewhole sample for the sampling period.
2.2.2. Throughfall (TF)
The collectors were the same as those described foropen field sampling. Sixteen collectors were used forTF measurement, distributed evenly over the plot (Fig.3), as suggested by the ICP Forest Manual (UN-ECE1994). The precipitation samples were collected weekly,and their volume measured separately and marked on
Tab. 1. Italian permanent plots for atmospheric deposition chemistry. CFS: Corpo Forestale dello Stato; CR-ENEA:Centro Ricerche Ente Nazionale Energie Alternative; *: Regione; JRC: Joint Research Centre (Ispra); CNR-IRSA:Consiglio Nazionale delle Ricerche - Istituto di Ricerca Sulle Acque (Brugherio); Univ. Siena: Dipartimento ScienzeAmbientali Università di Siena. 1: station not active in the winter period; 2: research performed in year 1998; 3:research performed in year 1999.
Code Name Altitude(m a.s.l.)
Dominant species Sampling methods Managing Laboratory
Trho
ughf
all
Ope
n fie
ld
Stem
flow
Snow
Run
off
Wet
-onl
y
ABR11 Selva Piana 1500 Fagus sylvatica X X X X - - CFS JRC-EICAL1 Piano Limina 915 Fagus sylvatica X X X X - - CFS JRC-EICAM1 Serra Nuda 1200 Fagus sylvatica X X X3 X - - CFS JRC-EIEMI1 Carrega 200 Quercus petraea
Quercus cerrisX X X - - X Natural Park JRC-EI
EMI2 Brasimone 1000 Fagus sylvatica X X X X X2 - CR-ENEA JRC-EIFRI1 Bosco Boscat 6 Carpinus betulus
Quercus roburX3 X3 - - - - CFS JRC-EI
FRI2 Tarvisio 820 Picea abies X X X X X2 X CFS JRC-EILAZ1 Monte Rufeno 690 Quercus cerris X X X - X X CFS JRC-EILOM1 Val Masino 1190 Picea abies X X - - - - Lombardy* CNR-IRSAMAR1 Roti 800 Quercus cerris X X - - - - CFS JRC-EIPIE1 Val Sessera 1150 Fagus sylvatica X X X3 X X2 - Piedmont* JRC-EISIC1 Ficuzza 940 Quercus cerris X X - - - - Sicily* JRC-EITOS1 Colognole 150 Quercus ilex X X X - - - Tuscany* Univ. SienaTRE1 Passo Lavazè 1800 Picea abies X X X3 X - - Trento* JRC-EIVEN1 Pian Cansiglio 1100 Fagus sylvatica X X X X - - CFS JRC-EI
Fig. 2. Diagram of a typical permanent site.

R. Mosello et al.80
the mailing form, to be sent with samples to the analyti-cal laboratories. The precipitation samples were thenpooled together and an aliquot sent to the laboratory.Most of the sites were dominated by a single species oftree. In one station (EMI1), where two species were pre-sent, the TF samples for each species were kept sepa-rate.
2.2.3. SnowDuring 1998 snow sampling was carried out weekly
using polyethylene plastic bags (diameter = 30 cm)placed in PVC tubes, one meter high, with a diameter of25 cm; the funnel and bottle collectors used for rainfallare inadequate for the correct collection of snow. Assome plastic bags were broken by ice, in 1999 the snowsamplers were replaced with a cylindrical PVC con-tainer (diameter = 20 cm, height = 80 cm). The snowsample was then melted in a warm environment by ex-posure to uniform heat. The volume was then measuredusing a graduated cylinder, and the sample bottled formailing to the laboratory.
2.2.4. Stemflow (SF)Stemflow samples were collected on representative
trees in the study area taking into account tree age class,diameters and heights. The operators and technicians re-sponsible for this kind of deposition (CR-ENEA) visitedeach station to select the trees and set up the equipment,and made annual checks that the equipment was in goodworking order. Three collectors were installed for eachstation, except in the area (EMI1) with two species,
where six devices were installed, three for each species.Collectors were however placed in only 9 of the 15 ac-tive stations; collecting in three other stations (TRE1,CAM1, PIE1) started at the beginning of 1999 (Tab. 1).The stemflow collectors consist of a device for watercollection made of ELASTOLEN W300 and are applieddirectly to the tree stems spiral-wise and fixed with ad-hesive tape and two nails of such a length as to cause aslittle as possible damage to the tree. A special connectorjoins the spiral to a tube through which the water runsinto a container of around 120 litres. Stemflow volumesare measured inside the collector with a gauge rod: thevolume measured in cm is converted into litres using aconversion table. Samples were obtained by mixingproportional aliquots from the three collectors. Meas-urements and collection of stemflow water were sus-pended during the periods of the year when the meantemperature falls below zero.
2.2.5. Runoff
During 1998 runoff water was analysed at four sta-tions (Tab. 1), one of which since April only (EMI2).The watercourse was chosen very close to the perma-nent observation plot; care was taken to check that thewatershed drained had characteristics which were suffi-ciently uniform, and similar to those of the plot. Thesampling point was identified on 1:25,000-scale officialItalian topographic maps and marked with a stake. Thewatercourse was a fairly small stream, but not so smallthat it was dry for more than 3-4 months a year. The
1 2 3 4
5 6 7 8
9 10 11 12
13 14 15 16
Stemflowcollectors
Meteorologicalstation (fenced)
Plot grid (10 x 10 m)Permanent observation plot (50 x 50 m)Permanent observation plot fenceOuter buffer zone (unfenced)
Servicepassage
Bulkdepositioncollectors
Snowcollectors
Service area
PERMANENT OBSERVATION PLOTtransit only permitted to research personnel(for the shortest possible time)
BUFFER ZONEtransit permitted to research personnel and the publicno grazing or other land use
SERVICE AREAtransit and stopping permitted to research personnel
Fig. 3. Diagram of a typical permanent observation plot with the distribution of throughfall (�) and snow (X) collectors in thepermanent observation plot.

The chemistry of atmospheric deposition in Italy 81
sample was collected directly with the bottle in which itwas sent to the laboratory, care being taken to avoid de-tritus of large size, such as for example leaf or mud de-tritus. Sampling was performed weekly, even in the ab-sence of precipitation. The temperature was measured atthe same time. During the year 1999 samples were col-lected only in the station LAZ1.
2.3. Chemical variables considered
The analyses were performed on filtered samples(0.45 µm), except for measurements of pH and conduc-tivity, for which unfiltered samples were used. Thesamples were filtered in the laboratory.
The variables examined were those of the first levellisted in EEC regulation n° 926/93 of 1 April 1993: pH,conductivity, sodium, potassium, magnesium, calcium,ammonium, sulphate, chloride, nitrate, alkalinity (sam-ples with pH >5.0) and total nitrogen (runoff, through-fall and stemflow). Reactive phosphorus was also meas-ured, to reveal any contamination of the samples by birddroppings.
2.4. Analytical quality control
As three different laboratories took part in thechemical analyses (Tab. 1), the data produced had to beperfectly comparable, as well as accurate. To this end aprogramme of analytical quality control was set up, su-pervised by the JRC of Ispra, in close collaboration withthe CNR-III and the Ministry for Agriculture and ForestPolicy. The analytical quality control programmeinvolved:
a) evaluation of the analytical methods used in thelaboratories taking part in the study;
b) comparison of internal quality controls applied in thelaboratories;
c) organisation of systematic intercalibration exercises.
The different aspects relating to comparability ofdata and results of intercomparisons were discussed inmeetings aimed at the identification and elimination ofthe causes of errors, involving the people in charge ofthe different laboratories. The intercomparison exerciseswere part of a larger project supported by the EU, theAnalytical Quality Control and Assessment Studies inthe Mediterranean Basin (AQUACON), carried out bythe JRC-Ispra in collaboration with CNR-III. Theseexercises consider samples with characteristics close toboth acid deposition and freshwater samples, and yieldvaluable results for the aims of the CONECOFORproject. The results were published in reports (e.g.Mosello et al. 1998, 1999).
2.5. Data validation in the co-ordinating centre
The co-ordinating centre for the studies on atmos-pheric deposition in the framework of theCONECOFOR project, located in the CNR III, providesvalidation of the data following the criteria of ion
balance and comparison of measured and calculatedconductivities (Ulrich & Mosello 2000; Mosello et al.1999). In addition, comparisons between measured con-ductivities and sum of cations and anions were made onthe values of each station and each sample type (bulk,throughfall, stemflow, runoff). Deviations from linearityof different samples were examined in the light of thecompleteness of the analyses and considering all thepossible causes of error.
3. RESULTS
3.1. Open field, throughfall and stemflow depositionchemistry
The amounts of precipitation measured in the openfield collectors (Tab. 2) range between 544-582 mm y-1
(SIC1) and 1593-2157 mm y-1 (LOM1). Values higherthan 1000 mm were measured in the stations located inNorthern Italy, while the values in the stations in theApennines and in Southern Italy are more variable andrange from 582-544 to 1257-1848 mm y-1.
The mean annual concentrations of ions in bulk OFdeposition (Tab. 2) show a wide range of variations,from a minimum of 127 up to 1241 µeq l-1 (FRI2 andSIC1, respectively). Most of this variability is due to themarine contribution, as is shown by the wide range ofchloride and sodium (8-217 and 7-204 µeq l-1, respec-tively). The common origin of these ions is well docu-mented by their linear relationship, whose slope is notfar from the ratio present in sea water (Fig. 4). A clusteranalysis on mean concentrations points out three groupsof stations, one of which is comprised of only one sta-tion, SIC1. This station shows the highest concentra-tions of calcium, alkalinity and sulphate. The other twogroups are characterised by low (PIE1, LOM1, FRI1,FRI2, EMI1, EMI2, VEN1, TRE1, ABR1) and high(TOS1, MAR1, CAL1, CAM1) concentrations of ionsof marine origin. The correction of concentrations forthe marine contribution, made on the basis of the ratioof each ion with chloride in sea water (O.E.C.D. 1979),allows an unbiased comparison between concentrations,as sea salt also contributes to sulphate and base cationconcentrations (Tab. 2). Alkalinity and calcium are themost important variables in the corrected concentra-tions. Nitrate and sulphate show the highest concentra-tions in stations TOS1 and EMI1 (Tab 2). High valuesof sulphate are also present in the stations CAL1 andSIC1, which may receive a sulphate contribution fromthe emissions of Mount Etna (Cimino 1984, Jaesche etal. 1982; Dongarrà & Varrica 1998), which was activeduring the sampling period. The ratios between sulphateand nitrate (sea salt corrected values) are between 1.0and 1.7 in the northern and central plots, and reach theirhighest values in the southern plots of SIC1 and CAL1(2.5 and 2.6 respectively). Alkalinity is present in all thestations, generally in mean amounts higher than themean hydrogen ion concentration, estimated from pH.However, a residual deposition of acidity was detected

R. Mosello et al.82
in two sites (PIE1 and FRI1). Total nitrogen is mainlymade up of ammonium and nitrate; the amount of or-ganic nitrogen, calculated from the difference with inor-ganic nitrogen, is between 5-37 µM, i.e. 8-38% of thetotal (average 20%). Reactive phosphorus mean con-centrations are in most cases lower than 20 µg P l-1,reaching a value of 84 µg P l-1 in the southern plot,CAL1.
0
50
100
150
200
250
300
350
400
450
0 50 100 150 200 250 300 350 400 450
Sodium µeq l-1
Chl
orid
e µe
q l-1
Bulk open fieldThroughfallStemflow
Cl/Na = 0.86
Fig. 4. Relationship between sodium and chloride concentra-tions in the different samplings in relation to sea water ratio.
Throughfall concentrations in all the stations (Tab.3) are higher than the respective bulk values; the in-crease involves alkalinity and the main ions, with theexception of nitrate and ammonium, which in several
stations are lower in TF, indicating canopy uptake.However, total nitrogen concentration in TF is alwayshigher than in the open field, indicating a net release oforganic nitrogen. In fact, ON constitutes from 13 to50% of TN, with a mean of 31%. pH values are in therange 4.9-5.8; these values, compared with the range ofalkalinity (6-213 µeq l-1), mean that there is a net depo-sition of alkalinity in all the stations, with the exceptionof PIE1 (beech stand), with the same values of alkalinityand acidity, and FRI2 (Picea abies) where there is re-sidual acidity of 6 µeq l-1. Chloride (11-351 µeq l-1) andsodium (9-318 µeq l-1) show values slightly higher thanin bulk deposition, although the ratio Na/Cl remainsvery close to the marine value (Fig. 4). Potassium showsa more substantial increase: it is present in concentra-tions of 2-28 µeq l-1 in bulk open field deposition, whileits values range from 21 to 179 µeq l-1 in TF. The in-crease of reactive phosphorus concentration is alsomarked, with a range of below 8 to 364 µg P l-1. Thecorrection for sea salt contribution (Tab. 3) shows thatmost of the sodium is of marine origin, while relativelyhigh concentrations of potassium and magnesium arestill present, due to leakage from leaves. Stemflowconcentrations (Tab. 4) show significant differencesfrom those of OF and TF deposition, and vary greatlyaccording to the tree species. A general pattern in all thestations is the relevant imbalance of cations and anions,the former much higher than the latter, indicating aconsiderable presence of organic acids.
Tab. 2. Precipitation amount (mm) and volume weighted mean concentrations for bulk open field deposition for the period1998-1999. Cond: conductivity at 20 °C; RP: reactive phosphorus; TN: total nitrogen; ON: organic nitrogen, *:concentration corrected for the marine contribution. 1: calculated from the volume weighted mean concentration of ion H+; 2:research performed in 1999, only.
08 F
RI2
10 L
OM
1
17 T
RE1
01 A
BR
1
03 C
AL1
04 C
AM
1
06 E
MI2
12 P
IE1
20 V
EN1
16 T
OS1
05 E
MI1
07 F
RI1
2
09 L
AZ1
11 M
AR
1
15 S
IC1
mm 1998 1335 1593 1048 591 1257 850 845 1252 1203 717 567 - 906 1038 582mm 1999 1489 2157 1135 567 1848 1428 1433 1995 1530 1006 929 961 1077 1166 544pH 1 5.17 5.01 5.78 5.81 5.05 5.29 5.06 4.91 5.2 4.95 5.45 4.82 5.38 5.44 4.89Cond. µS cm-1 9.8 11.3 11.8 21.7 28.9 25 19.6 15.2 14.8 32.7 18.6 20.6 22.2 28.7 69H+ µeq l-1 7 10 2 2 9 5 9 12 6 11 4 15 4 4 13NH4
+ µeq l-1 18 22 32 25 14 21 26 43 34 37 65 40 24 45 22Ca++ µeq l-1 23 30 41 105 52 62 54 25 47 59 46 36 59 61 309Mg++ µeq l-1 7 4 26 15 37 29 18 5 10 33 13 13 25 30 68Na+ µeq l-1 7 7 9 41 107 98 49 9 12 204 27 36 81 112 199K+ µeq l-1 3 2 7 8 28 8 9 4 5 16 6 6 7 8 23Alk. µeq l-1 8 16 34 77 38 31 25 6 29 43 21 9 24 39 235SO4
= µeq l-1 27 29 28 40 57 46 45 39 38 76 52 52 47 47 117NO3
- µeq l-1 19 22 20 32 17 24 33 37 28 36 44 40 28 30 38Cl- µeq l-1 8 7 10 41 114 106 48 9 13 140 27 39 89 109 217Σ cat. µeq l-1 66 76 116 197 247 224 163 99 115 360 161 146 201 259 635Σ an. µeq l-1 61 74 92 190 226 207 152 91 108 294 144 140 189 224 606RP µg l-1 3 10 104 17 45 14 10 11 5 - 11 17 7 19 39ON µM 8 14 19 16 18 15 5 8 12 - 14 10 13 13 37TN µM 45 58 71 74 48 60 63 88 75 - 124 90 66 87 97Ca* µeq l-1 23 30 41 104 48 58 52 25 47 54 45 35 55 57 301Mg* µeq l-1 6 3 24 7 15 9 8 4 8 5 8 5 7 8 25Na* µeq l-1 1 1 0 6 9 7 7 1 1 84 3 2 5 18 13K* µeq l-1 3 2 6 8 26 6 8 4 4 13 5 5 6 6 19SO4* µeq l-1 26 29 26 35 45 35 40 38 36 61 49 48 38 36 95

The chemistry of atmospheric deposition in Italy 83
Tab. 3. Precipitation amount (mm) and volume weighted mean concentrations for throughfall deposition in theperiod 1998-1999. Cond.: conductivity at 20 °C; RP: reactive phosphorus; TN: total nitrogen; ON: organic nitrogen;*: concentration corrected for the marine contribution; Qc: Quercus cerris; Qr: Quercus robur. 1: calculated fromthe volume weighted mean concentration of ion H+; 2: research performed in 1999, only.
08 F
RI2
10 L
OM
1
17 T
RE1
01 A
BR
1
03 C
AL1
04 C
AM
1
06 E
MI2
12 P
IE1
20 V
EN1
16 T
OS1
05 E
MI1
Qr
07 F
RI1
2
05 E
MI1
Qc
09 L
AZ1
11 M
AR
1
15 S
IC1
mm 1998 1047 1303 864 818 1146 937 584 1280 1508 529 525 - 507 804 859 621mm 1999 1162 1738 857 687 1223 1092 1099 1837 1562 812 792 744 1224 930 1006 601pH 1 4.91 5.41 5.45 5.64 5.26 5.64 5.25 5.03 5.3 5.58 5.44 5.6 5.48 5.3 5.66 5.75Cond. µS cm-1 24.3 13.3 14.5 36.6 49.1 49.9 31.9 17 16.2 71.7 43.2 45 37 34.4 44.9 87.5H+ µeq l-1 12 4 4 2 5 2 6 9 5 3 4 3 3 5 2 2NH4
+ µeq l-1 23 20 17 48 16 25 36 43 33 69 149 53 123 19 18 46Ca++ µeq l-1 63 42 46 109 98 104 70 30 39 121 105 146 79 78 112 271Mg++ µeq l-1 30 12 26 43 73 70 37 9 15 156 47 83 37 47 53 136Na+ µeq l-1 15 9 9 67 175 196 75 10 12 318 37 50 35 114 168 274K+ µeq l-1 43 37 28 83 90 64 56 21 29 114 71 109 61 48 68 179Alk. µeq l-1 6 15 28 106 57 72 50 9 23 141 99 118 72 27 68 213SO4
= µeq l-1 68 33 27 46 103 75 64 40 42 150 90 96 86 61 65 137NO3
- µeq l-1 39 30 17 31 20 46 54 43 32 68 82 53 82 43 44 27Cl- µeq l-1 23 11 12 83 202 219 86 11 14 270 52 71 43 136 188 351Σ cat. µeq l-1 186 123 129 353 457 462 281 123 133 781 413 444 338 311 421 908Σ an. µeq l-1 136 89 83 265 382 412 254 104 110 629 323 339 284 268 365 727RP µg l-1 12 49 27 56 84 23 17 9 36 - 21 13 21 8 19 364ON µM 34 26 25 70 36 29 21 13 19 - 34 48 33 26 31 65TN µM 96 76 59 149 72 100 112 99 83 - 264 154 238 88 93 137Ca* µeq l-1 62 42 46 106 90 96 67 30 39 111 103 144 78 73 105 258Mg* µeq l-1 26 10 23 27 33 27 20 6 13 103 37 69 28 21 16 68Na* µeq l-1 0 0 0 0 4 8 1 1 0 87 0 0 0 0 7 0K* µeq l-1 42 36 28 81 86 60 55 21 29 109 70 107 61 45 64 172SO4* µeq l-1 65 32 25 37 82 53 55 39 40 123 85 89 81 47 46 100
Tab. 4. Precipitation amount (mm) and volume weighted mean concentrations for stemflow deposition in theperiod 1998-1999. Cond.: conductivity at 20 °C; RP: reactive phosphorus; TN: total nitrogen; ON: organicnitrogen; * concentration corrected for the marine contribution; Qc: Quercus cerris; Qr: Quercus robur. 1:calculated from the volume weighted mean concentration of ion H+; 2: station not active in winter; 3: researchperformed in 1999, only.
08 F
RI2
17 T
RE1
3
01 A
BR
12
03 C
AL1
04 C
AM
13
06 E
MI2
12 P
IE13
20 V
EN1
16 T
OS1
05 E
MI1
Qr
05 E
MI1
Qc
09 L
AZ1
mm 1998 3 - 22 16 - 30 - 21 24 27 20 102mm 1999 3 0.17 26 17 56 115 206 33 34 44 27 104pH 1 4.17 4.07 6.16 5.55 5.24 5.43 5.48 5.67 5.45 5.82 5.29 5.15Cond. µS cm-1 107 158 23.7 56.5 64.9 29.1 16.4 13.1 89.5 46.4 53.3 55.3H+ µeq l-1 68 86 1 3 6 4 3 2 4 2 5 7NH4
+ µeq l-1 30 25 8 5 18 34 46 11 13 144 235 14Ca++ µeq l-1 276 595 68 87 98 54 20 36 193 87 47 97Mg++ µeq l-1 129 212 30 72 92 26 7 10 182 28 24 71Na+ µeq l-1 42 58 72 228 370 91 8 11 343 30 41 222K+ µeq l-1 306 708 68 137 53 63 52 51 252 168 136 110Alk. µeq l-1 1 0 43 19 20 22 15 21 91 76 40 13SO4
= µeq l-1 343 483 39 147 96 71 45 35 229 96 113 94NO3
- µeq l-1 39 4 19 2 45 51 47 11 52 84 117 65Cl- µeq l-1 98 122 81 254 368 98 9 13 354 35 52 248Σ cat. µeq l-1 851 1683 246 533 636 272 136 122 987 459 489 520Σ an. µeq l-1 481 609 182 422 529 242 117 80 726 292 321 419RP µg l-1 15 55 12 23 12 10 55 48 - 8 6 6ON µM 174 308 36 45 25 11 13 33 - 53 57 49TN µM 243 338 63 52 88 97 107 55 - 282 410 128Ca* µeq l-1 272 591 65 78 84 50 19 36 180 85 45 87Mg* µeq l-1 110 188 14 22 19 7 5 8 113 22 14 23Na* µeq l-1 0 0 3 10 54 7 0 0 40 0 0 9K* µeq l-1 304 705 66 132 46 61 52 51 246 167 135 105SO4* µeq l-1 332 470 30 121 58 61 44 33 193 93 107 68

R. Mosello et al.84
The ion difference ranges between 8 and 48% of thecation concentrations, with a median value of 21%. Thehighest ion concentrations were measured in stemflowin Picea abies (TRE1 and FRI2), with values which are10-15 times higher than OF bulk deposition and 5-10times higher than TF. These stations were also the oneswhere the lowest pH values were recorded (4.1 and 4.2,respectively), with high values of sulphate and ammo-nium. The lowest concentrations in stemflow werefound in Fagus sylvatica (ABR1, CAL1, EMI2, VEN1,PIE1) plots with values close to those of TF. Intermedi-ate between these two cases are the stemflow concen-trations on Quercus robur and Quercus cerris, whichare about twice those of TF. No sodium uptake from thevegetation is evident in the case of stemflow either; theNa/Cl ratio was close to that of sea water (Fig. 4). Theconcentrations of organic nitrogen and potassium showa further increase if compared to OF and TF deposition.
3.2. Chemistry of runoff water
The waters of the streams sampled close to the per-manent observation plots show high solute and alkalin-ity values, indicating high soil weathering rates (Tab. 5).Alkalinity values range from 765 µeq l-1 in plot PIE1 toas much as 5160 µeq l-1 in plot LAZ1, where the soil isformed of calcareous clay. Major cations are calciumand magnesium, followed by sodium. Chloride concen-trations are very high in LAZ1 (805 µeq l-1), while thelowest mean concentration is measured in PIE1 (14 µeql-1). The low concentrations of reactive phosphorus indi-cate, as expected, the absence of fertiliser pollution. Asregards nitrogen compounds, ammonium is present in
concentrations below 5 µeq l-1, while nitrate showsmean annual values ranging from 6 to 46 µeq l-1 respec-tively in the plots FRI2 and PIE1. The monthly meanconcentrations, obtained from the weekly measurements(Fig. 5), show increasing values from the plots LAZ1and FRI2 (below 20 µeq l-1) to EMI2 (between 20 and30 µeq l-1) to PIE1 (between 30 and 67 µeq l-1). Theconcentrations of total nitrogen are three times higherthan nitrate in FRI2 and LAZ1, while the ratio is 30 and60% in the case of PIE1 and EMI2.
0
10
20
30
40
50
60
70
80
Gen Feb Mar Apr May Jun Jul Aug Sep Oct Nov Dec
PIE1
EMI2
FRI2
LAZ1
Fig. 5. Mean monthly concentrations of nitrate (µeq l-1) instream water measured in four station during the year 1998.
4. DISCUSSION
4.1. Validation of results
The ion balance check proved to be reliable in thecase of open field bulk deposition and the runningwaters, but it was not successful with TF and SF depo-sition, because of the high content of undetermined or-
Tab. 5. Mean concentrations of ions in runoff in 1998. Cond.:conductivity at 20 °C; RP: reactive phosphorus; TN: totalnitrogen; ON: organic nitrogen; *: concentration corrected for themarine contribution.
06 EMI2 08 FRI2 09 LAZ1 12 PIE1
pH 8 8.2 8.2 7.6Cond. µS cm-1 220 327 576 81H+ µeq l-1 0 0 0 0NH4
+ µeq l-1 2 4 5 3Ca++ µeq l-1 1704 2765 4472 411Mg++ µeq l-1 628 1060 1419 321Na+ µeq l-1 148 57 988 56K+ µeq l-1 21 14 49 7Alc. µeq l-1 1883 3612 5160 765SO4
= µeq l-1 356 130 677 24NO3
- µeq l-1 24 6 11 46Cl- µeq l-1 119 41 805 14Σ Cat. µeq l-1 2503 3902 6933 799Σ An. µeq l-1 2382 3789 6653 850RP µg l-1 4 3 10 4ON µM 13 6 21 7TN µM 39 16 37 56Ca* µeq l-1 1700 2764 4443 411Mg* µeq l-1 604 1052 1260 318Na* µeq l-1 47 22 297 44K* µeq l-1 19 13 34 7SO4* µeq l-1 344 125 594 23

The chemistry of atmospheric deposition in Italy 85
ganic acids, which systematically resulted in higherconcentrations of cations vs anions (Fig. 6, upper). Thesecond check, based on the comparison betweenmeasured and calculated conductivity, proved to bereliable for the four types of sample considered (Fig.6b). The contribution to conductivity of organiccompounds is generally poor, and is important only forcompounds with low molecular weight. Analyses notpassing the test were repeated and, if confirmed, thedata were in any case accepted.
0
100
200
300
400
500
600
700
N. o
f dat
a
Open fieldThroughfallStemflow
-25 -20 -15 -10 -5 0 5 10 15 20 25% difference between cation and anion concentration
0
30
60
90
120
150
180
210
240
270
N. o
f dat
a
Open fieldThroughfallStemflow
-25 -20 -15 -10 -5 0 5 10 15 20 25% difference between measured and calculated conductivity
Fig. 6. Check of anion vs cation concentrations (upper) and ofmeasured vs calculated conductivity (lower) for open field,throughfall and stemflow precipitation.
4.2. Relationships among ions
The correlation among the different ions was estab-lished using the volume weighted mean concentrationsof all the stations. From the measured values the con-centration of organic nitrogen was calculated as differ-ence between TN and NO3 + NH4, and the value of ∆(µeq l-1), as difference between the sum of cations andanions. ∆ should be related to the content of organicacid present in solution, which is not considered in thechemical analyses. On the other hand ∆ also includes allthe analytical errors made in the determination of thesingle ions, so that it must be considered only as a roughevaluation of the organic component. The correlationmatrix for the three types of deposition, obtained usingthe Spermann correlation, is presented in tables 6 to 8for OF, TF and SF concentrations respectively.
The strong influx of the marine component is evi-dent with OF and TF values, and is pointed out by therelationship between chloride and sodium, potassium,magnesium; sulphate also shows a correlation withchloride, which highlights the importance of the naturalfraction of sulphate. Hydrogen ion concentration is notlinked to any of the ions considered in OF, while in TFit is loosely related to alkalinity, calcium and sodium.Calcium is significantly related to alkalinity, magne-sium and sulphate. Ammonium and nitrate are corre-lated with each other, but do not show any relationshipwith other ions, even with organic nitrogen, either in OFor TF. On the other hand, in TF organic nitrogen is re-lated to potassium, alkalinity and ∆ (organic matter),probably as the effect of leakage from leaves.
In the case of SF, only the relationship betweenchloride and sodium remains among those linked to themarine contribution, and those linking calcium to mag-nesium. The relation between ∆ and ON, absent in OFand significant at P <0.01 in TF, is significant at P<0.001 in ST, indicating a gradual increase in impor-tance of compounds leached from leaves. This is notcompletely confirmed by the relationship between ∆ andpotassium, which is highly significant in TF, but not inSF.4.3. Flux of ions to the plots
The deposition of ions in the open field is presentedin table 9. A comparison of the flux of hydrogen ion andalkalinity shows a net flux of acidity only in two plots:PIE1 and FRI1 (11 and 4 meq m-2 y-1). In the remainingareas, net deposition of alkalinity ranges from 1 (FRI2)to 125 (SIC1) meq m-2 y-1. However, bulk depositionoverestimates alkalinity, as it also includes local dust,which is alkaline in most of the areas. The flux of basecations, which is also influenced by the samplingtechnique, is altogether high, ranging from 50 meq m-2
y-1 in FRI2, in northern Italy, to values higher than 100meq m-2 y-1 in TOS1, CAM1 and SIC1 (Central andSouth Italy). Nitrogen, which does not show any greatdifferences of concentration from southern to northernsites, does however show definitely higher fluxes innorthern sites (142, 109, 103 mmol m-2 y-1 respectivelyin PIE1, LOM1, VEN1), while the lowest values are incentral and southern sites (55, 65 meq m-2 y-1 in SIC1and LAZ1).
A comparison between the flux in OF and in TF(Tab. 10) shows an increase in most of the ions duringthe passage of the deposition through the canopy. Thisis the effect of both dry deposition on the leaves andleakage from the foliar surface, which is responsible forthe strong increase of potassium and organic matter,roughly quantified by the difference between cationsand anions (∆). Total nitrogen flux is higher in the TFthan in OF, indicating a net release from the canopy;this is true for nitrate and organic nitrogen, while am-monium fluxes show lower values in TF than in OF inseveral plots.

R. Mosello et al.86
Tab. 6. Significance of the relationships among ions in bulk open field depositions (Spearman correlation,*: p <0.05; **:p <0.01; ***: p <0.001).
mm Cond. PO4 H+ NH4+ Ca++ Mg++ Na+ K+ Alc. SO4
= NO3- Cl- NT ON ∆
mm -Cond. -PO4 * -H+ -NH4
+ -Ca++ * *** -Mg++ *** ** ** -Na+ *** *** *** -K+ *** * *** *** *** -Alc. ** ** *** *** ** *** -SO4
= * *** * ** *** ** -NO3
- * * * -Cl- *** * *** *** *** *** ** *** -NT * ** *** -ON ** ** -∆ ** ** * *** *** ** ** ** *** -
Tab. 7. Significance of the relationships among ions in throughfall depositions (Spearman correlation, *: p<0.05; **:p <0.01; ***: p <0.001).
mm Cond. PO4 H+ NH4+ Ca++ Mg++ Na+ K+ Alc. SO4
= NO3- Cl- NT ON ∆
mm -Cond. * -PO4 -H+ * * -NH4
+ * -Ca++ *** *** *** -Mg++ ** *** * *** -Na+ *** *** *** -K+ ** *** * *** *** *** -Alc. *** *** *** * *** *** ** *** -SO4
= * *** *** *** *** *** ** -NO3
- * ** -Cl- *** * *** *** *** *** ** ** -NT * *** * * ** * ** -ON * ** *** ** *** ** ** -∆ *** *** ** *** *** * *** *** *** * *** -
Tab. 8. Significance of the relationships among ions in stemflow depositions (Spearman correlation, *: p <0.05; **:p<0.01; ***: p <0.001).
mm Cond. PO4 H+ NH4+ Ca++ Mg++ Na+ K+ Alc. SO4
= NO3- Cl- NT ON ∆
mm -Cond. -PO4 -H+ ** -NH4
+ -Ca++ *** * -Mg++ *** *** -Na+ * -K+ ** ** ** -Alc. * -SO4
= *** * ** ** *** -NO3
- * ** * -Cl- ** ** ** *** -NT ** -ON * * *** ** * -∆ * *** ** ** *** *** *** -

The chemistry of atmospheric deposition in Italy 87
Stemflow fluxes, measured in 8 plots (Tab. 11),show values which are far lower than TF and OF fluxes.The relative importance of OF compared with TF rangesfrom less than 1% to 10%; the lowest values are meas-ured in conifer stands (FRI2 and TRE1), while thevalues are higher and in the same range for Fagus syl-vatica and Quercus sp. stands.
Eventually, an attempt was made to evaluate the to-tal flux of ions related to acidification, considering thesum of the deposition of ammonium, nitrate and sul-phate. The production of acidity per mole of ammoniumwas assumed as 1.5, as an average between 1, in thecase of uptake from vegetation, and 2, in the case of
oxidation to nitrate (Reuss & Johnson 1987; van Bree-men et al. 1984). The fraction deriving from sea spraywas subtracted from sulphate; nevertheless it must beborne in mind that a further fraction of sulphate may bedue to volcanic emissions (SIC1, CAL1) and to miner-als transported from North Africa (Guerzoni & Chester1996; Loye-Pilot & Martin 1996; Carratalà et al. 1996),events which are quite frequent in South and CentralItaly, and which not infrequently affect even the north-ernmost stations.
The deposition of compounds related to acidification(DEP acid) was calculated in the open field and in theplot, as the sum of throughfall (TF) and stemflow (SF):
Tab. 9. Mean ion deposition in the open field during 1998-1999. ON, TN: organic and total nitrogen. Units: ions: meq m-2
y-1, nitrogen compound: mmol m-2 y-1, ∆ difference between cations and anions, as an estimate of the fractions of organicacids meq m-2 y-1. 1: research performed in 1999; *: corrected for the marine contribution.
FRI2 LOM1 TRE1 ABR1 CAL1 CAM1 EMI2 PIE1 VEN1 TOS1 EMI1 FRI11 LAZ1 MAR1 SIC1
H+ 10 19 2 1 14 6 10 20 9 10 3 10 4 4 7NH4
+ 26 42 35 20 21 24 29 70 47 32 49 26 24 50 13Ca++ 33 56 45 82 81 71 62 41 65 51 34 26 58 67 174Mg++ 10 8 28 12 58 33 20 9 14 28 10 10 24 33 38Na+ 10 13 10 32 166 111 55 15 17 176 20 23 81 123 112K+ 5 4 7 7 43 9 10 6 6 14 4 4 7 9 13Alk. 11 30 37 59 58 35 29 9 40 37 15 6 24 43 132SO4
= 38 55 30 31 88 52 51 63 51 65 39 36 47 51 66NO3
- 26 41 22 26 27 27 37 60 39 31 33 26 28 33 22Cl- 11 12 11 32 177 120 55 15 18 120 20 25 89 120 122∆ 7 3 27 6 32 20 13 14 9 56 12 7 12 39 16ON 11 28 21 13 27 17 6 12 17 0 11 7 13 14 21TN 63 109 78 59 75 68 72 142 103 0 93 60 65 96 55Ca* 32 56 45 81 74 66 60 41 64 47 34 17 55 63 170Mg* 8 5 26 6 23 10 9 6 10 5 6 3 7 9 14Na* 1 2 1 4 14 8 8 2 1 73 2 1 5 20 8K* 5 4 7 6 40 7 9 6 6 11 4 3 6 6 11SO4* 37 54 29 28 70 40 46 61 49 53 37 23 38 39 53
Tab. 10. Mean ion deposition in throughfall during 1998-1999. ON, TN: organic and total nitrogen. Units, ions: meq m-2
y-1, nitrogen compound: mmol m-2 y-1; ∆: difference between cations and anions, as an estimate of the fractions of organicacids meq m-2 y-1; Qr: Quercus robur; Qc: Quercus cerris. 1: research performed in 1999; *: corrected for the marinecontribution.
FRI2
LOM
1
TRE1
AB
R11
CA
L1
CA
M1
EMI2
PIE1
VEN
1
TOS1
EMI1
Qr
EMI1
Qc
FRI1
11
LAZ1
MA
R1
SIC
1
H+ 14 6 3 2 6 2 5 15 8 2 3 2 1 4 2 1NH4
+ 25 30 14 39 19 26 31 67 51 46 106 98 20 17 17 28Ca++ 69 64 40 90 116 105 59 47 60 81 69 69 54 67 105 166Mg++ 33 18 22 35 86 71 31 13 24 104 32 31 31 41 49 83Na+ 17 14 8 55 208 199 63 16 18 213 30 25 19 99 156 168K+ 47 56 24 67 106 65 47 33 45 76 53 47 40 41 63 109Alk. 7 23 24 87 68 73 42 15 36 95 63 65 44 24 64 130SO4
= 75 50 23 37 122 76 54 63 64 101 74 60 36 53 61 83NO3
- 43 46 14 25 23 47 46 67 48 46 71 54 20 37 41 16Cl- 25 16 11 67 239 222 73 17 21 181 37 34 26 118 175 214∆ 55 52 40 70 89 51 23 30 35 102 47 59 39 37 53 111ON 38 39 22 55 43 29 18 21 29 0 29 22 18 22 29 39TN 106 115 51 120 85 102 94 154 128 0 206 174 57 77 87 84Ca* 68 63 39 87 107 97 57 47 60 75 67 68 53 63 98 158Mg* 28 15 20 22 39 28 17 10 19 69 24 24 26 18 15 41Na* 0 0 0 0 5 9 2 1 0 58 1 0 0 0 6 0K* 47 55 24 66 102 61 46 33 44 73 52 46 40 39 60 105SO4* 72 49 22 31 97 53 46 61 62 82 70 56 33 41 43 61

R. Mosello et al.88
Tab. 11. Mean ion deposition in stemflow during 1998-1999. ON, TN: organic and total nitrogen. Units, ions: meq m-2 y-1
nitrogen compound: mmol m-2 y-1, ∆ difference between cations and anions, as an estimate of the fractions of organic acidsmeq m-2 y-1; Qr: Quercus robur; Qc: Quercus cerris. 1: research performed in 1999; *: corrected for the marinecontribution.
FRI2 TRE12 ABR1 CAL1 CAM11 EMI2 PIE11 VEN1 TOS1 EMI1Qr EMI1Qc LAZ1
H+ 0.2 0.01 0.0 0.0 0.2 0.3 0.3 0.1 0.1 0.1 0.1 0.7NH4
+ 0.1 0.00 0.2 0.1 0.5 2.5 4.8 0.3 0.4 5.6 5.1 1.4Ca++ 0.7 0.05 1.6 1.4 2.7 3.9 2.0 1.0 5.6 1.1 3.0 10.0Mg++ 0.3 0.02 0.7 1.2 2.6 1.9 0.7 0.3 5.3 0.6 1.0 7.4Na+ 0.1 0.00 1.7 3.8 10.4 6.6 0.8 0.3 9.9 1.0 1.1 22.9K+ 0.8 0.06 1.6 2.3 1.5 4.5 5.3 1.4 7.3 3.2 5.9 11.3Alk. 0.0 0.00 1.0 0.3 0.6 1.6 1.5 0.6 2.6 1.0 2.7 1.3SO4
= 0.9 0.04 0.9 2.4 2.7 5.1 4.7 0.9 6.6 2.7 3.4 9.7NO3
- 0.1 0.00 0.5 0.0 1.3 3.7 4.9 0.3 1.5 2.8 3.0 6.7Cl- 0.3 0.01 2.0 4.2 10.3 7.1 0.9 0.4 10.2 1.2 1.2 25.6∆ 1.0 0.09 1.5 1.8 3.0 2.1 2.0 1.1 7.6 4.0 5.9 10.4ON 0.5 0.03 0.9 0.7 0.7 0.8 1.4 0.9 0.0 1.4 1.9 5.1TN 0.6 0.03 1.5 0.9 2.5 7.0 11.0 1.5 0.0 9.7 9.9 13.2Ca* 0.7 0.05 1.6 1.3 2.4 3.6 2.0 1.0 5.2 1.1 3.0 9.0Mg* 0.3 0.02 0.3 0.4 0.5 0.5 0.5 0.2 3.3 0.3 0.8 2.3Na* 0.0 0.00 0.1 0.2 1.5 0.5 0.0 0.0 1.2 0.1 0.0 1.0K* 0.8 0.06 1.6 2.2 1.3 4.4 5.3 1.4 7.1 3.2 5.9 10.9SO4* 0.9 0.04 0.7 2.0 1.6 4.4 4.6 0.9 5.6 2.5 3.3 7.0
Tab. 12. Volume (mm) and deposition of acid ions (SO4=, NO3
-, NH4+), alkalinity, total nitrogen and base cations (BC: mmol m-2
y-1) in the CONECOFOR research areas. Qr: Quercus robur, Qc: Quercus cerris.
08 F
RI2
10 L
OM
1
17 T
RE1
01 A
BR
11
03 C
AL1
04 C
AM
1
06 E
MI2
12 P
IE1
20 V
EN1
16 T
OS1
05 E
MI1
Qr
07 F
RI1
05 E
MI1
Qc
09 L
AZ1
11 M
AR
1
15 S
IC1
volume 1998 1335 1593 1048 591 1257 850 845 1252 1203 717 567 - 567 906 1038 5821999 1489 2157 1135 567 1848 1428 1433 1995 1530 1006 929 961 929 1077 1166 544
acid ions 1998 98 136 81 79 93 71 90 170 143 132 119 - 119 90 170 701999 104 180 125 89 164 136 164 281 174 131 166 142 166 114 123 118
alkalinity 1998 15 30 27 79 35 45 18 6 49 23 14 - 14 23 64 541999 7 30 47 40 81 26 40 12 31 51 17 9 17 25 21 210
total N 1998 65 67 55 55 55 48 56 112 94 672 84 - 84 58 106 561999 62 151 101 63 96 88 87 172 111 582 101 86 101 73 87 54
BC 1998 59 57 95 151 275 172 106 64 104 310 62 - 62 116 196 1981999 57 105 86 115 421 277 188 80 99 227 75 88 75 225 268 477
BC* 1998 50 44 88 112 119 91 70 53 92 158 44 - 44 68 118 1021999 42 90 68 82 183 91 101 57 71 112 48 46 48 77 79 302
Throughfall + Stemflow
volume 1998 1050 1303 864 840 1162 937 614 1280 1529 553 551 - 528 906 859 6211999 1165 1738 857 714 1240 1148 1214 2043 1596 846 836 744 1251 1035 1006 601
acid ions 1998 110 126 53 137 142 130 105 176 199 201 231 - 224 113 104 1051999 198 152 63 114 159 154 194 312 177 209 309 165 405 127 115 134
alkalinity 1998 9 35 26 77 73 78 28 9 19 82 48 - 56 14 79 921999 5 10 21 100 64 69 60 23 54 113 88 88 71 36 48 168
total N 1998 84 117 47 153 86 92 78 123 136 1022 172 - 168 83 85 711999 128 114 55 91 86 116 124 207 123 852 196 115 264 97 89 96
BC 1998 124 138 97 273 529 466 146 102 137 439 167 - 148 213 328 3761999 213 167 91 232 519 450 291 136 162 568 198 289 231 387 419 675
BC* 1998 111 121 90 189 273 209 102 90 121 258 137 - 118 116 198 1931999 180 147 77 168 240 190 158 108 131 324 159 238 182 170 160 415

The chemistry of atmospheric deposition in Italy 89
DEPOF (acid) = 2 DEPOF (SO4*)+DEPOF (NO3) ++ 1.5 DEPOF (NH4)
DEPIF (acid) = 2 DEPTF (SO4*) + 2 DEPSF (SO4*) ++ DEPTF (NO3) + DEPSF (NO3) +
+ 1.5 DEPTF (NH4) + 1.5 DEPSF (NH4)
where units are mmol m-2 y-1. It must be emphasisedthat these values do not express actual or potential acid-ity, as most of the anions are buffered by the high con-centrations of calcium and other base cations.
Results (Tab. 12) shows the highest values in openfield (130-280 mmol m-2 y-1) in the northern sites ofPIE1, VEN1, LOM1; the station of MAR1, located inCentral Italy, also shows high values, mainly due tohigh ammonium deposition. The lowest values (70-130mmol m-2 y-1) were measured in the plots TRE1, ABR1,CAM1, SIC1. The ranking is very similar in the case oftotal deposition (Tab. 8), with a ratio total/OF rangingbetween 0.8 to 1.9.
The difference in ion fluxes between the two studyyears (Fig. 7) in most of the stations shows slightlyhigher values in 1999 than in 1998, both for OF andTF+SF deposition, in accordance with the high volumesof precipitation.
4.4. Nitrogen saturation
Besides the alkaline/acidic input in deposition, thedeposition of nitrogen, sometimes referred to as the"eutrophication effect" (e.g. Posch et al. 1999) must betaken into account. Also in this case we considered theOF and the deposition in the plot, as follows:
DEPOF (N) = DEPOF (NO3) + DEPOF (NH4)
DEPIF (N) = DEPTF (NO3)+DEPSF (NO3)++ DEPTF (NH4)+DEPSF (NH4)
where units are mmol m-2 y-1. Results show a widerange of variation both for OF and in the plot values(Tab. 12). The ranking of the values is close to those ofacidic compounds, with the highest values of OF nitro-gen deposition in the areas PIE1, MAR1 and VEN1 (94-172 mmol m-2 y-1), while the lowest are in TRE1,ABR1, LAZ1 (55-101 mmol m-2 y-1). The ratio betweenthe OF and total deposition of nitrogen ranges between0.8 and 3.4.
Nitrogen loads may be compared with nitrate andtotal nitrogen concentrations in stream waters. To syn-thesise the concentrations and the seasonal variations ofnitrate we used the Stoddard & Traan approach (Tab.13), as applied to water courses with frequent samplings(Traan & Stoddard 1995; Stoddard 1994). This ap-
Volume (mm)
0
500
1000
1500
2000
2500
0 500 1000 1500 2000 2500
year 1998
year
199
9
Bulk open fieldThroughfall + stemflow
Acid ions (mmol m-2 y-1)
0
100
200
300
400
500
0 100 200 300 400 500
year 1998
year
199
9
Bulk open fieldThroughfall + stemflow
Base cations (mmol m-2 y-1)
0
100
200
300
400
500
600
700
0 100 200 300 400 500 600 700
year 1998
year
199
9
Bulk open fieldThroughfall + stemflow
Total nitrogen (mmol m-2 y-1)
0
50
100
150
200
250
300
0 50 100 150 200 250 300
year 1998
year
199
9Bulk open fieldThroughfall + stemflow
Fig. 7. Comparison between 1998 and 1999 values of amount of precipitation (mm) and deposition of acid ions, base cations andtotal nitrogen.
R. Mosello et al.90
proach gives a quantification of the level of nitrogensaturation of the watershed; the higher the stage of satu-ration, the lower the possibility of soil and vegetation tometabolise and immobilise the amount of nitrogen de-posited from atmosphere. Results (Fig. 5) give a satura-tion stage of 1 for sites FRI2 and PIE1, stage 2 forEMI2, stage 3 for PIE1. These values mean that all theareas are subjected to nitrogen overload, very accentu-ated in the case of EMI2 and PIE1, and that vegetationand soil microflora are no longer able to regulate the ni-trogen flux. These conclusions are further supported bythe high organic nitrogen content, which is present inthe highest amounts in the two streams with relativelylow nitrate.
5. CONCLUSIONS1998 and 1999 were the first full years when data on
the chemistry of atmospheric deposition were collectedin Italy. For this reason, sampling, analysis and datavalidation were performed with particular care and instrict accordance with international standards (UN-ECE1994). The sampling stations considered, all located inpermanent plots for the study of vegetation growth andevolution, are representative of different geographicalconditions, from the Mediterranean conditions of thesouthern sites to the Alpine environment of some of thenorthern stations. The chemistry of bulk deposition isstrongly influenced by natural sources, such as the ma-rine component (Na, Cl, Mg, part of the sulphate) andsoil dust (Ca, alkalinity, Mg, K), of local or remote ori-gin (North Africa). Among the changes due to anthro-pogenic emissions in the atmosphere, acidification ispresent in some of the northern stations (PIE1, FRI2),while most of the other sites show a net flux of alkalin-ity, even in open field deposition. The acidity is how-ever buffered by the dust and dry deposition present onthe canopy, so that the throughfall deposition is alwaysalkaline. However, it must be emphasised that bulkdeposition is not entirely reliable in estimating the acid-ity level of deposition, as it is strongly influenced bydust particles of local origin. The parallel measurementof wet deposition in some areas has already beenplanned, with the aim of improving our understandingof the relative importance of local and transported sub-stances in atmospheric deposition.
An estimation of the amount of ion deposition re-lated to anthropogenic emissions (sulphate, nitrate andammonium, Fig. 8) produces a wide range of variations,with the highest values in the northern (PIE1, VEN1)and central (EMI1, TOS1) sites and the lowest in thesouthern and alpine stations. The contribution of vol-canic emissions to the high sulphate deposition of CAL1and SIC1 requires further investigation.
The situation of nitrogen deposition is far more criti-cal: values are very high both in open field and TF sam-ples. Again, there is a trend towards lower values in thesouthern and central stations than in the north of thecountry. Both ammonium and nitrate are important inOF deposition; the importance of organic nitrogen in-creases markedly in the TF and SF samples, if comparedwith OF. The different level of nitrogen deposition isclearly reflected in the nitrate and total nitrogen con-centrations of the stream water sampled in four plots,quantified through the Stoddard and Traaen approach(Fig. 5). The plots show a release of nitrate from thewatershed in all seasons, indicating an overload of ni-trogen compared to its possible uptake by vegetation,but saturation is very high, also in absolute terms (stage3 of the Stoddard & Traaen criteria) in the northern plotPIE1, high in the central EMI2 plot (stage 2), and mod-erate in the central and alpine plots of LAZ1 and FRI2.Furthermore, a comparison between actual and criticalloads of acidity and nitrogen, detailed in a previous pa-per (Mosello & Marchetto 1999), reveals nitrogen loadexceedances in most of the areas.
Nitrogen enrichment is a common feature of largeparts of Europe with intensive human activities; its im-pact on surface and drinking water poses a seriouschallenge. The gradient shown in these four Italian sitesoffers an opportunity to study details of the processes ofdeposition and transformation of the different N speciesimmediately after deposition, pointing out the interac-tions existing between nitrogen deposition, vegetationuptake and release in surface water.
Other aspects of the relationships between atmos-pheric deposition chemistry and vegetation status arebeing considered in the interdisciplinary projectCONECOFOR, and form the basis for Italian forestryresearch, in close connection with the international
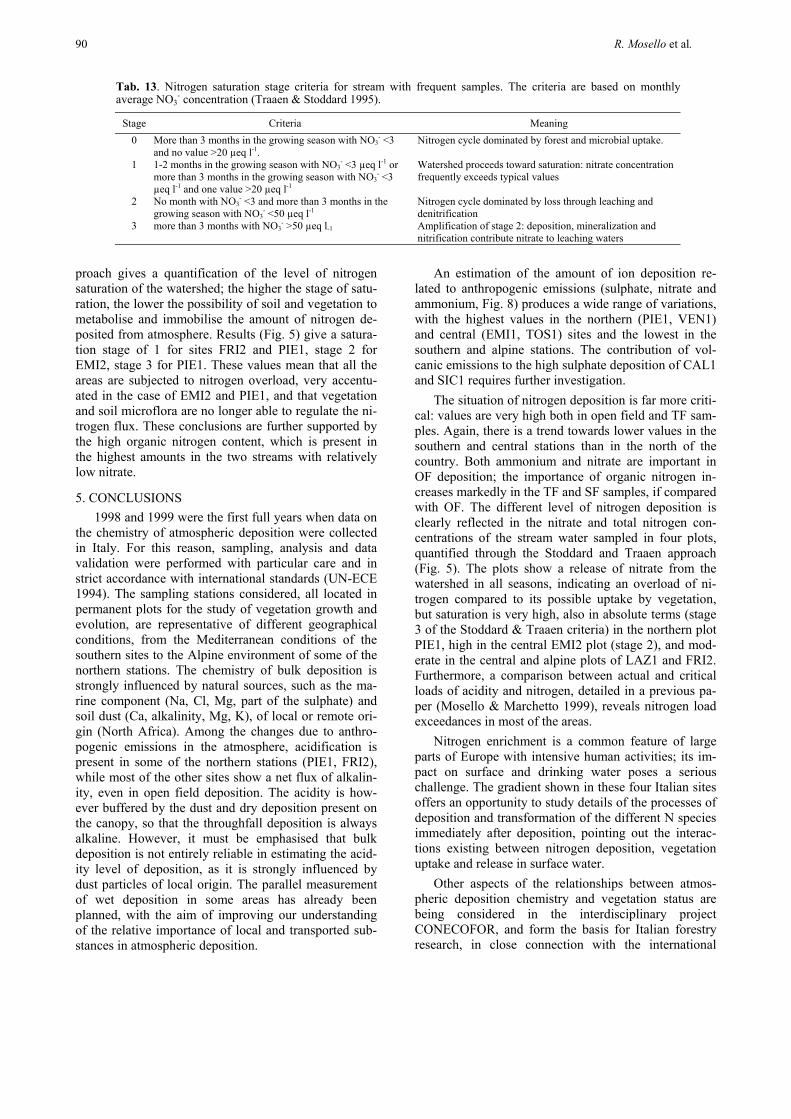
Tab. 13. Nitrogen saturation stage criteria for stream with frequent samples. The criteria are based on monthlyaverage NO3
- concentration (Traaen & Stoddard 1995).
Stage Criteria Meaning0 More than 3 months in the growing season with NO3
- <3and no value >20 µeq l-1.
Nitrogen cycle dominated by forest and microbial uptake.
1 1-2 months in the growing season with NO3- <3 µeq l-1 or
more than 3 months in the growing season with NO3- <3
µeq l-1 and one value >20 µeq l-1
Watershed proceeds toward saturation: nitrate concentrationfrequently exceeds typical values
2 No month with NO3- <3 and more than 3 months in the
growing season with NO3- <50 µeq l-1
Nitrogen cycle dominated by loss through leaching anddenitrification
3 more than 3 months with NO3- >50 µeq l-1 Amplification of stage 2: deposition, mineralization and
nitrification contribute nitrate to leaching waters

The chemistry of atmospheric deposition in Italy 91
studies performed under the sponsorship of the EU andUN/ECE.
ACKNOWLEDGMENTSThis paper was prepared under the contract between
the Ministry for Agriculture and Forestry Policy – Na-tional Forest Service, Italy.
REFERENCESAllavena, S., B. Petriccione, R. Isopi, E. Pompei, R. Mosello,
A. Boggero, G. Tartari, S. Piazza, G. Serrini, A. Andreotti,M. De Mei, M. Collina & F. Serra. 1997. ProgrammaNazionale Integrato per il Controllo degli EcosistemiForestali (CONECOFOR): studio della chimica delledeposizioni atmosferiche. Ministero per le Politiche Agri-cole - D.G. Risorse Forestali, Montane ed Idriche - Divi-sione V, CNR - Istituto Italiano di Idrobiologia. ReportCNR-III 02.97: 37 pp.
Allavena, S., R. Isopi, B. Petriccione & E. Pompei. 1999. Pro-gramma Nazionale Integrato per il Controllo degli Eco-sistemi Forestali. Ministero per le Politiche agricole, D.G.Risorse Forestali, Montane ed Idriche. Roma: 167 pp.
Carratalà, A., J. Bellot, A. Gomez & M. Millan. 1996. Africandust influence on rainwater on the Eastern coast of Spain.In: Guerzoni, S. & R. Chester (Eds). The impact of desertdust across the Mediterranean. Kluwer, Dordrecht: 323-332.
Cimino, G. 1984. Impatto dell'attività vulcanica sulle acquepiovane nell'areale orientale dell'Etna. Inquinamento, 7/8:43-46.
De Vries, W., G.J. Reinds, M.S. van Kerkvoorde,. C.M.A.Hendriks, E. E. J.M. Leeters, C.P. Gross, J.C.H. Voogd &E.M. Vel. 2000. Intensive Monitoring of Forest Ecosys-tems in Europe. Technical Report 2000. EC, UN/ECE,Brussels, Geneva: 193 pp.
Dongarrà, G. & D. Varrica. 1998. The presence of heavymetals in air particulate at Vulcano Island (Italy). Sci.Total. Environ., 212: 1-9.
European Commission, DG VI. 1996. European Programmefor the Intensive Monitoring of Forest Ecosystems. Pro-tection of Forests against Atmospheric Pollution (Regula-tion (EC) N° 3528/86 and its amendments). EC DG VI,Brussels: 40 pp.
Guerzoni, S. & R. Chester (Eds). 1996. The impact of desertdust across the Mediterranean. Kluwer, Dordrecht: 389 pp.
Jaesche, W., H Berresheim & H.W. Georgii. 1982. Sulfuremission from mt. Etna. J. Geophys. Res., 87: 7253-7261
Loye-Pilot, M.D. & J.M. Martin. 1996. Saharan dust input tothe Western Mediterranean: an eleven year record in Cor-sica. In: Guerzoni, S. & R. Chester (Eds), The impact ofdesert dust across the Mediterranean. Kluwer, Dordrecht:191-200.
Loye-Pilot, M.D., J.M. Martin, & J. Morelli. 1986. Influenceof Saharan dust on the rain acidity and atmospheric inputto Mediterranean. Nature, 321: 427-428.
Fig. 8. Open field bulk depositions of sulphate, nitrate and ammonium in the Italian sampling sites.

R. Mosello et al.92
Mosello, R. & A. Marchetto. 1999. Atmospheric depositionand streamflow chemistry at the Permanent MonitoringPlots of the CONECOFOR program. Annali IstitutoSperimentale Selvicoltura, 30: 117-120.
Mosello, R., A. Boggero, A. Marchetto & G.A. Tartari. 1998.National integrated programme for the control of forestecosystems (CONECOFOR). Study of atmospheric depositionchemistry. CNR Istituto Italiano di Idrobiologia, VerbaniaPallanza, Technical Report: 40 pp.
Mosello, R., M. Bianchi, H. Geiss, A. Marchetto, G. Serrini,G. Serrini Lanza, G.A. Tartari & H. Muntau. 1998.AQUACON-MedBas Subproject N°5. Freshwater analysis.Intercomparison 1/97. Joint Res. Centre European Com-mission, Rep. EUR 18075 EN, 66 pp.
Mosello, R., M. Bianchi, M.C. Brizzio, H. Geiss, W. Leyen-decker, A. Marchetto, D. Rembges, G.A. Tartari & H.Muntau. 1999. AQUACON-MedBas Subproject No. 6.Acid rain analysis. Intercomparison 1/98. Joint Res. CentreEuropean Commission, Rep. EUR 19015 EN: 81 pp.
O.E.C.D. 1979. The O.E.C.D. programme on long rangetransport of air pollutants. O.E.C.D., Paris.
Posch, M., P.A.M. de Smet, J.-P. Hettelingh & R.J. Downing.1999. Calculation and mapping of critical thresholds inEurope. Status Report 1999. Coordination Center for Ef-fects, National Institute of Public Health and the Environ-ment, Bilthoven, Netherlands, RIVM Report NO.259101009: 165 pp.
Reuss, L.O. & D.W. Johnson. 1986. Acid deposition and theacidification of soils and waters. Springer, New York: 120 pp.
Stoddard, J.L. 1994. Long-term changes in watershed reten-tion of nitrogen. Its causes and aquatic consequences. In:Environmental Chemistry of Lakes and Reservoirs. ACS,American Chemical Society. Advances in Chemistry Series,237.
Traaen, T.S. & J.L. Stoddard. 1995. An assessment of nitrogenleaching from watersheds in ICP on waters. Conventionon Long-range Transboundary Air Pollution. Interna-tional Cooperative Programme on assessment and moni-toring of acidification of rivers and lakes. Prepared by theProgramme Centre, Norwegian Institute for Water re-search. NIVA-report, 3201: 39 pp.
Ulrich, E. & R. Mosello. 2000. Quality Assurance and QualityControl for atmospheric deposition monitoring within ICPForests. In: UN-ECE. Convention on Long-Range Trans-boudary Air pollution. Manual on Methods and criteriafor harmonized sampling, assessment, monitoring andanalysis of the effects of air pollution on forests. PartVI.Measurement of deposition and air pollution: 13-39.
UN-ECE. 1994. Manual on methods and criteria for harmo-nized sampling, assessment, monitoring and analysis ofthe effects of air pollution on forests. Hamburg and Prague:177 pp.
Van Breemen, N., C.T. Driscoll & J. Mulder. 1984. Aciddeposition and internal proton sources in acidification ofsoils and waters. Nature, 307: 599-604.
Related Documents