The Check_MK monitoring system Open Source Days 2016, Copenhagen Speaker: Troels Arvin Slides: http://troels.arvin.dk/osd/2016/

Welcome message from author
This document is posted to help you gain knowledge. Please leave a comment to let me know what you think about it! Share it to your friends and learn new things together.
Transcript
The Check_MKmonitoring system
Open Source Days 2016, CopenhagenSpeaker: Troels Arvin
Slides: http://troels.arvin.dk/osd/2016/

About meSection of Infrastructure Development & Architecture, Danish Health Data Authority (Sundhedsdatastyrelsen).
Role: Database administrator.
Systems monitoring experience: Nagios, SCOM, SolarWinds, Check_MK (since 2012), OEM, up.time, HP IMC.
● History● Features / demo● Drawbacks● If time: How it works● Questions
Agenda
History of Check_MK2008: Check_MK released as plugin to Nagios.
2010: Open Monitoring Distribution (OMD, omdistro.org): A mash-up of Nagios, Check_MK, NagVis, PNP4Nagios, DocuWiki, ...
2015: Check_MK Raw Edition: Simplified version of OMD.
Along the way, Nagios has become a minor part of the monitoring solution.
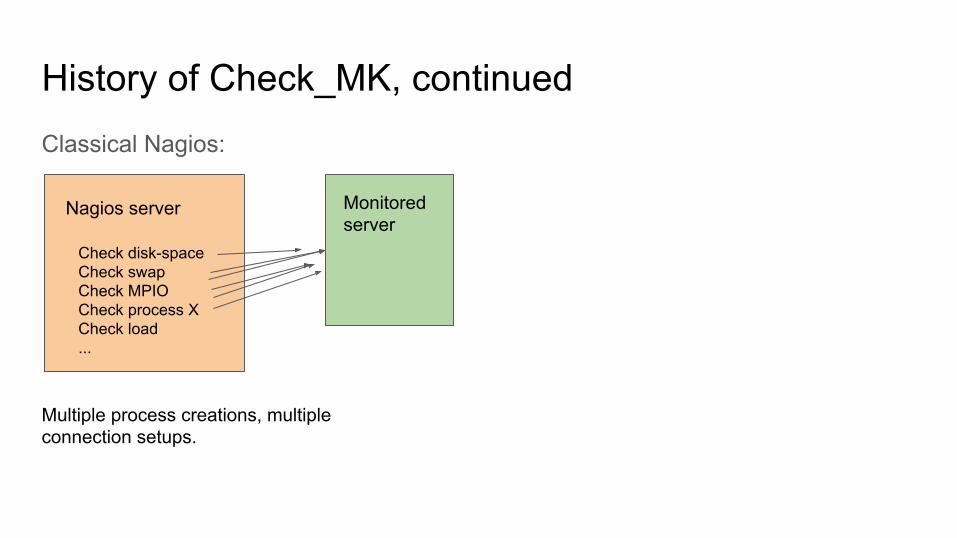
History of Check_MK, continuedClassical Nagios:
Nagios server
Check disk-spaceCheck swapCheck MPIOCheck process XCheck load...
Monitored server
Multiple process creations, multiple connection setups.
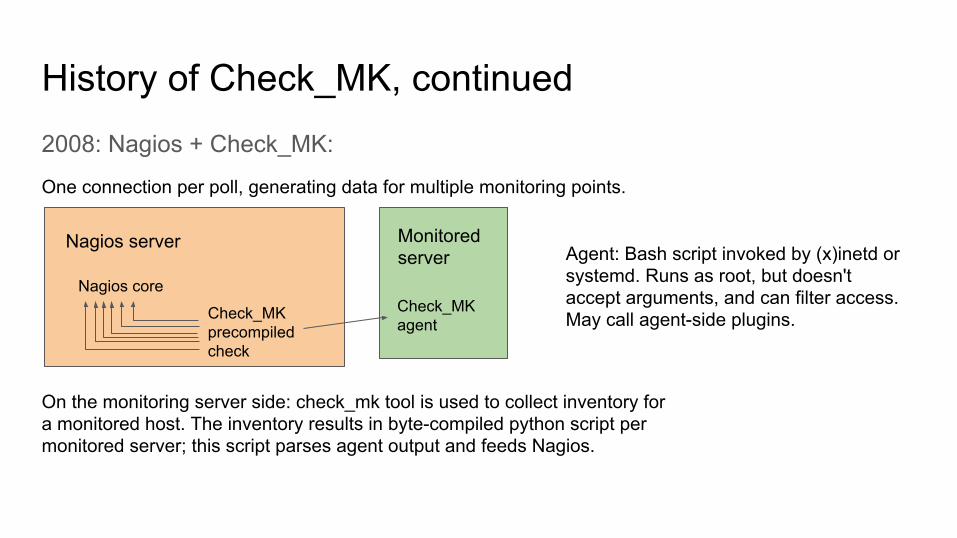
History of Check_MK, continued2008: Nagios + Check_MK:
Nagios server
Nagios core
Monitored server
Check_MKprecompiledcheck
Check_MKagent
On the monitoring server side: check_mk tool is used to collect inventory for a monitored host. The inventory results in byte-compiled python script per monitored server; this script parses agent output and feeds Nagios.
Agent: Bash script invoked by (x)inetd or systemd. Runs as root, but doesn't accept arguments, and can filter access. May call agent-side plugins.
One connection per poll, generating data for multiple monitoring points.

History of Check_MK, continued2010: Open Monitoring Distribution (OMD):
● Bundled Nagios, Icinga, Check_MK, NagVis, PNP4Nagios, RRDtool, DocuWiki, Shinken, ...
● Distributed via package repositories.● Included installer.● Community.

History of Check_MK, continued2015: Open Monitoring Distribution stagnating, as Check_MK has taken center stage. Nagios is now a small corner of the solution; mainly used for core scheduling.
Leaner derivations of OMD:
● Check_MK Raw Edition● Check_MK Enterprise Edition
Main developers: Mathias Kettner GmbH, Munich.
Check_MK Raw Edition FeaturesOpen source (GPL 2) with public git repo.
Available as a stand-alone bundled package for several distros. Or for DIY-people as separate packages (e.g. in EPEL).
Backed by full-time developers.
Commercial support available (Enterprise Edition + appliance editions).
Consultancy available.
Courses, conferences. Thriving community (IRC, mailing lists, extension repo).

Check_MK Raw Edition Features, continuedVery efficient:
● Uses tmpfs at write-intensive paths.● Byte-compiled checks per monitored host.● Multiple monitoring points covered by a single agent poll.● rrdcached
CPU util on monitoring server with 15000+ services at 600+ hosts, 4 minutes between polls (60/sec):
Huge contrast to SCOM, Nagios.
Check_MK Raw Edition Features, continuedGraphs are handled so fast that they are actually useful.
(Live demo.)
Check_MK Raw Edition Features, continuedReal choice between text-based configuration and web-based configuration. Text-based configuration much more concise than Nagios configuration.
Broad monitoring coverage:
● 100s of checks out-of-the box. Most of high quality.● 160 contributed checks in Check_MK Exchange ("MKP" packages)● Compatibility with Nagios plugins.
Examples...
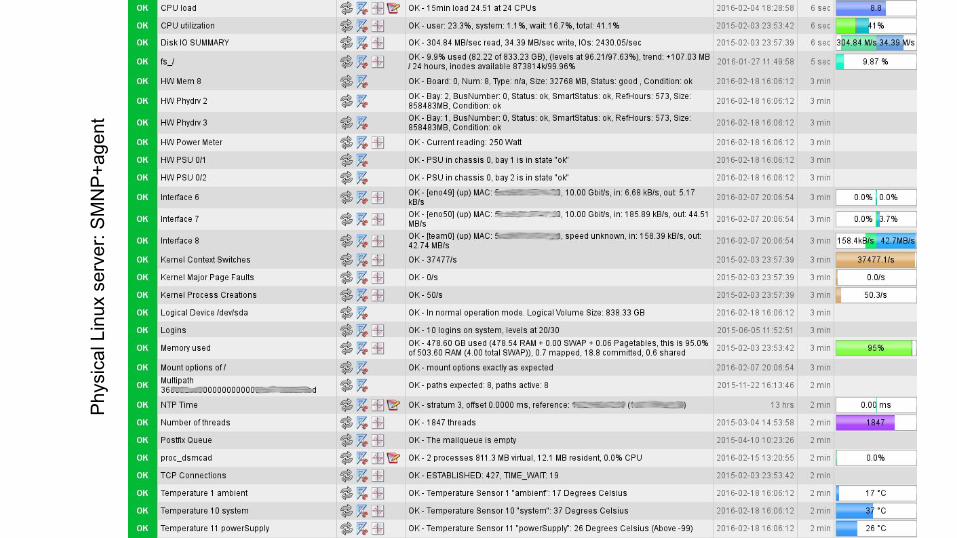
Phy
sica
l Lin
ux s
erve
r: S
MN
P+a
gent
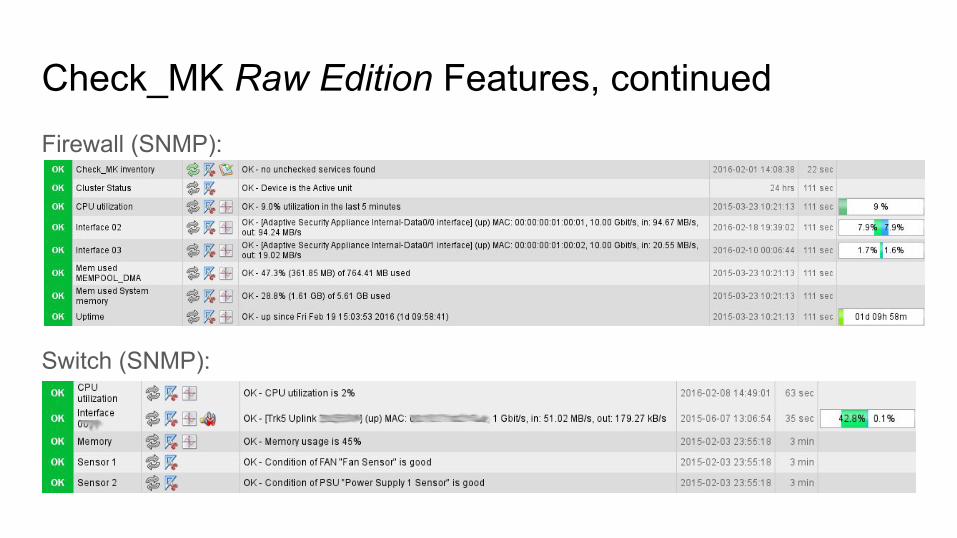
Check_MK Raw Edition Features, continuedFirewall (SNMP):
Switch (SNMP):

Check_MK Raw Edition Features, continuedFibre channel switch (SNMP):
Note: Not trap-based (trap-based hw monitoring generally isn't reliable).
MSSQL (agent + agent plugin):
Check_MK Raw Edition Features, continued
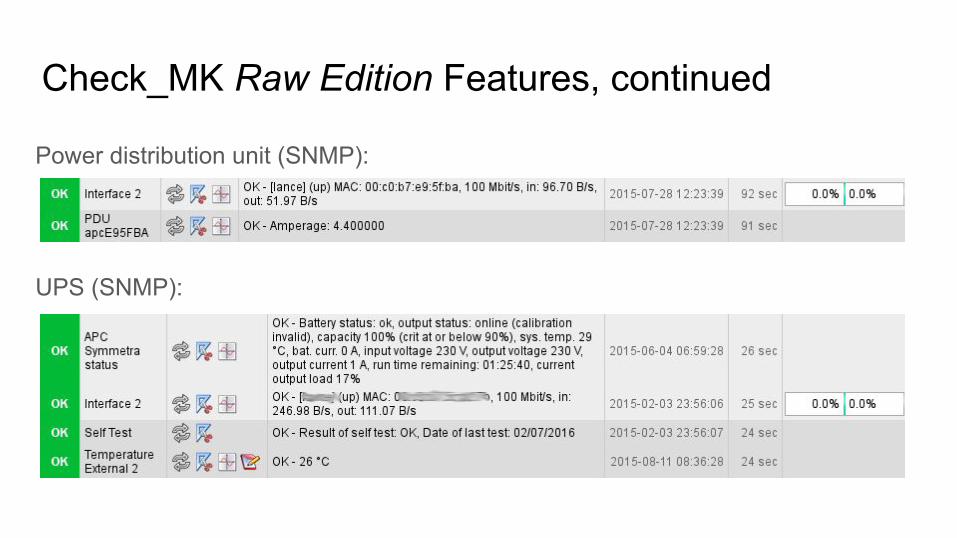
Power distribution unit (SNMP):
UPS (SNMP):
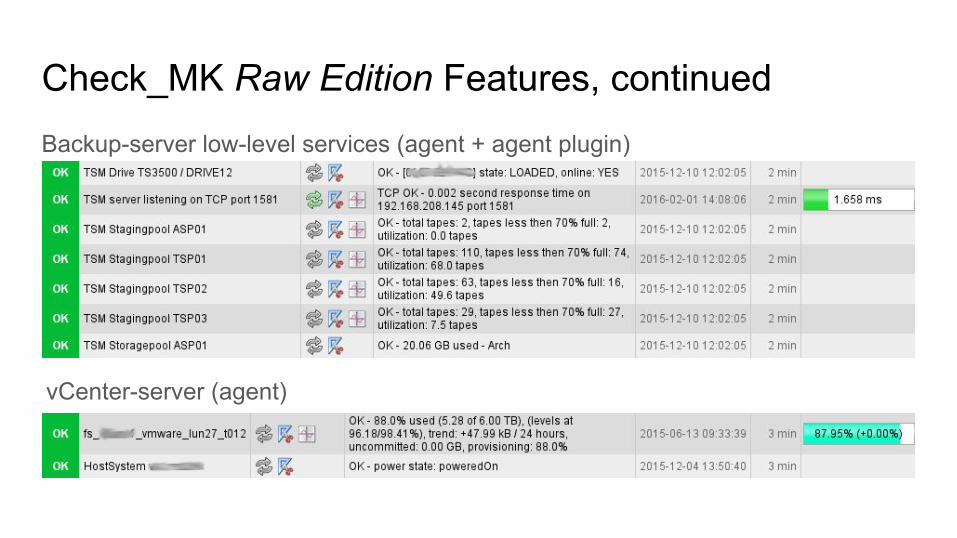
Check_MK Raw Edition Features, continuedBackup-server low-level services (agent + agent plugin)
vCenter-server (agent)
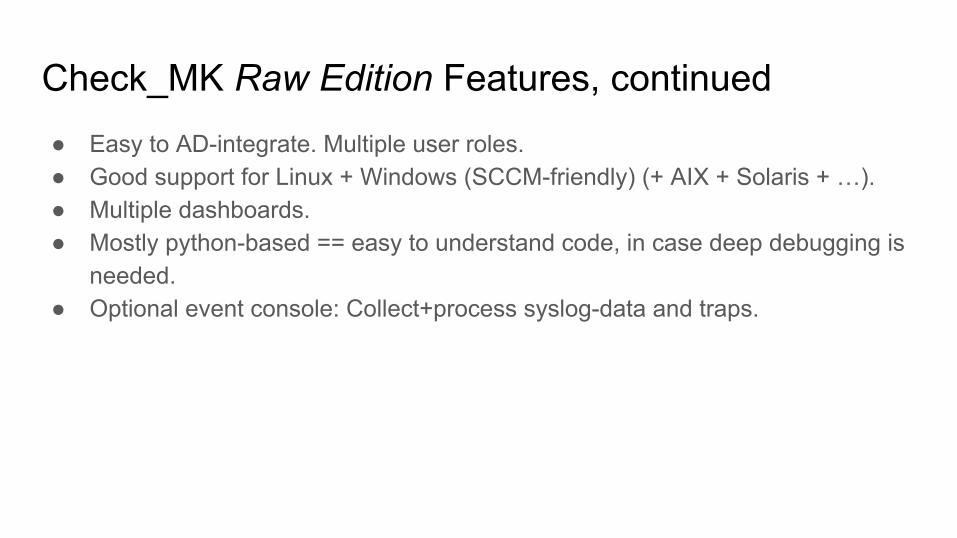
Check_MK Raw Edition Features, continued● Easy to AD-integrate. Multiple user roles.● Good support for Linux + Windows (SCCM-friendly) (+ AIX + Solaris + …).● Multiple dashboards.● Mostly python-based == easy to understand code, in case deep debugging is
needed.● Optional event console: Collect+process syslog-data and traps.
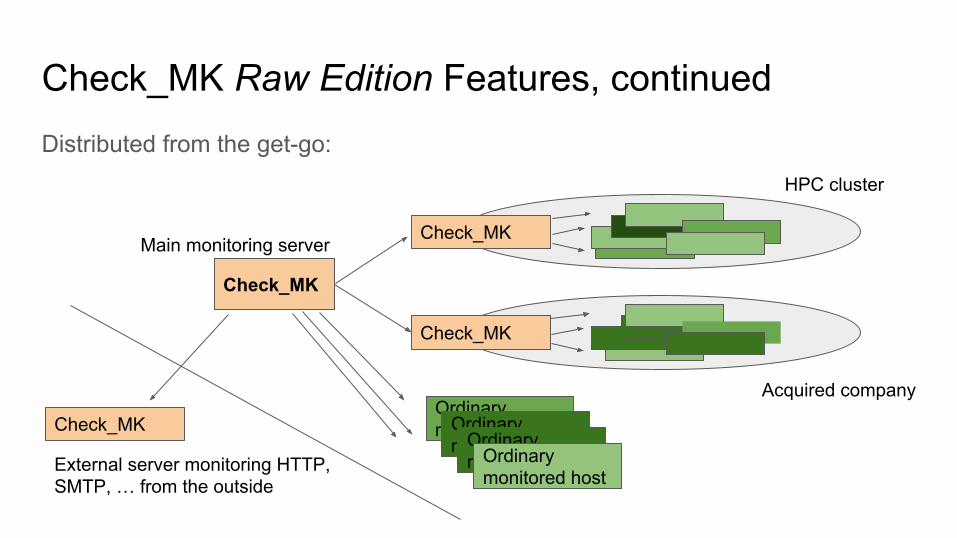
Check_MK Raw Edition Features, continuedDistributed from the get-go:
Check_MK
Check_MK
Check_MK
Ordinary monitored hostOrdinary
monitored hostOrdinary monitored hostOrdinary
monitored host
HPC cluster
Acquired company
Main monitoring server
Check_MK
External server monitoring HTTP, SMTP, … from the outside
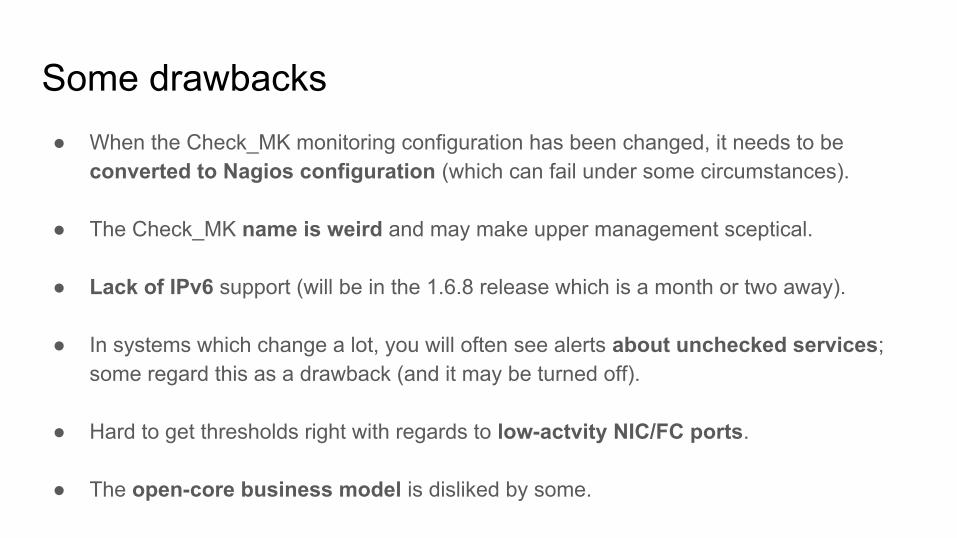
Some drawbacks● When the Check_MK monitoring configuration has been changed, it needs to be
converted to Nagios configuration (which can fail under some circumstances).
● The Check_MK name is weird and may make upper management sceptical.
● Lack of IPv6 support (will be in the 1.6.8 release which is a month or two away).
● In systems which change a lot, you will often see alerts about unchecked services; some regard this as a drawback (and it may be turned off).
● Hard to get thresholds right with regards to low-actvity NIC/FC ports.
● The open-core business model is disliked by some.
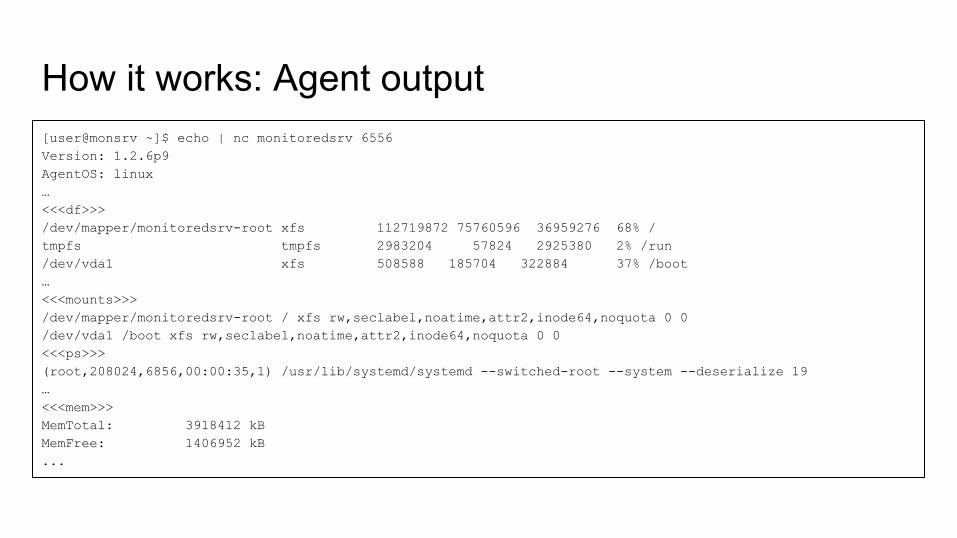
How it works: Agent output[user@monsrv ~]$ echo | nc monitoredsrv 6556Version: 1.2.6p9AgentOS: linux…<<<df>>>/dev/mapper/monitoredsrv-root xfs 112719872 75760596 36959276 68% /tmpfs tmpfs 2983204 57824 2925380 2% /run/dev/vda1 xfs 508588 185704 322884 37% /boot…<<<mounts>>>/dev/mapper/monitoredsrv-root / xfs rw,seclabel,noatime,attr2,inode64,noquota 0 0/dev/vda1 /boot xfs rw,seclabel,noatime,attr2,inode64,noquota 0 0<<<ps>>>(root,208024,6856,00:00:35,1) /usr/lib/systemd/systemd --switched-root --system --deserialize 19…<<<mem>>>MemTotal: 3918412 kBMemFree: 1406952 kB...
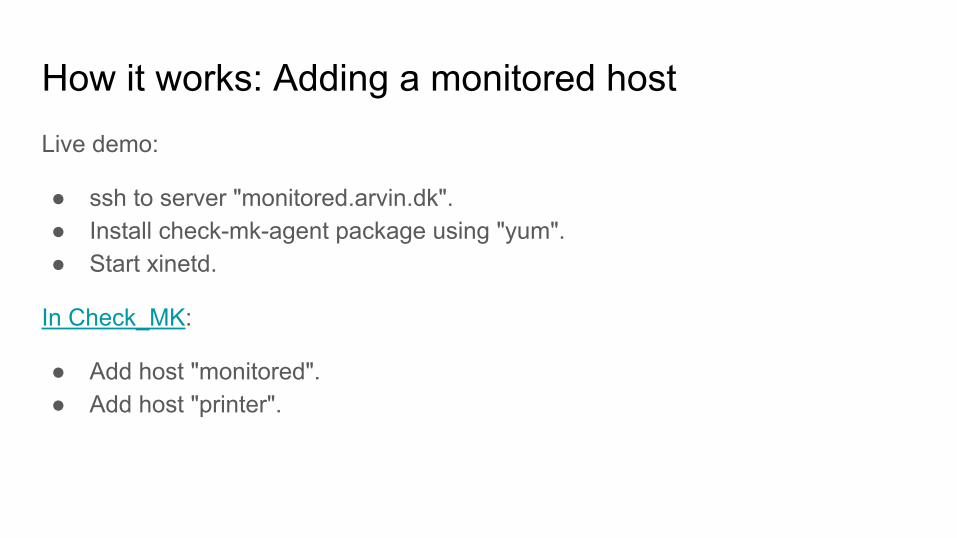
How it works: Adding a monitored hostLive demo:
● ssh to server "monitored.arvin.dk".● Install check-mk-agent package using "yum".● Start xinetd.
In Check_MK:
● Add host "monitored".● Add host "printer".

LinksThese slides: http://troels.arvin.dk/osd/2016/
Check_MK: http://mathias-kettner.com/check_mk.html
Questions?
Related Documents