THE CHANGING LANDSCAPE OF REWARDS, PERFORMANCE, AND TALENT September 23, 2014

Welcome message from author
This document is posted to help you gain knowledge. Please leave a comment to let me know what you think about it! Share it to your friends and learn new things together.
Transcript
THE CHANGING LANDSCAPE OF REWARDS, PERFORMANCE, AND TALENT
September 23, 2014
About Ward Group
• Ward Group is a consulting and analytical firm specializing in the insurance industry and the leading provider of industry benchmarking and best practices services. Our services include:
– Expense, staffing & performance analysis for all functions
– Compensation and pay practices surveys
– Executive compensation consulting
– Distribution management
• Annual evaluation of the financial performance of industry
Jeff Rieder, CPA, CPCUPartnerHead of Ward [email protected](513) 746-2400 (direct)
2 |
About The Jacobson Group
• The Jacobson Group is the leading global provider of insurance talent. For more than 40 years, we have been connecting organizations with insurance professionals through a variety of solutions including the following:
– Executive search
– Professional recruiting
– Emerging talent
– Recruitment process outsourcing
– Temporary staffing
– Subject matter experts
– Onsite and work-at-home operations support
Greg JacobsonCEOThe Jacobson [email protected](312) 884-0407 (direct)
3 |
Objectives
• Analyze current labor trends and future staffing expectations
• Provide an overview of compensation trends and performance
4 |
Key Industry Trends
5 |
Industry Challenges and Initiatives
6 |
CHALLENGES FACING THE INDUSTRY
– Keeping up with technology and managing the associated costs.
– Finding growth in “less hard” market
– Keeping pace with the evolution of data analysis and predictive analytics.
– Prospect of diminishing returns after strong 2013
– Personal Auto product and pricing strategy – Telematics/UBI.
TOP INITIATIVES
– Strategic planning around distribution strategy – evaluating alternate distributions, strengthening key agency relationships, and renewed focus on terminating unprofitable agencies.
– Enhancing the customer experience is a focus of carriers encompassing all touch points in the lifetime of the relationship.
– Core system replacement and legacy retirement.
– Predictive analytics projects continue in underwriting, but now span the rest of the company including claims, agency management, marketing, telematics, and premium audit.
– Aligning company structure to future strategy.
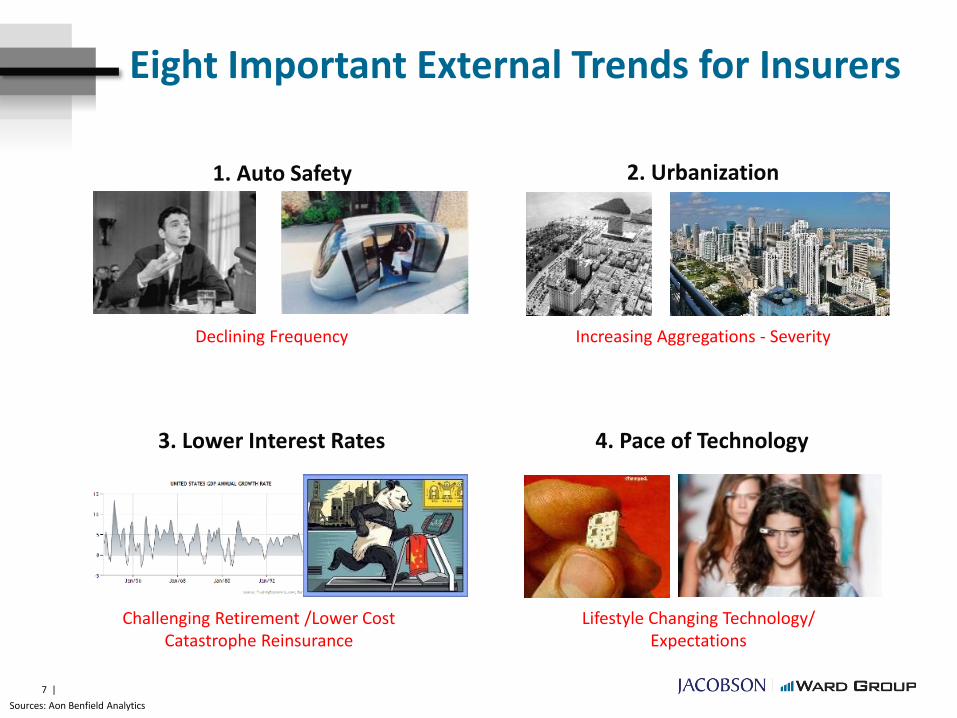
Eight Important External Trends for Insurers
1. Auto Safety
Declining Frequency
7 |
Sources: Aon Benfield Analytics
2. Urbanization
Increasing Aggregations - Severity
3. Lower Interest Rates
Challenging Retirement /Lower Cost Catastrophe Reinsurance
4. Pace of Technology
Lifestyle Changing Technology/Expectations
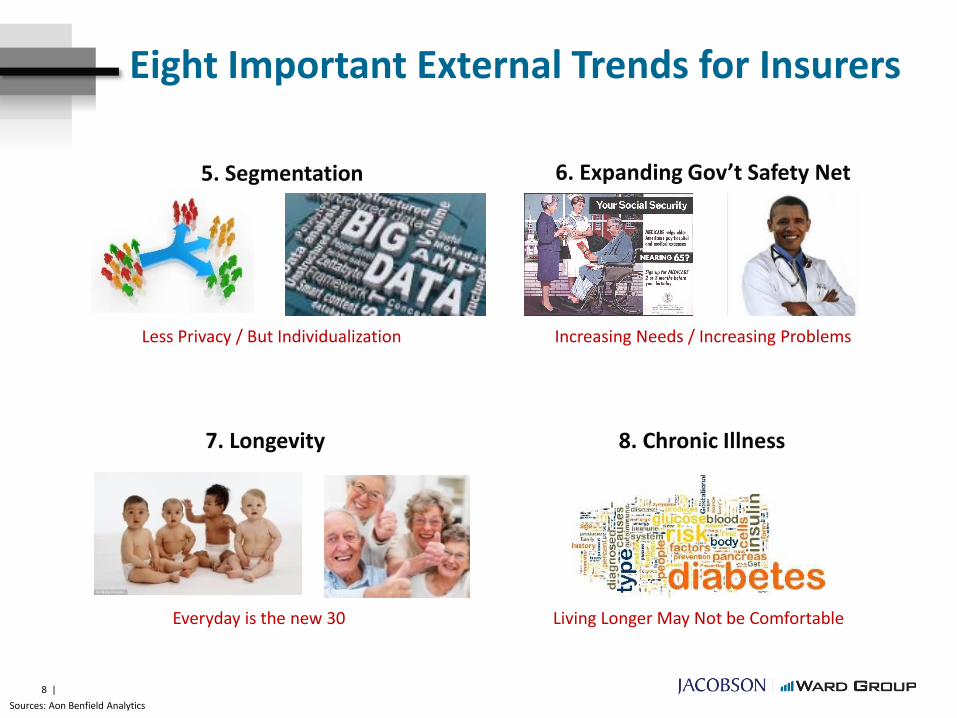
Eight Important External Trends for Insurers
5. Segmentation
Less Privacy / But Individualization
8 |
Sources: Aon Benfield Analytics
6. Expanding Gov’t Safety Net
Increasing Needs / Increasing Problems
7. Longevity
Everyday is the new 30
8. Chronic Illness
Living Longer May Not be Comfortable
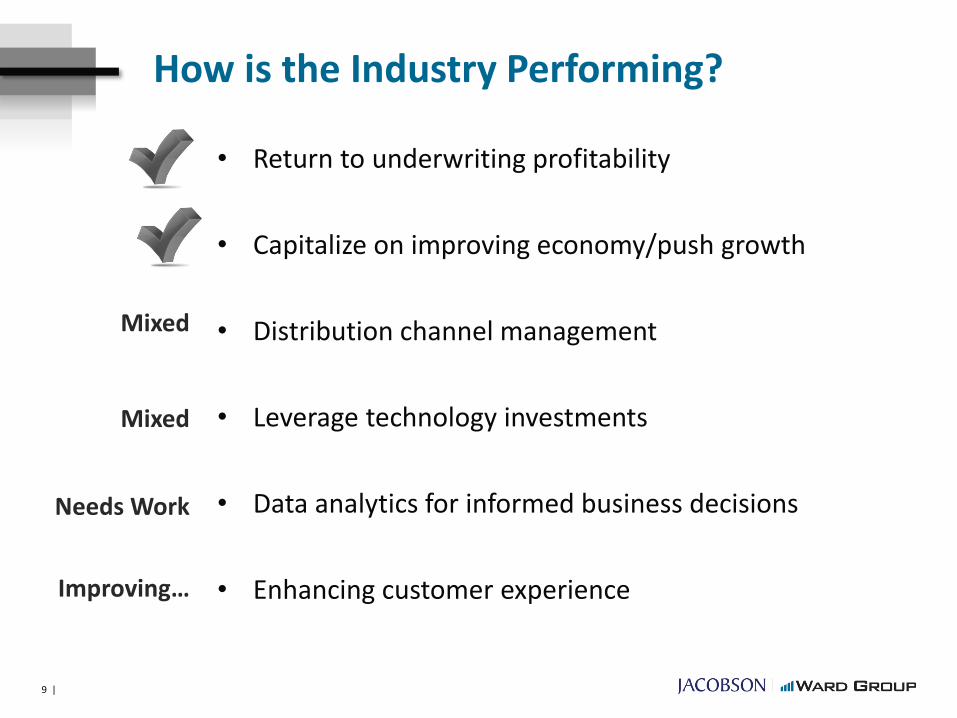
How is the Industry Performing?
Mixed
Needs Work
Improving…
• Return to underwriting profitability
• Capitalize on improving economy/push growth
• Distribution channel management
• Leverage technology investments
• Data analytics for informed business decisions
• Enhancing customer experience
9 |
Mixed
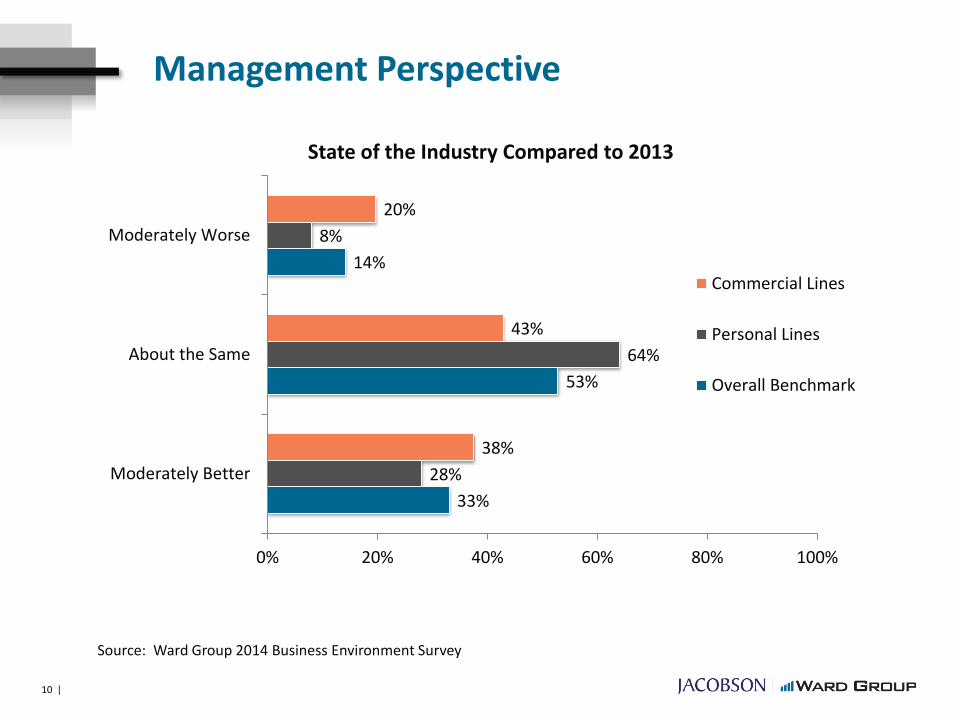
Management Perspective
10 |
33%
53%
14%
28%
64%
8%
38%
43%
20%
0% 20% 40% 60% 80% 100%
Moderately Better
About the Same
Moderately Worse
State of the Industry Compared to 2013
Commercial Lines
Personal Lines
Overall Benchmark
Source: Ward Group 2014 Business Environment Survey
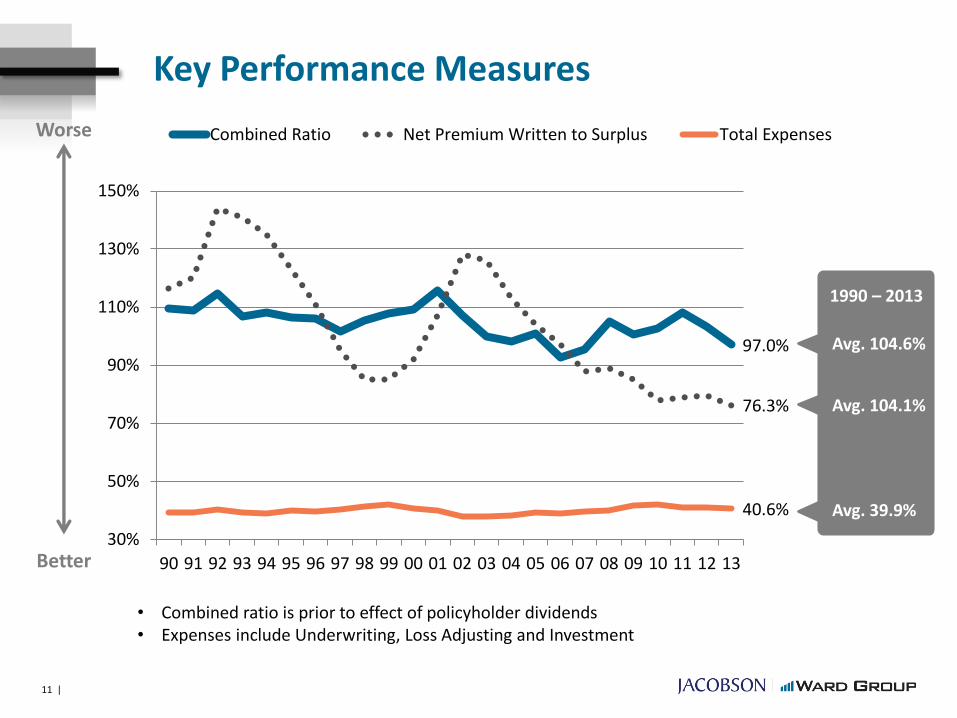
Key Performance Measures
11
97.0%
76.3%
40.6%
30%
50%
70%
90%
110%
130%
150%
90 91 92 93 94 95 96 97 98 99 00 01 02 03 04 05 06 07 08 09 10 11 12 13
Combined Ratio Net Premium Written to Surplus Total Expenses
• Combined ratio is prior to effect of policyholder dividends• Expenses include Underwriting, Loss Adjusting and Investment
Avg. 39.9%
Avg. 104.1%
1990 – 2013
Worse
Better
11 |
Avg. 104.6%
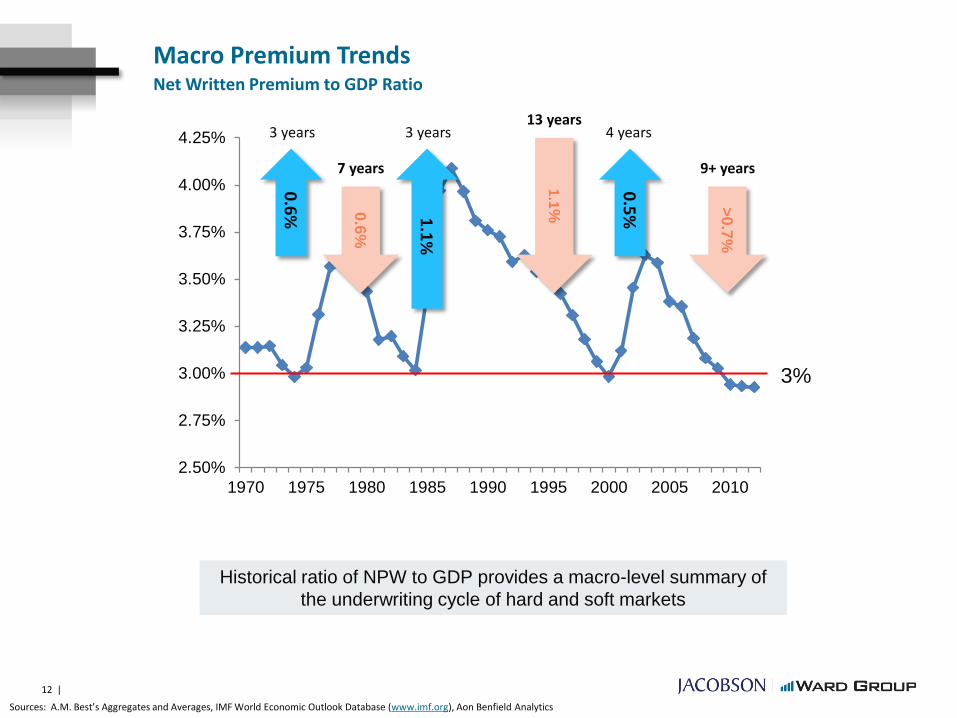
2.50%
2.75%
3.00%
3.25%
3.50%
3.75%
4.00%
4.25%
1970 1975 1980 1985 1990 1995 2000 2005 2010
Macro Premium TrendsNet Written Premium to GDP Ratio
Sources: A.M. Best’s Aggregates and Averages, IMF World Economic Outlook Database (www.imf.org), Aon Benfield Analytics
Historical ratio of NPW to GDP provides a macro-level summary of
the underwriting cycle of hard and soft markets
0.6
%
3 years
1.1
%
3 years
0.5
%
4 years
0.6
%
7 years
1.1
%
13 years
>0
.7%
9+ years
3%
12 |
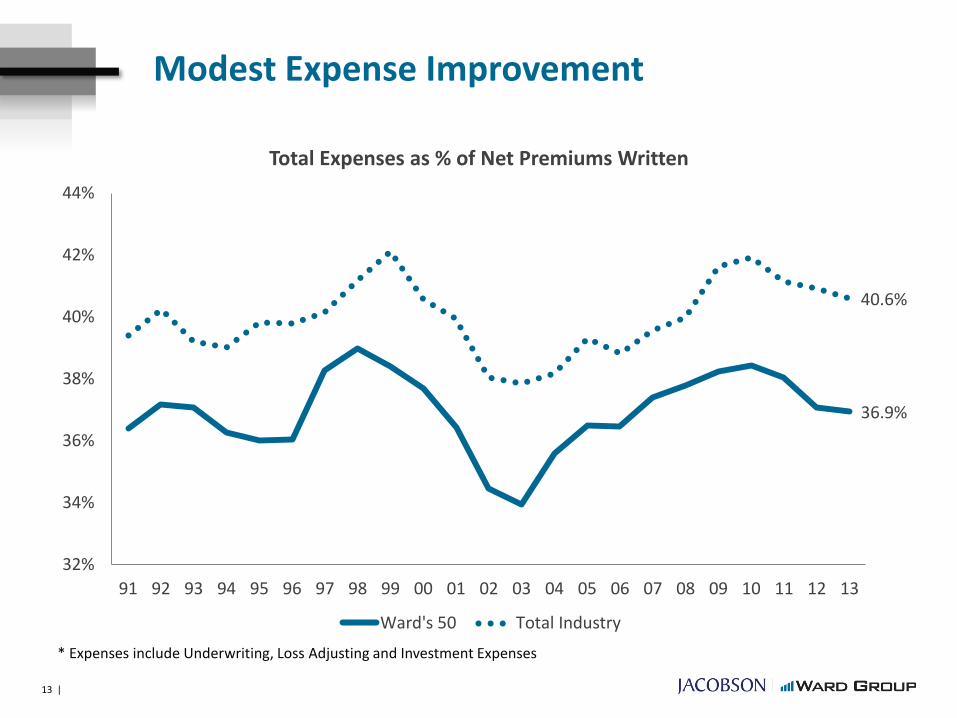
Modest Expense Improvement
13
* Expenses include Underwriting, Loss Adjusting and Investment Expenses
13 |
36.9%
40.6%
32%
34%
36%
38%
40%
42%
44%
91 92 93 94 95 96 97 98 99 00 01 02 03 04 05 06 07 08 09 10 11 12 13
Total Expenses as % of Net Premiums Written
Ward's 50 Total Industry
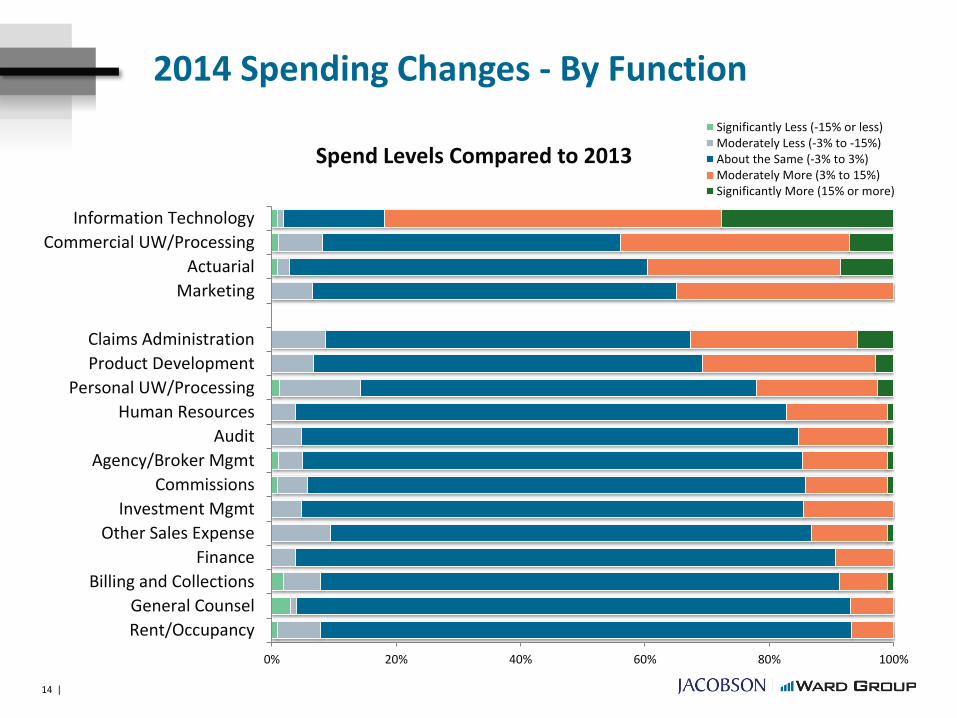
2014 Spending Changes - By Function
14 |
0% 20% 40% 60% 80% 100%
Rent/Occupancy
General Counsel
Billing and Collections
Finance
Other Sales Expense
Investment Mgmt
Commissions
Agency/Broker Mgmt
Audit
Human Resources
Personal UW/Processing
Product Development
Claims Administration
Marketing
Actuarial
Commercial UW/Processing
Information Technology
Spend Levels Compared to 2013
Significantly Less (-15% or less)Moderately Less (-3% to -15%)About the Same (-3% to 3%)Moderately More (3% to 15%)Significantly More (15% or more)

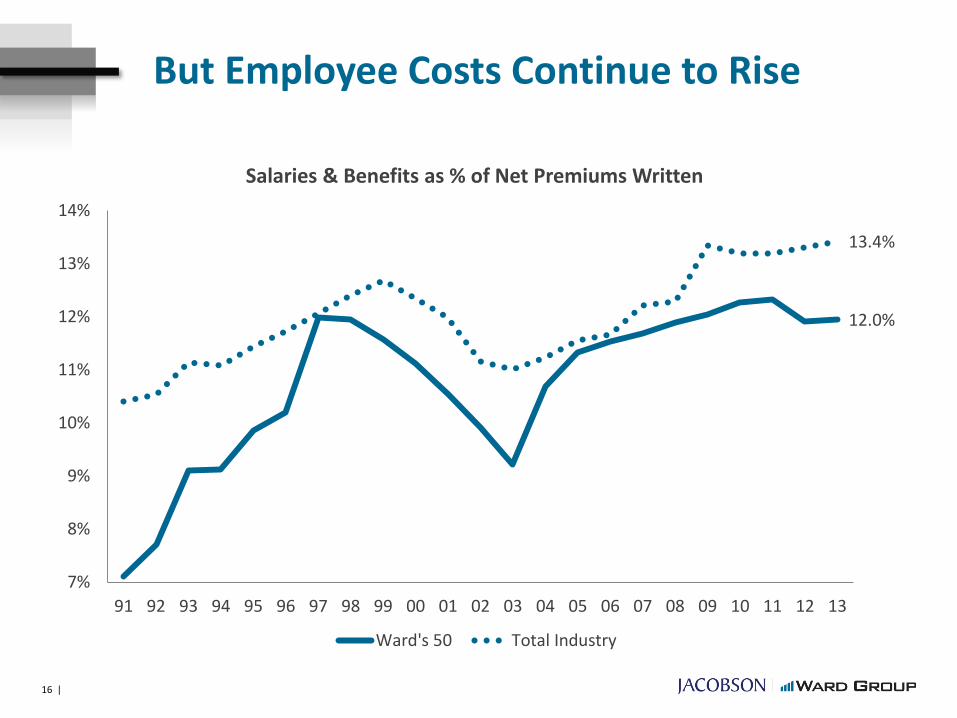
But Employee Costs Continue to Rise
1616 |
12.0%
13.4%
7%
8%
9%
10%
11%
12%
13%
14%
91 92 93 94 95 96 97 98 99 00 01 02 03 04 05 06 07 08 09 10 11 12 13
Salaries & Benefits as % of Net Premiums Written
Ward's 50 Total Industry
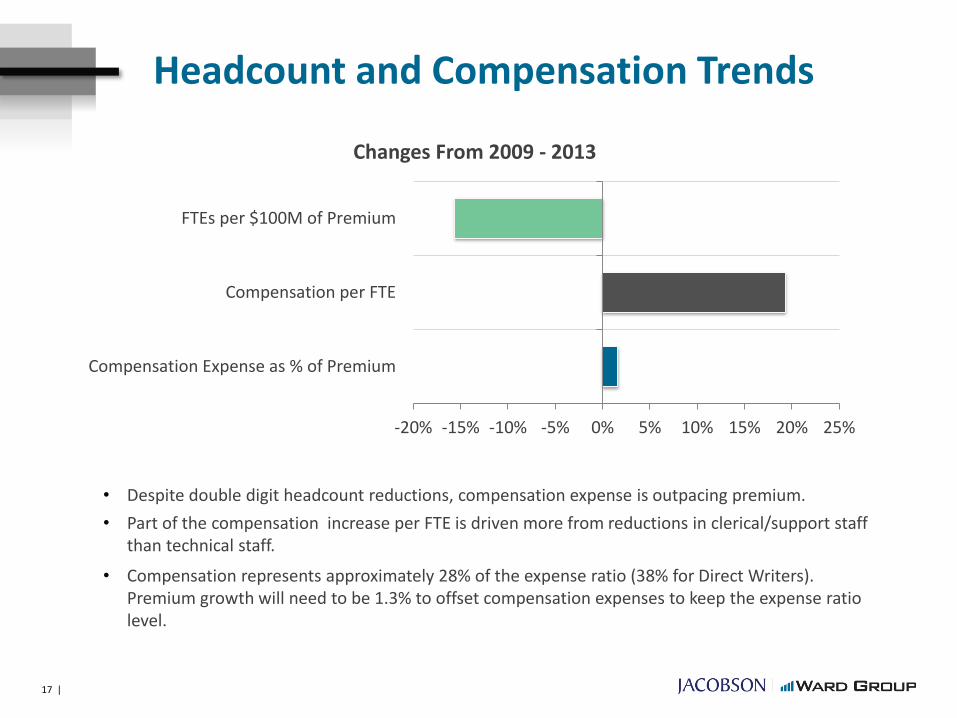
Headcount and Compensation Trends
-20% -15% -10% -5% 0% 5% 10% 15% 20% 25%
Compensation Expense as % of Premium
Compensation per FTE
FTEs per $100M of Premium
Changes From 2009 - 2013
• Despite double digit headcount reductions, compensation expense is outpacing premium.
• Part of the compensation increase per FTE is driven more from reductions in clerical/support staff than technical staff.
• Compensation represents approximately 28% of the expense ratio (38% for Direct Writers). Premium growth will need to be 1.3% to offset compensation expenses to keep the expense ratio level.
17 |
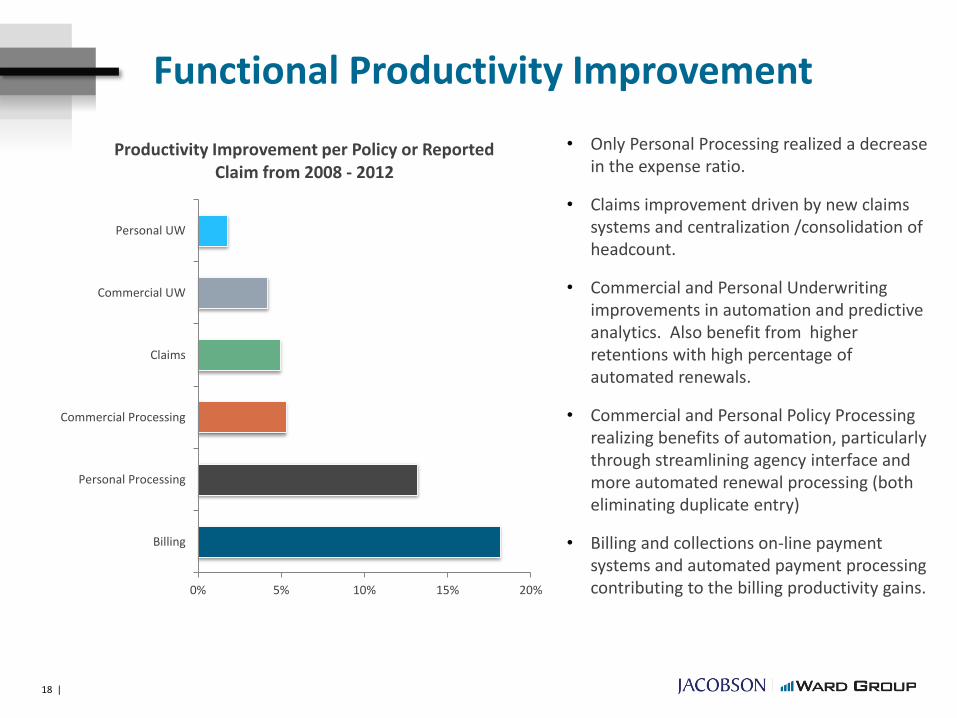
Functional Productivity Improvement
0% 5% 10% 15% 20%
Billing
Personal Processing
Commercial Processing
Claims
Commercial UW
Personal UW
Productivity Improvement per Policy or Reported Claim from 2008 - 2012
• Only Personal Processing realized a decrease in the expense ratio.
• Claims improvement driven by new claims systems and centralization /consolidation of headcount.
• Commercial and Personal Underwriting improvements in automation and predictive analytics. Also benefit from higher retentions with high percentage of automated renewals.
• Commercial and Personal Policy Processing realizing benefits of automation, particularly through streamlining agency interface and more automated renewal processing (both eliminating duplicate entry)
• Billing and collections on-line payment systems and automated payment processing contributing to the billing productivity gains.
18 |
Hiring and Employment Trends
19 |
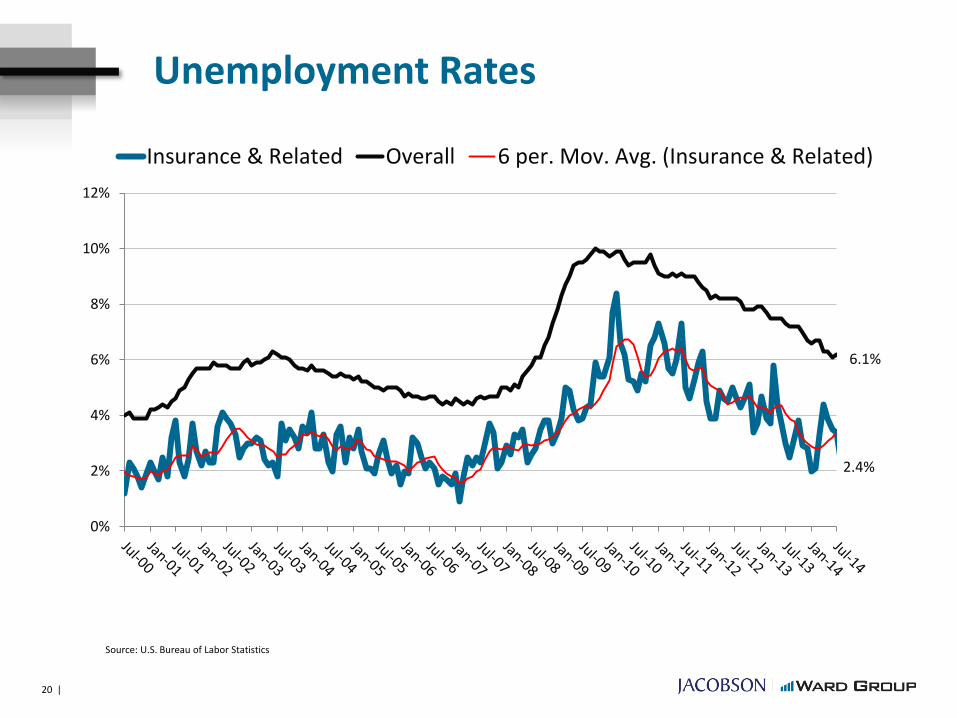
Unemployment Rates
Source: U.S. Bureau of Labor Statistics
2.4%
6.1%
0%
2%
4%
6%
8%
10%
12%
Insurance & Related Overall 6 per. Mov. Avg. (Insurance & Related)
20 |

Insurance Carrier Employment
1390.0
1400.0
1410.0
1420.0
1430.0
1440.0
1450.0
1460.0
1470.0
1480.0
1490.0
In T
ho
usa
nd
s
3.61%
51,300 new jobs since April 2011
21 |
Source: U.S. Bureau of Labor Statistics
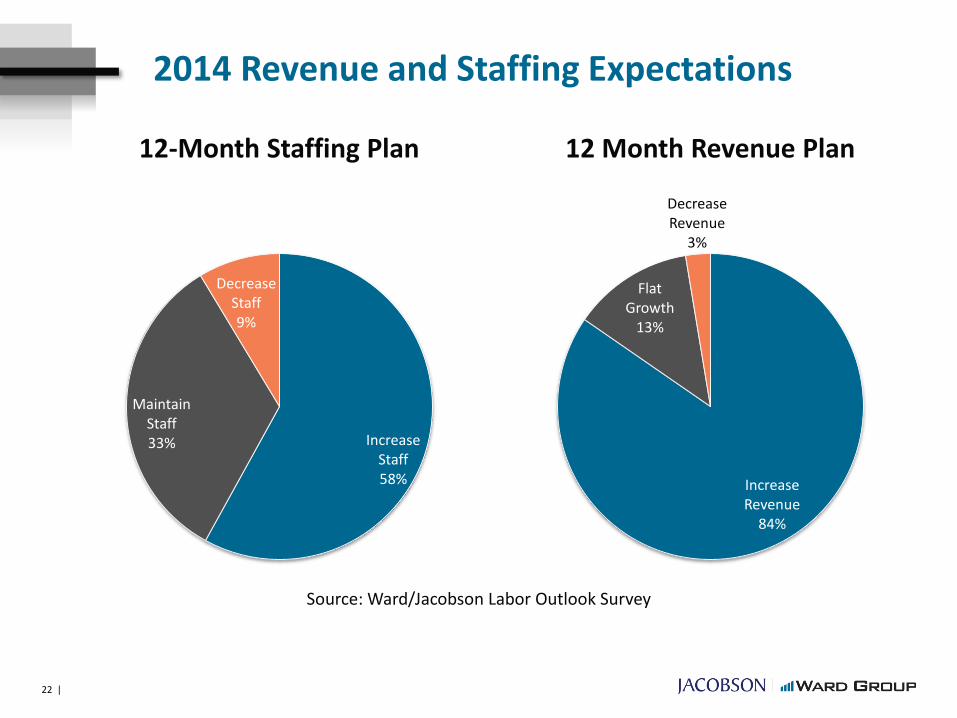
2014 Revenue and Staffing Expectations
Source: Ward/Jacobson Labor Outlook Survey
Increase Revenue
84%
Flat Growth
13%
Decrease Revenue
3%
12 Month Revenue Plan
Increase Staff58%
Maintain Staff33%
Decrease Staff9%
12-Month Staffing Plan
22 |
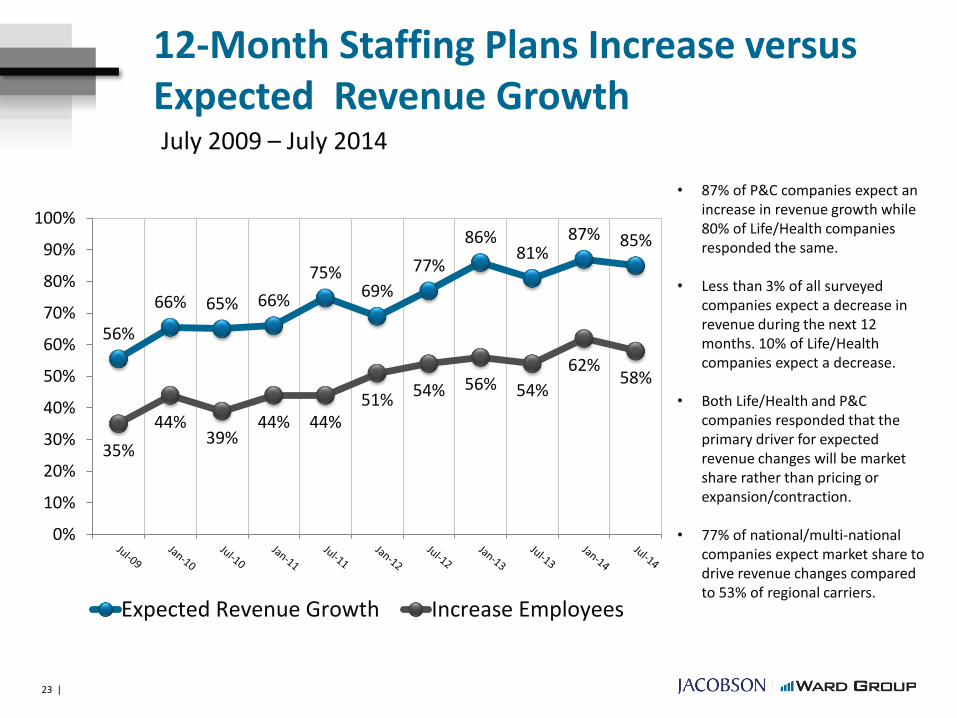
12-Month Staffing Plans Increase versus Expected Revenue Growth
56%
66% 65% 66%
75%69%
77%
86%81%
87% 85%
35%
44%39%
44% 44%51%
54% 56% 54%
62%58%
0%
10%
20%
30%
40%
50%
60%
70%
80%
90%
100%
Expected Revenue Growth Increase Employees
July 2009 – July 2014
• 87% of P&C companies expect an increase in revenue growth while 80% of Life/Health companies responded the same.
• Less than 3% of all surveyed companies expect a decrease in revenue during the next 12 months. 10% of Life/Health companies expect a decrease.
• Both Life/Health and P&C companies responded that the primary driver for expected revenue changes will be market share rather than pricing or expansion/contraction.
• 77% of national/multi-national companies expect market share to drive revenue changes compared to 53% of regional carriers.
23 |
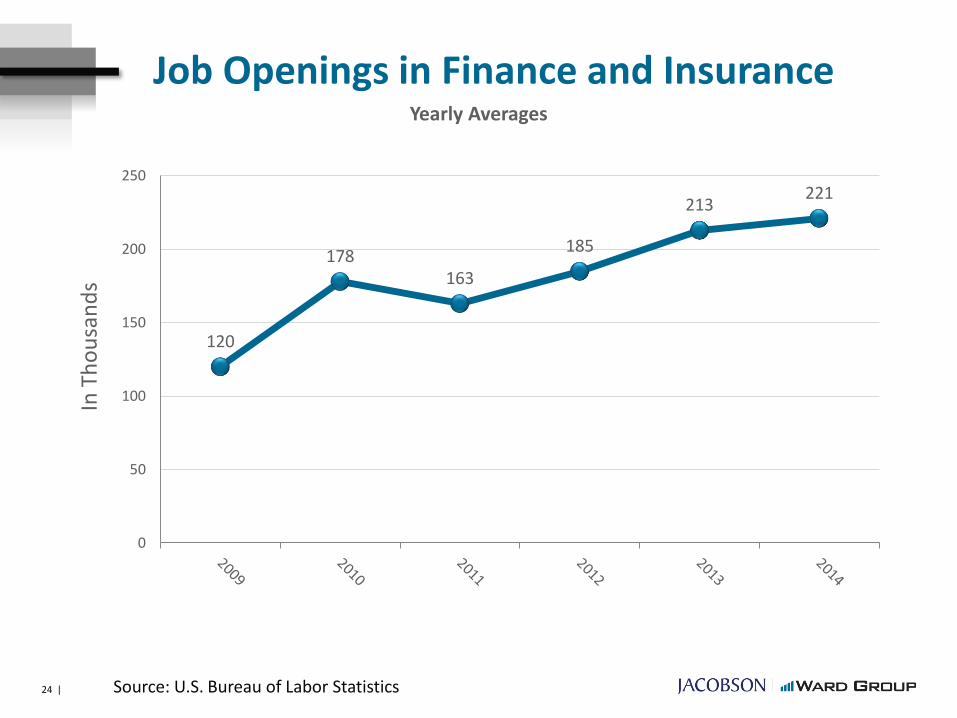
Job Openings in Finance and Insurance
120
178163
185
213221
0
50
100
150
200
250
In T
ho
usa
nd
s
Source: U.S. Bureau of Labor Statistics24 |
Yearly Averages

12-Month Staffing Plans
67%
31%
2%
50%
44%
6%
48%
30%
22%
0%
10%
20%
30%
40%
50%
60%
70%
80%
Increase FTE Maintain current size Decrease FTE
Small (Under 300) Medium (300-1000) Large (Over 1000)
By Employee Size
• 54% of small companies are expecting growth in revenue/premium at greater than 10%. This compares to 23% for large companies and 27% for medium-sized companies.
• 79% of large companies responded that revenue growth will be driven by market share compared to 62% of small and 47% of medium-sized companies.
25 |
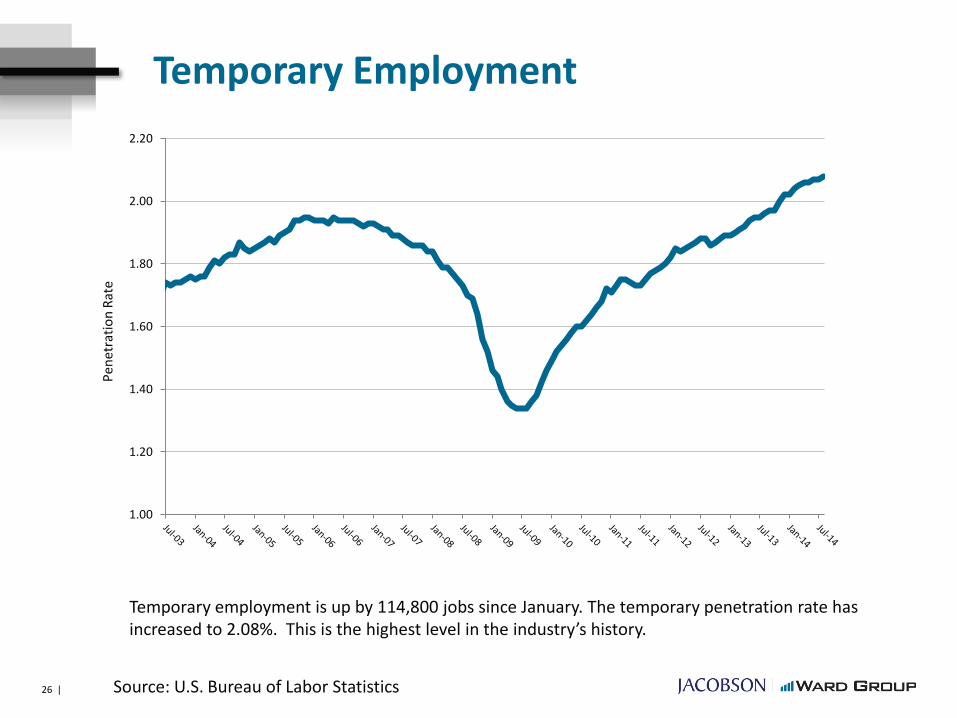
Temporary Employment
Source: U.S. Bureau of Labor Statistics
Temporary employment is up by 114,800 jobs since January. The temporary penetration rate has increased to 2.08%. This is the highest level in the industry’s history.
1.00
1.20
1.40
1.60
1.80
2.00
2.20
Pen
etra
tio
n R
ate
26 |

Temporary Employees
Increase8%
Maintain77%
Decrease15%
Use of Temporary Employees During Next 12 Months
27 |
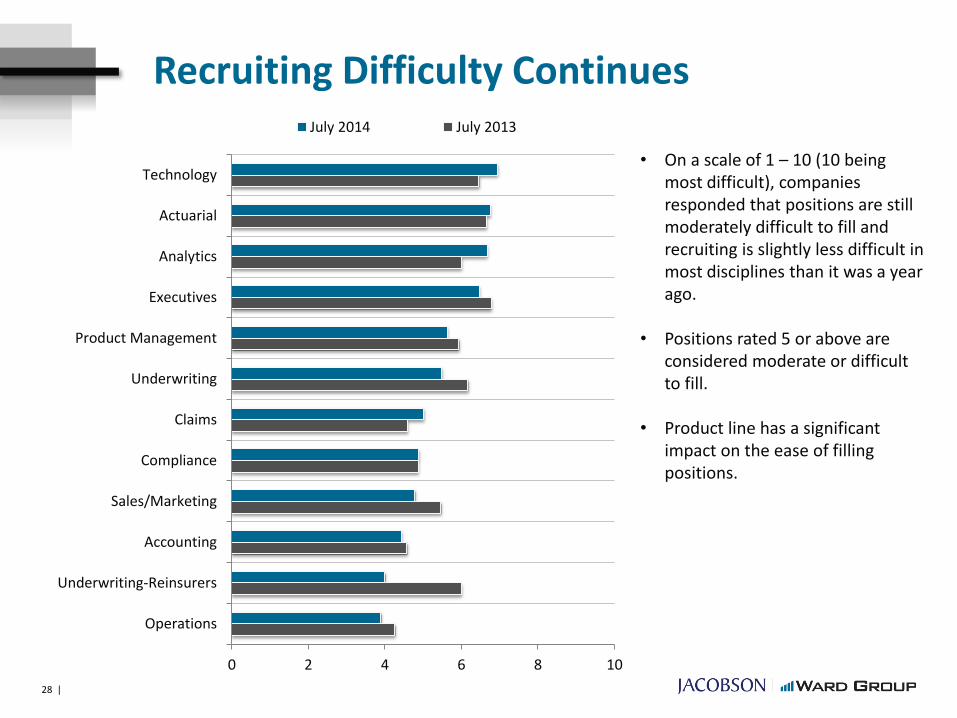
Recruiting Difficulty Continues
• On a scale of 1 – 10 (10 being most difficult), companies responded that positions are still moderately difficult to fill and recruiting is slightly less difficult in most disciplines than it was a year ago.
• Positions rated 5 or above are considered moderate or difficult to fill.
• Product line has a significant impact on the ease of filling positions.
0 2 4 6 8 10
Operations
Underwriting-Reinsurers
Accounting
Sales/Marketing
Compliance
Claims
Underwriting
Product Management
Executives
Analytics
Actuarial
Technology
July 2014 July 2013
28 |

-
1.0
2.0
3.0
4.0
5.0
6.0
7.0
P&C Balanced P&C Commercial P&C Personal
Most in Demand
Least in Demand
Least Likely
Likelihood of Increasing Staff By Function
Most Likely
• After Technology, large companies are most likely to increase staff in Analytics, medium-sized companies in Claims and small companies look to Underwriting.
• Commercial lines companies have a higher need for Underwriters in the next 12 months compared to personal lines companies.
• Life/Health companies have the greatest need in the Technology function followed by Sales/Marketing.
• Technology has had the greatest likelihood to increase staff in 10 of the past 11 surveys for P&C companies.
29 |
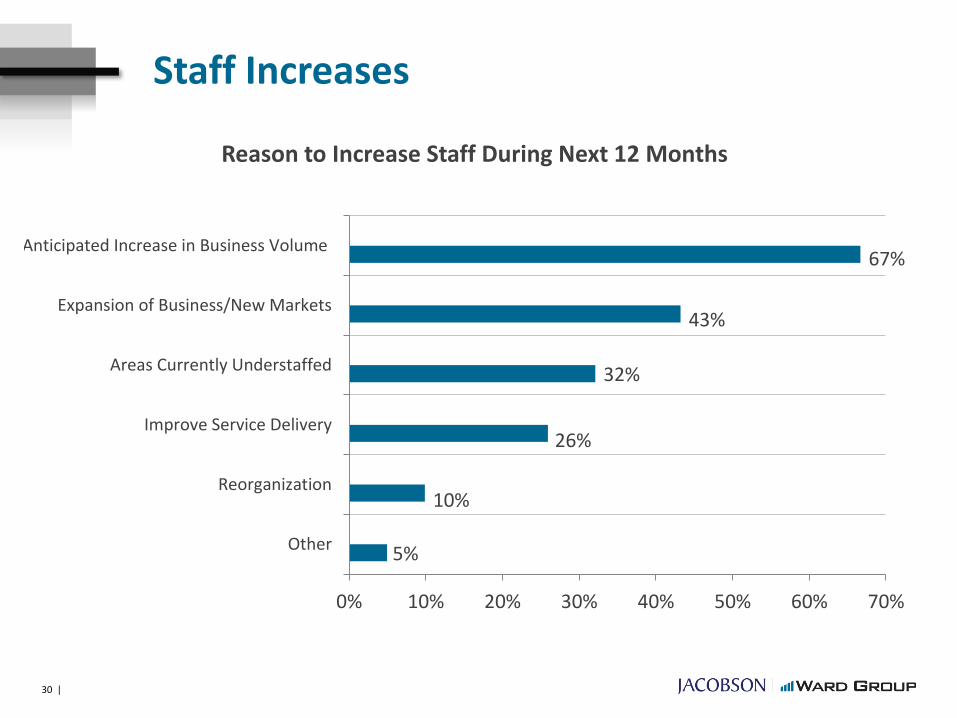
5%
10%
26%
32%
43%
67%
0% 10% 20% 30% 40% 50% 60% 70%
Other
Reorganization
Improve Service Delivery
Areas Currently Understaffed
Expansion of Business/New Markets
Anticipated Increase in Business Volume
Reason to Increase Staff During Next 12 Months
Staff Increases
30 |
Compensation Survey Key Findings
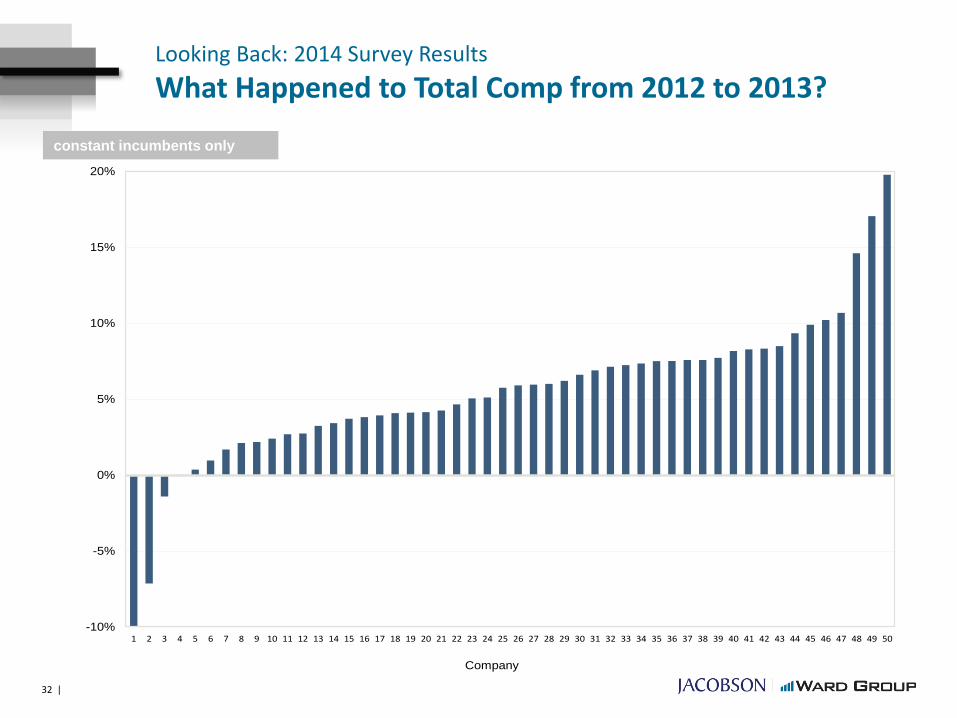
Looking Back: 2014 Survey Results
What Happened to Total Comp from 2012 to 2013?
-10%
-5%
0%
5%
10%
15%
20%
1 2 3 4 5 6 7 8 9 10 11 12 13 14 15 16 17 18 19 20 21 22 23 24 25 26 27 28 29 30 31 32 33 34 35 36 37 38 39 40 41 42 43 44 45 46 47 48 49 50
Company
constant incumbents only
32 |
Looking Back: 2014 Survey Results
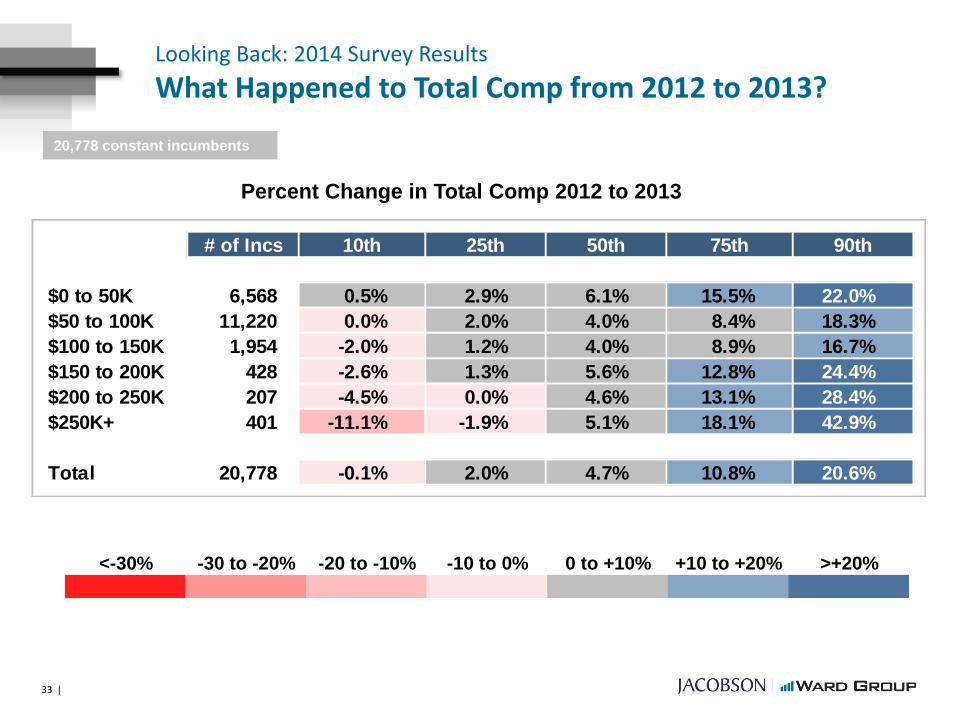
What Happened to Total Comp from 2012 to 2013?
<-30% -30 to -20% -20 to -10% -10 to 0% 0 to +10% +10 to +20% >+20%
LEGEND:
Percent Change in Total Comp 2012 to 2013
20,778 constant incumbents
# of Incs 10th 25th 50th 75th 90th
$0 to 50K 6,568 0.5% 2.9% 6.1% 15.5% 22.0%
$50 to 100K 11,220 0.0% 2.0% 4.0% 8.4% 18.3%
$100 to 150K 1,954 -2.0% 1.2% 4.0% 8.9% 16.7%
$150 to 200K 428 -2.6% 1.3% 5.6% 12.8% 24.4%
$200 to 250K 207 -4.5% 0.0% 4.6% 13.1% 28.4%
$250K+ 401 -11.1% -1.9% 5.1% 18.1% 42.9%
Total 20,778 -0.1% 2.0% 4.7% 10.8% 20.6%
33 |
Looking Back: 2014 Survey Results
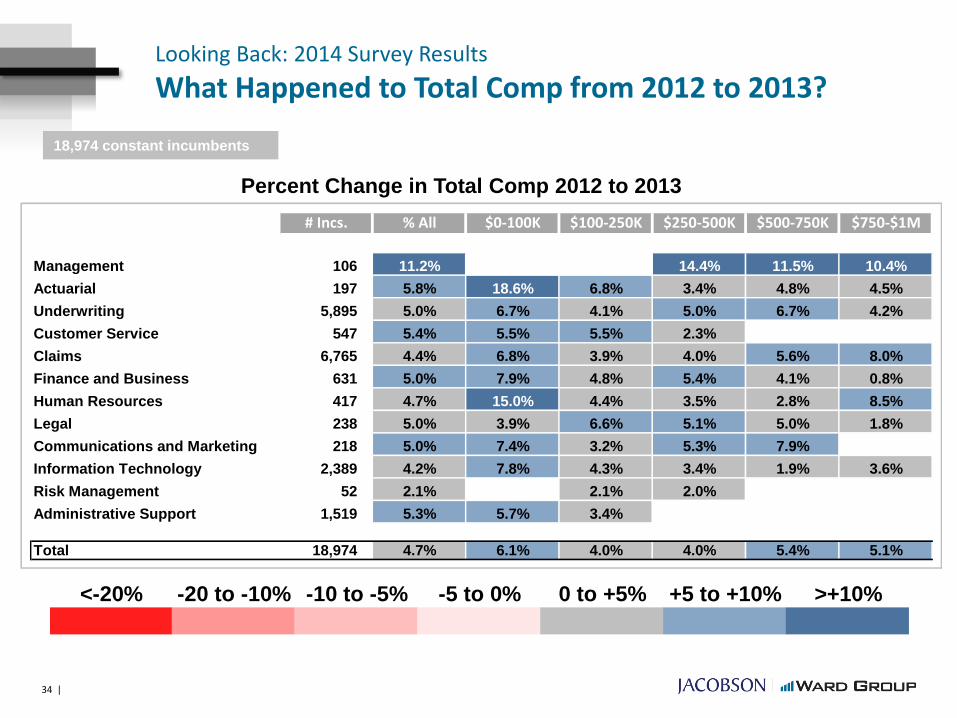
What Happened to Total Comp from 2012 to 2013?
Percent Change in Total Comp 2012 to 2013
18,974 constant incumbents
<-20% -20 to -10% -10 to -5% -5 to 0% 0 to +5% +5 to +10% >+10%
# Incs. % All $0-100K $100-250K $250-500K $500-750K $750-$1M
Management 106 11.2% 14.4% 11.5% 10.4%
Actuarial 197 5.8% 18.6% 6.8% 3.4% 4.8% 4.5%
Underwriting 5,895 5.0% 6.7% 4.1% 5.0% 6.7% 4.2%
Customer Service 547 5.4% 5.5% 5.5% 2.3%
Claims 6,765 4.4% 6.8% 3.9% 4.0% 5.6% 8.0%
Finance and Business 631 5.0% 7.9% 4.8% 5.4% 4.1% 0.8%
Human Resources 417 4.7% 15.0% 4.4% 3.5% 2.8% 8.5%
Legal 238 5.0% 3.9% 6.6% 5.1% 5.0% 1.8%
Communications and Marketing 218 5.0% 7.4% 3.2% 5.3% 7.9%
Information Technology 2,389 4.2% 7.8% 4.3% 3.4% 1.9% 3.6%
Risk Management 52 2.1% 2.1% 2.0%
Administrative Support 1,519 5.3% 5.7% 3.4%
Total 18,974 4.7% 6.1% 4.0% 4.0% 5.4% 5.1%
34 |
$0
$20
$40
$60
$80
$100
$120
LT/Deferred Awards
Cash Bonus
Salary
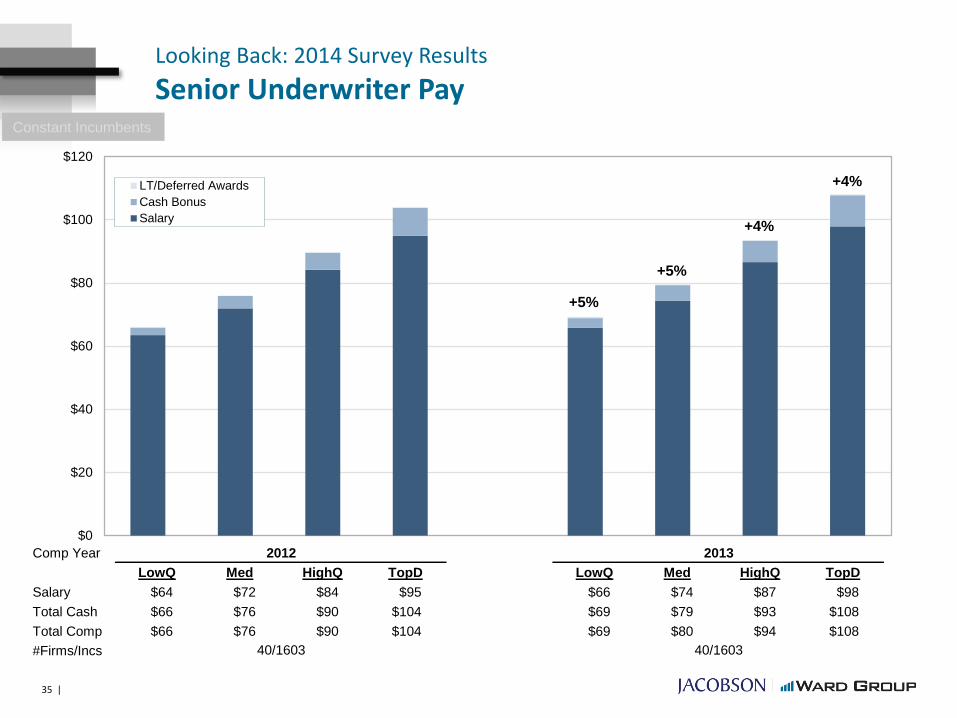
Looking Back: 2014 Survey Results
Senior Underwriter PayConstant Incumbents
+5%
+5%
+4%
+4%
Comp Year
LowQ Med HighQ TopD LowQ Med HighQ TopD
Salary $64 $72 $84 $95 $66 $74 $87 $98
Total Cash $66 $76 $90 $104 $69 $79 $93 $108
Total Comp $66 $76 $90 $104 $69 $80 $94 $108
#Firms/Incs
2012 2013
40/1603 40/1603
35 |
$0
$20
$40
$60
$80
$100
$120
LT/Deferred Awards
Cash Bonus
Salary
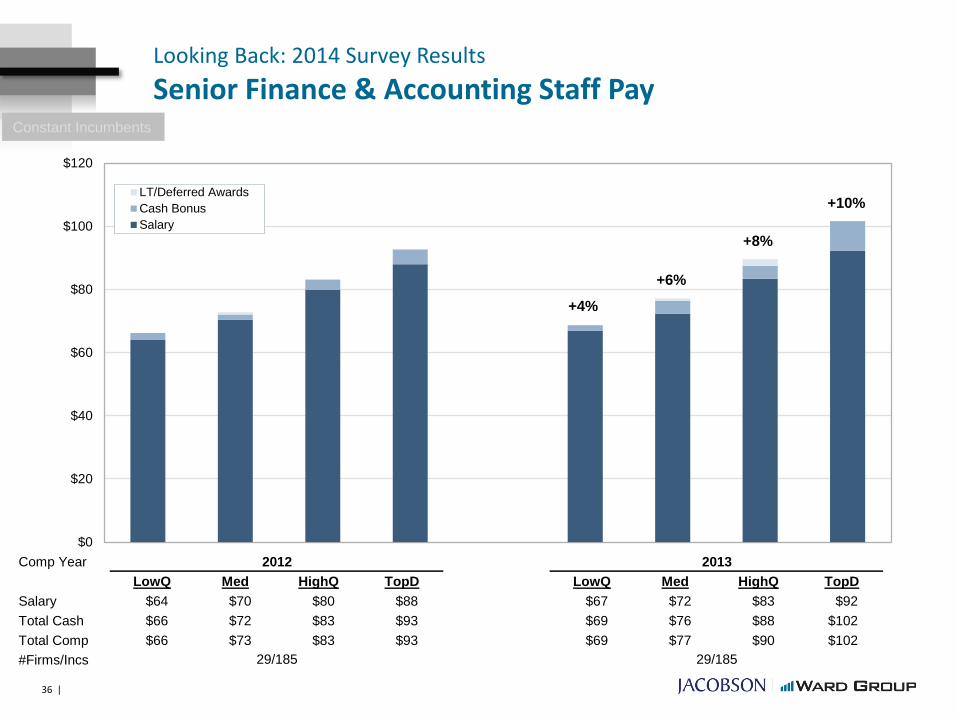
Looking Back: 2014 Survey Results
Senior Finance & Accounting Staff PayConstant Incumbents
+4%
+6%
+8%
+10%
Comp Year
LowQ Med HighQ TopD LowQ Med HighQ TopD
Salary $64 $70 $80 $88 $67 $72 $83 $92
Total Cash $66 $72 $83 $93 $69 $76 $88 $102
Total Comp $66 $73 $83 $93 $69 $77 $90 $102
#Firms/Incs
2012 2013
29/185 29/185
36 |
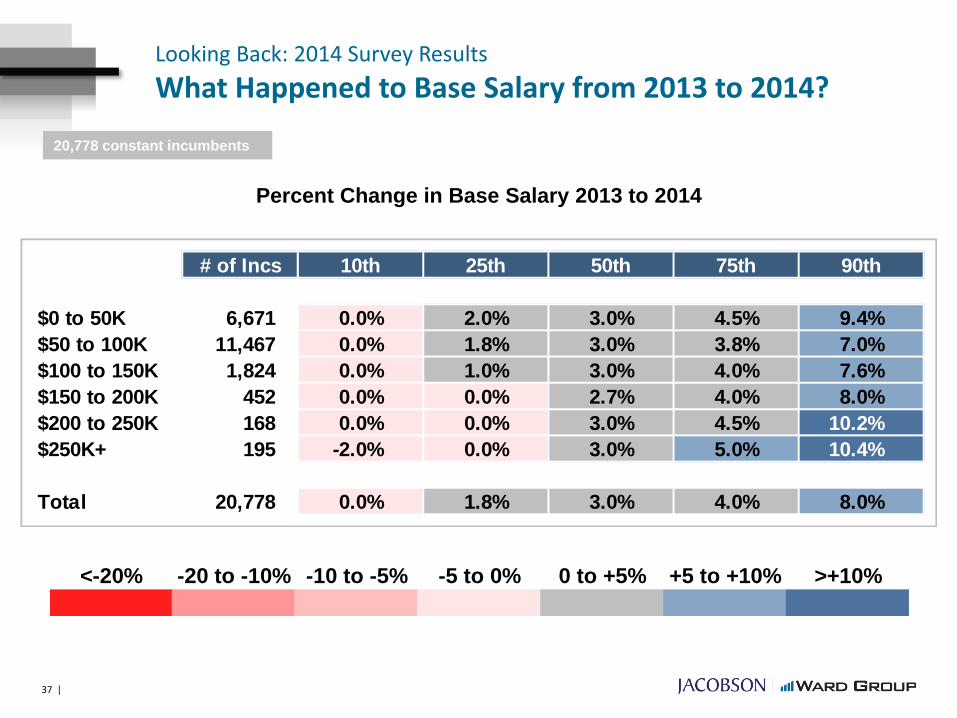
20,778 constant incumbents
Looking Back: 2014 Survey Results
What Happened to Base Salary from 2013 to 2014?
Percent Change in Base Salary 2013 to 2014
<-20% -20 to -10% -10 to -5% -5 to 0% 0 to +5% +5 to +10% >+10%
# of Incs 10th 25th 50th 75th 90th
$0 to 50K 6,671 0.0% 2.0% 3.0% 4.5% 9.4%
$50 to 100K 11,467 0.0% 1.8% 3.0% 3.8% 7.0%
$100 to 150K 1,824 0.0% 1.0% 3.0% 4.0% 7.6%
$150 to 200K 452 0.0% 0.0% 2.7% 4.0% 8.0%
$200 to 250K 168 0.0% 0.0% 3.0% 4.5% 10.2%
$250K+ 195 -2.0% 0.0% 3.0% 5.0% 10.4%
Total 20,778 0.0% 1.8% 3.0% 4.0% 8.0%
37 |

Base Salary Increases
-1%
0%
1%
2%
3%
4%
5%
6%
7%
8%
9%
Average Base Salary Increase
38 |
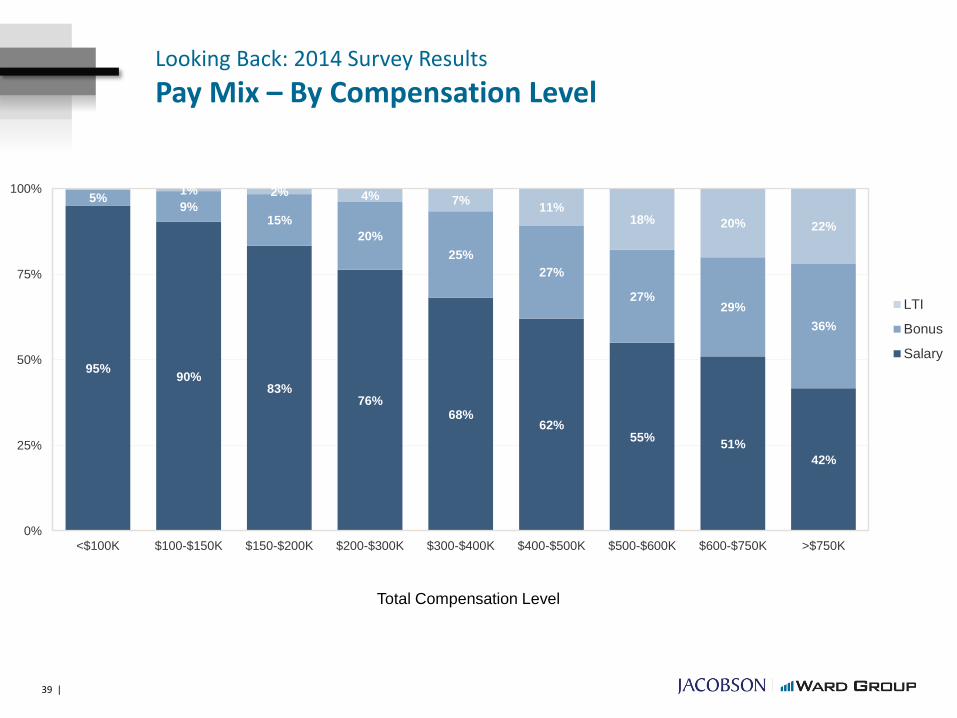
Total Compensation Level
Looking Back: 2014 Survey Results
Pay Mix – By Compensation Level
95%90%
83%76%
68%62%
55%51%
42%
5%9%
15%
20%
25%
27%
27%29%
36%
1% 2% 4% 7%11%
18% 20% 22%
0%
25%
50%
75%
100%
<$100K $100-$150K $150-$200K $200-$300K $300-$400K $400-$500K $500-$600K $600-$750K >$750K
LTI
Bonus
Salary
39 |
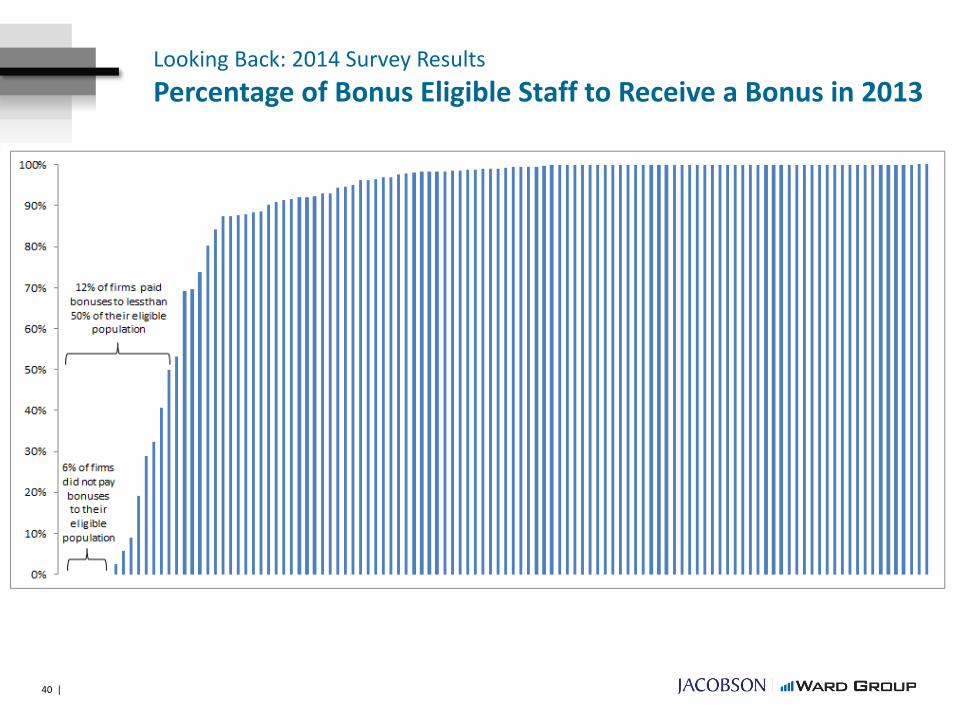
Looking Back: 2014 Survey Results
Percentage of Bonus Eligible Staff to Receive a Bonus in 2013
40 |
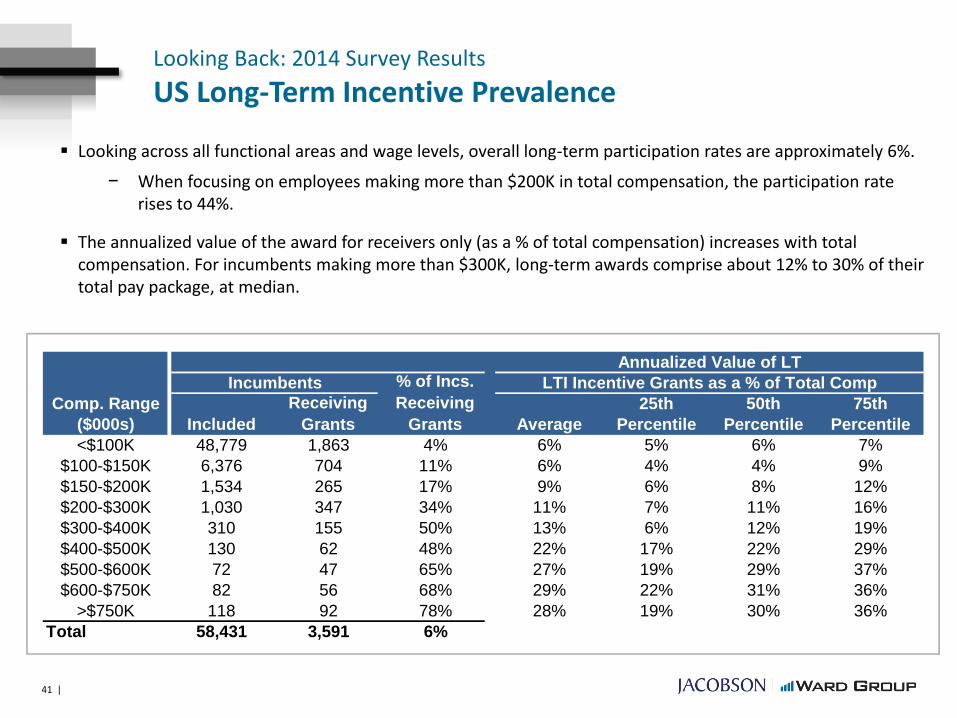
Looking Back: 2014 Survey Results
US Long-Term Incentive Prevalence
Looking across all functional areas and wage levels, overall long-term participation rates are approximately 6%.
− When focusing on employees making more than $200K in total compensation, the participation rate rises to 44%.
The annualized value of the award for receivers only (as a % of total compensation) increases with total compensation. For incumbents making more than $300K, long-term awards comprise about 12% to 30% of their total pay package, at median.
25th 50th 75th
($000s) Average Percentile Percentile Percentile
<$100K 48,779 1,863 4% 6% 5% 6% 7%
$100-$150K 6,376 704 11% 6% 4% 4% 9%
$150-$200K 1,534 265 17% 9% 6% 8% 12%
$200-$300K 1,030 347 34% 11% 7% 11% 16%
$300-$400K 310 155 50% 13% 6% 12% 19%
$400-$500K 130 62 48% 22% 17% 22% 29%
$500-$600K 72 47 65% 27% 19% 29% 37%
$600-$750K 82 56 68% 29% 22% 31% 36%
>$750K 118 92 78% 28% 19% 30% 36%
Total 58,431 3,591 6%
Comp. Range
Annualized Value of LT
Incumbents % of Incs.
Receiving
Grants
LTI Incentive Grants as a % of Total Comp
Included
Receiving
Grants
41 |
Long-Term Incentive
0%
1%
2%
3%
4%
5%
6%
7%
8%
9%
1 4 7
10
13
16
19
22
25
28
31
34
37
40
43
46
49
52
55
58
61
64
67
70
73
76
79
82
85
88
91
94
97
10
0
10
3
10
6
10
9
11
2
11
5
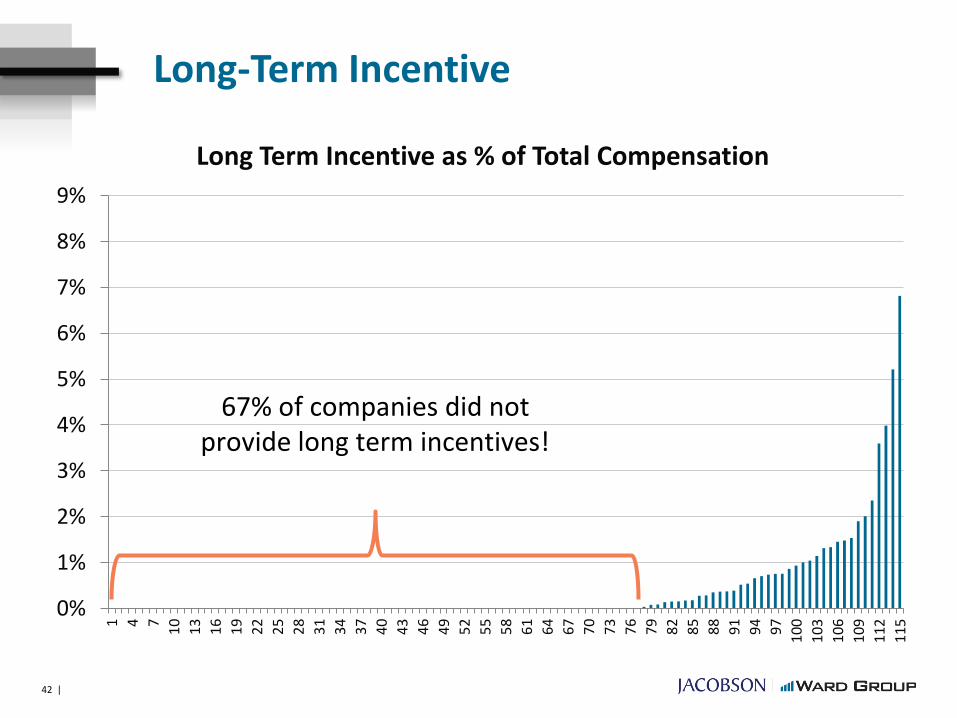
Long Term Incentive as % of Total Compensation
67% of companies did not provide long term incentives!
42 |
Long-Term Incentive
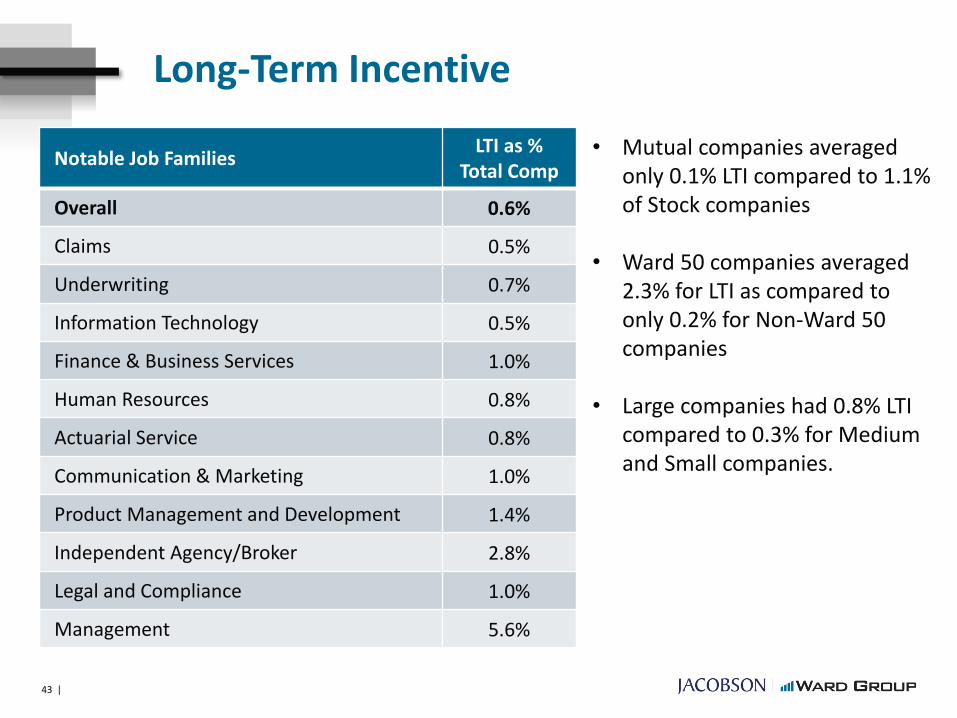
Notable Job FamiliesLTI as %
Total Comp
Overall 0.6%
Claims 0.5%
Underwriting 0.7%
Information Technology 0.5%
Finance & Business Services 1.0%
Human Resources 0.8%
Actuarial Service 0.8%
Communication & Marketing 1.0%
Product Management and Development 1.4%
Independent Agency/Broker 2.8%
Legal and Compliance 1.0%
Management 5.6%
• Mutual companies averaged only 0.1% LTI compared to 1.1% of Stock companies
• Ward 50 companies averaged 2.3% for LTI as compared to only 0.2% for Non-Ward 50 companies
• Large companies had 0.8% LTI compared to 0.3% for Medium and Small companies.
43 |
How well is pay linked with performance?
Survey Background
To further evaluate the link between performance and rewards, we evaluated the operating performance of 115 of the 132 participants that filed NAIC annual statements.
• We compared participants compensation results against public data along following key metrics:
• Return on Equity
• Return on Revenue
• Combined Ratio
• Expense Ratio
• Surplus Growth
• In addition, separate analysis was done for 30 companies in the Ward Expense Benchmarking Program to evaluate additional employee performance metrics.
45 |

Profile of Deep Dive Participants
564
1,042
504 411
863
41
332
2,105
Overall Ward 50 NonWard 50
Mutual Stock Small Medium Large
Average Net Premiums Written (millions)
100.6%
93.2%
101.5%
101.0%
99.7%
100.3%
102.0%
96.3%
Overall
Ward 50
Non Ward 50
Mutual
Stock
Small
Medium
Large
Combined Ratio
45.1%
41.7%
45.5%
44.4%
46.4%
53.5%
42.6%
40.4%
Overall
Ward 50
Non Ward 50
Mutual
Stock
Small
Medium
Large
Expense Ratio
14.9%
11.8%
15.3%
14.5%
15.9%
16.5%
14.7%
13.2%
Overall
Ward 50
Non Ward 50
Mutual
Stock
Small
Medium
Large
Salary and Benefits Expense
Mutual66%
Stock34%
Large17%
Medium56%
Small27%
# cos 115 13 102 76 39 30 65 20
46 |
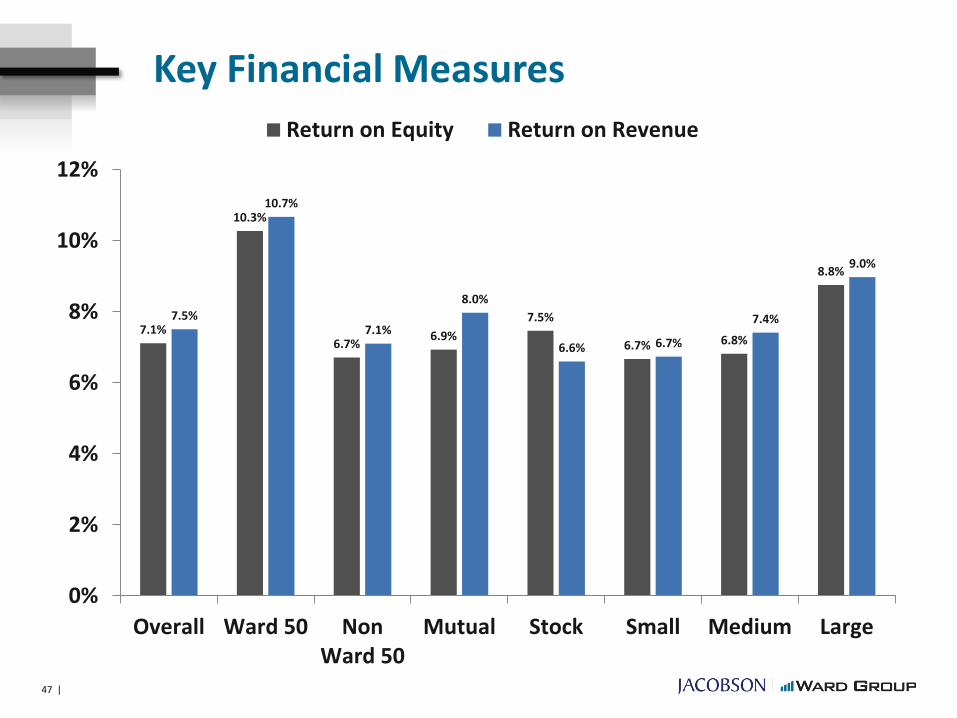
Key Financial Measures
7.1%
10.3%
6.7%6.9%
7.5%
6.7% 6.8%
8.8%
7.5%
10.7%
7.1%
8.0%
6.6% 6.7%
7.4%
9.0%
0%
2%
4%
6%
8%
10%
12%
Overall Ward 50 NonWard 50
Mutual Stock Small Medium Large
Return on Equity Return on Revenue
47 |
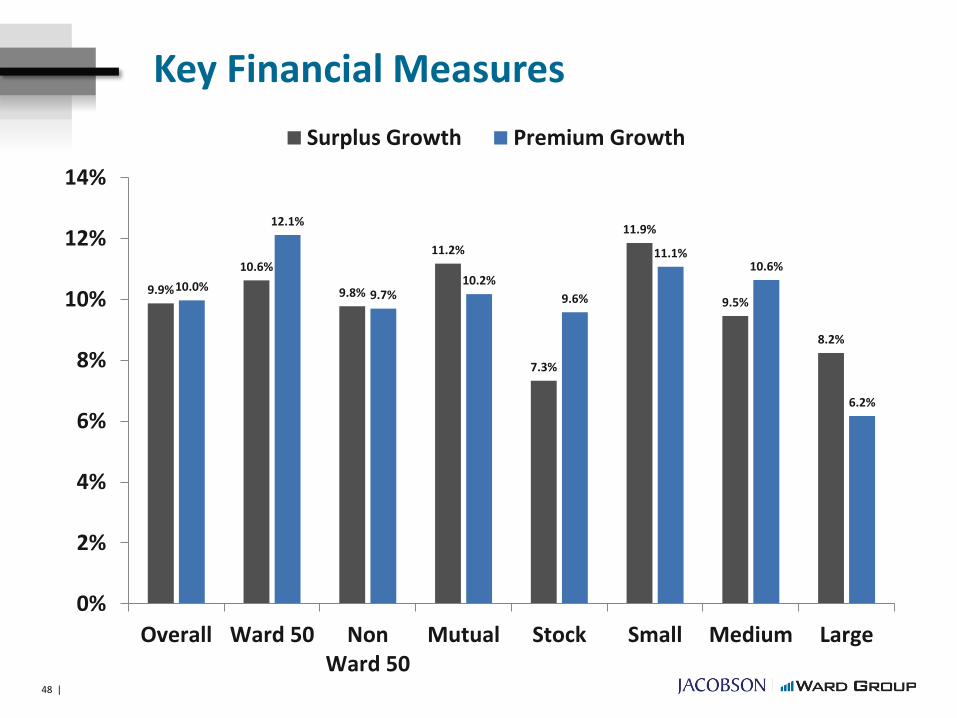
Key Financial Measures
9.9%
10.6%
9.8%
11.2%
7.3%
11.9%
9.5%
8.2%
10.0%
12.1%
9.7%10.2%
9.6%
11.1%10.6%
6.2%
0%
2%
4%
6%
8%
10%
12%
14%
Overall Ward 50 NonWard 50
Mutual Stock Small Medium Large
Surplus Growth Premium Growth
48 |
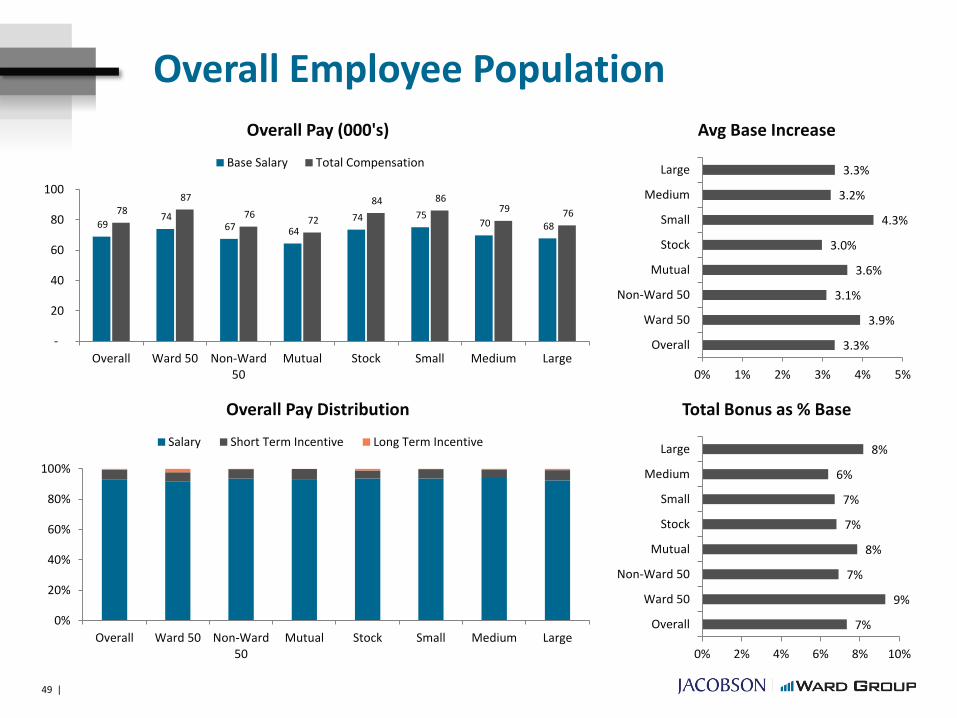
Overall Employee Population
69 74
67 64
74 75 70 68
78 87
76 72
84 86 79 76
-
20
40
60
80
100
Overall Ward 50 Non-Ward50
Mutual Stock Small Medium Large
Overall Pay (000's)
Base Salary Total Compensation
3.3%
3.9%
3.1%
3.6%
3.0%
4.3%
3.2%
3.3%
0% 1% 2% 3% 4% 5%
Overall
Ward 50
Non-Ward 50
Mutual
Stock
Small
Medium
Large
Avg Base Increase
0%
20%
40%
60%
80%
100%
Overall Ward 50 Non-Ward50
Mutual Stock Small Medium Large
Overall Pay Distribution
Salary Short Term Incentive Long Term Incentive
7%
9%
7%
8%
7%
7%
6%
8%
0% 2% 4% 6% 8% 10%
Overall
Ward 50
Non-Ward 50
Mutual
Stock
Small
Medium
Large
Total Bonus as % Base
49 |
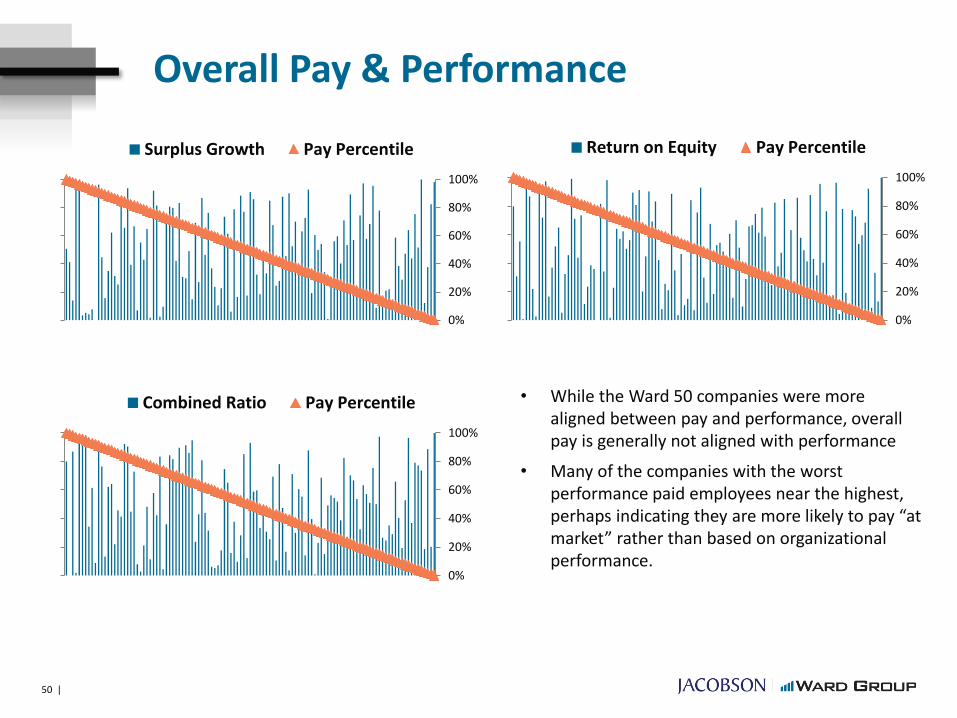
Overall Pay & Performance
• While the Ward 50 companies were more aligned between pay and performance, overall pay is generally not aligned with performance
• Many of the companies with the worst performance paid employees near the highest, perhaps indicating they are more likely to pay “at market” rather than based on organizational performance.
0%
20%
40%
60%
80%
100%
Surplus Growth Pay Percentile
0%
20%
40%
60%
80%
100%
Return on Equity Pay Percentile
0%
20%
40%
60%
80%
100%
Combined Ratio Pay Percentile
50 |

Overall Pay & Performance
Ward 50 company
Ove
rall
Pay
Ran
k
Overall Performance Rank
51 |
Pay and Performance Perfectly Aligned
Linear Trend Actual Pay and Performance
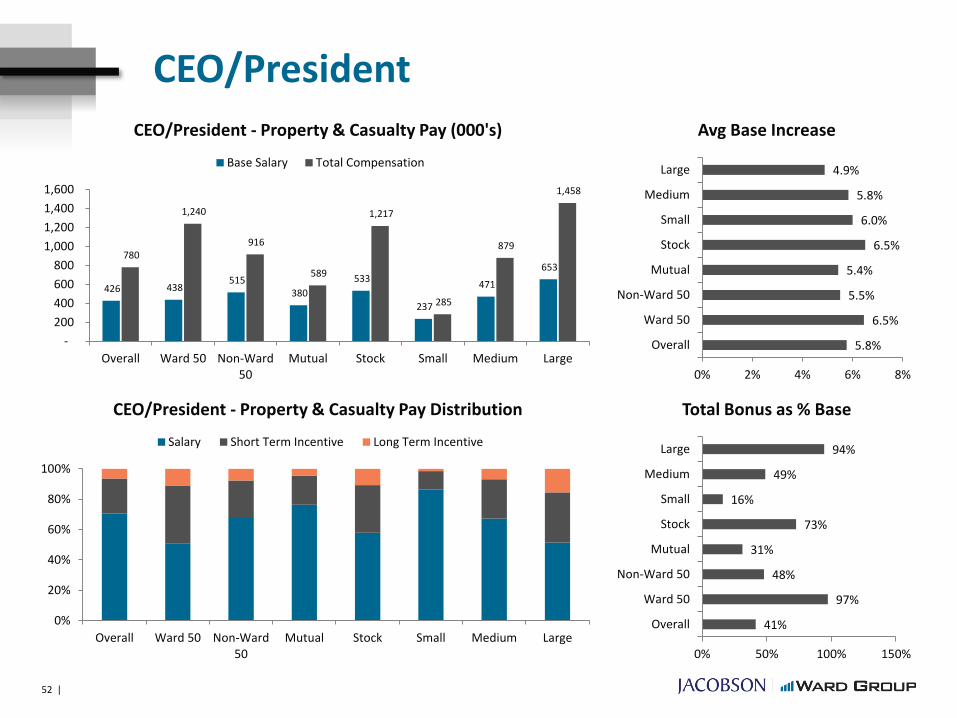
CEO/President
426 438 515
380
533
237
471
653 780
1,240
916
589
1,217
285
879
1,458
-
200
400
600
800
1,000
1,200
1,400
1,600
Overall Ward 50 Non-Ward50
Mutual Stock Small Medium Large
CEO/President - Property & Casualty Pay (000's)
Base Salary Total Compensation
5.8%
6.5%
5.5%
5.4%
6.5%
6.0%
5.8%
4.9%
0% 2% 4% 6% 8%
Overall
Ward 50
Non-Ward 50
Mutual
Stock
Small
Medium
Large
Avg Base Increase
0%
20%
40%
60%
80%
100%
Overall Ward 50 Non-Ward50
Mutual Stock Small Medium Large
CEO/President - Property & Casualty Pay Distribution
Salary Short Term Incentive Long Term Incentive
41%
97%
48%
31%
73%
16%
49%
94%
0% 50% 100% 150%
Overall
Ward 50
Non-Ward 50
Mutual
Stock
Small
Medium
Large
Total Bonus as % Base
52 |
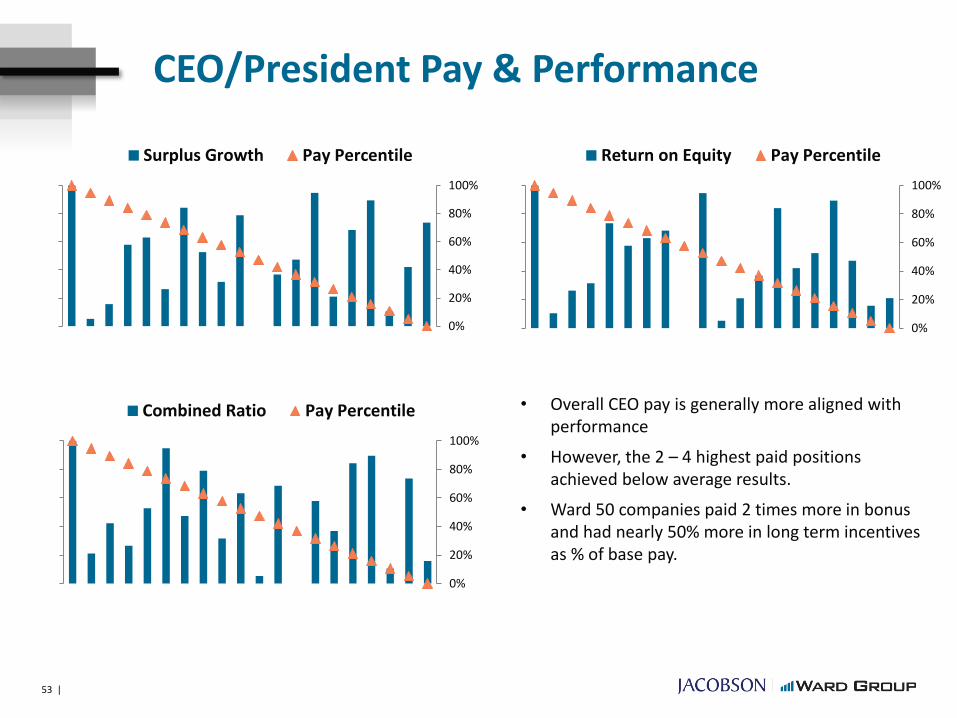
CEO/President Pay & Performance
• Overall CEO pay is generally more aligned with performance
• However, the 2 – 4 highest paid positions achieved below average results.
• Ward 50 companies paid 2 times more in bonus and had nearly 50% more in long term incentives as % of base pay.
0%
20%
40%
60%
80%
100%
Surplus Growth Pay Percentile
0%
20%
40%
60%
80%
100%
Return on Equity Pay Percentile
0%
20%
40%
60%
80%
100%
Combined Ratio Pay Percentile
53 |

CEO/President Pay & Performance
CEO
Pay
Ran
k
CEO Total Performance RankWard 50 company
54 |
Pay and Performance Perfectly Aligned
Linear Trend Actual Pay and Performance
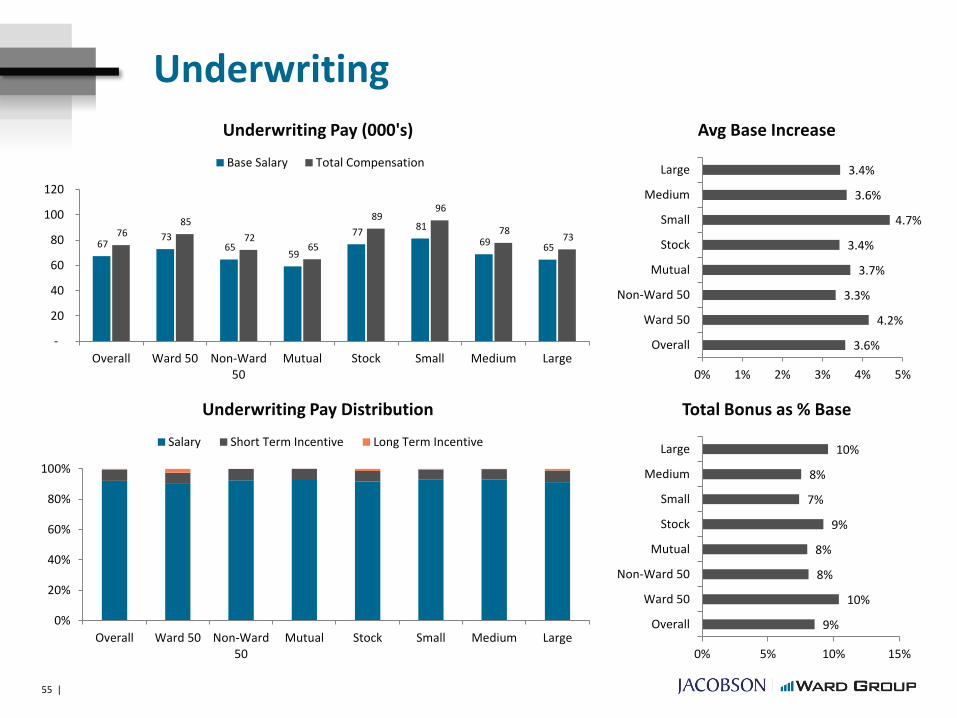
Underwriting
67 73
65 59
77 81
69 65
76 85
72 65
89 96
78 73
-
20
40
60
80
100
120
Overall Ward 50 Non-Ward50
Mutual Stock Small Medium Large
Underwriting Pay (000's)
Base Salary Total Compensation
3.6%
4.2%
3.3%
3.7%
3.4%
4.7%
3.6%
3.4%
0% 1% 2% 3% 4% 5%
Overall
Ward 50
Non-Ward 50
Mutual
Stock
Small
Medium
Large
Avg Base Increase
0%
20%
40%
60%
80%
100%
Overall Ward 50 Non-Ward50
Mutual Stock Small Medium Large
Underwriting Pay Distribution
Salary Short Term Incentive Long Term Incentive
9%
10%
8%
8%
9%
7%
8%
10%
0% 5% 10% 15%
Overall
Ward 50
Non-Ward 50
Mutual
Stock
Small
Medium
Large
Total Bonus as % Base
55 |

Underwriting Pay & Performance
• Underwriting pay was moderately aligned with performance
• Business mix influences pay for underwriter, particularly for commercial specialty roles
• The most efficient company paid the lowest compensation, driven by high automation among its personal book of business
0%
20%
40%
60%
80%
100%
Premium Growth Pay Percentile
0%
20%
40%
60%
80%
100%
Retention Ratio Pay Percentile
0%
20%
40%
60%
80%
100%
Loss Ratio Efficiency Pay Percentile
56 |

Underwriting Pay & Performance
Un
de
rwri
tin
g P
ay R
ank
Underwriting Performance RankWard 50 company
57 |
Pay and Performance Perfectly Aligned
Linear Trend Actual Pay and Performance
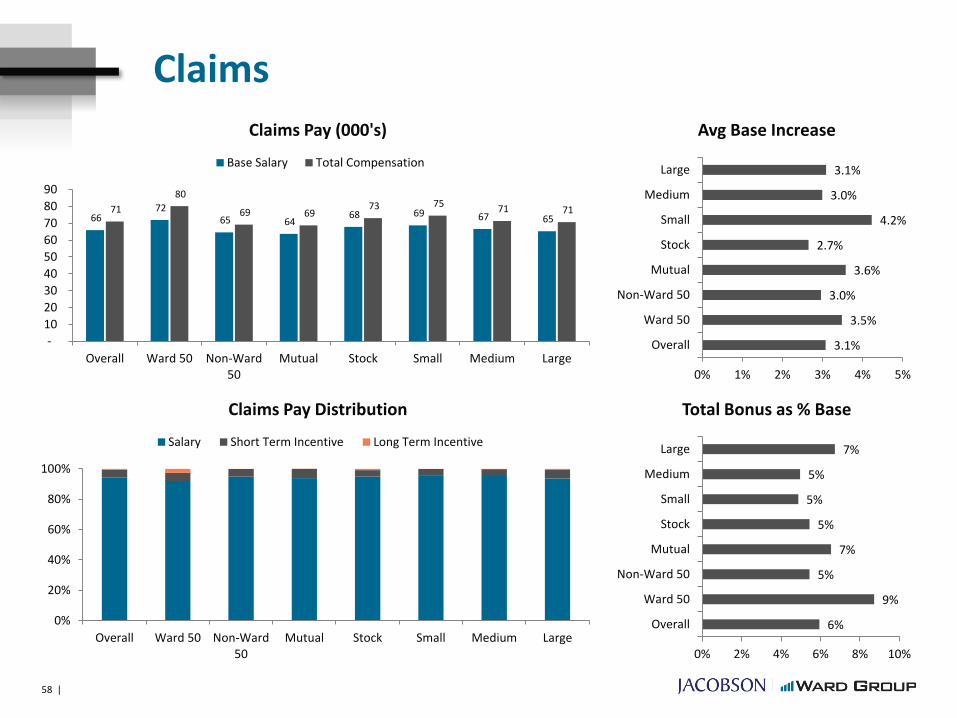
Claims
66 72
65 64 68 69 67 65
71
80
69 69 73 75 71 71
-
10
20
30
40
50
60
70
80
90
Overall Ward 50 Non-Ward50
Mutual Stock Small Medium Large
Claims Pay (000's)
Base Salary Total Compensation
3.1%
3.5%
3.0%
3.6%
2.7%
4.2%
3.0%
3.1%
0% 1% 2% 3% 4% 5%
Overall
Ward 50
Non-Ward 50
Mutual
Stock
Small
Medium
Large
Avg Base Increase
0%
20%
40%
60%
80%
100%
Overall Ward 50 Non-Ward50
Mutual Stock Small Medium Large
Claims Pay Distribution
Salary Short Term Incentive Long Term Incentive
6%
9%
5%
7%
5%
5%
5%
7%
0% 2% 4% 6% 8% 10%
Overall
Ward 50
Non-Ward 50
Mutual
Stock
Small
Medium
Large
Total Bonus as % Base
58 |

Claims Pay & Performance
0%
20%
40%
60%
80%
100%
Expense Efficiency Pay Percentile
0%
20%
40%
60%
80%
100%
Staff Efficiency Pay Percentile
0%
20%
40%
60%
80%
100%
Loss Ratio Efficiency Pay Percentile • Claims pay was not aligned with performance
• In many cases, Claims workloads will be higher in poor performing years due to catastrophe activity.
• However, Ward typically finds automated processes, workflow and faster settlement practices heavily influence the expense and loss ratio efficiency of top performers.
59 |

Claims Pay & Performance
Cla
ims
Pay
Ran
k
Claims Total Performance RankWard 50 company
60 |
Pay and Performance Perfectly Aligned
Linear Trend Actual Pay and Performance
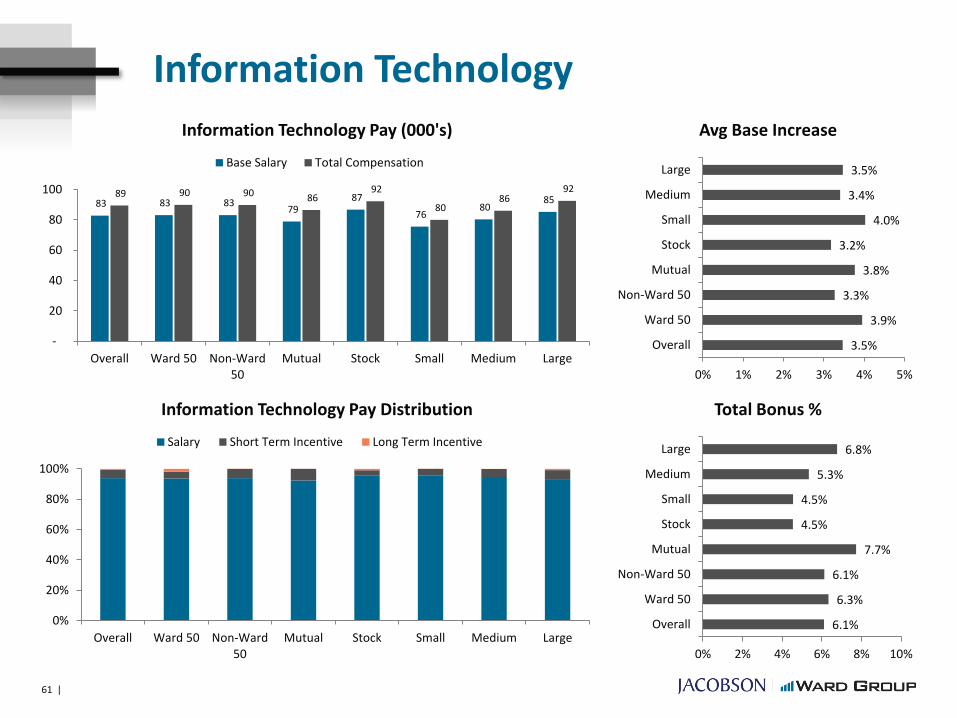
Information Technology
83 83 83 79
87
76 80
85 89 90 90 86
92
80 86
92
-
20
40
60
80
100
Overall Ward 50 Non-Ward50
Mutual Stock Small Medium Large
Information Technology Pay (000's)
Base Salary Total Compensation
3.5%
3.9%
3.3%
3.8%
3.2%
4.0%
3.4%
3.5%
0% 1% 2% 3% 4% 5%
Overall
Ward 50
Non-Ward 50
Mutual
Stock
Small
Medium
Large
Avg Base Increase
0%
20%
40%
60%
80%
100%
Overall Ward 50 Non-Ward50
Mutual Stock Small Medium Large
Information Technology Pay Distribution
Salary Short Term Incentive Long Term Incentive
6.1%
6.3%
6.1%
7.7%
4.5%
4.5%
5.3%
6.8%
0% 2% 4% 6% 8% 10%
Overall
Ward 50
Non-Ward 50
Mutual
Stock
Small
Medium
Large
Total Bonus %
61 |

Information Technology Pay & Performance
0%
20%
40%
60%
80%
100%
Expense Efficiency Pay Percentile
0%
20%
40%
60%
80%
100%
Staff Efficiency Pay Percentile
0%
20%
40%
60%
80%
100%
External Expense Efficiency Pay Percentile • IT pay was not aligned with performance
• Not surprising, higher pay among staff resulted in higher overall expenses.
• Ward often finds higher expense ratio in IT is usually found in a less automated company and often reflects complicated processes, multiple operating platforms and complicated organizational structures (which require more IT staff to address issues)
62 |
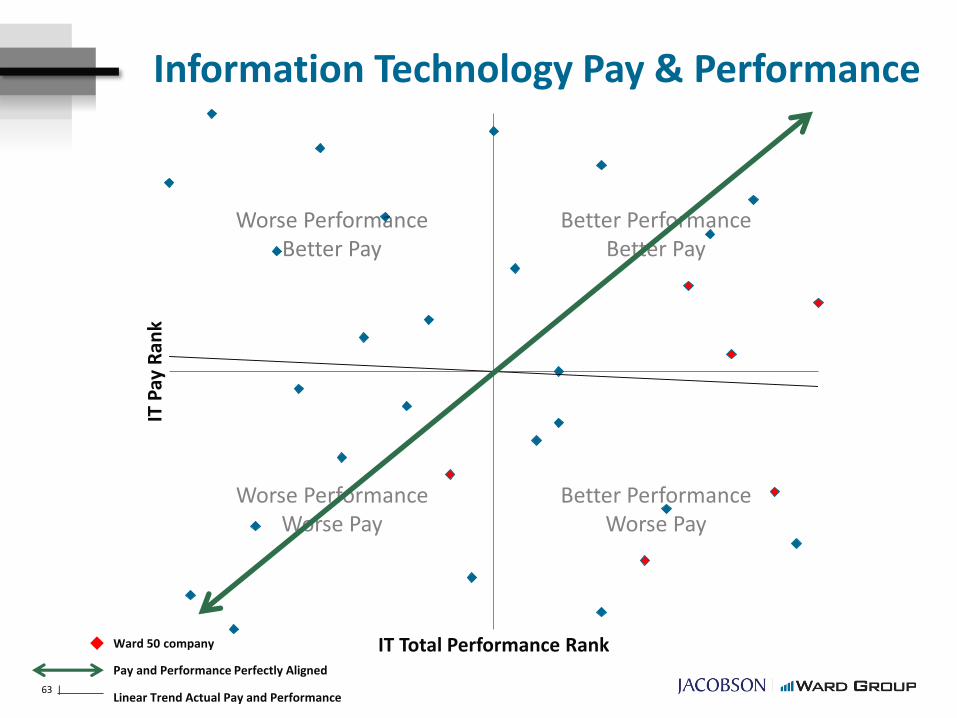
Information Technology Pay & Performance
IT P
ay R
ank
IT Total Performance RankWard 50 company
63 |
Pay and Performance Perfectly Aligned
Linear Trend Actual Pay and Performance

Leveraging Talent
Current Talent Trends
65 |
Sources: BLS, SunTrust
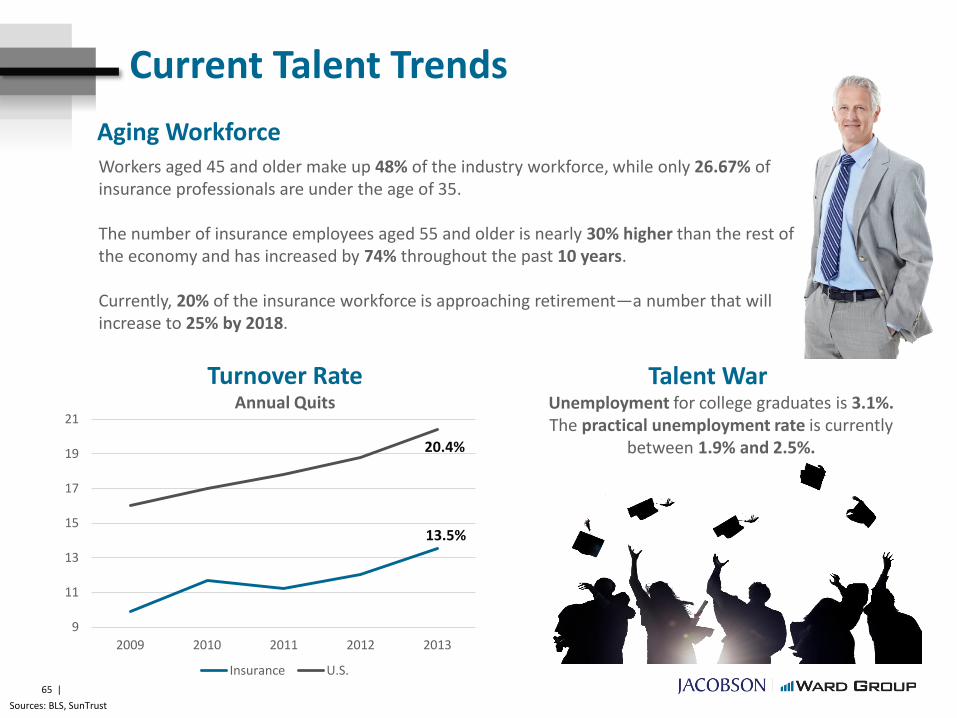
Aging Workforce
Turnover RateAnnual Quits
Workers aged 45 and older make up 48% of the industry workforce, while only 26.67% of insurance professionals are under the age of 35.
The number of insurance employees aged 55 and older is nearly 30% higher than the rest of the economy and has increased by 74% throughout the past 10 years.
Currently, 20% of the insurance workforce is approaching retirement—a number that will increase to 25% by 2018.
9
11
13
15
17
19
21
2009 2010 2011 2012 2013
Insurance U.S.
13.5%
20.4%
Talent WarUnemployment for college graduates is 3.1%. The practical unemployment rate is currently
between 1.9% and 2.5%.
Current Talent Trends
66 |
Sources: BLS, U.S. Census Bureau
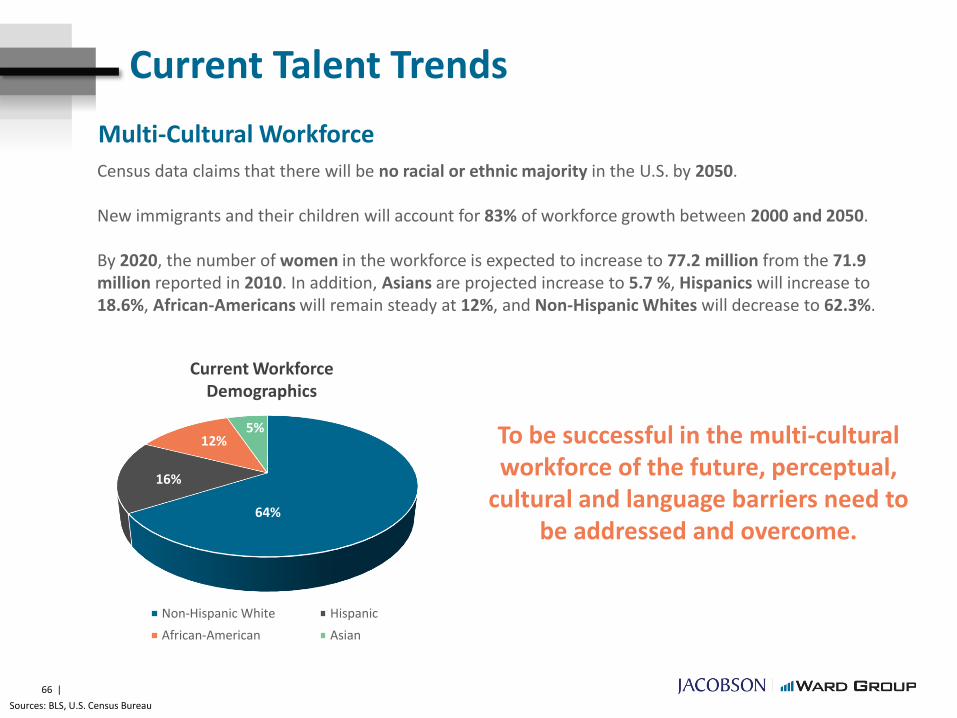
Multi-Cultural Workforce
Census data claims that there will be no racial or ethnic majority in the U.S. by 2050.
New immigrants and their children will account for 83% of workforce growth between 2000 and 2050.
By 2020, the number of women in the workforce is expected to increase to 77.2 million from the 71.9 million reported in 2010. In addition, Asians are projected increase to 5.7 %, Hispanics will increase to 18.6%, African-Americans will remain steady at 12%, and Non-Hispanic Whites will decrease to 62.3%.
Non-Hispanic White Hispanic
African-American Asian
64%
16%
5%12%
Current Workforce Demographics
To be successful in the multi-cultural workforce of the future, perceptual,
cultural and language barriers need to be addressed and overcome.
Current Talent Trends
67 |
Sources: BLS, U.S. Census Bureau, Society for Human Resource Management, Pew Research Center
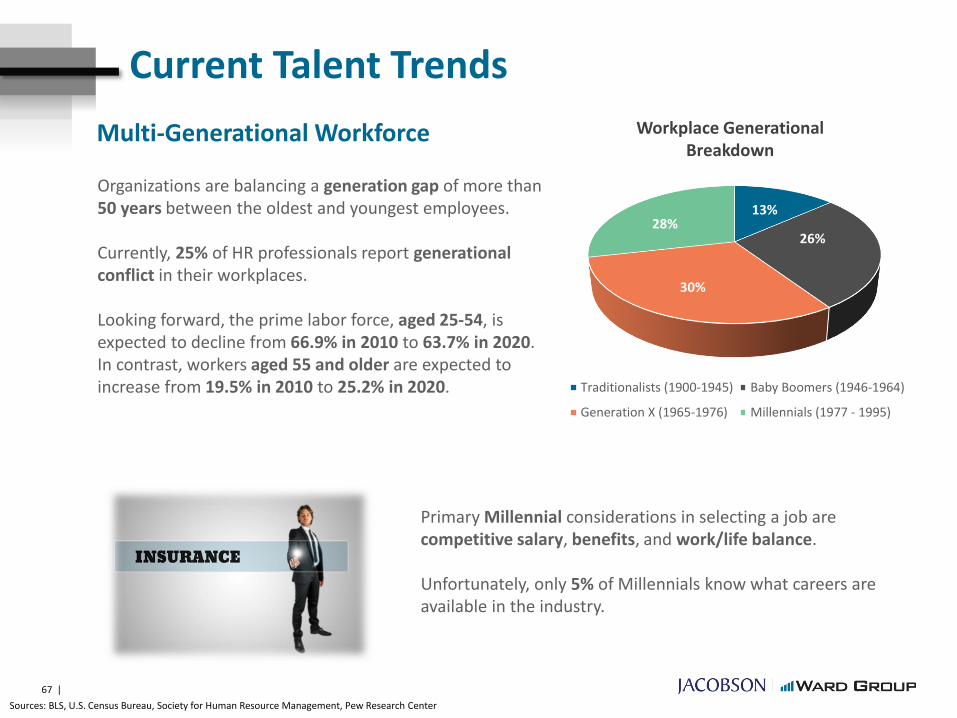
Multi-Generational Workforce Workplace Generational Breakdown
Traditionalists (1900-1945) Baby Boomers (1946-1964)
Generation X (1965-1976) Millennials (1977 - 1995)
30%
28%13%
26%
Primary Millennial considerations in selecting a job are competitive salary, benefits, and work/life balance.
Unfortunately, only 5% of Millennials know what careers are available in the industry.
Organizations are balancing a generation gap of more than 50 years between the oldest and youngest employees.
Currently, 25% of HR professionals report generational conflict in their workplaces.
Looking forward, the prime labor force, aged 25-54, is expected to decline from 66.9% in 2010 to 63.7% in 2020. In contrast, workers aged 55 and older are expected to increase from 19.5% in 2010 to 25.2% in 2020.
Current Talent Trends
68 |
New Skills Required
CommunicationLost art
64%
16%
5%12%
TechnologyAdaptive to new tools
AnalyticsNot just within analytics department
Critical ThinkingDecision making and problem solving
Social Media SavvyAware of new trends

Key Leadership Qualities
69 |
Engaging
Motivates on a personal level
EmpoweringAbility to assess and lead change
Ask to step up … will step up

Key Leadership Qualities
Adaptive (not weak)
• Able to admit mistakes
• Able to change approach
• Able to approach others differently
70 |
Ability to accurately and quickly size up a situation
• Markets move fast• Buyer needs
change fast• Loyalties change
fast
Focus on succession planning
Develops People

Recruiting Talent
71 |
Selling is key!
Culture
Relationships
Financial Benefits
Opportunity
First and foremost … do they like the environment?
Millennials are social and want to work in teams.
Can they envision challenge, growth, financial rewards in the near future?
Reward = Impact
Recruiting Talent
72 |
Most efficient way to train and assess new talent
Reduce ramp up time and expense!
Current tenure in insurance is 4.9 years.
60% of Millennials will leave their employers within the first 3 years.
Internships
Sources: BLS
Talent Retention
Competitive CompensationTotal expected compensation is what counts.
Realistic incentives act as hand-cuffs.
73 |
Aligned Compensation
Must compete with stock companies
Long-Term Incentives
Talent Retention
74 |
Enterprise involvement
Continued Growth Opportunities
1. Work from home
2. Other priorities
3. Other interests
Work/Life Balance

Top Takeaways and Closing Thoughts
• The future will look much different (both in insurance and externally)
- We need to expand viewpoint
- External changes having bigger influence
• Things are generally looking good for the industry
- But operational changes are significant
- Managing change will be difficult
• Big difference between financial strength and operational efficiency
• Data, Data, DATA
- But most don’t even know how to use it
- Early adopters are likely to gain the most
• Technology is making meaningful improvements in operations
- Need to have courage to allow it to work
75 |
• Companies still struggle with managing compensation
– It is clear proper design drives results
– Mutuals trail stock companies in use of LTI
• You get what you measure
– People want to be measured
– Creates predictable behaviors
• There are ways to objectively measure almost everything
– But value is how it is communicated
– Clear line of sight is needed
– Helps eliminate emotion in decisions
• Despite the demand for technology, underwriting and claims staff, many companies are not aligning pay plans to retain key staff
76 |
Top Takeaways and Closing Thoughts

Questions and Discussion
77 |
Related Documents

![Untitled-2 [fogokitchen.com] · BEERS e CIDER 1 Pint £5.95 £5.95 £4.25 £4.25 £4.25 £7.95 Coke Ginger Ale Slim Line Tonic SOFT DRINKS £2.95 £2.45 £3.55 £3.25 £4.25](https://static.cupdf.com/doc/110x72/5fb7f6f1f5eb5306ef5358d3/untitled-2-beers-e-cider-1-pint-595-595-425-425-425-795-coke.jpg)