The changes in energy that occur during chemical reactions can be illustrated using an energy diagram:

Welcome message from author
This document is posted to help you gain knowledge. Please leave a comment to let me know what you think about it! Share it to your friends and learn new things together.
Transcript
The changes in energy that occur during chemical reactions can
be illustrated using an energy diagram:
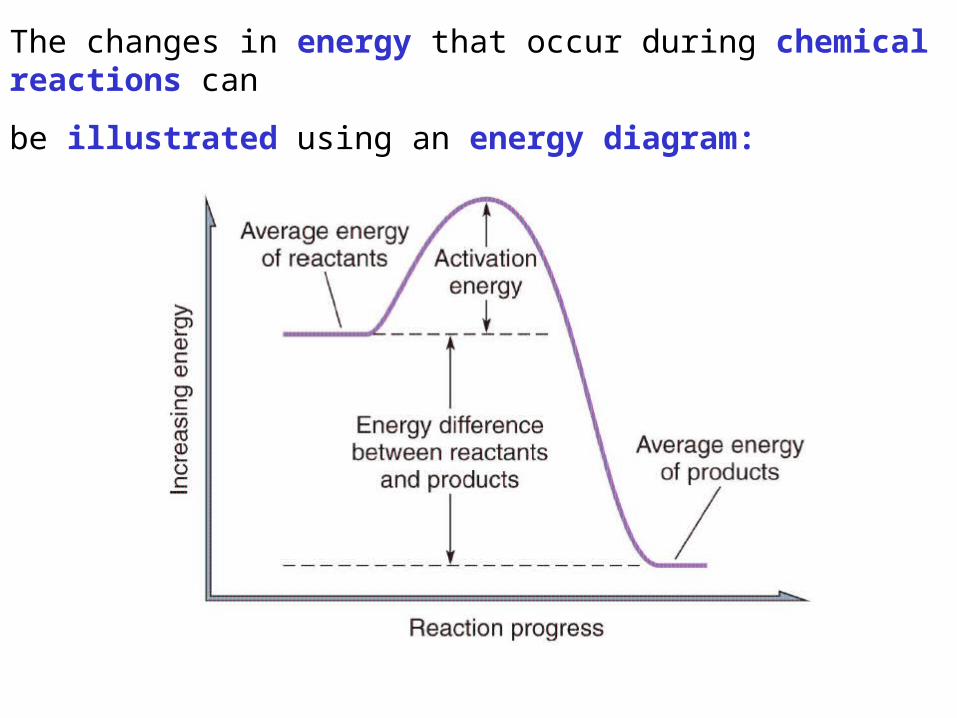
Many reactions take place in solution:
e.g.
2AgNO3(aq) + Na2CO3(aq) Ag2CO3(s) + 2NaNO3(aq)
The co-efficients in equations allow us to determine the
relative amounts of products and reactants.
# moles of Ag2CO3 = ½(# moles of AgNO3)
# moles of Na2CO3 = ½(# moles of AgNO3)
# moles of NaNO3 = # moles of AgNO3
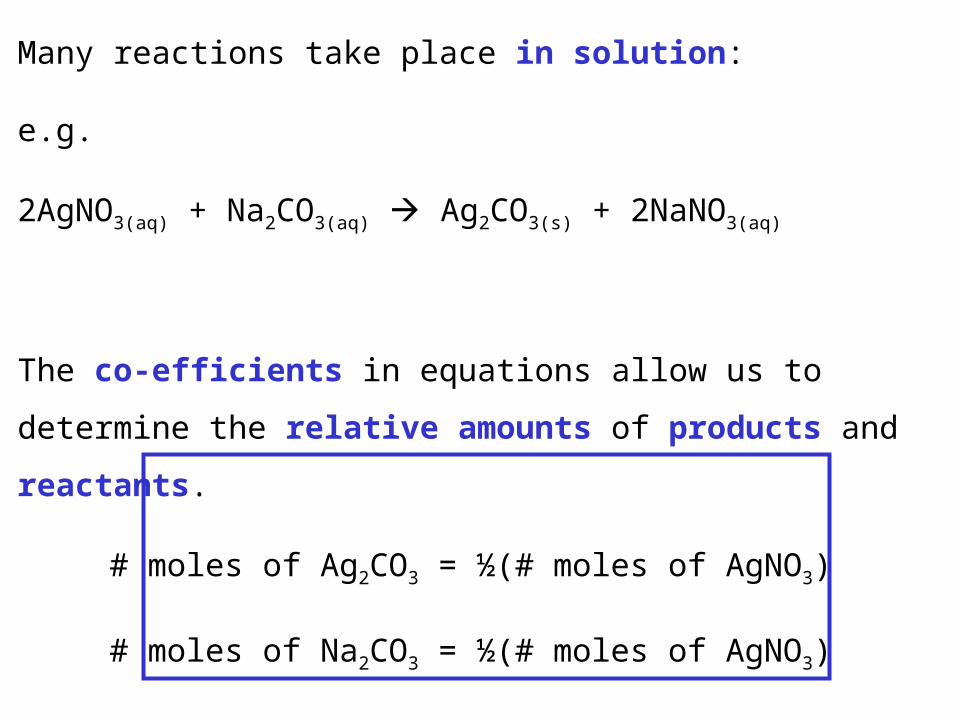
2AgNO3(aq) + Na2CO3(aq) Ag2CO3(s) + 2NaNO3(aq)
In the case of this reaction all reagents are in the form of
aqueous solutions.
If we combine two solutions of known volume of the reagents
how could we calculate the amount of product produced?
If we know the molarity of the reagent solutions we can use the
relationship between molarity and volume to determine the
number of moles of each reagent.
M = n/V
n = M x V
We can then determine the yield of product as we would for any
other stoichiometry calculation.
Would anyone like to do an example?

Luckily I thought that might be the case so I prepared a slide!
Consider the following reaction:
2AgNO3(aq) + Na2CO3(aq) Ag2CO3(s) + 2NaNO3(aq)
If I combined 20 mL of 0.20 molL-1 AgNO3(aq) solution with
10mL of 0.20 molL-1 Na2CO3(aq) what mass of Ag2CO3 would be
produced?

# of moles of AgNO3 = M x V
= 0.2 molL-1 x 20 mL x (1 x10-3 LmL-1)
= 0.004 moles of AgNO3
# moles of Ag2CO3 = ½(# moles of AgNO3)
# moles of Ag2CO3 = ½ x 0.004 moles
If the limiting reagent is AgNO3 0.002 moles of Ag2CO3 will be
produced.

# of moles of Na2CO3 = M x V
= 0.2 molL-1 x 10 mL x (1 x10-3 LmL-1)
= 0.0020 moles of Na2CO3
# moles of Ag2CO3 = # moles of Na2CO3
# moles of Ag2CO3 = 0.0020 moles
If the limiting reagent is Na2CO3 0.0020 moles of Ag2CO3 will be
produced.
Conclude that we produce 0.0020 moles of Ag2CO3 in this
reaction. However question asked for what mass.
Mass = n x MW
Mass of Ag2CO3 = 0.002mol x (2x107.9 + 12.01 + 3x16.00)gmol-1
Mass of Ag2CO3 = 0.55 grams
The reaction 20 mL of 0.20 molL-1 AgNO3(aq) solution with
10mL of 0.20 molL-1 Na2CO3(aq) would produce 0.55 g of
Ag2CO3.
Pure water conducts electricity poorly.
Addition of a solute can affect the ability of water to conduct
electricity.
• solutes that result in aqueous solutions that conduct
electricity well are called strong electrolytes.
• solutes that result in aqueous solutions that conduct
electricity poorly are called weak electrolytes.
• solutes that result in aqueous solutions that do not
conduct electricity are called nonelectrolytes.

The ability of a solute to conduct electricity increases with the
extent to which it dissociates into ions.
Soluble ionic compounds tend to completely dissociate into
ions and are strong electrolytes:
NaCl(aq) Na+(aq) + Cl-(aq)
Polar covalent compounds dissociate depending on how polar
the bonds they contain are:
HCl(aq) H+(aq)+ Cl-(aq)
Non-polar covalent compounds are nonelectrolytes.
Lets do some practice problems now.
Some properties of solutions do not depend on the chemical
nature of the solute but only on the concentration of the solute.
•These kinds of properties are called colligative properties
We will discuss three colligative properties:
• Boiling point elevation
• Freezing point depression
• Osmotic pressure

The vapor pressure above a solution is lower than that above
the pure solvent.
This has some interesting effects:
• The boiling point of a solution is higher than the pure solvent
(boiling point elevation).
• The freezing point of a solution is lower than the pure solvent
(freezing point depression).

The change in boiling point and freezing point can be
calculated using the following similar equations:
Δ tf =nKfM
Δtb = nKbM
Where:
Δtb = change in boiling poing
Δtf = change in freezing point
n = number of moles of solute particles put in to solution
when 1 mole of solute is dissolved.
Kb = a constant characteristic of the solvent
Kf = a constant characteristic of the solvent
M = molarity

What is the boiling point of a 0.1 molL-1 solution of MgCl2?
Δtb = nKbM
Δtb = ?
n = 3 (2 x Cl- and 1 x Mg2+)
Kb = 0.52 oC/M (from Table 7.6)
M = 0.1 molL-1
Δtb = 3 x 0.52 x 0.1 = 0.156 oC
Boiling point = 100oC + 0.156oC = 100.2oC
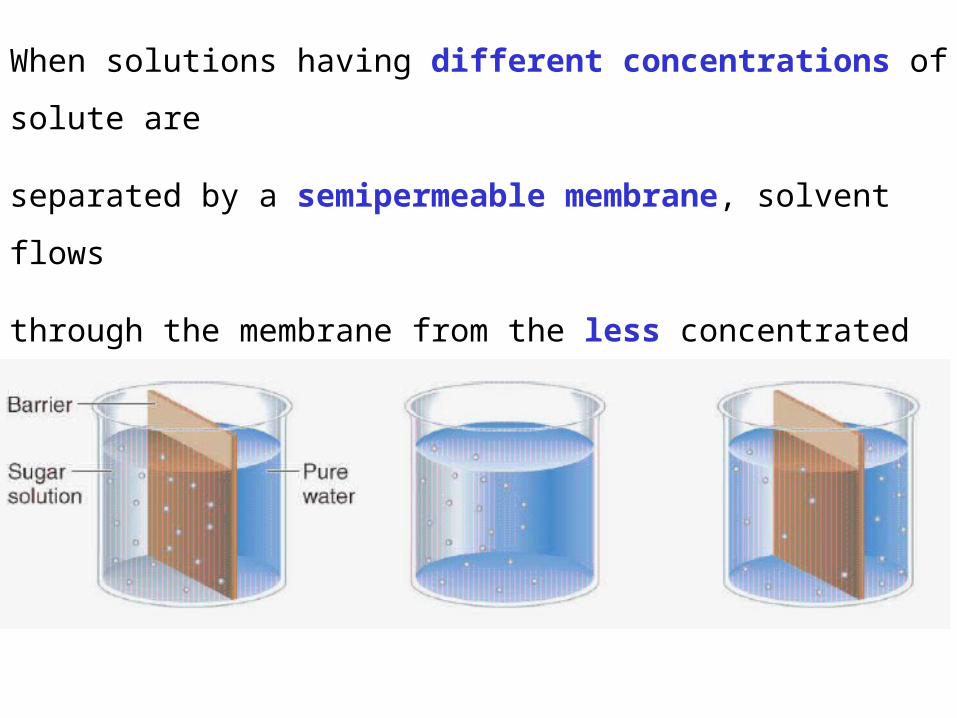
When solutions having different concentrations of solute are
separated by a semipermeable membrane, solvent flows
through the membrane from the less concentrated solution into
the more concentrated solution this is called osmosis.

This will ultimately result in unequal amounts of liquid on each
side of the membrane.
A pressure will be exerted hindering the movement of solvent
across the membrane. Eventually the pressure will prevent the
movement of solvent across the membrane. This is called the
osmotic pressure and is given by equation:
π= nMRT
Where:
π = osmotic pressure
n = number of moles of solute particles put in to solution
when 1 mole of solute is dissolved.
M = molarity (molL-1)
R = universal gas constant
T = temperature (Kelvin)
A process very similar to osmosis is dialysis. In dialysis a
membrane is used that allows the smaller molecules to cross
but do not the larger ones.
Dialysis is used extensively for purifying solutions of large
biomolecules.
e.g. proteins
A commonly known use of dialysis is in purifying the blood of
people whose kidneys do not function correctly.
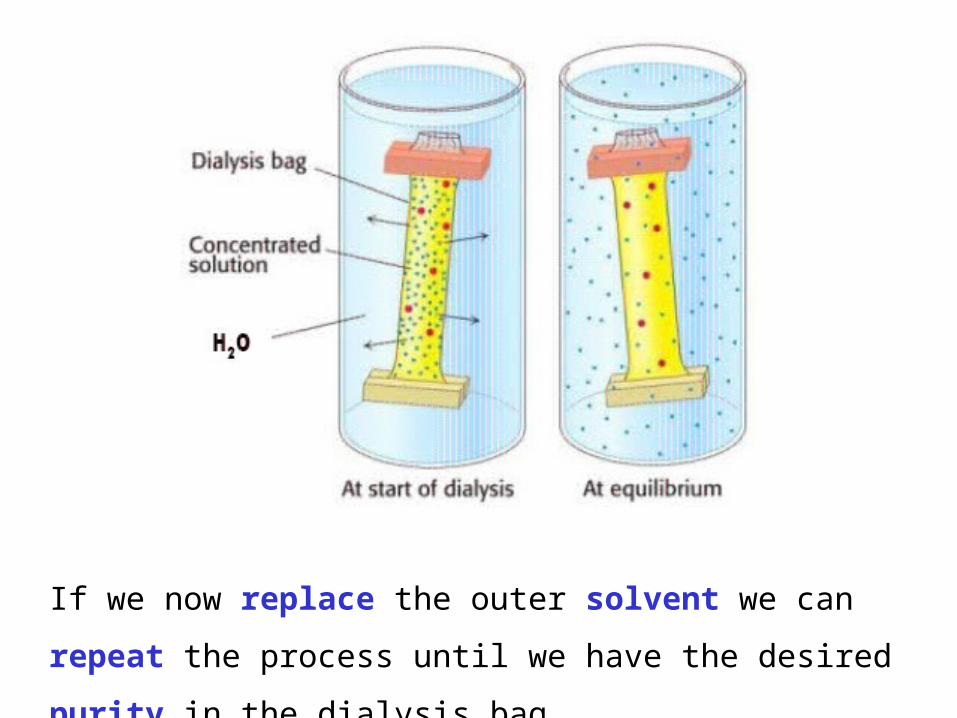
If we now replace the outer solvent we can repeat the
process until we have the desired purity in the dialysis bag.
We have all observed how some processes tend to
spontaneously occur while others don’t.
e.g. Objects roll downhill but not up.
Our rooms effortlessly become disorganized but don’t
spontaneous tidy themselves up.
We age rather than grow younger.
It would be very useful to predict what processes will occur
and what ones won’t?
We have already classified chemical processes as either being
endothermic (heat in) or exothermic (heat out) processes.
HINT: if you are having trouble remembering what these things
mean think about the words entrance and exit.
Heat is only one form of energy, others include light, sound,
kinetic energy etc.
In a more general sense, taking all forms of energy into
account, we can classify reactions as being exergonic (energy
out) or endogonic (energy in).
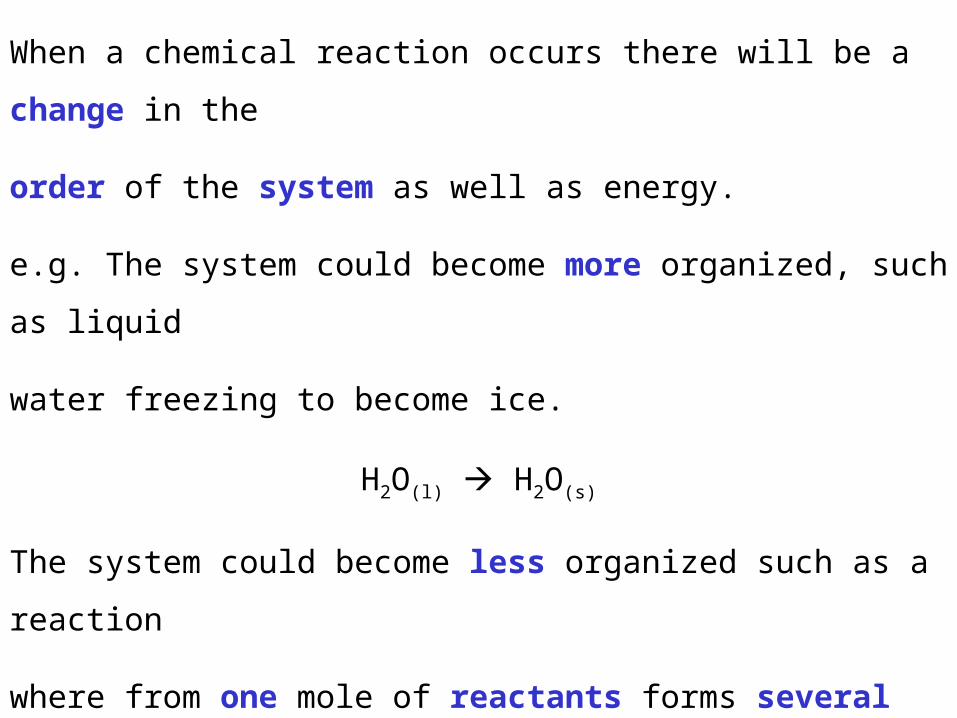
When a chemical reaction occurs there will be a change in the
order of the system as well as energy.
e.g. The system could become more organized, such as liquid
water freezing to become ice.
H2O(l) H2O(s)
The system could become less organized such as a reaction
where from one mole of reactants forms several moles of
products are formed.
2HgO(s) 2Hg(l) + O2(g)
The degree of order or randomness in a system is called the
entropy.
Spontaneous reactions tend to release energy and have an
increase in entropy.
If these conditions don’t exist then there must be a larger change
in the other parameter to off set the effect of the other in order for
the process to be spontaneous.
When looking at a reaction there are only several possible ways
in which the energy and entropy can change that allow us to
predict the spontaneity of the process.
1. If the reaction has no change in energy or gains energy from
the surroundings. It will only be spontaneous if there is an
increase in entropy.
2. A process will always be spontaneous if the reaction
releases energy to the surroundings and is accompanied by
an increase in entropy.
3. A process in which the entropy decreases will only be
spontaneous if accompanied by a release of energy.
Spontaneous reactions tend to release energy and have an
increase in entropy.
1. If there is no change in energy or a gain of energy from the
surroundings. Process will only be spontaneous if there is an
increase in entropy.
Can anyone think of a spontaneous process that falls into
this case?
H2O(s) + energy H2O(l)
Spontaneous reactions tend to release energy and have an
increase in entropy.
2. A process will always be spontaneous if the reaction
releases energy to the surroundings and is accompanied by
an increase in entropy.
Can anyone think of a spontaneous process that falls into
this case?
NaOH(s) Na+(aq) + OH-
(aq) + heat
Spontaneous reactions tend to release energy and have an
increase in entropy.
3. A process in which the entropy decreases will only be
spontaneous if accompanied by a release of energy.
Can anyone think of a spontaneous process that falls into
this case?
H2O(g) H2O(l) + heat

A reaction mechanism describes the pathway or process by
which a reaction occurs.
This is different from a reaction rate we discussed previously
which just tells you how quickly the reaction occurs.
e.g. Comparing the difference between reaction rate and
mechanism is like comparing how long it takes to complete a
journey and the directions to a location.
e.g. “ it takes 4.5 hours to fly to Chicago and Chicago lies to the
east of Seattle.”

Some aspects of reaction mechanisms are common to most
reactions:
1. The reactant particles must collide (come into
contact)
Can anyone think of an exception to this rule ?
Decomposition reactions have only one reagent:
A B + C
The second aspect of reaction mechanisms that is common to
most reactions is:
2. The reactant particles must collide with a certain
minimum amount of energy
When a reaction occurs old bonds are broken and often new
ones form. This typically requires an initial input of energy called
the activation energy.
Once the activation energy is overcome the process proceeds
spontaneously.The energy of the reactants is made up of two
components:
1. The kinetic energy of the molecules.
2.The internal energy of the reactant molecules.
The kinetic energy of the reactants describes how fast the
reactant molecules are moving. This will be greater for gases
and liquids than solids and increases with temperature.
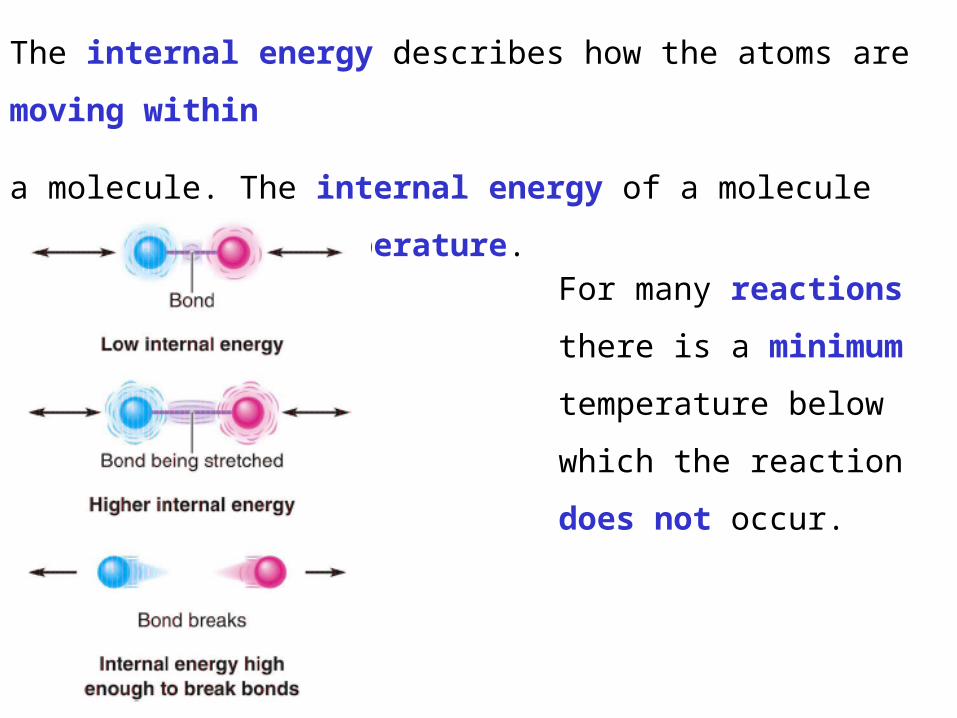
The internal energy describes how the atoms are moving within
a molecule. The internal energy of a molecule increases with
temperature.
For many reactions there
is a minimum temperature
below which the reaction
does not occur.
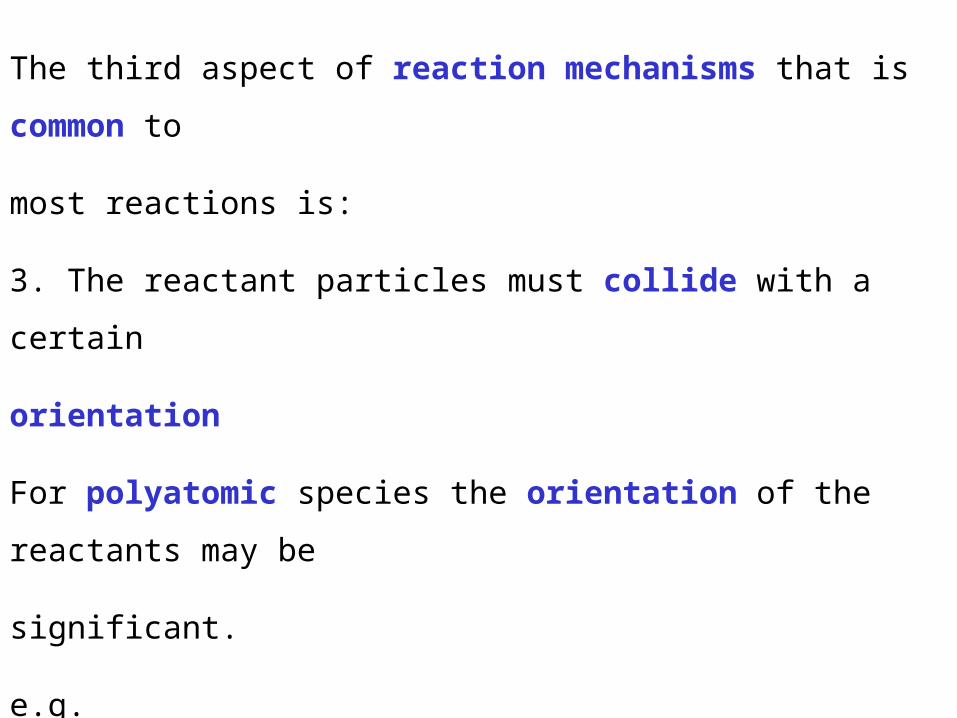
The third aspect of reaction mechanisms that is common to
most reactions is:
3. The reactant particles must collide with a certain
orientation
For polyatomic species the orientation of the reactants may be
significant.
e.g.
AB + CD → AC + BD
In the above A must be near C and B must be near D.
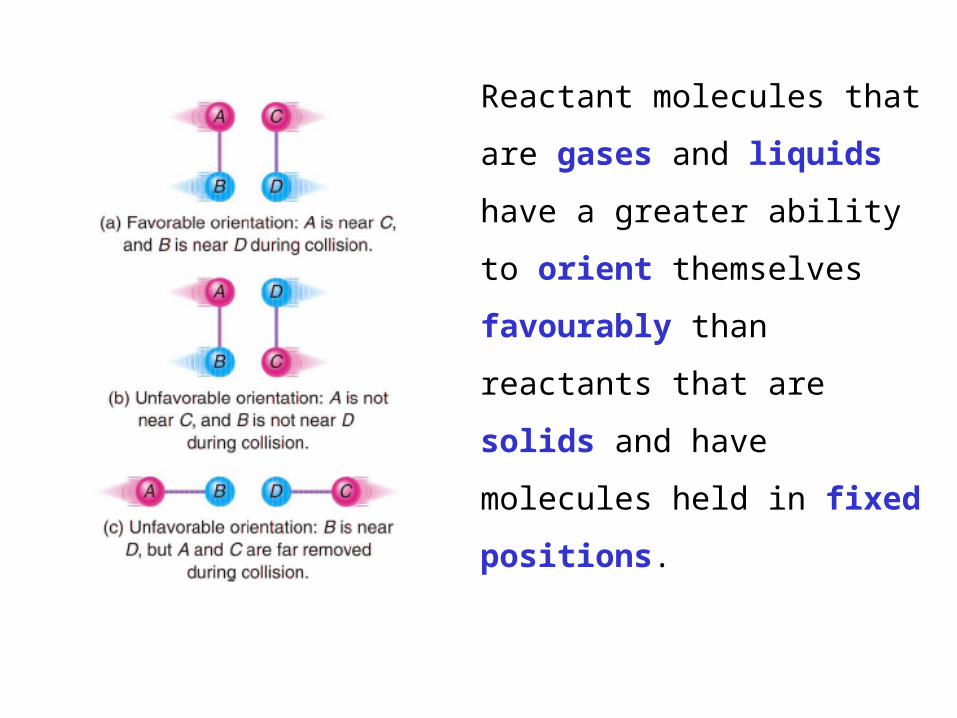
Reactant molecules that are
gases and liquids have a
greater ability to orient
themselves favourably than
reactants that are solids and
have molecules held in fixed
positions.

Good luck in the final !!
Keep watching the website for updates
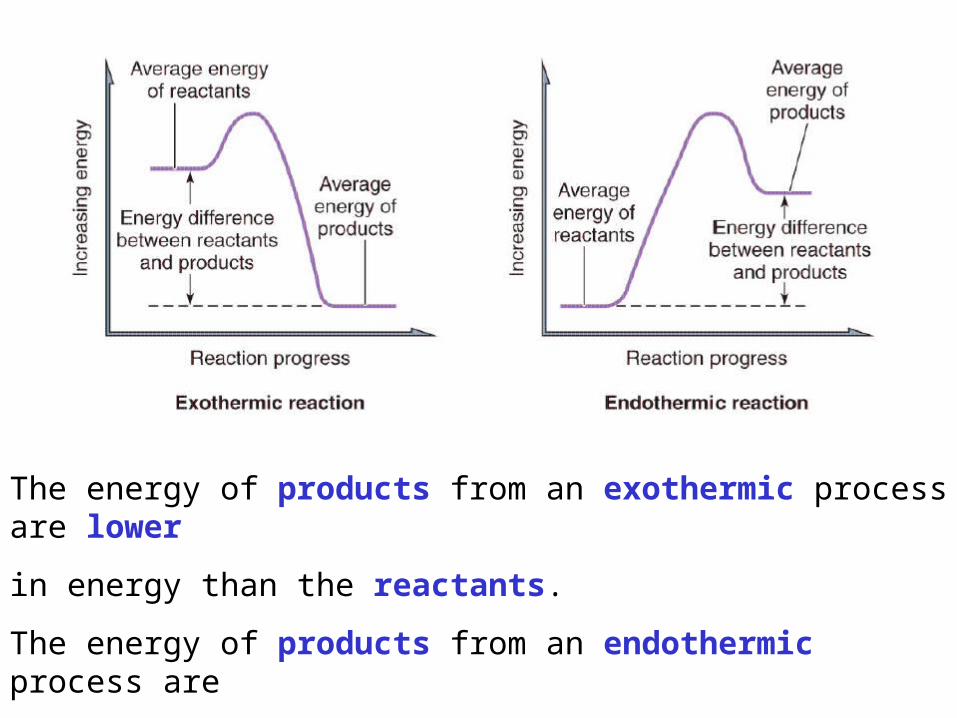
The energy of products from an exothermic process are lower
in energy than the reactants.
The energy of products from an endothermic process are
higher in energy than the reactants.

The reaction rate of all reactions are affected by:
1. The nature of the reactants
2. The concentration of the reactants
3. The temperature of the reactants
4. The presence of catalysts
Important chemical properties of the reagents that can affect
the reaction rate include:
The type of bonds the reactants contain
The charge of the reactants
The state of the reactants
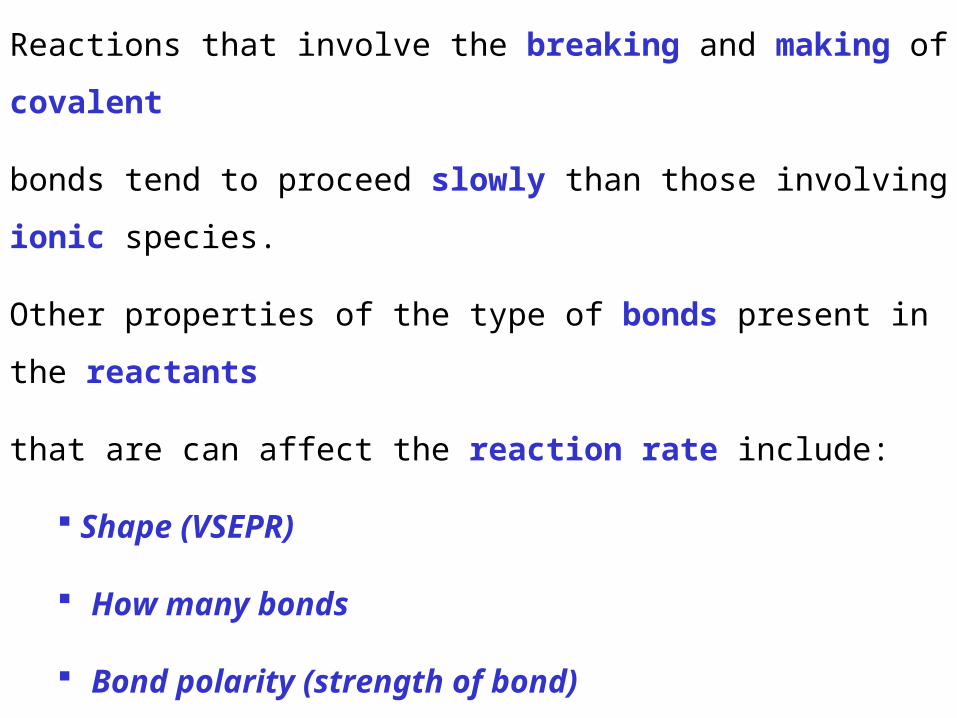
Reactions that involve the breaking and making of covalent
bonds tend to proceed slowly than those involving ionic species.
Other properties of the type of bonds present in the reactants
that are can affect the reaction rate include:
Shape (VSEPR)
How many bonds
Bond polarity (strength of bond)
Bond order (number of electrons in bond)
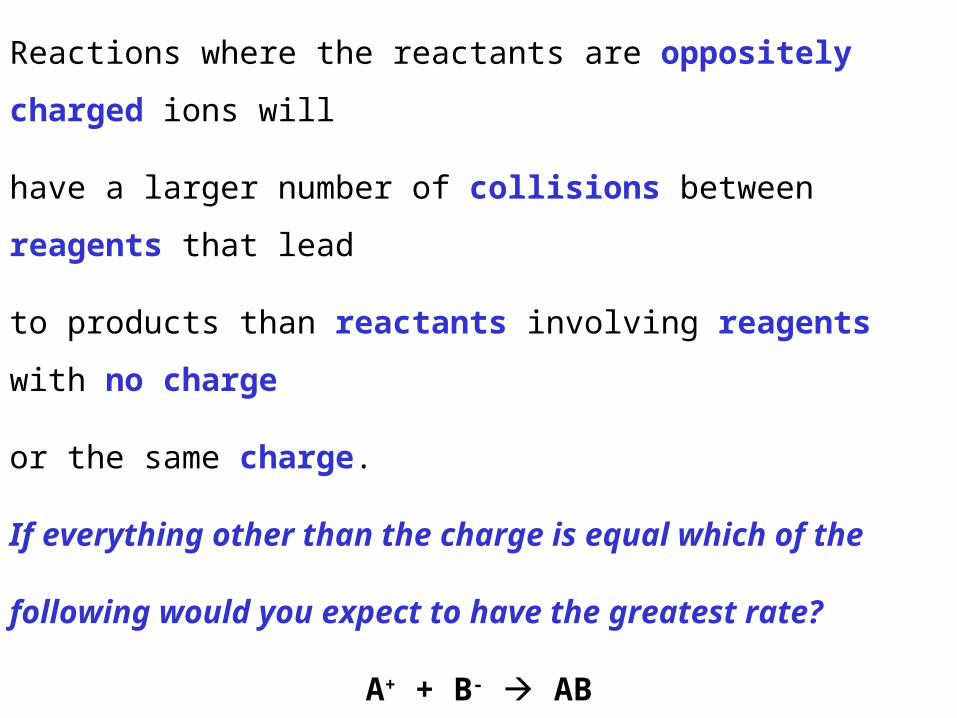
Reactions where the reactants are oppositely charged ions will
have a larger number of collisions between reagents that lead
to products than reactants involving reagents with no charge
or the same charge.
If everything other than the charge is equal which of the
following would you expect to have the greatest rate?
A+ + B- AB
A+ + A+ A2 2+
A + B AB

By increasing the temperature of the reagents we increase the
proportion of reagents that have sufficient energy to overcome
the activation energy.
A good rule of
thumb is that for
every 100C rise in
temperature the
reaction rate
doubles.
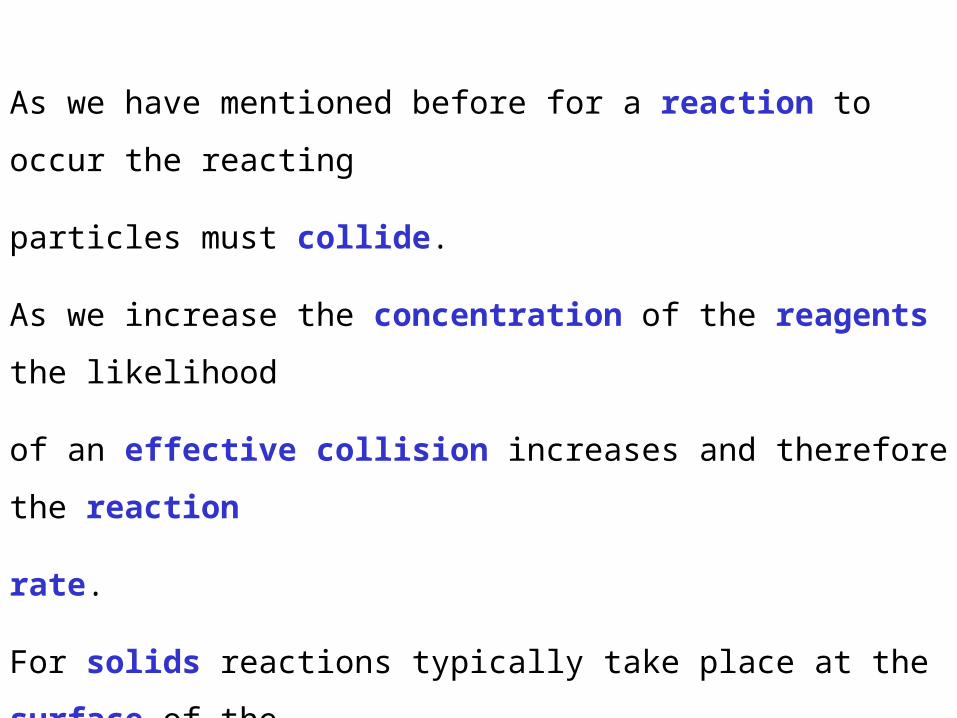
As we have mentioned before for a reaction to occur the reacting
particles must collide.
As we increase the concentration of the reagents the likelihood
of an effective collision increases and therefore the reaction
rate.
For solids reactions typically take place at the surface of the
reactant. By finely dividing solids we can increase the surface
area and the rate at which they react.

Catalysts are substances that change the rate of a reaction
without being consumed.
Catalysts that slow the rate of a reaction are known as inhibitors.
Catalysts that are in the same state as the reagents and
distributed as individual molecules or ions are known as
homogeneous catalysts.
Many catalysts are solids (often with large surface areas) while
the reactants are gases or liquids, these are known as
heterogeneous catalysts. E.g. catalytic convertors in cars.

Catalysts work by providing an alternative, faster, pathway (or
mechanism) from the reactants to the products.
This alternative mechanism may have a lower activation
energy (EA).
More reactants are
likely to have sufficient
energy to overcome EA
and so the reaction
proceeds quicker.

Solid catalysts can accelerate reactions by binding one of the
reactants in a desirable orientation. Furthermore, molecules
that are not moving are easier targets for collisions.
In this diagram the
catalyst holds the
reactant in an
orientation such that
the yellow atoms are
in a favourable
position in order for
them to react.
Related Documents