The challenge of quantitative risk analysis for wildland fire Mark A. Finney * USDA Forest Service, Missoula Fire Sciences Laboratory, PO BOX 8089, Missoula, MT 59802, USA Abstract Quantitative fire risk analysis depends on characterizing and combining fire behavior probabilities and effects. Fire behavior probabilities are different from fire occurrence statistics (historic numbers or probabilities of discovered ignitions) because they depend on spatial and temporal factors controlling fire growth. That is, the likelihood of fire burning a specific area is dependent on ignitions occurring off-site and the fuels, topography, weather, and relative fire direction allowing each fire to reach that location. Research is required to compare computational short-cuts that have been proposed for approximating these fire behavior distributions. Fire effects in a risk analysis must also be evaluated on a common scale for the variety of values susceptible to wildland fire. This means that appraisals of fire impacts to human infrastructure and ecological values must be measured by the same currency so that the risk assessment yields a single expectation of fire effects. Ultimately, this will help guide planning and investment into management activities that can alter either the probabilities of damaging fire or the susceptibility to those fire behaviors. # 2005 Elsevier B.V. All rights reserved. Keywords: Wildland fires; Quantitative risk analysis; Net value change 1. Introduction Fire planning and risk assessment are concerned with how often fires burn, what effects they have on wildland and urban values, and what opportunities exist to improve the situation through management actions. In the United States, most wildland fires are suppressed. Fires are detected, reported, and initial attack resources dispatched. Fire statistics for feder- ally managed public lands reveal that 99% of all reported fires are suppressed by initial attack forces (NIFC, 2002). Other measures from around the United States similarly suggest about 98% of fires in 2002 are less than 100 ha (250 acres; Neuenschwander et al., 2000; Cardille and Ventura, 2001). The remaining percentage escapes initial attack for many reasons, mostly involving extreme weather, overwhelming of suppression resources by multiple ignitions, and fuel types producing fire behavior that exceeds fire- fighting capabilities. Where management policies explicitly disallow free-burning fires, the rare escaped fires burn under weather scenarios among the most extreme and in fuel conditions that have often been exacerbated by the overall success of fire exclusion under more moderate conditions. Even if fuels remain unchanged during the long fire-free intervals, these policies shift the distribution of fire behaviors toward www.elsevier.com/locate/foreco Forest Ecology and Management 211 (2005) 97–108 * Tel.: +1 40 6329 4825; fax: +1 40 6329 4825. E-mail address: mfi[email protected] 0378-1127/$ – see front matter # 2005 Elsevier B.V. All rights reserved. doi:10.1016/j.foreco.2005.02.010

Welcome message from author
This document is posted to help you gain knowledge. Please leave a comment to let me know what you think about it! Share it to your friends and learn new things together.
Transcript

The challenge of quantitative risk analysis for wildland fire
Mark A. Finney *
USDA Forest Service, Missoula Fire Sciences Laboratory, PO BOX 8089, Missoula, MT 59802, USA
www.elsevier.com/locate/foreco
Forest Ecology and Management 211 (2005) 97–108
Abstract
Quantitative fire risk analysis depends on characterizing and combining fire behavior probabilities and effects. Fire behavior
probabilities are different from fire occurrence statistics (historic numbers or probabilities of discovered ignitions) because they
depend on spatial and temporal factors controlling fire growth. That is, the likelihood of fire burning a specific area is dependent
on ignitions occurring off-site and the fuels, topography, weather, and relative fire direction allowing each fire to reach that
location. Research is required to compare computational short-cuts that have been proposed for approximating these fire
behavior distributions. Fire effects in a risk analysis must also be evaluated on a common scale for the variety of values
susceptible to wildland fire. This means that appraisals of fire impacts to human infrastructure and ecological values must be
measured by the same currency so that the risk assessment yields a single expectation of fire effects. Ultimately, this will help
guide planning and investment into management activities that can alter either the probabilities of damaging fire or the
susceptibility to those fire behaviors.
# 2005 Elsevier B.V. All rights reserved.
Keywords: Wildland fires; Quantitative risk analysis; Net value change
1. Introduction
Fire planning and risk assessment are concerned
with how often fires burn, what effects they have on
wildland and urban values, and what opportunities
exist to improve the situation through management
actions. In the United States, most wildland fires are
suppressed. Fires are detected, reported, and initial
attack resources dispatched. Fire statistics for feder-
ally managed public lands reveal that 99% of all
reported fires are suppressed by initial attack forces
(NIFC, 2002). Other measures from around the United
* Tel.: +1 40 6329 4825; fax: +1 40 6329 4825.
E-mail address: [email protected]
0378-1127/$ – see front matter # 2005 Elsevier B.V. All rights reserved
doi:10.1016/j.foreco.2005.02.010
States similarly suggest about 98% of fires in 2002 are
less than 100 ha (250 acres; Neuenschwander et al.,
2000; Cardille and Ventura, 2001). The remaining
percentage escapes initial attack for many reasons,
mostly involving extreme weather, overwhelming of
suppression resources by multiple ignitions, and fuel
types producing fire behavior that exceeds fire-
fighting capabilities. Where management policies
explicitly disallow free-burning fires, the rare escaped
fires burn under weather scenarios among the most
extreme and in fuel conditions that have often been
exacerbated by the overall success of fire exclusion
under more moderate conditions. Even if fuels remain
unchanged during the long fire-free intervals, these
policies shift the distribution of fire behaviors toward
.
M.A. Finney / Forest Ecology and Management 211 (2005) 97–10898
the extreme end. Escaped fires are of most practical
concern to risk assessment, although the same
procedures are applicable to the broader range of
weather conditions where the management policies
permit the growth of free-burning fires (Parsons and
van Wagtendonk, 1996; Rollins et al., 2001).
A quantitative definition of fire risk includes two
main factors: fire behavior probabilities and fire
effects. This definition applies to a particular
geographic area and time period and can be
formulated as an expected net value change
(E[nvc]) which is the summed losses and benefits
from for all N fire behaviors (e.g. under all weather
conditions from all ignitions locations) and n values:
E½nvc� ¼XN
i¼1
Xn
j¼1
pðFiÞ½Bij � Lij� (1)
where p( Fi) is the probability of the ith fire behavior,
and Bij and Lij are the respective benefits and losses
afforded the jth value received from the ith fire
behavior. Since benefits and losses from a given fire
change through time, estimates of Envc will be the sum
of Eq. (1) for a fixed period post-fire. For example,
benefits of an underburn that removed surface fuels
would be accrued for many years in the form of
reduced fire hazard (i.e. reduced potential fire beha-
vior) although losses may be incurred in the initial
year (Hesseln and Rideout, 1999). The purpose of this
paper will be to discuss the components of this equa-
tion and the methods used for approximating them.
This nomenclature corresponds to the terminology
common to fire risk assessment (e.g. Bachmann and
Allgower, 2000) where the fire behaviors ( Fi) con-
stitute ‘‘hazards’’ and ‘‘risk’’ applies only to the final
summary of net value change.
2. Fire occurrence versus burn probability
Fire occurrence is defined as the frequency of fires
that have been reported and recorded within a finite
area and historical period of time (e.g. number of fires/
ha/year). Data for calculating fire occurrence must be
obtained from fire records, which often document the
geographic coordinates of the fire. These differ from
fire dates procured from fire scarred trees that really
record the passage of a fire of unknown size, not
necessarily a discrete occurrence (i.e. multiple records
for the same fire may exist elsewhere on the
landscape). Fire occurrence data are often summarized
for different time periods, often by daily, weekly, or
monthly intervals to help depict variation in fire
activity through out the season (Andrews et al., 2003;
Garcia Diez et al., 2000; Neuenschwander et al.,
2000). Records may be summarized for the entire fire
season, which is a period determined by fire climate
and especially precipitation patterns (Schroeder and
Buck, 1970). Nearly all analyses of fire occurrence
relate fire occurrence to effects of fuel moisture and
thus ratings of ‘‘fire danger’’ (Andrews et al., 2003).
Fire occurrence can be expressed as a single value for
the land area or as a spatial data theme through use of
spatial moving averages (Harkins, 2000) if the ignition
location is known (Fig. 1(a)). The fire occurrence
probability for the entire Deschutes National Forest in
Oregon is about 0.0001 fires/acre/year. These sum-
maries are descriptive of the average, but imply that
fire probabilities were stationary through time and
distributed evenly across the landscape, which may
not be the case if climatic and human influences have
changed during the period of summary data (Schuster,
1999; Keeley et al., 1999). Spatial fire occurrence data
often reveal correlations with land ownership and
developed areas because of human-caused ignitions
(Bradshaw et al., 1984; Cardille and Ventura, 2001)
and land cover types. The definition of fire occurrence
implies nothing about fire size, the size distribution of
the fires, or the probability of an area burning. Fire
occurrence is often summarized by cause (human,
arson, lightning, etc.) and may be further refined by
the area ‘‘protected’’ or under the fire management
responsibility of a particular agency (fires by acre
protected) rather than the total area encompassed or
owned.
Although straightforward to analyze, fire occur-
rence data by themselves are of limited value to risk
assessment because they do not reflect probability of
burning at a given geographic location. A fire start
does not imply spread, yet risk produced by Eq. (1)
uses the probability of how fires of a given
characteristic burn a piece of land and what changes
are produced, not how often they ignite. Character-
izing fire probability for risk assessment requires an
estimate of the probability of burning with a given
fire behavior for all areas within the area of interest.
M.A. Finney / Forest Ecology and Management 211 (2005) 97–108 99
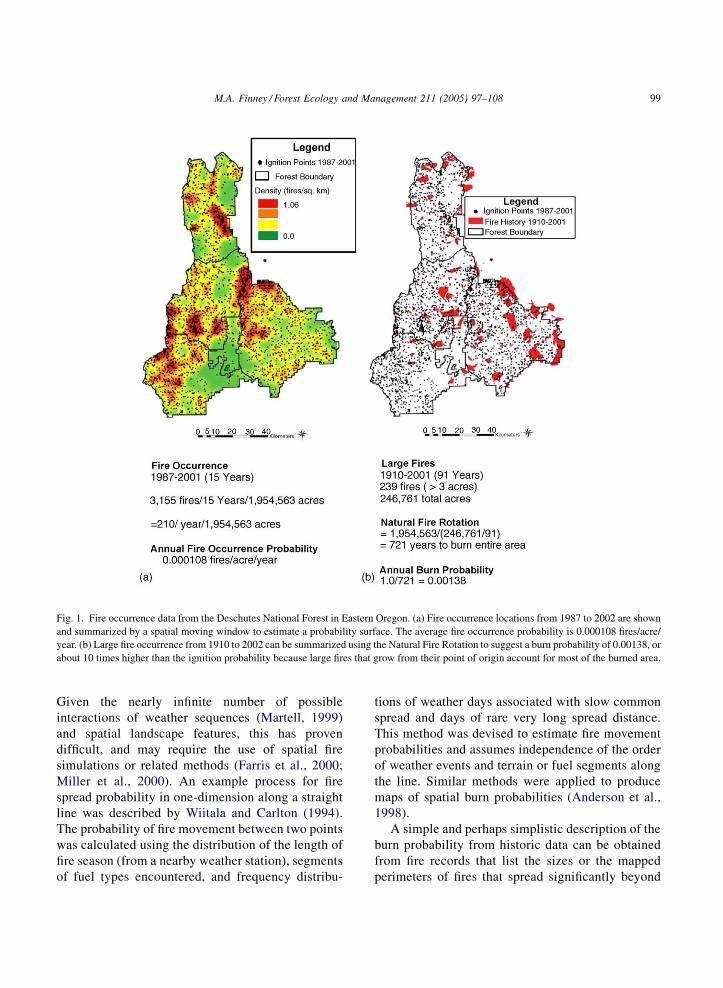
Fig. 1. Fire occurrence data from the Deschutes National Forest in Eastern Oregon. (a) Fire occurrence locations from 1987 to 2002 are shown
and summarized by a spatial moving window to estimate a probability surface. The average fire occurrence probability is 0.000108 fires/acre/
year. (b) Large fire occurrence from 1910 to 2002 can be summarized using the Natural Fire Rotation to suggest a burn probability of 0.00138, or
about 10 times higher than the ignition probability because large fires that grow from their point of origin account for most of the burned area.
Given the nearly infinite number of possible
interactions of weather sequences (Martell, 1999)
and spatial landscape features, this has proven
difficult, and may require the use of spatial fire
simulations or related methods (Farris et al., 2000;
Miller et al., 2000). An example process for fire
spread probability in one-dimension along a straight
line was described by Wiitala and Carlton (1994).
The probability of fire movement between two points
was calculated using the distribution of the length of
fire season (from a nearby weather station), segments
of fuel types encountered, and frequency distribu-
tions of weather days associated with slow common
spread and days of rare very long spread distance.
This method was devised to estimate fire movement
probabilities and assumes independence of the order
of weather events and terrain or fuel segments along
the line. Similar methods were applied to produce
maps of spatial burn probabilities (Anderson et al.,
1998).
A simple and perhaps simplistic description of the
burn probability from historic data can be obtained
from fire records that list the sizes or the mapped
perimeters of fires that spread significantly beyond

M.A. Finney / Forest Ecology and Management 211 (2005) 97–108100
their ignition location (i.e. large fires). Assuming that
the landscape is uniform and the burning conditions
are stationary over time (i.e. ignition frequency,
climatology), the Natural Fire Rotation (Heinselman,
1973) reflects the time required to burn an area equal
in size to the study area. The NFR is calculated
as:
NFR ¼ At=ðAf=NyÞ (2)
where At is the total area of the land, Af the total area
burned by all fires (re-burned areas included) and Ny
the years in the record. For the Deschutes National
Forest (Fig. 1(b)), the NFR was 721 years, which
implies an average probability of burning as 1/
721 = 0.00138. This means that the burn probability
from large fires would have been about 10 times
greater than the fire occurrence probability and sig-
nifies the difference between fire occurrence and
burn probabilities. This burn probability does not
discern any fire behavior characteristics or any para-
meter involving the distribution of behaviors. It
would be similar to the sum of all N behaviors in
Eq. (1). Although the NFR methods can be easily
calculated, its application to fire risk assessment is of
limited value because the fire behaviors with respect
to spatial landscape properties are not differentiated
and literally assume that the landscape has a uniform
probability of burning. NFR calculations also assume
that the sample size or length of record is sufficient
and stationary over that time period to include rare
large fire events. This is often false, however. Van
Wagner (1988) found wide variation over six dec-
ades. The Deschutes National Forest data record
used here in Fig. 1 ended before the largest fire
occurred in 2003 (B&B Complex – 35,900 ha or
88,700 acres).
To move beyond the NFR’s assumptions of spatial
uniformity and temporal stationarity requires account-
ing for effects of spatially varying fuels, topography,
and weather on the growth and behavior of fires. This
will produce local differences in the probability of fire
behaviors (i.e. at a given point) because of the local
properties and the interaction of landscape topology
and contagion due to fire growth (Farris et al., 2000). A
simple example was developed to illustrate the
topological implications of spatially non-uniform
burning conditions. Fire simulations were performed
using a minimum travel time algorithm that can
efficiently simulate fire growth over complex land-
scapes using temporally static weather conditions
(Finney, 2002). Between 10,000 and 40,000 fires
driven by southwest winds were simulated for uniform
weather and ignition probability across a flat land-
scape containing a few patches of slower-burning fuel
types (Fig. 2). The simulations produced burn
probability maps for three scenarios involving fires
of different durations (i.e. fire sizes) and show a
probability shadow formed on the lee-side of the
slower-burning patches as well as the edge effect
extending into the landscape from the windward
direction. The lee-side probability reductions extend
farther from the widest obstruction with the largest
fires, but are nearly eliminated behind the narrow
obstructions. Note that the absolute probabilities
increase with fire size, meaning that a given point
was more likely to burn as fire size increased.
Similarly, 98th percentile weather conditions were
applied to a 900 km2 area near Missoula, MT, where
topography and fuel types varied (Fig. 3). Fuel
moisture varied by adiabatic adjustment of tempera-
ture and humidity, and topographically altered solar
radiation. Wind speeds were 25 mph from the
southwest. The results show that burn probabilities
for 20,000 random ignitions are not uniform and were
higher downwind of the fastest-burning fuel types
because a larger ‘‘fetch’’ for ignitions can influence
those areas. In summary, this simulation illustrates
that burn probabilities are topological, depending on
the upstream properties of the landscape. These
simulations were not intended to calculate absolute
burn probabilities, which would require more complex
sequences of weather.
Data on area burned and fire size distributions are
often useful for summarizing aspects of general fire
occurrence and its variability. Wiitala (1999) used
empirical data on fire size distributions to calculate
probabilities of exceeding a given fire size. Data on
only the largest fires in a given area have also been
examined (Erman and Jones, 1996; Moritz, 1997).
Theoretical work on fire size distributions have also
been examined (Gill et al., 2003; McKelvey and
Busse, 1996) and consistently suggest a log-log
reduction in the frequency of larger fires. An idea
proposed to explain this relationship concerns the
influence of many small fires in reducing the
frequency of large fires. However, fire data used to

M.A. Finney / Forest Ecology and Management 211 (2005) 97–108 101
Fig. 2. Simulations of burn probabilities for (a) random ignitions and artificial landscapes composed of uniform conditions except in three
patches of slower-burning fuels of different shapes. With constant wind conditions from the southwest (2258) the fire sizes or duration of burning
determines the size of probability shadows resulting from these slower fuel patches. Simulations for 40,000 short duration fires (b) (see fire size in
lower right) produce a relative burn probability surface that contains a ‘‘shadow’’ on the lee-side because some fires are blocked from burning
through the slower fuels. Larger fires (c) and (d) increase the absolute burn probability and the length of the lee-side probability shadow. All
simulations show downwind landscape effects and edge effects on south and west edges of the landscape.

M.A. Finney / Forest Ecology and Management 211 (2005) 97–108102
Fig. 3. Example burn probability simulations using 20,000 fires on a real landscape around Missoula, MT under extreme (98th percentile)
conditions with winds from the southwest. No suppression effects are simulated. Thus, the different fire sizes that result, for example shown as
yellow outlined perimeters (a) are a function of the fuel type, topography, over a fixed time period. The burn probability surface that results from
all fires (b) shows the down-stream effects of faster-burning fuel types as increased probabilities on the northeast sides of the valleys. Fires
starting along the southwest side of the valley create a greater ‘‘fetch’’ for areas to burn down wind.
test these relationships (Malamud et al., 1998;
McKelvey and Busse, 1996) come from such large
geographic areas (e.g. continental scale) that interac-
tions among fires is practically impossible. Further-
more, Reed and McKelvey (2002) point out that these
relationships may not be as universal as once thought.
Theoretical processes that generate fire size distribu-
tions can produce many trends on log–log scales.

M.A. Finney / Forest Ecology and Management 211 (2005) 97–108 103
Fig. 4. Elliptical fires burning under uniform conditions produce radial patterns of fireline intensity and spread rate (A). The variability within
simple fires forms a distribution (B) that shows more area burned by the faster-moving higher-intensity portion of a fire. This illustrates the
potential for different fire effects to occur within burned areas.
3. Fire behavior
Burn probabilities as approximated by the reci-
procal of NFR or by simulation represent a summation
or integration of the distribution of all fire behaviors. A
burn probability is a useful summary of the likelihood
component of a risk analysis but it does not distinguish
the probabilities of different behaviors that are needed
to determine fire effects or value changes. Fireline
intensity (Byram, 1959) is one behavior that deter-
mines crown scorch and ignition of trees (Van Wagner,
1973, 1977). It varies with the spread rate which, in
turn, depends on the fuels, weather, and topography,
and direction of movement (heading, flanking, back-
ing). Relative fire spread direction alters fire behavior
as fires burn in two-dimensions (Catchpole et al.,
1982, 1992). An elliptical fire shape that ideally
evolves under uniform and constant conditions dis-
plays a pattern of fire intensity and spread rate that
varies radially from the ignition point (Fig. 4). Fires
cannot be purely elliptical on complex landscapes, but
this pattern reveals that the relative location of an
ignition point and spread direction of the fire front
determine the spread rate and intensity at each point
on a landscape. Thus, a given point would often
experience fireline intensities from flanking or back-
ing fires with lower intensities than the maximum
intensity of the heading fire.
In an ideal calculation, combinations of all factors
for all ignition points would be combined to produce
a distribution of fire behaviors each summing to the
total burn probability at each point on the landscape.
The brute-force calculation of this distribution is
probably computationally and practically impossible
because of the nearly infinite sequences of weather
and ignition timing and location. Approximations
have, therefore, been attempted by several different
methods. Each method involves assumptions that
affect the distribution of fire behavior and might be
classified as follows:
1. I
gnore fire growth and any spatial/temporalinteractions – calculate probabilities of heading
fire behavior only.
2. S
imulate fire growth only for extreme events whichburn the most area.
3. S
imulate fire growth for all fire events usingaverages of space–time interactions (before calcu-
lations).
The simplest short-cut involves ignoring any spa-
tio-temporal interactions that produce fire growth a-

M.A. Finney / Forest Ecology and Management 211 (2005) 97–108104
cross landscapes and simply calculate heading fire
behavior (i.e. fire behavior potential) for all raster cells
that comprise that landscape. Kafka et al. (2000) e-
xamine two methods for determining fire behavior
potential maps for the range of weather conditions.
One uses actual weather recorded for all days over
many years and the other uses percentile conditions
from a distribution of those observations. Both met-
hods produce a series of maps of fire behavior for the
range of weather conditions. At each point on the
landscape, a distribution of fire behaviors could be
then constructed by taking values from all percentile
maps. These distributions would contain higher pro-
portions of high intensity fires compared to the ideal
distribution because only the heading fire behavior
would be represented.
Another possible short-cut is to use fire simulation
to characterize fire growth and behavior under
relatively short-term extreme events (similar to
Fig. 3). Simulations attempt to represent fire behaviors
by mechanistically incorporating spatial and temporal
factors that produce fire growth and behavior (e.g.
Finney, 1998, 2002), but are not easily validated for
long-duration fires under all possible conditions.
Assuming that simulations are reliable, the exclusion
of all but extreme weather conditions could be justified
in jurisdictions where fire suppression policies are
enforced. This reasoning is implicit in the methods of
simulating burn probabilities by Farris et al. (2000)
and Miller et al. (2000) and shown in Fig. 3. In this
management context, fires escape mainly under
extreme weather and achieve the majority of growth
under those dry and windy conditions even after
becoming large (Graham, 2003). Since weather is the
ultimate arbiter of suppression success on large fires,
some method of determining the distribution of
burning times would also be necessary to regulate
fire sizes, perhaps derived from analysis of extreme
intervals in local weather records (Martell, 1999) or
theoretical considerations (Reed and McKelvey,
2002). Fire simulations under these conditions would
produce distributions of fire intensities at each point
on the landscape. These would likely be skewed
toward the higher intensities because of the restricted
set of weather conditions, but fire growth simula-
tions would generate a range of fire behaviors at each
point because all spread directions are potentially
simulated.
The final class of short-cut methods relies on
statistical averaging to reduce the combinations of
fuels, topography, and weather prior to simulating fire
growth. These have been attempted for one-dimension
(Wiitala and Carlton, 1994) and two-dimensions
(Anderson et al., 1998) for individual fires. In both
cases, it is unknown what the implications are to non-
linear fire behaviors caused by averaging the
environmental inputs over space and time before fire
growth is calculated. In the one-dimensional case,
comparison with observed fire behavior is probably
not possible because the probability of fire movement
cannot be observed. However, the two-dimensional
case can perhaps be compared against the observed
fire growth to give a relative indication of agreement
among all spread directions.
At present, these methods have yet to be rigorously
researched. The author is aware of no published efforts
where short-cut approximations of burn probabilities
or fire behavior distributions have been compared to
either real data (which are probably non-existent) or to
an artificial data set. Thus, a recommendation as to the
most appropriate method must be considered pre-
mature.
4. Fire effects and value changes
A quantitative risk assessment as described by
Eq. (1) for a particular land area requires fire effects
for all values of interest to be evaluated. Ideally, they
must be evaluated using a common currency so that
the relative importance of fire effects on, for example,
ecological and cultural values can be factored into the
expectation across all fire behaviors. Values of human-
created property, for example houses, roads, and
power lines, are easily appraised in terms of
replacement or rehabilitation costs (i.e. money).
However, environmental and ecological effects of
fires are not easily assigned monetary value, even
though the relative changes in appearance or
functioning of ecosystems caused by fire are readily
apparent. Some methods have been applied to
estimating non-market values such as ecological
impacts in terms of cost-benefit analysis and
contingent valuation (Rideout et al., 1999). Yet for
the wide variety of ecological effects, there is a
considerable difference between appraisal of value

M.A. Finney / Forest Ecology and Management 211 (2005) 97–108 105
changes and identification of ecological impacts. The
former is required for risk assessment and requires
values to be assigned, whereas the latter assumes no
requirement that ecological impacts are in fact
important. In other words, dramatic effects may
physically occur and be detectable yet not be valuable.
Alternatively, a risk assessment may be performed
solely for ecological or intangible considerations,
assuming that these have intrinsic values that can be
scaled in some way but which may not be compatible
with economic values and measures. Difficulties will
still arise when separate analyses for the various kinds
of values are combined or interpreted for decision
making and priority setting.
Ecological impacts of some fires are sometimes
labeled as ‘‘uncharacteristic’’ when changes to
vegetation or soils or other ecological attributes are
said to be beyond ranges of historic variability. This is
a difficult determination to make because the spatial
variability within a particular fire must be assessed
against the multivariate nature of the distribution of
fire attributes associated with a reference fire regime.
Satellite maps of fire severity have recently become
useful to provide a comprehensive picture of some
kinds of effects across an entire burned area. One
measure of fire severity is the difference-normalized
burn ration (DNBR: Key and Benson, 1999; Kotliar
et al., 2003), which indicates the changes caused by
the fire to the near infrared reflectance. This measure
of severity is difficult to compare against historic fire
regime data directly. A fire regime, defined as the
spatial and temporal patterns of variation in fire
behaviors and effects (Heinselman, 1981; Agee,
1993), often comes from incomplete and historic
conditions over some reference period. In theory, with
detailed distributions of fire regime components (fire
intervals, sizes, severities, seasons, etc.), severity and
other attributes of a particular fire could be assigned a
probability based on these distributions. The category
of ‘‘uncharacteristic’’ would then be defined below a
low-probability threshold of historical occurrence.
Yet in practice, even a well documented fire regime
typically contains limited estimates mainly of fire
frequency variation, although sometimes fire sizes are
indicated (Swetnam, 1993; Brown et al., 1999;
Niklasson and Granstrom, 2000) and rough categories
of severity. This fire frequency information also
relates to a short time frame compared to the
thousands of years over which fire frequency can
vary in response to climatic and human influences.
The presence of fire-scarred trees from previous
centuries does prove, however, that the fires recorded
by them did not kill them, and thus gives a gross
indication of severity at certain points in space. Large
fires can include contiguous patches of hundreds of
square kilometers of complete mortality which would
be unprecedented within long fire history records
(Graham, 2003) and difficult and expensive to manage
in terms of watershed recovery and forest growth. The
characteristics of these fires, aside from the sheer
measure of size, may warrant the term ‘‘uncharacter-
istic’’.
Values considered in a risk analysis are usually
susceptible, or respond differently, to the range of
possible fire behaviors. For example, fire effects on
homes are probably uniformly negative, with ignition
and burning possible from firebrands and even low
intensity fires (Cohen, 2000).
For some ecological objectives, some fire behaviors
and effects may be desirable for achieving manage-
ment objectives (immediately and for some period into
the future) and some are considered ‘‘characteristic’’
of fire regimes from historical periods. Low-intensity
fires that thin stands of ponderosa pine and reduce
fuels are similar to the majority of fires before the 20th
century (Swetnam and Baisan, 1996; Brown and
Shepperd, 2001). Positive effects such as these are
realized in future years in terms of mitigating effects
of subsequent fires and alleviating the need for
expensive additional fuel treatments. Very often
however, ecological effects of fires may be perfectly
acceptable within an ecological frame of reference yet
be completely incompatible with human values. For
example, crown fires in chaparral shrub lands (Keeley
et al., 1999) and in coastal and subalpine forests
(Agee, 1993) are typical of those fire regimes and plant
communities which may benefit from periodic
renewal or at least not incur lasting negative impacts.
But crown fires near cities or in municipal watersheds
are rarely perceived as acceptable and may destroy or
damage human-managed systems. Regardless of
whether ecological and human values have conflicting
or mutual responses to a given fire, the important
theme for risk assessment is that wildland fires are
inevitable. The ecological consequences of fires and
the susceptibility of human values, however, are not

M.A. Finney / Forest Ecology and Management 211 (2005) 97–108106
inevitable because management activities can be
undertaken to change these outcomes. This suggests
that the most important benefit of a risk assessment
process may be to explicitly recognize the variable
nature of fire behaviors and that social choices can be
made for how to deal with their impacts, whether the
impacts are on houses or on ecosystems.
5. Management options and opportunities
Management actions have the potential to alter the
expected losses as expressed in Eq. (1) by reducing the
susceptibility of the values to negative fire impacts,
increasing the positive results from fire, changing the
probabilities of the fire events, or changing the values
themselves. Managers cannot change weather or
topography, but fuels and values can be modified to
change the burning and loss characteristics at specific
locations as well as across large landscapes.
The hazard or fire behavior distribution for a given
area is partly a function of the combustible materials
located on site. Fuel management activities, thinning
and prescribed burning, have been repeatedly shown
to reduce fire intensities and increase survival of some
forest types (Kallander et al., 1955; Helms, 1979;
Pollet and Omi, 2002). This not only reduces the
negative impacts on those forests but the wildfire itself
may very well provide benefits in the form of
additional fuel management and ecological process.
Structure survival has been shown to be exclusively be
a function of the building materials, maintenance, and
vegetation in the immediate vicinity (Cohen, 2000).
Thus, fuel management at a specific location can be
used to alter the susceptibility of those values to
wildland fire, reducing the expected net value change.
The probability of fire occurrence is affected by
traditional programs in fire prevention (e.g. 10AM
policy), detection, and initial attack responses.
Collectively, these have likely reduced the probability
of a fire burning in any particular year, but
paradoxically increased the severity of fires that
ultimately do occur (Arno et al., 1991). Evidence
exists, however, that fire occurrence may be reduced
by prescribed burning (Kallander et al., 1955; Davis
and Cooper, 1965; Wood, 1982), yet Pye et al. (2003)
found no statistical evidence in Florida that prescribed
fire changed the overall burn probability during
drought conditions. Spatial patterns of fuel treatments
can theoretically alter the movement rate of large fires
(Finney, 2001, 2003). The example in Fig. 2 illustrates
how the movement of fires skews the distribution of
fire behaviors experienced at a given location. By
reducing the overall growth rate of a fire, the
probability is reduced that a fire will impact a given
site in a given time period as a heading fire. Slower
moving fires have reduced intensity and create less
negative net value change for some ecosy-
stem resources as characterized in Eq. (1). If the
active growth of escaped fires is largely determined by
the duration of weather conditions (Reed and
McKelvey, 2002), then slower moving fires are
smaller. This increases the chance that periods of
moderate weather or suppression action can intervene
in fire growth before reaching certain portions of the
landscape.
6. Conclusions
Development of a quantitative risk assessment
procedure is dependent on spatially characterizing fire
probabilities, fire behavior distributions, and value
changes from those fires. Although pieces of this
procedure are possible at present, much work is yet to
be done on simulating or characterizing fire behavior
distributions and probabilities across large landscapes.
Given the difficulty with these calculations, most risk
assessments will likely be driven mainly by the
susceptible values rather than on the probability of fire
behaviors or fire-related loss. Although this procedure
may illustrate the locations of valuable property
relative to hazards and opportunities for land manage-
ment, it does not factor in the likelihood of loss. Thus,
without an expected net value change (Eq. (1)) it is not
possible to estimate the cost-effectiveness of manage-
ment activities that may be proposed for mitigating
potential fire impacts.
References
Agee, J.K., 1993. Fire Ecology of Pacific Northwest Forests. Island
Press, p. 505.
Anderson, K.R., Powell, S., Etches, M., 1998. A Modified Suppres-
sion Response Decision Support System for Wood Buffalo

M.A. Finney / Forest Ecology and Management 211 (2005) 97–108 107
National Park.. In: Proceedings of the Second Symposium on
Fire and For. Meteorol., January 11–16, Phoenix, AZ, pp. 32–37.
Andrews, P.L., Loftsgaarden, D.O., Bradshaw, L.S., 2003. Evalua-
tion of fire danger rating indexes using logistic regression and
percentile analysis. Int. J. Wild. Fire 12, 213–226.
Arno, S.F., Brown, James, K., 1991. Overcoming the paradox in
managing wildland fire. West Wildl. 17 (1), 40–46.
Bachmann, A., Allgower, B., 2000. The need for a consistent
wildfire risk terminology. In: Neuenschwander, L.F., Ryan,
K.C., Gollberg, G.E., Greer, J.D. (Eds.), Proceedings of the
Joint Fire Science Conference and Workshop: Crossing the
Millenium: Integrating Spatial Technologies and Ecological
Principles for a New Age in Fire Management, Boise Idaho,
June 15–17, 1999, University of Idaho, pp. 67–77.
Bradshaw, L.S., Deeming, J.E., Burgan, R.E., Cohen, J.D., compi-
lers. 1984. The 1978 National Fire-Danger Rating System:
technical documentation. Gen. Tech. Re INT-169. Ogden,
UT: U.S. Department of Agriculture, Forest Service, Intermoun-
tain Forest and Range Experiment Station, pp. 44
Brown, P.M., Shepperd, W.D., 2001. Fire history and fire climatol-
ogy along a 58 gradient in latitude in Colorado and Wyoming
USA. Palaeobotanist 50, 133–140.
Brown, P.M., Kaufmann, M.R., Shepperd, W.D., 1999. Long-term,
landscape patterns of past fire events in a montane ponderosa
pine forest of central Colorado. Landsc. Ecol. 14, 513–532.
Byram, 1959. Combustion of forest fuels. In: Davis, K.P. (Ed.),
Forest Fire: Control and Use. McGraw-Hill, New York (Chapter
3).
Cardille, J.A., Ventura, S.J., 2001. Occurrence of wildfire in the
northern Great Lakes Region: effects of land cover and land
ownership assessed at multiple scales. Int. J. Wildl. Fire 10 (2),
145–154.
Catchpole, E.A., de Mestre, N.J., Gill, A.M., 1982. Intensity of fire
at its perimeter. Aust. For. Res. 12, 47–54.
Catchpole, E.A., Alexander, M.E., Gill, A.M., 1992. Elliptical-fire
perimeter- and area-intensity distributions. Can. J. For. Res. 22,
968–972.
Cohen, J.D., 2000. Preventing disaster: home ignitability in the
wildland-urban interface. J. For. 98 (3), 15–21.
Davis, L.S., Cooper, R.W., 1965. How prescribed burning affects
wildfire occurrence. J. For. 61, 915–917.
Erman, D.C., Jones, R., 1996. Fire frequency analysis of Sierra
Forests. IN Sierra Nevadat Ecosystem Project: Final report to
Congress, vol. II: Assessments and scientific basis for manage-
ment options. University of California, Centers for Water and
Wildland Resources, Davis, 1996, pp. 1139–1153.
Farris, C.A., Pezeshki, C., Neuenschwander, L.F., 2000. A compar-
ison of fire probability maps derived from GIS modeling and
direct simulation techniques. In: Neuenschwander, L.F., Ryan,
K.C., Gollberg, G.E., Greer, J.D. (Eds.), Proc. The Joint Fire
Science Conference and Workshop: ‘‘Crossing the Millenium:
Integrating Spatial Technologies and Ecological Principles for a
New Age in Fire Management’’, Boise Idaho, June 15–17, 1999,
University of Idaho, pp. 130–137.
Finney M.A., 1998. FARSITE: Fire Area Simulator – Model
Development and Evaluation. USDA For. Serv. Res. Pa
RMRS-RP-4.
Finney, M.A., 2001. Design of regular landscape fuel treatment
patterns for modifying fire growth and behavior. For. Sci. 47 (2),
219–228.
Finney, M.A., 2002. Fire growth using minimum travel time meth-
ods. Can. J. For. Res. 32 (8), 1420–1424.
Finney, M.A., 2003. Calculating fire spread rates across random
landscapes. Int. J. Wildl. Fire. 12 (2), 167–174.
Garcia Diez, E.L., Rivas Soriano, L., dePablo, F., Garcia Diez, A.,
2000. Prediction of the daily number of forest fires. Int. J. Wildl.
Fire 9 (3), 207–212.
Gill, A.M., Allan, G., Yates, C., 2003. Fire-created patchiness in
Australian savannas. Int. J. Wildl. Fire 12 (4), 323–331.
Graham, R.T., 2003. HaymanFire Case Study. Gen. Tech. Re
RMRS-GTR-114. Ogden, UT, U.S. Department of Agriculture,
Forest Service, Rocky Mountain Research Station.
Harkins, K.C., 2000. The Idaho Panhandle National Forests wildfire
hazard-risk assessment. In: Neuenschwander, L.F., Ryan, K.C.,
Gollberg, G.E., Greer, J.D. (Eds.), Proceedings of the Joint Fire
Science Conference and Workshop: ‘‘Crossing the Millenium:
Integrating Spatial Technologies and Ecological Principles for a
New Age in Fire Management’’, Boise Idaho, June 15–17, 1999,
University of Idaho, pp. 92–100.
Heinselman, M.L., 1973. Fire in the virgin forests of the Boundary
Waters Canoe Area, Minnesota. Quarter. Res. 3, 329–382.
Heinselman, M.L., 1981. Fire intensity and frequency as factors in
the distribution and structure of northern ecosystems. In:
Mooney, H.A., Bonnicksen, T.M., Christiensen, N.L., Lotan,
J.E., Reiners, W.A. (tech. cords). Fire regimes and ecosystem
properties. USDA For. Serv. Gen. Tech. Re WO-26, pp. 7–57.
Helms, J.A., 1979. Positive effects of prescribed burning on wildfire
intensities. Fire Manage. Notes 403, 10–13.
Hesseln, H., Rideout, D.H., 1999. Using control theory to model the
long-term economic effects of wildfire. In: Gonzalez-Caban, A.,
Omi, P.N. (tech. cords.), Proceedings of the Symp. on Fire
Economics, Planning and Policy: Bottom Lines. USDA For.
Serv. Gen. Tech. Re PSW-GTR-173, pp. 107–114.
Kafka, V., Tymstra, C., Hirsch, K., Flannigan, M., 2000. The need
for a consistrent wildfire risk terminology. In: Neuenschwander,
L.F., Ryan, K.C., Gollberg, G.E., Greer, J.D. (Eds.), Proceed-
ings of the Joint Fire Science Conference and Workshop:
‘‘Crossing the Millenium: Integrating Spatial Technologies
and Ecological Principles for a New Age in Fire Management’’,
Boise Idaho, June 15–17, 1999, University of Idaho, pp. 113–
121.
Kallander, H., Weaver, H., Gains, E.M., 1955. Additional informa-
tion on prescribed burning in virgin ponderosa pine in Arizona. J.
For. 53, 662–667.
Keeley, J.E., Fotheringham, C.J., Morais, M., 1999. Reexamining
fire suppression impacts on brushland fire regimes. Science 284,
1829–1832.
Key, C.C., Benson N.C., 1999. The normalized burn ratio (NBR): a
Landsat TM radiometric measure of burn severity. (http://
www.nrmsc.usgs.gov/research/ndbr.htm.)
Kotliar, N.B., Haire, S.L., Key, C.H., 2003. Lessons from the fires of
2000: post-fire heterogeneity in ponderosa pine forests. In: Omi,
P.N., Joyce, L.A. (tech. eds.) 2003. Fire, Fuel Treatments, and
Ecological Restoration: Conference Proceedings; 2002, 16–18

M.A. Finney / Forest Ecology and Management 211 (2005) 97–108108
April; Fort Collins CO. USDA For. Serv, Rocky Mountain
Research Station, Proceedings RMRS-P-29. Fort Collins CO,
pp. 277–280.
Malamud, B.M., Morein, G., Turcote, D.L., 1998. Forest fires: an
example of self-organized critical behavior. Science 281, 1840–
1842.
Martell, D.L., 1999. A Markov chain model of day to day changes in
the Canadian forest fire weather index. Int. J. Wildl. Fire 9 (4),
265–273.
McKelvey, K.S., Busse, K.K., 1996. Twentieth-century fire patterns
on Forest Service Lands. Sierra Nevada Ecosystem Project:
Final report to Congress, vol. II: Assessments and scientific
basis for management options. University of California, Centers
for Water and Wildland Resources, Davis, 1996, pp. 1119–1138.
Miller, C., Landres, P.B., Alaback, P.B., 2000. Evaluating risks and
benefits of wildland fire at landscape scales. In: Neuenschwan-
der, L.F., Ryan, K.C., Gollberg, G.E., Greer, J.D. (Eds.), Pro-
ceedings of the Joint Fire Science Conference and Workshop:
‘‘Crossing the Millenium: Integrating Spatial Technologies and
Ecological Principles for a New Age in Fire Management’’,
Boise Idaho, June 15–17, 1999, University of Idaho, pp. 78–87.
Moritz, M.A., 1997. Analyzing extreme disturbance events: fire in
Los Padres national forest. Ecol. Appl. 7, 1252–1262.
National Interagency Fire Center, 2002. Highlights for the 2002
wildland fire season. Http://www.nifc.gov/fireinfo/2002/sum-
mary.html.
Neuenschwander, L.F., Menakis, J.P., Miller, K.M., Sampson, R.N.,
Hardy, C., Averaill, B., Mask, R., 2000. Indexing Colorado
watersheds to risk of wildfire. J. Sustain. For. 11 (1/2), 35–55.
Niklasson, M., Granstrom, A., 2000. Numbers and sizes of fires:
long term spatially explicit fire history in a Swedish boreal
landscape. Ecology 81, 1484–1499.
Parsons, D.J., van Wagtendonk, J.W., 1996. Fire research and
management in the Sierra Nevada. In: Halvorson, W.L., Da-
vis, G.E. (Eds.), Science and ecosystem management in the
National Parks. Univ. Ariz. Press, Tucson (Chapter 3).
Pollet, J., Omi, P.N., 2002. Effect of thinning and prescribed burning
on crown fire severity in ponderosapine forests. Int. J. Wildl. Fire
11 (1), 1–10.
Pye, J.M., Prestemon, J.P., Butry, D.T., Abt, K.L., 2003. Prescribed
burning and wildfire risk in the 1998 fire season in Florida. In:
Omi, P.N. (Ed). Proceedings of the Fire, Fuel Treatments, and
Ecological Restoration, April 14–17, Ft. Collins CO, USDA For.
Serv. Proceedings RMRS-P-29, pp. 15.
Reed, W.J., McKelvey, K.S., 2002. Power-law behaviour and para-
metric models for the size-distribution of forest fires. Ecol.
Model. 150, 239–254.
Rideout, D.B., Loomis J.B., Omi P.N., 1999. Incorporating non-
market values in fire management planning. In: Gonzalez-
Caban, A., Omi, P.N. (tech. cords.), Proceedings of the Symp.
on Fire Economics, Planning and Policy: Bottom Lines. USDA
For. Serv. Gen. Tech. Re PSW-GTR-173, pp. 217–225.
Rollins, M.G., Swetnam, T.W., Morgan, P., 2001. Evaluating a
century of fire patterns in two Rocky Mountain wilderness areas
using digital fire atlases. Can. J. For. Res. 31, 2107–2123.
Schroeder, M.J., Buck, C.C., 1970. Fire weather. Agriculture
Handbook, 360USDA Forest Service, p. 228.
Schuster, E.G., 1999. Analysis of Forest Service wildland fire
management expenditures: an update. In: Gonzalez-Caban,
A., Omi, P.N. (tech. cords.), Proceedings of the Symp. on Fire
Economics, Planning and Policy: Bottom Lines. USDA For.
Serv. Gen. Tech. Re PSW-GTR-173, pp. 37–50.
Swetnam, T.W., 1993. Fire history and climate change in giant
sequoia groves. Science 262 (5), 885–886.
Swetnam, T.W., Baisan, C.H., 1996. Historical fire regime patterns
in the southwestern United States since D 1700. USDA For. Serv.
Gen. Tech. Re RM-GTR-286, pp. 11–32.
Van Wagner, C.E., 1973. Height of crown scorch in forest fires. Can.
J. For. Res. 3, 373–378.
Van Wagner, C.E., 1977. Conditions for the start and spread of
crownfire. Can. J. For. Res. 7, 23–24.
Van Wagner, C.E., 1988. The historical pattern of annual burned area
in Canada. For. Chron. 64 (3):182–185, 319.
Wiitala, M.R., Carlton, D.W., 1994. Assessing long-term fire move-
ment risk in wilderness fire management. In: Proceedings of the
12th Conference on Fire Forest Meteorology, October 26–28,
Jekyll Island Georgia. Soc. Am. Foresters, Bethesda, MD.
Wiitala, M.R., 1999. Assessing the risk of cumulative burned acre-
age using the Poisson probability model. In: Gonzalez-Caban,
A., Omi, P.N. (tech. cords.), Proceedings of the Symp. on Fire
Economics, Planning and Policy: Bottom Lines. USDA For.
Serv. Gen. Tech. Re PSW-GTR-173, pp. 51–58.
Wood, D.B., 1982. Fuel management’s potential for reducing fre-
quency of large fires in the Northern Rockies. J. For. 105–107.
Related Documents