The Challenge of Energy and Environment in China and the World John P. Holdren Teresa & John Heinz Professor of Environmental Policy John F. Kennedy School of Government Professor of Environmental Science & Policy Department of Earth & Planetary Sciences HARVARD UNIVERSITY Director THE WOODS HOLE RESEARCH CENTER Panel Presentation for the Harvard Alumni

The Challenge of Energy and Environment in China and the World John P. Holdren Teresa & John Heinz Professor of Environmental Policy John F. Kennedy School.
Dec 19, 2015
Welcome message from author
This document is posted to help you gain knowledge. Please leave a comment to let me know what you think about it! Share it to your friends and learn new things together.
Transcript
The Challenge of Energy and Environment in China and the World
John P. Holdren
Teresa & John Heinz Professor of Environmental PolicyJohn F. Kennedy School of Government
Professor of Environmental Science & PolicyDepartment of Earth & Planetary Sciences
HARVARD UNIVERSITY
Director
THE WOODS HOLE RESEARCH CENTER
Panel Presentation for the Harvard Alumni Association Global Series Meeting
Shanghai • 29 March 2008

Why is energy important?
Because…
• meeting basic human needs is important
• economic growth is important,
• the environment is important,
• international relations are important,
and energy is intimately entwined with allfour.
Economically…
• Affordable energy is a crucial ingredient of sustained prosperity & sustainable development.
• Energy is ~10% of GDP, 10% of world trade, and a large part of trade deficits in importing countries
• Costly energy → inflation, recession, frustration of economic aspirations of the poor.
• Investments in energy-supply systems are ~$800 billion/yr worldwide; ~15% of gross domestic investment in developing countries.
Environmentally…
• Energy supply = major contributor to dangerous & difficult environmental problems from local to global
• Specifically, energy supply is the source of
– most indoor and outdoor air pollution, most acid rain
– much of the hydrocarbon and trace-metal pollution of soil and ground water
– almost all of the oil humans add to the ocean
– most radioactive waste
– most of the human emissions of greenhouse gases that are disrupting global climate.
International relations…
• Oil & gas are so important to economies that suppliers can use cut-offs as a weapon, and importers may threaten or wage war to gain or maintain access.
• Spread of nuclear-energy technologies spreads access to nuclear-weapon capabilities
• Energy systems are “force-multiplier” targets for terrorists: dams, nuclear reactors, oil refineries…
• Internal & international tensions & upheavals can result from energy-strategy inadequacies that threaten, create, or perpetuate great economic or environmental harm.
World Energy 1850-2000
050
100150200250300350400450500
1850 1875 1900 1925 1950 1975 2000
Year
EJ/
yea
r
Gas
Oil
Coal
Nuclear
Hydro +
Biomass
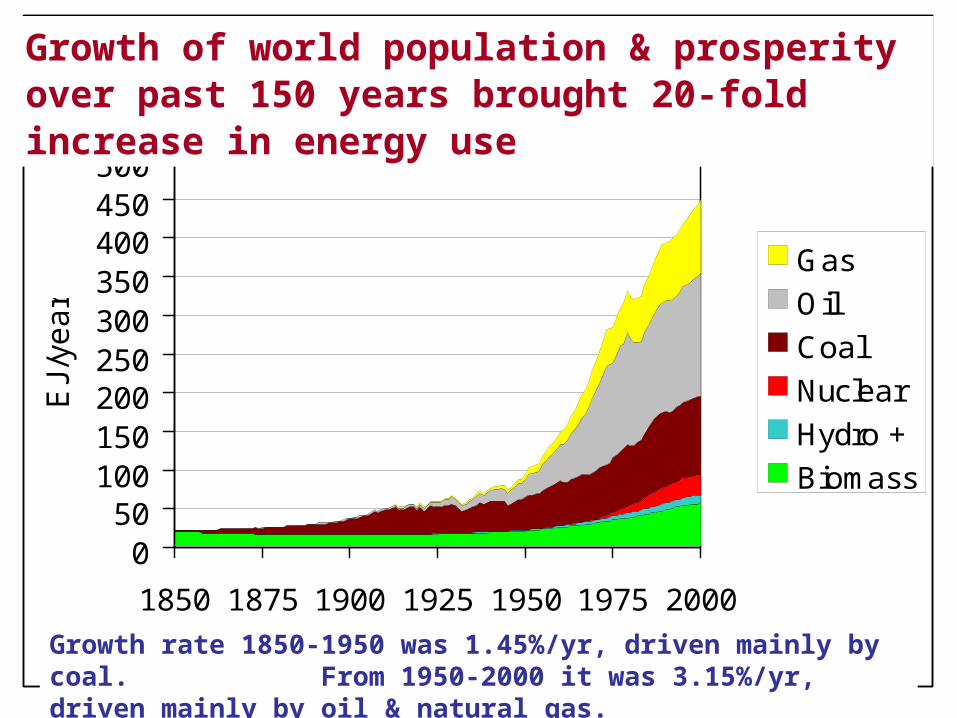
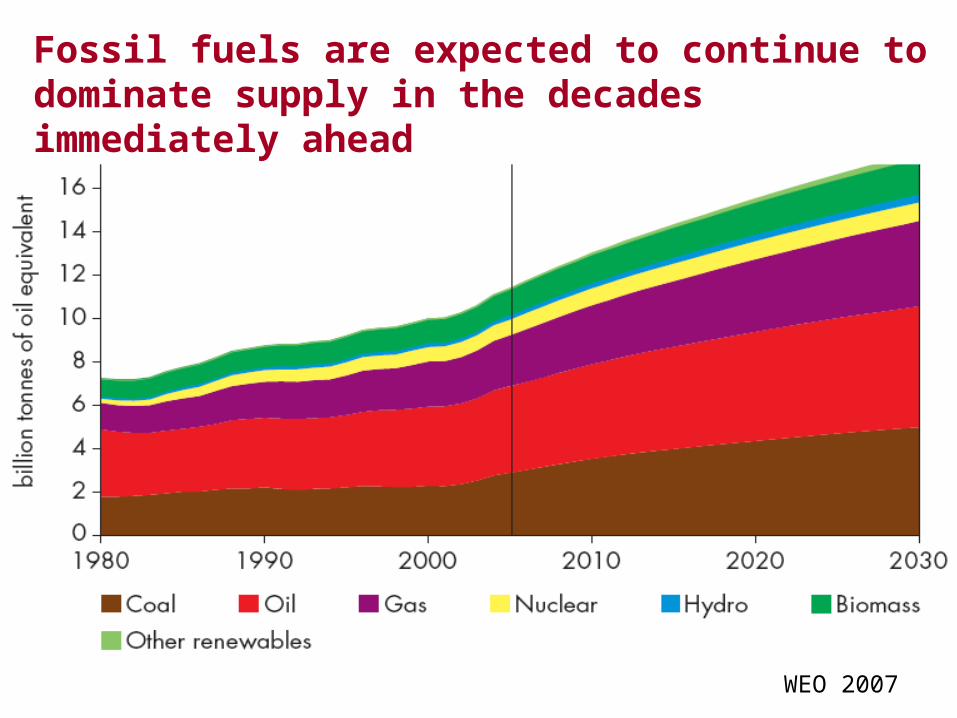
Growth of world population & prosperity over past 150 years brought 20-fold increase in energy use
Growth rate 1850-1950 was 1.45%/yr, driven mainly by coal. From 1950-2000 it was 3.15%/yr, driven mainly by oil & natural gas.

Rapid growth & high fossil-fuel dependence are continuing
Growth rate 2000-2006 averaged 2.7%/yr.
Units are millions of tonnes of oil equivalent

WEO 2007
Much of the growth is in Asia
Bars show role of China & India in growth 2000-2006
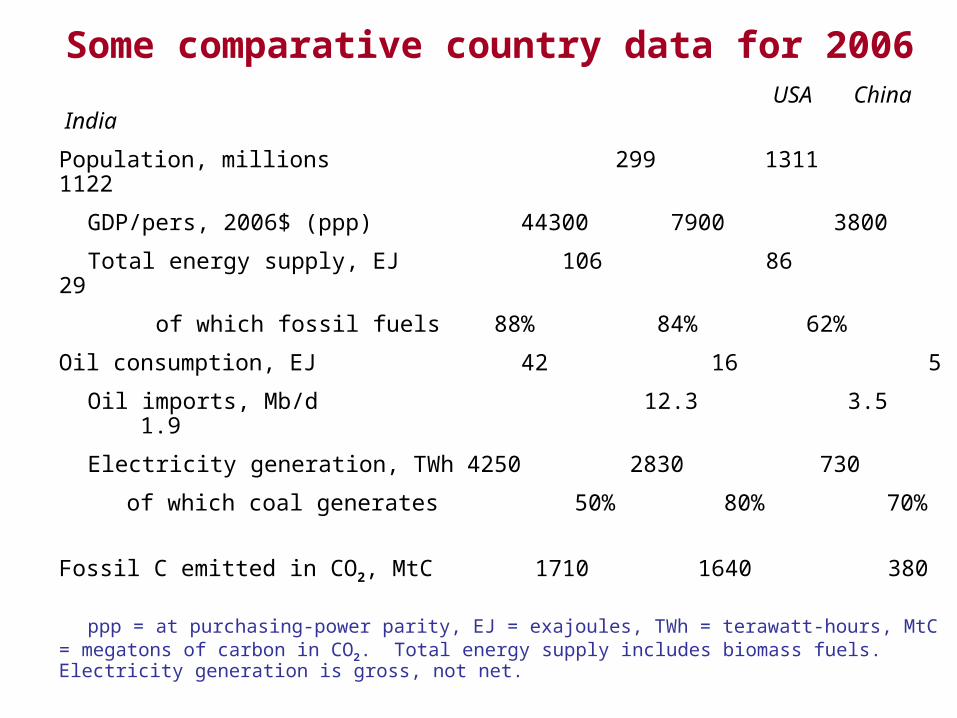
USA China India
Population, millions 299 1311 1122
GDP/pers, 2006$ (ppp) 44300 7900 3800
Total energy supply, EJ 106 86 29
of which fossil fuels 88% 84% 62%
Oil consumption, EJ 42 16 5
Oil imports, Mb/d 12.3 3.5 1.9
Electricity generation, TWh4250 2830 730
of which coal generates 50% 80% 70%
Fossil C emitted in CO2, MtC 1710 1640 380
ppp = at purchasing-power parity, EJ = exajoules, TWh = terawatt-hours, MtC = megatons of carbon in CO2. Total energy supply includes biomass fuels. Electricity generation is gross, not net.
Some comparative country data for 2006

Continued high growth is expected to 2030
2006 2030
Primary energy, exajoules
World 526 800
United States 106 150
China 86 175
Electricity, trillion kWh
World 19.3 35
United States 4.3 6.0
China 2.8 7.5
US EIA 2007 and IEA WEO 2007 “reference” forecasts
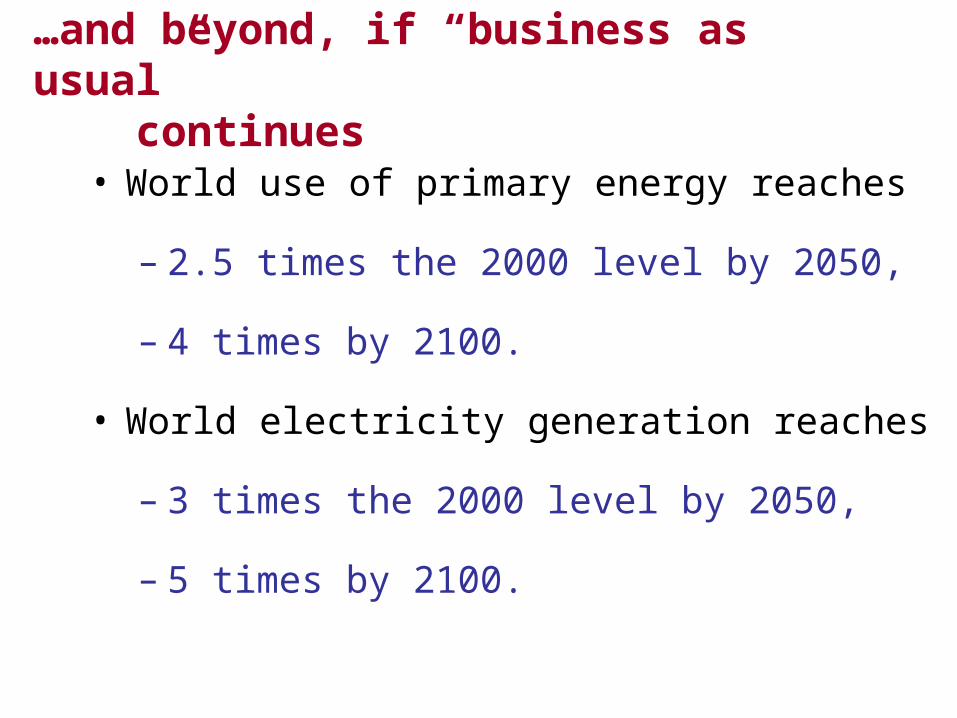
…and beyond, if “business as usual” continues
• World use of primary energy reaches
– 2.5 times the 2000 level by 2050,
– 4 times by 2100.
• World electricity generation reaches
– 3 times the 2000 level by 2050,
– 5 times by 2100.
WEO 2007
Fossil fuels are expected to continue to dominate supply in the decades immediately ahead

WEO 2007
Projected growth of oil use for road transport in Asia is particularly large
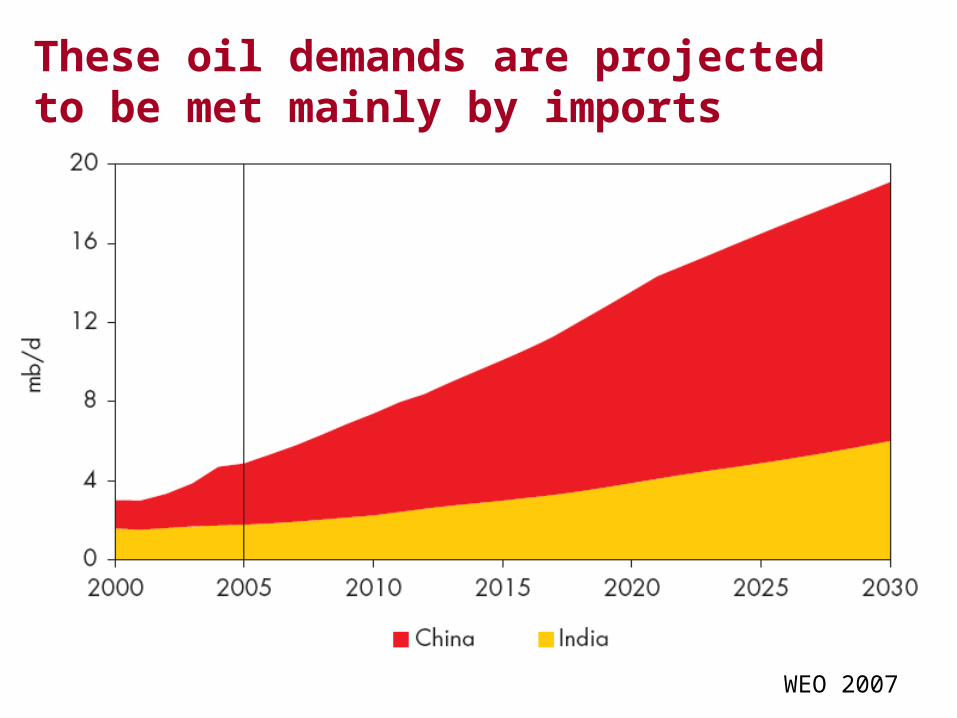
WEO 2007
These oil demands are projected to be met mainly by imports
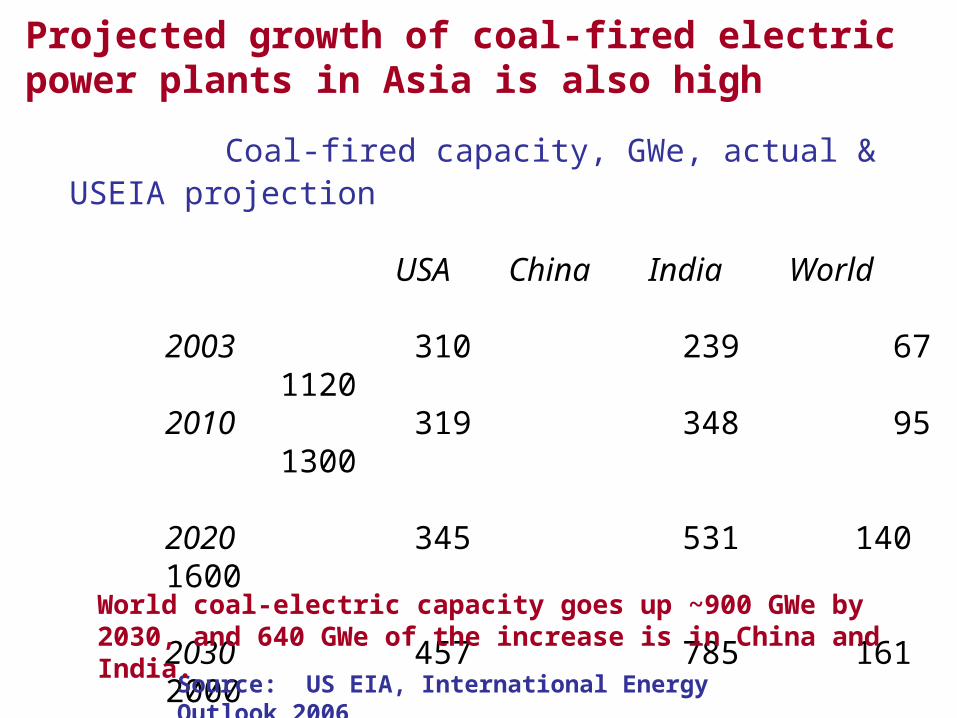
Projected growth of coal-fired electric power plants in Asia is also high
Coal-fired capacity, GWe, actual & USEIA projection
USA China India World
2003 310 239 67 1120 2010 319 348 95 1300
2020 345 531 140 1600
2030 457 785 161 2000
Source: US EIA, International Energy Outlook 2006
World coal-electric capacity goes up ~900 GWe by 2030, and 640 GWe of the increase is in China and India.
High fossil-fuel dependence already causes big problems for Asia and the world
• Increasing dependence on imported oil & natural gas means economic vulnerability, as well as international tensions and potential for conflict over access & terms.
• Coal burning for electricity and industry and oil burning in vehicles are main sources of severe urban and regional air pollution – SOx, NOx, hydrocarbons, soot – with big impacts
on public health, acid precipitation.
• Emissions of CO2 from ALL fossil-fuel burning are largest
driver of global climate disruption, already associated with increasing harm to human well-being and rapidly becoming more severe.
The oil market, pollutant transport, & climate are global. Each country is affected by what other countries do.
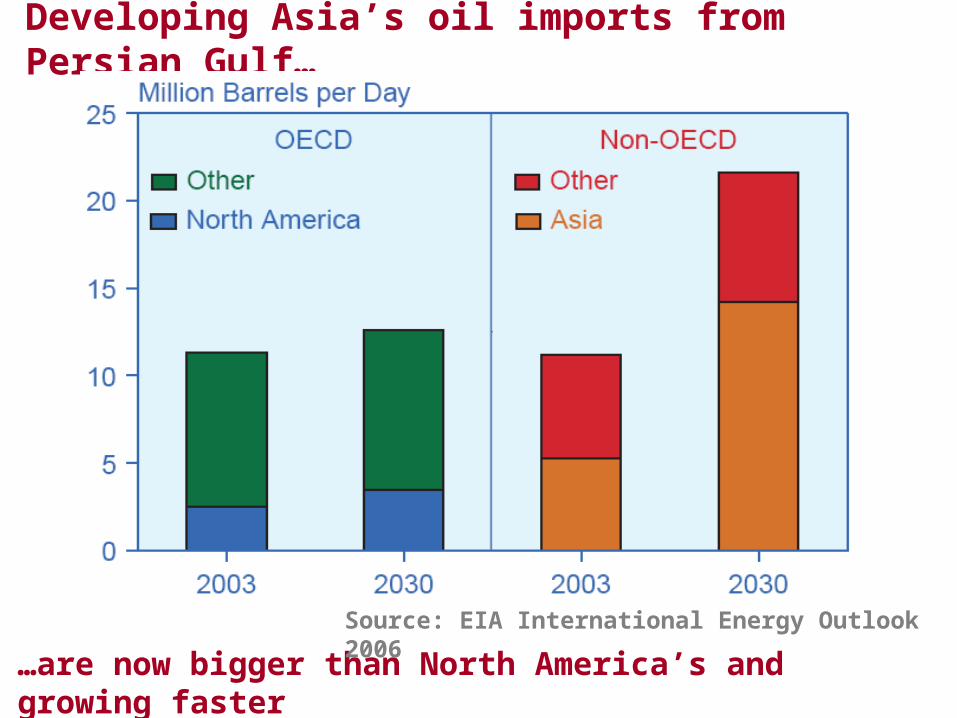
Developing Asia’s oil imports from Persian Gulf…
…are now bigger than North America’s and growing faster
Source: EIA International Energy Outlook 2006
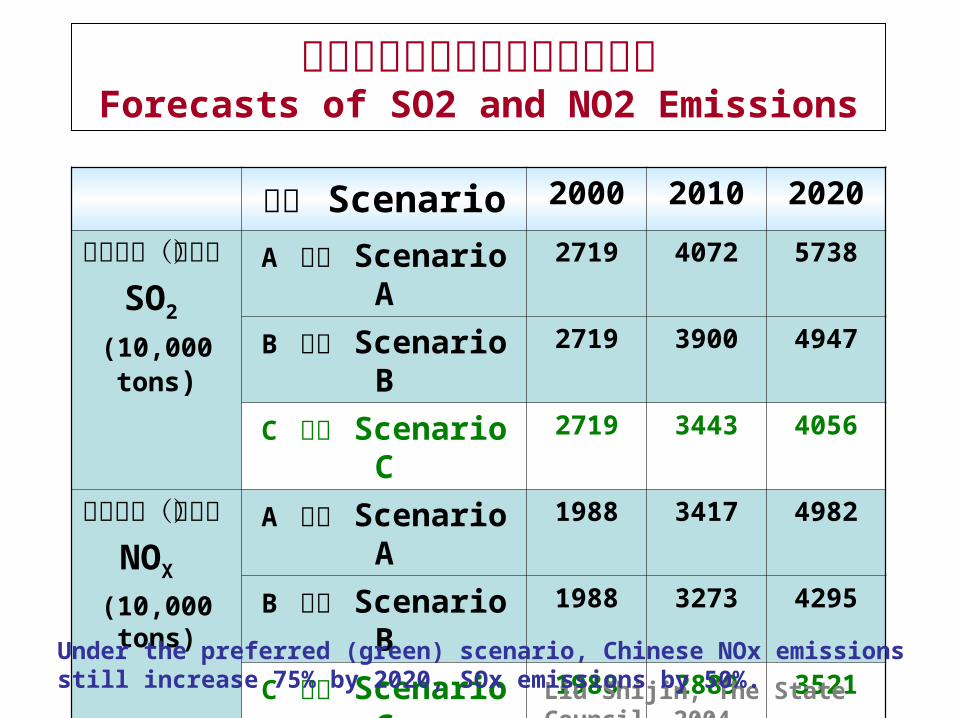
二氧化硫和氮氧化物产生量预测Forecasts of SO2 and NO2 Emissions
情景 Scenario 2000 2010 2020
二氧化硫(万吨)
SO2
(10,000 tons)
A 情景 Scenario A 2719 4072 5738
B 情景 Scenario B 2719 3900 4947
C 情景 Scenario C 2719 3443 4056
氮氧化物(万吨)
NOX (10,000 tons)
A 情景 Scenario A 1988 3417 4982
B 情景 Scenario B 1988 3273 4295
C 情景 Scenario C 1988 2889 3521
Liu Shijin, The State Council, 2004
Under the preferred (green) scenario, Chinese NOx emissions still increase 75% by 2020, SOx emissions by 50%.

Health Costs from Particulate Pollution in China
Source: Clear Water, Blue Skies; China’s Environment in the New Century, World Bank, 1997.

Wet and dry reactive nitrogen deposition from the atmosphere, early 1990s and projected for 2050
Acid precipitation under BAU growth

China passes USA as biggest CO2 emitter in 2007
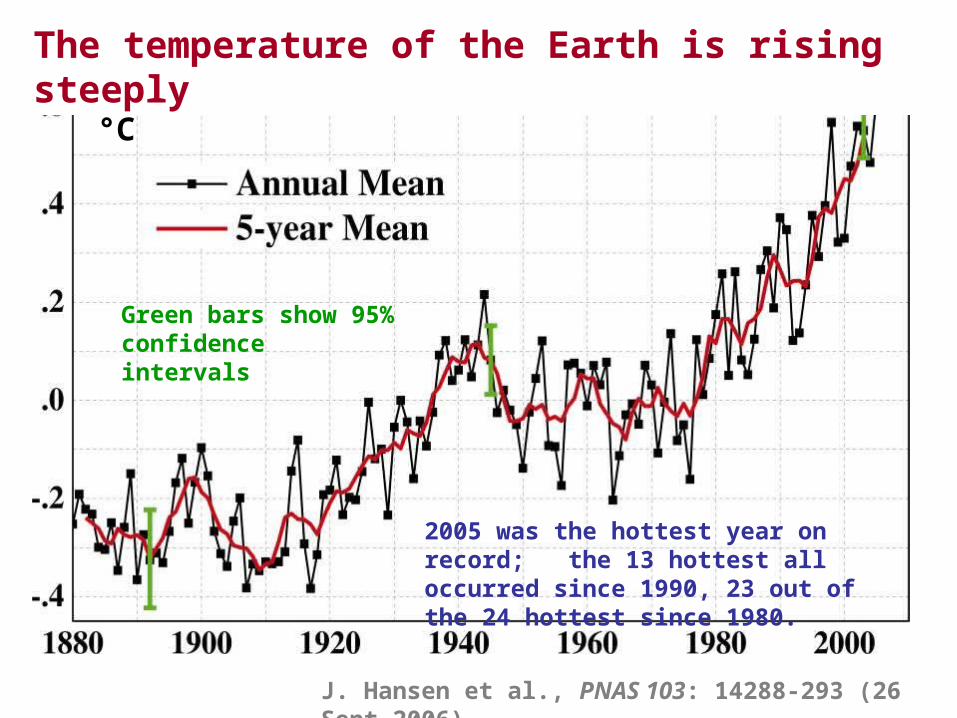
2005 was the hottest year on record; the 13 hottest all occurred since 1990, 23 out of the 24 hottest since 1980.
J. Hansen et al., PNAS 103: 14288-293 (26 Sept 2006)
Green bars show 95% confidence intervals
The temperature of the Earth is rising steeply
°C

Year
1965 1970 1975 1980 1985 1990 1995 2000 2005
Mea
n w
ind
spee
d (m
/s)
2.0
2.1
2.2
2.3
2.4
2.5
2.6
2.7
2.8
Win
dy d
ays
with
dai
ly m
ean
win
d sp
eed
>5m
/s (
day)
15
20
25
30
35
40
45
Y = -0.02161X + 45.275(R2 = 0.94, p < 0.001)
wind speed
windy days
Y = -0.8022X + 1620.66(R2 = 0.95, p < 0.001)
Qi Ye, Tsinghua University, May 2006
Predicted by climate models, this change has produced increased flooding in the South of China and increased drought in the North.
This climatic disruption is already harmfulWeakening of the East Asia Monsoon is an example
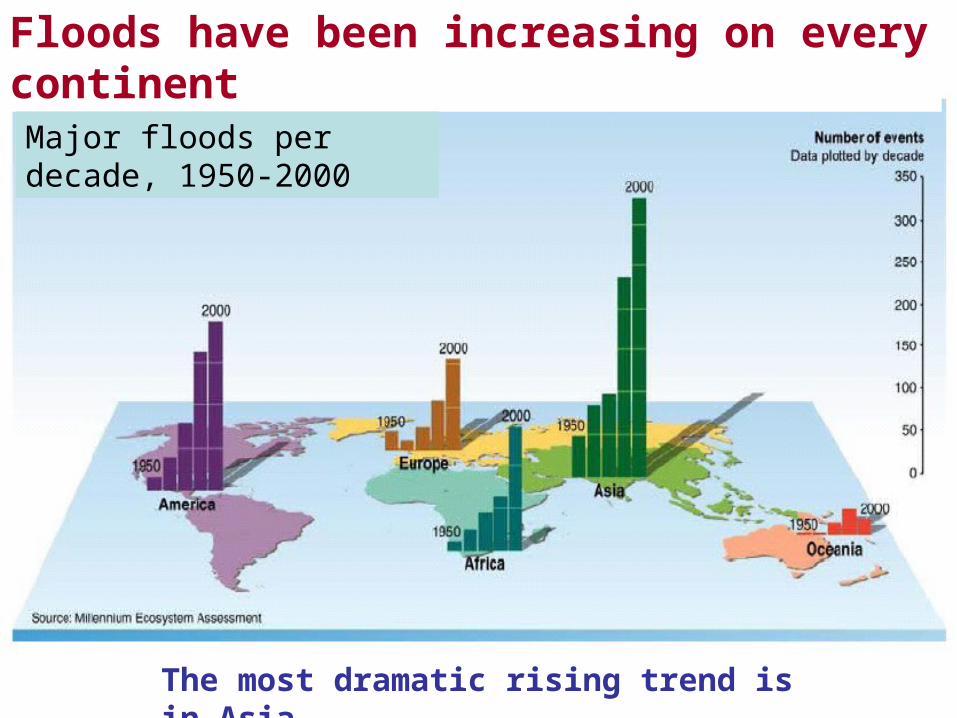
The most dramatic rising trend is in Asia.
Floods have been increasing on every continentMajor floods per decade, 1950-2000
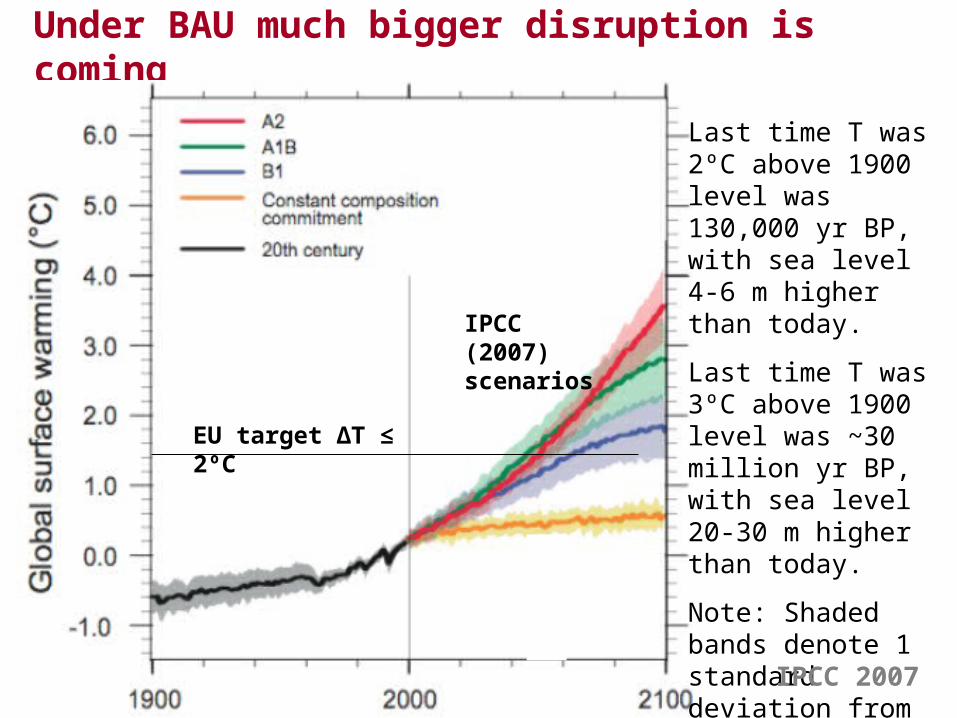
Under BAU much bigger disruption is coming
Last time T was 2ºC above 1900 level was 130,000 yr BP, with sea level 4-6 m higher than today.
Last time T was 3ºC above 1900 level was ~30 million yr BP, with sea level 20-30 m higher than today.
Note: Shaded bands denote 1 standard deviation from mean in ensembles of model runs
IPCC 2007
EU target ∆T ≤ 2ºC
IPCC (2007) scenarios

Path for 50% chance of avoiding ∆Tavg >2°C (gold) is much more
demanding than path for 50% chance of avoiding >3°C (green).
BAU ( 6°C+)
(~3°C)
(~2°C)
Stabilizing CO2 concentration to limit T increase
requires big emissions reductions from BAU

Solutions: better technologies are key
ONLY WITH IMPROVED TECHNOLOGIES CAN WE
• limit oil imports & oil dependence overall without incurring excessive economic or environmental costs
• improve urban air quality while meeting growing demand for automobiles
• use the world’s abundant coal resources without intolerable impacts on regional air quality, acid rain, and global climate
• expand the use of nuclear energy enough to make a difference for climate change and oil & gas dependence, while still reducing accident/terrorism & proliferation risks
Needed new or improved technologies
• Cleaner, more fuel-efficient motor vehicles: hybrids (diesels, plug-in hybrids)
• More energy-efficient commercial & residential buildings
• Fuel- and electricity-efficient manufacturing• Improved coal technologies to make electricity &
hydrogen with CO2 capture & storage
• Advanced nuclear reactors with increased safety and proliferation-resistant fuel cycles
• Biofuels that don’t compete with food & forests• Cheaper photovoltaic cells
Policy innovation is needed in order to…• provide the scale, continuity, & coordination of effort in
energy research & development needed to realize in a timely way the required technological innovations
• get the benefits of market competition in the electricity sector while protecting public goods (provision of basic energy services to the poor, preservation of adequate system reliability, protection of environment)
• ensure the rapid diffusion of cleaner and more efficient energy technologies across the least developed countries and sectors
• devise and implement an equitable, adequate, and achievable cooperative framework for limiting global emissions of greenhouse gases

Asia’s role in solutions
• Good education system, high production of scientists & engineers, & business environment favor rapid innovation.
• Asia’s growing role in global energy-environment problems means USA & Europe want to cooperate with Asia to solve these problems (e.g., cost-sharing, technology transfer).
• High growth rate of Asian economies allows for dominance of new, efficient technologies & infrastructure over old, inefficient ones.
• This and other factors position Asia to be a world leader in renewable energy, energy efficiency, clean coal.
• Underdeveloped rural regions in Asia provide opportunity to plan & build new resource-conserving towns.

Thank you!
Related Documents