THE CENTRE FOR MARKET AND PUBLIC ORGANISATION Centre for Market and Public Organisation University of Bristol 2 Priory Road Bristol BS8 1TX http://www.bristol.ac.uk/cmpo/ Tel: (0117) 33 10952 Fax: (0117) 33 10705 E-mail: [email protected] The Centre for Market and Public Organisation (CMPO) is a leading research centre, combining expertise in economics, geography and law. Our objective is to study the intersection between the public and private sectors of the economy, and in particular to understand the right way to organise and deliver public services. The Centre aims to develop research, contribute to the public debate and inform policy-making. CMPO, now an ESRC Research Centre was established in 1998 with two large grants from The Leverhulme Trust. In 2004 we were awarded ESRC Research Centre status, and CMPO now combines core funding from both the ESRC and the Trust. ISSN 1473-625X Does quality affect patients’ choice of doctor? Evidence from the UK Rita Santos, Hugh Gravelle and Carol Propper July 2013 Working Paper No. 13/306

Welcome message from author
This document is posted to help you gain knowledge. Please leave a comment to let me know what you think about it! Share it to your friends and learn new things together.
Transcript

THE CENTRE FOR MARKET AND PUBLIC ORGANISATION
Centre for Market and Public Organisation University of Bristol
2 Priory Road Bristol BS8 1TX
http://www.bristol.ac.uk/cmpo/
Tel: (0117) 33 10952 Fax: (0117) 33 10705
E-mail: [email protected]
The Centre for Market and Public Organisation (CMPO) is a leading research centre, combining expertise in economics, geography and law. Our objective is to study the intersection between the public and private sectors of the economy, and in particular to understand the right way to organise and deliver public services. The Centre aims to develop research, contribute to the public debate and inform policy-making.
CMPO, now an ESRC Research Centre was established in 1998 with two large grants from The Leverhulme Trust. In 2004 we were awarded ESRC Research Centre status, and CMPO now combines core funding from both the ESRC and the Trust.
ISSN 1473-625X
Does quality affect patients’ choice of doctor? Evidence from the UK
Rita Santos, Hugh Gravelle and Carol Propper
July 2013
Working Paper No. 13/306

CMPO Working Paper Series No. 13/306
Does Quality Affect Patients’ Choice of Doctor? Evidence from the UK
Rita Santos1, Hugh Gravelle1 and Carol Propper2
1 Centre for Health Economics, University of York, UK
2 Imperial College, London, University of Bristol and CEPR, UK
July 2013
Abstract Provider competition is a currently popular healthcare reform model. A necessary condition for greater competition to improve quality is that providers will face higher demand if they improve their quality. We test this crucial assumption in an important part of the health care market using data on the choices made by 3.4 million English patients from amongst nearly 1000 family doctor practices. We find that patients do respond to quality: a one standard deviation increase in a publicly available measure of clinical quality would increase the number of patients a practice would attract by around 15%. Keywords: Quality; demand; healthcare; choice; competition; family practice JEL Classification: I11, I18 Electronic version: www.bristol.ac.uk/cmpo/publications/papers/2013/wp306.pdf Acknowledgements Hugh Gravelle and Rita Santos were funded by a grant from the Department of Health to the Policy Research Unit in the Economics of Health and Social Care Systems. Carol Propper was funded by the Economic and Social Research Council under the ESRC Centre Grant to CMPO at the University of Bristol. The views expressed are those of the authors and not necessarily those of the funders. We thank Mark Dusheiko and Mark Harrison for assistance and advice on data. We are grateful for comments from Maria Goddard, David Johnson, Tony Scott, Peter Sivey, Mike Shields, and from seminar participants at Melbourne Institute for Social and Economic Research, the University of York, and at the Health Economists’ Study Group. Address for correspondence CMPO University of Bristol 2 Priory Road Bristol BS8 1TX [email protected] www.bristol.ac.uk/cmpo/
Quality and choice of GP EJ submission 14 06 13 26/06/2013 16:00
Does quality affect patients’ choice of doctor? Evidence from the UK
Rita Santos* Hugh Gravelle* Carol Propper**
Abstract Provider competition is a currently popular healthcare reform model. A necessary condition for greater competition to improve quality is that providers will face higher demand if they improve their quality. We test this crucial assumption in an important part of the health care market using data on the choices made by 3.4 million English patients from amongst nearly 1000 family doctor practices. We find that patients do respond to quality: a one standard deviation increase in a publicly available measure of clinical quality would increase the number of patients a practice would attract by around 15%. JEL Nos: I11, I18 Keywords: Quality; demand; healthcare; choice; competition; family practice Acknowledgements. HG and RS were funded by a grant from the Department of Health to the Policy Research Unit in the Economics of Health and Social Care Systems. CP was funded by the Economic and Social Research Council under the ESRC Centre Grant to CMPO at the University of Bristol. The views expressed are those of the authors and not necessarily those of the funders. We thank Mark Dusheiko and Mark Harrison for assistance and advice on data. We are grateful for comments from David Johnson, Tony Scott, Peter Sivey, Mike Shields, and from seminar participants at Melbourne Institute for Social and Economic Research, the University of York, and at the Health Economists’ Study Group. * Economics of Social and Health Care Research Unit, Centre for Health Economics, University of York ** Imperial College, London, University of Bristol and CEPR
1

1 Introduction Governments facing fiscal pressure have increasingly turned to proposals to create or enhance
consumer choice for public services e.g. Besley and Ghatak (2003), Hoxby (2003), Le Grand
(2003). In health care, choice is a popular reform model adopted by administrations of
different political orientations in many countries, including the US, the UK, Denmark, Italy
(Lombardy), the Netherlands, Germany and Sweden. The belief is that by increasing choice
for patients, providers of care will become more responsive to patient demand which, in turn,
will drive greater efficiency in delivery and funding. But such reforms have been
controversial and whether enhanced patient choice will make care providers more responsive
to quality is not well established. Consumers may lack information about medical care
providers, and measures of quality may be noisy and difficult for them to interpret.
More generally, a necessary condition for greater competition to improve quality is that a
provider will face higher demand if they improve their quality. Thus one approach to the
issue of whether competition promotes quality is to test the crucial assumption that quality
affects demand. This is what we do in this paper. We examine whether health care
consumers in England respond to differences in quality when they make their choice of
family doctor. England is an excellent “test bed”. First, all individuals in the UK are entitled
to choose a family doctor practice and need to do so, as family doctors both provide almost
all primary care and are also the gatekeepers for any specialist or hospital care the individual
may need. Second, care is tax funded and free at point of use, so price plays no role in
choice. Third, an important major strand in government policy in England has been the
promotion of competition both amongst hospitals and family doctors and to make this policy
work the government has actively promoted the provision of information on the performance
of medical providers to the public. Fourth, the UK has been a world leader in the
development of quality indicators for primary care which are both publicly available and are
salient to family doctors as their performance on these indicators is used in pay-for-
performance contracts that accounts for over 20% of their average total remuneration.
Despite the fact that a patient’s choice of their doctor could be critical to their health and
wellbeing, there are few studies of the effects of quality on patient choice of family doctors.
One reason for this is that good measures of physician quality are rarely publicly available.
We exploit the availability of such data in England. We use data on the choices made by 3.4
2

million patients from amongst nearly 1000 family doctor practices to estimate the
determinants of choice and, in particular, to test whether quality affects choice. Our data
contain information on the distances from patients to potential practices and a rich set of
measures of practice quality, some of which are published and observable by patients, as well
as characteristics of the practice which have been shown to influence choice of patients,
including age and gender of the family doctors in the practice, their country of qualification,
and the type of contract the practice has with the NHS.1
We find that patients are more likely to choose practices which are of higher quality as
measured by the publicly available data on practice performance. The positive effect of
clinical quality on choice is robust across patient age and gender groups, to patient
socioeconomic characteristics, to allowing for unobserved heterogeneity in patient
preferences, and to the potential endogeneity of the clinical quality measure. In addition,
patient choice is more responsive to published than unpublished measures of quality. We also
find, as expected given that most primary healthcare requires patients to attend their practice,
that patients’ valuation of practices decreases with distance from their home. Patients are also
likely to choose practices which have a higher proportion of GPs qualified in Europe, a
higher proportion of female GPs, and a lower average GP age.
This responsiveness of choice to practice quality is economically meaningful as well as
statistically significant. Using our most conservative estimates of the effect of quality on
choice, the average marginal effect of an increase of one standard deviation in measured
quality is to increase the probability of a practice being chosen by a patient by 0.0083. In
terms of the metric of distance, the average patient would be willing travel an additional 125
metres to join a practice with one standard deviation higher clinical quality. These results
might appear to suggest a small influence of quality on the choices of individual patients.
However, the relevant effect for assessing the potential incentive for practices to improve
quality is the increase in the number of patients who wish to join a practice when its quality
increases. This depends on the effect of quality on the probability that a patient will choose a
practice and on the number of patients who would consider choosing the practice. In our data
1 Our measures of practice quality are discussed in detail in Section 3.3, but include summary measures derived from the Quality and Outcomes Framework (QOF) which records and rewards practice performance on a large set of clinical and administrative quality indicators, the rate of emergency admissions for ambulatory care sensitive conditions, and average patient satisfaction with the practice.
3

set there are on average over 25,000 potential patients within 2km of a practice. We estimate
that an increase of one standard deviation in clinical quality will increase the number of
patients over the age of 24 choosing a practice by just over 1000, an increase of around 15
percent.
Our results contribute to the literature on choice and competition in health care. The
theoretical literature is generally supportive of the proposition that greater competition
improves quality if prices are regulated (Gaynor, 2006).2 Most empirical studies find that
when providers face fixed prices greater competition is associated with higher quality (see
Gaynor and Town (2012) and Gravelle et al (2012) for reviews. For England, Cooper et al,
(2011) and Gaynor et al, (forthcoming) provide evidence for a positive impact of the pro-
competitive policy that operated post-2006 for hospitals. Studies of patient choice of hospital
in the US (Burns and Wholey, 1992; Cutler et al, 2004; Ho, 2006; Howard, 2005; Luft et al,
1990; Pope, 2009; Tay, 2003), the Netherlands (Varkevisser et al, 2012), Italy (Moscone et
al, 2012), and in England (Beckert et al, 2012; Gaynor et al, 2012; Sivey, 2011) find that
higher hospital quality increases demand. But there are very few studies of the determinants
of quality on patient choice of family doctors. This is primarily because measures of quality
are rarely publicly available. Research to date has tended to focus on other attributes of care
or proxies for quality. For example, studies have shown the importance of distance (for the
UK, Salisbury, 1989; Billinghurst and Whitfield, 1993; Dixon et al, 1997; McLean and
Sutton, 2005; for Norway, Godager, 2009), other aspects of accessibility such as opening
hours) (e.g. Dixon et al, 1997) and attributes of the doctor such as age, gender and ethnicity
(e.g. Godager 2009).3 In the absence of any measures of clinical quality such attributes may
be used by consumers as signals of a better match and so higher quality. Stated preference
studies have shown that, hypothetically, patients are willing to trade-off measures of
consultation quality, thoroughness of physical examinations and the GP's knowledge of the
patient against the accessibility of the consultation and waiting times for appointments
(Cheraghi-Sohi, 2008; Scott and Vick, 1999; Vick and Scott, 1998). Revealed preference
2 There are caveats about the role of imperfect information and the required assumptions about provider cost functions and patient prefrences (Brekke, et al, 2010; Gravelle, 1999; Gravelle and Masiero, 2000; Karlsson, 2007; Gravelle et 2012; Halonen and Propper, 2012). 3 Studies of Australian GPs, where GPs are paid by fee for service and GPs’ prices for consultations are not regulated, find that GPs in areas with less competition (whether measured by distance to other GPs or by GPs per capita) charge higher prices (Gravelle et al, 2013; McCrae, 2009; Richardson et al, 2006; Savage and Jones, 2004).
4
evidence on the relationship between choice of practice and proxies for quality is more mixed
(e.g McLean and Sutton, 2005), though recent studies following the introduction of a list
system in Norway have found evidence of small positive responses to factors such as practice
mortality rates and the volume of services provided (Iversen and Luras 2011, Biorn and
Godager 2010). Finally, Pike (2010) examines the cross sectional association between
competition between general practices and quality and finds that practices with more rivals
within 500m have higher quality (as measured by patient satisfaction and a measure of
clinical care).
More broadly, our paper contributes to the literature on whether choice based reforms will
provide incentives for firms to increase quality. There has been a great deal of interest in
recent years in competition in education, both theoretically and empirically (e.g., Epple and
Romano 1998; Hoxby 2000; Epple, Figlio, and Romano 2004). In this literature, as in health,
the predictions from theoretical models are often ambiguous and the empirical evidence quite
contested (Hoxby 2000; Rothstein 2007; Bayer and McMillan 2005; Burgess, Propper and
Wilson 2005). Our results thus add to the evidence on the conditions under which gains from
consumer choice in the provision of public services may be realized.
2 Institutional setting To receive primary medical care in the British National Health Service (NHS) patients must
register with a general (family) practice, which also acts as a gatekeeper for elective hospital
care. The NHS is financed almost entirely from general taxation and patients face no charges
for NHS health care, apart from a small charge for dispensed medicines.
General practitioners (GPs) are not employees of the NHS, apart from a small proportion
directly employed by local primary care organisations (Primary Care Trusts - PCTs). GPs are
organised in general practices, most of which are limited liability partnerships owned by the
GPs. The NHS contracts with the general practices, not with the individual GPs. English
practices have on average 4.2 general practitioners (GPs) and around 6,600 patients
(Information Centre, 2011).
Practice contracts with the NHS to supply services to patients are of two types. Just over half
of general practices have the General Medical Services (GMS) contract whose terms are set
5
by national negotiations between the NHS and the British Medical Association (the doctors’
trade union). GMS practices are paid a mixture of lump sums, capitation, quality incentive
payments, and items of service. Around 80% of practice revenue varies with the number of
patients on the practice revenue. Most of practice revenue (over 60%) is generated by
capitation payments which are determined by a national formula which takes account of the
demographic mix of practice patients and local morbidity measures. Quality incentives from
the Quality and Outcomes Framework (QOF) (Roland, 2004) generate over 20% of practice
revenue. For a given quality level, QOF revenue increases with the number of patients.
Practice payments for vaccinating and screening specified target proportions of the relevant
practice population also increase with the total list. Practices are reimbursed for the costs of
their premises but have to fund all other expenses, such as hiring practice nurses and clerical
staff, from their revenue.
Around 48% of practices are paid under a Primary Medical Services (PMS) contract. These
contracts are negotiated between the practice and their local PCT. Under the PMS contract,
the practice receives a lump sum in exchange for agreeing to provide similar services to those
required under the GMS contract, plus additional services for particular patient groups. The
amount received is typically the amount the practice would have received under GMS, plus
an addition intended to cover the cost of the extra services. PMS practices also receive QOF
payments, though they are paid less than GMS practices for the same quality achievement
because some of the QOF payments relate to activities which are also paid for directly under
PMS contracts. As under GMS, the practice has to meet its expenses from its revenue.
One of the strands in policy in the English National Health Service (NHS) in recent years has
been the promotion of competition amongst hospitals in the secondary care sector and
amongst general practices in primary medical care. In general practice the national body
which controlled entry of new practices was abolished in 2002 and the Department of Health
(DH) introduced a tendering process to make it easier for new practices to be established,
especially in under-doctored areas (Department of Health, 2006). Patients are to be given the
right to register with any practice in England (Department of Health, 2010). A website, NHS
Choices, has been set up by the DH containing information on the characteristics of practices,
6

such as the clinics they offer and their performance under the national quality incentive
(QOF) scheme and results from patient satisfaction surveys.4
The method of payment for practices ensures that, whether they have GMS or PMS contracts,
their revenue will increase with the number of patients. The question we address is whether
practices can attract more patients by improving their quality.
3 Data We construct a rich data set on patients and practices by linking a number of NHS
administrative data sets (Attribution Data Set, General Medical Statistics, Quality and
Outcomes Framework, Hospital Episode Statistics) with small area census and socio-
economic data from Neighbourhood Statistics. Sources are in Table A1.
3.1 Patients
The Attribution Data Set (ADS) contains, for each administratively defined homogenous
small geographical area in England (known as a Lower Super Output Area, LSOA), the
number of patients by age/sex band who are registered with each general practice at 1 April
2010. There are 32,482 LSOAs in England, with a minimum population of 1000 and a mean
population of 1500.5
To reduce computational burden we limit our analysis to the choice of practice by patients
resident in one of 10 geographically defined Strategic Health Authorities (SHAs) in England.
We selected the East Midlands SHA which contains 2875 LSOAs. It has a mixture of
densely populated urban areas and rural areas, has an ethnically diverse population allowing
investigation of the effects of ethnicity and other socio-economic characteristics on patients’
tastes for practice characteristics, and it is far from the English-Welsh and English-Scottish
4 http://www.nhs.uk/choiceintheNHS/Yourchoices/GPchoice/Pages/ChoosingaGP.aspx. Detailed information on performance of practices in an area under the national P4P scheme is also available via http://www.qof.ic.nhs.uk/search/ and information on patient satisfaction survey in http://www.gp-patient.co.uk/info/ 5 On average over England the population registered with general practices is about 7% greater than estimates of the population derived from the decennial population census (Ashworth et al, 2005). The difference is due to lags in the updating of patient registration data when patients die or change practice. Since general practices are paid according to their registered lists it is appropriate to model the determinants of the number of patients registered with practices as we wish to examine whether practices are paid more, via larger lists, when their quality is greater.
7

borders so that we do not have to drop any LSOAs whose patients are registered in Welsh or
Scottish practices whose characteristics we do not observe.6
We exclude practice registrations of children because their choices are made by their parents
and we cannot distinguish in our data between patients with and without children. We also
exclude patients aged 18-24 because students in post-secondary education may continue to be
registered at their parents’ general practice despite living away from home. We therefore
analyse the choice of practice by the 3.372M individuals in the East Midlands SHA who are
aged 25 and over.
The ADS data contain age (in bands) and gender of each patient. We attribute socio-
economic characteristics to patients by their LSOA of residence. The characteristics we
include are the proportion of the LSOA who are income deprived (defined as receiving
income related social security benefits), the proportion of adults with no formal educational
qualifications, the proportion who report themselves as being in fair or good, rather than
poor, self rated health, and the proportion who are of Asian ethnicity. We also categorise an
LSOA as urban or rural. These patient and small area level variables allow us to examine
whether different types of patient have different preferences over practice characteristics.
3.2 Practice characteristics
We use data from the General Medical Services census (taken on 30 September 2010 and
2009) to measure the average age of GPs, the proportion of female GPs, the proportion of
GPs qualified in the UK, in Europe, in Asia, and elsewhere. We also have data on the type of
practice contract (PMS or GMS), whether the practice has opted out of providing out of hours
care for its patients, and whether the practice is permitted to dispense medicines as well as
prescribe them. Data on the type of contract are missing for 13 practices and rather than
reduce the number of practices we assumed they had GMS contracts and included a dummy
variable indicating that the contract status dummy had been imputed.
6 The ADS includes patients resident in England but registered in practices located in Wales and Scotland as well as England.
8
3.3 Practice quality
We have several measures of the quality of the practice. We use these to examine which
aspects of quality are most salient to patients and to test the robustness of our results. Our
primary measure of quality is practice performance on the Quality and Outcomes Framework
(QOF). The QOF is a national pay-for-performance scheme introduced in April 2004 and
whose broad structure has been maintained subsequently. From 2006/7 practices could
receive up to 1000 points for achieving quality indicators grouped into four domains (clinical,
organisation, patient experience, and additional services) and for a holistic care indicator.
Each point earned the practice £125.7 As noted above, QOF payments account for around
20% of general practice gross income.8
As a measure of clinical quality QOF points have two potential drawbacks. Up to 665 of the
1000 QOF points are awarded for having disease registers and for the percentage of eligible
patients in a disease area for whom various indicators are achieved.9 No points were awarded
for achievement less than 40% and points increased linearly with percentage achievement
above 40% up to an upper threshold ranging from 60% to 90%, with no points earned for
further increases in achievement. In addition, research has suggested that some practices
designated patients as “exceptions” to increase their reported achievement (Gravelle et al,
2010). Thus points are an imperfect measure of actual achievement on a clinical indicator.
However, performance measured by the QOF total points is readily available to the public
(via the government NHS Choices website designed to help patients choose health care
providers). Although it may be an imperfect measure of quality because of upper and lower
thresholds and exception reporting, we use total QOF points as our main quality measure as it
is most visible to patients.
7 In more detail, the domains, points and indicators in 2006/7 were as follows. Clinical (80 indicators covering 19 conditions, carrying 655 points in total), organisation (43 indicators carrying 181 points for record keeping, medicines management, education and training,), patient experience (4 indicators carrying 108 points for length of consultations and having undertaken patient surveys), and additional services (8 indicators carrying 36 points for services including cervical screening, child health surveillance, maternity, and contraception). In addition there was holistic care indicator which awarded up to 20 points on the basis of performance in the 3rd worst condition in the clinical domain. 8 The QOF data is extracted directly from patients’ electronic health records for practices in the UK 9 For example, indicator DM7 is the proportion (N/D) of eligible diabetic patients whose HbA1c was 10 or less and carried 11 points, where N is the number of patients for whom the indicator is achieved and D is the number who are declared eligible for the indicator.
9

Specifically, we use total QOF points for 2006/7. We choose a 4 year lagged measure (choice
of practice is observed for 2010) to reduce reverse causality from patient choices to quality.
However, in robustness tests we also use total points for 2009/10, the average total points
from 2006/7 to 2009/10, and 2006/7 points earned on each of the domains of the QOF. We
also use the raw QOF data on clinical indicators to construct measures of overall reported
achievement and population achievement which are not affected by upper and lower
thresholds and exception reporting.10
We also consider other, non-QOF, measures of quality. The first is a measure of the quality
of practice disease management: the practice’s total annual emergency admission rate for
Ambulatory Care Sensitive Conditions (ACSCs).11 ACSCs are conditions for which good
quality management in general practice should prevent emergency admissions for
complications (AHRQ, 2004; Purdy et al., 2009). ACSCs admission rates are used as
measures of access to good quality primary care inside and outside the UK.
The second type of non-QOF measures are three patient satisfaction measures from the GP
Patient Survey for 2009 which was sent to a 5.7M random sample of patients in all practices
in England. We use the answers to three questions. The first question concerns general
satisfaction (“In general, how satisfied are you with the care you get at your GP surgery or
health centre?”). The second question is about satisfaction with opening hours (“How
satisfied are you with the hours that your GP surgery or health centre is open?”). Patients
answer both questions on a 5 points scale and we use the proportion of the practice
respondents who say they were “Very satisfied” or “Fairly satisfied”. The third question asks
patients “Would you recommend your GP surgery or health centre to someone who has just
moved to your local area?” and we use the proportion of respondents who report “Yes, would
definitely recommend” or “Yes, might recommend”, as opposed to “Not sure”, “No, would
probably not recommend”, “No, would definitely not recommend” or “Don’t know”.
10 Overall reported achievement is weighted average of the reported achievement (N/D) on the clinical indicators, where the weights are the maximum points available for the indicator. Practices can exception report patients for clinical indicators on various grounds, including the patient refusing to attend for treatment or having contra indications. We therefore also calculate overall population achievement as the maximum points weighted average over clinical indicators of N/(D + E) where E is the number of exceptions. Further details are in Table B1. 11 ACSCs listed in Table A2.
10
3.4 Distance measurement and choice sets
Figure 1 shows the practices and LSOAs in the East Midlands. Some practices have more
than one surgery. In total there are 994 practices with 1232 surgeries in the choice sets of East
Midlands patients. We obtained the practice branch grid references from their postcodes and
calculated the straight line distance between the centroid of each LSOA and all GP surgeries
within 50km of LSOAs in the East Midlands SHA. We assume that a patient considers the
distance to the nearest surgery of a practice when choosing amongst practices. So we use the
distance to the nearest surgery of a practice from the LSOA centroid as our measure of
practice distance.
Since over 99% of the patients were registered with practice with a surgery within 10km of
their LSOA centroid, we restrict the choice set for an LSOA to practices within 10km. In
some urban areas there were more than 100 practices within 10km. To reduce the
computation burden in these cases we further restricted the choice set to the 30 practices with
the largest number of patients from the LSOA. When practices had the same number of
patients from the LSOA we broke the ties by distance, taking the practices which were
nearest to the LSOA centroid.
Practices are supervised by administrative bodies known as Primary Care Trusts (PCTs).
Although patients are not required to register with practices located in the PCT in which they
live, they may be less likely to choose practices in a different PCT because PCTs provide
information about practices located within the PCT. Moreover, PCT boundaries are in part
determined by physical features such as railway lines and rivers which may make it more
difficult to access a practice than is suggested by the straight line distance. To allow for this,
we take account of whether practices are in the same PCT as the LSOA of the patient.
3.5 Descriptive statistics
Table 1 presents the practice characteristics, distances and the small area (LSOA)
characteristics. Over a third (36%) of GPs in practices are female and over a quarter (27%)
11

were trained outside Europe.12 The mean distance to the nearest practice is 1.2km and the
mean distance to practices within the LSOA choice set is 4.8 km. There are 22 practices on
average within the choice set of each LSOA. Figure 2, panel (a) shows that the distribution
of distance to nearest practice has more mass on the left hand side, but there are rural LSOAs
with long distances to nearest practice in our data set. The mean distance to the chosen
practice is 1.9 km. The distribution is shown in Figure 2, panel (b). This is skewed to the left
as 40% of East Midlands SHA patients are registered with the nearest GP practice. This is
higher than the proportion (32%) reported in Dixon et al (1997) for patients in practices in
three other areas of England. Around 27% of practices in LSOA choice sets are located in a
different PCT and 19% of patients choose a practice in a different PCT.
Table A3 reports the correlations amongst the quality measures. It is clear that these
measures are not identical. There are reasonably high correlations amongst the QOF points
measures.13 ACSC emergency admissions are a negative measure of quality and are slightly
negatively correlated with other quality indicators. Although the QOF was intended to
improve care for long term conditions and to reduce hospital admissions, there is only weak
negative correlation between ACSCs and QOF points. This may be because there are both
negative and positive correlations between admissions for particular ACSCs and the QOF
clinical indicators for management of those conditions (Bottle et al, 2008; Downing et al,
2007; Dusheiko et al, 2011; Purdy et al, 2011). The three patient reported measures are
reasonably highly correlated with each other but much less well correlated with the QOF
measures. Finally, the reported achievement 2009/10 and population achievement 2009/10
measures, which use more of the information used to compute QOF clinical indicators, are
highly though not perfectly correlated with total 2009/10 QOF points and with each other.
4 Estimation 4.1 Model We use McFadden's (1974; 1978) random utility choice model and estimate conditional logit
models of patients’ choice of practice. There are nA LSOAs and their choice sets contain nJ
12 We do not have data on ethnicity or first language of GPs but the majority of doctors trained outside Europe will not have English as a first language. 13 In some cases this is due to the construction of the measures: clinical points contribute over 60% of total points, and the holistic care points are based on performance in the third worst clinical domain.
12

different practices in total. All na patients in LSOA a choose a practice from the same set Ca:
na = a
ajj Cn
∈∑ , where naj is the number of LSOA a residents who choose practice j. The
number of patients choosing practice j is 1
Anj aja
n n=
=∑ and there are 1
Jnjj
N n=
=∑ = 1
Anaa
n=∑
patients in total.
The utility for individual i living in LSOA a if she chooses practice j is
iaj iaj iaju ε′= +x β (1)
xiaj = ( 1 ,...,iaj Kiajx x ) is a vector of K observed variables and εiaj is random error term observed
by the patient i but not the econometrician. Each patient i in LSOA a chooses the practice in
their choice set Ca which yields the highest realised value of uiaj.
Assuming that the εiaj errors are independently and identically distributed according to the
type 1 extreme value distribution, the probability that patient i in LSOA a chooses practice j
is
1
exp( ) exp( )a
iaj iaj iajj CP
−
′′∈ ′ ′= ∑x β x β (2)
The log-likelihood for this conditional logit model is
ln L = 1 1
exp( )ln
exp( )
Aa
a
i
n n iajiaja j C i
iajj C
y′= ∈ =
′′∈
′
′ ∑ ∑ ∑ ∑
x βx
(3)
where yiaj = 1 when practice j is chosen by individual i in LSOA a and is zero otherwise.
If we assume, as in most of our models, that individuals’ preferences over practice
characteristics do not vary across different types of individual, only variables which vary by
LSOA and practice (xaj) will affect choice probabilities and thus the probability of choice of
practice j by an individual in LSOA a is the same for all individuals in LSOA a. Hence
1
exp( ) exp( )a
iaj aj ajj CP
−
′′∈ ′ ′= ∑x β x β (4)
and the log-likelihood is
ln L = 1
exp( )ln
exp( )
A
a
a
n ajaja j C
ajj C
n′= ∈
′′∈
′
′ ∑ ∑ ∑
x βx β
(5)
13

so that the log of the choice probability for practice j in choice set Ca is weighted by the
number of patients in LSOA a who choose practice j.14
To reduce the computational burden from assuming that patients in an LSOA can choose
from amongst any of the practices in or near the East Midlands SHA, we estimate the model
after imposing the restriction that the choice set for patients in an LSOA is restricted to the
practices within 10 km of the LSOA centroid. McFadden (1978) has shown that maximum
likelihood produces consistent estimates of the coefficients β, which are the marginal patient
utilities from practice characteristics, even with imposed choice sets which are subsets of the
true choice set. (See Appendix C for a discussion.)
We examined our baseline assumption of homogeneous individual preferences in three ways.
First, because we have data on the numbers of individuals in age and gender groups in each
LSOA who choose each practice, we estimate versions of (5) for each age and gender group,
so that naj is now the number of patients in an LSOA in a given age/gender band who choose
practice j. Second, although we do not observe any other individual characteristics, we do
have information on the average socio-economic characteristics of LSOAs. To investigate
whether preferences about practices vary with these characteristics we stratify LSOAs
separately by the proportion of the population who are income deprived, non-white, have no
educational qualifications or are in fair or good self reported health. Finally, we allow the
coefficients β in individual utility functions to vary randomly across individuals according to
a normal distribution and we estimate mixed logit models of their mean and standard
deviation.
4.2 Reported effects
The estimated coefficients β̂ convey information about the sign of the effect of an attribute
on patient utility and on the probability of choice since ˆˆ ˆ ˆ/ (1 )aj kaj k aj ajP x P Pβ∂ ∂ = − . The
magnitudes of the marginal effects ˆ /aj kajP x∂ ∂ vary across practices and LSOAs. To get a
more readily interpretable quantitative estimate of patient preference across practice
characteristics we generally report the average of the marginal effects ˆ /aj kajP x∂ ∂ :
14 All models estimated using Stata 12. A subset were re-estimated using NLogit.
14

( )1 ˆ ˆ ˆ1a
a k aj aja j Cn n P Pβ−
∈−∑ ∑ (6)
rather than the coefficients.
The estimated marginal effects of practice characteristics are typically very small. But the
potential incentives for practices to increase quality to attract patients depend on the change
in demand for the practice. This depends on the change in the probability that patients will
wish to join the practice (i.e the marginal effects) and on the number of patients in whose
choice set the practice falls. On average there are 74,529 people aged 25 and over within 5
km of a practice and 25,070 within 2 km. Thus even small changes in the probability of an
individual choosing a practice can have a non-trivial effect on demand for the practice.
We therefore also report the estimated average number of additional patients a practice would
receive from a unit increase in practice characteristic xkj
( )
* ** *
ˆˆ1 1 jJ J
a aja SjJ Jj S j S
kj kj
n Pnn x n x
∈
∈ ∈
∂ ∂ = ∂ ∂
∑∑ ∑
( )**
1 ˆ ˆ ˆ1Jj
a k aj ajJ j S a Sn P P
nβ
∈ ∈ = − ∑ ∑ (7)
Sj = { }aa j C∈ is the set of East Midlands LSOAs whose choice sets include practice j. SJ* is
the set of nJ* (= 482) practices which draw at least 99% of their list from East Midland
LSOAs.
The elasticity of demand for practice j with respect to xjk is
( )ˆ ˆ ˆ ˆ1ˆ ˆ j
j kj kjk a aj aja S
kj j j
n x xn P P
x n nβ
∈
∂= −
∂ ∑ (8)
and we report the weighted average elasticity of demand
( )( )* *
ˆ ˆ 1 ˆ ˆ ˆ1ˆ ˆ ˆJ J
j
j j kjk kj a aj ajj S j S a S
kj j
n n xx n P P
n x n nβ
∈ ∈ ∈
∂= − ∂
∑ ∑ ∑ (9)
We also calculate marginal rates of substitution between the k’th practice characteristic xkj
and the distance daj in kilometres between the LSOA centroid and the practice. In our
15

preferred model utility depends on a cubic function of distance so the marginal rate of
substitution varies across practices and LSOAs:
2
11 12 13
ˆ/ˆ ˆ ˆ/ 2 3
kj iaj ajaj kkd
aj iaj kj aj aju
x u dMRS
d u x d dβ
β β β∂ ∂ ∂
= = − = −∂ ∂ ∂ + +
(10)
ajkdMRS is the additional distance that a patient in LSOA a would be willing to travel to
practice j a practice if xkj increased by one unit. To avoid the computational burden in
estimating standard errors for the average of (10) across all patients we evaluate the MRSkd at
the mean distance to practice chosen and, using the results in Hole (2007), estimate standard
errors using the delta method.
5 Results 5.1 The effect of quality, distance and practice characteristics
We begin by exploring the responsiveness of choice to our key variables of interest – practice
quality and distance. Table 2 presents our baseline model. Quality is measured by four year
lagged total QOF points (2006/7) and we allow for non-linearity in distance with a cubic
function of distance from the LSOA centroid to the nearest surgery of the practice. Other
covariates are practice characteristics: whether the practice is in the same PCT as the LSOA,
mean GP age, proportion of female GPs, the proportion of GPs qualified outside Europe
(where GPs qualified in Europe is the baseline), the type of contract the practice has (GMS is
the baseline category), and whether the practice has opted out of providing out of hours cover
for its patients.
The table reports the average marginal effects of variables on the probability that a practice is
chosen. The first row shows that patients are more likely to choose a practice with higher
quality. An increase of 10 QOF points increases the probability of choice of practice by
0.0013. Note the small magnitude of this estimate is in part because of the scale of the QOF
measure (the mean number of QOF points is 633 with a standard deviation of 64). The
second row shows that patients dislike distance and prefer practices that are closer to their
homes, and the third that, conditional on distance, patients prefer practices in the same PCT.15
15 As PCTs boundaries may reflect physical features that are hard to cross, the coefficient on PCT may be interpreted as a (non-linear) distance parameter.
16
In terms of observed GP characteristics, patients prefer practices with younger GPs, with a
higher proportion of female GPs, with a lower proportion of non-European qualified GPs,
practices that have opted out of our-of-hours cover and those with PMS contracts. These
results for practice gender and ethnicity mix, and average age, are robust across all model
variants that we estimated and confirm earlier research findings on the choice of GPs in the
UK. The literature suggests that female patients prefer consultations with female GPs so we
expect that on average patients are more likely to choose practices with a higher proportion of
female GPs. GPs who have qualified outside Europe are less likely to have English as a first
language, so practices with a higher proportion of such GPs will have less demand. The
positive effect of a practice opting out of providing services to patients outside normal
working hours seems paradoxical at first sight. However, patients at a practice which has
opted out will not necessarily experience worse access. When practices opt out the
responsibility for providing out of hours care for their patients passes to the PCT. This need
not lead to a reduction in the availability of out of hours care for patients compared to
practices which do not opt out because much of the out of hours care is subcontracted by
practices to commercial and cooperative deputising services. It may be that practices which
opt out are then able to provide better care during normal hours. The effect of the practice
opting out is much less robust than the effects of other practice characteristics. Patients may
prefer practices with PMS contracts since such PMS contracts usually require the practice to
provide additional services.16
5.2 Alternative quality measures
To further examine the effect of quality we estimate a series of modifications to our baseline
model. In Table 3 we compare five different specifications of clinical quality. Although all
models also contain the full set of practice characteristics used our Table 2 baseline model,
we report only the average marginal effects for the quality measures and distance. Results for
the other characteristics were very similar to those in the baseline model. Column (1)
presents estimates using total 2006/7 QOF points. Column (2) examines the separate effects
of the components of the 2006/7 QOF. This model performs slightly better than the other,
16 We also estimated models which included a dummy variable for the practice’s ability to dispense as well as prescribe. The average marginal effect of dispensing status was small and non significant. Practices are allowed to dispense medicines for patients who would find it otherwise difficult to use a pharmacy. Although this is more convenient for patients who register with a dispensing practice, other patients may prefer to register with practices which are more conveniently situated with respect to pharmacies, which may explain the insignificant effect of dispensing status on demand.
17

simpler, models which use only one QOF points measure, but two of the components (holistic
care and patient experience) have negative, though insignificant, effects. This is possibly
because of collinearity amongst the five components. Column (3) examines this further and
uses only the 2006/7 clinical points. The results show that clinical points are positively
associated with choice of practice but the model performs slightly worse than the model with
total 2006/7 QOF points. The effects of distance are very similar for these first three models
using quality measures derived from the 2006/7 QOF.
Columns (4) and (5) present results from models with total QOF 2009/10 points and the
average of total QOF points over the period 2006/7 to 2009/10 respectively. In both cases
greater distance has a negative marginal effect and higher QOF total points has a positive
marginal effect. The marginal effect of total 2009/10 QOF points is much smaller and is less
precise than the effect of total 2006/7 QOF points. The instrumented results, reported later,
suggest that this is due to endogeneity.
In Table 4 we examine patient satisfaction with their practice and willingness to recommend
it as measures of practice quality. We again do not report estimated average marginal effect
for other practice characteristics as these are robust to the quality specification, but all models
include these variables. Column (1) shows that if overall patient satisfaction is the only
measure of quality and no other covariates are included in the model, patient satisfaction is
strongly correlated with choice of practice. However, the overall fit of the model is poor
compared to those which include a full set of practice characteristics. When we also include
other practice characteristics and our baseline measure of clinical quality (total QOF 2006/7
points) in column (2) the marginal effect of overall patient satisfaction becomes negative and
insignificant. This suggests that patient satisfaction is summarising the effect of practice
characteristics on patient utility, as suggested in Robertson et al (2008), but makes no
independent contribution to predicting patient choice of practice once practice characteristics
and practice quality are accounted for.17
Columns (3) and (4) use patient satisfaction with access as a quality measure. It is statistically
significant when it is the only explanatory variable in the demand model, but it has the wrong
17 The lack of precision on the patient satisfaction measures may also reflect measurement error as these measures are based on an achieved sample of about 5% of patients, whilst the ACSC admission rate and QOF points are based on all relevant patients.
18

sign, as it is negative. This may reflect a negative correlation between practices with high
demand and longer waits for consultations. As with overall satisfaction, access satisfaction
becomes insignificant when other practice characteristics and total QOF 2006/7 points are
included in the model in column (4). Column (5) shows that the patient survey measure
“would recommend” a practice is positively associated with choice and column (6) that this
variable retains its significant positive marginal effect when practice characteristics and total
QOF 2006/7 points are included. The overall performance of this last model is very similar
to the model where total QOF 2006/7 points is used as the quality measure (Table 3, column
(1)).
We investigated two further QOF based measures of clinical quality (reported achievement
and population achievement which allow for lower and upper thresholds and exception
reporting). Neither measure was significant and reported achievement had the wrong
(negative) sign. Finally, emergency admissions for ambulatory sensitive conditions (ACSC
2006/7) were insignificant when added to baseline model with total QOF 2006/7 points. (See
Appendix Table B1).
This battery of test of alterative quality measures supports our baseline estimates in which we
use 2006/7 total QOF points as the single overall measure of practice quality to predict
patient choice. In statistical terms 2006/7 total QOF points fits the data very nearly as well as
the model including all separate QOF sub-components and predicts a little better than total
QOF 2009/10 points and the average of total QOF points 2006/7 to 2009/10. Importantly, it
is also more plausible as a measure which affects patient choices. It is publicly reported on
the NHS Choices web site aimed at helping patient choice, unlike the more nuanced measures
of the components of the total score, or adjustments using QOF data to deal with gaming, or
measures based on ACSC emergency admissions. Finally, a lagged measure is more likely to
be exogenous to current choices (we further address endogeneity in section 5.6).
5.3 Distance effects
Because of the importance of distance in determining practice choice we investigate the
robustness of baseline model to alternative specifications of distance. Table 5 reports
estimates from model with different assumptions about the way in which distance affects the
utility derived from practice choice. The statistically significant negative effects of distance
19
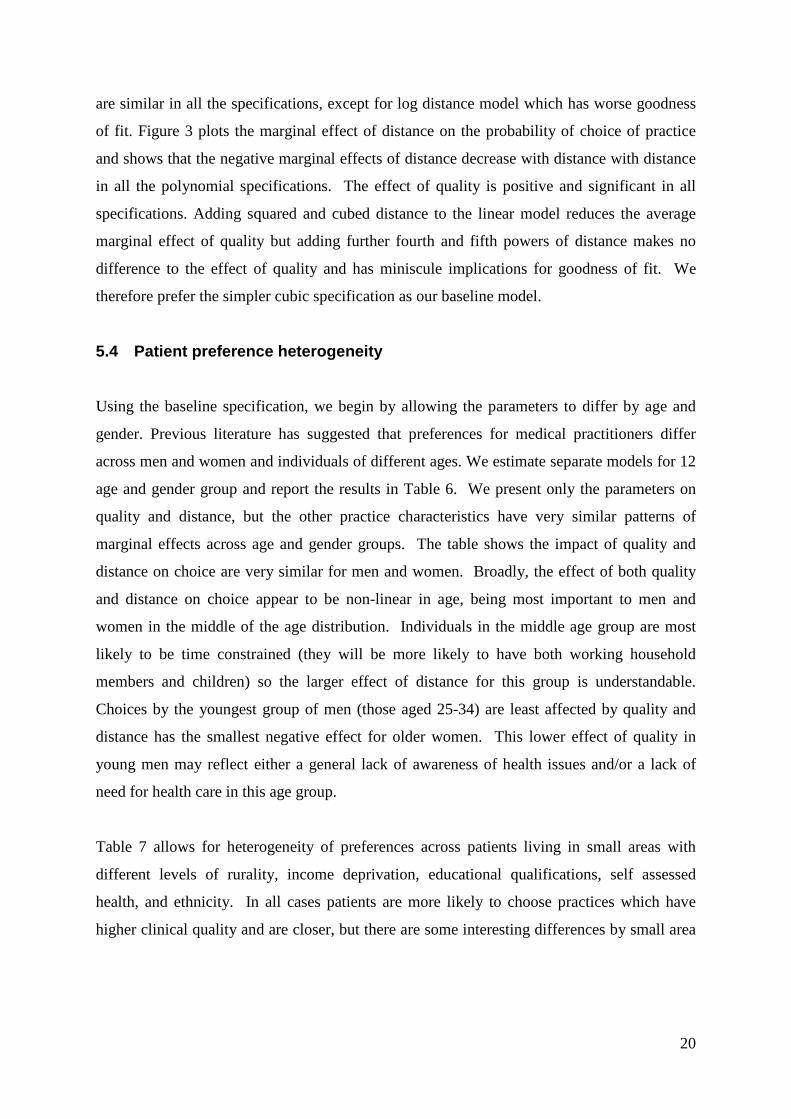
are similar in all the specifications, except for log distance model which has worse goodness
of fit. Figure 3 plots the marginal effect of distance on the probability of choice of practice
and shows that the negative marginal effects of distance decrease with distance with distance
in all the polynomial specifications. The effect of quality is positive and significant in all
specifications. Adding squared and cubed distance to the linear model reduces the average
marginal effect of quality but adding further fourth and fifth powers of distance makes no
difference to the effect of quality and has miniscule implications for goodness of fit. We
therefore prefer the simpler cubic specification as our baseline model.
5.4 Patient preference heterogeneity
Using the baseline specification, we begin by allowing the parameters to differ by age and
gender. Previous literature has suggested that preferences for medical practitioners differ
across men and women and individuals of different ages. We estimate separate models for 12
age and gender group and report the results in Table 6. We present only the parameters on
quality and distance, but the other practice characteristics have very similar patterns of
marginal effects across age and gender groups. The table shows the impact of quality and
distance on choice are very similar for men and women. Broadly, the effect of both quality
and distance on choice appear to be non-linear in age, being most important to men and
women in the middle of the age distribution. Individuals in the middle age group are most
likely to be time constrained (they will be more likely to have both working household
members and children) so the larger effect of distance for this group is understandable.
Choices by the youngest group of men (those aged 25-34) are least affected by quality and
distance has the smallest negative effect for older women. This lower effect of quality in
young men may reflect either a general lack of awareness of health issues and/or a lack of
need for health care in this age group.
Table 7 allows for heterogeneity of preferences across patients living in small areas with
different levels of rurality, income deprivation, educational qualifications, self assessed
health, and ethnicity. In all cases patients are more likely to choose practices which have
higher clinical quality and are closer, but there are some interesting differences by small area
20
characteristics of the patients.18 The marginal effects of practice characteristics on the
probability of choice of practice are smaller for rural LSOAs than urban LSOAs, but the
magnitudes of the marginal effects of characteristics relative to distance are not greatly
different. For example, a 1 point increase in QOF points would have the same effect on
choice probability as a reduction in distance of 1.9 metres for rural patients and 1.8 metres for
urban patients. However, there is a difference across patients by patient deprivation. The
choices of patients in LSOAs which are in the top quintile of income deprivation, or the top
quintile for no educational qualifications, or for poor self- assessed health are more affected
by distance and less by quality. For patients from LSOAs in these top quintiles, a 1 point
increase in total QOF points has the same effect on choice probabilities as a 1 metre decrease
in distance, whereas for small areas in the other quintiles, the effect of a 1 QOF point increase
has the same effect as a 2 metre decrease in distance.
The analyses in Table 7 allow for observed heterogeneity. Table 8 compares the results from
a mixed logit model, which allows for unobserved heterogeneity, and our baseline conditional
logit specification. To facilitate comparison, the table reports coefficient estimates rather than
AMEs and we present estimates for all the variables in the model. The upper part of the table
shows that the mean values of the mixed logit coefficients are very similar to those from the
baseline conditional logit model of Table 2. The lower part of the table shows that standard
deviations of the mixed logit coefficients, except for the distance and quality variables, are
not significantly different from zero. As the mean estimates are similar across the two
models and the mixed logit model cannot easily be used to estimate average marginal effects,
we prefer to report results from the more restrictive conditional logit models.
5.5 Catchment areas and closed lists: specification of the choice set
In interpreting the results we assume that practice lists are determined by patient decisions,
rather than practice decisions. But because practices have a legal obligation to make home
visits if these are medically necessary, they will be reluctant to accept patients who live a
considerable distance from the practice. Practices are allowed to agree catchment areas with
their PCTs and are not obliged to accept patients who live outside this catchment area. Thus
18 The qualitative patterns of the other covariates are mostly very similar to those in the non-stratified model. Patients from all types of small area are more likely to choose practices with a higher proportion of female GPs, a smaller proportion of non-European qualified GP and have younger GPs.
21

an observed negative effect of distance on the probability of patients in an LSOA being on
the list of a practice may be due to decisions by practices as well as by patients.
In Appendix C we sketch a model of practice choice of catchment area and discuss the
implications for interpretation of our estimates. We show that if practices preferentially
accept patients who live closer to the practice this will not produce an association between
the proportion of a particular LSOA’s patients choosing a practice and the practice’s quality.
The argument is as follows. It is possible that a practice whose patients are closer to the
practice will have higher quality, either because it is harder to achieve higher quality if there
is less contact between patients and GPs or because practices with higher quality have higher
demand from patients and set smaller catchment areas for any given list size. Either of these
mechanisms would lead to a negative association between practice quality and the average
distance from the practice of the practice’s patients from all LSOAs in its catchment area.19
But it would not imply any relationship between the proportion of any particular LSOA
choosing the practice and practice quality since the latter depends on the average distance of
all practice patients.
Practices can close their lists to patients even if they live in the practice catchment area.
Practices might wish to exclude patients who are more difficult to treat and who would
therefore lower average quality. But a practice can refuse an application to join its list from a
patient in their catchment area only if it has formally notified their local PCT that its list is
closed. If the practice list is open it cannot refuse patients in its catchment area. For practices
intending to stay in business list closures must be temporary since each year around 8% of
patients will leave a practice list (primarily due to residential moves) (Hippisley-Cox et al,
2005). Our practice list data are a snapshot of the distribution of patients across practices at a
given date and reflects patient choices over a number of years, so we think that list closure is
unlikely to have major implications for our results.
Nevertheless, although we do not think that practices’ ability to set catchment areas or to
close their list to new patients can account for a positive association between the proportion
of an LSOA’s patients on a practice list and the quality of the practice, we undertake two
further robustness tests. If catchment areas are a binding constraint on patients, then models
19 Jenkins and Campbell (1996) found that higher quality practices in London had smaller catchment areas.
22

estimated with large radii or without restrictions on the number of patients from the LSOA
registered at the practice, should yield different results from those estimated with tighter
constraints. First, we estimate models in which the radius of the choice set for LSOAs is
restricted progressively from 10km down to 8km, 6km, 4km and 2km. Second, we restrict
the choice set for LSOAs to practices which have at least 1, 5, 10, or 50 of their patients
drawn from the LSOA. By restricting the choice sets for LSOAs we make it less likely that
the observed distribution of LSOA patients across practices in the choice sets is due to
decisions by GPs about catchment areas.
Tables 9 and 10 report these investigations. Table 9 presents the average marginal effects
from models in which we attempt to capture catchment area effects by restricting LSOA
choice sets by distance. Table 9 shows that the average marginal effect of distance becomes
larger (absolutely) as the choice set becomes smaller. This is to be expected: as Figure 3
shows the effect of distance declines with distance to the practice and restricting the choice
set reduces the average distance to practices.
While the average marginal effects for both quality and distance change in Table 9 as we
restrict the choice set, the ratio of the marginal effect of quality to distance is quite stable
across the definition of the choice set. The ratio of quality marginal effect to distance
marginal effect is approximately 18 percent higher for choice sets defined over 10km
compared to over 2km. Table 10 reports average marginal effects from models in which
LSOA choice sets are restricted to practices which have a minimum number of patients from
the LSOA on their list. Again the trade-off between quality and distance is similar across the
different definitions of choice sets. The similarity of the estimates across the restricted
choice sets is thus in line with the choice process being the same across the sets and
unaffected by GP behaviour in deciding catchment areas or temporarily closing lists.20
20 This may be because few patients would wish to be further away from their practice than the maximum distance GPs are willing to travel to patients.
23

5.6 Endogeneity and measurement error
Although we have examined a number of different quality variables, it is possible that we
measure quality with error. It is also possible that practice quality is determined in part by
the demographic, socio-economic and health characteristics of the patients on its list (see
Appendix C). If different patient types have different preferences over practice
characteristics the quality measure may be correlated with unobserved demand factors. The
endogeneity bias could go either way: practices which are better could attract more complex
patients with whom it is more difficult to achieve QOF points, or better educated individuals
who may be easier to treat may be more likely to choose better practices. To address this we
have used a lagged measure of practice quality as our preferred measure, as this reduces bias
arising from unobserved patient characteristics that affect both current quality and the patient
preferences towards quality.
To further allow for possible endogeneity and measurement error, we estimate a model in
which we instrument practice quality by the average quality of neighbouring practices. The
quality of neighbouring practices is a good predictor of practice quality because neighbouring
practices will have similar types of patient who are exposed to similar environments, and will
operate under similar cost conditions when producing quality. The instrument will be
uncorrelated with practice demand errors provided that there are no unobservable factors
affecting demand which are correlated across neighbouring practices and which affect
practice quality.
We implement the instrumental variable using two stage residual inclusion (Terza et al,
2008). We first estimate an OLS model of practice quality for all practices in the choice sets
of LSOAs in the East Midlands. In addition to the instrument (average quality of
neighbouring practices), the first stage quality model contains the variables in the choice
model, averaged over the LSOAs whose choice sets contain the practice. The practice
observations are weighted by the number of LSOA choice sets in which a practice appears.
The residuals from the first stage model are included in the second stage conditional logit
model as an additional explanatory variable. The estimated coefficient on the quality
measure in the choice model is an unbiased estimate of the effect of quality if the instrument
24
is valid. We bootstrap the standard errors on the coefficients in the second stage choice
model. 21
Table 11 presents the results of instrumenting our preferred measure of practice quality (total
2006/7 QOF points) with the average total 2006/7 QOF points of the practice’s nearest
neighbouring practices and including the residuals from the first stage quality model in the
second stage. The full first stage results are in Table B2. The nearest neighbour instruments
have F statistics of 18.54 for quality, which is comfortably greater than the conventional
critical value of 10 (Stock et al, 2002). The residuals are significant in the 2SRI second stage
models, suggesting that the quality measure is endogenous.
Table 11 reports the quality and distance estimates from the 2SRI choice model estimated on
the full sample of LSOAs in column (1), the average results from 100 bootstrap replications
of the choice model in column (2) and the ratio of the full sample 2SRI average marginal
effect estimates to the standard deviation of the bootstrap estimates in column (3).
Comparison of columns (1) and (2) show the results are not sensitive to which sample is used
and column (3) shows the marginal effects are statistically significant. Instrumenting
increases the estimated average marginal effect of quality from the baseline estimate of
0.00013 (Table 2) to 0.00074 for 2006/7 QOF points. This suggests that practices which
provide good quality also attract more complex patients, lowering measured performance.
We also use the average quality of neighbouring practices to instrument quality as measured
by average QOF points 2006/7-2009/10 and total QOF points 2009/10. The F statistics for the
instruments are 19.17 and 29.62 respectively and the residuals are significant in the second
stage estimates. The instrumented estimates of the average marginal effects of the quality
measures are again larger than the unistrumented estimates (compare Table 4), particularly so
for 2009/10 QOF points. After instrumenting the average marginal effects are very similar
across the three measures of quality (0.00074 for 2006/7 QOF points, 0.00087 for averaged
21 We draw 100 random bootstrap samples of 987 LSOAs with replacement from the set of 987 practices chosen by patients in the East Midlands. We estimate the first stage quality model for the practices in the choice sets of LSOAs in each bootstrap sample, weighting the observations by the number of times the practice appears in the choice sets (including multiple draws of the same LSOA as separate observations). We estimate the second stage choice model for each bootstrap sample of LSOAs, adding the residuals from the first stage quality regression, and weighting LSOAs by number of times they appear in the bootstrap sample. We then compute the standard deviation of the 100 estimates of the second stage coefficients.
25

2006/7-2009/10 QOF points, and 0.00064 for 2009/10 QOF points), again suggesting
endogeneity in the raw quality measures.
5.7 Summarising the effects of quality on patient demand
In Table 12 we summarise the estimated effects of quality on practice choice and compare
these with the effects of the average age of the practice GPs, the proportion of female GPs,
and the proportion who qualified outside Europe. We compare the effects of 1/10th standard
deviation increases in each of the variables. In addition to the average marginal effects (the
change in probability that a patient will choose the practice in response to the change in the
practice characteristic or quality), we report the extra distance in metres patients would be
willing to travel to be in a practice whose characteristic or quality had increased,22 the
number of additional patients a practice would gain, and the elasticity of practice numbers
with respect to the characteristic or quality. We report the calculations for our baseline model
using un-instrumented quality and for the 2SRI model of Table 11.
Using first the estimates from our uninstrumented baseline model, column (1) shows that the
absolute magnitudes of the average marginal effects of quality is small compared to other
features of the GP practice. The increase in the probability of a practice being chosen by a
patient if its QOF points increase by 1/10th standard deviation is 0.00082, which is similar to
the effect of a one standard deviation in average age of a GP but considerably smaller than
the response to a one standard deviation change in the proportion female or trained outside
the EU. Column (2) shows patients are willing to travel 12.4 metres for a one standard
deviation in QOF points, whereas they would be willing to travel between an extra 56.7
metres to a practice with a 1/10th SD greater proportion of female GPs.
However, what matters in terms of the incentives for practices to increase quality is the
number of patients they will gain. This depends both on the effect of quality on the
probability of a patient choosing the practice and the number of patients in whose choice set
the practice lies. An average practice has 74,529 potential patients aged 25 and over resident
within 5 km and 25,070 within 2 km. Column (3) shows that the estimated increase in
practice patients from a 1/10th SD increase in quality is 103.6. Thus although the effect of a
22 This is equal to 1000 times marginal rate of substitution between quality or the practice characteristic and distance measured in kilometres, as defined in section 4.2 in (10).
26

1/10th standard deviation increase in quality on the probability of an individual patient
choosing the practice is small, the number of additional patients gained by the practice is not
trivial, though smaller then the number of patients gained by 1/10 standard deviation
increases in the proportion of GPs that are female or trained inside the EU (486 and 1342
respectively).
Column (4) presents the elasticity of practice demand with respect to quality. This measure is
scale invariant and so is not affected by differences in the variance of the quality measure and
the practice covariates (which does affect the comparison of the estimates in columns (2) and
(3)). This quality elasticity is large: a 1% increase in 2006/7 QOF points implies a 1.44%
increase in practice list size. Thus quality appears to be important to patient choice. Results
in the right hand panel (columns (5) to (7)) of the table use the less conservative instrumented
measure. They reinforce the importance of quality, as the average marginal effect of quality
estimate in column (5) is nearly 6 times as high as that in column (1). If this estimate is used,
then the average patient would be willing to travel an extra 31 metres for a 1/10th of a
standard deviation increase in quality, which would result in a gain of an extra 260 patients
for the practice. These estimates suggest a very high quality elasticity of nearly 3.6.
6 Conclusion The issue of whether choice and competition will increase quality of health care services is
both current and important. A pre-requisite for increased competition to increase quality is
that demanders are responsive to quality. We have tested whether they do in an important
setting – the choice by patients of their family physicians who, in the context we examine,
determine access to all health care services at zero direct monetary cost for the patient.
We examine the choices of 3.4 million patients from amongst nearly 1000 family doctor
practices. We find quality is important: patients are more likely to choose practices with
higher measured (and published) clinical quality. Patients trade off quality against distance.
The results are robust to alternative estimation methods, to the way in which distance was
assumed to affect choice of practice, to possible restrictions on patient choice sets and across
age, gender and socio-economic circumstances of patients. While the effect of quality on the
probability of an individual patient choosing a family practice is small, this does not translate
into a small incentive for practices to increase quality in order to attract more patients. What
27

matters for practices is how many additional patients will be attracted by an increase in
quality and this depends both on the small effect of quality on the probability of choice by an
individual patient and on the large number of patients who could choose the practice. Using
the most conservative of our model specifications we estimate that a one standard deviation
increase in measured clinical quality would attract approximately 15 percent more patients to
a family practice. Thus practices seeking to attract patients could do so by raising quality. If
the marginal revenue from additional patients sufficiently exceeds their marginal cost so as to
cover the costs of higher quality then greater competition in this market could potentially
improve quality for patients.
28

References Agency for Healthcare Quality and Research. 2004. AHRQ Quality Indicators — Guide to
Prevention Quality Indicators: Hospital Admission for Ambulatory Care Sensitive Conditions. Rockville, MD: Pub. No. 02-R0203. Available at http://www.qualityindicators.ahrq.gov/pqi_download.htm
Ashworth, M., Jenkins, M., Burgess, K., Keynes, H., Wallace, M., Roberts, D., Majeed, A. 2005. Which general practices have higher list inflation? An exploratory study. Family Practice. 22, 529-531.
Bayer, Patrick, and Robert McMillan. 2005. Choice and Competition in Local Education Markets. NBER Working Paper 11802.
Beckert, W., Christensen, M., Collyer, K. (2012). Choice of NHS-funded hospital services in England. Economic Journal. In press. doi: 10.1111/j.1468-0297.2012.02496x
Besley, T and Ghatak, M. 2003. Incentives, Choice and Accountability in the Provision of Public Services. Oxford Review of Economic Policy. 19: 235-249.
Billinghurst, B., Whitfield, M. 1993. Why do patients change their general practitioner? A postal questionnaire study of patients in Avon. British Journal of General Practice. 43, 336-338.
Biorn, E., Godager, G. 2010. Does quality influence choice of general practitioner? An analysis of matched doctor-patient panel data. Economic Modelling. 27, 4, 842-853.
Bottle, A., Gnani, S., Saxena, S., Aylin, P., Mainous, A., Majeed, A. 2008. Association between quality of primary care and hospitalization for coronary heart disease in England: national cross-sectional study. Journal of General Internal Medicine, vol 23, 2,135–41.
Brekke, K., Siciliani, L., Straume, O. 2010. Price and quality in spatial competition. Regional Science and Urban Economics, 40, 471-480.
Burgess, Simon, Carol Propper, and Deborah Wilson. 2005. Will More Choice Improve Outcomes in Education and Health Care: The Evidence from Economic Research. CMPO, University of Bristol. http://www.bris.ac.uk/cmpo/choice/index.html (accessed May 04, 2013).
Burns, L., Wholey, D. 1992. The impact of physician characteristics in conditional choice models for hospital care. Journal of Health Economics. 11, 43-62.
Cheraghi-Sohi, S., Hole, A., Mead, N., McDonald, R., Whalley, D., Bower, P., Roland, M. 2008. What patients want from primary care consultations: a discrete choice experiment to identify patients’ priorities. Annals of Family Medicine. 6: 107-115.
Cooper, Z., Gibbons, S., Jones, S., McGuire A., (2011), Does Hospital Competition Save Lives? Evidence from the English Patient Choice Reforms, Economic Journal 121 (August), F228–F260.
Cutler, D., Huckman, R., Landrum, M. 2004. The role of information in medical markets: an analysis of publicly reported outcomes in cardiac surgery. American Economic Review. 94, 342-346.
Department of Health. 2006. Our health, our care, our say: a new direction for community services. Cm 6737. Stationery Office, London.
Department of Health. 2010. Equity and excellence: Liberating the NHS. Cm 7881. Stationery Office.
Dixon, P. Gravelle, H., Carr-Hill, R. and Posnett, J. Patient Movements and Patient Choice, Report for National Health Service Executive, December 1997. http://www.york.ac.uk/che/publications/in-house/archive/1990s/
Downing, A., Rudge, G., Cheng, Y., Tu, Y., Keen, J., Gilthorpe, M. 2007. Do the UK government’s new Quality and Outcomes Framework (QOF) scores adequately
29
measure primary care performance? A cross-sectional survey of routine healthcare data. BMC Health Services Research. 7, 166. DOI:10.1186/1472–6963–7-166.
Dusheiko, M., Doran, T., Gravelle, H., Fullwood, C., Roland, M. 2011. Does higher quality of diabetes management in family practice reduce unplanned hospital admissions? Health Services Research, 2011, 46, 1, 27-46.
Epple, Dennis, and Richard E. Romano. 1998. Competition between Private and Public Schools, Vouchers, and Peer-Group Effects. American Economic Review, 88: 33-62.
Epple, Dennis, David Figlio, and Richard Romano. 2004. Competition between Private and Public Schools: Testing Stratification and Pricing Predictions. Journal of Public Economics 88: 1215-45.
Gaynor, M. 2006. What Do We Know about Competition and Quality in Health Care Markets? Foundations and Trends in Microeconomics, 2 (6).
Gaynor, M., Moreno-Serra R., Propper, C. (forthcoming). Death by Market Power: Reform, Competition and Patient Outcomes in the National Health Service, CMPO Working Paper No. 10/242. Forthcoming, American Economic Journal: Economic Policy.
Gaynor, M., Propper, C., Seiler, S. Free to choose? 2012. Reform and demand responses in the British National Health Service. NBER Working paper 18574.
Gaynor, M., Town, R. 2011. Competition in health care markets. In M.V. Pauly, T.G. McGuire, P.P. Barros (eds.), Handbook of Health Economics, Volume 2, Elsevier.
Godager, G. 2009. Birds of a feather flock together: a study of doctor-patient matching. HERO Working Paper 2009-3
Gravelle, H. 1999. Capitation contracts: access and quality. Journal of Health Economics, 18, 317-342
Gravelle, H., Masiero, G. 2000. Quality incentives in a regulated market with imperfect competition and switching costs: capitation in general practice. Journal of Health Economics 19, 1067–1088.
Gravelle, H., Sutton, M., Ma, A. 2010. Doctor behaviour under a pay for performance contract: treating, cheating and case finding? Economic Journal., 2010, 120, F129–F156.
Gravelle, H., Santos, R., Siciliani, L., Goudie, R. 2012. Hospital competition and quality under fixed prices. ESCHRU CHE Research Paper 80, November. http://www.york.ac.uk/che/publications/in-house/
Gravelle, H., Scott, A., Sivey, P., Yong, Y. 2013. Competition, prices and quality in the market for doctors: evidence from Australian GPs. Mimeo, CHE, University of York
Halonen M and Propper C., 2012. Competition, Quality and Equity in Healthcare. CMPO, University of Bristol working paper 12/296.
Hippisley-Cox, J., Vingradova, Y., Coupland, C., Pringle, M. 2005. Comparison of key practice characteristics between general practices in England and Wales and general practices in the QRESEARCH database. http://www.nhsemployers.org/Site CollectionDocuments/fr72_characteristics_qresearch_practices_database_cd_201105.pdf
Ho, K. 2006. The welfare effects of restricted hospital choice in the US medical care market. Journal of Applied Econometrics. 21, 1039-1079.
Hole, A. 2007. A comparison of approaches to estimating confidence intervals for willingness to pay measures. Health Economics. 16: 827-840.
Hoxby, Caroline M. 2000. Does Competition among Public Schools Benefit Students and Taxpayers? American Economic Review, 90: 1209-1238
30

Hoxby, C. 2003. School choice and school productivity: Could school choice be a tide that lifts all boats? In The economics of school choice ed C. Hoxby, 287-342. Cambridge Mass: NBER.
Howard, D. 2005. Quality and consumer choice in healthcare: evidence from kidney transplantation. Topics in Economic Analysis and Policy. 5(1), 1349.
Information Centre. 2011. General Practice Bulletin 2000-2010. http://www.ic.nhs.uk /webfiles/publications/010_Workforce/nhsstaff0010/GP/General_Practice_Bulletin_2000-2010.pdf
Iversen, T., Luras, H. 2011. Patient switching in general practice. Journal of Health Economics. 30, 894-903.
Jenkins, C., Campbell, J. 1996. Catchment areas in general practice and their relation to size and quality of practice and deprivation: a descriptive study in one London borough. British Medical Journal. 313, 1189-1192
Karlsson, M. 2007. Quality incentives for GPs in a regulated market. Journal of Health Economics. 26, 699-720
Le Grand, J. 2003. Motivation, agency and public policy: Of knights and knaves, pawns and queens. Oxford: OUP
Luft, H., Garnick, D., Mark, D., Peltzman, D., Phibbs, C., Lichtenberg, E., McPhee, S. 1990. JAMA, 263(21), 2899-2905.
McFadden, D. 1974. Conditional logit analysis of qualitative response behavior. In P. Zarembka (ed.), Frontiers in Econometrics, Academic Press, New York, 105-1-42.
McFadden, D. 1978. Modelling the choice of residential location. In A Karlqvist, L., Lundqvist, J. Weibull (eds.), Spatial Interaction Theory and Planning Models, 75-96, North Holland, Amsterdam.
McLean, G., Sutton, M. 2005. Competition and patient choice. Unpublished research paper, General Practice and Primary Care, Community Based Sciences, University of Glasgow.
McRae, I. 2009. Supply and demand for GP services in Australia. Australian Centre for Economic Research on Health. Research Report No. 6. July
Moscone, F., Tosetti, E., Vittadini,, G. 2012. Social interaction in patients hospital choice: Evidence from Italy. Journal of the Royal Statistical Society: Series A. 175: 453-472.
Pike, C. 2010. An empirical analysis of the effects of GP competition. Co-operation and Competition Panel. Working Paper Series, Volume 1, No. 2
Pope, D. 2009. Reacting to rankings: evidence from “America’s Best Hospitals”. Journal of Health Economics. 28, 1154-1165.
Purdy, S., Griffin, T., Salisbury, C., Sharp, D. 2009. Ambulatory Care Sensitive Conditions: terminology and disease coding need to be more specific to aid policy makers and clinicians. Public Health. 123, 169–73.
Purdy, S., Griffin, T., Salisbury, C., Sharp, D. 2011. Emergency admissions for coronary heart disease: A cross-sectional study of general practice, population and hospital factors in England. Public Health. 125, 46-54.
Richardson, J., Peacock, S., Mortimer, D. 2006. Does an increase in the doctor supply reduce medical fees? An econometric analysis of medical fees across Australia. Applied Economics 38: 253-266
Roland, M. 2004. Linking physician pay to quality of care: a major experiment in the UK. New England Journal of Medicine. 351,1448–1454.
Robertson, R., Dixon, A., Le Grand, J. 2008. Patient choice in general practice: the implications of patient satisfaction surveys. Journal Health Service Research and Policy. 13, 2, 67-72.
31

Rothstein, Jesse. 2007. Does Competition among Public Schools Benefit Students and Taxpayers? Comment. American Economic Review, 97(5): 2026-2037.
Salisbury, C. 1989. How do people choose their doctor? British Medical Journal. 299, 2 September, 608-610.
Savage E, Jones G. 2004. An analysis of the General Practice Access Scheme on GP incomes, bulk-billing and consumer copayments. Australian Economic Review 37 (1): 31-40
Scott, A., Vick, S. 1999. Patients, doctors and contracts: An application of principal-agent theory to the doctor-patient relationship. Scottish Journal of Political Economy 46, 111-134.
Sivey, P. 2011. The effect of waiting time and distance on hospital choice for English cataract patients. Health Economics. DOI: 10.1002/hec.1720; available on line.
Stock, J., Wright, J., Yogo, M. 2002.. A Survey of weak instruments and weak identification in Generalized Method of Moments, Journal of Business and Economic Statistics, 20, 4, 518–29
Tay, A. 2003. Assessing competition in hospital care markets: the importance of accounting for quality differentiation. The RAND Journal of Economics. 34, 4, 786-814
Terza, J., Basu, A., Rathouz, P. 2008. Two-stage residual inclusion estimation: addressing endogeneity in health econometric modelling. Journal of Health Economics. 27, 531-543.
Varkevisser, M., van der Geest, S., Schut, F. 2012. Do hospitals choose hospitals with high quality ratings? Empirical evidence from the market for angioplasty in the Netherlands. Journal of Health Economics. 31, 371-378.
Vick, S., Scott A. 1998. Agency in health care. Examining patients' preferences for attributes of the doctor-patient relationship. Journal of Health Economics, 17, 511-644.
32

Figure 1. East Midlands SHA: practice locations and LSOAs
33

Figure 2. Distributions of distances to nearest practice and to practice chosen (a) Distance to practices in choice set
(b) Distance to practice chosen
34
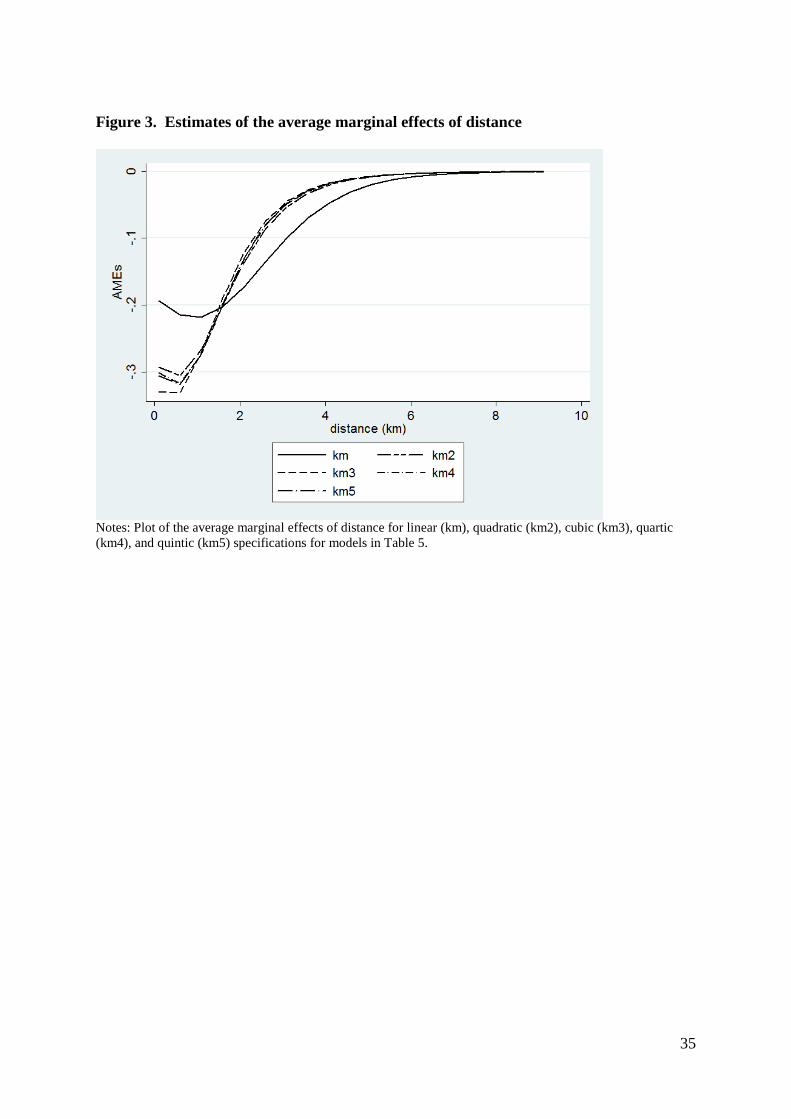
Figure 3. Estimates of the average marginal effects of distance
Notes: Plot of the average marginal effects of distance for linear (km), quadratic (km2), cubic (km3), quartic (km4), and quintic (km5) specifications for models in Table 5.
35
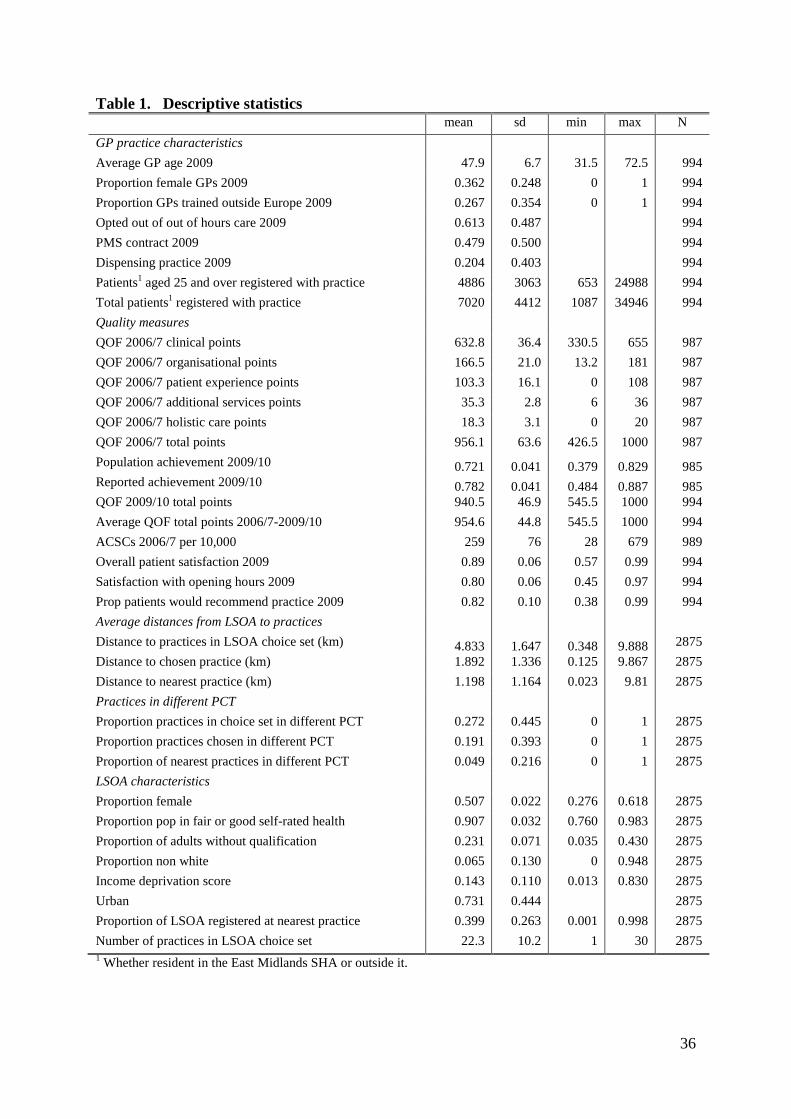
Table 1. Descriptive statistics mean sd min max N GP practice characteristics Average GP age 2009 47.9 6.7 31.5 72.5 994 Proportion female GPs 2009 0.362 0.248 0 1 994 Proportion GPs trained outside Europe 2009 0.267 0.354 0 1 994 Opted out of out of hours care 2009 0.613 0.487 994 PMS contract 2009 0.479 0.500 994 Dispensing practice 2009 0.204 0.403 994 Patients1 aged 25 and over registered with practice 4886 3063 653 24988 994 Total patients1 registered with practice 7020 4412 1087 34946 994 Quality measures QOF 2006/7 clinical points 632.8 36.4 330.5 655 987 QOF 2006/7 organisational points 166.5 21.0 13.2 181 987 QOF 2006/7 patient experience points 103.3 16.1 0 108 987 QOF 2006/7 additional services points 35.3 2.8 6 36 987 QOF 2006/7 holistic care points 18.3 3.1 0 20 987 QOF 2006/7 total points 956.1 63.6 426.5 1000 987 Population achievement 2009/10 0.721 0.041 0.379 0.829 985 Reported achievement 2009/10 0.782 0.041 0.484 0.887 985 QOF 2009/10 total points 940.5 46.9 545.5 1000 994 Average QOF total points 2006/7-2009/10 954.6 44.8 545.5 1000 994 ACSCs 2006/7 per 10,000 259 76 28 679 989 Overall patient satisfaction 2009 0.89 0.06 0.57 0.99 994 Satisfaction with opening hours 2009 0.80 0.06 0.45 0.97 994 Prop patients would recommend practice 2009 0.82 0.10 0.38 0.99 994 Average distances from LSOA to practices Distance to practices in LSOA choice set (km) 4.833 1.647 0.348 9.888 2875 Distance to chosen practice (km) 1.892 1.336 0.125 9.867 2875 Distance to nearest practice (km) 1.198 1.164 0.023 9.81 2875 Practices in different PCT Proportion practices in choice set in different PCT 0.272 0.445 0 1 2875 Proportion practices chosen in different PCT 0.191 0.393 0 1 2875 Proportion of nearest practices in different PCT 0.049 0.216 0 1 2875 LSOA characteristics Proportion female 0.507 0.022 0.276 0.618 2875 Proportion pop in fair or good self-rated health 0.907 0.032 0.760 0.983 2875 Proportion of adults without qualification 0.231 0.071 0.035 0.430 2875 Proportion non white 0.065 0.130 0 0.948 2875 Income deprivation score 0.143 0.110 0.013 0.830 2875 Urban 0.731 0.444 2875 Proportion of LSOA registered at nearest practice 0.399 0.263 0.001 0.998 2875 Number of practices in LSOA choice set 22.3 10.2 1 30 2875 1 Whether resident in the East Midlands SHA or outside it.
36

Table 2. Estimated marginal effects of quality, distance and practice characteristics Average Marginal Effect z QOF 2006/7 Total points 0.00013 6.87 Distance (cubic) -0.06778 -14.18 Practice in different PCT -0.04751 -10.12 GP age -0.00144 -13.31 Prop female GPs 0.01508 6.12 Prop GPs non Europe trained -0.03029 -10.36 Opted Out 0.00543 2.49 PMS contract 0.00564 2.95 BIC 11714907
McFadden R2 0.3955
N LSOA 2,870 N GP practices 987 N patients 3,364,263
Notes: Table reports average marginal effects of variables on number of patients aged 25 and over registered with the practice. Models also contained a dummy for missing PMS status.
37
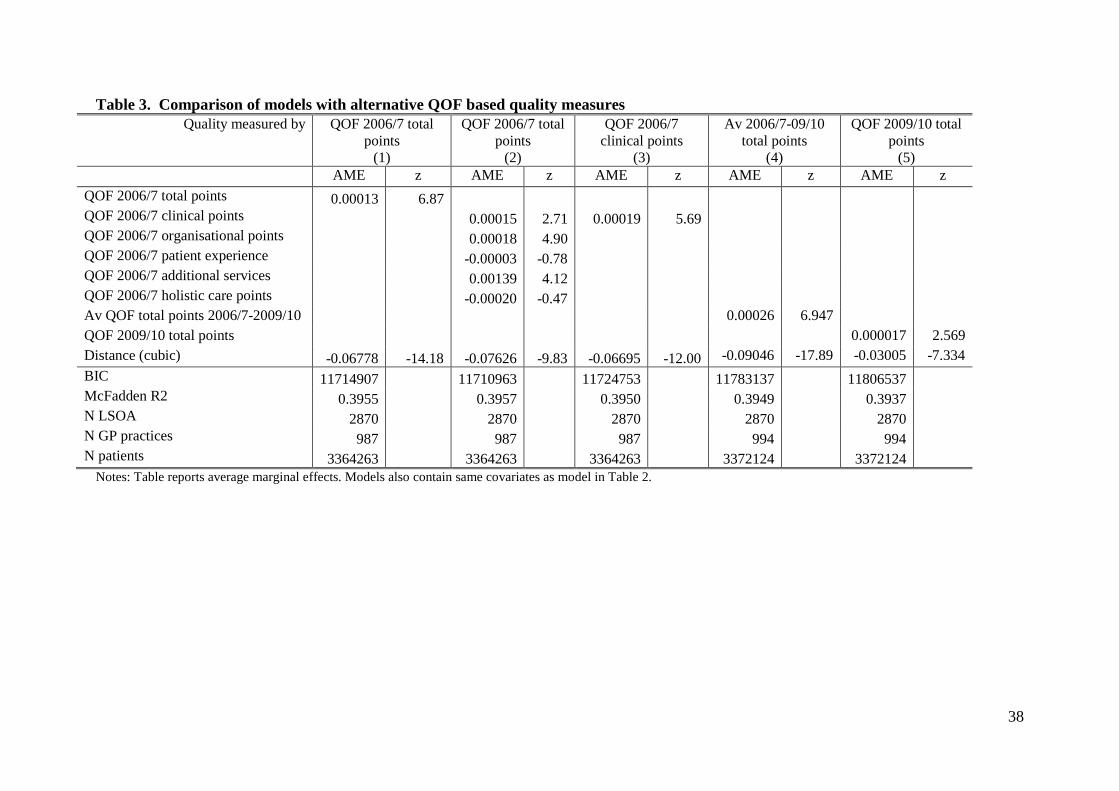
Table 3. Comparison of models with alternative QOF based quality measures Quality measured by QOF 2006/7 total
points (1)
QOF 2006/7 total points
(2)
QOF 2006/7 clinical points
(3)
Av 2006/7-09/10 total points
(4)
QOF 2009/10 total points
(5) AME z AME z AME z AME z AME z QOF 2006/7 total points 0.00013 6.87 QOF 2006/7 clinical points 0.00015 2.71 0.00019 5.69 QOF 2006/7 organisational points 0.00018 4.90 QOF 2006/7 patient experience -0.00003 -0.78 QOF 2006/7 additional services 0.00139 4.12 QOF 2006/7 holistic care points -0.00020 -0.47 Av QOF total points 2006/7-2009/10 0.00026 6.947 QOF 2009/10 total points 0.000017 2.569 Distance (cubic) -0.06778 -14.18 -0.07626 -9.83 -0.06695 -12.00 -0.09046 -17.89 -0.03005 -7.334 BIC 11714907 11710963
11724753
11783137
11806537
McFadden R2 0.3955 0.3957
0.3950
0.3949
0.3937 N LSOA 2870 2870
2870
2870
2870
N GP practices 987 987
987
994
994 N patients 3364263 3364263
3364263
3372124
3372124
Notes: Table reports average marginal effects. Models also contain same covariates as model in Table 2.
38
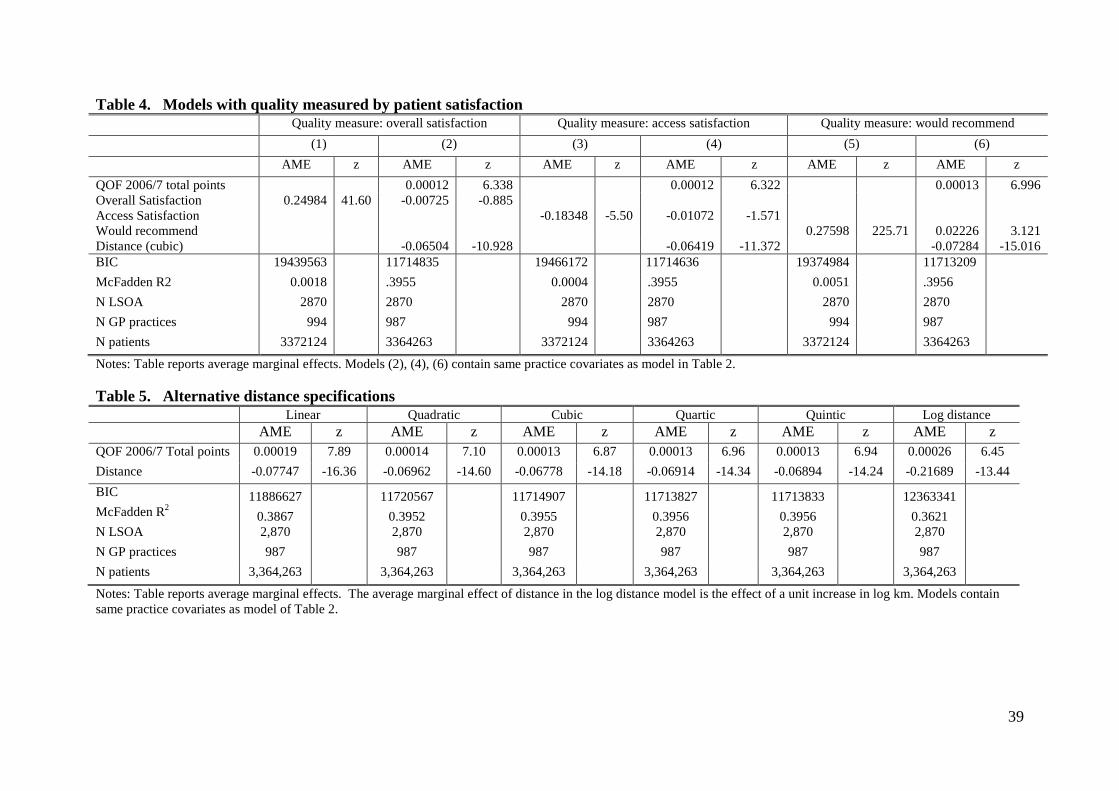
Table 4. Models with quality measured by patient satisfaction Quality measure: overall satisfaction Quality measure: access satisfaction Quality measure: would recommend (1) (2) (3) (4) (5) (6) AME z AME z AME z AME z AME z AME z QOF 2006/7 total points 0.00012 6.338 0.00012 6.322 0.00013 6.996 Overall Satisfaction 0.24984 41.60 -0.00725 -0.885 Access Satisfaction -0.18348 -5.50 -0.01072 -1.571 Would recommend 0.27598 225.71 0.02226 3.121 Distance (cubic) -0.06504 -10.928 -0.06419 -11.372 -0.07284 -15.016 BIC 19439563 11714835 19466172 11714636 19374984 11713209 McFadden R2 0.0018 .3955 0.0004 .3955 0.0051 .3956 N LSOA 2870 2870 2870 2870 2870 2870 N GP practices 994 987 994 987 994 987 N patients 3372124 3364263 3372124 3364263 3372124 3364263
Notes: Table reports average marginal effects. Models (2), (4), (6) contain same practice covariates as model in Table 2. Table 5. Alternative distance specifications Linear Quadratic Cubic Quartic Quintic Log distance AME z AME z AME z AME z AME z AME z QOF 2006/7 Total points 0.00019 7.89 0.00014 7.10 0.00013 6.87 0.00013 6.96 0.00013 6.94 0.00026 6.45 Distance -0.07747 -16.36 -0.06962 -14.60 -0.06778 -14.18 -0.06914 -14.34 -0.06894 -14.24 -0.21689 -13.44 BIC 11886627
11720567
11714907
11713827
11713833
12363341
McFadden R2 0.3867
0.3952
0.3955
0.3956
0.3956
0.3621
N LSOA 2,870 2,870 2,870 2,870 2,870 2,870 N GP practices 987 987 987 987 987 987 N patients 3,364,263 3,364,263 3,364,263 3,364,263 3,364,263 3,364,263
Notes: Table reports average marginal effects. The average marginal effect of distance in the log distance model is the effect of a unit increase in log km. Models contain same practice covariates as model of Table 2.
39
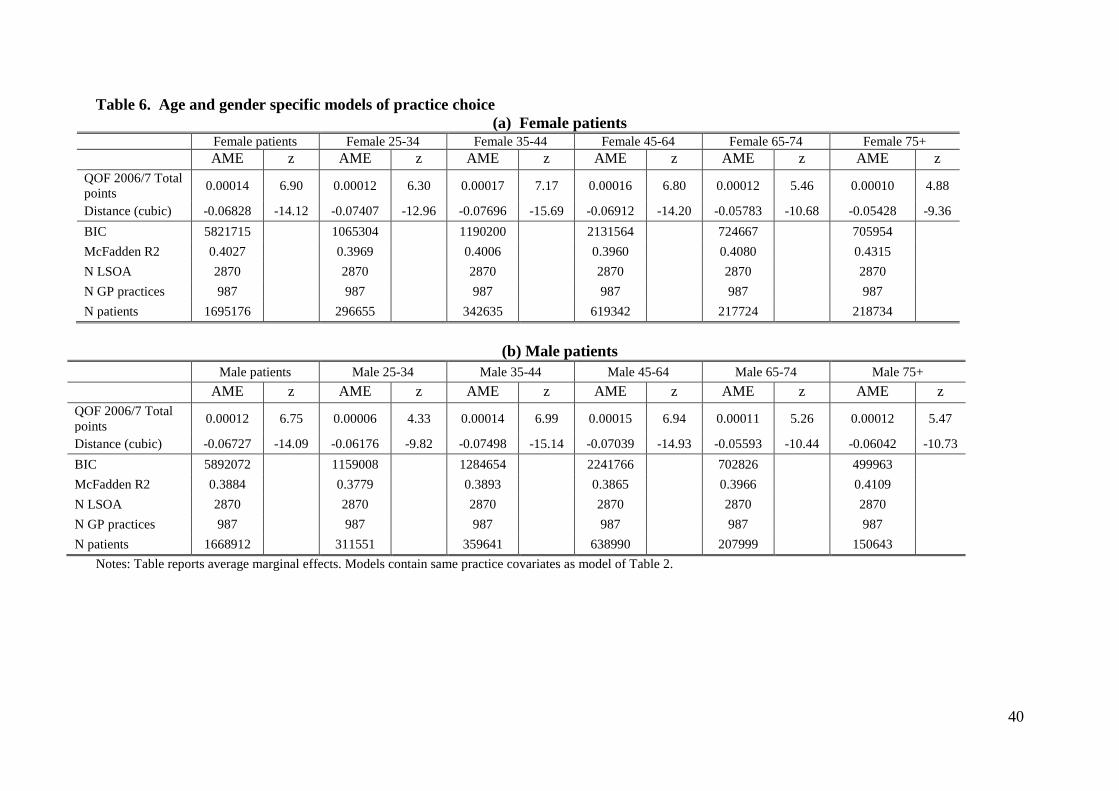
Table 6. Age and gender specific models of practice choice (a) Female patients
Female patients Female 25-34 Female 35-44 Female 45-64 Female 65-74 Female 75+
AME z AME z AME z AME z AME z AME z
QOF 2006/7 Total points 0.00014 6.90 0.00012 6.30 0.00017 7.17 0.00016 6.80 0.00012 5.46 0.00010 4.88
Distance (cubic) -0.06828 -14.12 -0.07407 -12.96 -0.07696 -15.69 -0.06912 -14.20 -0.05783 -10.68 -0.05428 -9.36 BIC 5821715 1065304 1190200 2131564 724667 705954 McFadden R2 0.4027 0.3969 0.4006 0.3960 0.4080 0.4315
N LSOA 2870 2870 2870 2870 2870 2870 N GP practices 987 987 987 987 987 987 N patients 1695176 296655 342635 619342 217724 218734
(b) Male patients
Male patients Male 25-34 Male 35-44 Male 45-64 Male 65-74 Male 75+
AME z AME z AME z AME z AME z AME z QOF 2006/7 Total points 0.00012 6.75 0.00006 4.33 0.00014 6.99 0.00015 6.94 0.00011 5.26 0.00012 5.47
Distance (cubic) -0.06727 -14.09 -0.06176 -9.82 -0.07498 -15.14 -0.07039 -14.93 -0.05593 -10.44 -0.06042 -10.73 BIC 5892072 1159008 1284654 2241766 702826 499963 McFadden R2 0.3884 0.3779 0.3893 0.3865 0.3966 0.4109 N LSOA 2870 2870 2870 2870 2870 2870 N GP practices 987 987 987 987 987 987 N patients 1668912 311551 359641 638990 207999 150643
Notes: Table reports average marginal effects. Models contain same practice covariates as model of Table 2.
40

Table 7. Models stratified by socioeconomic characteristics of small areas (LSOAs) (a) Rurality, income deprivation, education. Rurality Income deprivation Proportion adults with no formal education Urban Rural Lowest 4 quintiles Top quintile Lowest 4 quintiles Top quintile AME z AME z AME z AME z AME z AME z QOF 2006/7 Total points 0.00017 7.98 0.00003 1.80 0.00014 6.10 0.00010 3.40 0.00013 5.81 0.00014 4.10 Distance (cubic) -0.08518 -16.35 -0.01548 -3.47 -0.06056 -12.19 -0.09852 -8.22 -0.06336 -11.64 -0.09623 -10.48 BIC 9447553 2247370 9039531 2648384 9386616 2316353 McFadden R2 0.365 0.501 0.410 0.346 0.396 0.397 N LSOA 2100 770 2295 575 2295 575 N GP practices 811 867 984 676 982 744 N patients 2417776 946487 2720471 643792 2712696 651567 (b) Self assessed health, Asian ethnicity Proportion with poor self assessed health Proportion of Asian ethnicity Lowest 4 quintiles Top quintile Lowest 4 quintiles Top quintile AME z AME z AME z AME z QOF 2006/7 Total points 0.00016 6.51 0.00007 2.77 0.00011 5.18 0.00021 5.93 Distance (cubic) -0.07075 -13.60 -0.06246 -6.06 -0.05234 -10.40 -0.12061 -13.22 BIC 9322153 2383773 8469297 3221563 McFadden R2 0.393 0.408 0.430 0.287 N LSOA 2296 574 2294 576 N GP practices 977 772 980 601 N patients 2707346 656917 2687812 676451 Notes: Table reports average marginal effects. Models also contained a dummy for missing PMS status. Models contain same practice covariates as model in Table 2.
41
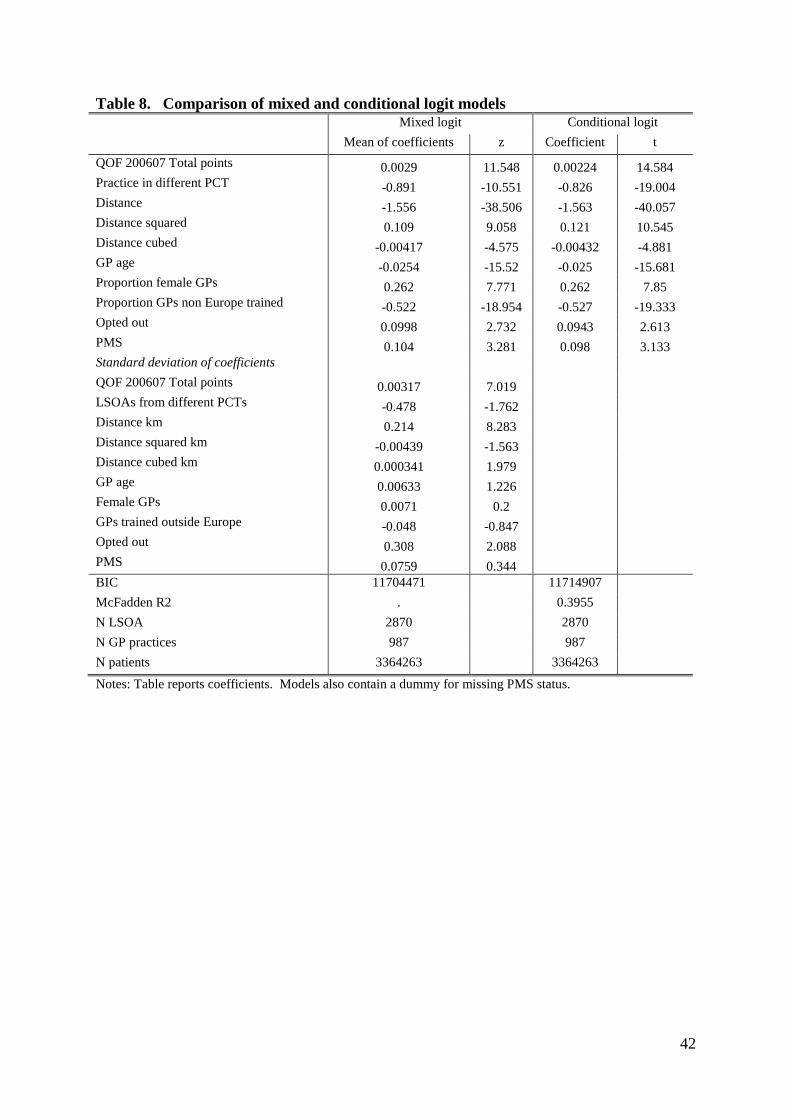
Table 8. Comparison of mixed and conditional logit models Mixed logit Conditional logit Mean of coefficients z Coefficient t QOF 200607 Total points 0.0029 11.548 0.00224 14.584 Practice in different PCT -0.891 -10.551 -0.826 -19.004 Distance -1.556 -38.506 -1.563 -40.057 Distance squared 0.109 9.058 0.121 10.545 Distance cubed -0.00417 -4.575 -0.00432 -4.881 GP age -0.0254 -15.52 -0.025 -15.681 Proportion female GPs 0.262 7.771 0.262 7.85 Proportion GPs non Europe trained -0.522 -18.954 -0.527 -19.333 Opted out 0.0998 2.732 0.0943 2.613 PMS 0.104 3.281 0.098 3.133 Standard deviation of coefficients QOF 200607 Total points 0.00317 7.019 LSOAs from different PCTs -0.478 -1.762 Distance km 0.214 8.283 Distance squared km -0.00439 -1.563 Distance cubed km 0.000341 1.979 GP age 0.00633 1.226 Female GPs 0.0071 0.2 GPs trained outside Europe -0.048 -0.847 Opted out 0.308 2.088 PMS 0.0759 0.344 BIC 11704471 11714907 McFadden R2 . 0.3955 N LSOA 2870 2870 N GP practices 987 987 N patients 3364263 3364263
Notes: Table reports coefficients. Models also contain a dummy for missing PMS status.
42
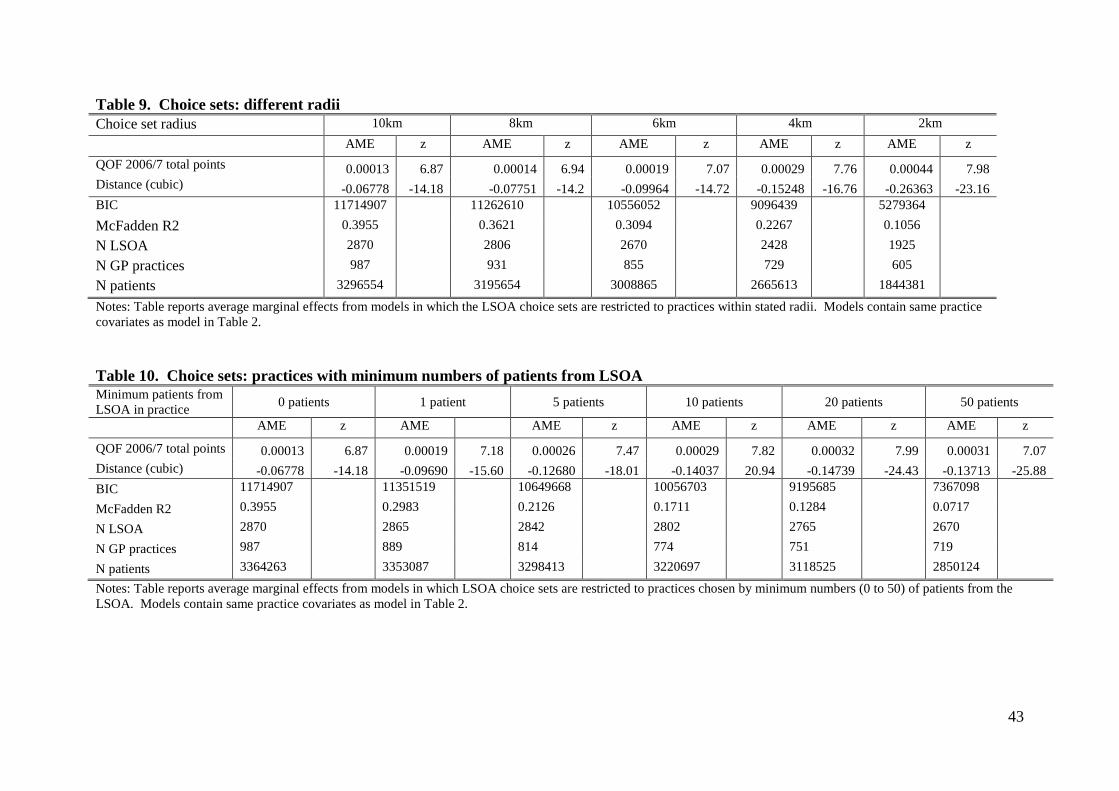
Table 9. Choice sets: different radii Choice set radius 10km 8km 6km 4km 2km AME z AME z AME z AME z AME z QOF 2006/7 total points 0.00013 6.87 0.00014 6.94 0.00019 7.07 0.00029 7.76 0.00044 7.98 Distance (cubic) -0.06778 -14.18 -0.07751 -14.2 -0.09964 -14.72 -0.15248 -16.76 -0.26363 -23.16 BIC 11714907 11262610 10556052 9096439 5279364 McFadden R2 0.3955 0.3621 0.3094 0.2267 0.1056 N LSOA 2870 2806 2670 2428 1925 N GP practices 987 931 855 729 605 N patients 3296554 3195654 3008865 2665613 1844381
Notes: Table reports average marginal effects from models in which the LSOA choice sets are restricted to practices within stated radii. Models contain same practice covariates as model in Table 2. Table 10. Choice sets: practices with minimum numbers of patients from LSOA Minimum patients from LSOA in practice 0 patients 1 patient 5 patients 10 patients 20 patients 50 patients
AME z AME AME z AME z AME z AME z
QOF 2006/7 total points 0.00013 6.87 0.00019 7.18 0.00026 7.47 0.00029 7.82 0.00032 7.99 0.00031 7.07 Distance (cubic) -0.06778 -14.18 -0.09690 -15.60 -0.12680 -18.01 -0.14037 20.94 -0.14739 -24.43 -0.13713 -25.88 BIC 11714907 11351519 10649668 10056703 9195685 7367098
McFadden R2 0.3955 0.2983 0.2126 0.1711 0.1284 0.0717
N LSOA 2870 2865 2842 2802 2765 2670
N GP practices 987 889 814 774 751 719
N patients 3364263 3353087 3298413 3220697 3118525 2850124
Notes: Table reports average marginal effects from models in which LSOA choice sets are restricted to practices chosen by minimum numbers (0 to 50) of patients from the LSOA. Models contain same practice covariates as model in Table 2.
43

Table 11. Instrumented quality
Full sample AME
(1)
Av AME bootstrap models
(2)
z
(3)
QOF 2006/7 Total points 0.00074 0.00073 4.35 QOF 2006/7 residuals -0.00044 -0.00044 -3.02 Different PCT -0.10942 -0.10701 -9.85 Distance (cubic) -0.11108 -0.10686 -18.82 GP age -0.00281 -0.00266 -11.50 Female GPs 0.03084 0.02916 6.52 GPs non Europe trained -0.06328 -0.06204 -10.26 Opted out 0.00803 0.00815 1.78 PMS 0.01021 0.00991 2.36 BIC 11713232 11720971 McFadden R2 0.3956 0.3955 N LSOA 2870 1816 N GP practices 987 965 N patients 3364263 2128248 F statistic on first stage IV 18.53 Notes: Results from two stage residual inclusion (2SRI) conditional logit models. For each model we report the results from the 2SRI model estimated with the full sample of LSOAs, the average of the bootstrap results from 100 replications, and ratio of the observed average marginal effect to the standard deviation of the bootstrap average marginal effects. All models also included a dummy for imputed PMS status.
44

Table 12. Estimated effect sizes for quality and other practice characteristics
Estimates from un-instrumented models Estimates from instrumented models
AME
(1)
Extra metres
(2)
Patients gained
(3)
Elasticity
(4)
AME
(5)
Extra metres
(6)
Patients gained
(7)
Elasticity
(8) 2006/7 QOF points (1/10th SD increase) 0.00082 12.4 103.6 1.44 0.00472 31.0 255.9 3.59
Standard error 0.00012 0.9 9.4 0.06 0.00108 5.3 30.1 0.59 Av age GPs (1/10th SD increase) -0.00096 -14.6 -120.6 0.003 -0.00188 -12.4 -102.1 0.00
Standard error 0.00007 0.9 5.3 0.00 0.00016 1.2 6.2 0.00 Prop female GPs (1/10th SD increase) 0.00374 56.7 468.1 0.07 0.03824 50.2 414.8 0.06
Standard error 0.00061 7.2 47.3 0.01 0.00586 7.3 45.3 0.01 Prop non-European trained GPs (1/10th SD increase)
-0.01072 -162.7 -1342.4 -0.08 -0.11200 -147.2 -1215.1 -0.07
Standard error 0.00103 -8.7 93.6 0.00 0.01091 -9.6 90.6 0.00 Notes: 1/10th SD 2006/7 points 6.36; 1/10th SD average GP age: 0.67 years; 1/10th SD proportion female GPs: 0.025. 1/10th SD proportion non-European trained GPs: 0.035. AME: average marginal effect. Metres: number of metres patients would be willing to travel to practice with one unit higher value of characteristic. Patients gained: number of additional patients aged 25 and over choosing a practice if characteristic increased by one standard deviation. Elasticity: percentage increase in number of patients aged 25 and over choosing a practice from a one percent increase in the characteristic.
45

[Appendices A to C are part of the version of the paper which will be available as a working paper in the CHE, CMPO and CEPR series.] Appendix A Table A.1 Data sources Data set Variables Source Attribution Data Set
Nos patients in each LSOA by age/gender on list of each practice
NHS Information Centre for Health and Social Care.
Quality and Outcomes Framework
QOF points total and by indicator; numbers for whom indicator achieved, exceptions.
www.ic.nhs.uk/statistics-and-data-collections/audits-and-performance/the-quality-and-outcomes-framework.
GP Patient Survey
Patient satisfaction with practice
www.gp-patient.co.uk/archive_weighted/practicereport
Hospital Episode Statistics
Emergency admissions for ambulatory care sensitive conditions
www.hesonline.nhs.uk
General Medical Service Statistics
Age, gender, country of qualification of GPs, practice contract, out of hour status, dispensing status, location.
NHS Information Centre for Health and Social Care
NHS Choices Location of branch practices
www.nhs.uk/Pages/HomePage.aspx
Neighbourhood Statistics
Socio-economic and demographic measures at LSOA level
www.neighbourhood.statistics.gov.uk/dissemination
Index of Multiple Deprivation
LSOA income deprivation;
www.communities.gov.uk/publications/communities/indiciesdeprivation07
Office of National Statistics
LSOA rurality classification
www.ons.gov.uk/ons/guide-method/geography/products/area-classifications/index.html
46

Table A2. Ambulatory Care Sensitive Conditions: ICD10 Codes Asthma J45 J46 Circulatory system I110 I130 I132 I10 I119 I129 I139 COPD J20 J41 J42 J43 J44 J47 J40 Stroke/LVD I60 I61 I63 I64 I66 I672 I698 R470 EPILEPSY G40 G41 R56 G253 R568 CHD/LVD I20 I240 I248 I249 I25 R072 I21 I22 I110 I130 I132 I255 I50 J81 Diabetes E110 E111 E112 E113 E114 E115 E116 E117 E118 E119 E10 E120
E121 E122 E128 E130 E131 E132 E133 E134 E135 E136 E137 E138 E140 E141 E142 E143 E144 E145 E146 E147 E148
DKD or Dementia N03 F00 F01 F02 F03 Alcohol-related disease F10 Perforated appendix K350 K351 Dehydration & gastroenteritis A020 A04 A059 A072 A080 A081 A083 A082 A084 A085 A09 E86
K520 K521 K522 K528 K529 Cellulitis I891 L010 L011 L020 L021 L022 L023 L024 L028 L029 L03 L04
L080 L088 L089 L88 L980 ENT H66 H67 J02 J03 J040 J06 J312 Gangrene R02 Influenza and pneumonia A481 A70 J10 J11 J120 J121 J122 J128 J129 J13 J14 J153 J154 J157
J159 J160 J168 J18 J181 J189 J180 J188 Iron-deficiency anaemia D460 D461 D463 D464 D501 D508 D509 D510 D511 D512 D513
D518 D520 D521 D528 D529 D531 D571 D580 D581 D590 D591 D592 D599 D601 D608 D609 D610 D611 D640 D641 D642 D643 D644 D648 E40 E41 E42 E43 E550 E643
Other vaccine preventable diseases A35 A36 A37 A80 B05 B06 B161 B169 B180 B181 B26 G000 M014 Pelvic inflammatory N70 N73 N74 Perforated/bleeding ulcer K20 K210 K219 K221 K226 K250 K251 K252 K254 K255 K256
K260 K261 K262 K264 K265 K266 K270 K271 K272 K274 K275 K276 K280 K281 K282 K284 K285 K286 K920 K921 K922
Atrial fibrillation and flutter I498 R000 I471 I479 I499 R002 R008 I495 Constipation K590 Urinary infection N11 N136 N10 N151 N159 N12 N390 N300 N309 N308 Fracture proximal femur S722 S720 S721 Peripheral vascular disease I73 I738 I739 Failure to thrive R629 Dyspepsia K21 K30 Hypokalemia E876 Low birth weight P050 P052 P059 P072 P073 Migraine G43 G440 G441 G443 G444 G448 R51 Tuberculosis A15 A16 A17 A18 A19 Dental conditions A690 K098 K099 K02 K03 K04 K05 K06 K08 K12 K13
47

Table A3. Correlations between quality measures
QO
F 20
06/7
cl
inic
al p
oint
s
QO
F 20
06/7
or
gani
satio
nal
QO
F 20
06/7
pa
tient
ex
perie
nce
QO
F 20
06/7
ad
ditio
nal
serv
ices
QO
F 20
06/7
ho
listic
car
e
QO
F 20
06/7
to
tal p
oint
s
QO
F 00
9/10
to
tal p
oint
s
2006
/7-0
9/10
to
tal p
oint
s 20
06/7
-200
9/10
AC
SCs 2
006/
7
Wou
ld
reco
mm
end
2009
Ove
rall
patie
nt
satis
fact
ion
2009
satis
fact
ion
witn
op
enin
g h
ours
Popu
latti
on
achi
evem
ent
2009
/10
QOF 2006/7 organisational 0.531 1.000 QOF 2006/7 patient experience 0.354 0.443 1.000
QOF 2006/7 additional services 0.388 0.513 0.549 1.000
QOF 2006/7 holistic 0.916 0.494 0.320 0.357 1.000 QOF 2006/7 total points 0.897 0.791 0.638 0.589 0.831 1.000 QOF 2009/10 total points 0.511 0.351 0.207 0.243 0.489 0.494 1.000 Average QOF total points 2006/7-2009/10 0.812 0.656 0.467 0.478 0.766 0.856 0.805 1.000
ACSCs 2006/7 -0.108 -0.049 -0.059 -0.096 -0.089 -0.101 -0.163 -0.147 1.000 Proportion patients who would recommend practice 2009 0.199 0.182 0.204 0.175 0.225 0.244 0.380 0.377 -0.239 1.000
Overall patient satisfaction 2009 0.152 0.151 0.172 0.143 0.181 0.194 0.363 0.332 -0.187 0.917 1.000
Satisfaction with opening hours 2009 0.039 0.071 0.041 0.035 0.045 0.060 0.307 0.199 0.019 0.551 0.651 1.000
Population achievement 2009/10 0.467 0.232 0.114 0.168 0.441 0.401 0.752 0.611 -0.119 0.167 0.160 0.151 1.000
Reported achievement 2009/10 0.431 0.222 0.108 0.166 0.405 0.373 0.833 0.627 -0.133 0.142 0.126 0.141 0.868
48

Appendix B. Additional results Table B1. Models with alternative clinical quality measures
Baseline model (Quality measure: total
2006/7 QOF points)
Quality measure: reported achievement
2009/10
Quality measure: population
achievement 2009/10
Baseline plus ACSCs 2006/7
AME z AME z AME z AME z QOF 2006/7 total points 0.00013 6.87 0.00012 6.514 Reported achievement 2009/10 -0.00221 -1.079 Population achievement 2009/10 0.00029 0.1073 ACSCs 2006/7 -0.000004 -0.58 Distance (cubic) -0.06778 -14.18 -0.016 -6.869 -0.0182 -7.578 -0.06659 -13.122 BIC 11714907 11808124 11808224 11674461 McFadden R2 0.3955 0.3936 0.3936 0.3960 N LSOA 2870 2870 2870 2869 N GP practices 987 994 994 985 N patients 3364263 3372124 3372124 3355743
Notes. Average marginal effects and z statistics reported. All models also contain same covariates as Table 2. Reported achievement for practice j is
( )( ) ( )max max/ /jq jq q qq qN D π π∑ ∑ where Njq is the number of patients for whom QOF clinical indicator q is achieved by practice j, Djq is the number of patients who are
declared eligible for indicator q, maxqπ is the maximum number of points achievable for indicator q. Population achievement is ( )( )( ) ( )max max/ /jq jq jq q qq q
N D E π π+∑ ∑
where Ejq is the number of patients exception reported for indicator q by practice j. ACSCs is the number of emergency admissions for ambulatory care sensitive conditions of practice patients per 10,000 patients registered with the practice.
49

Table B2. First stage estimates of practice quality (total 2006/7 QOF points) Coefficient
(t stat) Different PCT 9.624 (1.739) Distance -5.287 (-0.896) Distance squared -0.0685 (-0.053) Distance cubed 0.0647 (0.642) GP age -1.167 (-3.407) Female GPs 11.25 (1.355) GPs non Europe trained -19.16 (-2.992) PMS 5.895 (0.962) PMS imputed -77.16 (-4.200) Opted Out 7.109 (1.130) 2 NN QOF 2006/7 0.177 (4.306) Constant 846.3 (18.451) Observations 987 BIC 10988 F statistic 18.54
Notes. The model is for the first stage of the two stage residual inclusion patient choice model reported in Table 11. The dependent variable is total 2006/7QOF points. Different PCT, Distance, Distance squared, Distance cubed are the averages of these practice-LSOA variables over the LSOAs whose choice sets included the practice. 2 NN QOF 2006/7 is the average of QOF total points 2006/07 in the practice’s two nearest neighbours. The F statistic is for the instrument.
50

Appendix C. Practice choice of catchment area and quality Suppose that practice j sets a catchment area defined by a radius kj from its surgery. It accepts
all patients who wish to join the practice provide they live within the catchment area. The
choice set for the LSOA is the set of practices within whose catchment areas the LSOA falls:
{ }a aj jC j d k= ≤ (C1)
We do not observe kj. We estimate models of patient choice by specifying the LSOA a choice
set to be all practices j within a radius k of the LSOA centroid ie we specify the choice set to
be
{ }ka ajC j d k= ≤ (C2)
If we estimate patient choice models where we only include observations of naj within a
radius k from the LSOA centroid and k > kj for some j then the conditional logit model may
not yield consistent estimates of patient preferences. If there are LSOAs and practices for
which k > daj > kj we will not observe any patients from a choosing practice j but this is due to
the choice of catchment area by practice j and does not reflect choices by patients. The
estimated coefficients will depend on patient preferences and the factors affecting practice
decisions on catchment areas.
McFadden (1974) has shown that, when the observed choices maximise a linear utility
function where the errors in the utility function follow the extreme value distribution, the
estimated conditional logit model coefficients are consistent estimates of the marginal utility
from choice characteristics. A subsequent paper (McFadden, 1978) proves that this result
also holds when the model is estimated on a data set in which the set of alternatives for each
individual satisfies the same type of arbitrary restriction.
Thus if we estimate models where we specify choice sets with
min { }j jk k≤ (C3)
so that none of the practice catchment area constraints bind, we will produce consistent
estimates of patient preferences over characteristics of practices. The smaller the k defining
the choice sets for the estimated model, the more likely is it that the estimated coefficients are
the consistent estimates of patient marginal utility. But the smaller is k the fewer the number
of observations satisfying the constraint and the less the precise the estimates.
51

These conclusion hold even though the practice catchment area is chosen to maximise
practice utility and even if the practice takes account of the possible effect of catchment area
on its quality and hence on patient demand. The set of LSOAs within the catchment area is
Sj = S(kj) = {a|daj ≤ kj}. (C4)
where daj is the distance from LSOA to practice j. The expected list of practice j is
nj = j j
h h h hj aj a ajh a S h a S h
n n n P∈ ∈
= =∑ ∑ ∑ ∑ ∑
( , ; , , )j
h h aa j aj j j ja S h
n P q d − − −∈= ⋅∑ ∑ q d k
= ( , ; , , , , )j j j j j jn q k − − − ⋅d q d k (C5)
where hjn is the number of patients of type h who chose the practice, h
ajn is the number of
patients of type h from LSOA a who choose practice j, han is number of patients of type h in
LSOA a. q-j, is the vector of the qualities of all other practices, aj−d is the vector of distances
to all other practices from LSOA a, and k-j is the vector of the catchment area radii of all
other practices. hajP = Ph(qj,daj,⋅) is probability that a patient of type h in LSOA a chooses
practice j.
The list of practice j is increasing in the size of its catchment area and its quality, and
decreasing in the size of other practices’ catchment areas and quality.
Practice quality qj is increasing in the effort by the practice and possibly decreasing in its
catchment area if nearby patients are more likely to attend the practice to enable it to achieve
its quality indicators. Quality may also depend on the mix of patient types on the practice list
qj = q(ej, kj, hjn ), qej > 0, qkj ≤ 0 (C6)
where hjn = ( 1 ,..., H
j jn n ). Substituting h h hj aj aja
n n P=∑ into (C6) and using the implicit function
theorem,23 we can write the quality production function as
( , ; , , , , )oj j j j j j jq q e k − − −= ⋅d q d k (C7)
where we allow for the indirect effects of ej and kj on quality via their effect on the mix of
patients. Note that, although the practice can set a catchment area, it is not permitted to
23 We assume that ( )( ) 11 / /h h
j j jhq n n q
−< ∂ ∂ ∂ ∂∑ so that 0, 0o o
e kq q> ≤ .
52

directly select by type amongst patients in the catchment area. It will however take account of
the effect of its choice of catchment area on the mix of patients.
Practice revenue depends on quality (via the QOF) and on the number of patients and costs
are increasing in the number of patients, effort and the distance to patients:
Rj = R(nj,qj,⋅ ), Rn > 0, Rq > 0 (C8)
cj = c(nj,ej,kj,⋅), cn > 0, ce > 0, ck > 0 (C9)
Practice j is altruistic and cares about practice income and quality
uj = u(yj, qj) = u(Rj − cj, qj), uy > 0, uq > 0 (C10)
and chooses effort and catchment area to satisfy
( ) 0o o oy q n q e n q e e q eu R R n q c n q c u q + − − + = (C11)
( ) ( ) 0o oy n k q k n k q k ku R n n q c n n q c + − + − = (C12)
In the Nash equilibrium where all practices choose their optimal ej and kj taking the decisions
of other practices as given, the quality and catchment area of each practice will depend on
parameters in the practice revenue, cost and utility functions and, via the demand function, on
parameters in the patient utility function and on the parameters in the revenue, cost and utility
functions of all other practices. Individual patients will ignore the effect of their decisions
on practice quality since even when quality depends on the patient mix a decision by a patient
to join a practice will have a negligible effect on practice quality.
53
Related Documents


