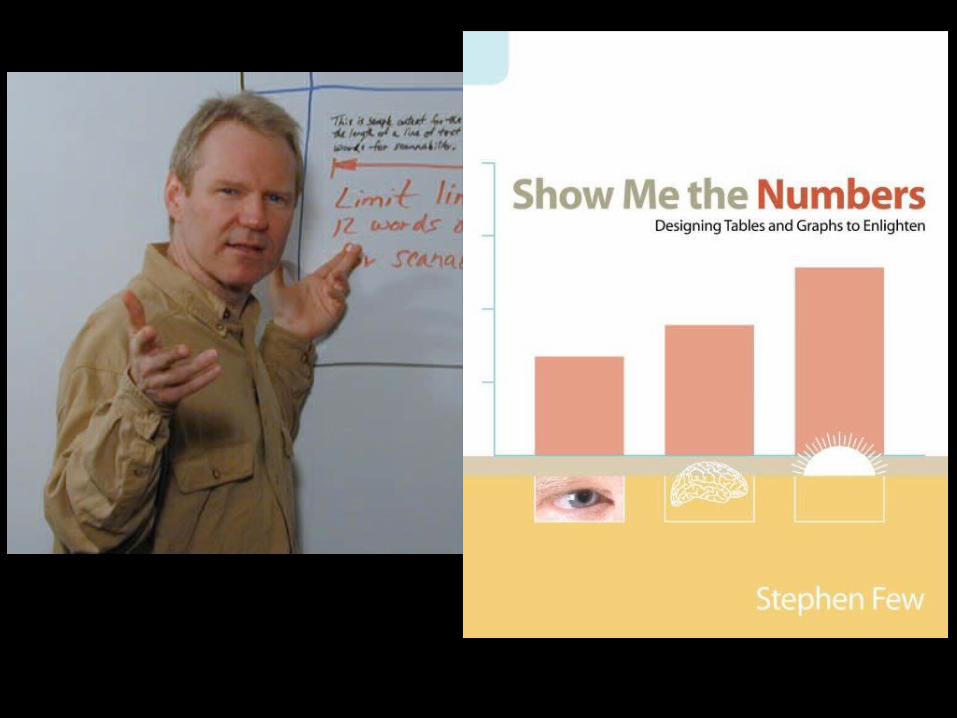
The Census Bureau’s Data Visualization Mission: To increase the ratio of graphics to text in Census Bureau publications, both online and in print; To open our datasets and analyses to a broader public.

Welcome message from author
This document is posted to help you gain knowledge. Please leave a comment to let me know what you think about it! Share it to your friends and learn new things together.
Transcript

The Census Bureau’s Data Visualization Mission:
To increase the ratio of graphics to text in Census Bureau publications, both online and in print;
To open our datasets and analyses to a broader public.


9

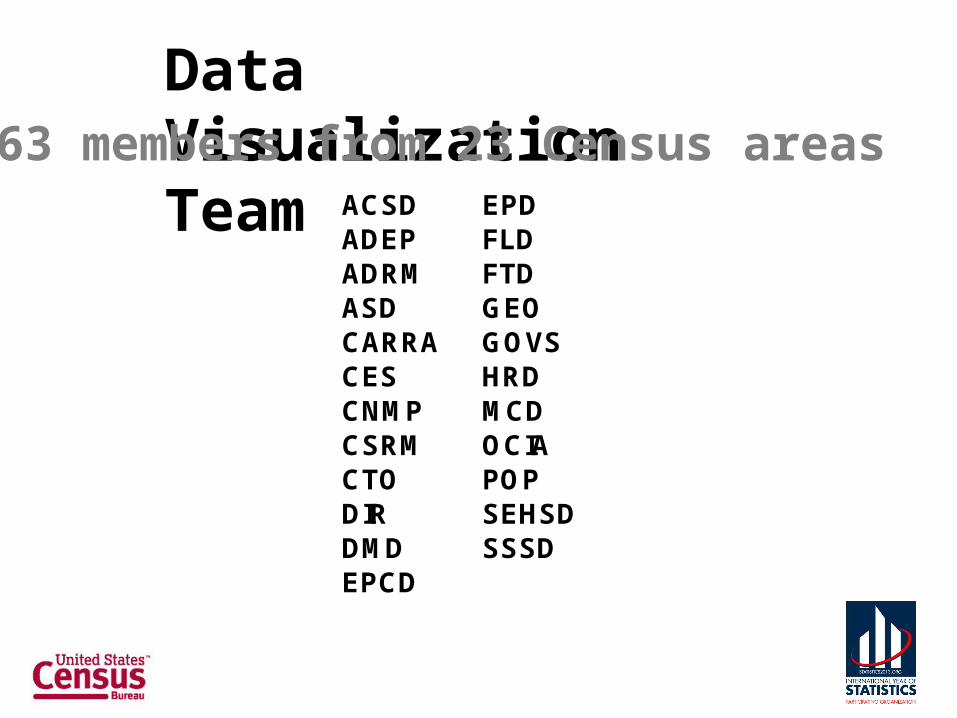
Data Visualization Team
ACSD EPDADEP FLDADRM FTDASD GEOCARRA GOVSCES HRDCNMP MCDCSRM OCIACTO POPDIR SEHSDDMD SSSDEPCD
63 members from 23 Census areas
18
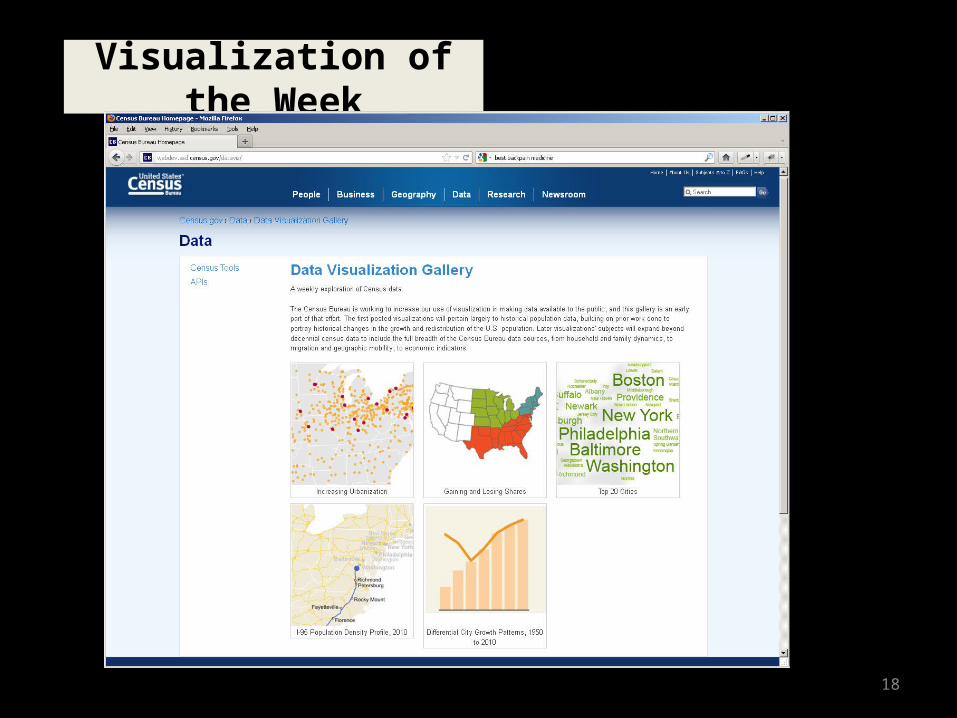
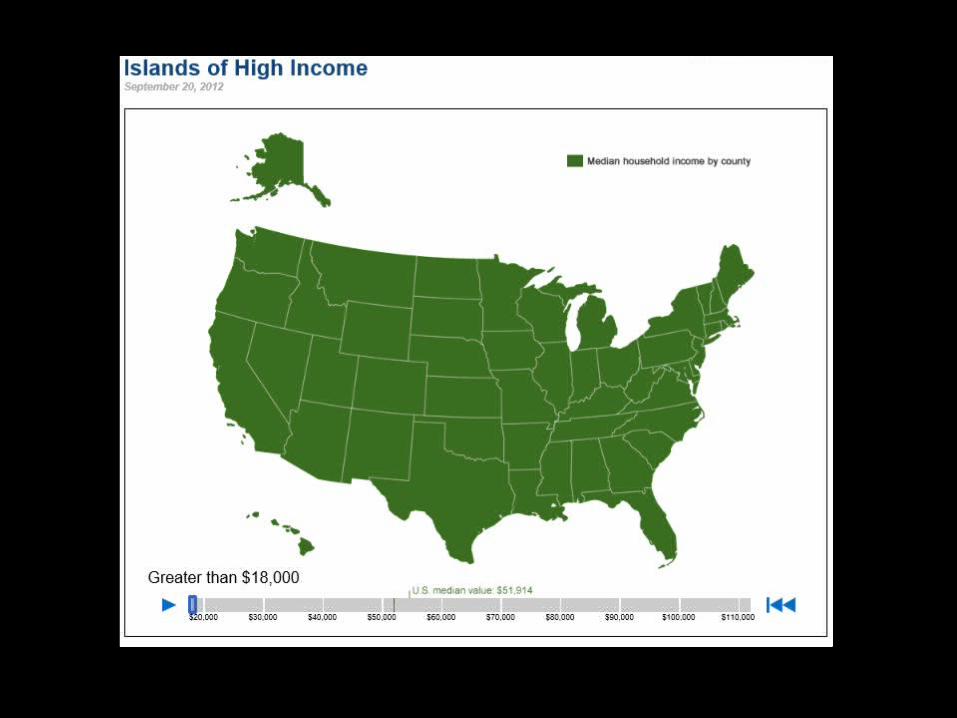
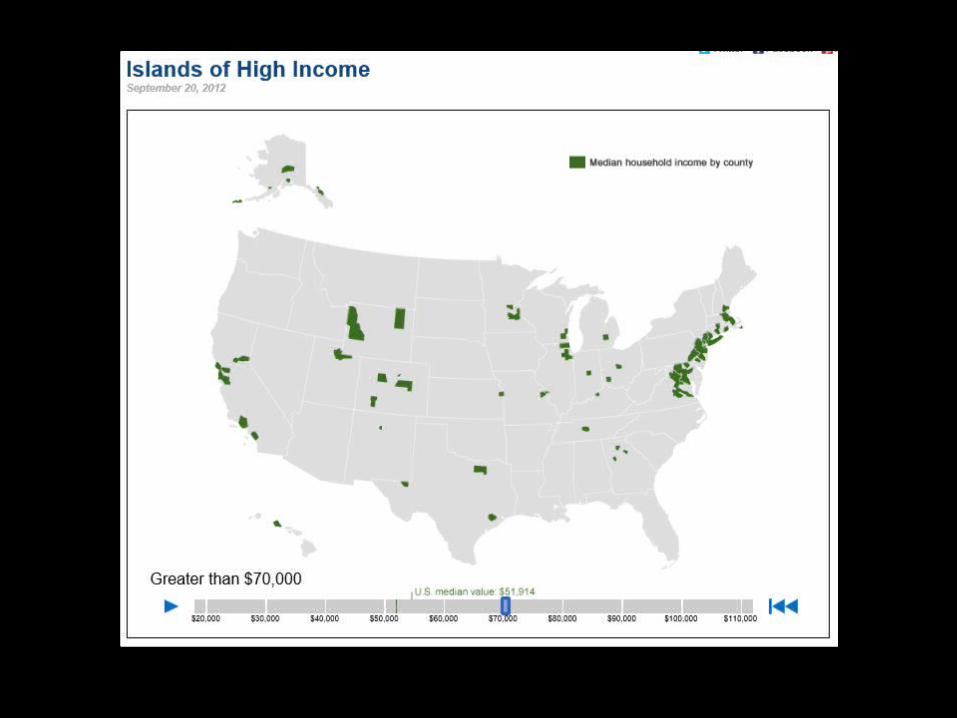
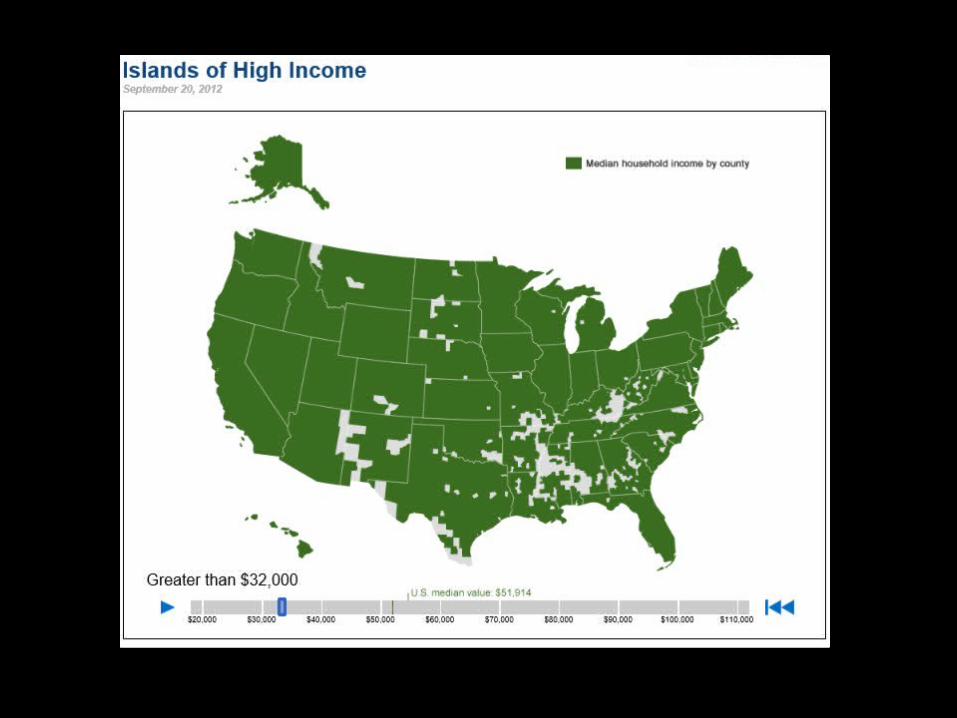
Visualization of the Week
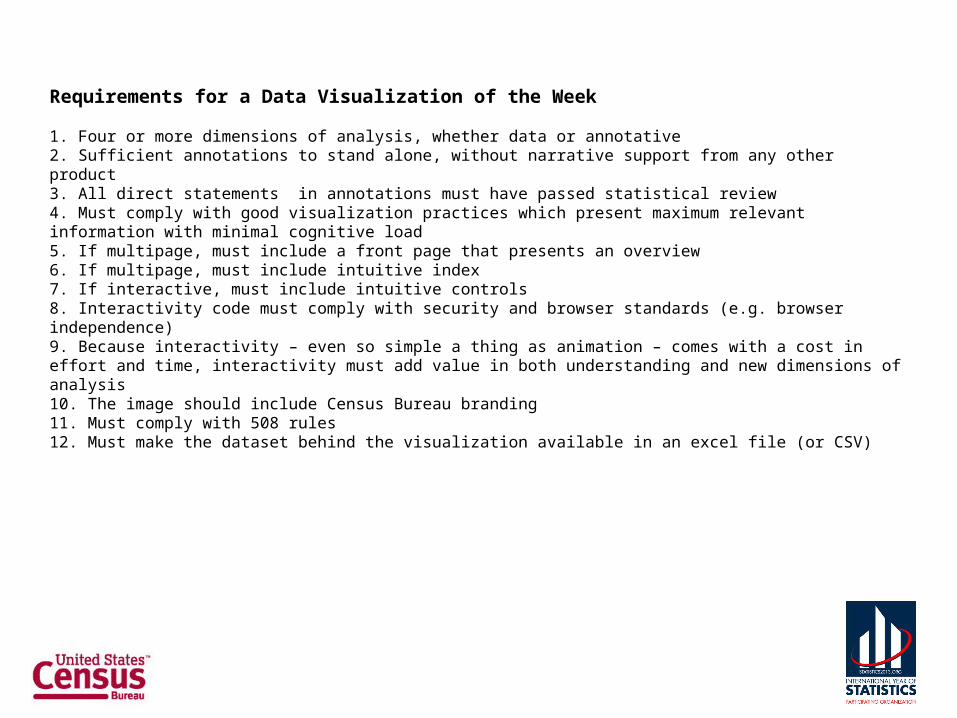
Requirements for a Data Visualization of the Week
1. Four or more dimensions of analysis, whether data or annotative2. Sufficient annotations to stand alone, without narrative support from any other product3. All direct statements in annotations must have passed statistical review4. Must comply with good visualization practices which present maximum relevant information with minimal cognitive load5. If multipage, must include a front page that presents an overview6. If multipage, must include intuitive index 7. If interactive, must include intuitive controls8. Interactivity code must comply with security and browser standards (e.g. browser independence)9. Because interactivity – even so simple a thing as animation – comes with a cost in effort and time, interactivity must add value in both understanding and new dimensions of analysis10. The image should include Census Bureau branding11. Must comply with 508 rules12. Must make the dataset behind the visualization available in an excel file (or CSV)
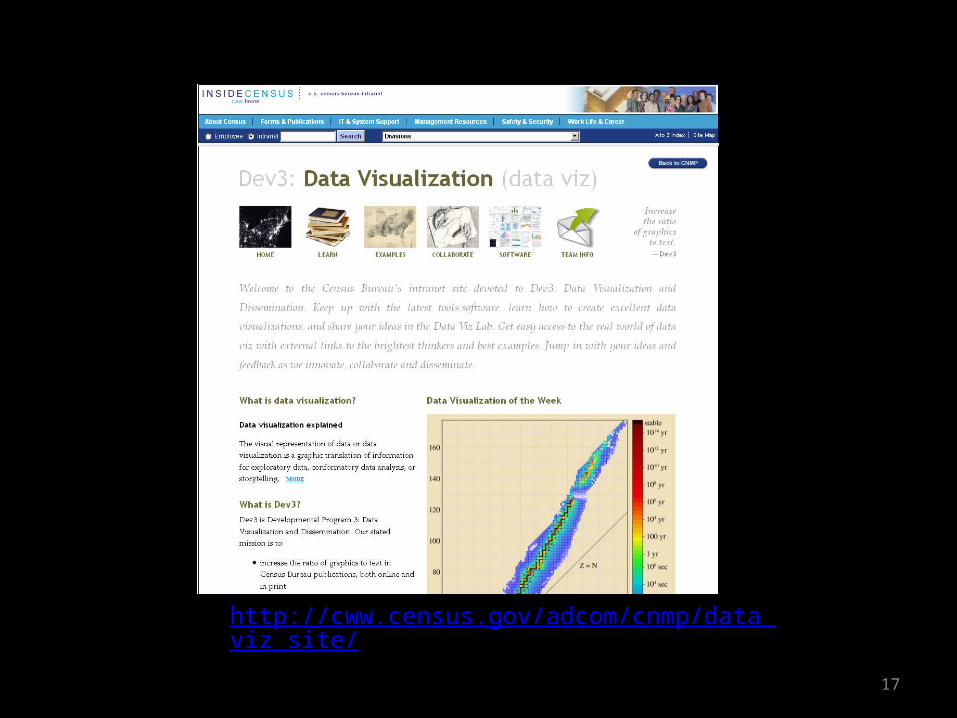
Related Documents