1 Seminar in Economics The causal link between short-term and long-term inflation expectations Alexander Czombera ([email protected]) Jonas Neise ([email protected]) 6 th Semester 26 th Februrary 2015 Supervisor: Prof. Dr. Michael Frenkel Tutor: Matthias Mauch Abstract Long-run and short-run inflation expectations indicate the quality of anchoring and central bank credibility for its inflations target and expected pass-through of inflationary shocks. In this paper we provide a comprehensive literature review and find that changes and credibility of policy targets are passed through long-run and short-run expectations while shocks affect mainly short-run expectations and influence long-run expectations if they are sequential and not-accommodated. We exemplify our hypothesizes by empirical models and find that short- term expectations compared to the medium-term have a weaker link to long-term expectations.

Welcome message from author
This document is posted to help you gain knowledge. Please leave a comment to let me know what you think about it! Share it to your friends and learn new things together.
Transcript
1
Seminar in Economics
The causal link between short-term and long-term inflation
expectations
Alexander Czombera
Jonas Neise
6th Semester
26th Februrary 2015
Supervisor: Prof. Dr. Michael Frenkel
Tutor: Matthias Mauch
Abstract
Long-run and short-run inflation expectations indicate the quality of anchoring and central
bank credibility for its inflations target and expected pass-through of inflationary shocks. In
this paper we provide a comprehensive literature review and find that changes and credibility
of policy targets are passed through long-run and short-run expectations while shocks affect
mainly short-run expectations and influence long-run expectations if they are sequential and
not-accommodated. We exemplify our hypothesizes by empirical models and find that short-
term expectations compared to the medium-term have a weaker link to long-term
expectations.
2
Table of Contents
1. Introduction .................................................................................................................................................. 6
2. Definitions of Inflation Expectations and Expectation Forming ............................................. 8
2.1 Inflation Expectations and Expectations Forming ....................................................................... 8
2.2 Inflation Targeting and Rule-Based Monetary Policy ......................................................... 9
2.3 Practical Implication: Monetary Policy and Inflation Expectations .................................... 12
3. Interdependence Between Short-Term and Long-Term Expectations .............................. 15
3.1 Influence of Short-Term on Long-Term Expectations - Exogenous Shocks and
Credibility Proofs ...................................................................................................................................... 15
3.2 Influence of Long-Term on Short-Term Expectations – Credibility of Policy
Changes ....................................................................................................................................................... 19
3.3 Measuring Dynamics of Inflation Expectations - A Survey Approach .............................. 21
4. Implications of a Heterogeneous Currency Union on Expectation Building – The
Current Case of the Euro Area .............................................................................................................. 27
4.1 Theory and Implications ............................................................................................................... 27
5. Statistical Analysis .................................................................................................................................. 29
5.1 Data Description ............................................................................................................................... 29
5.2 Towards a Causal Link ...................................................................................................................... 34
6. Conclusion .................................................................................................................................................. 48
References ....................................................................................................................................................... 50
Appendix .......................................................................................................................................................... 55
3
List of Figures and Tables Charts
Chart 3.2.1: India Inflation Rate (CPI) 54
Chart 3.3.1: Mean of individual forecasts 54
Chart 3.3.2: Median of individual forecasts 55
Chart 3.3.3: Standard deviation of individual forecasts 55
Chart 3.3.4: Interquartile range of individual forecasts 56
Chart 3.3.5: Proportion of changes in inflation expectations per week 56
Chart 4.1.1: 10-year government bonds - nominal yields 57
Chart 4.1.2: 10-year government bonds - real yields 57
Chart 4.1.3: Inflation (change in CPI YoY) 58
Chart 4.1.4: Nominal GDP per capita growth 58
Chart 5.1.1: Variance of inflation expectations in squared percentage points 30
Chart 5.1.2: Distribution of 1-year inflation expectations 30
Chart 5.1.3: Distribution of long-run inflation expectations 31
Chart 5.1.4: Distribution of 1-year inflation expectations 31
Chart 5.1.5: Mean and median 1-year inflation expectations 32
Chart 5.1.6: Mean and median 2-year inflation expectations 32
Chart 5.1.7: Mean and median long-run inflation expectations 32
Chart 5.1.8: Eventually realized inflation rates vs. forecasts 33
Figures
Figure 5.2.1: 2-year estimate regressed over 1-year estimates 34
Figure 5.2.2: Long-run estimates regressed over 1-year and 2-year estimates 34
Figure 5.2.3: 1-year estimates regressed over 60-month, 36-month, 12-month and actual
inflation
35
Figure 5.2.4: 2-year estimates regressed over 60-month, 36-month, 12-month and actual
inflation
36
Figure 5.2.5: long-run estimates regressed over 60-month, 36-month, 12-month and actual
inflation
36
Figure 5.2.6: 1-year inflation expectations regressed over economic data 38
Figure 5.2.7: Changes in 1-year inflation expectations regressed over changes in economic
data
39
Figure 5.2.8: 2-year inflation expectations regressed over economic data 39
Figure 5.2.9: Changes in 2-year inflation expectations regressed over changes in economic
4
data 3 40
Figure 5.2.10: Long-run inflation expectations regressed over economic data 41
Figure 5.2.11: Changes in long-run inflation expectations regressed over changes in economic
data
41
Figure 5.2.12: 1-year inflation expectations regressed over probabilities of default 42
Figure 5.2.13: 2-year inflation expectations regressed over probabilities of default 43
Figure 5.2.14: Long-run inflation expectations regressed over long-run economic forecasts
and short- and medium-run inflation expectations
44
Figure 5.2.15: Changes in long-run inflation expectations regressed over changes long-run
economic forecasts and changes in short- and medium-run inflation expectations
45
Figure 5.2.16: Correlation matrix of economic variables 45
Figure 5.2.17: Correlation matrix of changes in economic variables 46
Tables
Table 5.1.1: Quality of estimates – realized inflation vs. consensus forecast 33
5
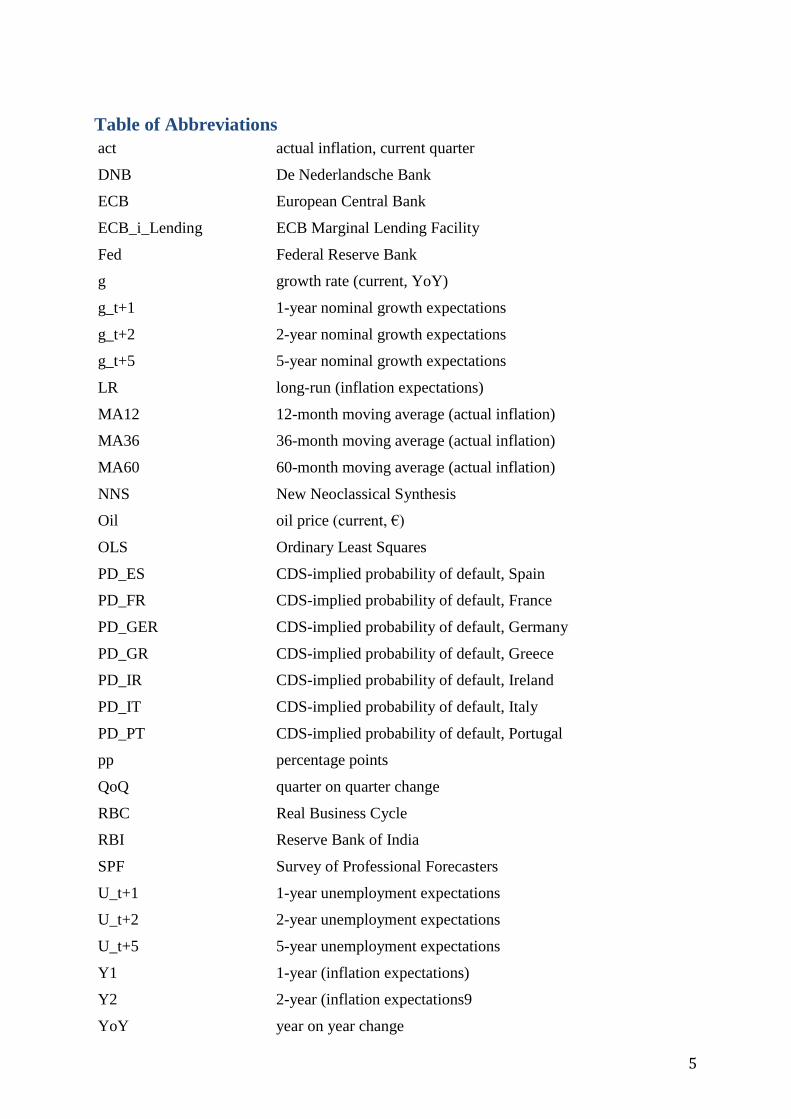
Table of Abbreviations
act actual inflation, current quarter
DNB De Nederlandsche Bank
ECB European Central Bank
ECB_i_Lending ECB Marginal Lending Facility
Fed Federal Reserve Bank
g growth rate (current, YoY)
g_t+1 1-year nominal growth expectations
g_t+2 2-year nominal growth expectations
g_t+5 5-year nominal growth expectations
LR long-run (inflation expectations)
MA12 12-month moving average (actual inflation)
MA36 36-month moving average (actual inflation)
MA60 60-month moving average (actual inflation)
NNS New Neoclassical Synthesis
Oil oil price (current, €)
OLS Ordinary Least Squares
PD_ES CDS-implied probability of default, Spain
PD_FR CDS-implied probability of default, France
PD_GER CDS-implied probability of default, Germany
PD_GR CDS-implied probability of default, Greece
PD_IR CDS-implied probability of default, Ireland
PD_IT CDS-implied probability of default, Italy
PD_PT CDS-implied probability of default, Portugal
pp percentage points
QoQ quarter on quarter change
RBC Real Business Cycle
RBI Reserve Bank of India
SPF Survey of Professional Forecasters
U_t+1 1-year unemployment expectations
U_t+2 2-year unemployment expectations
U_t+5 5-year unemployment expectations
Y1 1-year (inflation expectations)
Y2 2-year (inflation expectations9
YoY year on year change
6
1. Introduction
More than 2000 years ago Plato (1970) described expectations as a concept based on beliefs
about the future. Nowadays, these beliefs are defined as a synergetic result of behavioral and
psychological elements. The importance of expectations becomes evident when people
change their current behavior in light of their beliefs about the future. This conceptual model
has still retained its validity in economics as well since expectations about the future affect
the current behavior of economic agents.
Therefore, economic expectations are generally referred to as explicit forecasts or implicit
opinions that economic agents hold about future prices, income, taxes or the overall level of
economic activity in general. Following this approach, inflation expectations can be
determined as the view or opinion of economic agents about future inflation. As inflation is a
factor that affects almost every economic entity in an economy, inflation expectations play a
crucial role in macroeconomics and especially monetary policy.
If people form expectations that are below the realized level they spend less than they would
have done otherwise. Instead, they save more against their bright future at the given interest
rate as they believe the purchasing power of their currency holdings will not change
significantly. This leads to a decrease in aggregate demand and may translate into a self-
fulfilling disinflation.
By contrast, if they hold too high inflation expectations they will demand a higher interest rate
to compensate them for the loss in real value of their cash holdings. As the central bank may
be unwilling to increase the interest rate people will consume more (rather than save) and at
the given supply curve inflate prices. Alternatively, they may also purchase assets that
promise some type of inflation protection such as gold or real estate. However, as they usually
yield only a small real return they do not meet the preferences of all agents.
As Bernanke & Gertler (2000) note asset prices incorporate inflationary and deflationary
pressures. They suggest a model of flexible inflation targeting to assure macroeconomic and
financial stability. Such a model provides an anchor for inflation expectations and thus
reduces the effects of volatile inflation expectations on asset prices.
Inflation expectations differ with regards to the time frame. Long-run expectations are in most
developed markets anchored to some target rate set by the central bank which has
demonstrated credibility for its objective. Yet, short-run expectations may deviate from it.
Rather than being purely based on explicit policy rates they also incorporate short-term
shocks to demand, supply, and monetary policy that result in inflation or deflation after a
7
certain time lag. A central bank has to be concerned about both types of inflation
expectations: long-run expectations to guide the pricing of production and investment goods
and estimation of nominal and real returns, and short-run expectations in order to keep
markups of monopolistically competitive firms at their profit maximizing level and thus avoid
volatile adjustments in prices and employment1 in consumption goods.
In our paper we try to identify the causal link between short-term and long-term inflation
expectations. In the first part we begin with defining the terminologies around inflation and
provide some background information about the issues of inflation targeting and the debate
about a rule-based monetary policy. We introduce the concept of rational expectations and
contrast it to sticky information flows and rational inattention. Finally, we discuss the
practical relevance of well-anchored information as to execute effective monetary policy.
The second part copes with the interdependence between short-term and long-term
expectations. For this purposes we study the Great Inflation and Volcker Disinflation of the
1970s and show that short-term shocks may in fact translate into a change of both short-term
and long-term expectations if they are viewed as somehow persistent, and as a necessary
condition if the central bank loses its credibility. The case of the effect on long-term
expectations on short-term expectations is exemplified by the introduction of inflation targets
in emerging markets such as India. This sometimes occurs in the form of step-down targets to
smooth the adjustment process. In order to anchor expectations to intermediate targets it is
critical that the central bank has credibility for its final target and hence its outlined path
towards it. At the same time its credibility will also be measured whether intermediate targets
were achieved.
In our third part we discuss the effects of heterogeneous currency unions on expectations
forming. We show how asymmetric developments lead to inflation in one part of the union
and disinflation in another and thus both short-run and to some extent long-run expectation in
individual regions deviate from the policy target even though average expectations in the
union remain well-anchored.
Finally, we provide some empirical analysis based on the last 15 years of short-term and long-
term professional forecasts and include economic variables and historical variables which
confirm our earlier findings.
1 Note, that producers may accept depressed markups without adjusting prices or employment if the central bank
is expected to adjust its policy such that in the mid-term markups return to their profit-maximizing level.
8
2. Definitions of Inflation Expectations and Expectation Forming
2.1 Inflation Expectations and Expectations Forming
When examining the concept of inflation expectations, it is also of high importance to define
inflation itself more precisely. Monetary policymakers are responsible to preserve overall
price stability, which is commonly defined as low and stable inflation. This objective is
supported by a corresponding policy and therefore, policymakers need to evaluate the current
inflation rate and the overall trend in inflation. In this context, central banks differentiate
between core inflation and headline inflation. Headline inflation is calculated on an overall
price index, while core inflation excludes unprocessed food and energy prices from the index
calculation. This core inflation approach is motivated by the statistically highly price-volatile
food and energy index components due to temporary supply shocks. Prices of these goods are
not subject to stickiness – markets almost always clear by adapting prices instantly (to match
current supply and demand). Hence, short-term price fluctuations do not reveal inflation
trades but information about current supply and demand. Therefore, core inflation
communicates a more accurate picture of the underlying inflation trend in the short-term and
helps policymakers to achieve low and stable headline inflation over the long-term period.
According to academic literature there are two ways how economic agents form inflation
expectations. Mohanty (2012) defines the first approach as a variant of adaptive behavior
wherein expectations are formed by extrapolating the past and current experience into the
future. Apart from past experience, new available market information are therefore also
factored into the expectations of economic agents. In light of the term adaptive behavior, an
essential element is also that economic agents learn from their past inflation forecasting errors
(usually with regard to short-term expectation) and take these errors also into account when
forming their inflation expectations. Nevertheless, the expectation forming process is
ambiguous as economic agents may not revise their inflation expectations continuously, but
may proceed with their revisions on a periodically basis. Overall, this first variant of forming
inflation expectations is mainly determined by its backward-looking character.
The second variant of forming inflation expectations is characterized by its forward-looking
approach. This variant is commonly referred to as rational expectation forming in academic
literature. According to Muth (1961) the forming process could be considered as rational if
economic agents are forming their expectations after processing all available information and
also factoring in the reaction function of the monetary authority.
9
However, empirical research has revealed that inflation expectations are characterized by
significant errors. Neither the adaptive nor the rational expectation formation has been able to
predict the actual inflation in the past as noted by Orphanides & Williams (2004). This is
related to the fact that no economic agent has the analytical capability to conduct a perfect
forecast, which is especially true in a complex market economy that is also marked by
imperfections and uncertainty. It is consequently not possible to develop a forecasting model
that incorporates all relevant variables and makes accurate predictions about future inflation.
The difficulty of accurate predictions might also be related to inaccurate causal inference as a
central aspect of economic theory. “Expectations influence the time path of an economy and
conversely one might hypothesize that the time path influences expectations” according to
Evans & Honkapohja (2001).
Though it might not be possible to incorporate all relevant factors into a single prediction
model, it is possible to make a general statement about the behavior of variables in context of
a short-term and long-term expectation perspective. The distinction between short-term and
long-term is crucial for understanding the dynamics of inflation expectation formation.
According to Samuelson and Nordhaus (2004) the long-term contrasts with the short-term, in
which macroeconomic variables are considered as fixed. Hence, the short-term is commonly
defined as the time horizon over which parameter factors like the general price level,
contractual wage rates and other production inputs are inflexible and may not fully adjust to
the state of the economy. The short-term is not a definite time period, but an indicator
regarding the flexibility of variables involved in macroeconomic models. The long run is
defined as the conceptual time horizon over which expectations and the above mentioned
factors are flexible and have time to fully adjust to the state of the economy.
2.2 Inflation Targeting and Rule-Based Monetary Policy
A major influence on forming and anchoring of inflation expectations have been credible
implicit or explicit inflation targets. Following the successful implementation of explicit
targets in New Zealand, Chile and Canada in the early nineties a number of countries
including the United Kingdom, Finland, Sweden and Australia also adopted this type of
policy. In comparison with Germany, Japan, Switzerland and the United States these
countries previously had a poor record in fighting inflation and were now able to improve
their performance (Debelle, Masson, Savastano, & Sharma, 1998).
10
While old literature has primarily debated the attributes of various commodity standards, i.e.,
the representation of the par value of a currency unit by a certain amount of a commodity-
basket (see for example [F. D.] Graham [1942], [B.] Graham [1944], and Friedman [1951]),
recent literature has shifted the focus to inflation targets, i.e., the constant increase (within a
range or at a certain point) of the price level for a goods basket. Several academics like
McCallum (1988) and Taylor (1993) have even gone a step further by suggesting a rule-based
monetary policy that follows explicitly a mechanic operating routine in setting policy rates.
One can find arguments in Lucas (1980), White (1999), and Aoki & Nikolov (2004)2 that
such a system may eliminate monetary shocks, guarantee independent central bank policy,
prevent speculation about discretionary activist policy and mitigate feedback from past policy
mistakes. Even though Fendel & Frenkel (2006) provide some evidence that the ECB follows
the forward-looking Taylor rule in its decision making3 the current state of central bank policy
is more in line with Bernanke and Mishkin’s (1992) notion that „monetary policy rules do not
allow the monetary authorities to respond to unforeseen circumstances“. In addition, the ECB
(2001) notes with regards to the Taylor rule that its implementation could be only
incorporated in a dual mandate (as contrasted to the inflation-focus by the ECB)4. Hence, no
central bank is explicitly bounded to a specific monetary rule but rather uses such as a
supplement in its decision process.
The inflation target of the central bank provides a nominal anchor for other economic agents.
In contrast to the cases of activist monetary policy a credible target is incorporated by the
market in calculations of forward prices and costs. Bernanke, Laubach, Mishkin, & Posen
(2000) acknowledge that even small inflation rates lead to economic costs.5 However, an
occasionally debated target of 2% - that as Irwin (2014) describes originally developed out of
a historical accident – is set deliberately above zero percent to adjust for the statistical
underestimation of inflation rates and to permit negative real interest rates in a recession.
2 Interestingly, Simons (1936) developed some positive and normative arguments in favor of rule-based
monetary systems. 3 Notably, comments by Fed governor Janet Yellen that the Taylor rule provides “a rough sense of whether or
not the funds rate is at a reasonable level” (Federal Open Market Committee, 1995) and Bank of Japan board
member Nobuyuki Nakahara (justifying his dissent against a majority decision) that „some sort of explicit policy
rule, such as the Taylor rule or the McCallum rule, should be employed to help enhance communication with the
market“ (Bank of Japan, 2000). 4 Additionally, one could apply Goodfriend’s (2002) political argument regarding inflation targets to strict policy
rules: „it’s natural for any leader of an organization to worry about restricting his freedom of action in the
future“. 5 The simplified argument is that the amount of money held for transaction purposes in cash is reduced as a
larger part is invested in short-term illiquid assets. In absence of perfect foresight aggregate demand is kept
below its potential.
11
With reference to the works of Phelps (1967) and Friedman (1968), Lucas (1976) developed
his famous critique and popularized the rational expectations theory. It suggests that agents
include expected responses from policy makers in their decisions and adjust their behavior ex
ante. By contrast, the Phillips curve implies only an ex post reaction of wages and hence
allows real wages to decline in the short-term. With the flattening of the Phillips curve central
bankers began to recognize the long-run neutrality of money. In fact, with spreading
knowledge about the central bank’s inflationary cure against inflation this method became
even in the short-run ineffective.
At the same time it should be outlined that rational economic agents will not take all
information into account (in contrast to the classical homo economicus model with complete
information). Wiederholt (2010) considers this rational inattention as an optimization problem
that individuals with limited attention capacity face. From this point Sims (2003) concludes
that communication policy by the central bank is relevant. And going a step further the sticky
information model described in Mankiw & Reis (2001) suggests that prices are always
changing but pricing decisions are not always grounded on current information. Their paper
suggests that current prices may be a consequence of previous (short-term) expectations.
Hence, we may find a reason different than menu costs why short-term inflation expectations
do not translate instantly into higher inflation with the new short-term inflation expectations
being again well-anchored. Asset pricing theory would suggest that if the government
announces to purchase any gold in six months at $ 10,000 gold will instantly trade at $ 10,000
(adj. for cost of capital and storage). However, the sticky information model suggests that it
takes some time until information (e.g., about a current shocks) is fully disseminated and
processed in the market place.
This may also provide a reason why argument shifted from the activist school to the relative
passive system of credible inflation targeting to avoid inflationary shocks and results lagging
its underlying monetary policy. Mishkin (1999) shows that inflation targeting helped to
stabilize both inflation rates and expectations. According to Debelle, Masson, Savastano &
Sharma (1998) there are two prerequisites for inflation targeting: (1) independence from
government influence, and (2) independence from other mandates such as wages, exchange
rates and the level of employment. To mark its credibility some countries have additionally
adopted methods through which central bankers are softly penalized for missing it. For
example, the governor of the Bank of England has to write an open letter to the Chancellor of
the Exchequer if inflation deviates by one percentage point from the target rate.
12
Clark & Davig (2008) summarize research on the influences of inflation expectations which
include a range of variables such as energy and commodity prices, past inflation, the state of
the economy and monetary policy changes. However, one needs to differentiate between
short- run and long-run effects on expectations. The latter are usually smaller. Their research
shows that innovations to CPI inflation impose the greatest risk. Moreover, shocks to the
interest rate are a more modest variable. Shocks to energy and food prices do not impact core
inflation directly although may potentially change inflation expectations. This is a contrasted
by shocks to food prices that affect both core inflation and inflation expectations.
Clark & Davig also outline improved results for the inflation targets. Expectations seem to be
better anchored and also volatility of expectations and trend inflation is reduced (which might
be due to smaller volatility in the inflation target, changes in the strategy of monetary policy
or better understanding by the public of central banking).
A detailed view on the quality of anchoring (i.e., central bank credibility) can be found in a
recently published paper by Strohsal & Winkelmann (2015). A market implied target is
derived from break even inflation rate and compared the official target by applying an
ESTAR process. The ECB shows the best performance with a MIE of 2% while the inflation
expectations in the UK shows a weak anchor with a MIE of 4.3% even though both regions
follow the same policy target. With regards to the US, the strength of the anchor decreased for
the short-term period and increased for the longer-term during the post-Lehman period.
2.3 Practical Implication: Monetary Policy and Inflation Expectations
The European Central Bank (ECB) forms its monetary policy decisions in accordance with
the Maastricht Treaty of 1992 that states the primary objective of the European System of
Central Banks shall be to maintain price stability. The ECB defines price stability as “rates of
inflation below, but close to 2 % over the medium term”. Hence, the ECB adopted a clear and
explicit inflation target which is supported by its monetary policy actions. This approach of
monetary stabilization policy has historically resulted in a reduction of inflation and output
volatility as noted by Mishkin & Schmidt-Hebbel (2007) and is subsumed under the
guidelines of the new neoclassical synthesis (NNS) in macroeconomics. The new neoclassical
synthesis is a result of the convergence of classical macroeconomic theory involving features
such as rational expectations and real business cycle aspects and Keynesian theory involving
features such as monopolistically competitive firms, sticky price setting and monetary policy
aiming for stabilization. Goodfriend (2007) argues that the practical application of NNS in
13
forming monetary policy reinforces four main advances: the priority for price stability; the
targeting of core rather than headline inflation; the importance of credibility for low inflation;
and preemptive interest rate policy supported by transparent objectives and procedures.
Monopolistically competitive firms set their product prices as a result of their marginal cost of
production plus an additional markup. The production costs are determined by the level of
productivity, wages and material. However, the process to determine the appropriate price for
a differentiated product that maximizes the profits in every economic scenario is quite costly
as noted by Sheshinski & Weiss (1977). These costs to a firm resulting from changing prices
are referred to as menu costs. Moreover, obtaining the required information about the firms´
individual demand and cost conditions is difficult and often not realizable. And adaption for
any volatility may result in higher hiring and firing costs.
A key element of the new neoclassical synthesis is that firms will only adjust their product
prices in order to maintain a constant profit maximizing markup if aggregate demand and
marginal cost condition changes threaten to decrease or increase the actual markup
significantly and persistently away from the profit maximizing markup. However, firms move
their product prices with expected inflation over time. In contrast to the NNS, the classical
real business core (RBC) model would suggest firms to neutralize the effect of aggregate
demand and productivity shocks by adjusting their prices in order to keep the actual markup
close to the constant profit-maximizing markup. As a consequence of the firms´ behavior in
accordance with the NNS, the product markup would fluctuate in response to shocks of
aggregate demand and productivity.
In order to prevent that firms change prices and employment in response to those shocks,
Goodfriend (2007) argues that monetary policy should actively monitor and manage
aggregate demand taking aggregate productivity into account, such that marginal costs rise at
the targeted rate of inflation – then firms will automatically raise product prices at the
expected targeted rate of inflation, because they are confident that this price behavior will
keep actual markups close to the profit-maximizing markup. By managing actively the
nominal interest rate, the central bank can boost or compress aggregate demand and thus,
keep markups close to their profit-maximizing level and meet low inflation expectations.
Increasing the real interest rate has a decreasing effect on current aggregate demand due to
increasing opportunity costs of current consumption in terms of future consumption.
14
The Federal Reserve Bank focuses on core inflation6 without the effect of food and energy
prices when deciding about the appropriate measures for an efficient monetary policy.
Targeting headline inflation is not necessary given that prices for food and energy are
naturally highly volatile as there markets always clear supply and demand. They are not
subject to sticky price.7 Therefore, the central bank is recommended to stabilize employment
and markups, while the economy adjusts to food and energy price shocks independently.
Simultaneously, core inflation would also be a more stable nominal anchor for inflation
expectations.
As mentioned above, price setting is a costly matter for firms with the obvious implication
that firms care about future costs of production as well when setting prices in order to
maintain their profit-maximizing product markup. When the central bank has full credibility
for its inflation target, then firms are confident that inevitable fluctuations of the actual
markup are just temporary as monetary policy is expected to restore the optimal balance. In
effect, full central bank credibility for low core inflation targeting makes expectations about
future costs of production in the sticky price sector invariant to aggregate demand shocks with
the result that inflation expectations themselves anchor current price setting decisions to the
targeted inflation rate. As a result, credibility is important for the central bank to anchor
inflation expectations as it can only manage real interest rates with its nominal interest rate
policy. Since real interest rates represent the relative price of current to future spending, real
interest rates have a direct effect on aggregate demand. Therefore, expectations regarding
future income need to be anchored independently of the monetary policy in order to provide
the nominal interest rate policy the leverage to manage current spending, meaning current
aggregate demand. Central bank credibility can contribute at this point by anchoring expected
future product markups to profit-maximizing markups. As a consequence, expectations about
future income are anchored to productivity growth and other real business cycle factors that
are independent of monetary policy.
As argued by Williams (2003) and Wicksell (1936) stabilizing inflation is only possible if the
interest rate policy reflects the volatile natural rate of interest that keeps actual markups close
to profit-maximizing markups and supports real business cycles by effecting aggregate
demand. Inflation targeting is technically challenging, because the natural rate of interest is
6 By contrast, HICP includes headline measures. 7 Note, however, that central banks in emerging markets frequently target headline inflation. The reason is that
these goods compose such a large share of the consumption basket that changes in headline inflation are the
crucial element in individual expectation forming. Moreover, there are sometime some social-political arguments
put forward as the central bank attempts to prevent increases in food prices for the very poor as illustrated by Raj
and Misra (2011).
15
not directly observable in the markets. However, Goodfriend states that within its classical
mandate and operations the central bank can only determine the short-term interest policy,
which must exert its leverage over current aggregate demand through its leverage over longer-
term interest rates.8 He further notes that according to the expectations theory of the term
structure, longer-term interest rates move with an average of expected future short rates.
Consequently, the accurate prediction of the effect of interest rate policy on longer-term
interest rates and aggregate demand requires the central bank to understand the dynamics of
market responses to given short-term interest rate actions and the implications for the future.
For the accomplishment of this goal, communication is an essential element for the central
bank in order to achieve effective interest rate policy. Goodfriend summarizes this aspect with
the argumentation that ad hoc announcements can reinforce, but not substitute for a genuine
mutual understanding between markets and the central bank. The understanding would need
to be created on the basis of an explicit, credible low-inflation objective supported by a policy
rule – “a systematic articulation of how a central bank intends to move its short-term interest
instrument in response to macroeconomic news to achieve that objective”.
3. Interdependence Between Short-Term and Long-Term Expectations
3.1 Influence of Short-Term on Long-Term Expectations - Exogenous Shocks and
Credibility Proofs
If the central bank has a credible inflation target and inflation expectations are well-anchored
short-term price fluctuations in certain sectors do not effect long-term expectations. This price
volatility indicates shortages and surpluses of certain goods rather than inflationary trends that
are due to inappropriate monetary policy. To illustrate this proposition we will use the oil
crisis of 1973 as an example. It was handled in different ways by different central banks,
eventually culminated in a period of runaway inflation the US and was not ended before
disinflationary measures were put into place by Federal Reserve chairman Paul Volcker. By
contrast Germany and Japan showed a better inflationary performance.
8 Targeting long-term interest rates occurred under “Operation Twist” in the early sixties and recent quantitative
easing by the Fed as noted by Swanson (2011). The discussion also came up during the purchases of long-term
bonds by the Bank of Japan as remarked by Saito, Hogen & Nishiguchi (2014), and recent quantitative easing by
the ECB – albeit the latter may have been also due to practical constraints as there is not enough short-term debt
outstanding to meet its targets. However, a central bank exposes itself and the taxpayer to interest rate risk when
it purchases long-term bonds. Once it increases again interest rates this may even lead to a technical bankruptcy
as argued by Buiter (2008).
16
Inflation expectations were better anchored in the 2000s than in the 1970s. Following a
tripling of oil prices, inflation in core consumer goods (other than food and energy) rose
sharply between 1975 and 1980. However, as Clark & Nakata (2008) contrast that consumer
price inflation remained flat between 2001 and 2007 despite a quadrupling of oil prices. They
argue that better-anchored inflation expectations yield shorter-lived inflation spikes.
In contrast to endogenous shocks9 exogenous distortions come from changes in variables
outside of the aggregate demand model. In our case there is an increase in oil prices, which is
particularly threating to an oil-importing country.
After the Arab oil embargo in 1973 oil prices more than doubled. Such a shock affects both
core and headline inflation. Energy prices are not directly a part of core inflation. Their
markets instantly adjust for changes in supply and demand. Central banks do not need to
adapt interest rates in order to avoid negative consequences from sticky prices. However, oil
is also a major input material for various goods such as plastic and energy-intensive
industries. Thus, if the change in prices is persistent, then also other good markets will be
affected.
At given monetary policy it is obvious that short-run inflation expectations tend to rise.
However, long-run expectations do not change per se. Such a shock may occur within a
normal random-walk model for commodity prices. It is an unexpected and sudden move that
tends to mean-revert in the long run. Hence, there does not have to be a link between short-
term and long-term expectations.
The first oil price shock differed from this notion. Goodfriend (1993) defines an inflation
scare as a rise in expected long-run inflation which can be interfered from a „long-rate rise in
absence of an aggressive fund rate tightening“. 10 As the market anticipates persistent
inflationary pressures it adjusts the term structure of the yield curve for a sustainable up-ward
9 An example for an endogenous shock is a change in long-run productivity. In the late 90s the rapid
acceleration of computer and information technology resulted in widespread optimism about the future. This can
be exemplified by a hypothesis by Allen Greenspan: “It is the observation that there has been a perceptible
quickening in the pace at which technological innovations are applied that argues for the hypothesis that the
recent acceleration in labor productivity is not just a cyclical phenomenon or a statistical aberration, but reflects
– at least in part – a more deep-seated, still developing, shift in our economic landscape” (1996) and was
supported by for example Gordon (1999) and contemporary views on economic and historical smoothing such as
in Weber (1997) and Fukuyama (1992). As growth expectations rise a classic RBC model would suggest to
increase the long-term real interest rate (expectations) by the same number in accordance with the approximation
𝑟 = 𝜌 + 𝑔 (Goodfriend, 2004). 10 Goodfriend & King (2005) highlight the fact that the FOMC considered long-term interest rates as indicators
of inflation expectations and their credibility and viewed with concern the implied „u-turn“ as the recessioned
deepened.
17
adjustment of the federal funds rate. By contrast, the short-rate (i.e., funds rate) remains
unchanged as it is set by the central bank.11
The Federal Reserve made an attempt to reduce inflation by sequentially increasing the
federal funds rate up to almost 12% in 1979. However, it failed to stabilize the inflation rate at
already elevated level of ca. 6% (but less than the previously seen 12%) in 1977. One reason
for not aggressively increasing the interest rate may have been the recession of 1973-1975 on
the back of the supply shock. The central bank failed to defend its credibility for stable prices
and the period was dominated by stagflation.
Similar like credit controls in 1980 mentioned in Goodfriend (1993), Jimmy Carter’s (1979)
tangible and intangible demand side policies have affected aggregate demand but not cured
the inflation scare.
By the time Paul Volcker became chairman of the Fed in August 1979 oil prices would
double from 1978 to 1980 and triple until 1981 following the Iranian revolution.
Nevertheless, he was determined to fight inflation and increased the federal funds rate from
11.4% in September 1979 to 17.6% in April 1980. As it can be seen from the 30-year bond
yield this move was only considered to be temporary. The yield rose from 9.2% in September
to 12.3% in March and fell back to 11.4% in April. The interest rate peaked at 14.1% in
February 1980 when increases where paused due to a weaking economy. The fact that a
national election was upcoming may have put additional pressure on the Fed.
As a consequence the inflation scare returned with an increase in the long-rate by 2%. The
Fed promptly reacted by a sharp 3% raise in its target rate to regain its long-term credibility.
Disinflationary measures resulted in 9.9% decline of GDP in the second quarter of 1980
which was followed by an 8.4% increase in the fourth quarter on the back of easing credit
controls and monetary policy.
The disinflationary measures peaked with a 19.2% fed funds rate in 1981 which was followed
by a recession but also declining inflation rates. Albeit inflation rates had been smaller in
1984 there was another increase in the long-rate and the central bank again proved its
credibility by increasing the short-rate. Eventually, the second half of the 1980s marked a
period of maintained credibility. As Goodfriend (1993) observes the recession of 1990-1991
11 Another example for such a change in the yield curve can be sometimes found at the peak boom times when
the normally, upward sloping yield curve becomes downward sloping. The market anticipates a recession an
interest rate cuts. The flattening of the Euro yield curve in 2015 follows a similar logic: long-term growth and
inflation expectations are adjusted downwards.
18
demonstrates that this objective was achieved: The Fed was able to reduce the fed funds rate
from 8% to 3% within two years without a significant increase in inflation.
The following years thus allowed to sustain a low fed funds rate and inflation rate at the same
time. Inflation expectations had been re-anchored.
The experience in the 1970s indicates a link between short-term and long-term expectations.
Firstly, while short-term exogenous shocks do only have an effect on short-term expectations
they may translate into elevated long-term expectations if they are seen as sustaining and the
central bank lacks sufficient credibility for its target. The crucial link is the ex-ante absence of
credibility and sufficient anchoring of long-term expectations. The decrease in credibility, we
guess, may also develop if there are multiple sequentially persistent (i.e., accumulating)
inflationary shocks which the central bank does not accommodate.
Secondly, it also includes the aspect of policy changes which we will discuss later. Policy
changes and credibility proofs have a strong effect on the short-end once they are implement
but need to be in place for a sufficient time to demonstrate their credibility and thus affect
long-term expectations. Trend inflation expectations are adjusted downwards not per se by a
spike in interest rates but only if the central bank is considered to pursue a focused
disinflationary policy whenever expectations are above its target (i.e., it prioritizes the
inflation target over other objectives). Indeed, in the short-run a central bank may have to
prove its credibility even at the risk of a recession.
Clark & Davig (2008) introduce the following model for time-varying trend inflation:
𝜋𝑡∗ − 𝜋𝑡−1
∗ + 𝑣𝑡 with 𝑣𝑡 ~ 𝑁(0, 𝜎𝑣2) (1)
They argue that generally long-term inflation expectations imply the private sector’s belief in
the long-term target rate and given the long time horizon of SPF forecasts (e.g., 10 years)
these should not be influence by short-run fluctuations; especially if the central bank is
considered as credible.
The model also suggests that there is a premium for volatility which can be easier explained
within an asset or option pricing framework. The authors note that the stochastic volatility
have been declining since the late 1990s. Volatility occurs due to shocks, inefficient inflation
management or changes in targets. The study shows, that both volatility of food and energy
prices as well as short-term expectations and core inflation rose during the recent years (albeit
for the latter starting from a low base rate). By contrast, volatility of long-term expectations is
19
on a downward trend. From this interferes, that trend inflation is better anchored as it
accounts for less overall volatility.
3.2 Influence of Long-Term on Short-Term Expectations – Credibility of Policy
Changes
As already discussed in a previous sub-chapter policy changes have an effect both on the
short-end and the long-end of the expectations curve. Short-term expectations are affected by
the measures taken to implement the new target and long-term expectations change if the new
target is perceived as credible. This was exemplified by the Volcker disinflation.
Moreover, distortions to long-term expectations can occur if the central bank loses credibility
for its target even without explicitly changing it. We have already illustrated the example of
an oil crisis and the central bank only passively accommodating the shock. Now we will
continue our discussion by focusing on explicit policy changes, particularly the introduction
of inflation targets in emerging markets.
Inflation targeting has been suggested to emerging markets by Batini & Laxton (2007) and
Batini, Kuttner, & Laxton (2005) following the tradition of Mishkin’s (1999) „just do it“.
Their main argument has been that countries with historically high inflation rates would be
able to achieve smaller ones and reduce volatility of inflation expectations. Their general and
unconditioned recommendation contrasts the technical and fiscal prerequisites mentioned by
Fraga, Goldfajn, & Minella (2004). However, it should be mentioned that Ball & Sheridan,
(2004) do not find positive evidence in favor of inflation targeting as a mean to achieve low
inflation rates. Their study suggests that this objective may have been also achieved by a
regression to the mean although the authors acknowledge that future works may reach
different conclusions.
Initial research on the case of inflation targeting in India provided mixed conclusions. Kannan
(1999) argues in favor of inflation targeting albeit criticizes the contemporary WPI inflation
measure. It is outdated and deviates from a more complete CPI inflation measure. Hence, the
measure for the central bank is not the same as that on which expectations are grounded on.
Moreover, he outlines reasons for time dependent targets. These step-down inflation targets
were used to introduce the system in New Zealand, Spain, Canada and Mexico. It has to be
20
taken into account that inflation usually follows monetary policy with a time lag.
Additionally, disinflations can be costly in terms of short-term output. Yet, credibility may
also be achieved by “just doing it“ in spite of the hardships of a recession.
Mahajan, Saha, & Singh (2014) raise concerns with regards to preconditions such as an
efficient transmission mechanism, large supply and demand shocks, social costs and short-
term growth trade others. Similar arguments are set forth by Jha (2008).
In spite of this opposition Rajan (2013) explained his objective of low inflation during his
first speech as the governor of the Reserve Bank of India. Moreover, he also initiate the
issuance of inflation protected securities. In our view, this step helps to anchor inflation
expectations (at least during the term of the bonds) as with regards to these it is in the
government’s self-interest to keep inflation low in order to avoid interest expenses.12 For this
purpose a step-down target was implemented. The objective is to achieve a nominal inflation
rate of 8% by January 2015, 6% by January 2016 and 4% (+/-2%) thereafter (RBI, 2014).
Albeit the target of 6% was considered as more difficult than that of 8% the RBI has already
accomplished (deliberately or indeliberately) it (see Chart 3.2.1 in Appendix). With sufficient
resources for the central bank and to reach its long-term targets and political will to reduce
volatility in the process of doing so the step-down targets can be perceived as credible.
At the same time a failure to achieve not more than 8% by 2015 might have resulted in a loss
of credibility for the recently celebrated central bank and his institutions. This would have
affected the 4% long-term target as the central bank would be considered to inflate beyond its
promises. At the same time the step-down target offers some of the advantages of a target
range (e.g., they possibility of managing demand without losing credibility) and that the
adjustment process is smoothed. However, for this purpose the central bank has to „remain on
track“.
To conclude our remarks on India we raise the issue that the Rupee has certain commonalities
with the Euro. Both are imperfect currency zones. Briefly relating to Mundell (1961) and van
Marrewijk, Ottens, & Schueller (2006) we are particularly concerned about the heterogeneity
across the 36 states and union territories. They differ in terms of languages, literacy rates,
political views and policies, the structure of the economy (e.g., rural and urban industries), the
12 A counter argument is that tax revenue would increase. However, in contrast to non-indexed bonds the
expense (and hence the liability) on IPS increases with the inflation rate.
21
size of the economy13 and different growth rates, legal barriers to labor mobility and home
good biases. These contrasts are subject to shocks leading to different levels of optimism and
pessimism about both the short-term and long-term future and consequently resulting in
individual inflation and deflation scares given the homogenous interest rate across
heterogeneous regions. Albeit GDP (as the weighting factor for the price index) is less
concentrated than in Europe one may still expect that a few large regions will determine the
monetary policy of the central bank at the expense of smaller ones with different economic
developments and expectations. Hence, we would expect long-term expectations better
anchored in large regions than in smaller ones.
3.3 Measuring Dynamics of Inflation Expectations - A Survey Approach
Inflation expectations are important indicators and determinants of observed inflation, but
academic literature and central banks are still arguing about the appropriate measurement of
expectations. Consequently, inferring how inflation expectations affect actual inflation
remains a difficult task as noted by Bernanke (2007). Empirical research on the measurement
of inflation expectations can basically be attributed to two approaches: the measurement of
inflation expectations based on inflation surveys such as Carlson & Parkin (1997); Branch
(2004) and the measurement of inflation expectations based on inflation-indexed financial
market instruments such as Gurkaynak, Levin & Svanson (2007); Barr & Campbell (1997).
Ang, Bekaert & Wei (2007) compared several inflation forecasting models, including simple
regime switching models and different variants of Phillips curve and term structure models,
and figured that survey measures of expected inflation provide better forecasts of inflation
than any other alternative. In addition, Forsells & Kenny (2002) analyzed survey data on
inflation expectations of consumers in the euro area and found that the observed expectations
seem to incorporate – though not always completely – the information contained in a broad
set of macroeconomic variables. In this context, survey measurements of inflation
expectations have been approved as the most direct and accurate method in terms of
forecasting power and are commonly used for research on inflation.
A research survey (DNB survey) on the formation of short-term and long-term inflation
expectations has been conducted by Galanti, Heemeijer and Moessner (2011), which provides
important information about the causal relation between short-term and long-term
13 Per capita income between Goa in the west and Bihar in the north east differs by a factor of 7.4:1 (Government
of India, 2014). By contrast, difference between the small European countries Luxembourg and Malta is only
5.5:1 (IMF, 2014).
22
expectations as well. We find the survey perfectly suited because it was taken directly after
the financial crisis and would allow to observe whether inflation expectations and especially
anchoring properties of long-term expectations have been affected by the crisis. Moreover, it
incorporates three novel features compared to existing surveys of inflation expectations: (1)
the survey has been conducted on a weekly basis between July 2009 and July 2010 and has
therefore a considerably higher frequency than surveys that have been conducted on a
monthly or quarterly basis (such as SPF and Consensus Economics). This novel feature
allows a more precise insight into the expectation formation process such as the frequency of
expectation changes over the short-term and long-term horizon. However, we acknowledge
that the survey period might appear too short. (2) The survey participants were provided with
macroeconomic information sets in order to examine the heterogeneity of inflation
expectations. (3) The survey participants received an incentive reward based on the accuracy
of their individual inflation forecasts in order to obtain most accurate survey responses.
The 129 survey participants, consisting of central bankers, academics and students, were
asked to indicate their personal expectations on short-term and long-term inflation in the euro
each week shortly after they received the information set (consisting of an updated HICP
inflation data on a national and euro area level, and - only for central bankers - an updated
Consensus mean forecasts). Below we have summarized the most important findings of the
survey and combined them with findings of other researchers in order to examine the causal
link between short-term and long-term inflation expectations.
The means and medians of the survey inflation forecasts indicate a distinct tendency in the
data set (see Chart 3.3.1 & 3.3.2 in Appendix). Long-term expectations have remained fairly
stable at 2%, while the means and medians of short-term expectations started initially around
1% and increased over the survey period. Galanti, Heemeijer and Moessner argue that this
seems to suggest that participants considered the observed low levels of inflation in 2009 and
early 2010 shortly after the peak of the financial crisis to be temporary and believed the
economic climate in the euro area to gradually normalize. This observation is supported by
the clear upward trend of the short-term expectation means. The data also suggests that long-
term expectations have remained well-anchored, considering the uncertain economic situation
after the financial crisis, and have not been affected substantially by the factors that had an
impact on the formation of expectations over the short-term horizon. This conclusion is
supported by the long-term medians which are stable at the ECB´s inflation target of 2% over
almost all weeks. The fact that the long-term means are all above the target is in line with the
conclusion as according to Bernanke (2007) even long-term inflation expectations do vary
23
over time. In reality expectations are often not perfectly anchored since the extent to which
they are anchored can change, depending on economic developments and especially debates
about current and past conduct of monetary policy and limitations to its effectiveness.
Furthermore, there are also other potential explanations for deviations from a central banks´
inflation target. One explanation is illustrated by Capistràn and Timmermann (2008) as the
concept of asymmetric loss. The idea behind this concept implies different costs of over- and
under-predicting inflation across participants. If the associated costs of under-predicting
inflation are higher for a particular survey participant than the costs of over-predicting, then it
would be optimal for this participant to bias his expectation forecasts towards higher
inflation.14 As a consequence that participant would reduce the probability of more costly
under-predictions. However, participants might also be misguided by heuristics for their
inflation forecasts. Brazier et al. (2008) describe lagged inflation and a central bank´s
inflation target as two potential heuristics between which economic agents switch depending
on their past performance. Therefore, economic agents are likely to abandon their previously
selected prediction mechanism if the corresponding forecasting error has passed some
threshold.
Since the survey comprises a relatively large number of participants, the obtained data results
have also been used to examine the disagreement across survey respondents. Mankiw, Reis
and Wolfers (2003) argue that disagreement regarding inflation is correlated with a great
number of macroeconomic variables and even conclude that disagreement might be a key to
understanding macroeconomic dynamics. This viewpoint is consistent with the theoretical
model of Lucas (1973) within which heterogeneity of expectations is crucial and the survey
authors were indeed able to extract important information by looking at the observed
disagreement. The standard deviation and interquartile range of the individual inflation
forecasts (see Chart 3.3.3 & 3.3.4 in Appendix) show that the disagreement within the survey
is smaller at the long-term than at the short-term. Furthermore, the disagreement measured by
the interquartile range at the long-term has remained noticeable persistent. We note that this
appears to some degree contradictive at first sight as the near future (short-term) should
intuitively be easier to forecast as the more distant long-term. This finding suggests that long-
term expectations are presumably affected by focal points such as the ECB´s inflation target
14 Intuitively, one may propose that inflation rates and the corresponding are somehow long-normally
distributed. Using a classical option pricing model this results in paying a higher premium for the call option
than for the put option. Inflation protected securities effectively provide this call (This is especially visible if one
purchases the security and shorts a corresponding fixed rate bond. The profit from this operation is π − i =[0, ∞).
24
based on its definition of price stability. On the other side, the formation of short-term
expectations seems to be more speculative from the participants´ perspective as it based more
on current macroeconomic information varying over time. However, the continuous decrease
in disagreement over the short-term horizon (see Chart 3.3.4 in Appendix) might be linked to
the provided information datasets that have been accumulated and factored into the
expectation formation process as part of adaptive learning over the survey period. There are
many examples in academic literature such as Bullard & Mitra (2002) who have shown that
the process of learning can affect the dynamics and even the potential stability of the
economy. Furthermore, these findings imply that understanding the dynamics of public
learning about the economy affects the form of optimal monetary policy (Gaspar, Smets and
Vestin, 2006). Overall, the survey results are consistent with similar research such as
Capistràn and Timmermann (2008) who analyzed different survey forecasts and remarked
that “strong differences in inflation forecasts are found even at short forecast horizons and
among professional forecasters with access to many common sources of information”.
As the survey has been conducted on a weekly basis and therefore on a comparatively high
frequency, it allows a comprehensive insight how frequent the participants revised and
changed their inflation expectations. The overall average percentage of participants who
revised and changed their expectations declines from 38.5 percent at the short-term to 23.5
percent at the long-term horizon (see Chart 3.3.5 in Appendix). This suggests that long-term
expectations are revised less frequently relative to short-term expectations in response to
macroeconomic news according to Galanti, Heemeijer and Moessner. The finding that long-
term expectations are revised less frequently than short-term expectations is also supported by
the analysis of the duration of spells when expectations remained unchanged. The mean
duration of spells of 2.4 weeks at the short-term increased to 3.4 weeks at the long-term. In
addition, the analysis of the distribution of weekly changes in inflation expectations reveals
that if participants changed their inflation expectations, the changes in long-term expectation
(mean absolute change of expectations of 0. 54%) were larger than the changes in short-term
expectations (mean absolute change of expectations of 0.47%). Comparable results have been
found by Kenny & Forsells (2004) who examined actual and expected inflation over the
period 1985-2005 and their results suggest that consumers revise their expectations and adjust
them in order to be in line with the actual inflation. Regarding the speed of adjustment they
figured that the monthly data indicates a quite low persistence in deviation of actual and
expected inflation. Therefore, the data suggest that consumers react quite quickly when
revising their expectations in response of new information and while actual and expected
25
inflation may drift apart in the short-run, they ultimately revert towards each other. We find
this consistent with the results of the survey, which show a lower duration of spells and a
lower mean absolute change of expectations at the short-term compared to the long-term.
Moreover, Kenny & Forsells also conducted an efficiency test on the data from 1985-2005
and found that consumers seem to incorporate – though not always completely – the
information contained in a broad set of macroeconomic variables. This degree of efficiency
seemed to have increased over time, but they note that this may not be interpreted as
increasing rationality over time. Inflation in the euro area has declined and become less
volatile over the last decades. In combination of greater ECB credibility, this development has
made it easier to predict future inflation overall. Again, we find this consistent with the
findings of the survey data which suggests well-anchored long-term expectations at the ECB´s
definition of price stability, illustrated by stable expectation means and medians and lower
volatility of expectations at the long-term. Furthermore, the survey participants have shown a
continuous decline in disagreement which might be linked to accumulated information sets
factored into short-term expectations over time.
An interesting approach of the DNB survey is to test whether the financial crisis has affected
the ECB´s credibility to target a stable inflation level according to its definition of price
stability of close, but below 2 percent. The survey is perfectly suited for this analysis as it has
been conducted shortly after the peak of the financial crisis in 2008 and households were
confronted with increased uncertainty. The authors presume that unprecedented monetary
easing in combination with the accumulation of large fiscal debt in the euro area, might have
undermined the confidence of economic agents in the central bank´s credibility for its
inflation target over the long-term. As discussed above, the long-term medians which are
stable at the ECB´s inflation target of 2% over almost all weeks of the survey horizon confirm
the ECB remaining credible though the long-term means are slightly above the target.
However, long-term inflation expectations can only be classified as being well-anchored if
these are not significantly affected by news about macroeconomic indicators as discussed by
Clark and Davig (2008). Therefore, the research study tested whether changes in inflation
expectations means have been associated with changes in Eurostat flash estimates as part of
the euro area HICP information. The empirical results show that changes in HICP flash
estimates have affected short-term inflation expectation means significantly at the 1 percent
level, but have not affected long-term expectation means. In this context, Bernanke (2007)
argues that inflation expectations can be classified as being anchored if they appear relatively
insensitive to new incoming data. Therefore, the result indicates that inflation expectations
26
have remained well-anchored at the long-term and the ECB could maintain its credibility for
its inflation target of close, but below 2% over the long-term.15
As just discussed above, long-term inflation expectations appear to have remained well-
anchored and were not significantly affected by macroeconomic news such as HICP flash
estimates in the aftermath of the financial crisis. However, Galanti, Heemeijer and Moessner
examined specifically in greater detail whether public deficits and the accumulation of large
fiscal debt might have affected inflation expectations. In order to investigate the influence of
debt concerns on inflation expectations, they tested changes in CDS spreads of euro area
economies and changes in Greek CDS spreads for statistically significant effect on changes of
inflation expectation means.16 The results show that changes in CDS spreads of euro area
economies had a statistically significant effect on changes of short-term inflation expectation
means (at the 1% level), but not on changes of long-term inflation expectation means.
However, while Greek CDS spreads also had a statistically significant effect on changes of
short-term inflation expectation means, they also had a significant effect at the 5%
significance level on long-term inflation expectation means. Overall, the results suggest that
short-term inflation expectations have not been immune to concerns about possible debt
monetization in order to deal with excessive public debt in Greece and in the euro area as a
whole. Moreover, concerns about the Greek sovereign debt crisis seem to have affected euro
area long-term inflation expectations as measured within the survey. Though the effect on
inflation is very small in economic terms, the results suggest that the ECB´s anchoring of
inflation expectations has not been completely insensitive to the turmoil in peripheral
sovereign bond markets in the euro area, which is again in line with Bernanke´s remark that
inflation expectations are not perfectly anchored in real economies.
We find that surveys give an appropriate impression of inflation expectations and their
development over time. With respect to the findings in this chapter we propose that the causal
link between short-term and long-term expectations can be found when looking at the quality
of expectation anchoring of central banks. The term “anchor” does not only imply stable
inflation expectations close to the central bank´s inflation target such as the ECB´s definition
of price stability of close, and below 2% over the long-term, but also insensitiveness to
15 We refer deliberately to long-term rather than the suggested medium-term to emphasize our notion on long-
term anchoring. 16 Galanti, Heemeijer and Moessner acknowledged that “a caveat within this approach of using CDS spread as a
measure of perceived risk of debt monetization through higher inflation is that expectations of debt monetization
via the printing of money by central banks, and associated expectations of higher inflation, could be associated
with lower sovereign risk, since higher inflation would lower the real burden of debt”.
27
macroeconomic variables in form of new incoming economic news. Economic agents seem to
be more confident in forecasting long-term expectation than they do at the short-term horizon.
The findings show that short-term expectations are more volatile and sensitive to
macroeconomic developments than long-term expectations in light of the difference in
relative time and flexibility of affecting variables.
4. Implications of a Heterogeneous Currency Union on Expectation
Building – The Current Case of the Euro Area
4.1 Theory and Implications
According to Petreski (2007) the Euro zone is not an optimum currency zone as qualified by
the criteria of Mundell (1961). While capital mobility is largely given, labor mobility remains
small and may thus increase the volatility in the business cycle (Burda, 1999) 17 .
Consequently, one may expect more volatile short-term inflation expectations, as the central
bank is not able to fully accommodate shocks in every single region. If the central bank fails
repeatedly to demonstrate its credibility within a particular region it risks a deviation of long-
term expectations for the explicit, global inflation target.
The Euro zone is in many ways similar to a currency peg between countries with
heterogeneous properties. Independent interest rate policy is impossible. Hence, inflation and
deflation scares may develop. In contrast to the US inflation differentials are larger and
longer-lasting in the EMU. In their position paper Darvas & Wolff (2014) argue that the ECB
should care about them, mostly to prevent contagion from deflation scares from one country
to another, and Fendel & Frenkel (2009) find some evidence that in fact it did.
Following the models by Goodfriend (2007) we find the (expected) productivity level, home
good bias and impatience as the exogenous variables that influence a country’s borrowing
behavior vis-à-vis a different country (e.g., trade surplus or deficit).18 These variables of both
countries also influence the terms of trade, and together with the interest rate employment in
the given period. For example, greater impatience lowers the terms of trade of the home
country, moves its balance of payments into the negative, increases the real interest rate –
encouraging households in the foreign country to save more and finance the former’s trade
17 As Bentivogli & Pagano (1999) argue labor mobility may not be a large problem if the currency union is not
prone to asymetric shocks or there are alternative adjustment mechanisms. 18 See formula (23) in Goodfriend (2007).
28
deficit, and boosts employment in the home country in the current period and reverses the
effect in the following period.
The terms of trade are exogenously defined by the current level of productivity, time
preference and markups in both countries and the trade deficit which itself is defined by the
current and expected productivity and markups in the home country, current and expected
home good bias and impatience in the home and the foreign country. If both countries are able
to stabilize their price level 𝑃𝐴𝐴 and 𝑃𝐵𝐵 the exchange rate 𝑒 will thus equal the terms of
trade: 𝑇 = 𝑃𝐵𝐵
𝑃𝐴𝐴 𝑒.
However, if the exchange rate is constant (e.g., currency peg or currency union), and terms of
trade are determined exogenously then at least in one country we can observe a deviation
from price stability.
Because of the impossible trinity in international economics a fixed exchange rate and free
capital movement lead to a no longer independent interest rate policy. This means, that in
order to achieve the fixed exchange rate within a no-arbitrage context, a central bank has to
mimic nominal interest changes of the currency area it wants to peg to. In a currency union
we have one single central bank and individual national banks only foster the transmission
mechanism following the rules forth by the central entity.
In the context of the EMU, the ECB has the single mandate of price stability, which is defined
as an increase of “an increase in the Harmonized Index of Consumer Prices (HICP) of below,
but close to 2%, over the medium term”. The Harmonized Index of Consumer Prices is
inevitably biased towards large countries in the core, which may in itself be homogeneous,
but heterogeneous relative to periphery countries.
Despite of convergence criteria that address interest rates, exchange rates and inflation upon
introduction of the single currency individual countries may show other developments than
during the observation period. Initially, as Chart 4.1.1 (in Appendix) shows, there has been a
greater convergence. Nominal interest rates converged towards the German one, albeit real
interest rates continued to differ from each other (Chart 4.1.2 in Appendix) as inflation was
not harmonized in all countries (Chart 4.1.3 in Appendix).
The reason for different inflation rates can be found in the conversion of output and
productivity levels. As it can be seen in Chart 4.1.4 (in Appendix) there have been different
growth rates. Some countries of the periphery were similar to emerging markets whose steady
state growth rate can be expected to be higher than in developed countries (i.e., core Europe).
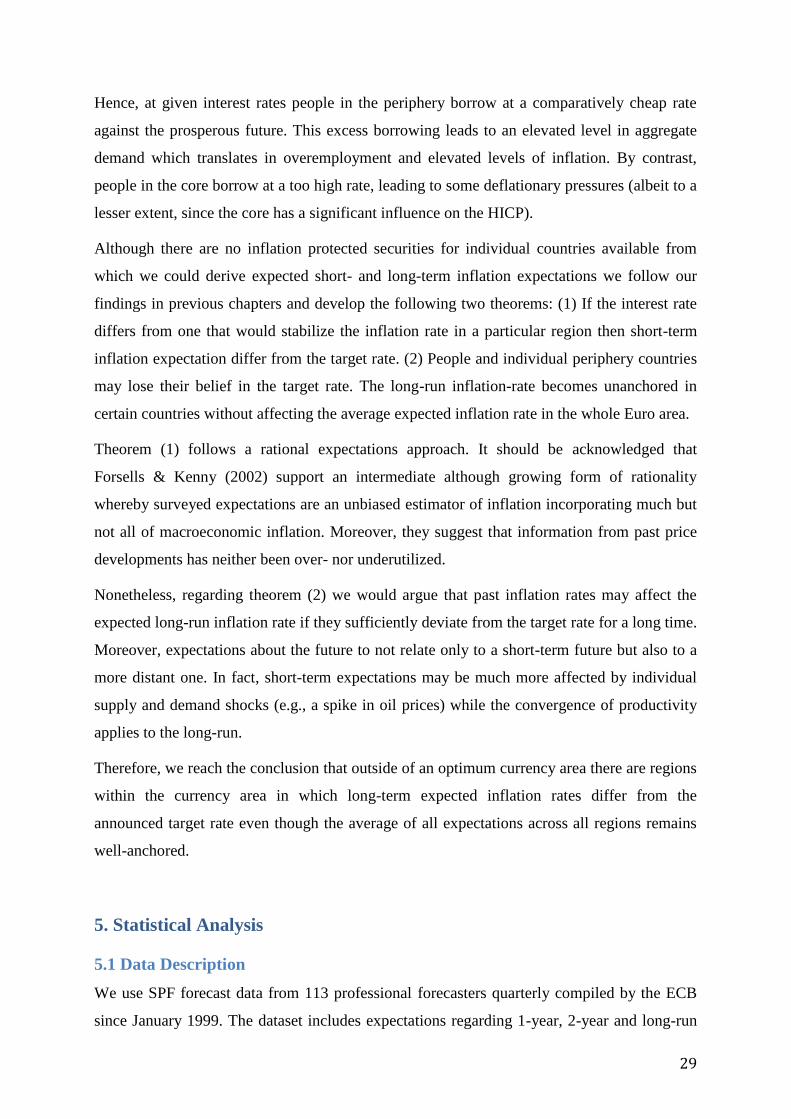
29
Hence, at given interest rates people in the periphery borrow at a comparatively cheap rate
against the prosperous future. This excess borrowing leads to an elevated level in aggregate
demand which translates in overemployment and elevated levels of inflation. By contrast,
people in the core borrow at a too high rate, leading to some deflationary pressures (albeit to a
lesser extent, since the core has a significant influence on the HICP).
Although there are no inflation protected securities for individual countries available from
which we could derive expected short- and long-term inflation expectations we follow our
findings in previous chapters and develop the following two theorems: (1) If the interest rate
differs from one that would stabilize the inflation rate in a particular region then short-term
inflation expectation differ from the target rate. (2) People and individual periphery countries
may lose their belief in the target rate. The long-run inflation-rate becomes unanchored in
certain countries without affecting the average expected inflation rate in the whole Euro area.
Theorem (1) follows a rational expectations approach. It should be acknowledged that
Forsells & Kenny (2002) support an intermediate although growing form of rationality
whereby surveyed expectations are an unbiased estimator of inflation incorporating much but
not all of macroeconomic inflation. Moreover, they suggest that information from past price
developments has neither been over- nor underutilized.
Nonetheless, regarding theorem (2) we would argue that past inflation rates may affect the
expected long-run inflation rate if they sufficiently deviate from the target rate for a long time.
Moreover, expectations about the future to not relate only to a short-term future but also to a
more distant one. In fact, short-term expectations may be much more affected by individual
supply and demand shocks (e.g., a spike in oil prices) while the convergence of productivity
applies to the long-run.
Therefore, we reach the conclusion that outside of an optimum currency area there are regions
within the currency area in which long-term expected inflation rates differ from the
announced target rate even though the average of all expectations across all regions remains
well-anchored.
5. Statistical Analysis
5.1 Data Description
We use SPF forecast data from 113 professional forecasters quarterly compiled by the ECB
since January 1999. The dataset includes expectations regarding 1-year, 2-year and long-run
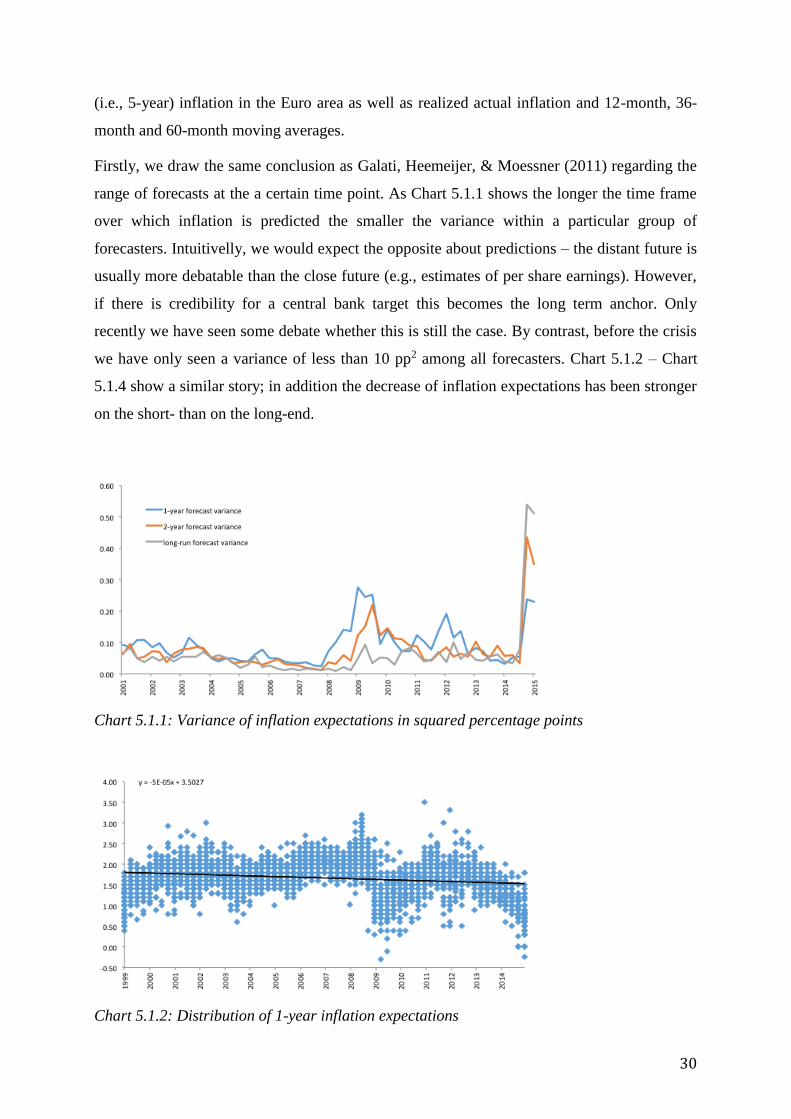
30
(i.e., 5-year) inflation in the Euro area as well as realized actual inflation and 12-month, 36-
month and 60-month moving averages.
Firstly, we draw the same conclusion as Galati, Heemeijer, & Moessner (2011) regarding the
range of forecasts at the a certain time point. As Chart 5.1.1 shows the longer the time frame
over which inflation is predicted the smaller the variance within a particular group of
forecasters. Intuitivelly, we would expect the opposite about predictions – the distant future is
usually more debatable than the close future (e.g., estimates of per share earnings). However,
if there is credibility for a central bank target this becomes the long term anchor. Only
recently we have seen some debate whether this is still the case. By contrast, before the crisis
we have only seen a variance of less than 10 pp2 among all forecasters. Chart 5.1.2 – Chart
5.1.4 show a similar story; in addition the decrease of inflation expectations has been stronger
on the short- than on the long-end.
Chart 5.1.1: Variance of inflation expectations in squared percentage points
Chart 5.1.2: Distribution of 1-year inflation expectations
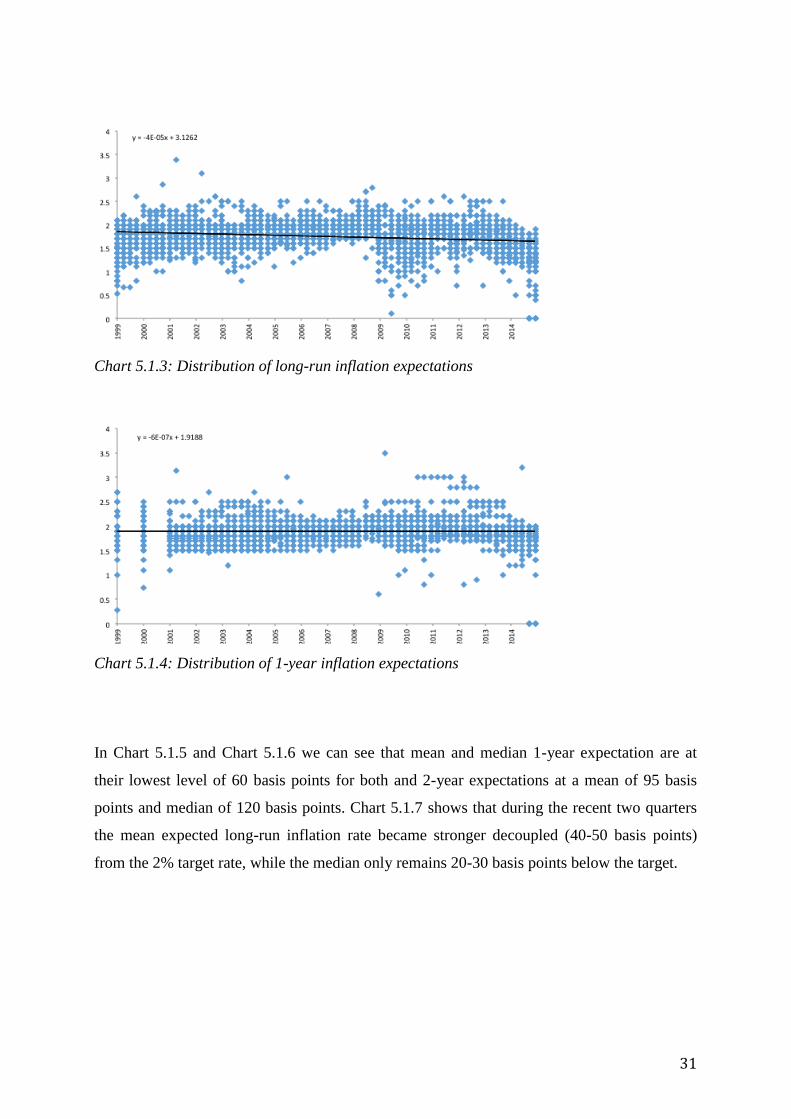
31
Chart 5.1.3: Distribution of long-run inflation expectations
Chart 5.1.4: Distribution of 1-year inflation expectations
In Chart 5.1.5 and Chart 5.1.6 we can see that mean and median 1-year expectation are at
their lowest level of 60 basis points for both and 2-year expectations at a mean of 95 basis
points and median of 120 basis points. Chart 5.1.7 shows that during the recent two quarters
the mean expected long-run inflation rate became stronger decoupled (40-50 basis points)
from the 2% target rate, while the median only remains 20-30 basis points below the target.
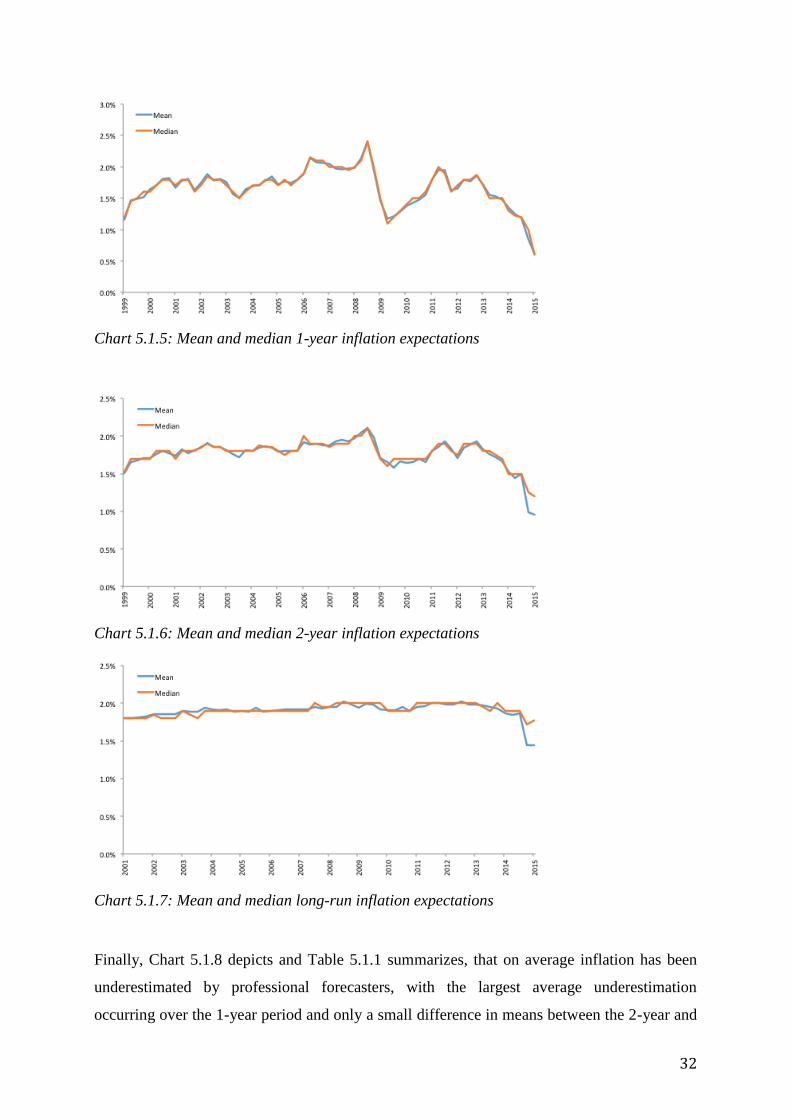
32
Chart 5.1.5: Mean and median 1-year inflation expectations
Chart 5.1.6: Mean and median 2-year inflation expectations
Chart 5.1.7: Mean and median long-run inflation expectations
Finally, Chart 5.1.8 depicts and Table 5.1.1 summarizes, that on average inflation has been
underestimated by professional forecasters, with the largest average underestimation
occurring over the 1-year period and only a small difference in means between the 2-year and
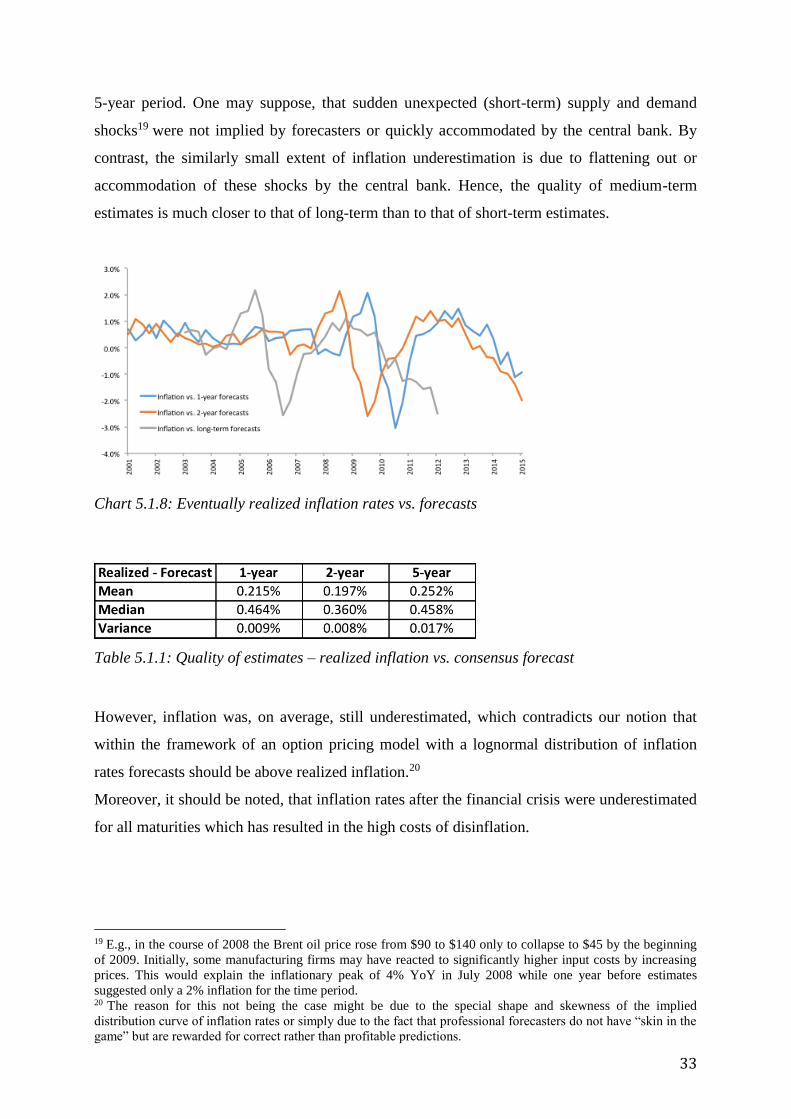
33
5-year period. One may suppose, that sudden unexpected (short-term) supply and demand
shocks19 were not implied by forecasters or quickly accommodated by the central bank. By
contrast, the similarly small extent of inflation underestimation is due to flattening out or
accommodation of these shocks by the central bank. Hence, the quality of medium-term
estimates is much closer to that of long-term than to that of short-term estimates.
Chart 5.1.8: Eventually realized inflation rates vs. forecasts
Table 5.1.1: Quality of estimates – realized inflation vs. consensus forecast
However, inflation was, on average, still underestimated, which contradicts our notion that
within the framework of an option pricing model with a lognormal distribution of inflation
rates forecasts should be above realized inflation.20
Moreover, it should be noted, that inflation rates after the financial crisis were underestimated
for all maturities which has resulted in the high costs of disinflation.
19 E.g., in the course of 2008 the Brent oil price rose from $90 to $140 only to collapse to $45 by the beginning
of 2009. Initially, some manufacturing firms may have reacted to significantly higher input costs by increasing
prices. This would explain the inflationary peak of 4% YoY in July 2008 while one year before estimates
suggested only a 2% inflation for the time period. 20 The reason for this not being the case might be due to the special shape and skewness of the implied
distribution curve of inflation rates or simply due to the fact that professional forecasters do not have “skin in the
game” but are rewarded for correct rather than profitable predictions.
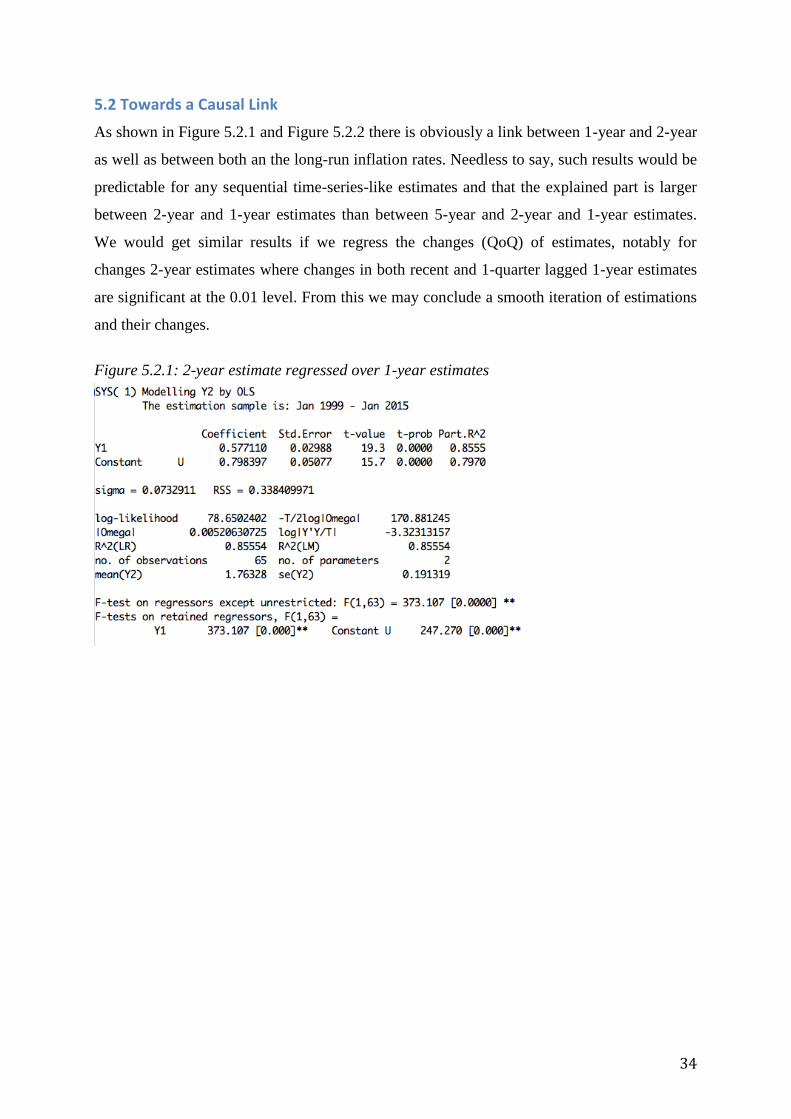
34
5.2 Towards a Causal Link
As shown in Figure 5.2.1 and Figure 5.2.2 there is obviously a link between 1-year and 2-year
as well as between both an the long-run inflation rates. Needless to say, such results would be
predictable for any sequential time-series-like estimates and that the explained part is larger
between 2-year and 1-year estimates than between 5-year and 2-year and 1-year estimates.
We would get similar results if we regress the changes (QoQ) of estimates, notably for
changes 2-year estimates where changes in both recent and 1-quarter lagged 1-year estimates
are significant at the 0.01 level. From this we may conclude a smooth iteration of estimations
and their changes.
Figure 5.2.1: 2-year estimate regressed over 1-year estimates
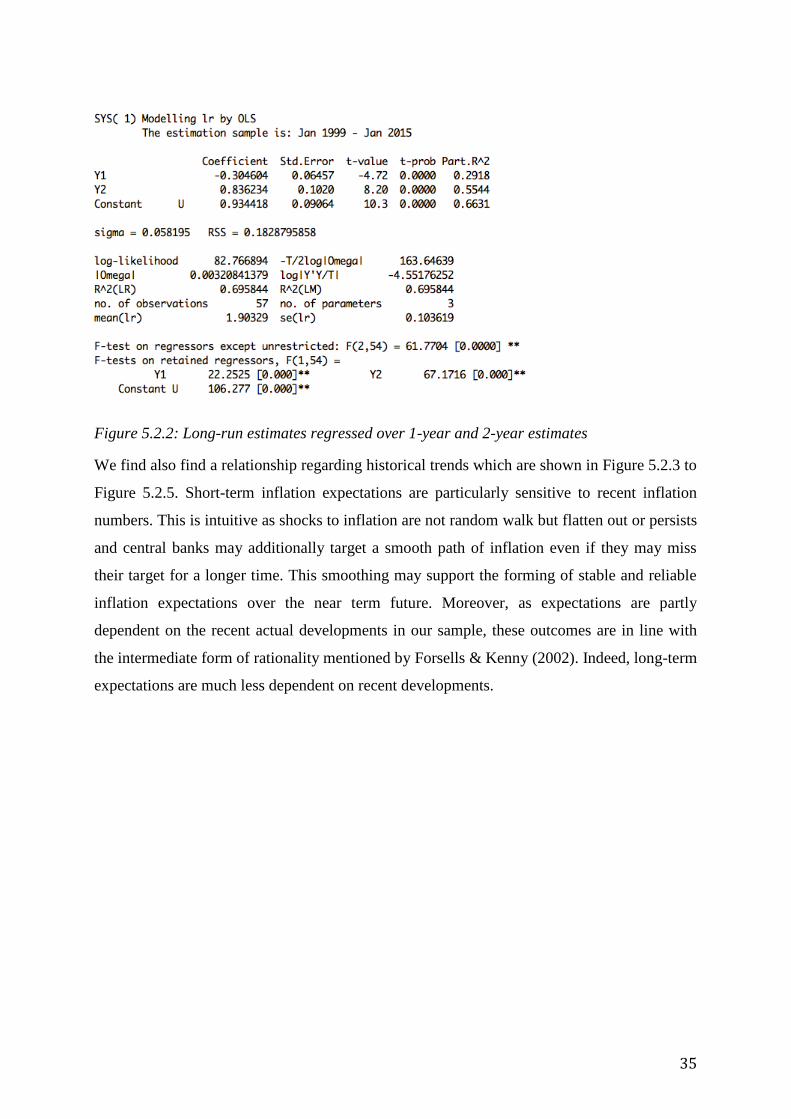
35
We find also find a relationship regarding historical trends which are shown in Figure 5.2.3 to
Figure 5.2.5. Short-term inflation expectations are particularly sensitive to recent inflation
numbers. This is intuitive as shocks to inflation are not random walk but flatten out or persists
and central banks may additionally target a smooth path of inflation even if they may miss
their target for a longer time. This smoothing may support the forming of stable and reliable
inflation expectations over the near term future. Moreover, as expectations are partly
dependent on the recent actual developments in our sample, these outcomes are in line with
the intermediate form of rationality mentioned by Forsells & Kenny (2002). Indeed, long-term
expectations are much less dependent on recent developments.
Figure 5.2.2: Long-run estimates regressed over 1-year and 2-year estimates
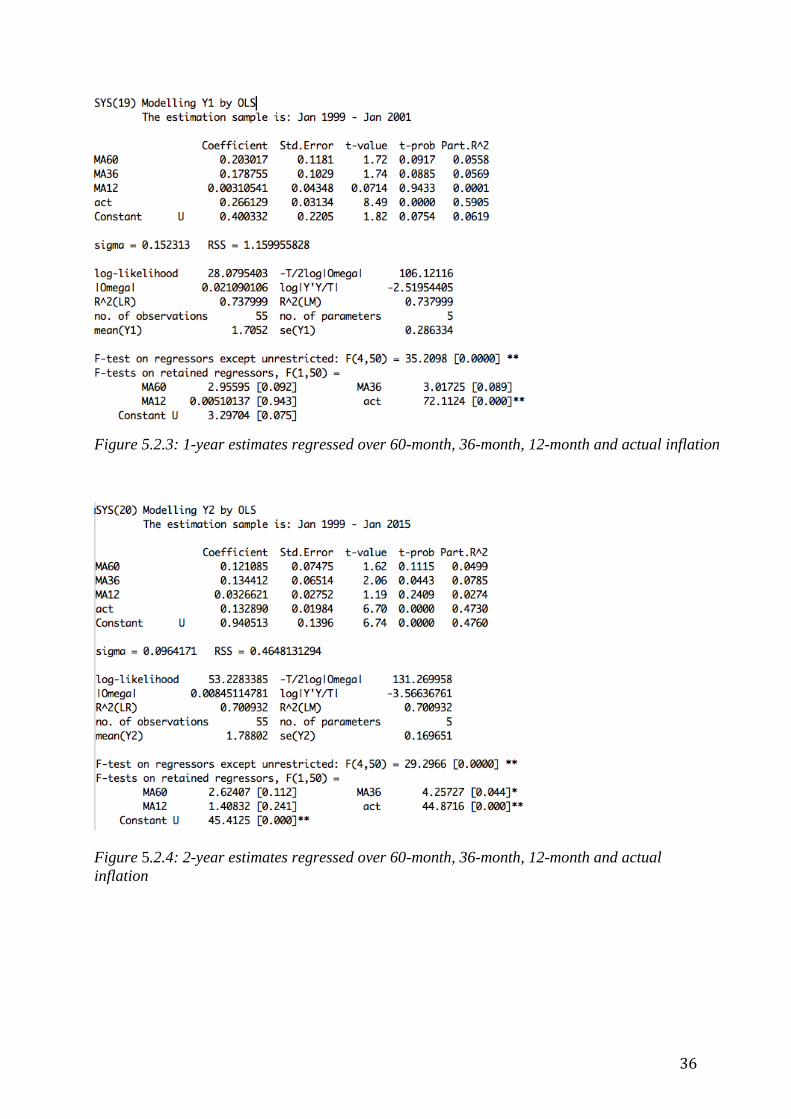
36
Figure 5.2.3: 1-year estimates regressed over 60-month, 36-month, 12-month and actual inflation
Figure 5.2.4: 2-year estimates regressed over 60-month, 36-month, 12-month and actual
inflation
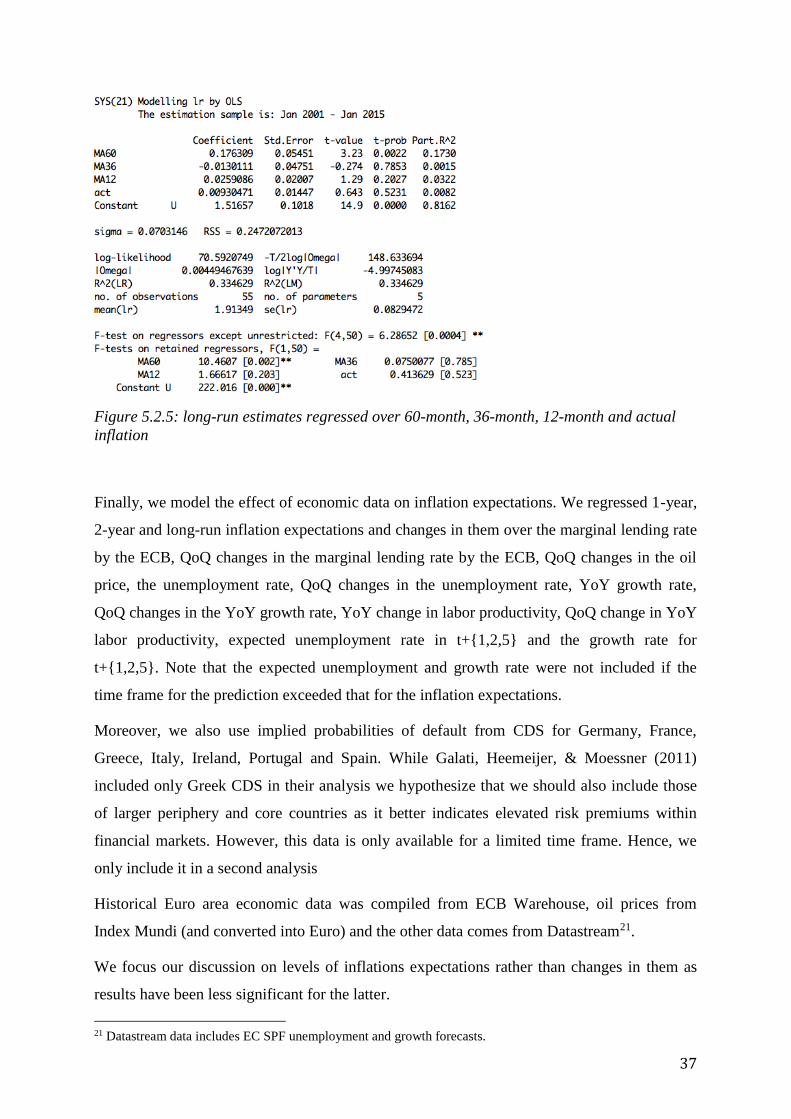
37
Finally, we model the effect of economic data on inflation expectations. We regressed 1-year,
2-year and long-run inflation expectations and changes in them over the marginal lending rate
by the ECB, QoQ changes in the marginal lending rate by the ECB, QoQ changes in the oil
price, the unemployment rate, QoQ changes in the unemployment rate, YoY growth rate,
QoQ changes in the YoY growth rate, YoY change in labor productivity, QoQ change in YoY
labor productivity, expected unemployment rate in t+{1,2,5} and the growth rate for
t+{1,2,5}. Note that the expected unemployment and growth rate were not included if the
time frame for the prediction exceeded that for the inflation expectations.
Moreover, we also use implied probabilities of default from CDS for Germany, France,
Greece, Italy, Ireland, Portugal and Spain. While Galati, Heemeijer, & Moessner (2011)
included only Greek CDS in their analysis we hypothesize that we should also include those
of larger periphery and core countries as it better indicates elevated risk premiums within
financial markets. However, this data is only available for a limited time frame. Hence, we
only include it in a second analysis
Historical Euro area economic data was compiled from ECB Warehouse, oil prices from
Index Mundi (and converted into Euro) and the other data comes from Datastream21.
We focus our discussion on levels of inflations expectations rather than changes in them as
results have been less significant for the latter.
21 Datastream data includes EC SPF unemployment and growth forecasts.
Figure 5.2.5: long-run estimates regressed over 60-month, 36-month, 12-month and actual
inflation
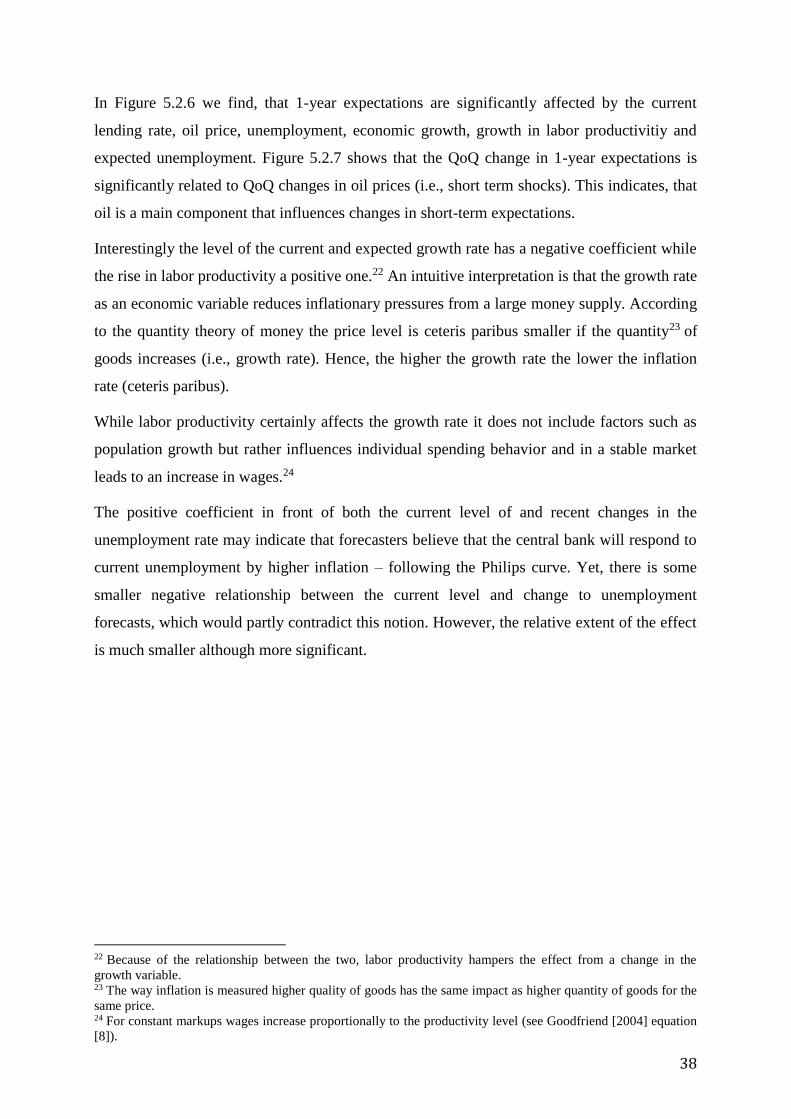
38
In Figure 5.2.6 we find, that 1-year expectations are significantly affected by the current
lending rate, oil price, unemployment, economic growth, growth in labor productivitiy and
expected unemployment. Figure 5.2.7 shows that the QoQ change in 1-year expectations is
significantly related to QoQ changes in oil prices (i.e., short term shocks). This indicates, that
oil is a main component that influences changes in short-term expectations.
Interestingly the level of the current and expected growth rate has a negative coefficient while
the rise in labor productivity a positive one.22 An intuitive interpretation is that the growth rate
as an economic variable reduces inflationary pressures from a large money supply. According
to the quantity theory of money the price level is ceteris paribus smaller if the quantity23 of
goods increases (i.e., growth rate). Hence, the higher the growth rate the lower the inflation
rate (ceteris paribus).
While labor productivity certainly affects the growth rate it does not include factors such as
population growth but rather influences individual spending behavior and in a stable market
leads to an increase in wages.24
The positive coefficient in front of both the current level of and recent changes in the
unemployment rate may indicate that forecasters believe that the central bank will respond to
current unemployment by higher inflation – following the Philips curve. Yet, there is some
smaller negative relationship between the current level and change to unemployment
forecasts, which would partly contradict this notion. However, the relative extent of the effect
is much smaller although more significant.
22 Because of the relationship between the two, labor productivity hampers the effect from a change in the
growth variable. 23 The way inflation is measured higher quality of goods has the same impact as higher quantity of goods for the
same price. 24 For constant markups wages increase proportionally to the productivity level (see Goodfriend [2004] equation
[8]).
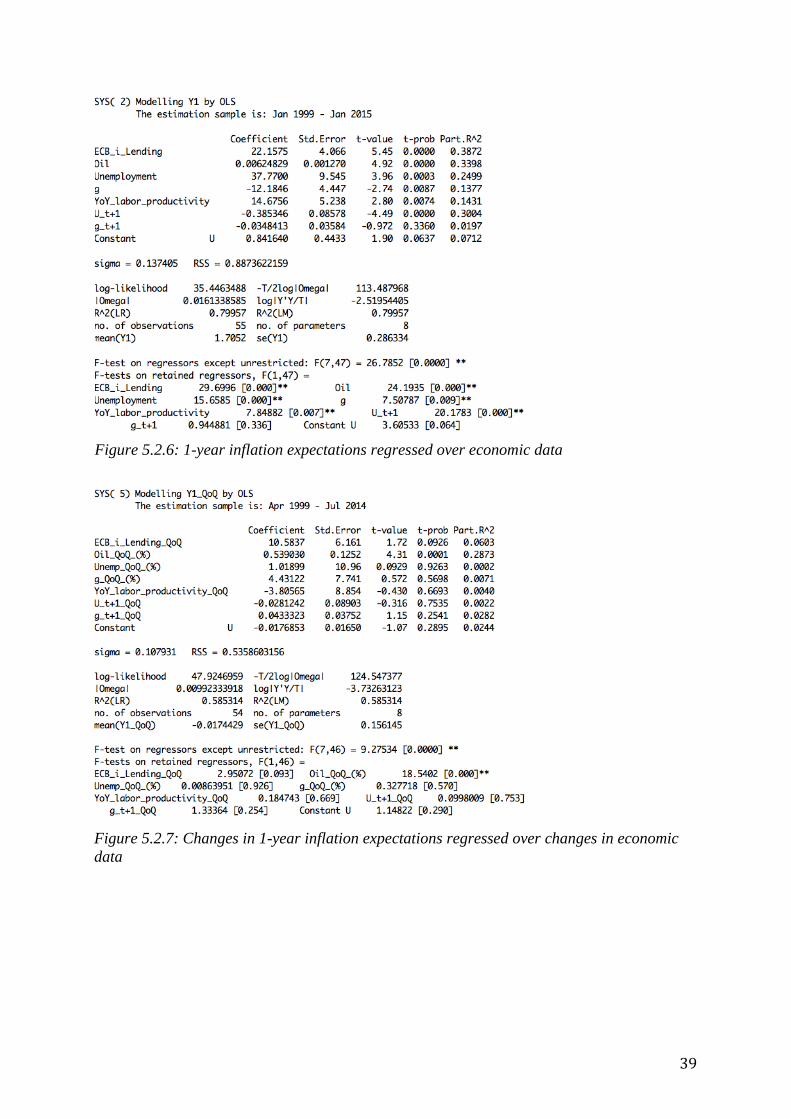
39
Figure 5.2.7: Changes in 1-year inflation expectations regressed over changes in economic
data
Figure 5.2.6: 1-year inflation expectations regressed over economic data
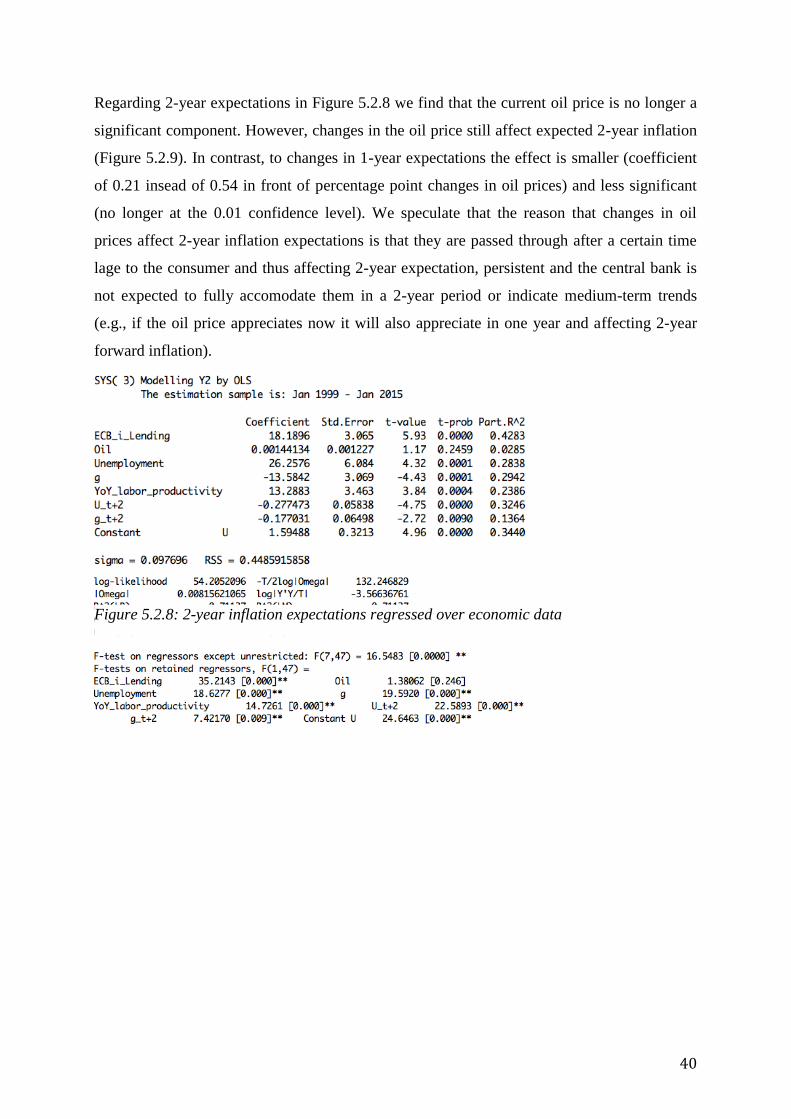
40
Regarding 2-year expectations in Figure 5.2.8 we find that the current oil price is no longer a
significant component. However, changes in the oil price still affect expected 2-year inflation
(Figure 5.2.9). In contrast, to changes in 1-year expectations the effect is smaller (coefficient
of 0.21 insead of 0.54 in front of percentage point changes in oil prices) and less significant
(no longer at the 0.01 confidence level). We speculate that the reason that changes in oil
prices affect 2-year inflation expectations is that they are passed through after a certain time
lage to the consumer and thus affecting 2-year expectation, persistent and the central bank is
not expected to fully accomodate them in a 2-year period or indicate medium-term trends
(e.g., if the oil price appreciates now it will also appreciate in one year and affecting 2-year
forward inflation).
Figure 5.2.8: 2-year inflation expectations regressed over economic data
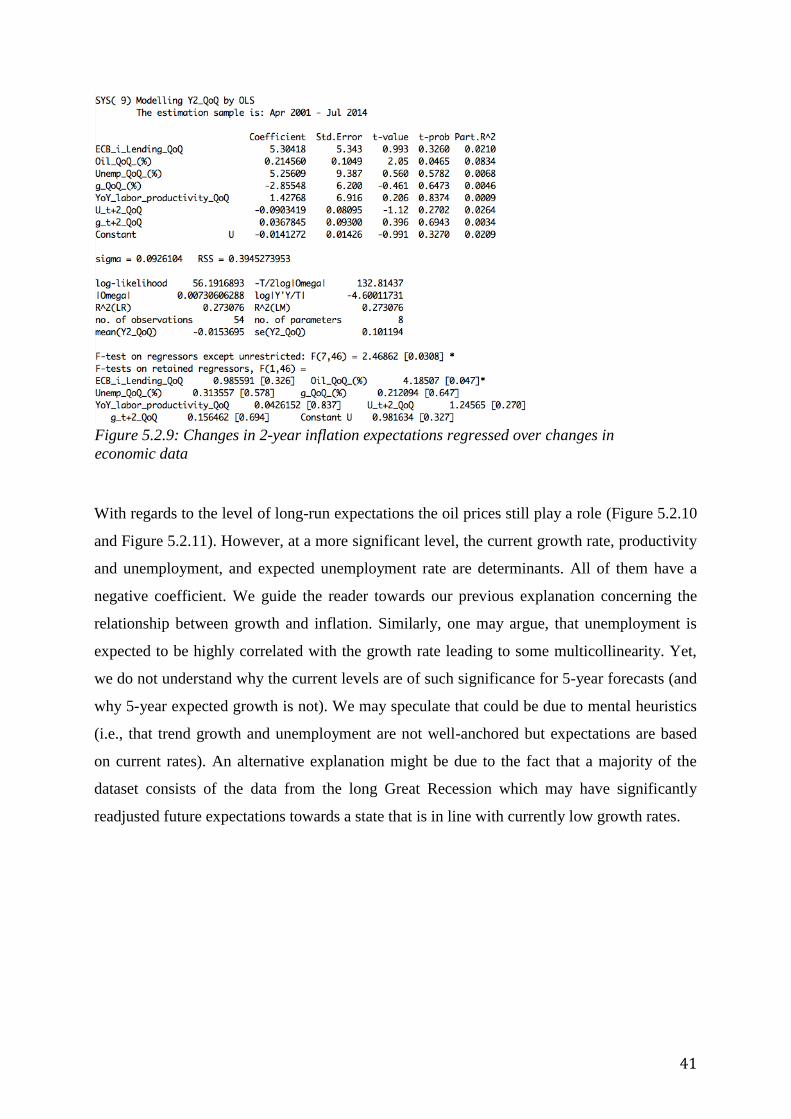
41
With regards to the level of long-run expectations the oil prices still play a role (Figure 5.2.10
and Figure 5.2.11). However, at a more significant level, the current growth rate, productivity
and unemployment, and expected unemployment rate are determinants. All of them have a
negative coefficient. We guide the reader towards our previous explanation concerning the
relationship between growth and inflation. Similarly, one may argue, that unemployment is
expected to be highly correlated with the growth rate leading to some multicollinearity. Yet,
we do not understand why the current levels are of such significance for 5-year forecasts (and
why 5-year expected growth is not). We may speculate that could be due to mental heuristics
(i.e., that trend growth and unemployment are not well-anchored but expectations are based
on current rates). An alternative explanation might be due to the fact that a majority of the
dataset consists of the data from the long Great Recession which may have significantly
readjusted future expectations towards a state that is in line with currently low growth rates.
Figure 5.2.9: Changes in 2-year inflation expectations regressed over changes in
economic data
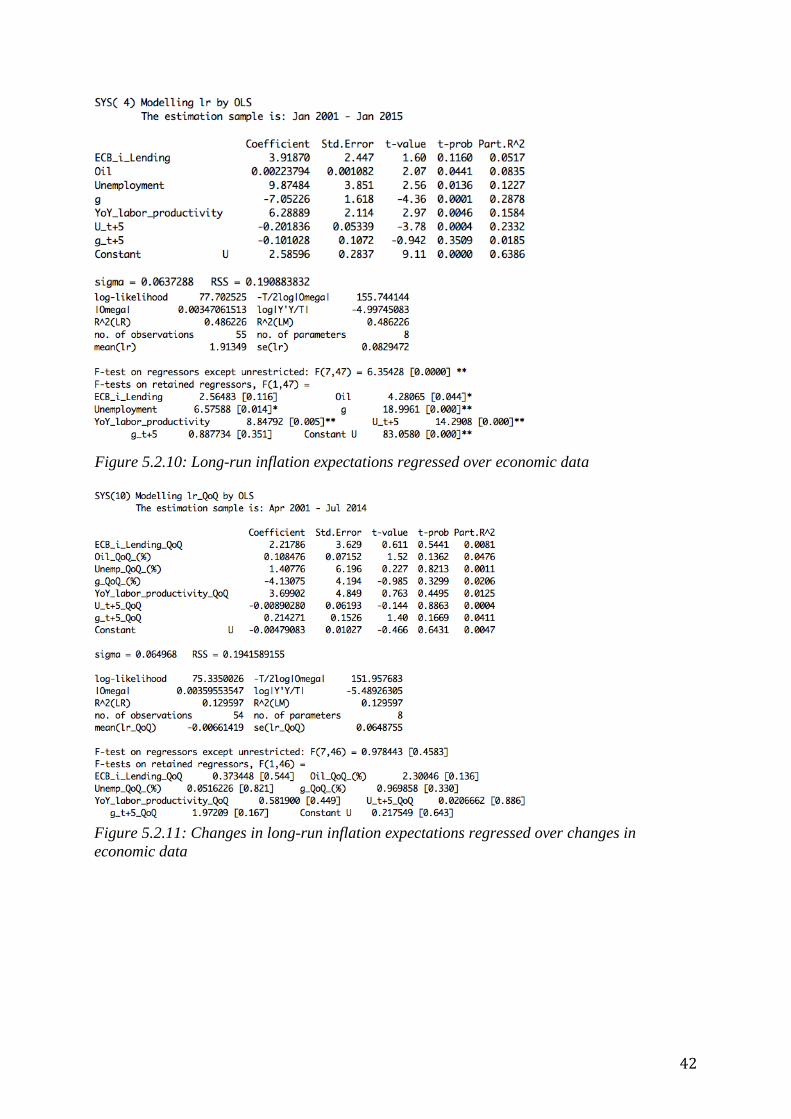
42
Figure 5.2.11: Changes in long-run inflation expectations regressed over changes in
economic data
Figure 5.2.10: Long-run inflation expectations regressed over economic data
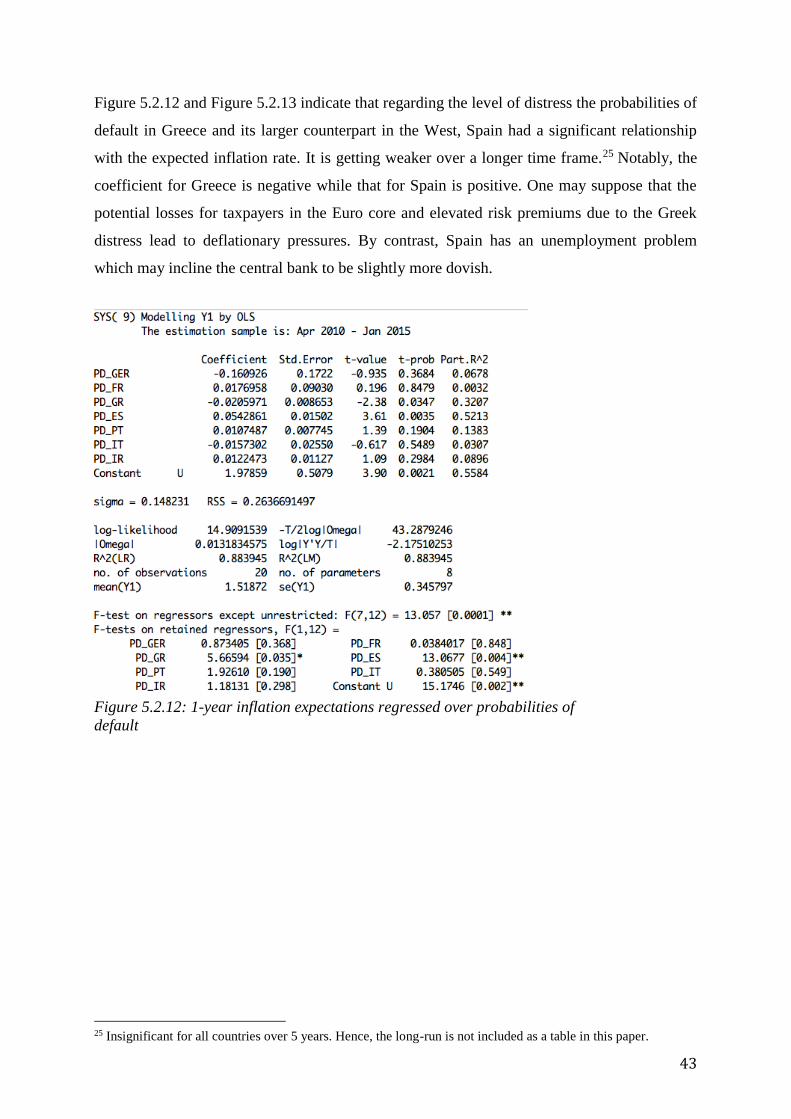
43
Figure 5.2.12 and Figure 5.2.13 indicate that regarding the level of distress the probabilities of
default in Greece and its larger counterpart in the West, Spain had a significant relationship
with the expected inflation rate. It is getting weaker over a longer time frame.25 Notably, the
coefficient for Greece is negative while that for Spain is positive. One may suppose that the
potential losses for taxpayers in the Euro core and elevated risk premiums due to the Greek
distress lead to deflationary pressures. By contrast, Spain has an unemployment problem
which may incline the central bank to be slightly more dovish.
25 Insignificant for all countries over 5 years. Hence, the long-run is not included as a table in this paper.
Figure 5.2.12: 1-year inflation expectations regressed over probabilities of
default
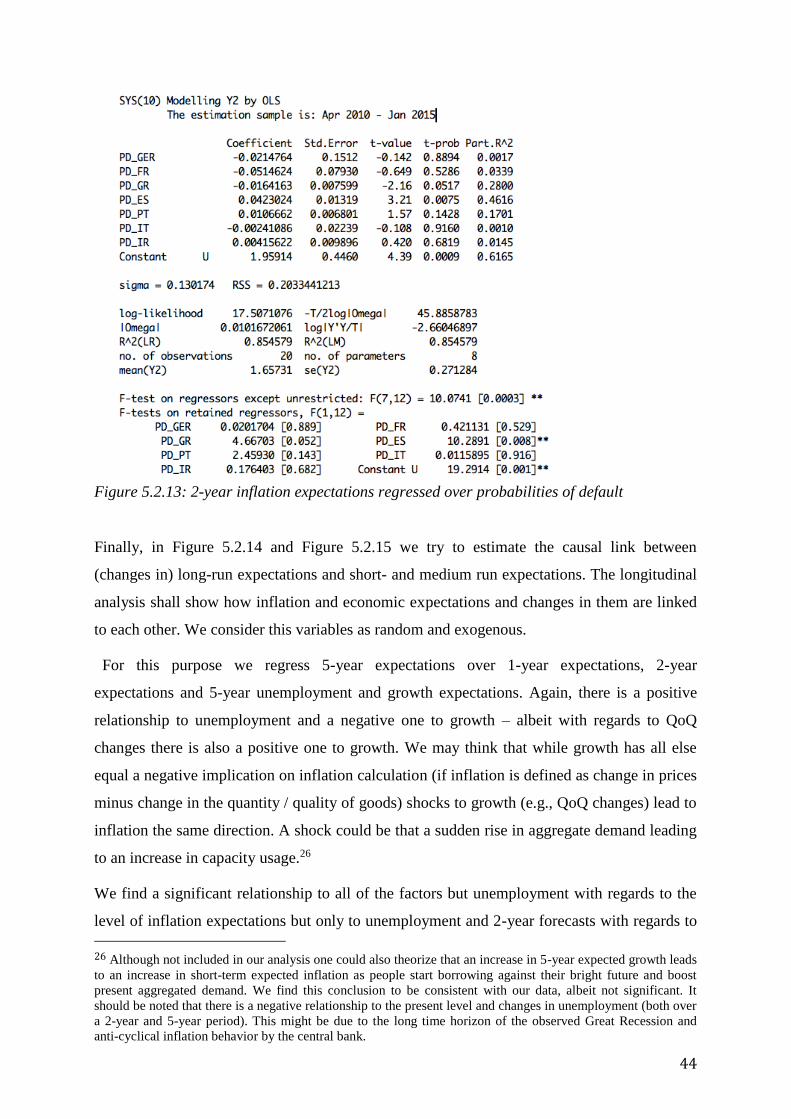
44
Finally, in Figure 5.2.14 and Figure 5.2.15 we try to estimate the causal link between
(changes in) long-run expectations and short- and medium run expectations. The longitudinal
analysis shall show how inflation and economic expectations and changes in them are linked
to each other. We consider this variables as random and exogenous.
For this purpose we regress 5-year expectations over 1-year expectations, 2-year
expectations and 5-year unemployment and growth expectations. Again, there is a positive
relationship to unemployment and a negative one to growth – albeit with regards to QoQ
changes there is also a positive one to growth. We may think that while growth has all else
equal a negative implication on inflation calculation (if inflation is defined as change in prices
minus change in the quantity / quality of goods) shocks to growth (e.g., QoQ changes) lead to
inflation the same direction. A shock could be that a sudden rise in aggregate demand leading
to an increase in capacity usage.26
We find a significant relationship to all of the factors but unemployment with regards to the
level of inflation expectations but only to unemployment and 2-year forecasts with regards to
26 Although not included in our analysis one could also theorize that an increase in 5-year expected growth leads
to an increase in short-term expected inflation as people start borrowing against their bright future and boost
present aggregated demand. We find this conclusion to be consistent with our data, albeit not significant. It
should be noted that there is a negative relationship to the present level and changes in unemployment (both over
a 2-year and 5-year period). This might be due to the long time horizon of the observed Great Recession and
anti-cyclical inflation behavior by the central bank.
Figure 5.2.13: 2-year inflation expectations regressed over probabilities of default
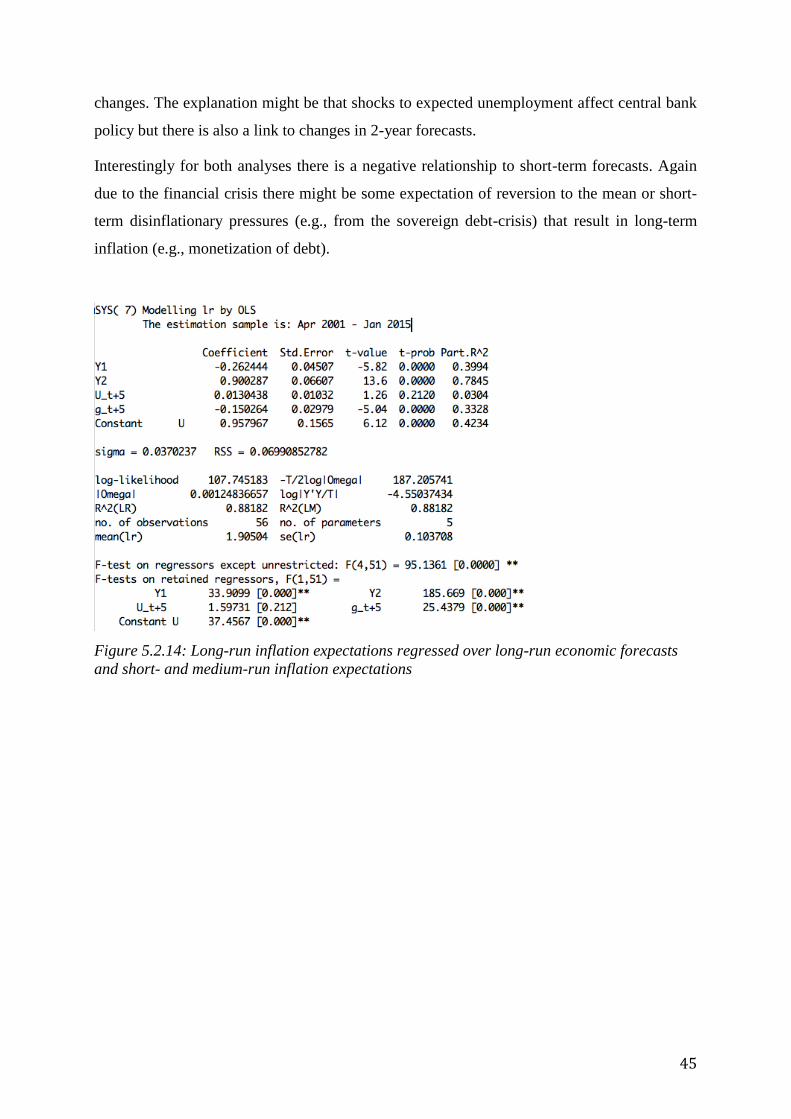
45
changes. The explanation might be that shocks to expected unemployment affect central bank
policy but there is also a link to changes in 2-year forecasts.
Interestingly for both analyses there is a negative relationship to short-term forecasts. Again
due to the financial crisis there might be some expectation of reversion to the mean or short-
term disinflationary pressures (e.g., from the sovereign debt-crisis) that result in long-term
inflation (e.g., monetization of debt).
Figure 5.2.14: Long-run inflation expectations regressed over long-run economic forecasts
and short- and medium-run inflation expectations
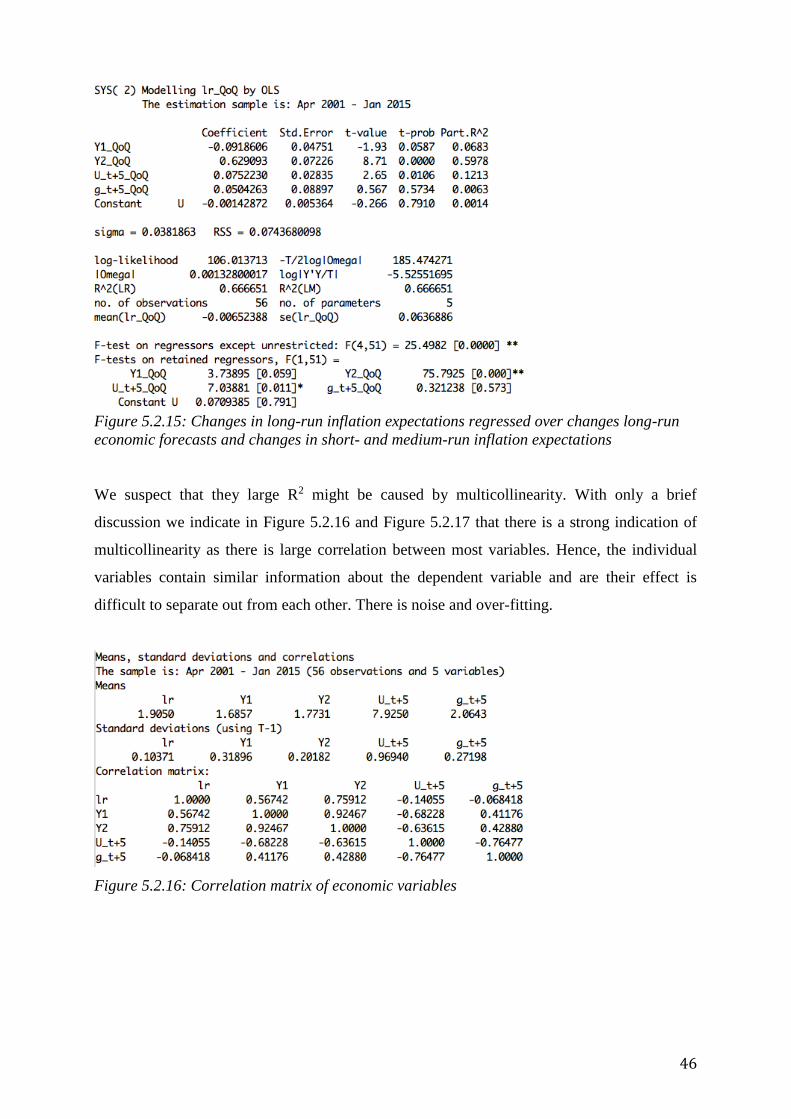
46
We suspect that they large R2 might be caused by multicollinearity. With only a brief
discussion we indicate in Figure 5.2.16 and Figure 5.2.17 that there is a strong indication of
multicollinearity as there is large correlation between most variables. Hence, the individual
variables contain similar information about the dependent variable and are their effect is
difficult to separate out from each other. There is noise and over-fitting.
Figure 5.2.16: Correlation matrix of economic variables
Figure 5.2.15: Changes in long-run inflation expectations regressed over changes long-run
economic forecasts and changes in short- and medium-run inflation expectations
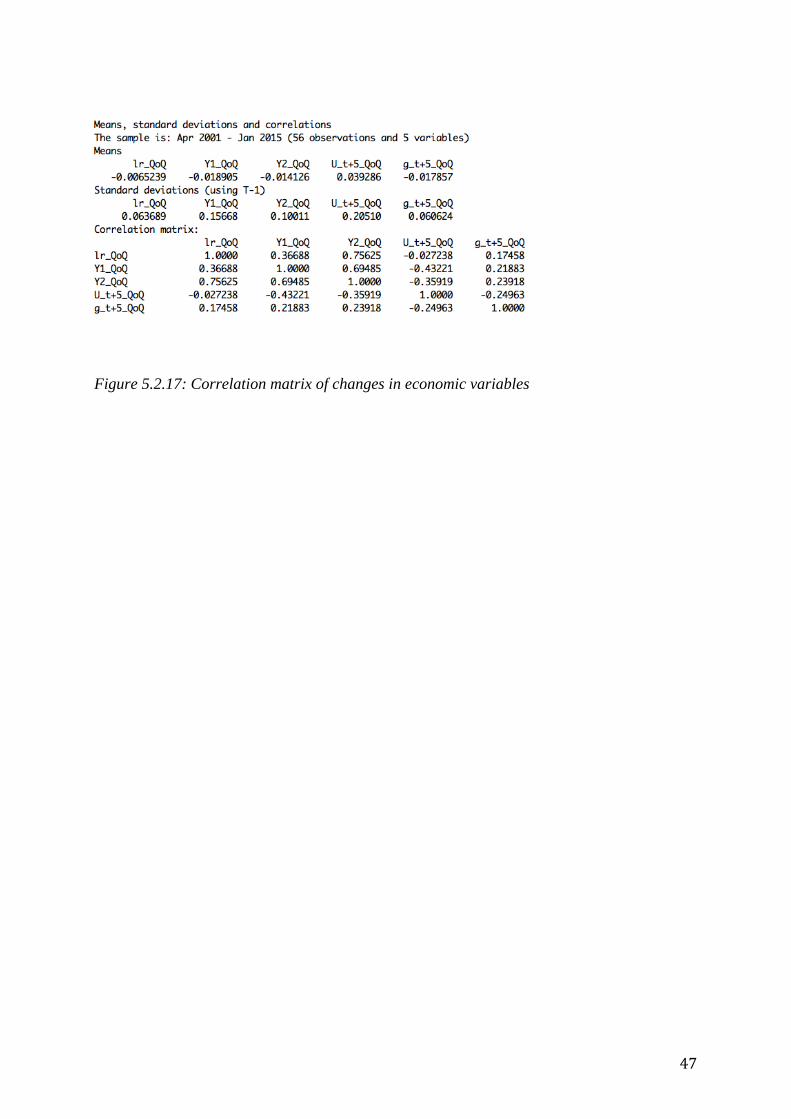
47
Figure 5.2.17: Correlation matrix of changes in economic variables
48
6. Conclusion
We provide several answers to the key question of this paper about the causal link between
short-term and long-term inflation expectations.
Firstly, as the Great Inflation of the 1970s shows supply shocks result may result in a change
of short-term expectations as headline inflation number may lag changes in core inflation.
Normally, there should be online little effect on long-term expectations if they are well-
anchored and the central bank has credibility for its target. However, if the central bank does
not actively defend it and allows sequential shocks to elevate short-term expectations these
may pass through to long-term inflation expectations. Economic agents incorporate the fact
that disinflations and credibility-proofs are costly and political pressure may support lose
monetary policy.
Secondly, a change in long-term expectations due to changes in policy rates is likely to affect
short-term expectations if new targets are perceived as credible. As currently observable in
India the central bank may pursue a step-down policy under which is reduces the current
inflation rate to the target rate through a smooth disinflationary process. Upon announcement
of this target expectations may adapt if credibility is given. At the same time, however, if the
central bank fails to achieve its intermediate target (or is expected to do so) it long-term target
will become questioned again.
Thirdly, with regards to currency unions with heterogeneous members, we suggest that even
both short-term as well as long-term (e.g., 5-year) inflation expectations in individual
countries may deviate from the explicit target. Even though the central bank has credibility
for the currency-wide inflation target heterogeneity in individual countries may lead to large
and over many years persistent inflation differentials. Inflation expectations become grounded
on the business cycle rather than central bank policy. This is particularly threatening as
asymmetric shocks may elevate the volatility of economic cycles cause inflation and deflation
scares. Moreover, there is some risk of contagion of deflationary expectations which the
European Central Bank has probably already tried to react to.
Fourthly, our own analysis is broadly consistent with these results. Nevertheless, we still find
some link of long-term expectations to current unemployment and oil prices. However, we
have to acknowledge several weaknesses of our analysis among which there are the time
frame of it (to a large extent including the Great Recession with negative expectations
prolonged by the European sovereign debt crisis), and a large degree of multicolinearity. In

49
addition, we have also identified the elevated level of distress (in particular in Spain and
Greece) as causes of changes of particularly changes in short-term expectations.
Fifthly, to make some concluding remarks there is a difference between forecasts and market-
implied inflation rates – especially as the latter one are subject to volatility expectations and
inflation-risk premiums. Moreover, central bank communication (e.g., indication about policy
objectives and rate rises as often heard in the US) may affect both short-term and long-term
expectations.
50
References
Ang, A., Bekaert, G., & Wei, M. (2007). Do macro variables, asset markets, or surveys forecast
inflation better? The Journal of Monetary Economics.
Aoki, K., & Nikolov, K. (2004). Rule-Based Monetary Policy under Central Bank Learning.
Cambridge: The MIT Press.
Ball, L., & Sheridan, N. (2004). Does inflation targeting matter? In B. S. Bernanke, & M. Woodford,
The Inflation-Targeting Debate (S. 249-282). Chicago: University of Chicago Press.
Bank of Japan. (2000). Minutes of Policy Meeting June 12. Tokyo.
Barr, D. G., & Campbell, J. Y. (1997). Inflation, real interest rates, and the bond market: A study of
UK nominal and index-linked government bond prices. Journal of Monetary Economics.
Batini, N., & Laxton, D. (2007). Under What Conditions Can Inflation Targeting Be Adopted? The
Experience of Emerging Markets. In F. S. Mishkin, & K. Schmidt-Hebbel (Hrsg.), Central
Banking, Analysis, and Economic Policies Book (Bd. Vol. 11, S. 467-506). Santiago de Chile:
Banco Central de Chile.
Batini, N., Kuttner, K., & Laxton, D. (Sep. 2005). What Is Inflation Targeting and Why Does Inflation
Targeting Matter? Inflation Targeting: An Assessment of the Impact Do “Preconditions” Need
to Be Met Before the Adoption of Inflation Targeting? 161-186.
Bentivogli, C., & Pagano, P. (1999). Regional Disparities and Labour Mobility: the Euro-11 versus the
USA. Labour(13.3), 737-760.
Bernanke, B. S. (2007). Inflation Expectations and Inflation Forecasting (Speech). Federal Reserve
Bank.
Bernanke, B. S., & Gertler, M. (2000). Monetary Policy and Asset Price Volatility. NBER Working
Paper(No. 7559).
Bernanke, B. S., & Mishkin, F. S. (1992). Central Bank Behavior and the Strategy of Monetary
Policy: Observations From Six Industrialized Countries. NBER Macroeconomics Annual
1992(Vol. 7), 184.
Bernanke, B. S., Laubach, T., Mishkin, F. S., & Posen, A. S. (2000). Inflation Targeting: Lessons from
the International Experience. Journal of Comparative Economics(Vol. 28 No. 2), 422-425.
Branch, W. A. (2004). The Theory of Rationally Heterogeneous Expectations: Evidence from Survey
Data on Inflation Expectations. The Economic Journal.
Buiter, W. (2004). Can central banks go broke? Center for Economic Policy Research Policy Insight
No. 24.
Bullard, J., & Mitra, K. (2002). Learning about monetary policy rules (Working Paper 2000-001E).
Journal of Monetary Economics.
Burda, M. C. (1999). European labor markets and the Euro: How much flexibility do we really need?
Discussion Papers, Interdisciplinary Research Project 373: Quantification and Simulation of
Economic Processes(No. 1999, 41).
Capristàn, C., & Timmermann, A. (2008). Disagreement and Biases in Inflation Expectations. Journal
of Money, Credit and Banking Vol. 41, 365–396.
Carlson, J. A., & Parkin, M. (1975). Inflation Expectations. Econometrica Vol. 42, 123 - 138.
51
Carter, J. E. (1978). Anti-Inflation Speech delivered on television on October, 24.
http://www.pbs.org/wgbh/americanexperience/features/primary-resources/carter-anti-
inflation/.
Clark, T. E., & Davig, T. (Nov. 2008). An Empirical Assessment of the Relationships Among
Inflation and Short- and Long-Term Expectations. The Federal Reserve Bank of Kansas
Economic Research Department(RWP 08-05).
Clark, T. E., & Davig, T. (Nov. 2008). An Empirical Assessment of the Relationships Among
Inflation and Short- and Long-Term Expectations, RWP. The Federal Reserve Bank of Kansas
City Economic Research Department.
Clark, T. E., & Nakata, T. (2008). Has the Behavior of Inflation and Long-Term Inflation
Expectations Changed? Economic Review-Federal Reserve Bank of Kansas City(Vol. 93 No.
1).
Darvas, Z., & Wolff, G. B. (Oct. 2014). So far apart and yet so close: Should the ECB care about
inflation differentials? Bruegel Policy Contribution.
Debelle, G., Masson, P., Savastano, M., & Sharma, S. (1998). Inflation Targeting as a Framework for
Monetary Policy. (I. M. Fund, Hrsg.) Economic Issues, No. 15.
Edwards, S. (2006). The relationship between exchange rates and inflation targeting revisited. NBER
Working Paper 12163.
European Central Bank. (October 2001). Issues Related to Monetary Policy Rules. Monthly Bulletin,
41-43.
European Central Bank. (kein Datum). Definition of Price Stability. Abgerufen am 12. Feb- 2015 von
https://www.ecb.europa.eu/mopo/strategy/pricestab/html/index.en.html
Evans, G. W., & Honkapohja, S. (2001). Learning and Expectations in Macroeconomics. Princeton:
Princeton University Press.
Federal Open Market Committee. (1995). Meeting of the Federal Open Market Committee January
31-February 1. Transcripts of FOMC meetings, (S. 101). Washington.
Fendel, R. M., & Frenkel, M. R. (2006). Five Years of Single European Monetary Policy in Practice:
Is the ECB Rule-Based? Contemporary Economic Policy(Vol. 24, No. 1), 106-115.
Fendel, R., & Frenkel, M. (2009). Inflation Differentials in the Euro Area: Did the ECB Care? Applied
Economics(Vol. 41 No. 10), 1293-1302.
Forsells, M., & Kenny, G. (2002). Survey Expectations, Rationality and the Dynamics of Euro Area
Inflation. Journal of Business Cycle Measurements and Analysis, 13 - 41.
Forsells, M., & Kenny, G. (Aug. 2002). The rationality of consumers' inflation expectations: survey-
based evidence for the euro area. European Central Bank Working Paper Series.
Forsells, M., & Kenny, G. (2002). The rationality of consumers' inflation expectations: survey-based
evidence for the euro area. ECB Working Paper(No. 163).
Fraga, A., Goldfajn, I., & Minella, A. (2004). Inflation Targeting in Emerging Market Economies.
NBER Macroeconomics Annual 2003(Vol. 18), 365-416.
Friedman, M. (June 1951). Commodity-Reserve Currency. The Journal of Political Economy(Vol. 59,
No. 3), 203-232.
52
Friedman, M. (1968). The Role of Monetary Policy. The American Economic Review(Vol. 58 No. 1),
1-17.
Fukuyama, F. (1992). The End of History and the Last Man. New York: Free Press.
Galati, G., Heemeijer, P., & Moessner, R. (Jul 2011). How do inflation expectations form? New
insights from a high-frequency survey. BIS Working Papers(No 349).
Galati, G., Heemeijer, P., & Moessner, R. (2011). How do inflation expectations form? New insights
from a high-frequency survey. BIS Working Papers 349.
Gaspar, V., Smets, F., & Vestin, D. (2006). Adaptive learning, persistance, and optimal monetary
policy. Journal of the European Economic Association , 376–385.
Goodfriend, M. (1993). Interest rate policy and the inflation scare problem: 1979-1992. FRB
Richmond Economic Quarterly(Vol. 79 No. 1), 1-23.
Goodfriend, M. (2002). A Short History of Monetary Policy. Econ-Exchange (a semi-annual
publication for K-12 teachers).
Goodfriend, M. (2004). Monetary policy in the new neoclassical synthesis: a primer. FRB Richmond
Economic Quarterly(Vol. 90 No. 3), 21-45.
Goodfriend, M. (2004). Monetary Policy in the New Neoclassical Synthesis: A Primer. FRB
Richmond Economic Quarterly(Vol. 90 No. 3), 21-45.
Goodfriend, M. (2007). International Adjustment in the New Neoclassical Synthesis. Kiel Working
Paper Collection (No. 2).
Goodfriend, M., & King, R. G. (2005). The incredible Volcker disinflation. Journal of Monetary
Economics(Vol. 52 No. 5), 981-1015.
Gordon, R. J. (1999). Has the “New Economy” Rendered the Productivity Slowdown Obsolete?
Northwestern University and NBER, Revised Version.
Government of India. (Aug. 2014). State-wise Per Capita Income and Gross Domestic Product at
current prices:. Abgerufen am 09. Feb. 2015 von Press Invormation Bureau:
http://pib.nic.in/archieve/others/2014/aug/d2014070801.pdf
Graham, B. (1944). World Commodities & World Currency. New York & London: McGraw-Hill
Book Company.
Graham, F. D. (1942). Social Gods and Economic Institutions. Princeton, N.J.: Princeton University
Press.
Greenspan, A. (6. May 1996). The American economy in a world context. Speech given at the the 35th
Annual Conference on Bank Structure and Competition of the Federal Reserve Bank of
Chicago.
Gurkayanak, R. S., Levin, A. T., & Swanson, E. T. (2007). Does Inflation Targeting Anchor Long-
Run Inflation Expectations? Evidence from Long-Term Bond Yields in the U.S., U.K. And
Sweden. Federal Reserve Bank of San Francisco Working Paper No. 2006-09.
IMF. (Jul. 2014). World Economic Outlook Database.
Irwin, N. (19. Dec. 2014). Of Kiwis and Currencies: How a 2% Inflation Target Became Global
Economic Gospel. The New York Times, S. BU1.
Issing, O., Gaspar, V., Angeloni, I., & Tristani, O. (2001). Monetary Policy in the Euro Area: Strategy
and Decision Making at the European Central Bank. Cambridge: Cambridge University Press.
53
Jha, R. (Mar. 2008). Inflation targeting in India: issues and prospects. International Review of Applied
Economics(Vol. 22, No. 2), 259-270.
Kannan, R. (1999). Inflation targeting: Issues and relevance for India. Economic and Political Weekly,
115-122.
Lucas, R. E. (1980). Rules, Discretion, and the Role of the Economic Advisor. In S. Fisher, Rational
Expectations and Economic Policy (S. 199-210). Chicago: University of Chicago Press.
Mahajan, S., Saha, S. K., & Singh, C. (2014). Inflation Targeting in India. Indian Institute of
Management Working Paper(No. 449).
Mankiw, G. N., & Reis, R. (2001). Sticky information versus sticky prices: a proposal to replace the
New Keynesian Phillips curve. National Bureau of Economic Research(No. 8290).
Mankiw, N. G., Reis, R., & Wolfers, J. (2004). Disagreement about Inflation Expectations. NBER The
Macroeconomics Journal.
McCallum, B. T. (1988). Robustness properties of a rule for monetary policy. Carnegia-Rochester
Conference Series on Public Policy, 29, 173-204.
Mishkin, F. S. (1999). International Eexperiences With Different Monetary Policy Regimes. Journal
of Monetary Economics(Vol. 43), 579–605.
Mishkin, F. S. (1999). International experiences with different monetary policy regimes. Journal of
Monetary Economics(Vol. 43), 579-605.
Mishkin, F. S., & Schmidt-Hebbel, K. (2007). Does inflation targeting make a difference? NBER
Working Paper 12876.
Mohanty, D. (2012). The importance of inflation expectations (Speech). Mumbai: Reserve Bank of
India.
Mundell, R. A. (1961). A theory of optimum currency areas. The American Economic Review(Vol. 51,
No. 4), 657-665.
Mundell, R. A. (1961). A Theory of Optimum Currency Areas. American Economic Association(Vol.
51, No. 4), 657-665.
Muth, J. F. (1961). Rational expectations and the theory of price movements. Econometrica Vol. 29,
315 - 355.
Orphanides, A., & Williams, J. (2004). Imperfect knowledge, inflation expectations and monetary
policy. In B. Bernanke, & M. Woodford, The inflation targeting debate (S. 201 - 234).
Chicago: University of Chicago Press.
Petreski, M. (2007). Is the Euro Zone an Optimal Currency Area? SSRN 986483.
Phelps, E. S. (1967). Phillips Curves, Expectations of Inflation and Optimal Unemployment over
Time. Economics(Vol. 34, No. 135), 254-281.
Plato. (1970). The Laws. London: Penguin.
Raj, J., & Misra, S. (2011). Measures of core inflation in India. Reserve Bank of India Occasional
Papers.
Rajan, R. G. (2013). Statement on taking office on September 4, 2013. Reserve Bank of India.
Mumbai.
RBI. (2014). Edited Transcript of Reserve Bank of India's Post Policy Conference Call with Media.
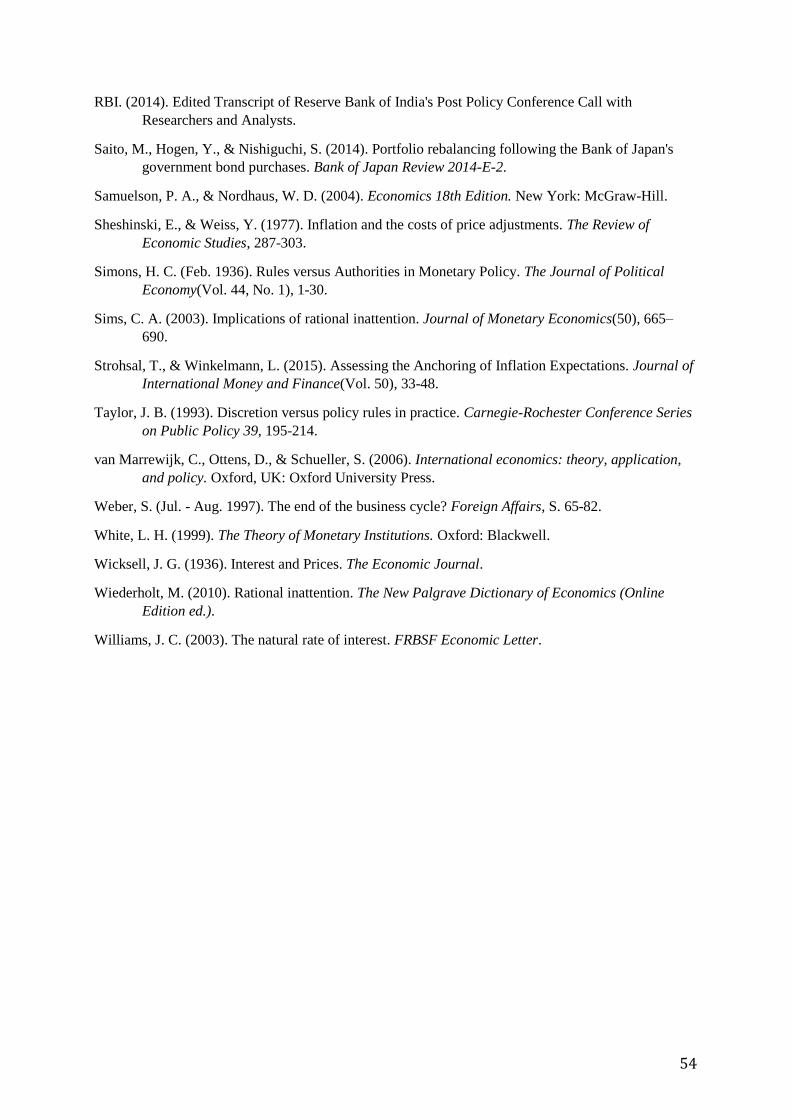
54
RBI. (2014). Edited Transcript of Reserve Bank of India's Post Policy Conference Call with
Researchers and Analysts.
Saito, M., Hogen, Y., & Nishiguchi, S. (2014). Portfolio rebalancing following the Bank of Japan's
government bond purchases. Bank of Japan Review 2014-E-2.
Samuelson, P. A., & Nordhaus, W. D. (2004). Economics 18th Edition. New York: McGraw-Hill.
Sheshinski, E., & Weiss, Y. (1977). Inflation and the costs of price adjustments. The Review of
Economic Studies, 287-303.
Simons, H. C. (Feb. 1936). Rules versus Authorities in Monetary Policy. The Journal of Political
Economy(Vol. 44, No. 1), 1-30.
Sims, C. A. (2003). Implications of rational inattention. Journal of Monetary Economics(50), 665–
690.
Strohsal, T., & Winkelmann, L. (2015). Assessing the Anchoring of Inflation Expectations. Journal of
International Money and Finance(Vol. 50), 33-48.
Taylor, J. B. (1993). Discretion versus policy rules in practice. Carnegie-Rochester Conference Series
on Public Policy 39, 195-214.
van Marrewijk, C., Ottens, D., & Schueller, S. (2006). International economics: theory, application,
and policy. Oxford, UK: Oxford University Press.
Weber, S. (Jul. - Aug. 1997). The end of the business cycle? Foreign Affairs, S. 65-82.
White, L. H. (1999). The Theory of Monetary Institutions. Oxford: Blackwell.
Wicksell, J. G. (1936). Interest and Prices. The Economic Journal.
Wiederholt, M. (2010). Rational inattention. The New Palgrave Dictionary of Economics (Online
Edition ed.).
Williams, J. C. (2003). The natural rate of interest. FRBSF Economic Letter.
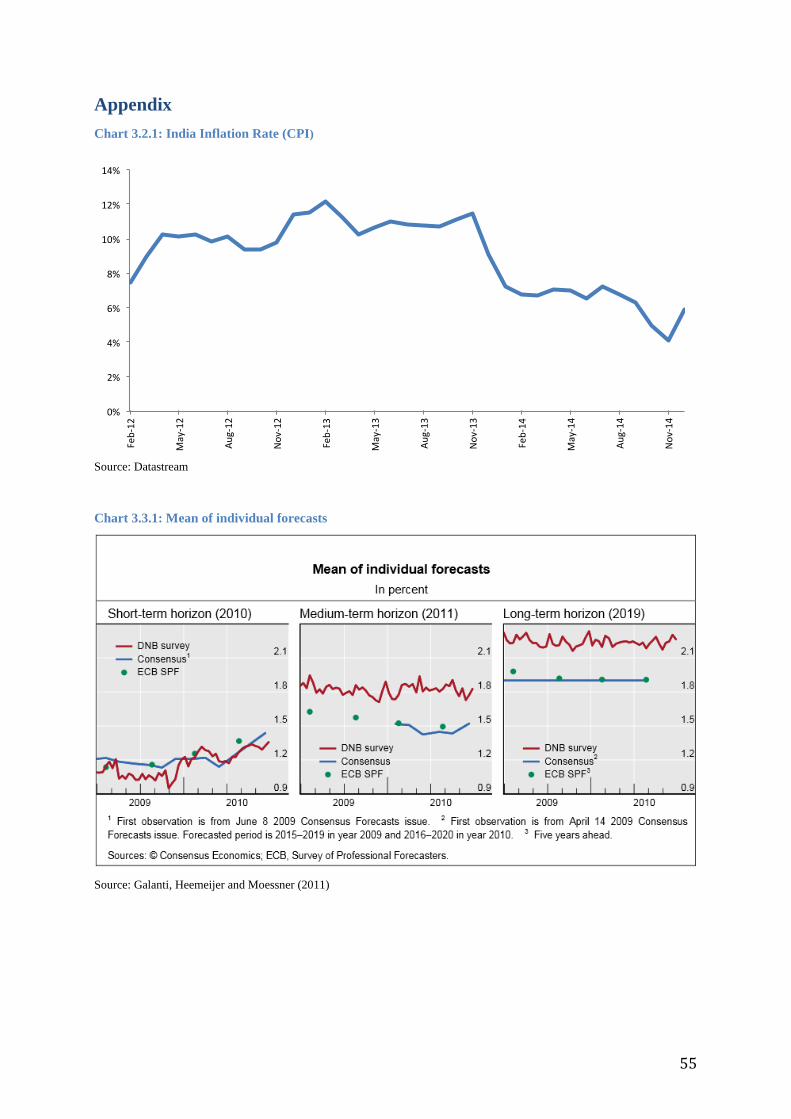
55
Appendix
Chart 3.2.1: India Inflation Rate (CPI)
Source: Datastream
Chart 3.3.1: Mean of individual forecasts
Source: Galanti, Heemeijer and Moessner (2011)
0%
2%
4%
6%
8%
10%
12%
14%
Feb-12
May-12
Aug-12
Nov-12
Feb-13
May-13
Aug-13
Nov-13
Feb-14
May-14
Aug-14
Nov-14
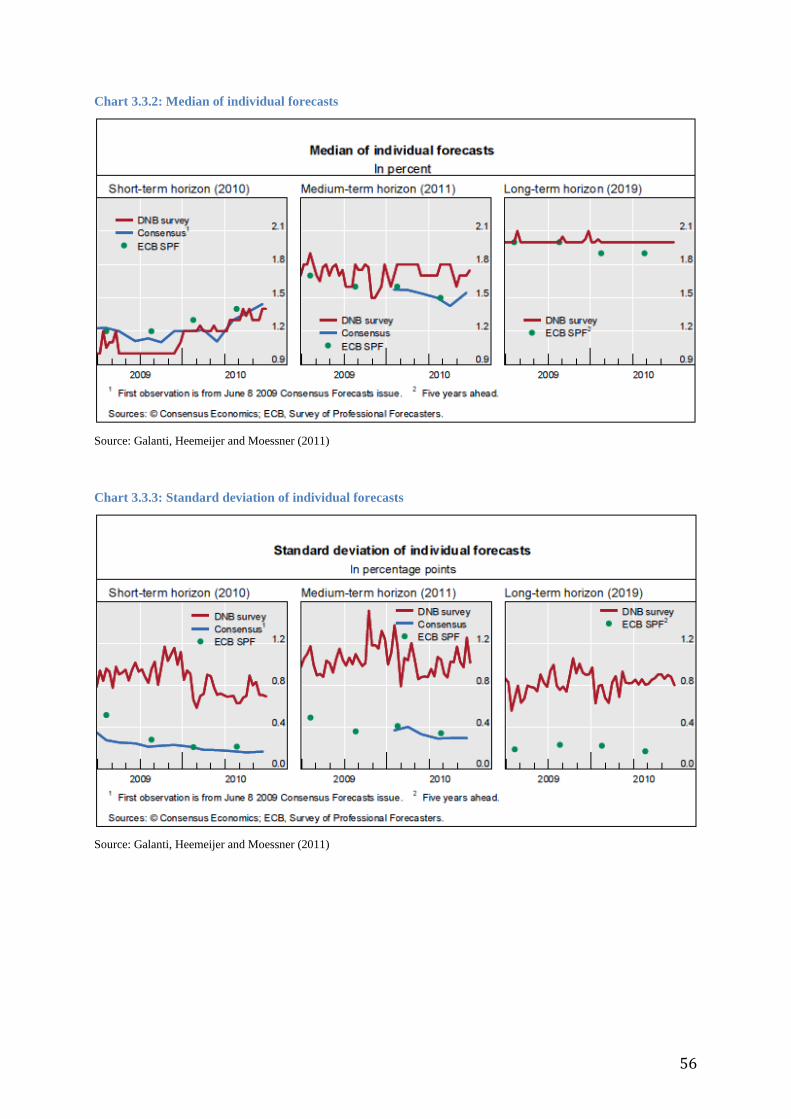
56
Chart 3.3.2: Median of individual forecasts
Source: Galanti, Heemeijer and Moessner (2011)
Chart 3.3.3: Standard deviation of individual forecasts
Source: Galanti, Heemeijer and Moessner (2011)
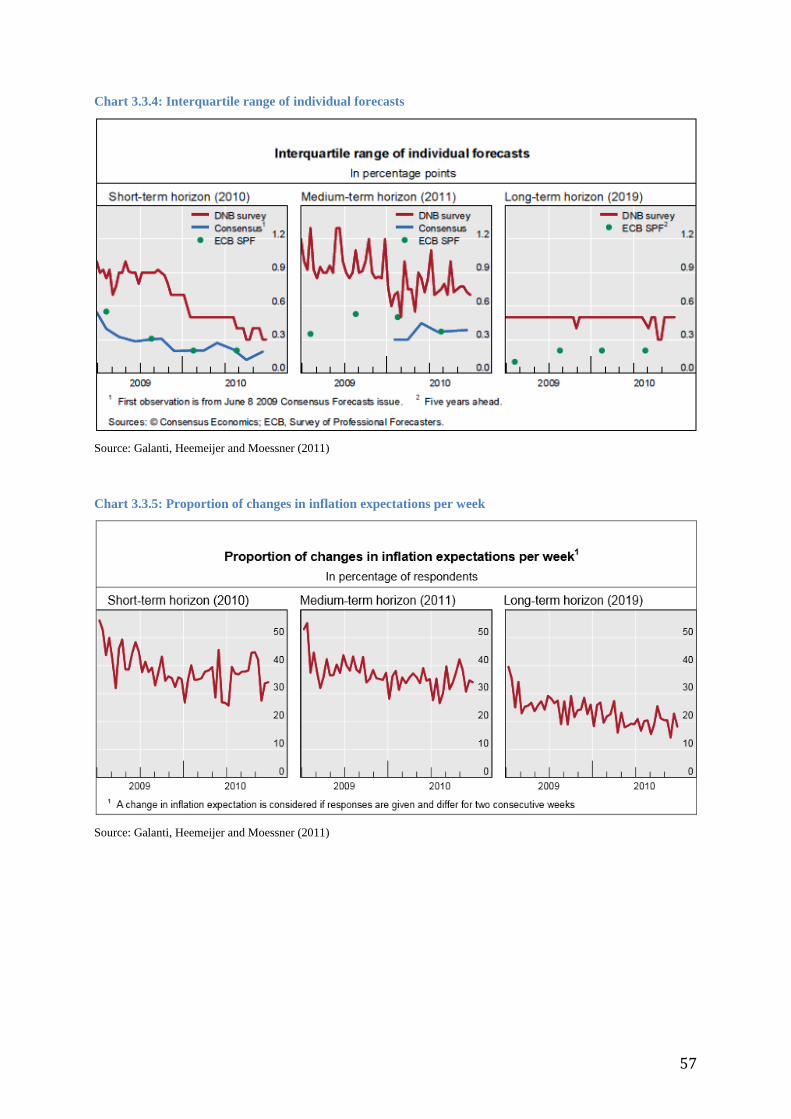
57
Chart 3.3.4: Interquartile range of individual forecasts
Source: Galanti, Heemeijer and Moessner (2011)
Chart 3.3.5: Proportion of changes in inflation expectations per week
Source: Galanti, Heemeijer and Moessner (2011)
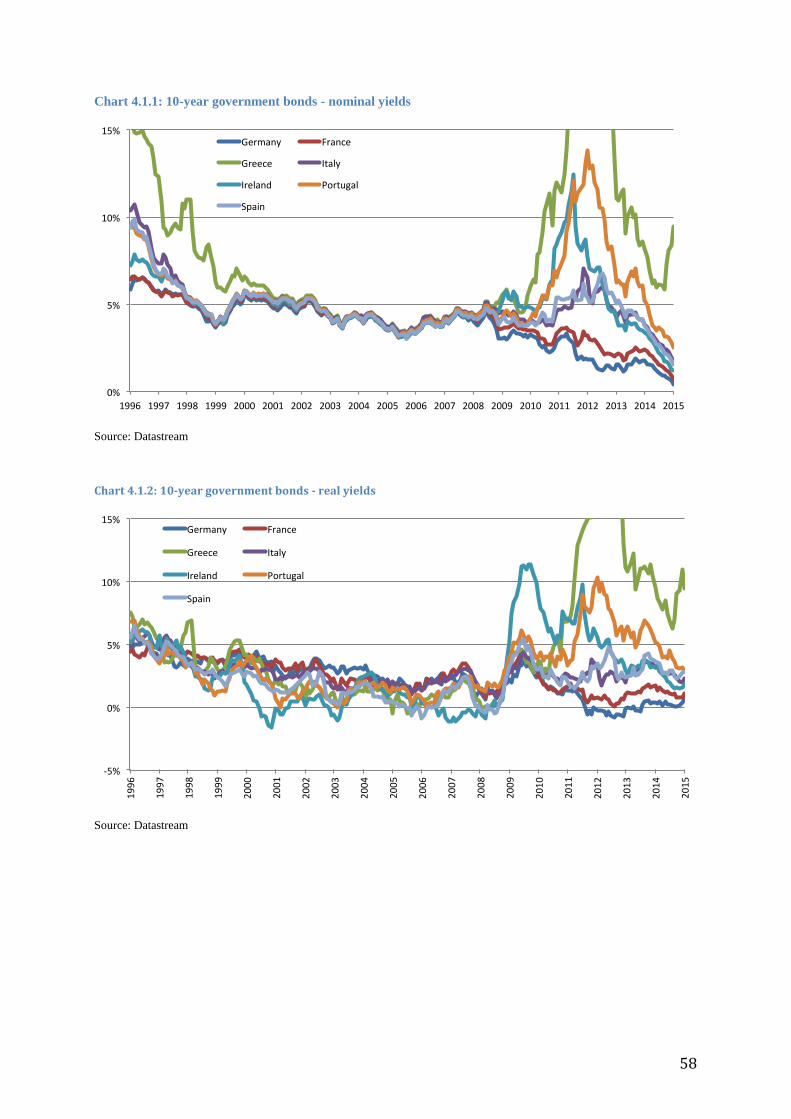
58
Chart 4.1.1: 10-year government bonds - nominal yields
Source: Datastream
Chart 4.1.2: 10-year government bonds - real yields
Source: Datastream
0%
5%
10%
15%
1996 1997 1998 19992000 2001 2002 2003 2004 2005 2006 2007 2008 2009 2010 2011 2012201320142015
Germany France
Greece Italy
Ireland Portugal
Spain
-5%
0%
5%
10%
15%
1996
1997
1998
1999
2000
2001
2002
2003
2004
2005
2006
2007
2008
2009
2010
2011
2012
2013
2014
2015
Germany France
Greece Italy
Ireland Portugal
Spain
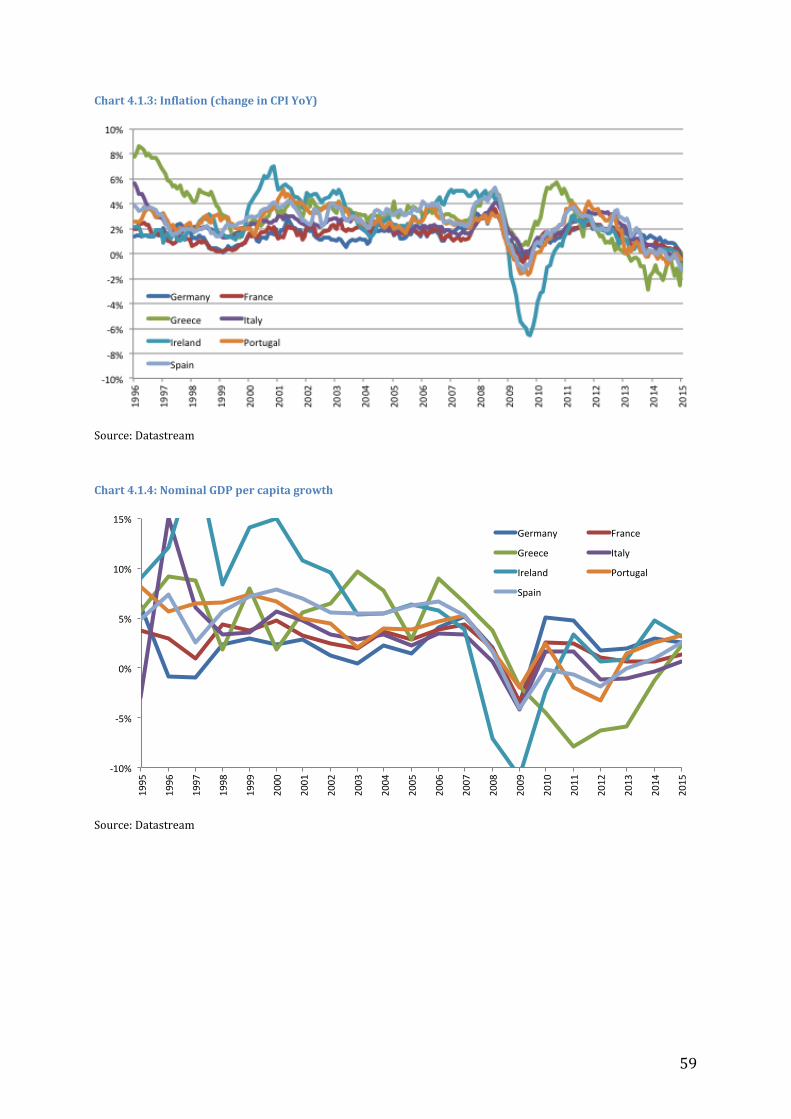
59
Chart 4.1.3: Inflation (change in CPI YoY)
Source: Datastream
Chart 4.1.4: Nominal GDP per capita growth
Source: Datastream
-10%
-5%
0%
5%
10%
15%
1995
1996
1997
1998
1999
2000
2001
2002
2003
2004
2005
2006
2007
2008
2009
2010
2011
2012
2013
2014
2015
Germany France
Greece Italy
Ireland Portugal
Spain
Related Documents


