The causal effect of multitasking on work-related mental health – the more you do, the worse you feel Anna Katharina Pikos * Leibniz Universit¨ at Hannover November 8, 2017 Abstract This paper analyses whether there is a causal relationship between work-related men- tal health problems and multitasking, the number of tasks performed at work. The data comes from two cross sectional surveys on the German working population. The empirical strategies uses technological change as an instrument for multitasking. In the first stage, the introduction of new production and information technologies is associated with increases in multitasking. Production technology adoption has larger associations to manual multitask- ing and informational technology adoption to cognitive multitasking. There is evidence for a causal effect of multitasking on emotional strain, emotional exhaustion and burnout. Keywords: work-related mental health, multitasking, job satisfaction JEL Classification: I10, J28 * Leibniz Universit¨ at Hannover, Institute of Labour Economics, K¨ onigsworther Platz 1, D-30167 Hannover, Germany, e-mail: [email protected], phone: +49 511 7625620. Part of this research is funded by the Federal Ministry of Education and Research (BMBF) within the framework program “Non-monetary returns to educatio”, project “Interactions of education, health, and work capacity” (IBiGA). The author alone is responsible for the content. I thank my colleagues at the Institute of Labor Economics, participants at the research seminar in Hannover, and the IBiGA-team for valuable comments and discussion.

Welcome message from author
This document is posted to help you gain knowledge. Please leave a comment to let me know what you think about it! Share it to your friends and learn new things together.
Transcript

The causal effect of multitasking on work-related mentalhealth – the more you do, the worse you feel
Anna Katharina Pikos∗
Leibniz Universitat Hannover
November 8, 2017
Abstract
This paper analyses whether there is a causal relationship between work-related men-
tal health problems and multitasking, the number of tasks performed at work. The data
comes from two cross sectional surveys on the German working population. The empirical
strategies uses technological change as an instrument for multitasking. In the first stage, the
introduction of new production and information technologies is associated with increases in
multitasking. Production technology adoption has larger associations to manual multitask-
ing and informational technology adoption to cognitive multitasking. There is evidence for
a causal effect of multitasking on emotional strain, emotional exhaustion and burnout.
Keywords: work-related mental health, multitasking, job satisfaction
JEL Classification: I10, J28
∗Leibniz Universitat Hannover, Institute of Labour Economics, Konigsworther Platz 1, D-30167 Hannover,Germany, e-mail: [email protected], phone: +49 511 7625620. Part of this research is funded by theFederal Ministry of Education and Research (BMBF) within the framework program “Non-monetary returns toeducatio”, project “Interactions of education, health, and work capacity” (IBiGA). The author alone is responsiblefor the content. I thank my colleagues at the Institute of Labor Economics, participants at the research seminarin Hannover, and the IBiGA-team for valuable comments and discussion.

1 Introduction
When IBM’s supercomputer Deep Blue won against chess grandmaster Garry Kasparov in
1997, humans still conserved the advantage of adaptation: Deep Blue was a master in chess but
would not have been able to play a simple game such as noughts and crosses without being re-
programmed (Hassabis, 2017). In March 2016, Google DeepMind’s AlphaGo bet the world’s best
player Lee Sedol at go, a complex Chinese board game. Contrary to Deep Blue, AlphaGo is a
learning algorithm that could train, learn from mistakes and develop new strategies. As artificial
intelligence becomes reality, people ask themselves what it will do to mankind. Understanding
how it will change human beings’ life is closely related to philosophical questions about the
place of the human being in the universe, the role of human beings in society, and their identity
(e.g. articles in The Guardian, MinnPost, Wirtschafswoche, Zeit online).
Before attempting to answer these questions, it is necessary to understand what present
technology, i.e. current production and information technology as used throughout developed
countries, does to human beings. We know for example that technological change has hetero-
geneous effects on the demand for skilled and unskilled labor. According to the skill-biased
technological change literature, unskilled jobs are substituted by technology and skilled jobs
are complemented. A recent strand of literature proposes that work tasks are the relevant unit
for the substitution. Routine tasks can be expressed in computer language and are therefore
substitutable. Non-routine tasks cannot be written in “if-then” language and are complemented
by technology. Technological change decreases the demand for routine tasks and increases the
demand for non-routine tasks (Autor et al., 2003, Spitz-Oener, 2006, Goos and Manning, 2007,
Autor et al., 2008, Dustmann et al., 2009, Autor and Handel, 2013). Technological change is
also related to organizational change: it alters the way work is done (e.g. Spitz-Oener, 2008,
Autor and Dorn, 2009). In particular, people perform more tasks at work (Spitz-Oener, 2006,
Antonczyk et al., 2009, Pikos and Thomsen, 2016). In the job design literature, the number of
different tasks carried out at work is called multitasking and is the opposite of specialization.
As chapter two shows, multitasking is related to worse work-related mental health (emotional
strain, emotional exhaustion, burnout) but the analysis remains exploratory. Bias may arise
from reversed causality or self-selection into multitasking.
The present paper aims at investigating whether this relationship is causal by using tech-
nological change as an instrument for multitasking. Technological change facilitates the devel-
opment of task complementarities (Lindbeck and Snower, 2000). Efficiency gains in performing
one task can be carried over to another task. Multitasking is an appropriate job design to
exploit these complementarities. Work content and processes change when new production or
1

information technology is adopted. Assuming that technology adoption is decided upon by the
firm and is hence exogenous to the employee, technology adoption generates exogenous vari-
ance in multitasking. This allows to analyze the causal effect of multitasking on work-related
mental health. The data come from two cross-sectional surveys covering the German working
population in 2006 and 2012.
Production technology adoption and information technology adoption are significantly as-
sociated with higher multitasking. There are differences across manual and cognitive tasks. In
general, production technology adoption has larger associations with manual multitasking and
information technology adoption with cognitive multitasking. There is evidence for a causal
effect of multitasking on work-related mental health using both instruments. With the produc-
tion technology instrument, general multitasking increases mild to medium severe work-related
mental health problems by around 0.2 standard deviations. This is driven by non-routine man-
ual and routine cognitive multitasking. With the information technology instrument, effects are
larger (around 0.2 to 0.4 standard deviations) and also significant for burnout. Cognitive tasks
are driving this finding. The increase in multitasking from 2006 to 2012 led to a loss in gross
value added through absenteeism and presenteeism of e 2.7 million.
The remainder of this paper is structured as follows: section 2 gives an overview over the
relevant literature. Section 3 is dedicated to data, section 4 explains the methodology. Results
are presented in sections 5 and 6 and discussed in section 7. The last section concludes.
2 Related literature
Multitasking as a job design is the opposite to specialization. Specialized workplaces are narrow
and demand only one task at the extreme. Focusing on one task exploits intratask learning:
over time, repetition increases efficiency in performing the task. The concept roots in Adam
Smith’s pin factory example and was used widely in the twentieth century (Taylorism). Multi-
tasking means carrying out different tasks and exploits intertask learning: knowledge acquired
at performing task a is used to more efficiently perform task b (Oldham and Hackman, 2010).
Multitasking is one consequence of the reorganization of work which was documented in case
studies first and from the 1990s onwards in representative studies for Japan (“Toyota model”),
the U.S., and Europe. The reorganization implies delegation, team work, job rotation, and
multitasking (e.g. Aoki, 1988, Osterman, 1994). This organizational change is skill-biased be-
cause delegation, job rotation, and multitasking increase the demand for higher skilled labor.
Therefore, skill-biased organizational change benefits higher skilled workers at the expense of
lower skilled workers. Multitasking began to become popular with the turn of the century. See
2
Lindbeck and Snower (2001) for an overview of the reorganization of work literature.
SBOC is related to skill-biased technological change (SBTC). Technological change has
different impacts on employees along the skill distribution. It complements the skills and tasks
performed by highly skilled people but substitutes lower skilled jobs. The computerization of
the workplace for example replaced many simple production line jobs but complemented data
analysts’ work. Taking a closer look at this substitution process reveals that “skill” might
not be the relevant factor. Beginning with Autor et al. (2003), a smaller unit has become
the focus of attention: tasks. Not the skill level of the worker matters for the substitution
process but the nature of the work performed. In principle, anything that follows a rule-based
logic can be substituted. This is generally the case when work processes are sufficiently well
understood to be expressed in computer language (“if-then” language). Computerization thus
substitutes routine tasks (“repetitive” tasks) and complements non-routine tasks (“complex”
tasks). The task literature largely focuses on employment and wage developments of single
task categories (routine versus non-routine, sometimes distinguished further into manual and
cognitive; e.g. Autor et al., 2003, Spitz-Oener, 2006, Goos and Manning, 2007, Autor et al.,
2008, Dustmann et al., 2009, Autor and Handel, 2013) but has paid little attention to the
inseparability of different tasks (exceptions are Spitz-Oener, 2006, Antonczyk et al., 2009, Pikos
and Thomsen, 2016). This is problematic because jobs usually consist of more than a single
task. Demand changes from routine to non-routine tasks do hence not necessarily substitute
whole jobs.1 When technological change substitutes certain tasks and complements others, jobs
are partially substituted and complemented and need to be redesigned. The case study in
Autor et al. (2002) illustrates managerial discretion in re-bundling non-substitutable tasks into
either simpler (specialization) or more complex jobs (multitasking). When there are intertask
complementarities, multitasking is an attractive design.
Lindbeck and Snower (2000) and Boucekkine and Crifo (2008) model the transition to mul-
titasking with technological change (technological and informational task complementarities)
and rising levels of education (ability to multitask and taste for multitasking) as the driving
forces. According to Lindbeck and Snower (2000), technological change results in two task com-
plementarities: technological and informational. The first arises from advances in production
technology that make machines more versatile and re-programmable (adaptable). This in turn
increases the task scope of the worker who needs not only to operate the machine but also to
adopt it. The second task complementarity comes from advances in information technology
that make access to information easier and cheaper. Interactions with clients become faster
1Not taking this into account may be one reason for the controversy raised by Frey and Osborne (2013) whofind that 47% of the U.S. employment is at risk of computerization.
3

and communication increases. This favors decentralization of decision making, team work, and
job rotation – all of which increase multitasking. Rising levels of education make workers more
able but also more willing to do multitasking. Education does not only improve particular
skills (“capital deepening”) but also the ability to acquire different skills (“capital widening”).
Hence, workers have the ability to multitask. Finally, more educated workers have a preference
for multitasking (e.g. more variety, challenges).
Hackman and Oldham (1976) give a motivation for multitasking from the firm’s perspective:
they link skill variety to intrinsic motivation. In their Job Characteristics Model (JCM), skill
variety is one of five factors that are related to high intrinsic motivation, job satisfaction, low
absenteeism, and performance. Analyzing simplified jobs, Herzberg (1966, 1976) arrives at a
similar conclusion: enriched jobs can increase intrinsic motivation. Looking at multitasking
from this side, employee engagement is the main goal. Engagement is a construct from work
psychology that emerged as a positive counterpart to burnout (Schaufeli et al., 2002, Zhang et
al., 2007, Maslach et al., 2001 and 2012).
Burnout is a mental health problem that arises in the context of work (Maslach and Jack-
son, 1981 and 1984). It consists of tree components: emotional exhaustion, cynicism, and
reduced professional efficacy. A common framework to analyze burnout is the Job Demands
and Resources Model (JD-R) where adverse health outcomes develop from an imbalance be-
tween demands and resources (Demerouti et al., 2001, Peterson et al., 2008). At work, an
individual experiences strain from job demands, e.g. from a high workload or a narrow time
frame. Up to a certain point, she can deal with this strain by using her job resources, e.g. re-
ceiving support from colleagues. When job demands increase, accumulate over time and when
resources are depleted, fulfilling work requirements becomes more and more difficult and energy-
demanding. Psychological strain, for example in patients’ care, from supervisors or colleagues,
plays an important role in the development of emotional exhaustion. The individual tries to
cope with her exhaustion by distancing herself and adopting a cynical attitude towards work
and its requirements but also towards customers, herself, and the company. As exhaustion and
cynicism increase, the individual is less and less able to fulfill her work requirements. This
reinforces exhaustion and cynicism: perceiving the loss in efficacy entails a higher effort to keep
up (exhaustion) and more cynicism when failing to do so.
Coming from Herzberg (1966, 1976) and Hackman and Oldham (1976), multitasking is
associated with engagement and lower burnout. Yet, chapter two documents that multitasking
is related to increased work-related mental health problems such as emotional strain, emotional
exhaustion, and burnout. The driver of this association appear to be interactive tasks, i.e.
4

tasks that require interaction with other human beings. This is in line with Hasselhorn and
Nubling (2004) who find that mental health is lower in occupations depending on cooperation
with people whose cooperation is often missing (e.g. physicians/nurses and patients, teachers
and students). The aim of the present paper is to investigate whether this association is causal.
3 Data
Burnout diagnosis is not straightforward. In medicine, burnout is classified in category Z73
as one of several “problems regarding difficulties in coping with life” in the International Clas-
sification of Diseases (ICD). Health insurance data is hence not very helpful. Most studies in
(work) psychology use validated scales such as the Maslach Burnout Inventory or the Oldenburg
Burnout Inventory. These scales are usually administered to narrow study populations, and do
not form part of large scale surveys. Surveys often include self-reported mental health but sel-
dom work-related mental health. An exception are the Qualification and Career Surveys 2006
and 2012. They were designed in 1979 to cover topics missing in official statistics (professional
career developments, qualification, and working conditions) and are since run every sixth year.
Work-related mental health was first included in 2006. The Research Data Centre of the Ger-
man Federal Institute for Vocational Training (Bundesinstitut fur Berufsbildung , BIBB) and
the Federal Institute for Occupational Safety and Health (Bundesanstalt fur Arbeitsschutz und
Arbeitsmedizin, BAuA) sample 20,000 individuals in both 2006 and 2012. Each cross sections is
representative of the German working population (Rohrbach-Schmidt, 2009, Rohrbach-Schmidt
and Hall, 2013).2
In the surveys’ health section, participants state whether they frequently experienced “burnout”
(2006) and “emotional exhaustion” (2012) during or immediately after work in the last 12
months. They also provide information on whether they consulted a physician due to this. Tak-
ing physician consultation as an indicator for a more severe health problem, the corresponding
outcomes equal 0 if the health problem does not exist, 1 if burnout/exhaustion is reported but
no physician was consulted, and 2 if a physician was consulted. A third outcome is taken from
a section on working conditions where information on the degree of emotional strain at work is
provided (often, sometimes, rarely, never; coded from 3 to 0). Emotional strain has a similar
but mild wording than emotional exhaustion. A fourth outcome is a combination of strain and
burnout/exhaustion ranging from 0 to 5. All outcomes are standardized for the analysis. When
work-related mental health problems exist, individuals can react in two ways: take sick leave
2“Working” is defined as doing paid work at least ten hours a week. Participants need to be older than 15,may currently interrupt their work for a maximum of three months but may not do voluntary work or be in theirinitial training.
5
(absenteeism) or go to work despite being sick (presenteeism). Binary information on both is
available in the data (1: yes, 0: no).
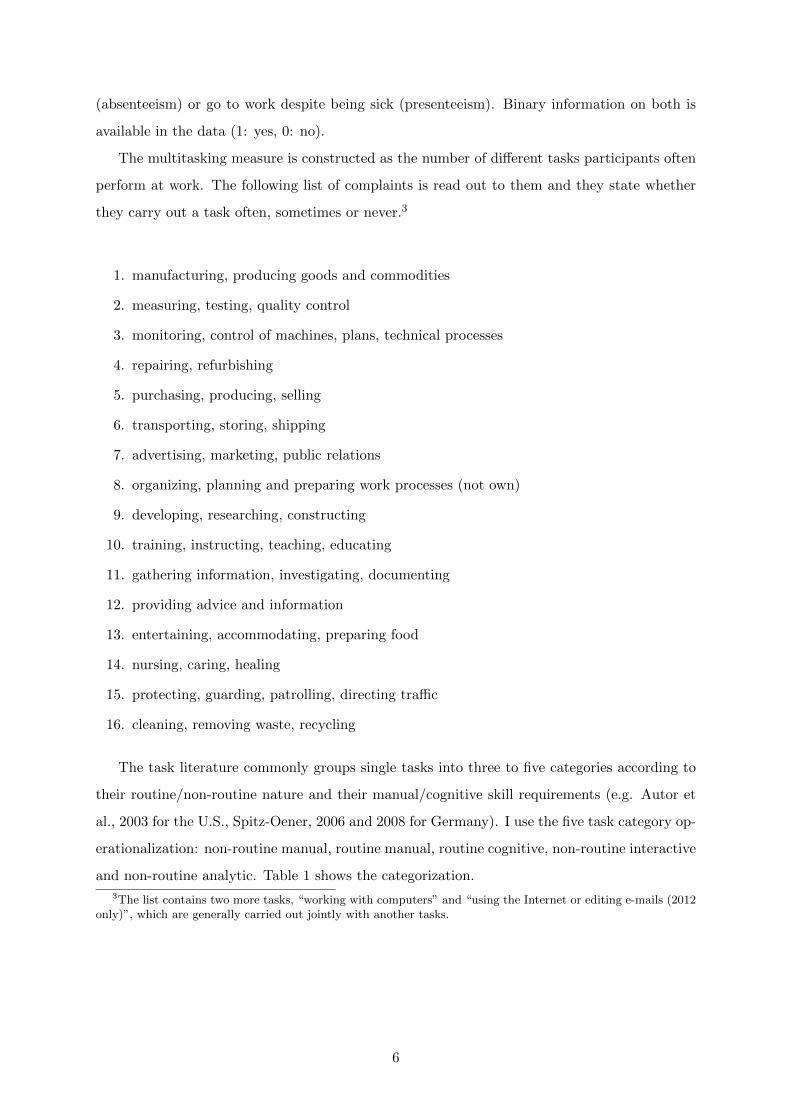
The multitasking measure is constructed as the number of different tasks participants often
perform at work. The following list of complaints is read out to them and they state whether
they carry out a task often, sometimes or never.3
1. manufacturing, producing goods and commodities
2. measuring, testing, quality control
3. monitoring, control of machines, plans, technical processes
4. repairing, refurbishing
5. purchasing, producing, selling
6. transporting, storing, shipping
7. advertising, marketing, public relations
8. organizing, planning and preparing work processes (not own)
9. developing, researching, constructing
10. training, instructing, teaching, educating
11. gathering information, investigating, documenting
12. providing advice and information
13. entertaining, accommodating, preparing food
14. nursing, caring, healing
15. protecting, guarding, patrolling, directing traffic
16. cleaning, removing waste, recycling
The task literature commonly groups single tasks into three to five categories according to
their routine/non-routine nature and their manual/cognitive skill requirements (e.g. Autor et
al., 2003 for the U.S., Spitz-Oener, 2006 and 2008 for Germany). I use the five task category op-
erationalization: non-routine manual, routine manual, routine cognitive, non-routine interactive
and non-routine analytic. Table 1 shows the categorization.
3The list contains two more tasks, “working with computers” and “using the Internet or editing e-mails (2012only)”, which are generally carried out jointly with another tasks.
6

Table 1: Task categories
category tasks
non-routine manual repairing, refurbishing
entertaining, accommodating, preparing food
nursing, caring, healing
protecting, guarding, patrolling, directing traffic
cleaning, removing waste, recycling
routine manual manufacturing, producing goods and commodities
monitoring, control of machines, plans, technical processes
transporting, storing, shipping
routine cognitive measuring, testing, quality control
purchasing, producing, selling
gathering information, investigating, documenting
non-routine interactive advertising, marketing, public relations
training, instructing, teaching, educating
providing advice and information
non-routine analytic organizing, planning and preparing work processes (not own)
developing, researching, constructing
Task categories according to Spitz-Oener (2006) and Pikos and Thomsen (2016). Data sources:BIBB/BAuA. Own table as in chapter two.
The surveys contain basic sociodemographic and company information. The analysis is
limited to 18 to 65-year-old German nationals who are neither self-employed nor employed in
the public sector. Helping family members and individuals who do not provide their tasks or
occupation code are excluded. This leaves around 26,000 observations.
4 Estimation procedure
The relationship between multitasking and work-related health outcomes can be formalized as
in equation 1, where Yi is a standardized variable (combined, emotional strain, emotional ex-
haustion, burnout) for individual i’s health. multitaskingi measures the number of different
tasks (1 to 12) or different tasks within categories (as in table 1). Xi is a vector of control
variables, α is a constant, and ui the error term. Xi includes only variables which should be
unaffected by technological change (survey dummy, basic individual and company characteris-
tics, see table A.1).4 For the binary outcomes absenteeism and presenteeism, equation 1 is a
4One could be concerned that there is bias from unobserved variables, e.g. from working hours or tenure.Including these variables and their squares into the estimation, decreases the coefficients of interest somewhatbut not substantially (see table A.2 in the appendix). Another concern are employees who change their jobin response to technology adoption. If an individual has a strong preference against new technology that hercompany introduces, she might change to another company that does not adopt new technology. Individualsusually restrict their search, e.g. to a geographic area, and identifying such a company takes time and resources.Most people find it easier not to change employment (preference for status quo, cognitive bias or behavioralinertia). Even if some people do change – assuming they change because their work-related mental health is morevulnerable and would suffer if they stayed – this should downward bias the results. Job demands and resources
7
linear probability model.
Yi = α+ βmultitaskingi + X′iδ + ui (1)
Estimating equation 1 with OLS gives the association between multitasking and work-related
mental health, β. β is biased if there is reversed causality, e.g. employees with worse mental
health doing more tasks, or selecting into multitasking, e.g. through job crafting. To identify a
causal effect, exogenous variation in multitasking is needed. In principle, any of the four factors
identified by Lindbeck and Snower (2000) can generate this variation. Measures for advances
in production and information technology are available in the data.
In a section labeled “Changes in the last two years”, participants state whether new man-
ufacturing/process technologies, new machines/equipment, or new computer programs were
introduced in their immediate working environment. The first two items provide a measure
for changes in production technology, the last item for changes in information technology. The
usage of both instruments relies on two data related assumptions. First, to eliminate the en-
dogeneity arising from selection, it is necessary to assume that the firm and not the individual
worker decides on technology.5 In this case, the decision whether or not to adopt new technology
is exogenous to the worker except for selection into more or less technology driven companies
(which NACE sectors could inform about to some degree). Second, it is necessary to assume
that the time frame between the measurement of instrument and outcomes is sufficient for a)
firms to alter job design (transition from specialization to multitasking) and b) individuals to
develop and observe work-related mental health problems (in response to multitasking). Indi-
viduals report work-related mental health problems for the last 12 months before the interview
and technological change in the company for the last 24 months. The distance between mea-
surement of health and technology can be very small and the ordering could be reversed. But
even if mental health is measured before technological change, organizational change and job
re-design usually occur before the actual introduction of technology. More information on the
decision taking and timing of technology adoption would be helpful but is not available in the
data.
Two assumptions are necessary for instrumental variables: relevance and exclusion restric-
are not included as regressors. There is an extensive literature mostly from work psychology showing whichdemands and resources are related to burnout. The theoretical framework is the Job Demands and Resourcesmodel of Demerouti et al. (2001) and Peterson et al. (2008). Job demands are factors that put strain on theemployee such as a high workload or deadline pressure. Job resources are for example leeway of decision makingregarding workload, schedule, or breaks and good collaboration with colleagues. When job demands outweighjob resources, burnout can arise. Demands and resources play a central part for work-related mental health butare excluded from the vector of control variables because they might be affected by technological change, too.
5Some workers may still have some leeway of deciding whether or not to adopt a particular technology in theirspecific job.
8
tion. Why should technology adoption be relevant for multitasking? The theoretical support
for this comes from Lindbeck and Snower (2000) and Boucekkine and Crifo (2008) who iden-
tify technological change as a driver of the transition from specialization to multitasking. New
technology demands more multitasking as production technology is more versatile and as in-
formation technology makes access to and exchange of information easier (see section 2). This
results in technological and informational task complementarities which can be exploited with
multitasking. Of course, technology adoption is only a convincing instrument if it really changes
job design. In principle, new technology could simply replace depreciated capital without in-
troducing any changes to the firm. If, on the other hand, new technology substantially changes
the way work is done, this should affect productivity. Figure 1 depicts capital productivity over
time in manufacturing as an index with 2010 as base year. For the participants of the 2005/06
survey, the technology adoption question refers to changes since 2003/04. Participants of the
2011/12 survey were asked about changes since 2009/10. Capital productivity increased in both
time periods. There is hence reason to regard technological changes during that time as having
an impact on firms and their job design. This is confirmed empirically in section 5. Technology
adoption is significantly associated with multitasking in the first stages.
The exclusion restriction stipulates that technology adoption has no direct effect, i.e. influ-
ences work-related mental health only through multitasking. There are certainly people who
feel stressed by new technologies but this is in general not due to the technology itself but the
change accompanying the introduction of new technology. Individuals need to learn how to
use the new technology, how to react to problems, and they might need to change established
work routines. This broadens their task scope (multitasking). The stress they might feel from
this change does not have its origin in the technology itself but in the resulting increase in
multitasking.
Table 2 shows the percentage of the German working population experiencing the introduc-
tion of production (PT) and information technologies (IT) in their immediate working environ-
ment. 55% report new PT and 48% the adoption of new IT. Technological change was higher in
2006 than in 2012. The difference is around 4 percentage points for PT and 7 percentage points
for IT. Production technology adoption differs across company size and sector (figure 2). It is
most common in the manufacturing sector (70%) and lowest in the service sectors (commerce,
hotels, finance, real estate, administration). More than 60% of the employees in companies with
100 and more employees report new production technology. 45% of the women face new PT in
their immediate working environment. This share is 20 percentage points higher among men.
Middle aged workers (30 to 49) are slightly more often exposed to new PT. Adoption increases
9
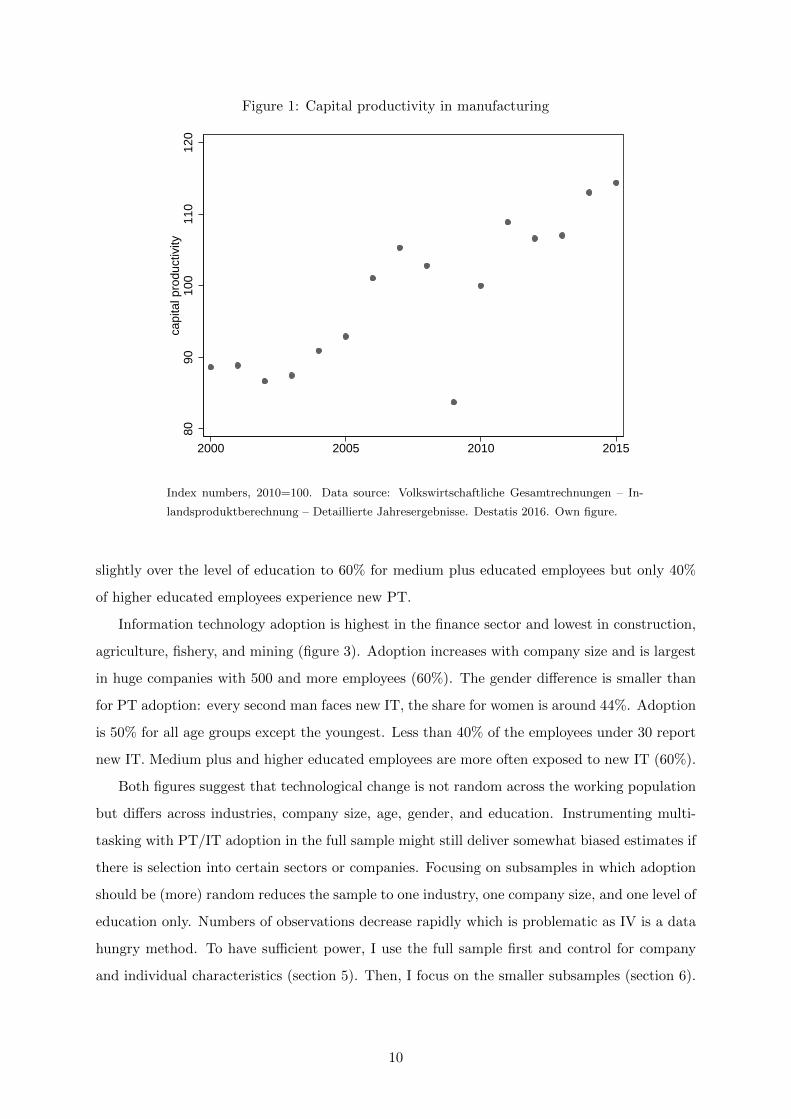
Figure 1: Capital productivity in manufacturing
8090
100
110
120
capi
tal p
rodu
ctiv
ity
2000 2005 2010 2015
Index numbers, 2010=100. Data source: Volkswirtschaftliche Gesamtrechnungen – In-
landsproduktberechnung – Detaillierte Jahresergebnisse. Destatis 2016. Own figure.
slightly over the level of education to 60% for medium plus educated employees but only 40%
of higher educated employees experience new PT.
Information technology adoption is highest in the finance sector and lowest in construction,
agriculture, fishery, and mining (figure 3). Adoption increases with company size and is largest
in huge companies with 500 and more employees (60%). The gender difference is smaller than
for PT adoption: every second man faces new IT, the share for women is around 44%. Adoption
is 50% for all age groups except the youngest. Less than 40% of the employees under 30 report
new IT. Medium plus and higher educated employees are more often exposed to new IT (60%).
Both figures suggest that technological change is not random across the working population
but differs across industries, company size, age, gender, and education. Instrumenting multi-
tasking with PT/IT adoption in the full sample might still deliver somewhat biased estimates if
there is selection into certain sectors or companies. Focusing on subsamples in which adoption
should be (more) random reduces the sample to one industry, one company size, and one level of
education only. Numbers of observations decrease rapidly which is problematic as IV is a data
hungry method. To have sufficient power, I use the full sample first and control for company
and individual characteristics (section 5). Then, I focus on the smaller subsamples (section 6).
10

Table 2: Production and information technology adoption in %
all 2006 2012
PT 55.2 57.3 53.5
IT 47.6 51.8 44.3
Production technology (PT): introduction of new manufacturing/process technologies or new ma-chines/equipment in the immediate working environment. Information technology (IT): introductionof new computer programs (excluding updates) in the immediate working environment. Data sources:BIBB/BAuA.
Figure 2: Production technology adoption by company and individual
characteristics
.4.5
.6.7
new
PT
ABC D E F GH I J K LQ M−P restNACE industry
95% confidence intervals
.4.5
.6.7
new
PT
<10 10−49 50−99 100−499 500company size
95% confidence intervals
.4.5
.6.7
new
PT
women mengender
95% confidence intervals
.4.5
.6.7
new
PT
18−29 30−39 40−49 50−65age
95% confidence intervals
.4.5
.6.7
new
PT
low mediumm medium plus higheducation
95% confidence intervals
NACE industries: ABC: Agriculture, fishery, mining, D: Manufacturing, E: Energy &
water supply, F: Construction, G&H: Commerce and hotels, I: Transport, J: Finance, K:
Real estate etc., L&Q: Public administration, M-P: Public & private services, rest not
elsewhere allocated. Data sources: BIBB/BAuA. Own figure.
5 Full sample results
5.1 Descriptives and general multitasking
Figures 4 and 5 show multitasking by PT and IT adoption. Employees who experienced pro-
duction technology adoptions perform 0.3 standard deviations more tasks than those who did
not. This is due to large differences in non-routine manual tasks (0.25 standard deviations) and
routine manual tasks (0.6 standard deviations). They perform more routine cognitive and non-
11
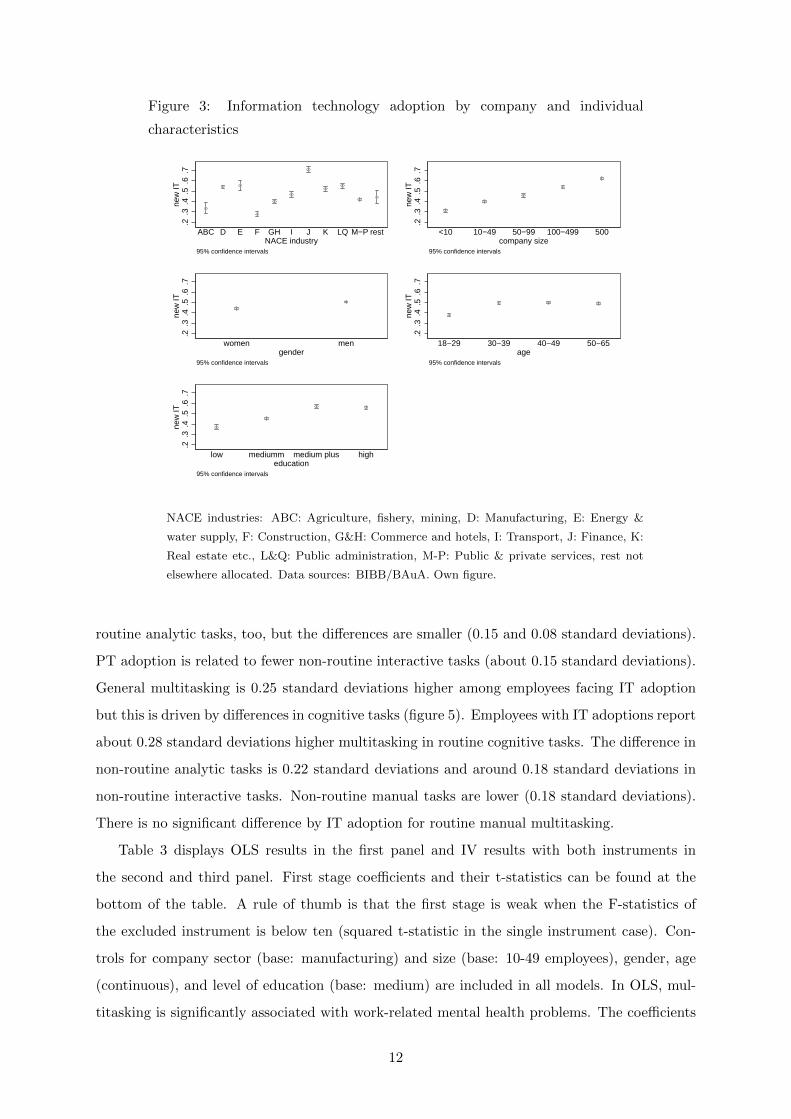
Figure 3: Information technology adoption by company and individual
characteristics
.2.3
.4.5
.6.7
new
IT
ABC D E F GH I J K LQ M−P restNACE industry
95% confidence intervals
.2.3
.4.5
.6.7
new
IT
<10 10−49 50−99 100−499 500company size
95% confidence intervals
.2.3
.4.5
.6.7
new
IT
women mengender
95% confidence intervals
.2.3
.4.5
.6.7
new
IT
18−29 30−39 40−49 50−65age
95% confidence intervals
.2.3
.4.5
.6.7
new
IT
low mediumm medium plus higheducation
95% confidence intervals
NACE industries: ABC: Agriculture, fishery, mining, D: Manufacturing, E: Energy &
water supply, F: Construction, G&H: Commerce and hotels, I: Transport, J: Finance, K:
Real estate etc., L&Q: Public administration, M-P: Public & private services, rest not
elsewhere allocated. Data sources: BIBB/BAuA. Own figure.
routine analytic tasks, too, but the differences are smaller (0.15 and 0.08 standard deviations).
PT adoption is related to fewer non-routine interactive tasks (about 0.15 standard deviations).
General multitasking is 0.25 standard deviations higher among employees facing IT adoption
but this is driven by differences in cognitive tasks (figure 5). Employees with IT adoptions report
about 0.28 standard deviations higher multitasking in routine cognitive tasks. The difference in
non-routine analytic tasks is 0.22 standard deviations and around 0.18 standard deviations in
non-routine interactive tasks. Non-routine manual tasks are lower (0.18 standard deviations).
There is no significant difference by IT adoption for routine manual multitasking.
Table 3 displays OLS results in the first panel and IV results with both instruments in
the second and third panel. First stage coefficients and their t-statistics can be found at the
bottom of the table. A rule of thumb is that the first stage is weak when the F-statistics of
the excluded instrument is below ten (squared t-statistic in the single instrument case). Con-
trols for company sector (base: manufacturing) and size (base: 10-49 employees), gender, age
(continuous), and level of education (base: medium) are included in all models. In OLS, mul-
titasking is significantly associated with work-related mental health problems. The coefficients
12

Figure 4: Multitasking by production technology adoption
−.2
−.1
0.1
mul
titas
king
no yestechnology adoption
95% confidence intervals
−.1
0.1
.2no
n−ro
utin
e m
anua
l
no yestechnology adoption
95% confidence intervals
−.2
0.2
.4ro
utin
e m
anua
l
no yestechnology adoption
95% confidence intervals
−.1
−.0
50
.05
.1ro
utin
e co
gniti
ve
no yestechnology adoption
95% confidence intervals
−.1
5−
.1−
.05
0.0
5no
n−ro
utin
e in
tera
ctiv
e
no yestechnology adoption
95% confidence intervals
−.0
6−
.04
−.0
20
.02
.04
non−
rout
ine
anal
ytic
no yestechnology adoption
95% confidence intervals
Data sources: BIBB/BAuA. Own figure.
Figure 5: Multitasking by information technology adoption
−.1
5−
.1−
.05
0.0
5.1
mul
titas
king
no yesIT adoption
95% confidence intervals
−.0
50
.05
.1.1
5no
n−ro
utin
e m
anua
l
no yesIT adoption
95% confidence intervals
.08
.09
.1.1
1.1
2ro
utin
e m
anua
l
no yesIT adoption
95% confidence intervals
−.1
0.1
.2ro
utin
e co
gniti
ve
no yesIT adoption
95% confidence intervals
−.1
5−
.1−
.05
0.0
5.1
non−
rout
ine
inte
ract
ive
no yesIT adoption
95% confidence intervals
−.1
−.0
50
.05
.1.1
5no
n−ro
utin
e an
alyt
ic
no yesIT adoption
95% confidence intervals
Data sources: BIBB/BAuA. Own figure.
are larger for milder conditions (emotional strain) than for burnout. Turning to the first stages,
the adoption of new technology is associated with an increase in multitasking of around 0.3
13
standard deviations. The coefficient’s t-statistic ranges from 16 (only one year available) to 23.
New IT is associated with an increase in multitasking of around 0.26 standard deviations. The
t-statistic is between 9 and 16. Both instruments are hence relevant for multitasking.
Using PT introduction as an instrument gives larger multitasking coefficients in the second
stage than in OLS. Standard errors increase by a factor of 5 to 6. The estimate for burnout is
insignificant and not that much larger than in OLS. The multitasking coefficient for exhaustion
increases by a factor of 2.5 compared to OLS. Multitasking increases strain by 0.26 standard
deviations and exhaustion by 0.21 standard deviations. Absenteeism and presenteeism due to
burnout/exhaustion increase by 5 and 9 percentage points. Given the average prevalence of
11% and 19%, the relative increase is around 45% in both cases.
With IT adoption as an instrument, all second stages are highly significant. Coefficients
are larger than in OLS and also larger than with the PT instrument. The point estimate for
burnout (0.253) is larger than the one for exhaustion (0.181). Multitasking increases strain by
0.43 standard deviations, absenteeism by 6 percentage points, and presenteeism by 9 percentage
points. All in all, multitasking worsens work-related mental health significantly. The impact is
more severe if the increase in multitasking occurs due to IT adoptions (significant point estimate
for burnout, larger estimate for strain). The following subsection analyzes whether certain task
categories are driving these results.
14

Table 3: Multitasking estimates for work-related mental health outcomes
combined strain exhaustion burnout absenteeism presenteeism
OLS
multitasking 0.171∗∗∗ 0.177∗∗∗ 0.082∗∗∗ 0.059∗∗∗ 0.019∗∗∗ 0.039∗∗∗
(0.008) (0.008) (0.010) (0.011) (0.002) (0.004)
constant -0.399∗∗∗ -0.407∗∗∗ -0.232∗∗∗ -0.141∗∗∗ 0.036∗∗∗ 0.190∗∗∗
(0.038) (0.039) (0.048) (0.049) (0.012) (0.021)
IV PT
multitasking 0.275∗∗∗ 0.261∗∗∗ 0.213∗∗∗ 0.089 0.050∗∗∗ 0.087∗∗∗
(0.043) (0.044) (0.058) (0.056) (0.014) (0.024)
constant -0.400∗∗∗ -0.407∗∗∗ -0.227∗∗∗ -0.142∗∗∗ 0.035∗∗∗ 0.192∗∗∗
(0.038) (0.040) (0.049) (0.049) (0.012) (0.021)
IV IT
multitasking 0.435∗∗∗ 0.430∗∗∗ 0.181∗∗ 0.253∗∗ 0.064∗∗∗ 0.091∗∗∗
(0.064) (0.066) (0.075) (0.102) (0.021) (0.032)
constant -0.408∗∗∗ -0.416∗∗∗ -0.247∗∗∗ -0.136∗∗∗ 0.034∗∗∗ 0.186∗∗∗
(0.040) (0.041) (0.049) (0.050) (0.012) (0.021)
N 23755 23797 13281 10490 23777 13313
first stage IV PT
new PT 0.357 0.357 0.346 0.369 0.357 0.347
t-statistic 23.25 23.28 16.58 16.42 23.25 16.62
first stage IV IT
new IT 0.245 0.246 0.270 0.211 0.245 0.271
t-statistic 15.85 15.91 12.86 9.21 15.87 12.92
Standardized dependent variable given in column header (absenteeism, presenteeism: binary).Combined: emotional exhaustion, burnout and/or emotional strain. Models include controls forage, gender, industry and company size. IV PT: production technology adoption as instrument. IVIT: information technology adoption as instrument. Standard errors in parentheses. Significancelevels ∗ p < 0.1, ∗∗ p < 0.05, ∗∗∗ p < 0.01. Data sources: BIBB/BAuA. Own calculations.
5.2 Multitasking within task categories
Multitasking in non-routine manual tasks is significantly associated with worse work-related
mental health in OLS (table 4). Coefficients are rather small and below one standard deviation
even for emotional strain. New PT is significantly associated with an increase in multitasking
of 0.26 standard deviations. The t-statistic is between 12 and 18. In the corresponding second
stage, multitasking significantly increases strain by 0.35 standard deviations and exhaustion
by 0.275 standard deviations. The point estimate for burnout is insignificant. Absenteeism
and presenteeism increase by 7 and 11 percentage points which is somewhat larger than the
effects for multitasking in general. As figure 5 suggests, new IT is associated with a reduction
in non-routine manual multitasking but this reduction is small (0.04 standard deviations). The
coefficient is significant but the t-statistic is below 3. Since the first stage is weak, no second
stage is reported.
15
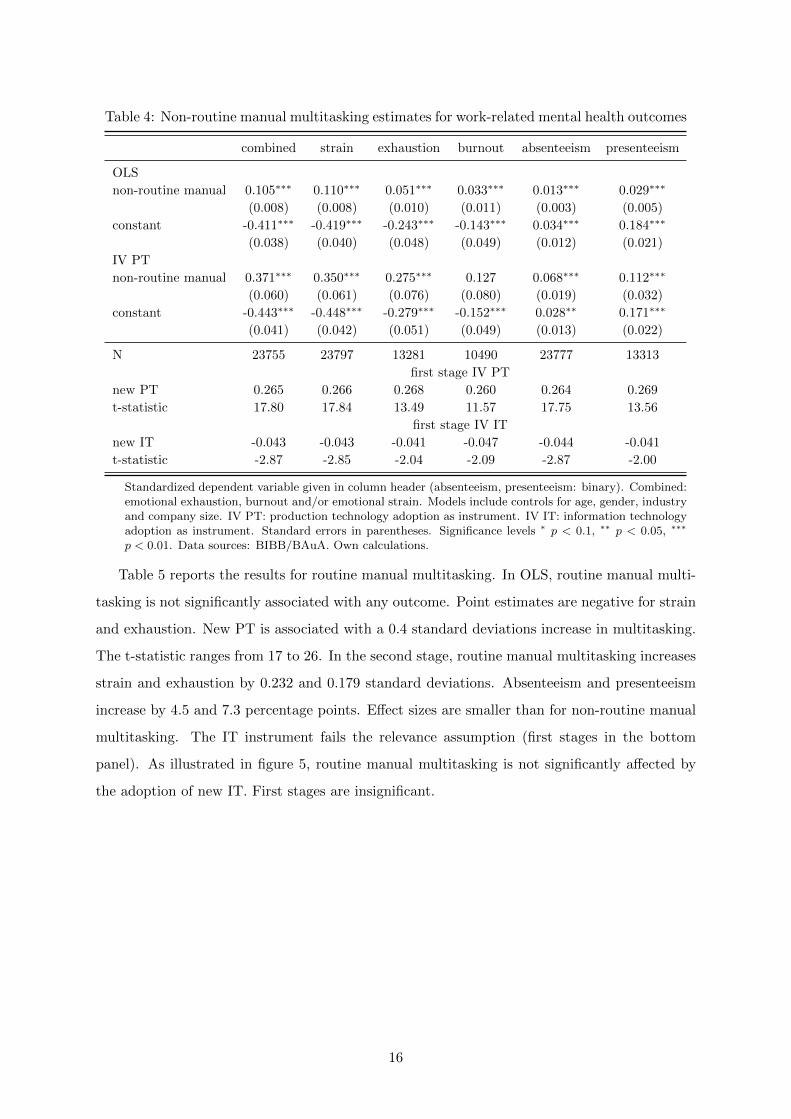
Table 4: Non-routine manual multitasking estimates for work-related mental health outcomes
combined strain exhaustion burnout absenteeism presenteeism
OLS
non-routine manual 0.105∗∗∗ 0.110∗∗∗ 0.051∗∗∗ 0.033∗∗∗ 0.013∗∗∗ 0.029∗∗∗
(0.008) (0.008) (0.010) (0.011) (0.003) (0.005)
constant -0.411∗∗∗ -0.419∗∗∗ -0.243∗∗∗ -0.143∗∗∗ 0.034∗∗∗ 0.184∗∗∗
(0.038) (0.040) (0.048) (0.049) (0.012) (0.021)
IV PT
non-routine manual 0.371∗∗∗ 0.350∗∗∗ 0.275∗∗∗ 0.127 0.068∗∗∗ 0.112∗∗∗
(0.060) (0.061) (0.076) (0.080) (0.019) (0.032)
constant -0.443∗∗∗ -0.448∗∗∗ -0.279∗∗∗ -0.152∗∗∗ 0.028∗∗ 0.171∗∗∗
(0.041) (0.042) (0.051) (0.049) (0.013) (0.022)
N 23755 23797 13281 10490 23777 13313
first stage IV PT
new PT 0.265 0.266 0.268 0.260 0.264 0.269
t-statistic 17.80 17.84 13.49 11.57 17.75 13.56
first stage IV IT
new IT -0.043 -0.043 -0.041 -0.047 -0.044 -0.041
t-statistic -2.87 -2.85 -2.04 -2.09 -2.87 -2.00
Standardized dependent variable given in column header (absenteeism, presenteeism: binary). Combined:emotional exhaustion, burnout and/or emotional strain. Models include controls for age, gender, industryand company size. IV PT: production technology adoption as instrument. IV IT: information technologyadoption as instrument. Standard errors in parentheses. Significance levels ∗ p < 0.1, ∗∗ p < 0.05, ∗∗∗
p < 0.01. Data sources: BIBB/BAuA. Own calculations.
Table 5 reports the results for routine manual multitasking. In OLS, routine manual multi-
tasking is not significantly associated with any outcome. Point estimates are negative for strain
and exhaustion. New PT is associated with a 0.4 standard deviations increase in multitasking.
The t-statistic ranges from 17 to 26. In the second stage, routine manual multitasking increases
strain and exhaustion by 0.232 and 0.179 standard deviations. Absenteeism and presenteeism
increase by 4.5 and 7.3 percentage points. Effect sizes are smaller than for non-routine manual
multitasking. The IT instrument fails the relevance assumption (first stages in the bottom
panel). As illustrated in figure 5, routine manual multitasking is not significantly affected by
the adoption of new IT. First stages are insignificant.
16
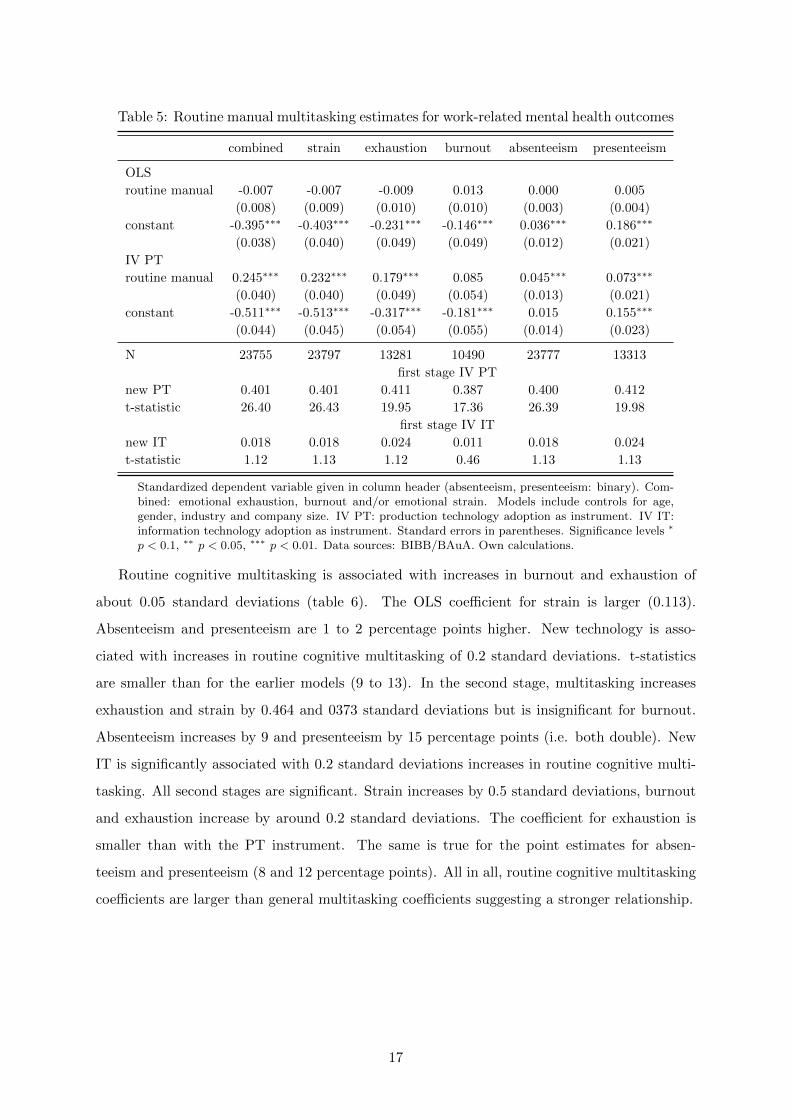
Table 5: Routine manual multitasking estimates for work-related mental health outcomes
combined strain exhaustion burnout absenteeism presenteeism
OLS
routine manual -0.007 -0.007 -0.009 0.013 0.000 0.005
(0.008) (0.009) (0.010) (0.010) (0.003) (0.004)
constant -0.395∗∗∗ -0.403∗∗∗ -0.231∗∗∗ -0.146∗∗∗ 0.036∗∗∗ 0.186∗∗∗
(0.038) (0.040) (0.049) (0.049) (0.012) (0.021)
IV PT
routine manual 0.245∗∗∗ 0.232∗∗∗ 0.179∗∗∗ 0.085 0.045∗∗∗ 0.073∗∗∗
(0.040) (0.040) (0.049) (0.054) (0.013) (0.021)
constant -0.511∗∗∗ -0.513∗∗∗ -0.317∗∗∗ -0.181∗∗∗ 0.015 0.155∗∗∗
(0.044) (0.045) (0.054) (0.055) (0.014) (0.023)
N 23755 23797 13281 10490 23777 13313
first stage IV PT
new PT 0.401 0.401 0.411 0.387 0.400 0.412
t-statistic 26.40 26.43 19.95 17.36 26.39 19.98
first stage IV IT
new IT 0.018 0.018 0.024 0.011 0.018 0.024
t-statistic 1.12 1.13 1.12 0.46 1.13 1.13
Standardized dependent variable given in column header (absenteeism, presenteeism: binary). Com-bined: emotional exhaustion, burnout and/or emotional strain. Models include controls for age,gender, industry and company size. IV PT: production technology adoption as instrument. IV IT:information technology adoption as instrument. Standard errors in parentheses. Significance levels ∗
p < 0.1, ∗∗ p < 0.05, ∗∗∗ p < 0.01. Data sources: BIBB/BAuA. Own calculations.
Routine cognitive multitasking is associated with increases in burnout and exhaustion of
about 0.05 standard deviations (table 6). The OLS coefficient for strain is larger (0.113).
Absenteeism and presenteeism are 1 to 2 percentage points higher. New technology is asso-
ciated with increases in routine cognitive multitasking of 0.2 standard deviations. t-statistics
are smaller than for the earlier models (9 to 13). In the second stage, multitasking increases
exhaustion and strain by 0.464 and 0373 standard deviations but is insignificant for burnout.
Absenteeism increases by 9 and presenteeism by 15 percentage points (i.e. both double). New
IT is significantly associated with 0.2 standard deviations increases in routine cognitive multi-
tasking. All second stages are significant. Strain increases by 0.5 standard deviations, burnout
and exhaustion increase by around 0.2 standard deviations. The coefficient for exhaustion is
smaller than with the PT instrument. The same is true for the point estimates for absen-
teeism and presenteeism (8 and 12 percentage points). All in all, routine cognitive multitasking
coefficients are larger than general multitasking coefficients suggesting a stronger relationship.
17

Table 6: Routine cognitive multitasking estimates for work-related mental health outcomes
combined strain exhaustion burnout absenteeism presenteeism
OLS
routine cognitive 0.111∗∗∗ 0.113∗∗∗ 0.045∗∗∗ 0.055∗∗∗ 0.012∗∗∗ 0.021∗∗∗
(0.008) (0.008) (0.010) (0.011) (0.002) (0.004)
constant -0.403∗∗∗ -0.411∗∗∗ -0.237∗∗∗ -0.141∗∗∗ 0.035∗∗∗ 0.188∗∗∗
(0.038) (0.040) (0.048) (0.049) (0.012) (0.021)
IV PT
routine cognitive 0.489∗∗∗ 0.464∗∗∗ 0.373∗∗∗ 0.164 0.089∗∗∗ 0.152∗∗∗
(0.082) (0.083) (0.106) (0.105) (0.026) (0.045)
constant -0.419∗∗∗ -0.426∗∗∗ -0.251∗∗∗ -0.143∗∗∗ 0.032∗∗ 0.182∗∗∗
(0.041) (0.042) (0.051) (0.049) (0.013) (0.022)
IV IT
routine cognitive 0.526∗∗∗ 0.519∗∗∗ 0.242∗∗ 0.269∗∗ 0.077∗∗∗ 0.122∗∗∗
(0.082) (0.083) (0.101) (0.108) (0.025) (0.044)
constant -0.430∗∗∗ -0.440∗∗∗ -0.263∗∗∗ -0.139∗∗∗ 0.031∗∗ 0.177∗∗∗
(0.042) (0.043) (0.050) (0.050) (0.013) (0.022)
N 23755 23797 13281 10490 23777 13313
first stage IV PT
new PT 0.201 0.201 0.198 0.201 0.201 0.198
t-statistic 12.90 12.92 9.34 8.80 12.93 9.35
first stage IV IT
new IT 0.203 0.204 0.202 0.198 0.203 0.203
t-statistic 13.09 13.17 9.61 8.66 13.10 9.67
Standardized dependent variable given in column header (absenteeism, presenteeism: binary). Com-bined: emotional exhaustion, burnout and/or emotional strain. Models include controls for age, gender,industry and company size. IV PT: production technology adoption as instrument. IV IT: informationtechnology adoption as instrument. Standard errors in parentheses. Significance levels ∗ p < 0.1, ∗∗
p < 0.05, ∗∗∗ p < 0.01. Data sources: BIBB/BAuA. Own calculations.
The association between multitasking and work-related mental health is strongest for multi-
tasking in non-routine interactive tasks (table 7). OLS coefficients are larger than for all other
multitasking measures (except the routine cognitive coefficient for burnout). Despite the de-
scriptive suggestion that PT adoption is relevant for non-routine interactive multitasking, this
is not true controlling for company and individual characteristics: first stages with new PT as
an instrument are insignificant (third panel). Coefficients are negative and small (0.02 standard
deviations) and t-statistics are below 2. New IT is significantly associated with increases in
non-routine interactive multitasking of nearly 0.2 standard deviations. t-statistics are between
9 and 13. All second stages are highly significant and comparable in size to the estimates for
routine cognitive. Non-routine interactive multitasking increases strain by nearly 0.6 standard
deviations and burnout and exhaustion by about 0.3 standard deviations. Absenteeism increases
by 9 percentage points and presenteeism by 15 percentage points.
18

Table 7: Non-routine interactive multitasking estimates for work-related mental health outcomes
combined strain exhaustion burnout absenteeism presenteeism
OLS
non-routine interactive 0.175∗∗∗ 0.184∗∗∗ 0.081∗∗∗ 0.045∗∗∗ 0.017∗∗∗ 0.036∗∗∗
(0.008) (0.008) (0.011) (0.011) (0.003) (0.005)
constant -0.367∗∗∗ -0.373∗∗∗ -0.217∗∗∗ -0.133∗∗∗ 0.039∗∗∗ 0.196∗∗∗
(0.038) (0.039) (0.048) (0.049) (0.012) (0.021)
IV IT
non-routine interactive 0.587∗∗∗ 0.582∗∗∗ 0.289∗∗ 0.270∗∗ 0.086∗∗∗ 0.146∗∗∗
(0.090) (0.091) (0.120) (0.109) (0.028) (0.052)
constant -0.295∗∗∗ -0.304∗∗∗ -0.187∗∗∗ -0.087∗ 0.051∗∗∗ 0.216∗∗∗
(0.044) (0.046) (0.057) (0.053) (0.014) (0.025)
N 23755 23797 13281 10490 23777 13313
first stage IV PT
new PT 0.025 0.025 0.031 0.018 0.025 0.031
t-statistic 1.70 1.70 1.55 0.83 1.72 1.55
first stage IV IT
new IT 0.182 0.182 0.169 0.197 0.182 0.170
t-statistic 12.52 12.54 8.63 9.15 12.52 8.66
Standardized dependent variable given in column header (absenteeism, presenteeism: binary). Combined:emotional exhaustion, burnout and/or emotional strain. Models include controls for age, gender, industryand company size. IV PT: production technology adoption as instrument. IV IT: information technologyadoption as instrument. Standard errors in parentheses. Significance levels ∗ p < 0.1, ∗∗ p < 0.05, ∗∗∗
p < 0.01. Data sources: BIBB/BAuA. Own calculations.
Non-routine analytic multitasking is associated with worse work-related mental health in
OLS but the association is weaker than for routine cognitive and non-routine interactive (table
8). First stage coefficients with the PT instrument are significant and around 0.1 standard
deviations. The corresponding t-statistics are rather low (5 to 8). Second stages deliver com-
parably large coefficients that are highly significant for all outcomes except for burnout. The
point estimate for strain and exhaustion is 0.74 standard deviations. Absenteeism increases by
14 percentage points and presenteeism by 30 percentage points. These estimates are – likely
due to the rather low first stage coefficients – comparatively large and should be interpreted
with care. New IT is associated with about 0.18 standard deviations increases in non-routine
analytic multitasking (t-statistics range from 8 to 12). Multitasking is highly significant in all
second stages. Point estimates are comparable to routine cognitive and non-routine interactive
multitasking results.
19
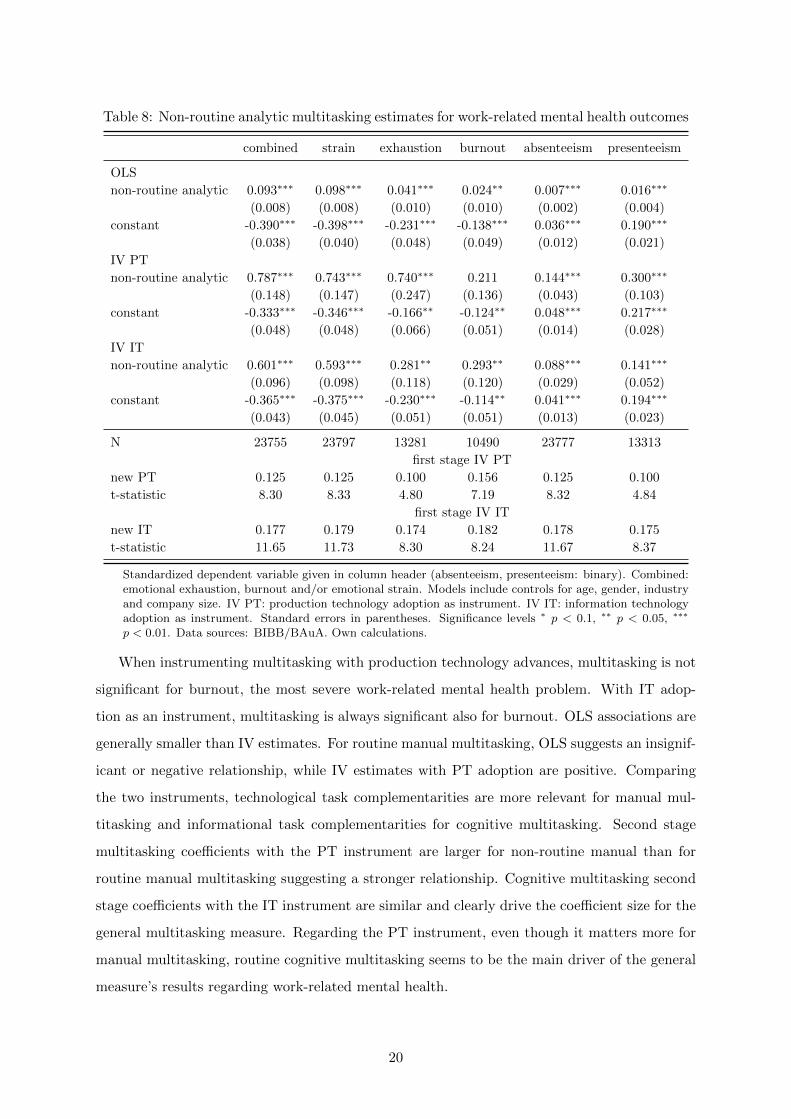
Table 8: Non-routine analytic multitasking estimates for work-related mental health outcomes
combined strain exhaustion burnout absenteeism presenteeism
OLS
non-routine analytic 0.093∗∗∗ 0.098∗∗∗ 0.041∗∗∗ 0.024∗∗ 0.007∗∗∗ 0.016∗∗∗
(0.008) (0.008) (0.010) (0.010) (0.002) (0.004)
constant -0.390∗∗∗ -0.398∗∗∗ -0.231∗∗∗ -0.138∗∗∗ 0.036∗∗∗ 0.190∗∗∗
(0.038) (0.040) (0.048) (0.049) (0.012) (0.021)
IV PT
non-routine analytic 0.787∗∗∗ 0.743∗∗∗ 0.740∗∗∗ 0.211 0.144∗∗∗ 0.300∗∗∗
(0.148) (0.147) (0.247) (0.136) (0.043) (0.103)
constant -0.333∗∗∗ -0.346∗∗∗ -0.166∗∗ -0.124∗∗ 0.048∗∗∗ 0.217∗∗∗
(0.048) (0.048) (0.066) (0.051) (0.014) (0.028)
IV IT
non-routine analytic 0.601∗∗∗ 0.593∗∗∗ 0.281∗∗ 0.293∗∗ 0.088∗∗∗ 0.141∗∗∗
(0.096) (0.098) (0.118) (0.120) (0.029) (0.052)
constant -0.365∗∗∗ -0.375∗∗∗ -0.230∗∗∗ -0.114∗∗ 0.041∗∗∗ 0.194∗∗∗
(0.043) (0.045) (0.051) (0.051) (0.013) (0.023)
N 23755 23797 13281 10490 23777 13313
first stage IV PT
new PT 0.125 0.125 0.100 0.156 0.125 0.100
t-statistic 8.30 8.33 4.80 7.19 8.32 4.84
first stage IV IT
new IT 0.177 0.179 0.174 0.182 0.178 0.175
t-statistic 11.65 11.73 8.30 8.24 11.67 8.37
Standardized dependent variable given in column header (absenteeism, presenteeism: binary). Combined:emotional exhaustion, burnout and/or emotional strain. Models include controls for age, gender, industryand company size. IV PT: production technology adoption as instrument. IV IT: information technologyadoption as instrument. Standard errors in parentheses. Significance levels ∗ p < 0.1, ∗∗ p < 0.05, ∗∗∗
p < 0.01. Data sources: BIBB/BAuA. Own calculations.
When instrumenting multitasking with production technology advances, multitasking is not
significant for burnout, the most severe work-related mental health problem. With IT adop-
tion as an instrument, multitasking is always significant also for burnout. OLS associations are
generally smaller than IV estimates. For routine manual multitasking, OLS suggests an insignif-
icant or negative relationship, while IV estimates with PT adoption are positive. Comparing
the two instruments, technological task complementarities are more relevant for manual mul-
titasking and informational task complementarities for cognitive multitasking. Second stage
multitasking coefficients with the PT instrument are larger for non-routine manual than for
routine manual multitasking suggesting a stronger relationship. Cognitive multitasking second
stage coefficients with the IT instrument are similar and clearly drive the coefficient size for the
general multitasking measure. Regarding the PT instrument, even though it matters more for
manual multitasking, routine cognitive multitasking seems to be the main driver of the general
measure’s results regarding work-related mental health.
20

6 Subsample results
6.1 Subsample definitions
Figures 2 and 3 suggest that PT and IT adoption is not random across company and individual
characteristics. Hence, selection into industries, companies, or education could mean selection
into “treatment” (technology adoption) and this might drive the findings of the previous section.
To find subsamples in which the adoption of PT/IT should be random and where estimation
is still feasible, I narrow down the sample first by industry, second by company size, and third
by education. First, I choose the largest industries (manufacturing with 7,300 and services
with 6,200 observations). There will thus be four groups: one for each instrument in each
sector. Most employees work in companies with 10 to 49 employees (6,500) but companies
with 100 to 499 and 500 and more employees are also common (about 5,900 observations for
each group). As shown in appendix figure A.1, PT adoption increases with size and is most
likely in companies with 100 and more employees in both manufacturing and service companies.
New IT is more likely in manufacturing companies with 500 and more employees which is also
the size group with most observations. For services, IT adoption does not differ significantly
between companies with 100 to 499 and companies with 500 and more employees. Looking at
differences across levels of education, PT adoption is lower for higher educated employees in
both the manufacturing and the service sample, IT adoption is lower for low educated employees
in service companies (A.4). The final samples in which PT/IT adoption should be random given
employees choices for industry, company size, and education, are hence:
1. PT 1: 3,700 low to medium plus educated in manufacturing companies with 100 and more
employees (controls: gender, age, level of education, size)
2. PT 2: 1,600 low to medium plus educated employees in service companies with 100 and
more employees (controls: gender, age, level of education, size)
3. IT 1: 2,500 employees in manufacturing companies with 500 and more employees (controls:
gender, age, level of education)
4. IT 2: 2,300 medium to higher educated employees in service companies with 100 and more
employees (controls: gender, age, level of education, size)
6.2 Subsample results
To detect multitasking differences by PT/IT adoption, the relationship between the instrument
and multitasking is depicted for all multitasking measures in the four samples in appendix
21

figures A.5 to A.8. The difference by the instrument for general multitasking is always signifi-
cant. For low to medium plus educated employees in manufacturing companies (PT 1) and in
service companies (PT 2) with technology adoption in their immediate working environment,
all multitasking is higher than for those without adoption (figures A.5 and A.6, except except
non-routine interactive in PT 1). Employees reporting IT adoption in huge manufacturing com-
panies have higher cognitive multitasking. Manual multitasking does not seem to differ (figure
A.7). For medium to higher educated employees in services, routine manual, routine cognitive,
and non-routine interactive multitasking is higher when IT adoption took place (figure A.8).
The confidence intervals for non-routine manual and non-routine analytic multitasking overlap.
Nevertheless, I check all first stages in each sample. New PT is insignificant or a weak
instrument for routine cognitive, non-routine interactive, and non-routine analytic multitasking
in the PT 1 sample (table A.3). t-statistics do rarely exceed 3. Hence, I report OLS and
second stages for general multitasking, non-routine manual, and routine manual. For low to
medium plus educated employees in service companies with 100 and more employees (PT 2),
the instrument is insignificant for non-routine interactive and analytic multitasking (table A.4).
First stages in the IT 1 sample are insignificant or come with low t-statistics for all outcomes
except general multitasking (table A.5). For medium to higher educated employees in service
companies with 100 and more employees (IT 2), only the first stage for general multitasking is
significant and not too weak (table A.6). t-statistics are between 4 and 5 except for the burnout
model (2.6). OLS and second stages will thus be run for the following multitasking measures
in each subsample:
1. PT 1: multitasking, non-routine manual, routine manual
2. PT 2: multitasking, non-routine manual, routine manual, routine cognitive
3. IT 1: multitasking
4. IT 2: multitasking
The OLS and second stage results for low to medium plus educated employees in manu-
facturing companies with 100 and more employees are displayed in table A.7. There are 3,700
observations for outcomes observed in both years and 1,600 for burnout in 2006. OLS estimates
with general multitasking are significant for the combined measure and strain only (0.098 and
0.133). The introduction of new PT is associated with increases in multitasking of 0.32 to 0.4
standard deviations. t-statistics are between 5 and 8. Second stage coefficients are more than
3 times larger than in OLS except for burnout, standard errors increase by 5 times or more.
22
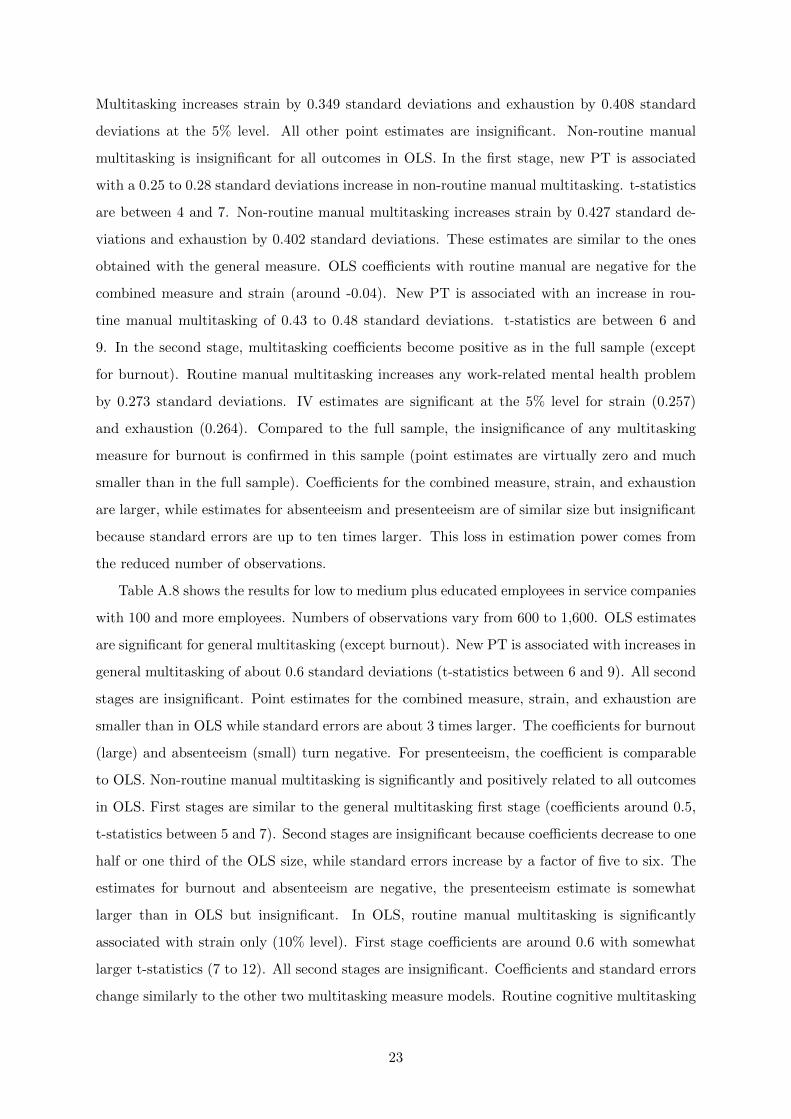
Multitasking increases strain by 0.349 standard deviations and exhaustion by 0.408 standard
deviations at the 5% level. All other point estimates are insignificant. Non-routine manual
multitasking is insignificant for all outcomes in OLS. In the first stage, new PT is associated
with a 0.25 to 0.28 standard deviations increase in non-routine manual multitasking. t-statistics
are between 4 and 7. Non-routine manual multitasking increases strain by 0.427 standard de-
viations and exhaustion by 0.402 standard deviations. These estimates are similar to the ones
obtained with the general measure. OLS coefficients with routine manual are negative for the
combined measure and strain (around -0.04). New PT is associated with an increase in rou-
tine manual multitasking of 0.43 to 0.48 standard deviations. t-statistics are between 6 and
9. In the second stage, multitasking coefficients become positive as in the full sample (except
for burnout). Routine manual multitasking increases any work-related mental health problem
by 0.273 standard deviations. IV estimates are significant at the 5% level for strain (0.257)
and exhaustion (0.264). Compared to the full sample, the insignificance of any multitasking
measure for burnout is confirmed in this sample (point estimates are virtually zero and much
smaller than in the full sample). Coefficients for the combined measure, strain, and exhaustion
are larger, while estimates for absenteeism and presenteeism are of similar size but insignificant
because standard errors are up to ten times larger. This loss in estimation power comes from
the reduced number of observations.
Table A.8 shows the results for low to medium plus educated employees in service companies
with 100 and more employees. Numbers of observations vary from 600 to 1,600. OLS estimates
are significant for general multitasking (except burnout). New PT is associated with increases in
general multitasking of about 0.6 standard deviations (t-statistics between 6 and 9). All second
stages are insignificant. Point estimates for the combined measure, strain, and exhaustion are
smaller than in OLS while standard errors are about 3 times larger. The coefficients for burnout
(large) and absenteeism (small) turn negative. For presenteeism, the coefficient is comparable
to OLS. Non-routine manual multitasking is significantly and positively related to all outcomes
in OLS. First stages are similar to the general multitasking first stage (coefficients around 0.5,
t-statistics between 5 and 7). Second stages are insignificant because coefficients decrease to one
half or one third of the OLS size, while standard errors increase by a factor of five to six. The
estimates for burnout and absenteeism are negative, the presenteeism estimate is somewhat
larger than in OLS but insignificant. In OLS, routine manual multitasking is significantly
associated with strain only (10% level). First stage coefficients are around 0.6 with somewhat
larger t-statistics (7 to 12). All second stages are insignificant. Coefficients and standard errors
change similarly to the other two multitasking measure models. Routine cognitive multitasking
23
is significantly associated with the combined measure and strain (0.193 and 0.217) but no
other outcome. New PT is associated to multitasking increases of 0.3 standard deviations. t-
statistics range from 4 (burnout model) to 6. All second stages are insignificant. Compared
to the full sample, no significant OLS associations are left for the routine manual and routine
cognitive multitasking measure. Sample size is quite small and might not be representative of
the full sample anymore. All second stage estimates are much smaller and not significant. Point
estimates are negative for burnout and absenteeism.
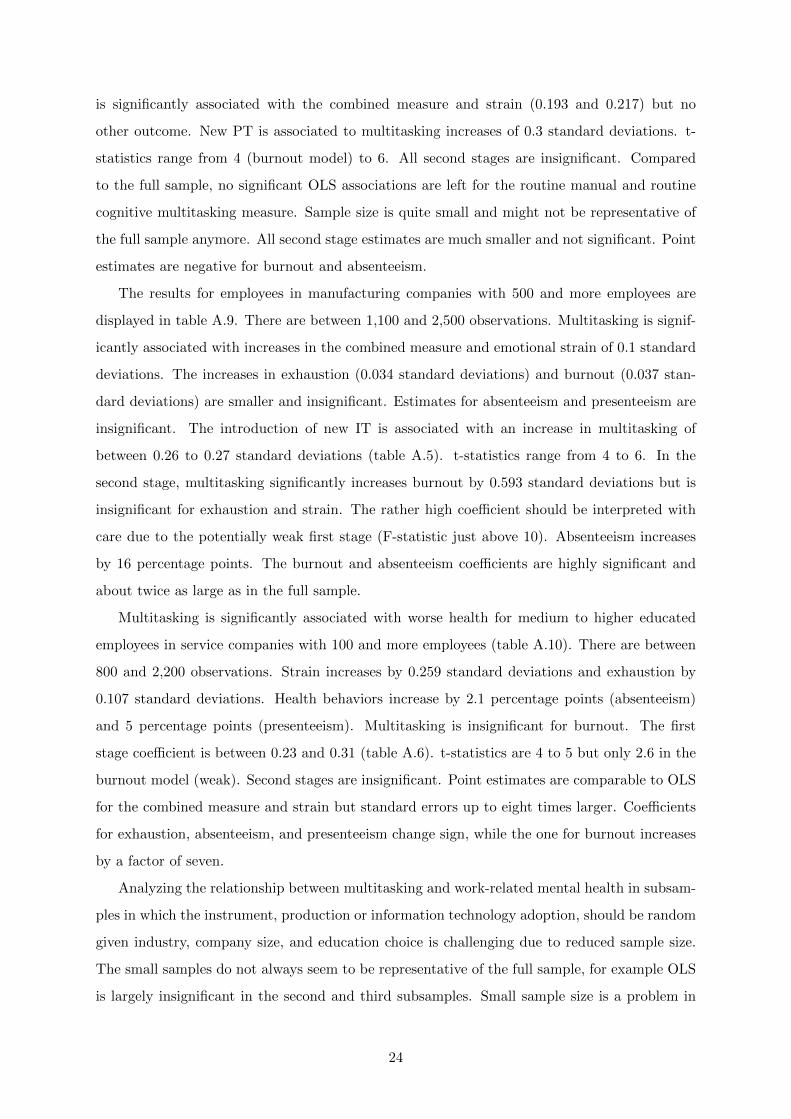
The results for employees in manufacturing companies with 500 and more employees are
displayed in table A.9. There are between 1,100 and 2,500 observations. Multitasking is signif-
icantly associated with increases in the combined measure and emotional strain of 0.1 standard
deviations. The increases in exhaustion (0.034 standard deviations) and burnout (0.037 stan-
dard deviations) are smaller and insignificant. Estimates for absenteeism and presenteeism are
insignificant. The introduction of new IT is associated with an increase in multitasking of
between 0.26 to 0.27 standard deviations (table A.5). t-statistics range from 4 to 6. In the
second stage, multitasking significantly increases burnout by 0.593 standard deviations but is
insignificant for exhaustion and strain. The rather high coefficient should be interpreted with
care due to the potentially weak first stage (F-statistic just above 10). Absenteeism increases
by 16 percentage points. The burnout and absenteeism coefficients are highly significant and
about twice as large as in the full sample.
Multitasking is significantly associated with worse health for medium to higher educated
employees in service companies with 100 and more employees (table A.10). There are between
800 and 2,200 observations. Strain increases by 0.259 standard deviations and exhaustion by
0.107 standard deviations. Health behaviors increase by 2.1 percentage points (absenteeism)
and 5 percentage points (presenteeism). Multitasking is insignificant for burnout. The first
stage coefficient is between 0.23 and 0.31 (table A.6). t-statistics are 4 to 5 but only 2.6 in the
burnout model (weak). Second stages are insignificant. Point estimates are comparable to OLS
for the combined measure and strain but standard errors up to eight times larger. Coefficients
for exhaustion, absenteeism, and presenteeism change sign, while the one for burnout increases
by a factor of seven.
Analyzing the relationship between multitasking and work-related mental health in subsam-
ples in which the instrument, production or information technology adoption, should be random
given industry, company size, and education choice is challenging due to reduced sample size.
The small samples do not always seem to be representative of the full sample, for example OLS
is largely insignificant in the second and third subsamples. Small sample size is a problem in
24
particular with the IT adoption instrument. Some first stages are still significant but with rather
low t-statistics. With the production technology adoption instrument, there is some evidence
for a causal effect of multitasking on emotional strain and exhaustion in the manufacturing
sample.
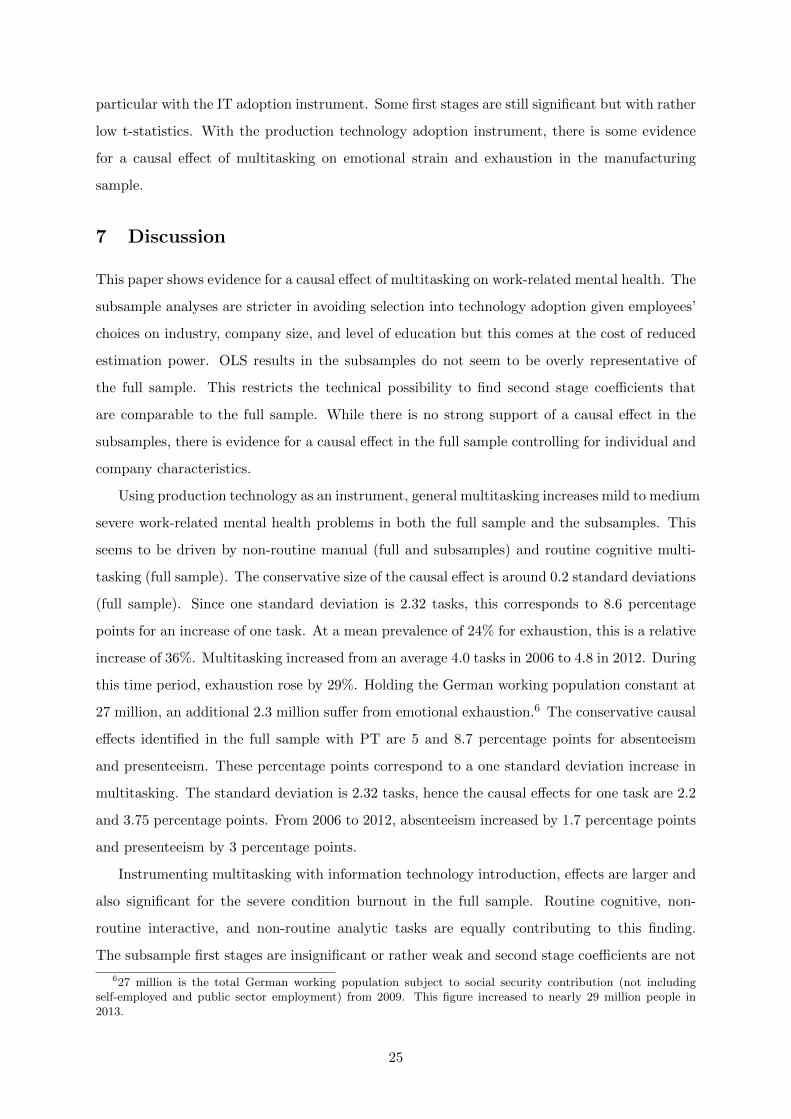
7 Discussion
This paper shows evidence for a causal effect of multitasking on work-related mental health. The
subsample analyses are stricter in avoiding selection into technology adoption given employees’
choices on industry, company size, and level of education but this comes at the cost of reduced
estimation power. OLS results in the subsamples do not seem to be overly representative of
the full sample. This restricts the technical possibility to find second stage coefficients that
are comparable to the full sample. While there is no strong support of a causal effect in the
subsamples, there is evidence for a causal effect in the full sample controlling for individual and
company characteristics.
Using production technology as an instrument, general multitasking increases mild to medium
severe work-related mental health problems in both the full sample and the subsamples. This
seems to be driven by non-routine manual (full and subsamples) and routine cognitive multi-
tasking (full sample). The conservative size of the causal effect is around 0.2 standard deviations
(full sample). Since one standard deviation is 2.32 tasks, this corresponds to 8.6 percentage
points for an increase of one task. At a mean prevalence of 24% for exhaustion, this is a relative
increase of 36%. Multitasking increased from an average 4.0 tasks in 2006 to 4.8 in 2012. During
this time period, exhaustion rose by 29%. Holding the German working population constant at
27 million, an additional 2.3 million suffer from emotional exhaustion.6 The conservative causal
effects identified in the full sample with PT are 5 and 8.7 percentage points for absenteeism
and presenteeism. These percentage points correspond to a one standard deviation increase in
multitasking. The standard deviation is 2.32 tasks, hence the causal effects for one task are 2.2
and 3.75 percentage points. From 2006 to 2012, absenteeism increased by 1.7 percentage points
and presenteeism by 3 percentage points.
Instrumenting multitasking with information technology introduction, effects are larger and
also significant for the severe condition burnout in the full sample. Routine cognitive, non-
routine interactive, and non-routine analytic tasks are equally contributing to this finding.
The subsample first stages are insignificant or rather weak and second stage coefficients are not
627 million is the total German working population subject to social security contribution (not includingself-employed and public sector employment) from 2009. This figure increased to nearly 29 million people in2013.
25
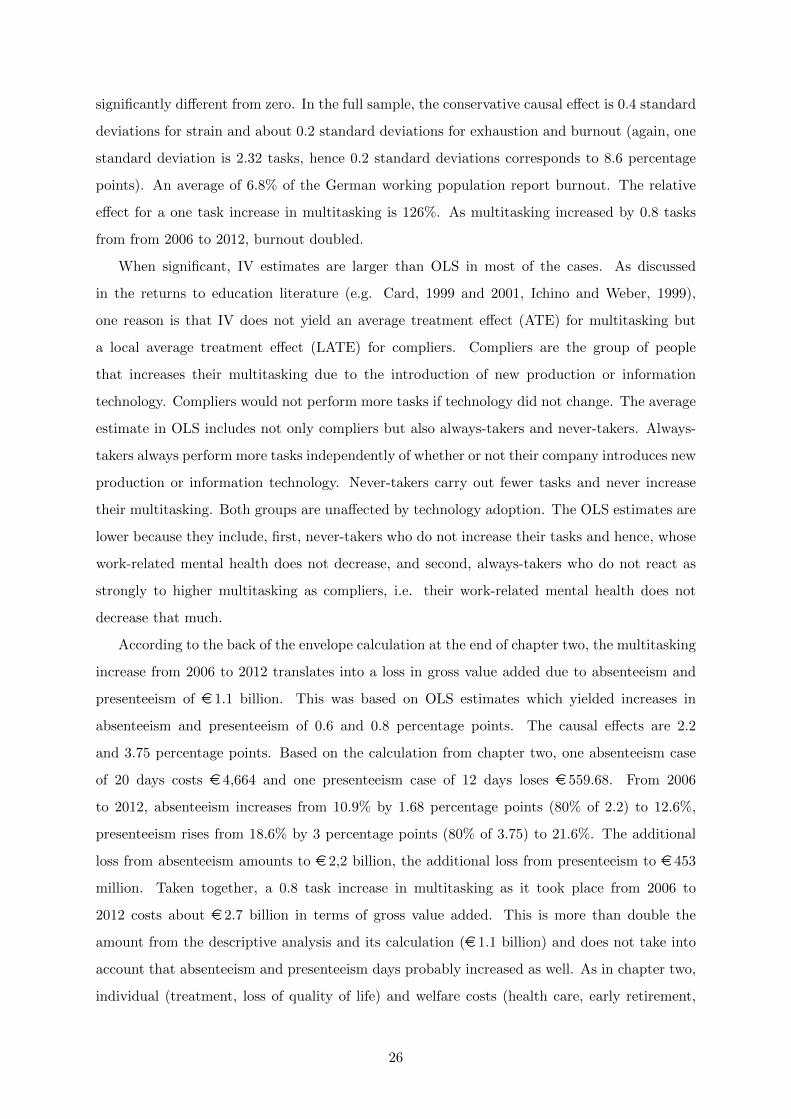
significantly different from zero. In the full sample, the conservative causal effect is 0.4 standard
deviations for strain and about 0.2 standard deviations for exhaustion and burnout (again, one
standard deviation is 2.32 tasks, hence 0.2 standard deviations corresponds to 8.6 percentage
points). An average of 6.8% of the German working population report burnout. The relative
effect for a one task increase in multitasking is 126%. As multitasking increased by 0.8 tasks
from from 2006 to 2012, burnout doubled.
When significant, IV estimates are larger than OLS in most of the cases. As discussed
in the returns to education literature (e.g. Card, 1999 and 2001, Ichino and Weber, 1999),
one reason is that IV does not yield an average treatment effect (ATE) for multitasking but
a local average treatment effect (LATE) for compliers. Compliers are the group of people
that increases their multitasking due to the introduction of new production or information
technology. Compliers would not perform more tasks if technology did not change. The average
estimate in OLS includes not only compliers but also always-takers and never-takers. Always-
takers always perform more tasks independently of whether or not their company introduces new
production or information technology. Never-takers carry out fewer tasks and never increase
their multitasking. Both groups are unaffected by technology adoption. The OLS estimates are
lower because they include, first, never-takers who do not increase their tasks and hence, whose
work-related mental health does not decrease, and second, always-takers who do not react as
strongly to higher multitasking as compliers, i.e. their work-related mental health does not
decrease that much.
According to the back of the envelope calculation at the end of chapter two, the multitasking
increase from 2006 to 2012 translates into a loss in gross value added due to absenteeism and
presenteeism of e 1.1 billion. This was based on OLS estimates which yielded increases in
absenteeism and presenteeism of 0.6 and 0.8 percentage points. The causal effects are 2.2
and 3.75 percentage points. Based on the calculation from chapter two, one absenteeism case
of 20 days costs e 4,664 and one presenteeism case of 12 days loses e 559.68. From 2006
to 2012, absenteeism increases from 10.9% by 1.68 percentage points (80% of 2.2) to 12.6%,
presenteeism rises from 18.6% by 3 percentage points (80% of 3.75) to 21.6%. The additional
loss from absenteeism amounts to e 2,2 billion, the additional loss from presenteeism to e 453
million. Taken together, a 0.8 task increase in multitasking as it took place from 2006 to
2012 costs about e 2.7 billion in terms of gross value added. This is more than double the
amount from the descriptive analysis and its calculation (e 1.1 billion) and does not take into
account that absenteeism and presenteeism days probably increased as well. As in chapter two,
individual (treatment, loss of quality of life) and welfare costs (health care, early retirement,
26

work incapacity) should be added to complete the picture.
8 Conclusion
In analyzing the causal effect of multitasking on work-related mental health this paper also
provides insight in the relationship between technological change and employee well-being.
Multitasking decreases work-related mental health, hence it can make employees sick. Since
technological change is associated with increases in multitasking, technological change can con-
tribute to decreased mental well-being at work. Regarding the nature of technological change,
production technology change is more relevant for manual multitasking, and information tech-
nology change for cognitive multitasking. This is not surprising but confirms that some types
of technological change are more important for some employees than for others. What can
be derived from this analysis is not that technological change is bad per se but rather that it
can have adverse effects on employees’ work-related mental health. The challenge is to better
prepare people for the changes new technology brings to their work places and thereby reduce
health problems. This is important not only from an individual perspective (loss of quality of
life) but also from the firm’s and from the society’s point of view: firms lose through absen-
teeism and presenteeism (loss in productivity, efficiency, quality), society through public health
expenditures, incapacity, and early retirement. Reducing adverse effects is hence a common
interest. It is impossible to make any prediction what the effect of future technological changes
will be but if they – as today’s technological change – increase multitasking, improvements in
work-related mental health can only come from reductions in other job demands or from better
coping with multitasking.
Apart from these general conclusions, the paper also contributes to the task literature by
showing that technological change does not necessarily substitute some task categories (rou-
tine) and complements others (non-routine) for the individual employee. Instead, technological
change is associated with performing more different tasks independently of their routine or
non-routine nature. This calls for paying more attention to the inseparability of tasks on the
individual level and to the role job design plays in re-bundling tasks to jobs after technological
change.
The study is subject to three limitations. First, it is not possible to accurately measure
the time distance between technological change and work-related mental health problems as
the exact timing of technological change is not recorded in the data. Taking into account that
organizational change often occurs even before technological change, this should not be overly
problematic to identification in general. Not finding any significant effect for the most severe
27
work-related mental health problem, burnout, with the production technology instrument might
be a hint that there was not enough time between technological change and mental health
measurement. Of the three outcomes considered, burnout takes most time to develop. The
first step into burnout is often emotional exhaustion, a component of burnout, for which the
estimates are significant. Thus, there might not have been sufficient time after the change for
the development of burnout. Another reason could lie in the second limitation: the analysis
is subject to survival bias. Individuals whose work-related mental health is so deteriorated
that they have to give up employment are not included in the study population. Burnout is
the most severe outcome. If individuals suffering from burnout leave employment to a larger
extent where production technology adoption occurred (compared to information technology
adoption), the survival bias could contribute to the insignificant result with this instrument.
In any case, the survival bias should bias the estimates downwards. Third, being concerned
that selection of certain individuals into certain companies might drive the results, the analysis
is repeated in subsamples where the adoption of technology should be close to random given
employees’ choices regarding industry, company size, and level of education. These subsamples
become quite small and do not always seem to be representative of the full sample. Many first
stages are insignificant or weak. As IV is a data hungry method, standard errors increase and
most second stages are insignificant.
Nevertheless, the full sample results provide evidence for a causal relationship between ris-
ing multitasking and worse work-related mental health. Multitasking reduction could be an
approach to improve mental health at work but this might entail unwanted negative conse-
quences on for instance job satisfaction which increases with multitasking (chapter two). The
lesson to be drawn from this paper is a more general one: there is a relationship between
technological change and work-related mental health. Future work could shed further light on
this by analyzing whether there are possible mediators to this relationship, e.g. whether job
environment (demands and resources) plays a role.
28
References
Antonczyk, D., B. Fitzenberger, and U. Leuschner (2009). Can a Task-Based Approach Ex-plain the Recent Changes in the German Wage Structure? Journal of Economics and Statis-tics 229 (2-3), 214–238.
Aoki, M. (1988, February). A new paradigm of work organization: the Japanece experience.Wider workign papers (36).
Autor, D. and D. Dorn (2013). The Growth of Low-Skill Service Jobs and the Polarization ofthe U.S. Labor Market. American Economic Review 103 (5), 1553–97.
Autor, D. and M. J. Handel (2013). Putting tasks to the test: Human capital, job tasks, andwages. Journal of Labor Economics 31 (2 Part 2), S59–S96.
Autor, D., L. Katz, and M. Kearney (2008). Trends in u.s. wage inequality: Revising therevisionists. The Review of Economics and Statistics 90 (2), 300–323.
Autor, D., F. Levy, and R. J. Murnane (2003). The skill content of recent technological change:An empirical exploration. Quarterly Journal of Economics 118 (4), 1279–1334.
Autor, D. H., F. Levy, and R. J. Murnane (2002). Upstairs, downstairs: Computers and skillson two floors of a large bank. ILR Review 55 (3), 432–447.
Boucekkine, R. and P. Crifo (2008). Human capital accumulation and the transition fromspecialization to multitasking. Macroeconomic Dynamics 12 (03), 320–344.
Card, D. (2001). Estimating the return to schooling: Progress on some persistent econometricproblems. Econometrica 69 (5), 1127–1160.
Chatfield, T. (January 20 ,2016). What does it mean to be human inthe age of technology? The Guardian. last accessed on July 20, 2017https://www.theguardian.com/technology/2016/jan/20/humans-machines-technology-digital-age.
Demerouti, E., A. B. Bakker, F. Nachreiner, and W. B. Schaufeli (2001). The job demands-resources model of burnout. Journal of Applied Psychology 86 (3), 499.
Dustmann, C., J. Ludsteck, and U. Schoenberg (2009). Revisiting the German Wage Structure.Quarterly Journal of Economics 124 (2), 843–881.
Ehling, M. (2015, March 20). Do we really want the future that rapid technological change isbringing? MinnPost. last accessed on July 20, 2017 https://www.minnpost.com/community-voices/2015/03/do-we-really-want-future-rapid-technological-change-bringing.
Frey, C. B. and M. A. Osborne (2013, September). The future of employment: how susceptibleare jobs to computerisation? University of Oxford.
Goos, M. and A. Manning (2007, February). Lousy and Lovely Jobs: The Rising Polarizationof Work in Britain. The Review of Economics and Statistics 89 (1), 118–133.
Hack, G. (2014, October 22). Wir Maschinenwesen. Zeit online. last accessed on July 20, 2017http://www.zeit.de/kultur/2014-10/cyborg-technologie/komplettansicht.
Hackman, J. R. and G. R. Oldham (1976). Motivation through the design of work: Test of atheory. Organizational Behavior and Human Performance 16 (2), 250–279.
29
Hassabis, D. (2017). Artificial intelligence: Chess match of the century. Nature 544 (7651),413–414.
Hasselhorn, H.-M. and M. Nubling (2004). Arbeitsbedingte psychische Erschopfung bei Er-werbstatigen in Deutschland. Arbeitsmedizin Sozialmedizin Umweltmedizin 39 (11).
Herzberg, F. (1976). The managerial choice: To be efficient and to be human. Irwin ProfessionalPublishing.
Herzberg, F. I. (1966). Work and the nature of man. World Publishing Company.
Lindbeck, A. and D. J. Snower (2000). Multitask learning and the reorganization of work: Fromtayloristic to holistic organization. Journal of Labor Economics 18 (3), 353–376.
Lindbeck, A. and D. J. Snower (2001). Centralized bargaining and reorganized work: Are theycompatible? European economic review 45 (10), 1851–1875.
Maslach, C. and S. E. Jackson (1981). The measurement of experienced burnout. Journal ofOccupational Behavior 2 (2), 99–113.
Maslach, C. and S. E. Jackson (1984). Burnout in organizational settings. Applied SocialPsychology Annual .
Maslach, C., M. P. Leiter, and S. E. Jackson (2012). Making a significant difference withburnout interventions: Researcher and practitioner collaboration. Journal of OrganizationalBehavior 33 (2), 296–300.
Maslach, C., W. B. Schaufeli, and M. P. Leiter (2001). Job burnout. Annual Review of Psy-chology 52 (1), 397–422.
Menn, A. (2014, November 21). Mein Chef ist ein Computer. Wirtschaftswoche. last accessedon July 20, 2017 http://www.wiwo.de/technologie/smarthome/kuenstliche-intelligenz-mein-chef-ist-ein-computer/9829550.html.
Oldham, G. R. and J. R. Hackman (2010). Not what it was and not what it will be: The futureof job design research. Journal of Organizational Behavior 31 (2-3), 463–479.
Osterman, P. (1994). How common is workplace transformation and who adopts it? ILRReview 47 (2), 173–188.
Peterson, U., E. Demerouti, G. Bergstrom, M. Samuelsson, M. Asberg, and A. Nygren (2008).Burnout and physical and mental health among Swedish healthcare workers. Journal ofAdvanced Nursing 62 (1), 84–95.
Pikos, A. K. and S. L. Thomsen (2016). Rising work complexity but decreasing returns. IZADiscussion Paper (9878).
Rohrbach-Schmidt, D. (2009). The BIBB/IAB- and BIBB-BAuA Surveys of the Working Pop-ulation on Qualification and Working Conditions in Germany. BIBB-FDZ Daten- und Meth-odenbericht No. 1/2009. Technical report, Bonn: BIBB. ISSN 2190-300X.
Rohrbach-Schmidt, D. and A. Hall (2013). BIBB/BAuA-Erwerbstaetigenbefragung 2012, BIBB-FDZ Daten- und Methodenberichte Nr. 1/2013. Technical report, Bonn: BIBB. ISSN 2190-300X.
Schaufeli, W. B., I. M. Martinez, A. M. Pinto, M. Salanova, and A. B. Bakker (2002). Burnoutand engagement in university students a cross-national study. Journal of Cross-cultural Psy-chology 33 (5), 464–481.
30

Spitz-Oener, A. (2006). Technical change, job tasks, and rising educational demands: lookingoutside the wage structure. Journal of Labor Economics 24 (2), 235–270.
Spitz-Oener, A. (2008). The returns to pencil use revisited. Industrial & Labor RelationsReview 61 (4), 502–517.
Zhang, Y., Y. Gan, and H. Cham (2007). Perfectionism, academic burnout and engagementamong chinese college students: A structural equation modeling analysis. Personality andIndividual Differences 43 (6), 1529–1540.
31
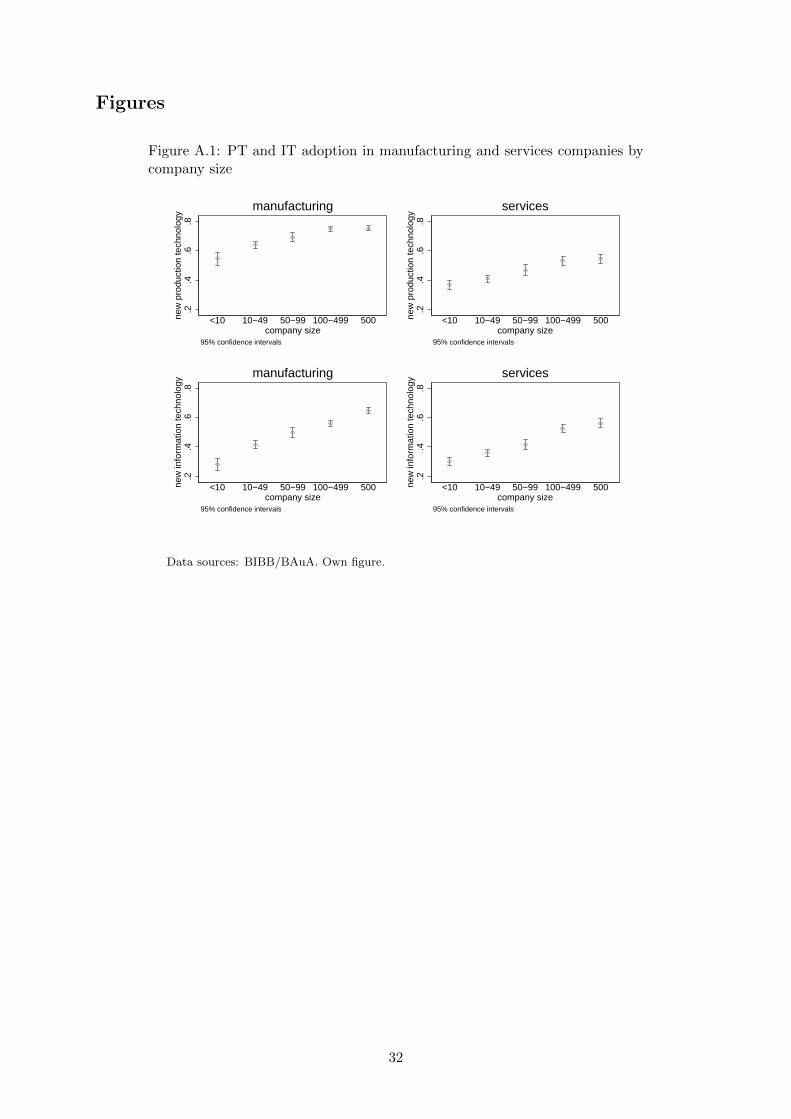
Figures
Figure A.1: PT and IT adoption in manufacturing and services companies bycompany size
.2.4
.6.8
new
pro
duct
ion
tech
nolo
gy
<10 10−49 50−99 100−499 500company size
95% confidence intervals
manufacturing
.2.4
.6.8
new
pro
duct
ion
tech
nolo
gy
<10 10−49 50−99 100−499 500company size
95% confidence intervals
services
.2.4
.6.8
new
info
rmat
ion
tech
nolo
gy
<10 10−49 50−99 100−499 500company size
95% confidence intervals
manufacturing
.2.4
.6.8
new
info
rmat
ion
tech
nolo
gy
<10 10−49 50−99 100−499 500company size
95% confidence intervals
services
Data sources: BIBB/BAuA. Own figure.
32

Figure A.2: PT and IT adoption in manufacturing and services companies with100 and more employees by gendera
.5.6
.7.8
.9ne
w p
rodu
ctio
n te
chno
logy
women menage
95% confidence intervals
manufacturing
.5.6
.7.8
.9ne
w p
rodu
ctio
n te
chno
logy
women menage
95% confidence intervals
services
.5.6
.7.8
.9ne
w in
form
atio
n te
chno
logy
women menage
95% confidence intervals
manufacturing
.5.6
.7.8
.9ne
w in
form
atio
n te
chno
logy
women menage
95% confidence intervals
services
a IT adoption in manufacturing companies with 500 and more employees.Data sources: BIBB/BAuA. Own figure.
33

Figure A.3: PT and IT adoption in manufacturing and services companies with100 and more employees by age categorya
.4.5
.6.7
.8ne
w in
form
atio
n te
chno
logy
18−29 30−39 40−49 50−65age
95% confidence intervals
manufacturing
.4.5
.6.7
.8ne
w in
form
atio
n te
chno
logy
18−29 30−39 40−49 50−65age
95% confidence intervals
services
.4.5
.6.7
.8ne
w in
form
atio
n te
chno
logy
18−29 30−39 40−49 50−65age
95% confidence intervals
manufacturing
.4.5
.6.7
.8ne
w in
form
atio
n te
chno
logy
18−29 30−39 40−49 50−65age
95% confidence intervals
services
a Technology adoption for men in manufacturing companies with 100 and more employees.IT adoption in manufacturing companies with 500 and more employees.Data sources: BIBB/BAuA. Own figure.
34

Figure A.4: PT and IT adoption in manufacturing and services companies bylevel of education
.2.4
.6.8
1ne
w p
rodu
ctio
n te
chno
logy
low mediumm medium plus higheducation
95% confidence intervals
manufacturing
.2.4
.6.8
1ne
w p
rodu
ctio
n te
chno
logy
low mediumm medium plus higheducation
95% confidence intervals
services
.2.4
.6.8
1ne
w in
form
atio
n te
chno
logy
low mediumm medium plus higheducation
95% confidence intervals
manufacturing
.2.4
.6.8
1ne
w in
form
atio
n te
chno
logy
low mediumm medium plus higheducation
95% confidence intervals
services
Data sources: BIBB/BAuA. Own figure.
35

Figure A.5: Standardized multitasking by technology adoption for low tomedium plus educated men in manufacturing companies with 100 and moreemployees
−.4
−.2
0.2
mul
titas
king
no yestechnology adoption
95% confidence intervals
−.3
−.2
−.1
0.1
.2no
n−ro
utin
e m
anua
l
no yestechnology adoption
95% confidence intervals
.2.4
.6.8
1ro
utin
e m
anua
l
no yestechnology adoption
95% confidence intervals
−.1
−.0
50
.05
.1.1
5ro
utin
e co
gniti
ve
no yestechnology adoption
95% confidence intervals
−.5
5−
.5−
.45
−.4
−.3
5no
n−ro
utin
e in
tera
ctiv
e
no yestechnology adoption
95% confidence intervals
−.3
−.2
−.1
0no
n−ro
utin
e an
alyt
ic
no yestechnology adoption
95% confidence intervals
Data sources: BIBB/BAuA. Own figure.
36
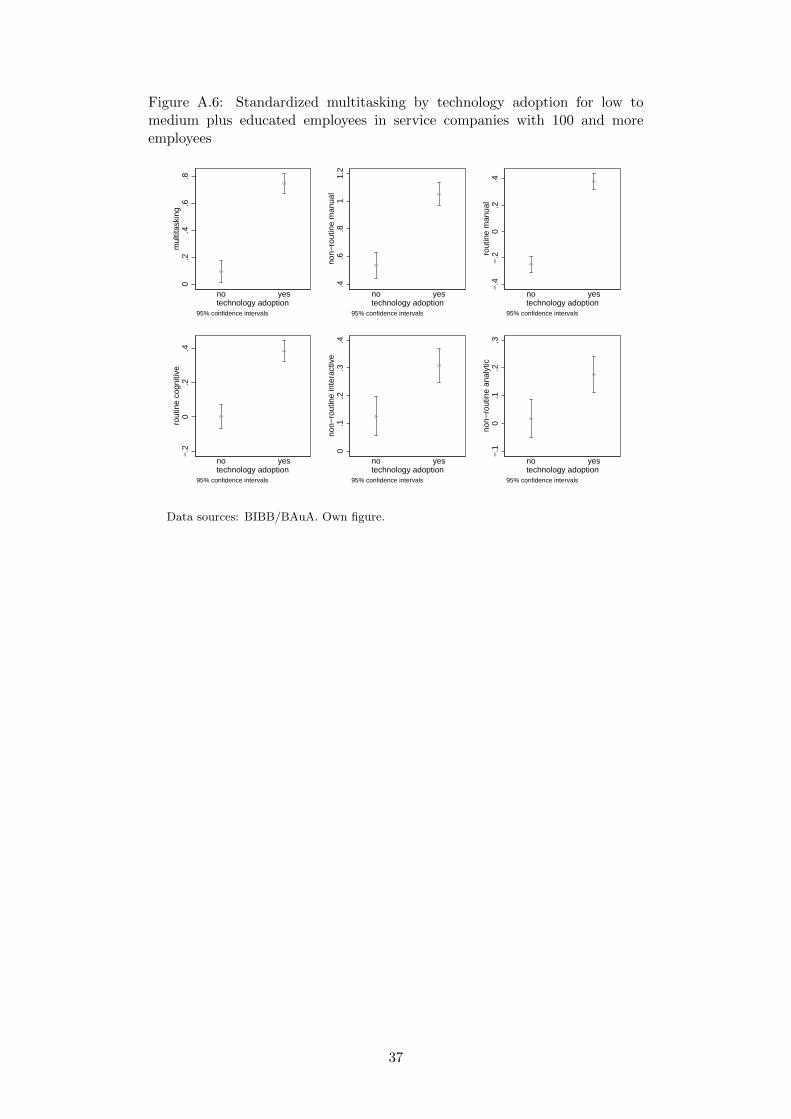
Figure A.6: Standardized multitasking by technology adoption for low tomedium plus educated employees in service companies with 100 and moreemployees
0.2
.4.6
.8m
ultit
aski
ng
no yestechnology adoption
95% confidence intervals
.4.6
.81
1.2
non−
rout
ine
man
ual
no yestechnology adoption
95% confidence intervals
−.4
−.2
0.2
.4ro
utin
e m
anua
l
no yestechnology adoption
95% confidence intervals
−.2
0.2
.4ro
utin
e co
gniti
ve
no yestechnology adoption
95% confidence intervals
0.1
.2.3
.4no
n−ro
utin
e in
tera
ctiv
e
no yestechnology adoption
95% confidence intervals
−.1
0.1
.2.3
non−
rout
ine
anal
ytic
no yestechnology adoption
95% confidence intervals
Data sources: BIBB/BAuA. Own figure.
37
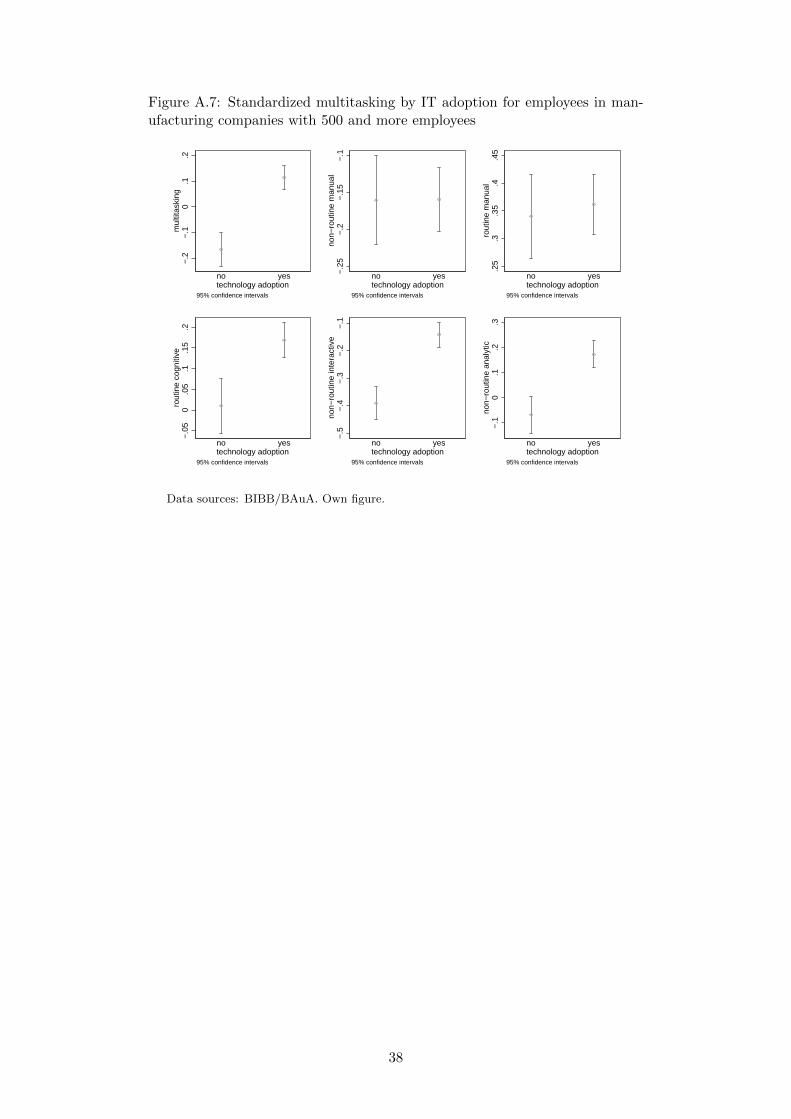
Figure A.7: Standardized multitasking by IT adoption for employees in man-ufacturing companies with 500 and more employees
−.2
−.1
0.1
.2m
ultit
aski
ng
no yestechnology adoption
95% confidence intervals
−.2
5−
.2−
.15
−.1
non−
rout
ine
man
ual
no yestechnology adoption
95% confidence intervals
.25
.3.3
5.4
.45
rout
ine
man
ual
no yestechnology adoption
95% confidence intervals
−.0
50
.05
.1.1
5.2
rout
ine
cogn
itive
no yestechnology adoption
95% confidence intervals
−.5
−.4
−.3
−.2
−.1
non−
rout
ine
inte
ract
ive
no yestechnology adoption
95% confidence intervals
−.1
0.1
.2.3
non−
rout
ine
anal
ytic
no yestechnology adoption
95% confidence intervals
Data sources: BIBB/BAuA. Own figure.
38

Figure A.8: Standardized multitasking by IT adoption for medium to highereducated employees aged 30 and older in service companies with 100 and moreemployees
.2.3
.4.5
.6.7
mul
titas
king
no yestechnology adoption
95% confidence intervals
.4.5
.6.7
non−
rout
ine
man
ual
no yestechnology adoption
95% confidence intervals
−.2
−.1
5−
.1−
.05
0.0
5ro
utin
e m
anua
l
no yestechnology adoption
95% confidence intervals
.1.2
.3.4
rout
ine
cogn
itive
no yestechnology adoption
95% confidence intervals
.2.3
.4.5
.6no
n−ro
utin
e in
tera
ctiv
e
no yestechnology adoption
95% confidence intervals
.15
.2.2
5.3
.35
non−
rout
ine
anal
ytic
no yestechnology adoption
95% confidence intervals
Data sources: BIBB/BAuA. Own figure.
39
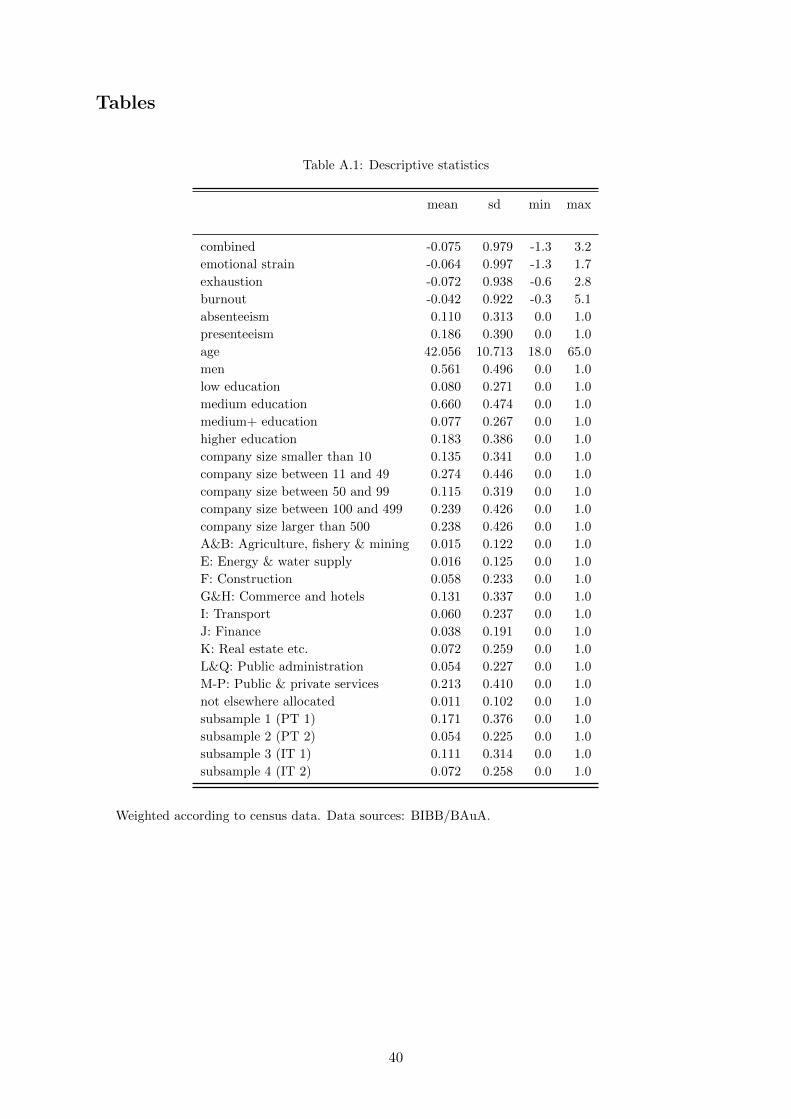
Tables
Table A.1: Descriptive statistics
mean sd min max
combined -0.075 0.979 -1.3 3.2
emotional strain -0.064 0.997 -1.3 1.7
exhaustion -0.072 0.938 -0.6 2.8
burnout -0.042 0.922 -0.3 5.1
absenteeism 0.110 0.313 0.0 1.0
presenteeism 0.186 0.390 0.0 1.0
age 42.056 10.713 18.0 65.0
men 0.561 0.496 0.0 1.0
low education 0.080 0.271 0.0 1.0
medium education 0.660 0.474 0.0 1.0
medium+ education 0.077 0.267 0.0 1.0
higher education 0.183 0.386 0.0 1.0
company size smaller than 10 0.135 0.341 0.0 1.0
company size between 11 and 49 0.274 0.446 0.0 1.0
company size between 50 and 99 0.115 0.319 0.0 1.0
company size between 100 and 499 0.239 0.426 0.0 1.0
company size larger than 500 0.238 0.426 0.0 1.0
A&B: Agriculture, fishery & mining 0.015 0.122 0.0 1.0
E: Energy & water supply 0.016 0.125 0.0 1.0
F: Construction 0.058 0.233 0.0 1.0
G&H: Commerce and hotels 0.131 0.337 0.0 1.0
I: Transport 0.060 0.237 0.0 1.0
J: Finance 0.038 0.191 0.0 1.0
K: Real estate etc. 0.072 0.259 0.0 1.0
L&Q: Public administration 0.054 0.227 0.0 1.0
M-P: Public & private services 0.213 0.410 0.0 1.0
not elsewhere allocated 0.011 0.102 0.0 1.0
subsample 1 (PT 1) 0.171 0.376 0.0 1.0
subsample 2 (PT 2) 0.054 0.225 0.0 1.0
subsample 3 (IT 1) 0.111 0.314 0.0 1.0
subsample 4 (IT 2) 0.072 0.258 0.0 1.0
Weighted according to census data. Data sources: BIBB/BAuA.
40

Table A.2: Multitasking estimates for work-related mental health outcomes, additionalcontrols
combined strain exhaustion burnout absenteeism presenteeism
OLS
multitasking 0.144∗∗∗ 0.150∗∗∗ 0.069∗∗∗ 0.047∗∗∗ 0.016∗∗∗ 0.033∗∗∗
(0.008) (0.008) (0.010) (0.012) (0.003) (0.004)
constant -1.507∗∗∗ -1.404∗∗∗ -1.169∗∗∗ -0.714∗∗∗ -0.174∗∗∗ -0.189∗∗∗
(0.121) (0.128) (0.144) (0.158) (0.037) (0.061)
IV PT
multitasking 0.215∗∗∗ 0.194∗∗∗ 0.207∗∗∗ 0.056 0.046∗∗∗ 0.082∗∗∗
(0.047) (0.048) (0.063) (0.063) (0.016) (0.027)
constant -1.432∗∗∗ -1.356∗∗∗ -1.010∗∗∗ -0.705∗∗∗ -0.142∗∗∗ -0.131∗
(0.134) (0.140) (0.166) (0.177) (0.041) (0.069)
IV IT
multitasking 0.358∗∗∗ 0.349∗∗∗ 0.151∗ 0.214∗ 0.053∗∗ 0.079∗∗
(0.075) (0.077) (0.087) (0.124) (0.025) (0.037)
constant -1.304∗∗∗ -1.193∗∗∗ -1.090∗∗∗ -0.648∗∗∗ -0.151∗∗∗ -0.140∗
(0.146) (0.154) (0.173) (0.178) (0.045) (0.076)
N 23702 23743 13232 10486 23724 13263
first stage IV PT
new PT 0.321 0.321 0.313 0.330 0.321 0.314
t-statistic 21.09 21.10 15.16 14.78 21.09 15.18
model F-statistic 107.04 107.30 57.99 59.34 107.33 58.34
first stage IV IT
new IT 0.206 0.207 0.232 0.171 0.206 0.233
t-statistic 13.36 13.41 11.09 7.51 13.38 11.13
model F-statistic 90.73 90.98 50.35 50.53 90.92 50.68
Standardized dependent variable given in column header (absenteeism, presenteeism: binary). Com-bined: emotional exhaustion, burnout and/or emotional strain. Models include controls for age, agesquare, gender, level of education, tenure, tenure square, hours, hours square, industry, and companysize. IV PT: production technology adoption as instrument. IV IT: information technology adoptionas instrument. Standard errors in parentheses. Significance levels ∗ p < 0.1, ∗∗ p < 0.05, ∗∗∗ p < 0.01.Data sources: BIBB/BAuA. Own calculations.
41

Table A.3: First stage estimates for work-related mental health outcomes for low to mediumplus educated employees in manufacturing companies with 100 and more employees
combined strain exhaustion burnout absenteeism presenteeism
multitasking
new technology 0.327∗∗∗ 0.327∗∗∗ 0.276∗∗∗ 0.403∗∗∗ 0.327∗∗∗ 0.276∗∗∗
(0.042) (0.042) (0.054) (0.065) (0.042) (0.054)
constant -0.543∗∗∗ -0.554∗∗∗ -0.552∗∗∗ -0.612∗∗∗ -0.542∗∗∗ -0.565∗∗∗
(0.093) (0.093) (0.113) (0.151) (0.093) (0.113)
non-routine manual
new technology 0.267∗∗∗ 0.267∗∗∗ 0.280∗∗∗ 0.250∗∗∗ 0.267∗∗∗ 0.281∗∗∗
(0.039) (0.039) (0.050) (0.063) (0.039) (0.050)
constant -0.305∗∗∗ -0.310∗∗∗ -0.257∗∗ -0.348∗∗ -0.304∗∗∗ -0.264∗∗
(0.091) (0.091) (0.113) (0.155) (0.091) (0.112)
routine manual
new technology 0.445∗∗∗ 0.444∗∗∗ 0.426∗∗∗ 0.481∗∗∗ 0.445∗∗∗ 0.424∗∗∗
(0.049) (0.049) (0.064) (0.075) (0.049) (0.064)
constant 0.255∗∗ 0.250∗∗ 0.275∗∗ 0.421∗∗ 0.256∗∗ 0.269∗∗
(0.105) (0.105) (0.136) (0.163) (0.105) (0.136)
routine cognitive
new technology 0.120∗∗∗ 0.120∗∗∗ 0.077 0.189∗∗∗ 0.121∗∗∗ 0.078
(0.042) (0.042) (0.055) (0.061) (0.042) (0.055)
constant -0.158∗ -0.164∗ -0.203∗ -0.189 -0.158∗ -0.209∗
(0.086) (0.086) (0.113) (0.134) (0.086) (0.112)
non-routine interactive
new technology 0.010 0.010 -0.001 0.026 0.011 -0.002
(0.037) (0.037) (0.049) (0.057) (0.037) (0.049)
constant -0.668∗∗∗ -0.675∗∗∗ -0.716∗∗∗ -0.785∗∗∗ -0.668∗∗∗ -0.725∗∗∗
(0.085) (0.085) (0.115) (0.125) (0.085) (0.115)
non-routine analytic
new technology 0.090∗∗ 0.091∗∗ 0.058 0.129∗∗ 0.089∗∗ 0.061
(0.040) (0.040) (0.053) (0.061) (0.040) (0.053)
constant -0.394∗∗∗ -0.401∗∗∗ -0.295∗∗ -0.589∗∗∗ -0.393∗∗∗ -0.303∗∗
(0.088) (0.088) (0.118) (0.136) (0.088) (0.118)
N 3683 3691 2028 1657 3685 2036
t-statistics
multitasking 7.85 7.86 5.09 6.23 7.85 5.10
non-routine manual 6.83 6.85 5.62 3.95 6.83 5.64
routine manual 9.10 9.09 6.65 6.41 9.09 6.63
routine cognitive 2.89 2.90 1.40 3.09 2.91 1.41
non-routine interactive 0.27 0.26 -0.03 0.45 0.28 -0.04
non-routine analytic 2.23 2.28 1.09 2.13 2.22 1.15
Second stage standardized dependent variable given in column header (absenteeism, presenteeism: binary).Combined: emotional exhaustion, burnout and/or emotional strain. Models include controls for age and com-pany size. IV PT: production technology adoption as instrument. Standard errors in parentheses. Significancelevels ∗ p < 0.1, ∗∗ p < 0.05, ∗∗∗ p < 0.01. Data sources: BIBB/BAuA. Own calculations.
42
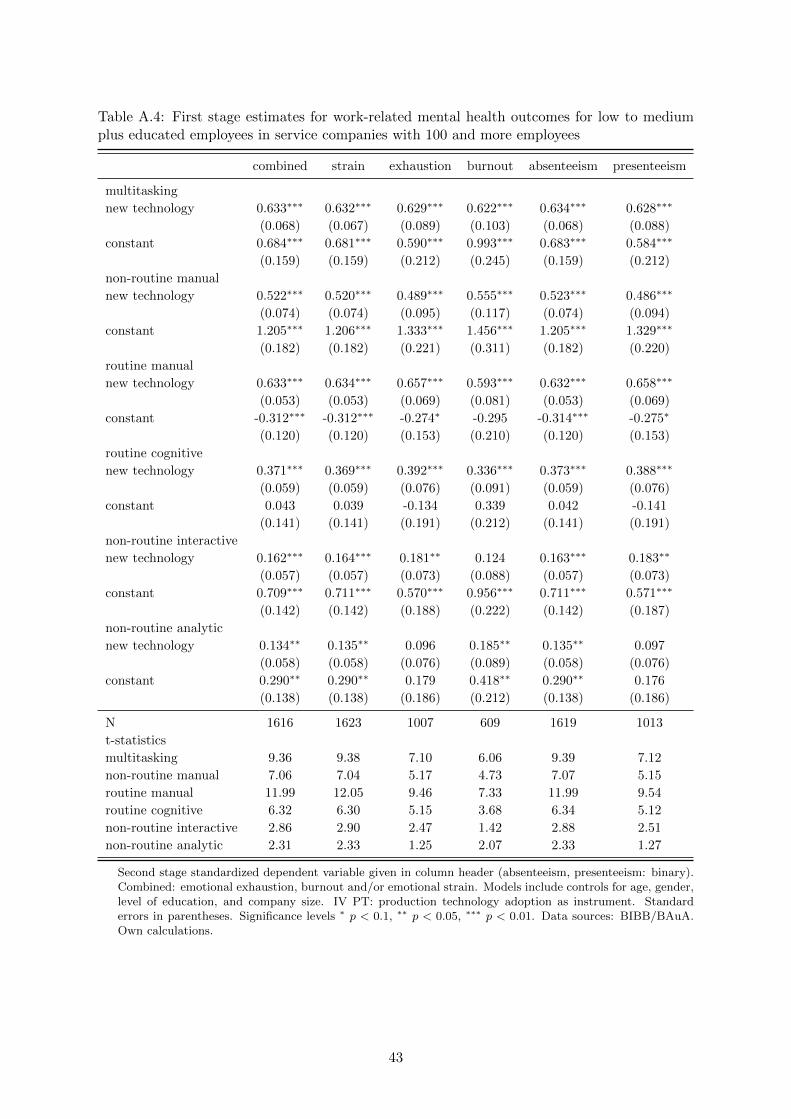
Table A.4: First stage estimates for work-related mental health outcomes for low to mediumplus educated employees in service companies with 100 and more employees
combined strain exhaustion burnout absenteeism presenteeism
multitasking
new technology 0.633∗∗∗ 0.632∗∗∗ 0.629∗∗∗ 0.622∗∗∗ 0.634∗∗∗ 0.628∗∗∗
(0.068) (0.067) (0.089) (0.103) (0.068) (0.088)
constant 0.684∗∗∗ 0.681∗∗∗ 0.590∗∗∗ 0.993∗∗∗ 0.683∗∗∗ 0.584∗∗∗
(0.159) (0.159) (0.212) (0.245) (0.159) (0.212)
non-routine manual
new technology 0.522∗∗∗ 0.520∗∗∗ 0.489∗∗∗ 0.555∗∗∗ 0.523∗∗∗ 0.486∗∗∗
(0.074) (0.074) (0.095) (0.117) (0.074) (0.094)
constant 1.205∗∗∗ 1.206∗∗∗ 1.333∗∗∗ 1.456∗∗∗ 1.205∗∗∗ 1.329∗∗∗
(0.182) (0.182) (0.221) (0.311) (0.182) (0.220)
routine manual
new technology 0.633∗∗∗ 0.634∗∗∗ 0.657∗∗∗ 0.593∗∗∗ 0.632∗∗∗ 0.658∗∗∗
(0.053) (0.053) (0.069) (0.081) (0.053) (0.069)
constant -0.312∗∗∗ -0.312∗∗∗ -0.274∗ -0.295 -0.314∗∗∗ -0.275∗
(0.120) (0.120) (0.153) (0.210) (0.120) (0.153)
routine cognitive
new technology 0.371∗∗∗ 0.369∗∗∗ 0.392∗∗∗ 0.336∗∗∗ 0.373∗∗∗ 0.388∗∗∗
(0.059) (0.059) (0.076) (0.091) (0.059) (0.076)
constant 0.043 0.039 -0.134 0.339 0.042 -0.141
(0.141) (0.141) (0.191) (0.212) (0.141) (0.191)
non-routine interactive
new technology 0.162∗∗∗ 0.164∗∗∗ 0.181∗∗ 0.124 0.163∗∗∗ 0.183∗∗
(0.057) (0.057) (0.073) (0.088) (0.057) (0.073)
constant 0.709∗∗∗ 0.711∗∗∗ 0.570∗∗∗ 0.956∗∗∗ 0.711∗∗∗ 0.571∗∗∗
(0.142) (0.142) (0.188) (0.222) (0.142) (0.187)
non-routine analytic
new technology 0.134∗∗ 0.135∗∗ 0.096 0.185∗∗ 0.135∗∗ 0.097
(0.058) (0.058) (0.076) (0.089) (0.058) (0.076)
constant 0.290∗∗ 0.290∗∗ 0.179 0.418∗∗ 0.290∗∗ 0.176
(0.138) (0.138) (0.186) (0.212) (0.138) (0.186)
N 1616 1623 1007 609 1619 1013
t-statistics
multitasking 9.36 9.38 7.10 6.06 9.39 7.12
non-routine manual 7.06 7.04 5.17 4.73 7.07 5.15
routine manual 11.99 12.05 9.46 7.33 11.99 9.54
routine cognitive 6.32 6.30 5.15 3.68 6.34 5.12
non-routine interactive 2.86 2.90 2.47 1.42 2.88 2.51
non-routine analytic 2.31 2.33 1.25 2.07 2.33 1.27
Second stage standardized dependent variable given in column header (absenteeism, presenteeism: binary).Combined: emotional exhaustion, burnout and/or emotional strain. Models include controls for age, gender,level of education, and company size. IV PT: production technology adoption as instrument. Standarderrors in parentheses. Significance levels ∗ p < 0.1, ∗∗ p < 0.05, ∗∗∗ p < 0.01. Data sources: BIBB/BAuA.Own calculations.
43
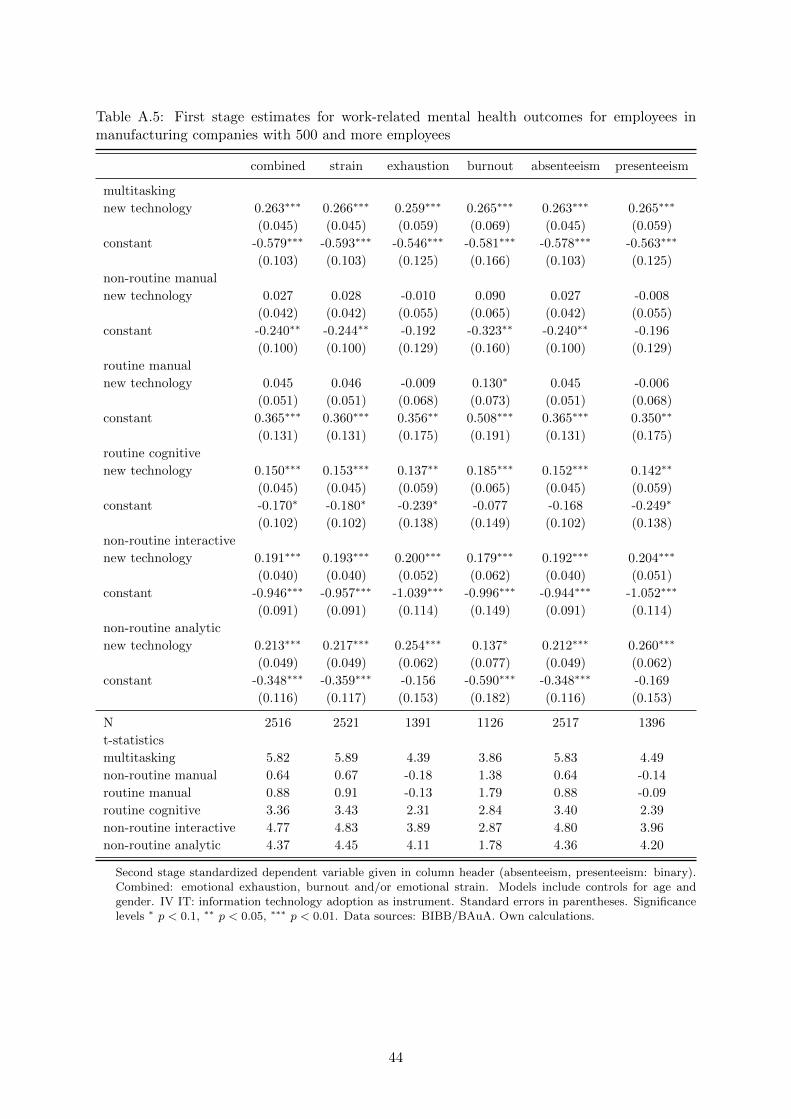
Table A.5: First stage estimates for work-related mental health outcomes for employees inmanufacturing companies with 500 and more employees
combined strain exhaustion burnout absenteeism presenteeism
multitasking
new technology 0.263∗∗∗ 0.266∗∗∗ 0.259∗∗∗ 0.265∗∗∗ 0.263∗∗∗ 0.265∗∗∗
(0.045) (0.045) (0.059) (0.069) (0.045) (0.059)
constant -0.579∗∗∗ -0.593∗∗∗ -0.546∗∗∗ -0.581∗∗∗ -0.578∗∗∗ -0.563∗∗∗
(0.103) (0.103) (0.125) (0.166) (0.103) (0.125)
non-routine manual
new technology 0.027 0.028 -0.010 0.090 0.027 -0.008
(0.042) (0.042) (0.055) (0.065) (0.042) (0.055)
constant -0.240∗∗ -0.244∗∗ -0.192 -0.323∗∗ -0.240∗∗ -0.196
(0.100) (0.100) (0.129) (0.160) (0.100) (0.129)
routine manual
new technology 0.045 0.046 -0.009 0.130∗ 0.045 -0.006
(0.051) (0.051) (0.068) (0.073) (0.051) (0.068)
constant 0.365∗∗∗ 0.360∗∗∗ 0.356∗∗ 0.508∗∗∗ 0.365∗∗∗ 0.350∗∗
(0.131) (0.131) (0.175) (0.191) (0.131) (0.175)
routine cognitive
new technology 0.150∗∗∗ 0.153∗∗∗ 0.137∗∗ 0.185∗∗∗ 0.152∗∗∗ 0.142∗∗
(0.045) (0.045) (0.059) (0.065) (0.045) (0.059)
constant -0.170∗ -0.180∗ -0.239∗ -0.077 -0.168 -0.249∗
(0.102) (0.102) (0.138) (0.149) (0.102) (0.138)
non-routine interactive
new technology 0.191∗∗∗ 0.193∗∗∗ 0.200∗∗∗ 0.179∗∗∗ 0.192∗∗∗ 0.204∗∗∗
(0.040) (0.040) (0.052) (0.062) (0.040) (0.051)
constant -0.946∗∗∗ -0.957∗∗∗ -1.039∗∗∗ -0.996∗∗∗ -0.944∗∗∗ -1.052∗∗∗
(0.091) (0.091) (0.114) (0.149) (0.091) (0.114)
non-routine analytic
new technology 0.213∗∗∗ 0.217∗∗∗ 0.254∗∗∗ 0.137∗ 0.212∗∗∗ 0.260∗∗∗
(0.049) (0.049) (0.062) (0.077) (0.049) (0.062)
constant -0.348∗∗∗ -0.359∗∗∗ -0.156 -0.590∗∗∗ -0.348∗∗∗ -0.169
(0.116) (0.117) (0.153) (0.182) (0.116) (0.153)
N 2516 2521 1391 1126 2517 1396
t-statistics
multitasking 5.82 5.89 4.39 3.86 5.83 4.49
non-routine manual 0.64 0.67 -0.18 1.38 0.64 -0.14
routine manual 0.88 0.91 -0.13 1.79 0.88 -0.09
routine cognitive 3.36 3.43 2.31 2.84 3.40 2.39
non-routine interactive 4.77 4.83 3.89 2.87 4.80 3.96
non-routine analytic 4.37 4.45 4.11 1.78 4.36 4.20
Second stage standardized dependent variable given in column header (absenteeism, presenteeism: binary).Combined: emotional exhaustion, burnout and/or emotional strain. Models include controls for age andgender. IV IT: information technology adoption as instrument. Standard errors in parentheses. Significancelevels ∗ p < 0.1, ∗∗ p < 0.05, ∗∗∗ p < 0.01. Data sources: BIBB/BAuA. Own calculations.
44
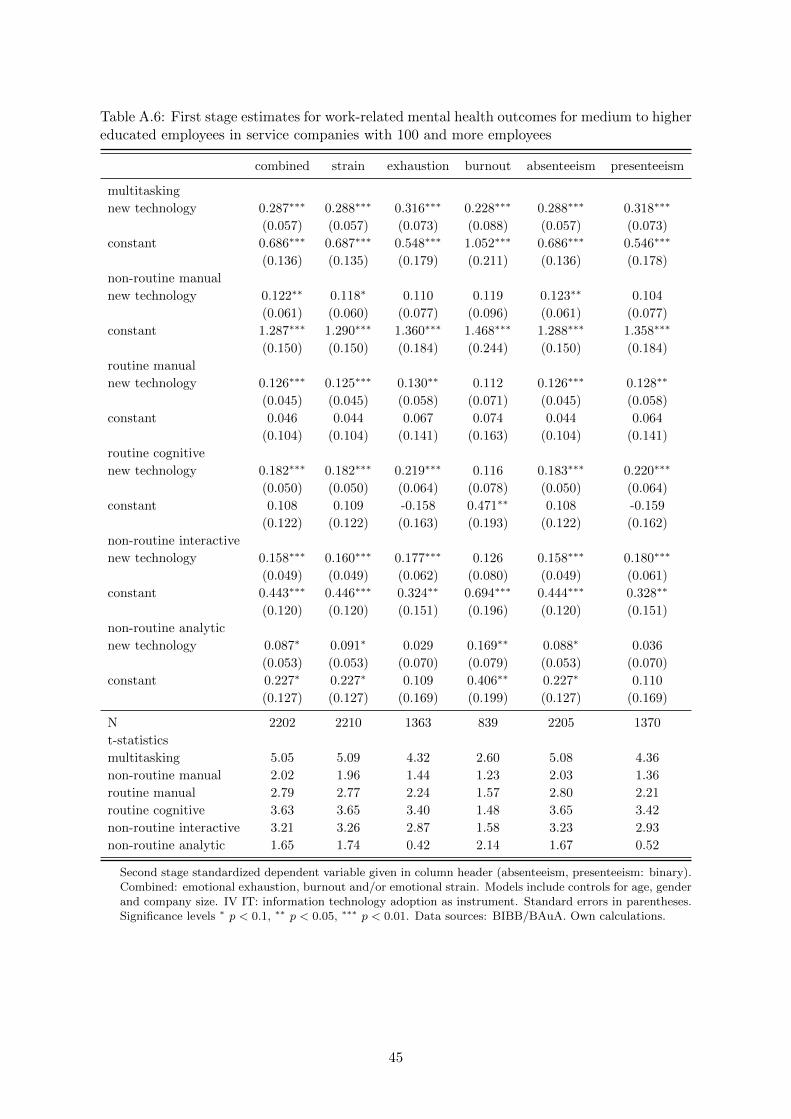
Table A.6: First stage estimates for work-related mental health outcomes for medium to highereducated employees in service companies with 100 and more employees
combined strain exhaustion burnout absenteeism presenteeism
multitasking
new technology 0.287∗∗∗ 0.288∗∗∗ 0.316∗∗∗ 0.228∗∗∗ 0.288∗∗∗ 0.318∗∗∗
(0.057) (0.057) (0.073) (0.088) (0.057) (0.073)
constant 0.686∗∗∗ 0.687∗∗∗ 0.548∗∗∗ 1.052∗∗∗ 0.686∗∗∗ 0.546∗∗∗
(0.136) (0.135) (0.179) (0.211) (0.136) (0.178)
non-routine manual
new technology 0.122∗∗ 0.118∗ 0.110 0.119 0.123∗∗ 0.104
(0.061) (0.060) (0.077) (0.096) (0.061) (0.077)
constant 1.287∗∗∗ 1.290∗∗∗ 1.360∗∗∗ 1.468∗∗∗ 1.288∗∗∗ 1.358∗∗∗
(0.150) (0.150) (0.184) (0.244) (0.150) (0.184)
routine manual
new technology 0.126∗∗∗ 0.125∗∗∗ 0.130∗∗ 0.112 0.126∗∗∗ 0.128∗∗
(0.045) (0.045) (0.058) (0.071) (0.045) (0.058)
constant 0.046 0.044 0.067 0.074 0.044 0.064
(0.104) (0.104) (0.141) (0.163) (0.104) (0.141)
routine cognitive
new technology 0.182∗∗∗ 0.182∗∗∗ 0.219∗∗∗ 0.116 0.183∗∗∗ 0.220∗∗∗
(0.050) (0.050) (0.064) (0.078) (0.050) (0.064)
constant 0.108 0.109 -0.158 0.471∗∗ 0.108 -0.159
(0.122) (0.122) (0.163) (0.193) (0.122) (0.162)
non-routine interactive
new technology 0.158∗∗∗ 0.160∗∗∗ 0.177∗∗∗ 0.126 0.158∗∗∗ 0.180∗∗∗
(0.049) (0.049) (0.062) (0.080) (0.049) (0.061)
constant 0.443∗∗∗ 0.446∗∗∗ 0.324∗∗ 0.694∗∗∗ 0.444∗∗∗ 0.328∗∗
(0.120) (0.120) (0.151) (0.196) (0.120) (0.151)
non-routine analytic
new technology 0.087∗ 0.091∗ 0.029 0.169∗∗ 0.088∗ 0.036
(0.053) (0.053) (0.070) (0.079) (0.053) (0.070)
constant 0.227∗ 0.227∗ 0.109 0.406∗∗ 0.227∗ 0.110
(0.127) (0.127) (0.169) (0.199) (0.127) (0.169)
N 2202 2210 1363 839 2205 1370
t-statistics
multitasking 5.05 5.09 4.32 2.60 5.08 4.36
non-routine manual 2.02 1.96 1.44 1.23 2.03 1.36
routine manual 2.79 2.77 2.24 1.57 2.80 2.21
routine cognitive 3.63 3.65 3.40 1.48 3.65 3.42
non-routine interactive 3.21 3.26 2.87 1.58 3.23 2.93
non-routine analytic 1.65 1.74 0.42 2.14 1.67 0.52
Second stage standardized dependent variable given in column header (absenteeism, presenteeism: binary).Combined: emotional exhaustion, burnout and/or emotional strain. Models include controls for age, genderand company size. IV IT: information technology adoption as instrument. Standard errors in parentheses.Significance levels ∗ p < 0.1, ∗∗ p < 0.05, ∗∗∗ p < 0.01. Data sources: BIBB/BAuA. Own calculations.
45
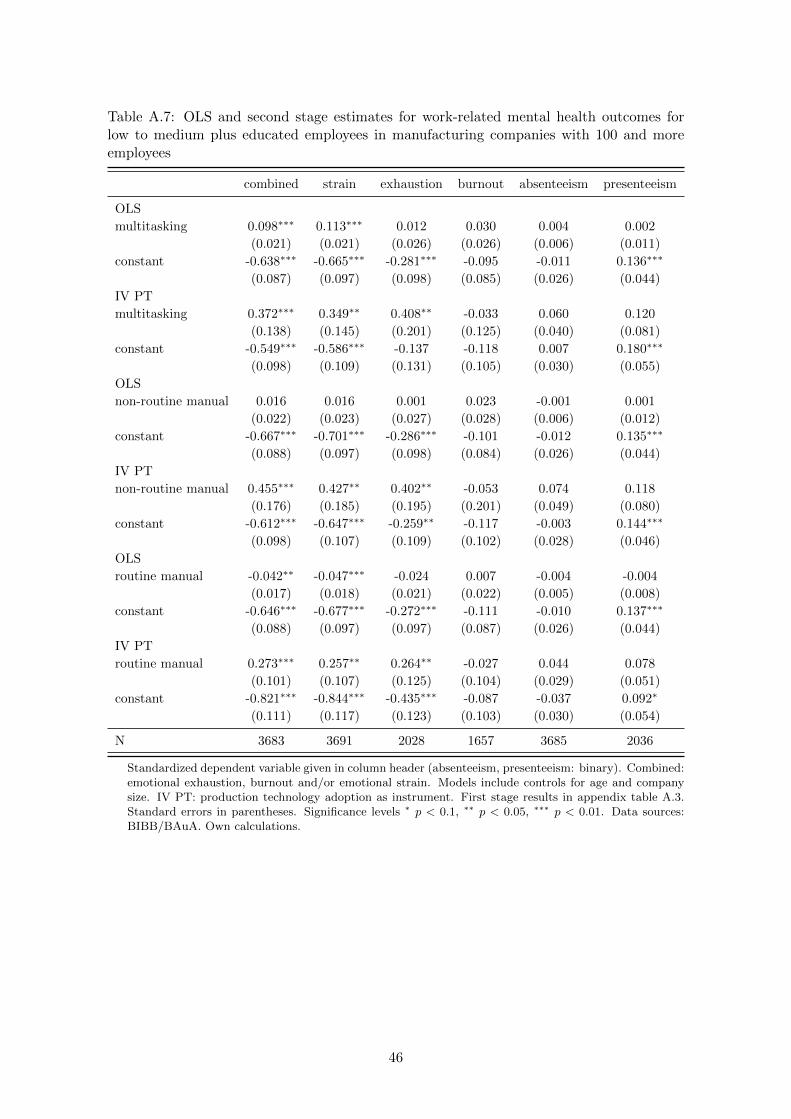
Table A.7: OLS and second stage estimates for work-related mental health outcomes forlow to medium plus educated employees in manufacturing companies with 100 and moreemployees
combined strain exhaustion burnout absenteeism presenteeism
OLS
multitasking 0.098∗∗∗ 0.113∗∗∗ 0.012 0.030 0.004 0.002
(0.021) (0.021) (0.026) (0.026) (0.006) (0.011)
constant -0.638∗∗∗ -0.665∗∗∗ -0.281∗∗∗ -0.095 -0.011 0.136∗∗∗
(0.087) (0.097) (0.098) (0.085) (0.026) (0.044)
IV PT
multitasking 0.372∗∗∗ 0.349∗∗ 0.408∗∗ -0.033 0.060 0.120
(0.138) (0.145) (0.201) (0.125) (0.040) (0.081)
constant -0.549∗∗∗ -0.586∗∗∗ -0.137 -0.118 0.007 0.180∗∗∗
(0.098) (0.109) (0.131) (0.105) (0.030) (0.055)
OLS
non-routine manual 0.016 0.016 0.001 0.023 -0.001 0.001
(0.022) (0.023) (0.027) (0.028) (0.006) (0.012)
constant -0.667∗∗∗ -0.701∗∗∗ -0.286∗∗∗ -0.101 -0.012 0.135∗∗∗
(0.088) (0.097) (0.098) (0.084) (0.026) (0.044)
IV PT
non-routine manual 0.455∗∗∗ 0.427∗∗ 0.402∗∗ -0.053 0.074 0.118
(0.176) (0.185) (0.195) (0.201) (0.049) (0.080)
constant -0.612∗∗∗ -0.647∗∗∗ -0.259∗∗ -0.117 -0.003 0.144∗∗∗
(0.098) (0.107) (0.109) (0.102) (0.028) (0.046)
OLS
routine manual -0.042∗∗ -0.047∗∗∗ -0.024 0.007 -0.004 -0.004
(0.017) (0.018) (0.021) (0.022) (0.005) (0.008)
constant -0.646∗∗∗ -0.677∗∗∗ -0.272∗∗∗ -0.111 -0.010 0.137∗∗∗
(0.088) (0.097) (0.097) (0.087) (0.026) (0.044)
IV PT
routine manual 0.273∗∗∗ 0.257∗∗ 0.264∗∗ -0.027 0.044 0.078
(0.101) (0.107) (0.125) (0.104) (0.029) (0.051)
constant -0.821∗∗∗ -0.844∗∗∗ -0.435∗∗∗ -0.087 -0.037 0.092∗
(0.111) (0.117) (0.123) (0.103) (0.030) (0.054)
N 3683 3691 2028 1657 3685 2036
Standardized dependent variable given in column header (absenteeism, presenteeism: binary). Combined:emotional exhaustion, burnout and/or emotional strain. Models include controls for age and companysize. IV PT: production technology adoption as instrument. First stage results in appendix table A.3.Standard errors in parentheses. Significance levels ∗ p < 0.1, ∗∗ p < 0.05, ∗∗∗ p < 0.01. Data sources:BIBB/BAuA. Own calculations.
46
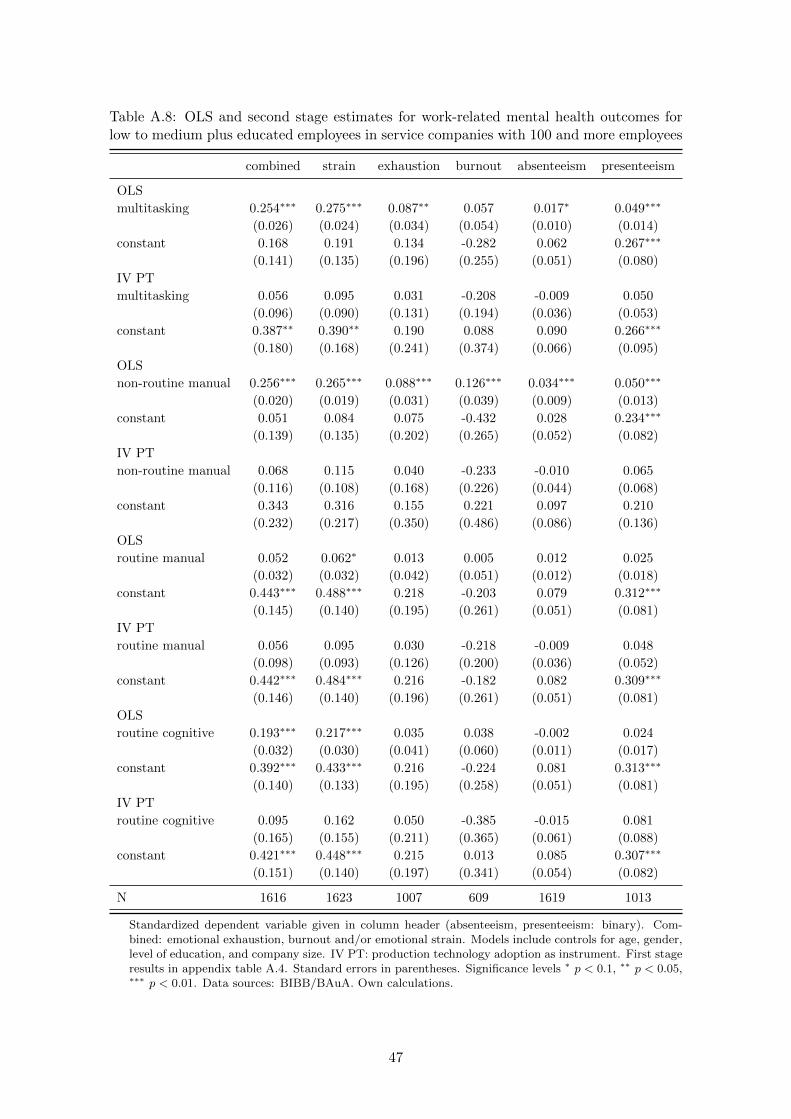
Table A.8: OLS and second stage estimates for work-related mental health outcomes forlow to medium plus educated employees in service companies with 100 and more employees
combined strain exhaustion burnout absenteeism presenteeism
OLS
multitasking 0.254∗∗∗ 0.275∗∗∗ 0.087∗∗ 0.057 0.017∗ 0.049∗∗∗
(0.026) (0.024) (0.034) (0.054) (0.010) (0.014)
constant 0.168 0.191 0.134 -0.282 0.062 0.267∗∗∗
(0.141) (0.135) (0.196) (0.255) (0.051) (0.080)
IV PT
multitasking 0.056 0.095 0.031 -0.208 -0.009 0.050
(0.096) (0.090) (0.131) (0.194) (0.036) (0.053)
constant 0.387∗∗ 0.390∗∗ 0.190 0.088 0.090 0.266∗∗∗
(0.180) (0.168) (0.241) (0.374) (0.066) (0.095)
OLS
non-routine manual 0.256∗∗∗ 0.265∗∗∗ 0.088∗∗∗ 0.126∗∗∗ 0.034∗∗∗ 0.050∗∗∗
(0.020) (0.019) (0.031) (0.039) (0.009) (0.013)
constant 0.051 0.084 0.075 -0.432 0.028 0.234∗∗∗
(0.139) (0.135) (0.202) (0.265) (0.052) (0.082)
IV PT
non-routine manual 0.068 0.115 0.040 -0.233 -0.010 0.065
(0.116) (0.108) (0.168) (0.226) (0.044) (0.068)
constant 0.343 0.316 0.155 0.221 0.097 0.210
(0.232) (0.217) (0.350) (0.486) (0.086) (0.136)
OLS
routine manual 0.052 0.062∗ 0.013 0.005 0.012 0.025
(0.032) (0.032) (0.042) (0.051) (0.012) (0.018)
constant 0.443∗∗∗ 0.488∗∗∗ 0.218 -0.203 0.079 0.312∗∗∗
(0.145) (0.140) (0.195) (0.261) (0.051) (0.081)
IV PT
routine manual 0.056 0.095 0.030 -0.218 -0.009 0.048
(0.098) (0.093) (0.126) (0.200) (0.036) (0.052)
constant 0.442∗∗∗ 0.484∗∗∗ 0.216 -0.182 0.082 0.309∗∗∗
(0.146) (0.140) (0.196) (0.261) (0.051) (0.081)
OLS
routine cognitive 0.193∗∗∗ 0.217∗∗∗ 0.035 0.038 -0.002 0.024
(0.032) (0.030) (0.041) (0.060) (0.011) (0.017)
constant 0.392∗∗∗ 0.433∗∗∗ 0.216 -0.224 0.081 0.313∗∗∗
(0.140) (0.133) (0.195) (0.258) (0.051) (0.081)
IV PT
routine cognitive 0.095 0.162 0.050 -0.385 -0.015 0.081
(0.165) (0.155) (0.211) (0.365) (0.061) (0.088)
constant 0.421∗∗∗ 0.448∗∗∗ 0.215 0.013 0.085 0.307∗∗∗
(0.151) (0.140) (0.197) (0.341) (0.054) (0.082)
N 1616 1623 1007 609 1619 1013
Standardized dependent variable given in column header (absenteeism, presenteeism: binary). Com-bined: emotional exhaustion, burnout and/or emotional strain. Models include controls for age, gender,level of education, and company size. IV PT: production technology adoption as instrument. First stageresults in appendix table A.4. Standard errors in parentheses. Significance levels ∗ p < 0.1, ∗∗ p < 0.05,∗∗∗ p < 0.01. Data sources: BIBB/BAuA. Own calculations.
47

Table A.9: OLS and second stage estimates for work-related mental health outcomesfor employees in manufacturing companies with 500 and more employees
combined strain exhaustion burnout absenteeism presenteeism
OLS
multitasking 0.109∗∗∗ 0.119∗∗∗ 0.033 0.035 0.012 0.010
(0.024) (0.025) (0.032) (0.025) (0.007) (0.014)
constant -0.428∗∗∗ -0.455∗∗∗ -0.218∗ 0.025 0.033 0.107∗∗
(0.102) (0.111) (0.119) (0.099) (0.032) (0.048)
IV IT
multitasking 0.338∗ 0.248 0.251 0.593∗∗∗ 0.160∗∗∗ 0.104
(0.176) (0.182) (0.217) (0.214) (0.059) (0.090)
constant -0.312∗∗ -0.379∗∗∗ -0.117 0.259 0.102∗∗ 0.146∗∗
(0.126) (0.135) (0.161) (0.161) (0.045) (0.066)
N 2516 2521 1391 1126 2517 1396
Standardized dependent variable given in column header (absenteeism, presenteeism: binary).Combined: emotional exhaustion, burnout and/or emotional strain. Models include controls forage and gender. IV IT: information technology adoption as instrument. First stage results inappendix table A.5. Standard errors in parentheses. Significance levels ∗ p < 0.1, ∗∗ p < 0.05,∗∗∗ p < 0.01. Data sources: BIBB/BAuA. Own calculations.
Table A.10: OLS and second stage estimates for work-related mental health outcomesfor medium to higher educated employees in service companies with 100 and moreemployees
combined strain exhaustion burnout absenteeism presenteeism
OLS
multitasking 0.243∗∗∗ 0.259∗∗∗ 0.107∗∗∗ 0.036 0.021∗∗ 0.050∗∗∗
(0.022) (0.021) (0.031) (0.045) (0.009) (0.012)
constant 0.181 0.184 0.033 0.038 0.074∗ 0.245∗∗∗
(0.124) (0.118) (0.168) (0.234) (0.043) (0.068)
IV2
multitasking 0.226 0.269 -0.109 0.272 -0.060 -0.009
(0.178) (0.167) (0.228) (0.437) (0.068) (0.090)
constant 0.205 0.175 0.205 -0.238 0.149∗∗ 0.293∗∗∗
(0.204) (0.192) (0.248) (0.546) (0.072) (0.094)
N 2202 2210 1363 839 2205 1370
Standardized dependent variable given in column header (absenteeism, presenteeism: binary).Combined: emotional exhaustion, burnout and/or emotional strain. Models include controls forage, gender and company size. IV2: information technology adoption as instrument. First stageresults in appendix table A.6. Standard errors in parentheses. Significance levels ∗ p < 0.1, ∗∗
p < 0.05, ∗∗∗ p < 0.01. Data sources: BIBB/ BAuA. Own calculations.
48
Related Documents