CAPIT AL GROWTH CONSTRAINTS OF MICRO AND SMALL ENTERPRISES: THE CASE OF JIMMA TOWN· Thesis Submitted to the Department of Accounting and Finance in Partial Fulfillment of the Requirements for Master of Science (MSc) Degree in Accounting and Finance By: Esmael Sanbi Advisor: Arega Seyoum Asfaw (PhD Co-Advisor: Mr. Yebeltal Ayalew JIMMA UNIVERSITY COLLEGE OF BUSINESS AND ECONOMICS DEPARTMENT OF ACCOUNTING & FINANCE June 2014 Jimma, Ethiopia

Welcome message from author
This document is posted to help you gain knowledge. Please leave a comment to let me know what you think about it! Share it to your friends and learn new things together.
Transcript
CAPIT AL GROWTH CONSTRAINTS OF MICRO AND SMALL
ENTERPRISES: THE CASE OF JIMMA TOWN·
Thesis Submitted to the Department of Accounting and Finance in Partial
Fulfillment of the Requirements for Master of Science (MSc) Degree in
Accounting and Finance
By: Esmael Sanbi
Advisor: Arega Seyoum Asfaw (PhD
Co-Advisor: Mr. Yebeltal Ayalew
JIMMA UNIVERSITY
COLLEGE OF BUSINESS AND ECONOMICS
DEPARTMENT OF ACCOUNTING & FINANCE
June 2014
Jimma, Ethiopia
,
·GROWTH CONSTRAINTS OF MICRO AND SMALL
ENTERPRISES: THE CASE OF JIMMA TOWN
By:
Esmael San bi
Approved By the Board of Examiners
Name Signature Date
1. External Examiner j) r· flL?"LJ Of6)::.oL _~~_----"
2. Internal Examiner ILk A fa ~l' G tL-&hfJl/1.~~'-----7~~,rl/'1::r-=~-f:-'-'L
3. Main Advisor Dr. APE bA S-.
4. Co-Advisor ~..e.mA I
JIMMA UNIVERSITY
COLLEGE ()F BUSINESS AND ECONOMICS
DEPARTMENT OF ACCOUNTING & FINANCE
CAPITAL GROWTH CONSTRAINTS OF MICRO AND SMALL
ENTERPRISES: THE CASE OF JIMMA TOWN
A Thesis Submitted to the Department of Accounting and Finance of Jimma
tJ niversity in Partial Fulfillment of the Requirements for Master of Science
(MSc) Degree in Accounting and Finance
By:
Esmael Sanbi
June 2014
Jimma, Ethiopia
Declaration
L the undersigned, declare that this paper prepared for the partial fulfillment of the requirements
for Msc Degree in Accounting and Finance entitled "Performance Constraints of Micro and
Small Enterprises: The Case of Jimma Town" is prepared with my own effort. I have made it
independently with the close advice and guidance of my advisor. This study has not been
submitted for any degree or diploma program in this or any other institutions and that all
sources of materials used for the thesis have been duly acknowledged.
Declared by: Esmael Sanbi
Signature:-----=~~~----------
Place: Jimma, Ethiopia
Signature:~~~~ _
Advisor: Arega Seyoum
June 2014
Jimma, Ethiopia
Abstract
The development of MSEs has been identified as one of the strategies for the country's
industrialization, employment generation and poverty reduction. Despite the increased number
of MSEs in Ethiopia, the rate of MSE failure is alarming. It is expected that MSEs possess
distinct skills found to have greater effect on their performances for their development. The aim
ofthis study was to investigate the major performance determinants of micro and small scale
enterprises in Jimma town. To achieve this purpose, descriptive research method was designed
in order to identify the internal and external factors that affect the capital growth of MSEs.
Mixed approach was used for answering research questions. 244 MSEs owners were selected by
using stratified random sampling from three sub-cities. In the process of answering the basic
questions, structured questionnaire that include demographic profiles, characteristics of MSE
owners and their enterprises, determinants that affect the performance of Micro and small
entrepreneurs was designed in open-ended, closed ended and likert scales. In addition, semi-
structured interviews were conducted with top officials of the TVET, MSEDO, and OCSSCO)
were included in the study. Descriptive statistics involved the use of frequencies and mean.
Inferential statistics were used to observe the variation in the growth of capital among the
different levels of each of the explanatory variables with the aid of SPSS. Multiple Regression
Model is used to test the hypotheses stated in this study regarding the performance of enterprises
in relation to each of the independent variables of the study. The R2 result shows that there is a
significant strong and linear relationship between the dependent variable growth of capital and
the independent variables. Accordingly, result of the study indicates that access of credit has the
biggest potential to contribute to the performance, followed by working premise, internal
finance, infrastructural access, management skill, access of market, access of training,
government policy and accounting and record keeping skill. The study also attempted to forward
some possible recommendations. These among others include: MSE Owners," they have to
develop their management, accounting, entrepreneurial and technical skill through training.
ORMSEDA; should maintain special lending services to MSE. MSEDO Officers; should discuss
with municipality manager and other administrative bodies to avoid the problem working
premise and create market linkage, promotion and display places. OCSSCO should maintain
individual lending systems and minimize the interest rates that they charge to MSEs. TVET
Officers should facilitate both technical and entrepreneurial skill training.

ACKNOWLEDGMENTS
First and foremost I am extremely grateful to thank the Almighty Allah, my savior, who has been
with me in all ups and downs from the beginning to the completion of my study.
My profound thanks go to my research advisor, Arega Seyoum Asfaw (PhD) whose valuable
assistance, guidance, comments and encouragements made this work a success and the time was
a golden opportunity to get better understanding in conducting research. First, my sincere thanks
go to my friend Addisalem Asefa for his immeasurable support and providing all necessary
material from beginning till now. I would like to extend my heartfelt gratitude to Abdulla Indris,
for his positive cooperation in providing me LC.
I am very grateful to thank Ato Faruk Aba Dura head of Jimma ZoFED; Tijani Mohammed and
Mohammed Jamal and Feid Taju Kersa Wereda Administer, head of OPDO and WoFED
respectively. Had it not been for all moral and financial encouragement and support of these
organizations, I would not have been able to realize this vision. I am very much thankful to
Jimma University, College of Business and Economics, Department of Accounting and Finance
the overall staff members of 20 13/14.
It is hardly possible to find appropriate words, and no amount of expression can describe enough
myIarnily's care and support from the babyhood until now. I never forget especially my mother
Merdia Aba Garo's golden words "Education First My Son", and my grandmother Gartiti's
encouragements. I am also grateful to my wife Fakiya Haji Idris, my daughters Rahmet, Ekram,
Iman and Hanan Esmael for their collaboration. My brothers' Mifta Aba Moga, Mohammed Aba
Giddi and all their families. Parallel to this, I would like to thank my friends indeed: Fikre
Awulacho and others whose name were not mentioned in here.
Last but not least, I am also greatly indebted to Jimma Town and Jimma Zone Micro and Small
enterprise Development Office, for making available all the information necessary for the
completion of the thesis. Finally, I am very thankful to every individual who have been
supporting me from the beginning of my study until this time because of their place and role in
the process. Allah richly blesses you!' A friend inneed is a friend indeed]!
ii
Table of contents
Contents PageAbstract i
Table of contents iii
Lists of Tables v
Lists of Figures vi
ACRO VMS AND ABBREVIATIONS vii
CHAPTER ONE 1
1. INTR 0 D UCTI ON-------------------------------------------------------------------------------------------- 1
I. I Background of the Study 1
1.2 Statement of the Problem 4
1.3 Objectives of the Study 5
1.4 Research Hypothesis 6
1.5 Significance of the Study 7
1.6 Scope of the Study 8
I .7 Organ ization of the Thesis 8
, -1.8 Operational Definitions of Terms 8
CHAPTER TWO 11
2. REVIEW OF RELATED LITERA TURE--------------------------------------------------------11
2.1. Theoretical Literature Review 11
2.2 Previous Studies Relation to MSE Performance Constraint 22
2.3 Conclusions and Knowledge Gap 28
CHAPTER THREE 30
3. RESEARCH DESIGN AND METHODOLOGY ----------------------------------------------- 30
3.1 Introduction 30
3.2 Research Approaches 30
3.3 Sample Design 31
3.4 Variables and Measures 32
3.5 Data Sources, Gathering Instruments and Procedures 37
3.6 Research Quality Issues 39
3.7 Ethical Considerations 39
iii
3.8 Data Analysis Techniques 40
3.9 Model Specification 40
3.10 The Study Area Profile 42
3.11 Limitations of the Study : 44
CI-IAPTER FOUR 45
4. DATA PRESENTATION, ANALYSIS AND INTERPRETA TION------------------------ 45
4.1 Introduction 45
4.2 Data Presentation and Analysis 46
4.3 Major Detennents of Micro and Small Scale Enterprises Performance 50
4.3.2 Results of Inferential Statistics 63
CHAPTER FIVE 67
5. SUMMARY, CONCLUSIONS AND RECOMMENDATIONS----------------------------- 67
5.1 Summary 67
5.2 Conclusions 69
5.3 Recommendations 71
References 73
Appendix 1 a
Appendix 2 f
Appendix 3 g
Appendix 4 h
Appendix 5 i
Appendix 6 10j
iv
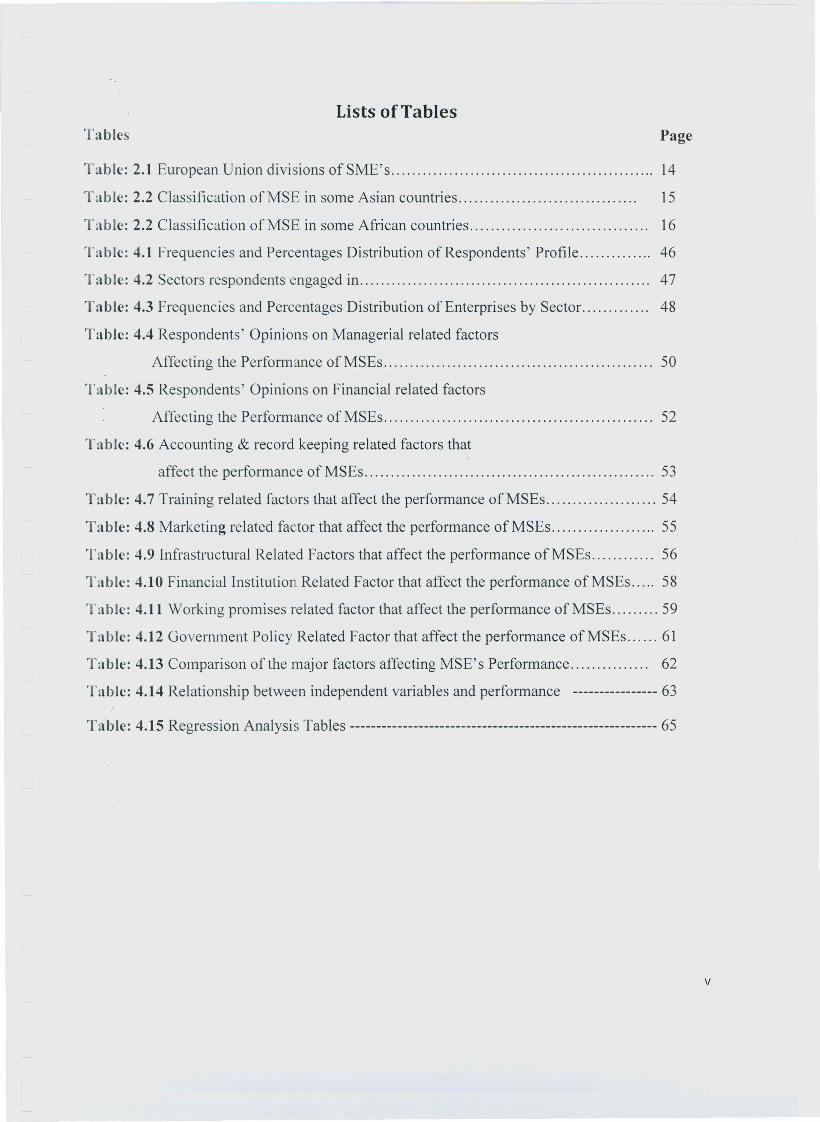
Lists of TablesTables Page
Table: 2.1 European Union divisions of SME's 14
Table: 2.2 Classification ofMSE in some Asian countries.................................. 15
Table: 2.2 Classification ofMSE in some African countries.................................. 16
Table: 4.1 Frequencies and Percentages Distribution of Respondents' Profile 46
Table: 4.2 Sectors respondents engaged in 47
Table: 4.3 Frequencies and Percentages Distribution of Enterprises by Sector...... 48
Table: 4.4 Respondents' Opinions on Managerial related factors
Affecting the Performance ofMSEs 50
Table: 4.5 Respondents' Opinions on Financial related factors
Affecting the Performance ofMSEs 52
Table: 4.6 Accounting & record keeping related factors that,
affect the performance of MSEs 53
Table: 4.7 Training related factors that affect the performance ofMSEs 54
Table: 4.8 Marketing related factor that affect the performance ofMSEs 55
Table: 4.9 Infrastructural Related Factors that affect the performance ofMSEs 56
Table: 4.10 Financial Institution Related Factor that affect the performance ofMSEs 58
Table: 4.11 Working promises related factor that affect the performance ofMSEs 59
Table: 4.12 Government Policy Related Factor that affect the performance ofMSEs 61
Table: 4.13 Comparison of the major factors affecting MSE's Performance............... 62
Table: 4.14 Relationship between independent variables and performance ---------------- 63
Ta ble: 4.15 Regression Analysis Tables ---------------------------------------------------------- 65
v

Lists of FiguresFigure 1: Location of the Study Area - Jimma Town .43
vi
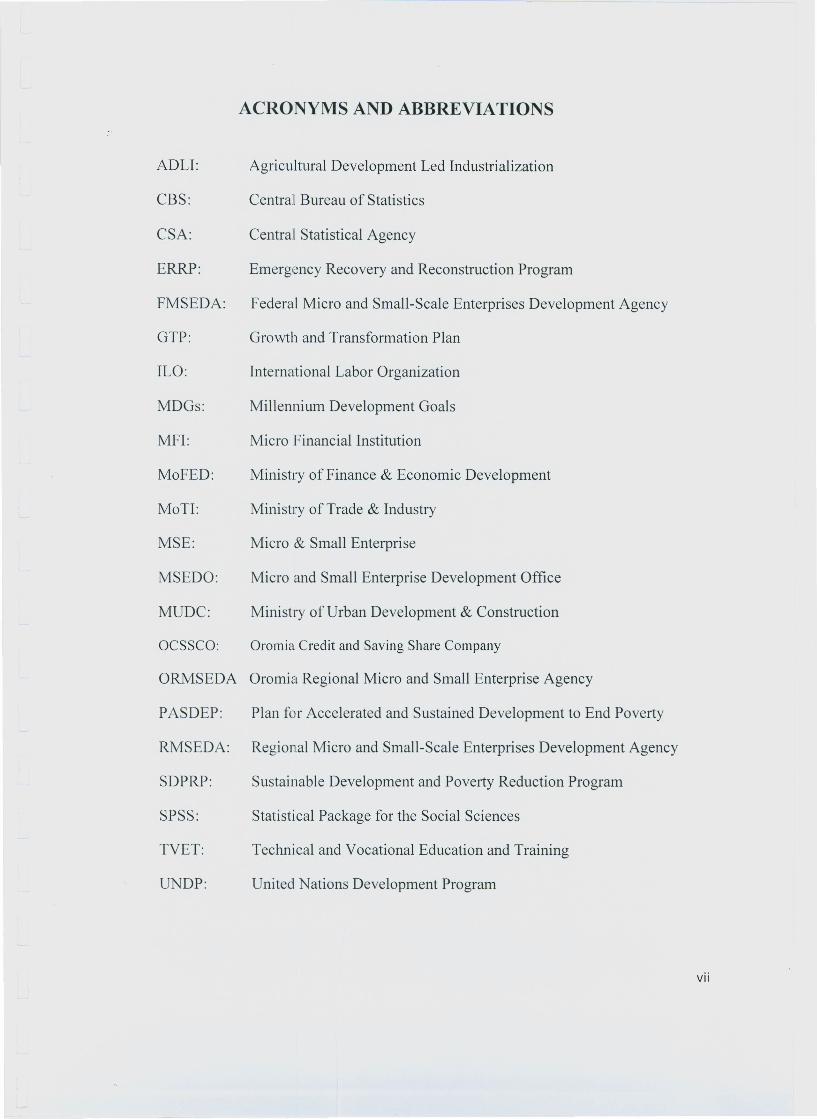
ADLI:
CBS:
CSA:
ERRP:
FMSEDA:
GTP:
ILO:
MDGs:
MFI:
MoFED:
MoTI:
MSE:
MSEDO:
MUDC:
ocssco
ACRONYMS AND ABBREVIATIONS
Agricultural Development Led Industrialization
Centra! Bureau of Statistics
Central Statistical Agency
Emergency Recovery and Reconstruction Program
Federal Micro and Small-Scale Enterprises Development Agency
Growth and Transformation Plan
International Labor Organization
Millenni urn Development Goals
Micro Financial Institution
Ministry of Finance & Economic Development
Ministry of Trade & Industry
Micro & Small Enterprise
Micro and Small Enterprise Development Office
Ministry of Urban Development & Construction
Oromia Credit and Saving Share Company
ORMSEDA Orornia Regional Micro and Small Enterprise Agency
PASDEP: Plan for Accelerated and Sustained Development to End Poverty
RMSEDA: Regional Micro and Small-Scale Enterprises Development Agency
SDPRP: Sustainable Development and Poverty Reduction Program
SPSS: Statistical Package for the Social Sciences
TVET: Technical and Vocational Education and Training
UNDP: United Nations Development Program
vii
CHAPTER ONE
1. INTRODUCTION
1.1 Background of the Study
Micro and Small-scale enterprise sector plays a dominant role in the economic development of
both developed and developing countries. In developing countries small-scale industries are
especially important in context of employment opportunities, equitable distribution of national
income, balanced .regional growth and development of rural and semi urban areas. Small-scale
('1 uerprise provide immediate large-scale employment, offer a method of ensuring a more
equitable distribution of the national income and facilitate effective mobilization of resources of
capital and skill which might otherwise remain unutilized.
f\ Iicro and small enterprises (MSEs) are strong driving forces for their industrial growth and indeed,
\ crull economic development. The smallest in this group of enterprises micro enterprises, are also
advertized as an absolute tool for attaining the first goal, one of the eight millennium development goals
or eradicating extreme poverty and hunger in the latter. The goal has two associated targets: reducing by
half the proportion of people living in extreme poverty, defined as $1 per day, and reducing by half the
proportion of people who suffer from hunger by 2015. Poverty is caused by inadequate incomes and
incomes result from employment which MSEs are widely known to provide (ILO, 2006).
In the modern economy, Micro and Small Scale Industries (MSIs) in the industrialization process
have gained much prominence in developing countries. Their importance came into the attention
i~l the late 1970s and early 1980s due to the economic recession which led to the decline of
industrial growth and employment in many developing countries especially in Africa.
Governments of such countries adopted a new policy approach towards the Small Scale
Industries (SSIs) because of their promise to adapt flexibly to the unprecedented foreign
cvchange constraints. They were seen as providing a viable alternative to the large scale
industries which were so dependent on foreign exchange. The contribution of MSEs to the
national economy is potentially very large and is seen in the contribution to the Gross Domestic
Product (GDP) (Basu, Blavy and Yulek, 2004).
1
Lvidences abound that in regions or economies where enterprises have been actively promoted
and encouraged, their poverty rates have declined. This is especially true of Asia whereas in sub-
Saharan Africa, more and more people have sunk deep into poverty. Their importance came into
the attention in the late 1970s and early 1980s due to the economic recession which led to the
decline of industrial growth and employment in many developing countries especially in Africa.
India, for instance, illustrates a model of bottom-up, demand driven, grass root-led economy
depending much on local entrepreneurial energy and less on foreign direct investment. Her
economic growth projected to be among the fastest in region is expected to be achieved via a
) oung confident population as it releases its creative entrepreneurial energies. It is thus believed
that India through its young population has great raw potential for high economic growth.
L'thiopia shares much in common with India in that they being endowed with a young vibrant
population whose entrepreneurial growth. However, this will only become a reality if the
necessary imperatives are in place to actively and consciously promote youth entrepreneurship
using MSEs as the appropriate vehicles. Youth entrepreneurship has become more imperative
now than ever before considering the high rate of youth unemployment situation in Ethiopia. The
conseq uences of youth unemployment are too serious to be toyed with.
111 Ethiopia poverty is widespread and remains a major challenge of sustainable development and
stability. It is estimated that close to half of the population in urban and rural areas of the country
Iivc ill absolute poverty due to lack of economic opportunities, governance crisis, inadequate
basic household income and poor means of survival (Mammo, 2008; Serneels, 2004). Although,
a growing number of researchers have suggested that the prospect of development in the
agricultural sector tends to increase along with development in the micro and small enterprises
(\lSEs) sector, until recently, MSEs have not been a major area of focus in Ethiopia
(Alcrnayehu, 2006) but the existing government has issued a national MSEs development
strategy for the promotion of MSEs in 1997 and established a well concerned institution for the
sector by the Council of Ministers of Ethiopian Regulation No 33/1998 on April 3, 1998. In
developing countries, the informal sector that mainly constitutes micro enterprises is the major
source of employment and income for the urban population.
2
The Ethiopian government has long recognized the important contribution that small and micro
enterprises can make in poverty reduction, employment creation and private sector development.
Micro and small enterprises offer both a safety valve for the survival of workers that is available
to 'find steady wage employment and opportunity for the poor entrepreneurs to raise their capital
and income. These enterprises also offer a vehicle for acquiring and applying skills to raise
productivity and private sector growth, providing better wage earning opportunities for the poor,
\\ hiIe raising national income.
Due to the sever poverty and ever increasing unemployment in Ethiopia, the FDRE has
undertaken different measures starting promulgation of laws to establishment of executives
starting from federal to grass root level to enhance the strength and competence of MSEs and
also different micro finance institutions are providing credit for these enterprises. The
government has long recognized the important contribution that small and micro enterprises can
make in poverty reduction, employment creation and private sector development. Micro and
small enterprises offer both a safety valve for the survival of workers that is available to find
steady wage employment and opportunity for the poor entrepreneurs to raise their capital and
income, These enterprises also offer a vehicle for acquiring and applying skills to raise
, productivity and private sector growth, providing better wage earning opportunities for the poor,
\ hile raising national income. Due to these reasons and based on the government strategy of
cupacny building in public and private sectors, donors as well as national governments have
attempted to promote micro and small enterprises through support for financial and non-financial
services appropriate for them (Solomon, 2007).
1\Iicro and small scale enterprise is the second largest employment-generating sector following
agriculture (CSA, 2005:34-35). A national survey conducted by Ethiopian Central Statistical
Authority (CSA) in 2005 in 48 major towns indicates that nearly 585,000 and 3,000 operators
engaged in micro and small scale manufacturing industries respectively, which absorb about
7<-1-0,000labor forces. Accordingly, the whole labor force engaged in the micro enterprises and
small scale manufacturing industries is more than eight folds (740,000 persons) to that of the
medium and large scale manufacturing industries (90,000 persons). This is a contribution of
3.-1-%to GDP, 33% of the industrial sector's contribution and 52% of the manufacturing sector's
3
'I here lore. the MES development is the strategic focus of the industrial development during the
Growth and Transformation Plan (GTP) period. The expansion of MSEs in urban area will also
result in large scale job creation and thereby poverty reduction. The development of MSEs is
also critical for strengthening sustainable rural-urban and urban-to-urban functional and
economic linkages (GTP, 2010).
Despite undisputable contribution of MESs to the overall economic development of the country,
they are entangled in varied problems of varied degrees and complexity like those in other
developing economies globally. Their problems include: access of finance, entrepreneurship
Skills. Access to land, Tax administration, Skills of workers, managerial skills, and training
opportunities and high cost of inputs and working capital, (Cook and Nixson, 2000). Hence, this
study will show the major constraints that hold back the performance of MSEs in Jimma town.
1.2 Statement of the Problem
Poverty and unemployment are the deep rooted problem of many developing countries
particularly in Ethiopia. The Ethiopian national economy is characterized by trick of problems
which has constituted a sleepless night to developmental oriented governance. The most
disturbing thing in the country is the poverty and endanger of unemployment. Rapid increase of
tile I.opulation in relation to the sluggish economic growth aggravated the intensity of poverty for
many years, with a considerable difference in different parts of the country. Although urban
lthiopians generally enjoy a higher standard of living when compared to their rural counterparts,
poverty and unemployment remains a problem in urban areas (Tadesse, 1999).
Micro and small enterprises (MSEs) have a tremendous potential to eradicate poverty and
generate employment for the majority of the urban labor force. They are also important sources
of income not only for those people who could not find employment in other sectors but also
provide supplement to falling incomes of low wage earners. Hence in the study area, MSEs are
operating in manufacturing, service, trade, construction, urban agriculture activities.
The government of Ethiopia has designed different strategies in order to reduce the mismatch
between the large number of population-with high unemployment rate, and level of the economy
to absorb labor. In the poverty reduction strategy micro and small enterprises are a special focus
or the government, in view of the fact that, they create job opportunities for jobless people,
4
reduce disparities of income distribution and hence maintain fair economic growth. The five year
GIP also gives priorities to MSEs for the deliberate revolution and development of the Ethiopian
industrial sector. Since 2003, Ethiopia has been vigorously struggling to realize in favor of poor
cvelopment through growth in the industrial sector. However, a knowledge gap exists regarding
appropriate approaches for sector growth with respect to industrial development.
The internal and external constraints faces in their operations are hostile and this has had a
negative impact on their development and also limited their potential to drive the national
economy as expected. This is distressing for a developing economy without the requisite
infrastructure and technology to attract big businesses in large numbers. In Ethiopia particularly
Oromia Regional State, lack of clear and accurate MSEs's problems is a major stumbling block
to offer more effective policies and support schemes to promote the development of MSE's. In
order to develop effective interventions for the small business sector, it is important to have an
understanding of the sector, the specific challenges faced by MSE owners and the capacity they
have to deal with those challenges (FinScope. 2010: 1).
Consequently this paper has an objective to investigate factors that affect the capital growth of
MSEs which have a powerful effect for rapid economic growth of a country. Besides, unless the
constraints are not known and solved the visions of the existing MSEs would questionable.
This study was deeming to identify the internal and external constraints that affect the MSEs'
performance in case 0 Jimma town.
In light of this, the study attempts to answer the following basic questions:
I. What internal and the external constraints affect the capital growth ofMSEs?
') What strategies should be employed to minimize those constraints?
1.3 Objectives of the Study
1.3.1 General Objective
The overall objective of the survey was analyzing factors that affect the capital growth of MSEs
found in Jimma town through sample survey.
5
1.3.2 Specific Objectives
Specifically the study attempted:
1, Find out internal constraints that hamper the capital growth of MSEs,
I Fi nd out external constraints that hamper the capital growth of MSEs and
3, Forward possible recommendations that would help MSE's capital growth.
1.4 Research Hypothesis
\\'ith the help of sufficient and appropriate empirical data on the independent variables and the
dependent variable of the study the following hypotheses were developed and tested using
multiple regression analysis technique.
Hypothesis 1:
There is no significant relationship between the performances of enterprise and management skill.
Hypothesis 2:
Tile! e is no significant relationship between performances of enterprise and access of internal
iinance.
Hypothesis 3:
There is no significant relationship between performances of enterprise and accounting and
record keeping skill.
Hypothesis 4:
Tnci e is no significance relationship between performance of enterprise and access of training.
Hypothesis 5:
There is no significance relationship between performance of enterprises and marketing skill of
MSE owners,
Hypothesis 6:
6
There is no significance relationship between performance of enterprise and the infra structural
access.
Hypothesis 7:
There is no significance relationship between performance of enterprise and the access of credit by
financial institutions.
Hypothesis 8:
There is no significance relationship between performance of enterprise and the working premise.
Hypothesis 9:
There is no significance relationship between performance of the enterprise and government
policy.
1.5 Significance of the Study
The rationale for selecting this study was based on an appreciation that the findings of a study
\ hich aims MSE sector which have meaningful results on the economic development, reducing
poverty, minimizing unemployment rate and enabling the sustainable industrial development to
the country economy. Secondly, the result will help Micro and Small Scale Development Office
(f\lS EDO), Micro finance institutions, Jimma Town: Administration, Women and Children
i\ flairs, Youth and Sport Affair, Technical and Vocational Education and Training (TVET),
Trade and Market Development and other concerned bodies. Thirdly, this study will assist
academicians in broadening the catalog with respect to capital growth constraints of MSEs.
Fourthly, it will assist the government in policy formulation and development of framework for
the internal and external constraints that affect the performance of MSE. Moreover, the findings
or this study will help the policy makers as well as financial institutions in regulating rules and
regu lations that encourage the developments of MSE.
7
1.6 S 'ope of the Study
Scope of the study looked at from various perspectives which could be in terms of areas of
coverage as related to the subject matter and viewpoints of geographical reach within a given
time and budget limit allocated for the assignment. Accordingly, the study outlines its scope only
to those MSEs, according to the definition of 2011 MSE strategy. Also it takes the sample of the
study only from those MSEs operating in and those involving in five sectors. The survey covers
three sub cities of the Jimma Town Administration with a total sample size of 244 MSEs
operating in these areas. Though there are various issues that can be researched in relation to
1"SLs, the analysis was delimited to the internal and external environments which affect the
MSI:s capital growth. In addition, the scope of this study was spread across five manufacturing,
construction, service trade and urban agriculture sectors.
1. 7 Organization of the Thesis
The paper organized as follows: The first chapter is an introduction which consists of
background of the study, statement of the problem, research questions, objectives, hypotheses,
significance and scopes of the study. The second chapter presents the theoretical and empirical
literature related to the study, while chapter three provides research methodology considerations
of the study, including discussions around the conceptual framework, the approaches used for the
samp] ing procedures and the data collection procedures used and data analysis techniques.
Chapter four outlines data presentation, analysis and interpretation. Chapter five conclude and
suggest some recommendations and drawing policy implications based on the study's findings.
1.8 Operational Definitions of Terms
1\ is necessary to have definitions of terms and concepts as used in this survey for better clarity
ami understandings. Hence clarifications and definitions of selected terms and concepts as used
in this research with brief looks into their equivalent usages in the policies and legal documents
or the country are given.
8
According to the terms and concepts given by MSE strategy of 20 11 :
Enterprise: an undertaking engaged in production and/or distribution-of goods & services for
commercial benefits, beyond subsistence (household) consumption at the household level. An
enterprise might be owned and operated by a single household, or by several households jointly
011 a partnership basis or by any institutional body.
Micro Enterprise: when the numbers of its employees (including the owner or family) are not
greater than 5 & total asset is :S 100,000 ETB for industrial sector and :S50,000 ETB for service
sector.
Small Enterprise: an enterprise with 6-30 employees & total asset 100,001 to 1,500,000 ETB
for industrial sector and 50,001 to 500,000 ETB for service sector.
Growth oriented Micro and Small Enterprises (MSEs): are MSEs engaged in production of
goods and services in the sectors given priorities in the economic development of the country in
most policy and strategy documents of the government (e.g., MoFED, GTP, 2010). The GTP
identifies sectors like, construction, metal and woodworking, textile and garments, leather and
foot wear, agro-processing, roads & other infrastructures as growth oriented sectors in which
MSEs are also have considerable parts (MoFED, GTP, 2010).
Retail trade is defined as the re-sale (sale without transformation) of new and used goods to the
general public, for personal or household consumption or utilization.
II tcrnal finance: the sources of finance that are generated by MSE owners from their own
capi tal (personal saving, retained profit and sales of assets) source.
External finance: the sources of finance that are generated in from of debt from formal financial
institutions like bank and micro finance institutions or from informal Iqub, Idir, family, Arata
and other sources.
Initial Capital: is defined here as "the original investment or money used to start the enterprise".
These initial funds, or capital, may come from microfinance loan, city government grant, owner's
personal savings, or any other relatives and family contributions.
9
Current capital: is the part of enterprise's capital available during the survey. Usually it IS
understood as a current asset minus current liabilities.
Constraints: both the internal and external factors that affect the capital growth of MSEs.
Micro finance: refers to the provision of financial services to low-income clients, including
consumers and the self-employed (Ethiopia Ministry of Trade and Industry, 2003).
C 1'0\\ th of Capital: current capital minus initial capital.
Supports: training, machinery, financial, raw material and facility assistances that TVETs
provide to MSEs.
10
CHAPTER TWO
2. REVIEW OF RELA TED LITERATURE
Several factors can influence the performance of MSE's. Recognizing and understanding the
underlying concepts and definitions of the MSE sector is essential in order to state results and
analyses. Hence chapter two serves as background for this study by describing concepts of MSE
performance and factors that could influence MSE's performance. In light of this, the purpose of
this chapter is to review the literatures related to MSE performance constraints'. The chapter has
three sections. Section 2.1 covers theoretical literature review, section 2.2 cover reviews of prior
empirical studies including Ethiopia and section 2.3 provides conclusion and knowledge gap.
2.1. Theoretical Literature Review
2.1.1 The Role of MSEs
1n 1110st fast developing countries, MSEs by virtue of their size, location, capital investment and
their capacity to generate greater employment have proved their powerful driving effect for rapid
economic growth. The sector is also known as an instrument in bringing about economic
transition by effectively using the skill and talent of the people without requesting high level
training, much capital and sophisticated technology. Moreover, they create job opportunities for
a substantial segment of the population. Hence the sector is a quick remedy for unemployment
problem. direct intervention and support of the government is crucial to facilitate the
em ironment for new job seekers and ease self employment.
The Government of Ethiopia recognized the contribution of the MSE sector. It has recognized
and paid due attention to the promotion and development of MSEs for they are important
vehicles to address the challenges of unemployment, economic growth and equity in the country.
To this effect, it has formulated a National MSE Development and Promotion Strategy in 1997,
\\ hich enlightens a systematic approach to alleviate the problems and promote the growth of
MSEs. The overall objective of the strategy is to create an enabling environment for MSEs. with
11
specific objectives to facilitate economic growth; bring equitable development; create long-term
jobs: strengthen cooperation between MSEs; provide the basis for medium and large-scale
enterprises; promote export; balance preferential treatment between MSEs & bigger enterprises.
According to the survey conducted by CSA in 1997, sighted in CLEP, 2006) within the MSE
sector, micro enterprises (handicraft and informal operators) account for 99.8% of total
establishments, 99.6% of employment and 94.7% of gross value of production and 95.1 % of the
\ alue added. Small scale manufacturing industries (SSMI) are mainly engaged in the
manufacturing of food, fabricated metal, furniture and wearing apparels, which constitute more
than 85% of the SSM!.
The 2009 National Employment Policy and Strategy of Ethiopia gave emphasis to promote small
ami micro enterprises is high on the agenda of the Ethiopian government in terms of its policy
framework for private sector development. Despite encouraging improvements in a number of
areas. policy innovations are still required to improve the business climate and address
bureaucratic hurdles. A particular focus should be given to improving access to business land,
simplifying and using the tax system to ensure competitiveness, enhancing access to credit, and
impro -ing infrastructure services. Improving the legal and administrative framework would
accelerate private investment and thereby help generate more productive employment.
jv1SEs are important sector for majority people who have low capital and skill to work together in
a form of cooperative and also the sector used as a linkage of different levels of sectors in which
the access of job opportunity was facilitated. Also many operators have joined the MSE business
to get job opportunity and income, and to develop their capacity in their area of living. The
development of MSE sector directly or indirectly contributes to the reduction of poverty through
improving the operators' socio-economic conditions, and consequently contributes to the
development of the city. Thoug the MSE sector has these roles, in order to utilize these MSE
potentials, it calls for high efforts the support of different institutions/organizations for the
success of MSEs growths.
]n developing economies like Ethiopia, where agriculture plays a predominant role in the
economy and the demographic pressure, marked by high population growth, is manifesting a
negative impact on the country's socio-economic development, the formal industrial sector
12
(public or Private) alone could not be capable of creating sustainable economic development,
generate large employment opportunities and alleviate poverty problems. Firstly, micro and
Small Enterprises are appropriate to the factor endowments of developing countries. They make
l se of domestic resources and labor-intensive technologies. Secondly, it fit to the limited size of
the domestic market. Thirdly, it does not require much capital and foreign exchange, and they
C,11l easily be established and operated by nationals of Developing countries (Gebrehiwot, 2006).
2.1.2 Definitions and classification of MSEs in different countries
'I he value of the Micro and Small Scale Enterprise sector is characterized by highly diversified
activities which create employment opportunities for a substantial segment of the population.
The contribution towards growth. job creation and social progress is valued highly and small
business is regarded as an essential element in a successful formula for achieving economic
growth. This implies that the sector is a quick remedy for unemployment and poverty problem.
110\\ e\'er, there is no single and universally acceptable definition of a small enterprise. This is so
because the criteria and ways of categorizing enterprises as micro and small from institution to
institution and from country to country depending essentially on the country's level of
dcx clopment. The definition and types of micro and small enterprises differ from country to
country and there is no universally stated definition for micro and small enterprises. The absence
o l such uniform definition of MSEs has created a difficulty.
111 Iinc with this. Tegegne and Meheret (2010: 11) argued that the absence of a single or globally
applicable definition has made the task of counting the number of MSEs and assessing their
impuct extremely difficult across countries, though the rationale for most governments to make
such definition and categorization is mainly for functional and promotional purposes to achieve
tne desired levels of development of the sector. Hence, definitions which employ measures of
size (c.g. number of employees, turnover, profitability and net worth) when applied to one sector
might lead to all firms being classified as small. while the same size definition when applied to a
different sector might lead to a different result. The definition of MSE is based on five main
parameters; labor. capital, loan size, fixed asset and annual sales turnover. Organizations often
use one criterion to define SMEs (Omobolanle, 2009).
13
2.1.2.1 Definition by European Union (EU) and Member States
Traditionally EU member countries have their own definition of what constitutes an SME, for
example Germany had traditional definition a limit of 250 employees constitutes as MSE, while
Belgium it could have been 100 employees. In the UK that same year, small business is said to
employ between 1 - 99 employees and medium scale 100 - 499 employees in the manufacturing
sector (Ekpenyong, 1997).
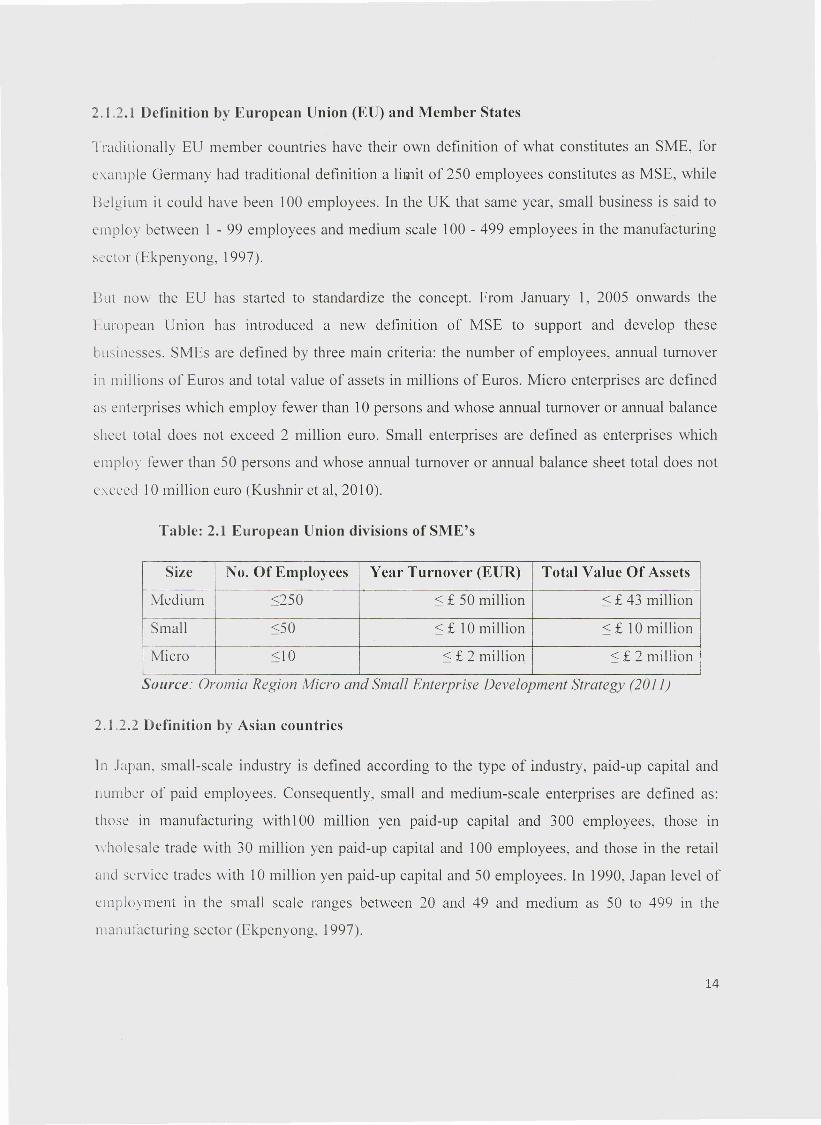
But now the EU has started to standardize the concept. From January 1, 2005 onwards the
luropcan Union has introduced a new definition of MSE to support and develop these
businesses. SMEs are defined by three main criteria: the number of employees, annual turnover
in millions of Euros and total value of assets in millions of Euros. Micro enterprises are defined
as enterprises which employ fewer than 10 persons and whose annual turnover or annual balance
sheet total does not exceed 2 million euro. Small enterprises are defined as enterprises which
employ fewer than 50 persons and whose annual turnover or annual balance sheet total does not
exceed 10 million euro (Kushnir et al, 2010).
Table: 2.1 European Union divisions of SME's
Size No. Of Employees Year Turnover (EUR) Total Value Of Assets
Medium ::::250 < £ 50 million ::::£ 43 million
Small ::::50 < £ 10 million ::::£ 10 million
Micro ::::10 ::::£ 2 million ::::£ 2 million ISource: Oromia Region Micro and Small Enterprise Development Strategy (2011)
2.1.2.2 Definition by Asian countries
In Japan. small-scale industry is defined according to the type of industry, paid-up capital and
number of paid employees. Consequently, small and medium-scale enterprises are defined as:
those in manufacturing with 100 million yen paid-up capital and 300 employees, those in
wholesale trade with 30 million yen paid-up capital and 100 employees, and those in the retail
and service trades with 10 million yen paid-up capital and 50 employees. In 1990, Japan level of
employment in the small scale ranges between 20 and 49 and medium as 50 to 499 in the
manufacturing sector (Ekpenyong, 1997).
14
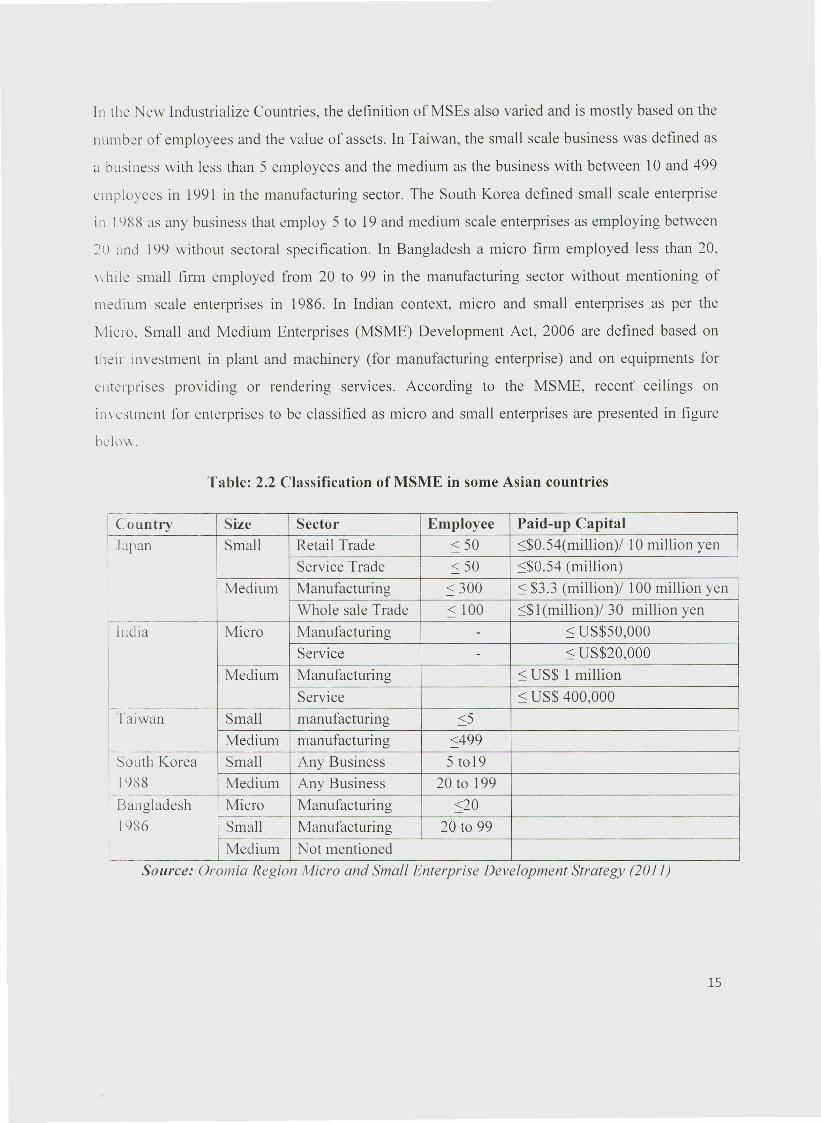
In the New Industrialize Countries, the definition of MSEs also varied and is mostly based on the
number of employees and the value of assets. In Taiwan, the small scale business was defined as
(1 business with less than 5 employees and the medium as the business with between 10 and 499
employees in 1991 in the manufacturing sector. The South Korea defined small scale enterprise
in 1988 as any business that employ 5 to 19 and medium scale enterprises as employing between
20 and 199 without sectoral specification. In Bangladesh a micro firm employed less than 20,
\\ hile small firm employed from 20 to 99 in the manufacturing sector without mentioning of
medium scale enterprises in 1986. In Indian context, micro and small enterprises as per the
Micro, Small and Medium Enterprises (MSME) Development Act, 2006 are defined based on
their investment in plant and machinery (for manufacturing enterprise) and on equipments for
enterprises providing or rendering services. According to the MSME, recent" ceilings on
investment for enterprises to be classified as micro and small enterprises are presented in figure
bl'lov..
Table: 2.2 Classification of MSME in some Asian countries
'Country Size Sector Employee Paid-up Capital II
I Japan Small Retail Trade < 50 :S$0.54(million)/ 10 million yen
Service Trade < 50 :S$0.54 (million)
i Medium Manufacturing < 300 :s $3.3 (million)/ 100 million yen
I Whole sale Trade < 100 :S$1(million)/ 30 million yen IIndia Micro Manufacturing - < US$50,000
Service - :s US$20,000Medium Manufacturing :s US$ 1 million
Service :s US$ 400,000Taiwan Small manufacturing <5
I Medium manufacturing <499I South Korea Small Any Business 5 to 19I
1988 Medium Any Business 20 to 199~ Bangladesh Micro Manufacturing <20
1986 Small Manufacturing 20 to 99
Medium Not mentionedSource: Orotnia Region Micro and Small Enterprise Development Strategy (2011)
15
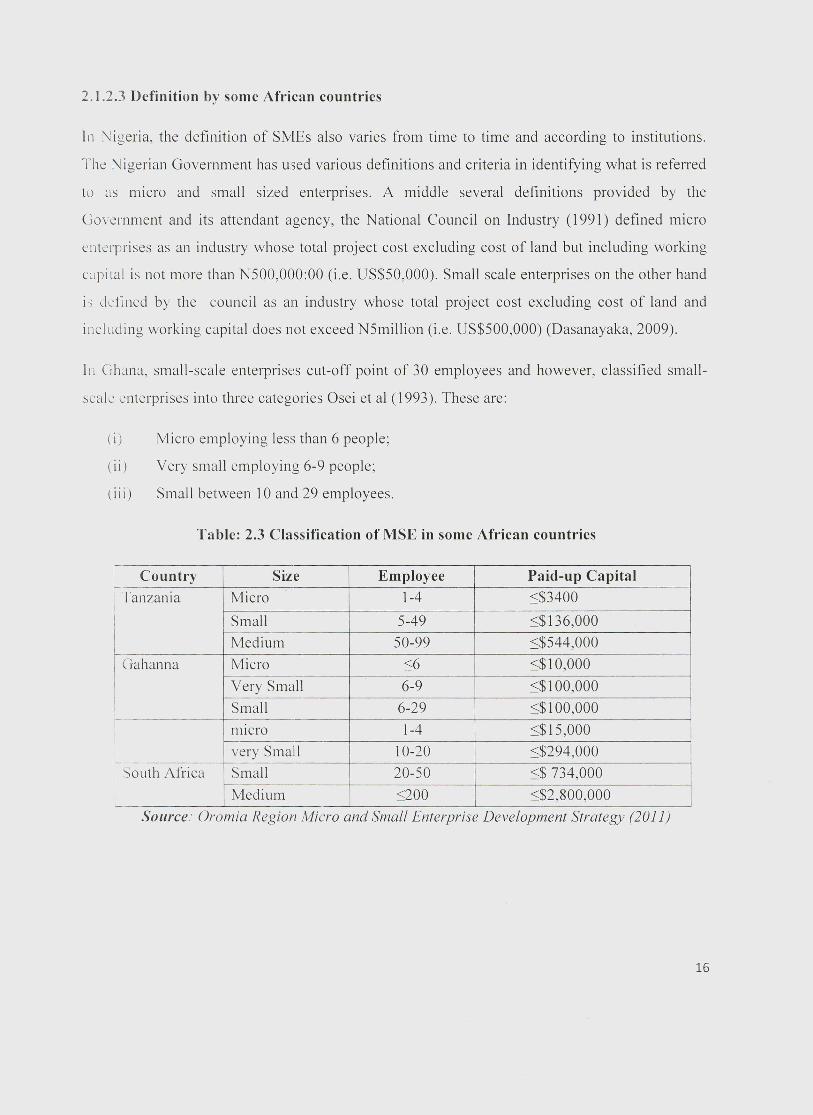
2.1.2.3 Definition by some African countries
In Nigeria, the definition of SMEs also varies from time to time and according to institutions.
The Nigerian Government has used various definitions and criteria in identifying what is referred
to as micro and small sized enterprises. A middle several definitions provided by the
Government and its attendant agency, the National Council on Industry (1991) defined micro
enterprises as an industry whose total project cost excluding cost of land but including working
capital is not more than NSOO,OOO:OO(i.e. US$SO,OOO). Small scale enterprises on the other hand
is defined by the council as an industry whose total project cost excluding cost of land and
including working capital does not exceed NSmillion (i.e. US$SOO,OOO) (Dasanayaka, 2009).
In Ghana, small-scale enterprises cut-off point of 30 employees and however, classified small-
scale enterprises into three categories Osei et al (1993). These are:
(i) Micro employing less than 6 people;
(ii) Very small employing 6-9 people;
(ii i) Small between 10 and 29 employees.
Table: 2.3 Classification of MSE in some African countries
I Country Size Employee Paid-up Capital'-, Tanzania Micro 1-4 ::;$3400I
Small S-49 ::;$136,000Medium SO-99 ::;$S44,000
Gahanna Micro ::;6 ::;$10,000
Very Small 6-9 ::;$100,000I
Small 6-29 ::;$100,000-_.
I micro 1-4 ::;$IS,OOOI
very Small 10-20 ::;$294,000f-
I South Africa Small 20-S0 <s 734,000
I Medium ::;200 ::;$2,800,000L
Source.' Oromia Region Micro and Small Enterprise Development Strategy (2011)
16
2.1.3 Overview of MSEs in Ethiopia
The EPRDF adopted Agricultural Development Led Industrialization (ADLI) and private sector
ell'\ clopment strategy in 1995. An element of these strategies was focused on MSEs
dl'\ clopment: Federal Micro and Small-Scale Enterprises Strategy (FMSES) and Regional Micro
and Small-Scale Enterprises Strategies (RMSES) were formulated in 1997. Federal Micro and
Small-Scale Enterprises Development Agency (FMSEDA) and Regional Micro and Small-Scale
lnicrprises Development Agencies (RMSEDAs) were established by the Council of Ministers of
lthiopia Regulation No.3311998, and supportive financial sector reforms were made. Among the
principal objectives of the FMSES and RMSES are exploitation of local raw material, creation of
productive job opportunities, adoption of new and appropriate technologies, and enhancement of
uie development of MSEs which have wide-ranging backward and forward linkages.
FISFDA and RMSEDAs and address the major issues and problems constraining MSEs
dcx clopment, the government issued an Industrial Development Strategy in 2003, which was
aimed at providing a package of material and technical government support to the MSEs
including, inter alia, provision of utilities and infrastructure, raw materials, access to credits, etc.
!\[ the early 2000's, the World Bank introduced poverty reduction strategy for Less Developed
Countries which is in line with the Millennium Development Goals. For Ethiopia, the program
L~IS 1\\ 0 phases: the Sustainable Development and Poverty Reduction Program (SDPRP) and the
Plan for Accelerated and Sustained Development to End Poverty (PASDEP).
S]W RP was aimed at creating an enabling environment for accelerated development and
attainment of improvements in the standard of living of the people and it lasted from year
2000/01 to 2003/04. PASDEP is designed for the years 2005 to 2010 and identified development
or i\[SEs as a best venue for job creation and to mitigate the pervasive youth unemployment
observed in the country. According to PASDEP, MSEs would get extended basic trainings,
upgraded business development services and enhanced market linkages with foreign importers
through FMSEDA and RMSEDAs in the planned period.
()TP (Growth and Transformation Plan), which is the successor of PASDEP and the current
development strategy of Ethiopia (2010 -2015), has also given a priority to MSEs development.
The GTP has put the MSEs development as one of the seven identified growth pillars of the
17
country. The MSEs to be a development pillar, they have to be formal to get the necessary
support.
The excursion made in the MSE strategy of Ethiopia in brief reveals the vastness of the role
MSEs in the entire economy has been immense. Some studies in these areas rightly point out that
MSEs have been on the forefront in employment creations, poverty reductions, proliferations of
entrepreneurships and thus economic development concurrently (CSA, 1997; MoTI, 1997;
] laftu. et ai, 2009; GTP, 2010).
From this point of view, two MSE strategy documents could come into attention from most
recent attempts the current government has been making. These are:
, MSE Development Strategy of 1997 and
, MSE Development Strategy of2011
As indicated in the preceding parts, the MSE Development Strategy formulated in 1997 clearly
enlightens a systematic approach to alleviate the problems and promote growth of enterprises.
The primary objective of this national MSE development strategy has been to create enabling
e11\ ironment for MSEs to operate. Thus, it is expected that hundreds and thousands of MSE, will,
themselves be responsible for the operation, growth and progress of their enterprises given such
an enabling environment. The specific objectives of the 1997 strategy framework were to:
, Facilitate economic growth and bring equitable development,
,... Create long term jobs;
,... Strengthen cooperation between MSEs;
,... Provide the basis for medium and large scale enterprises;
,... Promote export and
,. Balance preferential between MSEs and bigger enterprises
2.1.3.1 The MSE Development Strategy of 2011
The new MSE Strategy (2011) included fresh band of target groups, the graduates, (in addition to
its classical emphasis on the poor and less skilled people) to form cooperatives and create their
own job. On top of providing jobs to the people, the establishments are also hoped to bring about
the technological transfer and new corporate management skills to the nation.
18
In this strategy also new set of areas are identified as requiring attention and priority from the
govcnunent. These are the manufacturing sector that encompasses the majority of the previously
identified areas. the service sector which is a relatively new one, though not completely new.
construction sector (partly exists in the previous one), the urban agriculture sector (partly exists
i11 the previous one), and the retail sector. These sectors got attention because they are expected
to substitute imports or are categorized in the manufacturing sector.
The other new and important concept raised in the new MSE strategy is about the stage of
growth of the MSEs. According to this strategy the supports these enterprises receive is
dependent up on their level of growth and is relatively a tailored one. The growth stages of the
MSJ:~ are three in number and they are: the start-up stage, the growth stage and the maturity
stage. The: strategy further outlined the criteria which qualifies MSEs into any of these
c rassi tications. Following this, trials will be made to analyze the kinds of problems MSEs face in
these three different growth stages and solutions will, independently, be recommended. This
appears a very innovative way of dealing with the problems of MSEs unlike some of the policy
instruments of the previous strategies.
2.1.-t The Concept of Performance
Global Entrepreneurship Monitor (GEM, 2004) defined performance as the act of performing; of
doing something successfully; using knowledge as distinguished from merely possessing it.
] 10\,\ ever, performance seems to be conceptualized, operational and measured in different ways
thus making cross-comparison difficult.
There is a little agreement in the existing literature on how to measure growth thus most previous
studies have used a variety of different measures such as total assets, sales, employment size,
profit. capital, and others (Berkham et al., 1996; Davidsson & Wiklund, 2000; Holmes &
?immer. 1994). These measures are relatively uncontroversial, the data tend to be easily
(l\ ailable and it increases the scope for cross study comparability (Freel& Robson, 2004).
1\loreover. growth has been measured in absolute or relative terms.
When we speak of performance, there is a consensus among researchers that it represented the
accomplishment of their peoples or materials/equipments, plants or methods/techniques or
organizations or products or their combinations. But, their differences lie on the issue of
19
determining whether these accomplishments are poor or good performances. However, attempts
to address the broad scope of performance and trying for a universally accepted concept and
definition for all contexts are too ambitious and disservice to the users. But generally,
performance can be understood as a means to represent accomplishments through subject-object
relationships and their descriptions (Gebrehiwot, 2006).
The financial or monetary measures of MSE include like profits before tax and turnover, costs,
expenses, incomes or revenue. savings and value of assets held. While the non-financial
measures focus on issues pertaining to customers' satisfaction and customers' referral rates,
delivery time, waiting time and employees' turnover, units of production, units of sales or
percentage of market share and quantity of stock held. In terms of time measurement, it includes
man-hours or machine-hours.
Performance of MSEs can also be measured in terms of capital employed typically expressed in
financial terms as rate of return on investment or in terms of current ratio arrived by dividing
current assets to current liabilities (Ivancevich, 1980). It is important to note that the key
performance indicators will differ depending on the organization but whatever measurements are
selected they must reflect the organizational objectives, they must be key to its success and they
must be quantifiable (measurable).
\ l Chirwa, (2004) several studies has analyzed the differential performance of MSEs in terms of
profitubility, employment growth and revealed qualitative growth in sales. Hence performance
has broad scope: it is ambitious for a universally accepted concept and definition for all contexts
are too and disservice to the users. But generally, performance can be understood as a means to
represent accomplishments through subject-object relationships and their metaphors.
2.1.5 The Capital Growth Constraints of MSEs
J\ number of studies on the MSE sector particularly those in developing countries face a number
01' constraints which inhibit their performance and development. The greater variance in growth
01' capital, survival and profitability of MSEs compared to larger firms emerges from financial
problem. MSEs generally tend to be confronted with higher interest rates, as well as credit
rationing due to shortage of collateral. The issues that arise in financing differ considerably
20
between existing and new firms, as well as between those which grow slowly and those that
grow rapidly.
\\'hi Ie national policies of Ethiopia play an important role in the development of MSEs, targeted
interventions are much more effective to bring about a rapid change in the growth of MSEs'
support services at the firm level. Most MSEs face critical constraints both at the operation and
start up level. The constraints are associated to structural problems in the sense of enabling
environment like policies, legal and regulatory environments, access to information and markets
including informal markets, access to capital for start-ups, regulatory burdens, as well as
availability of basic infrastructural facilities on the one hand and operational problems like basic
busi ness skills and entrepreneurial competencies on the other hand.
Commission on Legal Empowerment of the Poor (CLEP, 2006) presented some of the MSE
constraints as follow: financial constraints like lack of adequate investment capital, lack of
sufficient loan, and inefficient financial market in terms of facilitating financial resources to
entrepreneurs, excessive administrative costs and lack the experience in dealing with financial
institutions and do not keeping track record of their business are the major obstacles in doing
business. particularly in the MSE sector. Moreover, the interest rate by most micro finance
insti Lutes, which is higher than the lending rate of formal banks, controls the effectiveness in
addressing the needs of micro enterprises.
Non financial constraints like inconvenient national policy to enhance the development of MSEs,
lack of premise and land, lack of entrepreneurial, managerial and other skills, lack of sufficient
marketing and promotional support, lack of skilled workforce, socio cultural constraints,
arbitrary and subjective tax system and lack of formal or informal linkages or business
cooperation amongst enterprises are also hinder the MSE's performance.
Eshctu et al., (2013) identifies factor that hinders growth and expansion MSEs include: financial
service includes credit and saving scheme where as the business development services (BDS)
include trainings, technology transfer, counseling, provision of working premises, legal
framework and streamlining regulatory conditions and the likes.
21
According to the CSA survey reports of 2011, the major operational problems cited by MSEs
\\ ere shortage of working capital and lack of market for product and services, lack of work
premises, absence of credit facility and lack of raw materials.
j ccording to the survey report of Association of Micro Finance Institutions (AMFI, 2009); lack
or financial, lack of business development services, low economic condition, and regulatory
environment heavily affect the operation of MSEs. Lack of appropriate and sustainable training
has been the next critical component missing from the support services provided by MFls and
other stakeholders
According to 2007 plan of Ministry of Works and Urban Development particular challenges that
exist in the implementation of the program include: technology upgrading, marketing capability,
extension services, training, MSE and TVET linkage and linking MSE development to secondary
education are particular challenges that hinder MSE's implementation.
2,2 Empirical Evidence on the Constraints of MSE Capital Growth
This section is proposed to understand various factors that affect the MSE performance from
literature. Probably factors influencing the performance of MSE in one country might be
di fferent from factors influencing the performance of MSEs in another country. Thus, the
following section reviews the empirical evidence on factors affecting MSE's performance with a
particular focus on those that have been conducted more recently, as far as they are best
indicators of current situation.
2.2.1 Review of Previous Studies of in the different Countries
W. Chilwa (2004) analyzed the performance of enterprises owned by females relative to those
owned by males using national survey data of enterprises owned by females relative to those
owned by males during the period from 1992 to 2000. He found that gender specific
characteristics, in particular with profit margins had no significant impact on MSE's
performance. In terms of employment growth, female-owned enterprises grow at a faster rate
than male-owned enterprises. Even if there are common factors that affect the performance of
female-owned and male-owned enterprises, education is a critical factor that affects the
performance of female-owned enterprises. The revealed decrease in sales for both female-owned
22
and male-owned enterprises relate to marketing, followed by competition In female-owned
enterprises and finance in male-owned enterprises are the most important problem that affect
TVISE's probability.
Study in Ghana by Nkrumah (2009) by using random variables investigated the performance of
MSE is affected by the non-financial method. As performance (profit efficiency) of MSE is
measured on variables in the inefficiency model that have negative coefficients, meaning that as
the on-financial or BDS variables (educational level, farming experience, and household size)
increase the profit efficiency of the farmer increases. The most important challenges identified
me. working capital, Access to credit, and Cost of credit. The result also shows that there are a
number of linkages that exists in micro and small agribusiness. These mostly take the form of
cooperati ves, associations and informal agreements. The results from the stochastic profit
frontier analysis showed that their profit efficiency was positively influenced by age, educational
level, farming experiences and household size.
In Malaysia, Abdulrazk et a1. (2011) contended that owner's experience, those having limited
liability and availability of external finance are the major determinants of MSE growth. They
argue that entrepreneurs those with high experience have high chance to use the opportunities
and can easily overcome problems. They also provided similar evidence to that of previous
studies that level of education has also contributed to the business growth. Abdulrazak et a1.
(20 J I) argues that micro entrepreneurs in Malaysia are generally having financial difficulties
particularly during the start up.
Kernunto et a1. (2013) analyzed the effect of business development services on the performance
or f\lSE in Kisii Town. The performance of MSE had influenced by business development
services training, advice, counsel, marketing, advertisement, technical assistance services and
other non-financial services to these small business operators. Kemunto et a1. (2013) argue that
the entrepreneurs who received business development services recorded an improvement in the
growth of sales and growth in market shares on the various businesses they were operating.
In Tanzania, Nkonoki (20 I0) observed on his study determinant factors that limit the growth/and
or success of small businesses through interview method from nine respondents (six small
business owners and three officials representing three organizations). The author identified a
23
number of limiting factors to small firm growth are originated from two groups; those internal to
the linn (Inadequate education and training, capital constraint, lack of needed talent, lack of
proper record keeping, lack of or improper professional advice and consultation, theftlcheating
and lack of trust in doing business, lack of a proper business plan/vision for the business, and
luck or background and experience in the business. and so on) and those that are external to the
firm (comprising things like corruption, government policy, bureaucratic processes, in access to
finances/capital constraint, unfavorable economic conditions, community factor and etcetera) are
key constraints which have emerged as the most influential in impacting the growth of small
firms in Tanzania. The constraints to small firm growth are not only a problem to small firm
owners. but this impacts the economy of the country as a whole. The author made
recommendations: firstly a reform of the SME policy by the government, a search of an adequate
business education by the small business community and trying to develop services and the
maintenance of good relationships with small business owners by other stakeholders like the
financial institutions.
BoV'.en et al (2009) analyzed how in Nairobi administer the challenges by employing stratified
random sampling 198 businesses are selected, primary data was collected through questionnaires
and interviews were analyze descriptively and presented through figures, tables and percentages.
The findings indicate that SMEs face the following challenges; competition among themselves
and from large firms, lack of access to credit, cheap imports, uncertainty and debt collection. The
constraint of credit seems to be moderate when compared to previous researches. Relevant
training or education is positively related to business success. The SMEs have the following
strategies to overcome the challenges; fair pricing, discounts and special offers, offering a variety
or services and products, superior customer service and continuously improving quality of
service delivery. The research concludes that business success is a consequence of
implementation a mix of strategies.
2.2.2 Review of Previous Studies related to the Ethiopian MSEs
Seyoum (2013) evaluated determinant factors that affect the growth of MSE in Addis Ababa 99
MSEs were randomly selected from Addis ketema and Areda sub city. Data were collected
through structured questionnaire and analyzed using descriptive and inferential statistics with the
help of SPSS and ANOV A was used for statistical t-test. In his study, two dependent variables
24
(asset growth and employment growth) were used to measure the growth of MSE's and the result
shows different statistical result. In situation asset used to measure MSEs growth, different in
growth among businesses happen due to: gender, work experience, family back ground, type of
busi ness, legal status/registration, record keeping, borrowing, competition level and availability
or market for their product. That means the variation in those variables will result in the variation
or growth if the measurement of growth is asset growth. In situation employment used to
measure MSE's growth, different in growth among businesses happen due to: the deference in
experience, family background, types of business, having, recording keeping practice, borrowing
and availability of market for their product brings difference in growth. But ANOYA and t-test
result shows there is no significant difference in growth with respect to the difference in
education level, registration with MSE office and age of business whether it is measured asset or
employment.
l.shctu et al. (2013) conducted a study to assess economic impact of MSE support service
programs on enterprise sales, employment and capital asset formation by using cross sectional
d.u.i collected randomly from four urban kebeles out of the nine urban kebeles in Dire Dawa
Administration, Ethiopia. Data were collected from randomly selected samples using structured
questionnaire and interviews which were undertaken in May, 201l. Four explanatory variables:
) cars of schooling, prior business experience, enterprise age, and location of enterprise has
significantly influence MSE which has great role in addressing the challenges of unemployment,
economic growth and equity. The result revealed that the MSEs program resulted in average
increment of monthly sales by 28%, employee level by 42%, and capital asset formation by 60%
\\ hich has great economic contribution of the town. The qualitative analysis indicates that still
there have been certain problems that impede the promotion and development of the sectors,
particularly in terms of financial and business development services. Generally, both qualitative
and econometric analysis concretely justified that MSE support service program intervention so
far provided has brought positive impact on participant enterprises.
Shifcraw (2013) examined the contributions of MSEs to the socio economic of communities by
randomly selected through stratification in each activity of the sector 82 organized/cooperated
f\lSLs in Jimma city. The study used inferential and descriptive design, and results were
analyzed and changed to tables, charts and bar-graphs, and some of them were tested using Chi
25
techniques. Result of the study indicates MSEs had 79.27% role in socio-economic contribution
through employment creation, saving and income generation, developing entrepreneur's skills
Lindknowledge, and gender empowering, changing social problem of peoples' and also ways of
acquiring businesses and linking different levels of enterprises to which facilitate development.
lvcn if the MSEs have such great roles in changing peoples' living conditions of the city, lack of
financial capacity. lack of working and production places, rules and regulatory procedures, lack
of capacity to compete, and insufficiency of business development services and socio-economic
infrastructures are the major constrained factors that affect MSE activities.
Tcfcra et al. (2013) measured the effects of 4 internal and external variables determinants of
growth of an enterprise, including the gender of owner, initial investment on the firm, location
and sector in which the firm operates as main determinants of growth of MSE on a survey
CU\ cring 178 randomly selected MSEs from Mekelle city. The effects of all variables are found
tLlbe significant, regardless 0 the potential contribution of MSEs to the economic growth of the
country.
J\ bera (2012) assessed factors affecting the performance of textile and garment, food processing
ami wood and metal work sectors in Addis Ababa. The sample MSEs in their study are from
Arada and Lideta sub-cities. Abera (2012) extract eight major challenges which seem to affect
performance of MSEs in sub-cities which include: inadequate finance, lack of working premises,
marketing problems, inadequate infrastructures, poor management practices, and technological,
entrepreneurial and political and legal problems including bureaucratic bottlenecks system.
Questionnaires and interviews were analyzed using statistical as descriptive and inferential
method. The respondent operators were selected using stratified sampling technique. The
findings further indicate that poor management practices, inaccessible training facilities and lack
of working premises have there exists linear and positive significant ranging from substantial to
strong relationship was found between independent variables and dependent variable.
/\bcbe (:2011) assessed to identify personal and business related factors that have a positive
relation to the MSE's performance in Addis. Arada and Gulele Sub City Administration based on
their nearness and convenience to collect data in short time, among those industries engaged in
MSE's 73 MSEs were randomly selected from Food and Beverage; Textile and Garment, Wood
and l\letal, and Merchandise and Retail shop. Primary data were collected through structured
26
questionnaire and analyzed using descriptive and inferential statistics using SPSS and ANOV A
\\ as used for statistical t-test. Eight independent variables (difference in age, education level,
management experience, and prior industry experience, business plan, use record keeping and
financial control system and ownership) were taken in this study to examine the variation in the
MSE performance (the average capital growth of the enterprises) in response to each of the
independent variables.
Chane (2010) assessed factors that affect the performance of MSEs women entrepreneurs in
Dessic town with a sample of 203 women entrepreneurs engaged in 5 sectors using stratified and
simple random sampling. Primary data was collected through questionnaire, likert scales and
interviews were analyzed using simple statistical techniques (tables and percentages) and
descriptive statistics (mean and standard deviations). The study indicated that economic factors;
l.ick of own premises (land), financial access, stiff competition, inadequate access to training,
access to technology and access to raw materials; social factors: conflicting gender roles and
personal character of entrepreneurs, social acceptability and, network with outsiders; legal!
administrative factors include access to policy makers, high amount of tax and interest,
bureaucracies and red tapes, poor business related trainings and over all legal and regulatory
environments. The study result shows those women entrepreneurs in MSEs ofDessie town need
Mulugeta (2008), undertook study on major causes toward failures of micro and small business
in Addis Ababa. where MSEs in Addis ketema sub city were selected for case study as sample.
Delta was collected from primary and secondary sources; in-depth interview was used for to
collect first hand data from owners of MSEs and authorities involved in the implementation.
1- rom ~survey report identified the causes of MSE failures as they were multidimensional and
diverse which are internal and external factors and many of them are interrelated. The study
recognized causes make MSE's toward failure: lacked business management skills, lack of
capital, lack of business plans, tax burdens and arbitrary taxes, luck of land and premises, poor
market, high rent charges, wrong pricing, legal framework proclamations like inter-linkage
promotion law, chamber of industry and other important supporting proclamations are not yet
passed. reform existing regulatory such as tax assessment and tender procedure are awaiting, the
only effort done is simplifying of the registration and licensing of business.
27
CLLP (2006), the Commission on Legal Empowerment of the Poor of Ethiopia, reviewed factors
that hinder the MSEs sector of the country as follows: access to land, premises, and working
space: the instauration of a tax system that is less arbitrary and less subjective; adequate financial
s .rvices: access to markets; access to private sector organizations as well as the establishment of
formal or informal linkages and/or business cooperation amongst enterprises; the implementation
or a clear and pragmatic national policy to enhance the development of the private sector and
Micro and Small Enterprises; the development of entrepreneurial, managerial and other skills as
\\ ell as the availability of skilled work force; the reduction of socio cultural constraints that
hinder from taking private initiative; coordination among business development service
providers; the reduction of bureaucratic red tape and other cumbersome regulations to enable
easy entry and exit from the formal sector; the provision of adequate information about the
procedures on becoming formal; and the betterment of the investment and private sector climate
in Ethiopia in order to alleviate the overall mistrust between government, informal sector
operators and private sector operators. The result shows MSE's operators (including women and
) outh) face problems of access to credit; complex business regulations or inefficient institutions.
2.3 Conclusions and Knowledge Gap
The review of the literature reveals the existence of many gaps of knowledge in respect of the
factors affecting MSE performance, particularly in the context of Ethiopia. As per the review of
the literature most of the empirical studies that have been conducted with the aim of identifying
factors affecting MSE performance belong to European Union member countries; in the new
i.idusirialize countries (i.e. south Korea, Taiwan, Bangladesh and India); and some Africa
countries; Nigeria, Gahanna, Tanzania, Kenya and south Africa. Moreover, scanty work has been
done with the objective of identifying the determinants of performance and also exposes the
c. isiencc of notorious conclusions that results from different studies in Sub Saharan Africa in
general and Ethiopia in particular.
In the context of Ethiopia, a few related studies were conducted Addis Ababa. Accordingly, the
findings of study may not necessarily apply to other MSEs operating in other parts of the
country; therefore, the results may not be generalized to Jimma. Only one study by Shiferaw
(2013) undertaken that analyze 'the contribution of Jmma MSEs to the socio-economic
communities'. The study by Shiferaw (2013) was not identify factors that affect MSE's capital
28

growth hence the main focus of his assessment was the MSE contribution factor. The study fails
to fill the knowledge gap that exists in the town i.e., did not identify dependent and independent
\ ariables; and considers to the extent that only very few external variables and overlooked
internal variables that may significantly affect MSE growth of capital. In addition, the sample is
\ l'r) 5111allrepresentation of the entire MSEs business sector in Jimma town.
In general, the lack of sufficient research on the performance constraints of MSEs found in the
area initiates to undertake this study.
29
CHAPTER THREE
3. RESEAllCH DESIGN AND METHODOLOGY
3.] Introduction
In order to analyze the potential impacts of factors on capital growth of MSEs, this study made
lIse of a research methodology. This section provides an overview of the study's research
approach which lays within the mixed methods strategies. The chapter discusses procedures and
acti , ities under taken, focusing on namely the study's research design, questionnaire design, data
collection, sampling strategy, data processing and analysis and instrument development. Besides,
the section deals with a discussion on the ethical issues and the study area profile.
3.2 Research Approaches
Quantitative and qualitative research design (Mixed) is appropriate for answering different kinds
of q ucstions. When we use mixed approach we learn more about the research problem (Leedy
ami Ormerod, 2005 cited in Semu 2010, p. 44). Further Creswell (2009) noted that mixed
research is an approach that combines or associates both qualitative and quantitative research
methods. Thus, it is more than simply collecting and analyzing both kinds of data, it also
involves the use of both approaches in tandem so that the overall strength of a study is greater
than either qualitative or quantitative research.
3.3 Research Design
The study adopted a descriptive survey research design. The design was intended to describe the
respondents view and opinions on the variable of the study. The principal advantage of
descriptive survey design is that it allows for collection of information on large groups of
respondents, with minimum costs (Levy & Lemeshow, 1999). Through this design the study was
able to establish how the internal and external hurts the growth of micro and small enterprises in
.limma Town.
30
3.4 Sampling Design
A sample design is a definite plan for obtaining a sample from the sampling frame. It refers to
the technique or the procedure the researcher would adopt in selecting some sampling units from
\\ hich inferences about the population is drawn.
3 ...•.1 Research Population
In Jimrna town, from 2005 to 2013, there were 1,126 formally registered MSEs which consist of
a total of 6,626 individual members who are engaged in manufacturing, construction, service,
urban agriculture and trade sectors (JMSEDO, 2014). Among the six sub-city Administrations,
sub city 1,3 and 4 Administrations those have 668 registered MSEs were selected for study.
3.4.2 Sampling Technique
Stratified random sampling technique, a method which every homogeneous member of thepopulation has an equal representative chance of being selected to represent the population andused \0 assist in minimizing bias when dealing with the population, relatively more precise andeasier to apply than others, causes a relatively small sampling error and helps to control thes) stomatic bias in a better way. The technique had the advantage of allowing all elements withinthe population to have equal chances of inclusion into the sample (Dillon and Hardaker, 1993). Italso eliminated bias thus enabling errors to be estimated (Kothari, 2009). By this technique eachunit in the population of 668 MSEs had an equal chance of being selected. Through thetechnique it was possible to generalize the findings and inferences were made based on the entirepopulation.
3...•.3 Sample Size
S.ze f sample refers to the number of operators to be selected from the population to constitute
a sample. Out of a population of 668 MSEs, a sample size of 244 MSEs was selected by using
stratified random sampling technique. The sample size was within the lower limits of a normally
distributed population as per Kothari (2002). The sample size for the study was determined using
the statistical package, NEA Research Bulletin, Vol. 38 (1960: 99), "Sample Techniques,"
formula published by the research division of the ational Education Association for
determining sample size (W.Mogan, 1960:69).
31
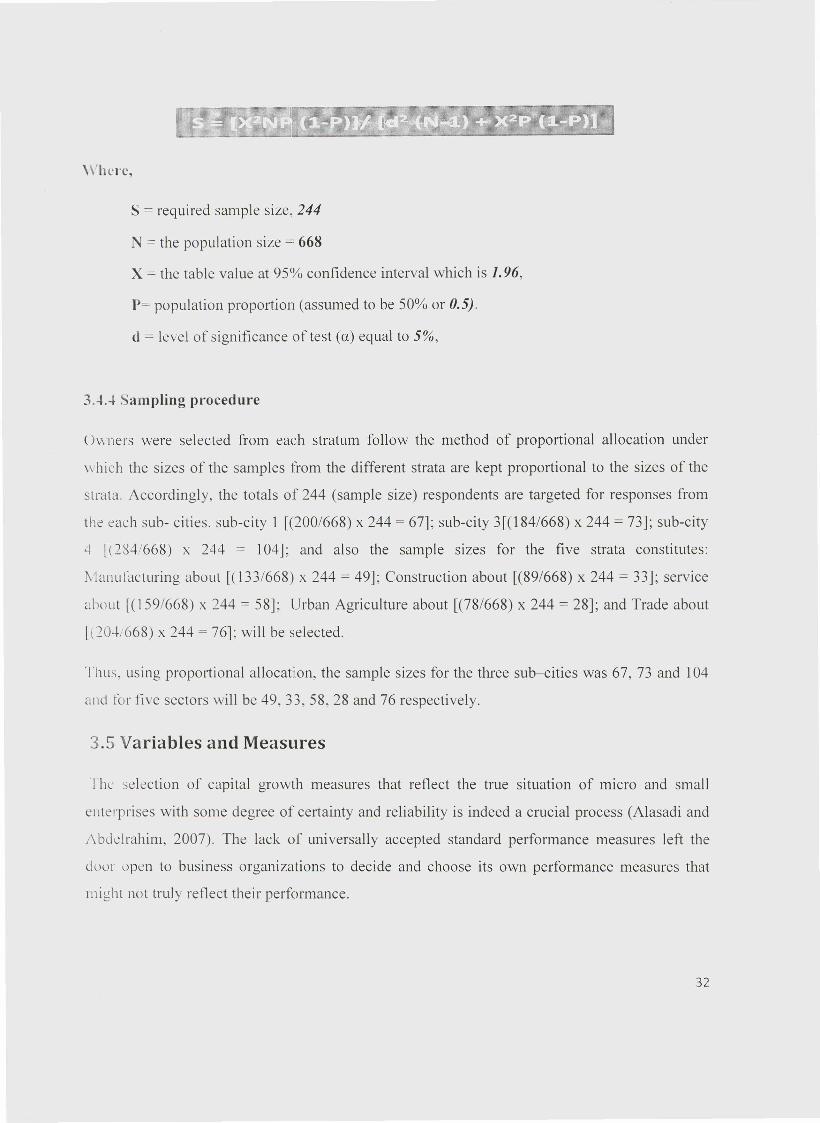
\\'herc,
S = required sample size, 244
N = the population size =: 668
X = the table value at 95(10 confidence interval which is 1.96,
P> population proportion (assumed to be 50% or 0.5).
d = level of significance of test (a) equal to 5%,
3.-t.-t Sampling procedure
Owners were selected from each stratum follow the method of proportional allocation under
which the sizes of the samples from the different strata are kept proportional to the sizes of the
strata. Accordingly, the totals of 244 (sample size) respondents are targeted for responses from
the each sub- cities. sub-city 1 [(200/668) x 244 = 67]; sub-city 3[(184/668) x 244 = 73]; sub-city
4 [\284/668) x 244 = 104]; and also the sample sizes for the five strata constitutes:
Manufacturing about [( 133/668) x 244 = 49]; Construction about [(89/668) x 244 = 33]; service
about [(159/668) x 244 = 58]; Urban Agriculture about [(78/668) x 244 = 28]; and Trade about
l(20-J./668) x 244 = 76]; will be selected.
Thus, using proportional allocation, the sample sizes for the three sub-cities was 67, 73 and 104
and for five sectors will be 49,33,58,28 and 76 respectively.
3.5 Variables and Measures
The selection of capital growth measures that reflect the true situation of micro and small
enterprises with some degree of certainty and reliability is indeed a crucial process (Alasadi and
Abdelrahim, 2007). The lack of universally accepted standard performance measures left the
door open to business organizations to decide and choose its own performance measures that
might not truly reflect their performance.
32
] lerc sub-section 3.5.1 presents the dependent variable as representative for MSEs' capital
growth. Then the independent variables categorized into internal and external were presented in
subsection 3.5.2.
3.5.1 Dependent Variable
The financial performance measures such as profit, turnover or return on investment is not used
for performance measurement of MSEs, because most MSEs' owners have poor record keeping
even may not keep their account and proprietors are generally suspicious to disclose information
related to revenue and profit and it was difficult to get response from respondents.
Thus. growth of capital of the enterprises was used as dependent variable of this study. Here the
change in capital growth as ratio data was used to measure the dependent variable of the
enterprises involved in the survey.
3.5.2 Independent Variables
This sub-section describes the independent variables that are used in the econometric model to
esti mate the dependent variable.
Commission on Legal Empowerment of the Poor, CLEP, (2006) presented some of the MSE
constraints as follow: financial constraints like lack of adequate investment capital, and lack the
experience in dealing with financial institutions and do not keeping track record of their business
are the major obstacles in doing business, particularly in the MSE sector. Moreover, which is
higher than the lending rate of formal banks, controls the effectiveness in addressing the needs of
micro enterprises. Non financial constraints like are also hinder the MSE's performance.
(Kalleberg & Leicht, 1991; Keats & Bracker, 1988, sighted in Kanburi, 2009) independent
\ ariubles that influence performance micro and small business can be classified into two main
levels: that emanate from the firm's internal environment and the external environment. The
internal factors, controllable for MSE's managers (i.e. lack of entrepreneurial, managerial skills,
LIck or adequate investment capital, excessive administrative costs, and poor record keeping).
Whi Ie the external factors, uncontrollable by MSE manager's and hence external (i.e. lack of
sufficient loan, inefficient micro finance institutions, the interest rate, lack of working premise,
lack or sufficient marketing, arbitrary and subjective tax system, inconvenient national policy,
and lack of formal or informal linkages or business cooperation amongst enterprises).
33
TJ m.ikc each of the independent variables selected for this study more clear, the explanations
me present here under as follows:
3.-4.2.1 Internal Constraints
The internal constraints incorporate such as management skills, lack internal finance, accounting
and record keeping skill and access of training.
3.-"2.1.1 Management Skills:
(Lussier. 1996; Murphy, Shleifer and Vishny 1996; Van Stel and Storey 2004; cited in Olusola,
:201 1) lack of managerial know-how spaces significant constraints on MSE development. Even
though MSEs tend to attract motivated managers, they can hardly compete with larger firms. The
scarcity of management talent, inexperience in the field of business, particularly lack of
entrepreneurial knowledge, inadequate managerial skills, and lack of monitoring, controlling
resources, lack of planning and market skill as causes of small business failure.
3.-4.2.1.2 Access of Internal Finance:
1\ business can use internal finance that is generated by MSE owners from their own capital
(personal saving, retained profit and sales of assets). Working Capital is also known as revolving
or cir .ulating capital or short-term capital. MSEs that are started operation with higher initial
investment are more likely to grow than their counter parts that are started operation with
relatix ely smaller initial investment (Barney, 1991; Carroll, 1993). Poor management of working
capital (e.g., cash, inventory, payables and receivables) is also a major problem of MSEs, who
often misperceive profit with cash and personal expenses with business expenditures. Most
micro and small enterprises are highly risky ventures involving excessive administrative and
personal expenses. MSEs that are started with high operational expenses are more likely grow
less than their counter parts that with relatively smaller operational expenses.
3.-4.2.1.3 Accounting and Record keeping skill:
Accounting is basically an information system that provides economic information to decision
makers. It is a financial information system that provides the guide and direction for business
growth and development. Accounting skills are the totality of skills ranging from record keeping,
34
attention directing, financial management and reporting skills that are expected to promote
effective decision, performance evaluation and business reporting of any business enterprise.
A lthough studies could not find record keeping skill as positive factor, financial management
skill has been found to be contributory to business development (Carland and Carland 2009;
!\kande, 2010). Attention directing skill enables the owner manager to make vital decision on
production and pricing issues while reporting skill describes the method and technique by which
busi ncss information are reported to the stakeholders of the business.
3.-t.2.1.4 Access of Training:
The most common form of acquiring skills in the MSEs sector is through apprenticeships.
Though the formal education system prepares students for paid employment, there are very few
\ ocational institutions that cater for developing skills. This inevitably leads to low level of
innovation in almost all sectors of the economy, severe shortage of training opportunities for
potential entrepreneurs.MSE operators have limited access to vocational and technical training
skills can only be developed on a strong foundation of basic primary and secondary education.
Ti1LTe is lack of formal education and training in MSEs operators. The most common form of
acquiring skills in the MSEs sector is through apprenticeships. Though the formal education
system prepares students for paid employment, there are very few vocational institutions that
cater for developing skills. This inevitably leads to low level of innovation in almost all sectors
or the economy and severe shortage of training opportunities for potential entrepreneurs
(Gebrehiwot & Wolday, 2004). Mbonyane & Ladzani (2011) found that more than 50 percent of
micro-enterprises lack training in proper business management.
3 ...L2.2 External Constraints
The external constraints cover access of market, infrastructure, and credit by financial institution,
working premises, legal and political conditions (government policy).
3.-t.2.2.1 Marketing Access:
Sufficient institutional facilities are needed in order to cultivate the promotion, growth and
development of MSEs. Marketing their products effectively as well as accessing and acquiring
information on business opportunities are the major bottlenecks that small and micro
entrepreneurs face all over the country uncornpetitive. Even though marketing has been widely
35
accredited as one of the most important of all activities and critical for the survival and growth of
MSEs'; many studies found owner/managers ofMSEs as having a very limited understanding of
the marketing concept generally to be little more than advertising and public relations and
lucking adequate marketing skills. Specifically, problems in promotion and marketing linkages
"ere frequently encountered by MSEs.
3.-l.2.2.2 Infrastructural Access:
Though not directly linked, inadequacy of infrastructure (road, banking service, electricity,
telecommunication and other public services), are serious impediments. Infrastructural access
could have greatly facilitated the development of the formal sector and facilitated the transition
from informal to formal sector activities. poor economic infrastructure and limited access to
publ ic services increases the operating costs of MSEs, limits their ability to meet quality
standards (for example, hygiene standards in restaurants), hinders their participation in linkage
relationships and reduces their market and customer base(Collier, 2002).
3..4.2.2.3 Access of Credit by Fjnancial Institutions
1 .ick of sufficient loan, inefficient financial institutions In terms of facilitating financial
resources to MSEs' are the major obstacles in doing business, particularly to those in the micro
category. MSEs may also shy away from borrowing due to a poor collateral position. The
collateral position is affected by assets, outstanding debt and opportunities for collateral
substitutes such as legal status, firm age, ownership structure and links with financial institutions.
Most micro and small enterprises do not have access to micro finance institutions and most
banks are reluctant to avail credit facility to small enterprises unless they have acceptable
collateral. The standard of loan appraisal, the long delay the banks takes to sanction loans.
unfavorable disposition towards small loans and the limited collateral requirement, which is over
100°10or the loan amount, are the major obstacles that small scale enterprises are facing at
present. Moreover, the interest rate by most micro finance institutes, which is higher than the
lending rate of formal banks, inhibits the effectiveness in addressing the needs of micro
enterprises.
36
3.-t.2.2.4 Working Premise:
Ior MSEs, lack of access to land is unquestionably a serious problem. Most MSE operators do
not get access to suitable locations where they can get easy access to markets. The issue of
acquisition and transaction cost has become very prohibitive to the emergence of new enterprises
and to the growth and survival of existing ones. The issue of land provision and the land lease
s) stcm has greatly constrained on incomes and productivity of MSEs. MSEs located at main
road side exhibit higher growth compared to MSEs located out of town (Hasnu & Amjam, 2007;
Gebreyesus, 2007; Parker, 1995). Moreover, the MSEs operating in commercial districts reveals
strong tendency of growth than those which operate at distant areas (McPherson, 1996).
3...L2.2.5 Government policy:
Despite the strategies such as the above mentioned and the unclear and unpractical government
policies are inappropriate and impractical to enhance the development of MSEs. For instance,
most government policies have a tendency to over regulate and limit the growth of private sector
enterprises and they are over bureaucratized and unfriendly to support small businesses. In
addition high taxes, complexity of national laws and bureaucratic and cumbersome regulations,
escalating interest rates and inflation hinder the creation and sustenance of MSEs. Most MSEs,
particularly the MSE operators, are subject to subjective tax system as most of them do not have
a proper accounting system.
3.5 Data Sources, Gathering Instruments and Procedures
3.5.1 Sources of Data:
Primary and secondary sources of data were used for the study.
3.5.2 Data Collection techniques
The instruments were designed to strength the viability of the study. To obtain relevant data from
di fferent sources numerous data gathering techniques employed during data gathering stage.
3.5.2. t The primary data source
The primary data formed the core of this study because it afforded the opportunity in obtaining at
first hand, relevant responses. Primary source of data was collected through questionnaires and
interview.
37
3.5.2.1.1 Questionnaires:
The questionnaire was the mam instrument of the study; the research questionnaire was
administered to 244 MSEs owners. To enhance the response rate, the questionnaires were
delivered by hand to the enterprises randomly approached and convinced to participate on this
study. The participants of this study fill up most of the questionnaires by themselves but when
necessary the data collector (the researcher) gave assistance by elaborating and explaining the
idea or the questions.
The first part of the questionnaire consist demographic profile of the respondents which was
designed in a close ended question format. The second part covers the characteristics of MSE
owners and their enterprises which is also prepared in a close ended and open-end question
format. The third part use to identify the support given to MSEs by TVETs and other Institutions.
The forth part use likert scale to identify key factors that affect the performance of MSEs. The
Likert scale ranges from "strongly agree" to "strongly disagree" (5 = strongly agree, 4 = agree,
3= neither agree nor disagree, 2= disagree, l=strongly disagree) so as to not limit the response of
respondents to some limited ranges.
Questionnaires were designed both in Afan Oromo and Amharic languages. The purpose of
translation from English to Afan Oromo and Amharic languages was to utilize those who cannot
c Ienrly understand English language so that respond easily.
3.5.2.1.2 Interviews:
Interviews were taken as an instrument to strength the investigation. The interview was
structured to the MSEDO, TVET and OCSSCO officers. It was designed to understand the
support given by different sectors. While the discussion with officials is in Afan Oromo, the
interview questions are designed in English language.
3.5.2.2 Secondary data Sources
The primary data were supplemented by secondary data which include information that were
gathered horn various sources mainly by reviewing reports, bulletins, journals websites
(\V\\ VI .google.com), literatures, variety of books, published and/or unpublished government
documents, Central Statistical Agency (CSA), Ministry of Trade and Industry, Oromia Industry
38
and Urban Development Office, Oromia Micro and Small Enterprise Development Agency
publications and official policy documents of government of Ethiopia which are relevant to the
theme of the study to complement the survey-based analysis.
3.6 Research Quality Issues
Before data entry into computer a series of pretest was conducted the data scanning and scrutiny
technique were employed from available questionnaires from respondents to examine and
\ alidate the survey instrument so as to ensure content validity and reliability.
3.6.1 Validity
To ensure validity study the triangulation technique by using interviews, questionnaires and
secondary data analysis concurrently and done through piloting of the data collection instruments
used to collect data. The data collection instruments designed in such a way that they measure
, ttitudes and opinions of respondents towards the obstacles of MSEs to the maximum degree
possible.
3.6.2 Reliability
Data reliability is a cornerstone of making a successful and meaningful study. The researcher
designed the interviews and questionnaires through an elaborate procedure which involved a
series of revisions under the guidance of the study supervisors to ensure the quality of data
collected from the fieldwork.
3.7 Ethical Considerations
All tile research participants included III this study were appropriately informed about the
purpose of the research and their willingness and consent is secured before the commencement
(,1' distributing questionnaire and asking interview questions. Regarding the right to privacy of
the respondents. the study was maintained the confidentiality of the identity of each participant.
In all cases, names were kept confidential thus collective names 'respondent's sex' was used.
39
.8 ata Analysis Techniques
The data gathered edited for completeness then analyzed by using statistical package for social
sciences (SPSS) version 16 program which provides relevant analysis such as reliability analysis,
1'1' 'LJ ucncy analysis, and regressi n analysis. Analysis of the study was done through descriptive
statistics which measure used in the context of sampling analysis for comparing a variance.
Regression is used to estimate the degree of association between the dependent variable (capital
growth) and independent variables which includes the internal and external parameters.
3,9 Model Specification
The Ordinary least squares (OLS) regression with multiple explanatory variables model
employed to determine the regression coefficients due to the continuous variable of the
ucpvndent variable.
The model specification test for this study explains the relationships between dependent variable
( .apital growth) and nine independent variables as follow.
yi = JJO+ JJ1Mgrsk + JJ2Accintfin + JJ3Accrkd + JJ4Acctrain + JJ5Accmkt
+ JJ6Accintfra + JJ7AccrFIs + JJ8Wopre + JJ9Govpo + Ui
Whcrc;
yi Growth of Capital (used as representative of performance).
1\ grsk = Managerial skill,
Accintfin = Access of internal finance,
ccrk = Accounting and record keeping skill,
f cttrain = Access of training,
A .c nkt = Market access,
A einfra = Infrastructural access,
AccrFfis = Access of Credit by the financial institutions,
40
Wopre = working premise,
Covpo = Government policy,
130=Coefficient of intercept,
131Mgrsk = Coefficient of managerial skills,
f32Accintfin = Coefficient of Access of finance,
f34Accrk = Coefficient of Accounting and record keeping skill,
f35Train = Coefficient of access of Training,
f36Accmkt = Coefficient of market access,
f37SccInfra = Coefficient infrastructural access,
f38AccrFIs = Coefficient of access of credit by Financial Institutions,
f39Wopre =Coefficient of working promise,
J39Govpo = Coefficient of Government policy,
Ui = the stochastic error term or extraneous variable: independent variables that are not related to
the purpose of the study, but may affect the dependent variable are termed as extraneous
\ ariables.
41
3.10 The Study Area Profile
Jimrna town is found in Jimma Zone of Oromia regional state. Historically, Jimma was founded
in 1822 during the regime of emperor Aba Jifar I. It is located at 335 km by road southwest of
Addis Ababa. Its geographical coordinates are approximately 7°41 'N latitude and 36°50'E
longitude. The town is found in an area of average altitude, of about 5400 ft (1780 m) above sea
level. It lies in the climatic zone locally known as Woyna Daga which is considered best for
agriculture as well as human settlement. The town bordered by Dedo Wereda in the South,
SekaWereda in the North-West, Kersa Wereda in the East, Manna Wereda in the North-West,
and it possesses or covers a total area of 100.2 KM2. The town is one of the 10 "grade A" towns
found in Oromia National Regional State. Currently, the town comprises of 6 sub-cities
(previously called Keftenyas) and 17 Kebeles which are 13 urban and 4 rural kebeles. Sub city is
the second administrative level next to the municipal government while kebele is the least
administrative level next to sub city. Ecologically, the town lies in wet land ecosystem,
blundered by wet evergreen mountain forest. The mean daily temperature ranges from 12.1°C to
28'\'; the annual rain fall ranges from 1450mm to 1800mm. The elevation of town ranges from
1720 meters above sea level of the airfield (kitto) to the highest 2010 meters above sea level of
J ircn.
In terms of population size, the Jimma town population is estimated above 157,956 which 79,358
(50.2) are males and 78,598 (49.8) are females (CSA: 2010). According to JOFED, (2013)
population has grown from 120,960 in 2007/2008 to 157,956 in 20137/2014 with the result that
the number of poor people in the town increased. The number as well as rate of population is
highly increasing from time to time i.e., there is high fertility rate and productive rate that
migrate from rural to the town with the purpose of seek job. The town is home for people from
\ arious nations and nationaliti s that composed of different ethnic groups of the country.
l Iowever, the dominant ethnic groups are Oromo, Amhara, Dawuro, Gurage, Kefficho, Yem,
Silic and Tigre (CSA: 2007). Afan Oromo is the working language in government offices and
also widely spoken in the town.
The town severs as commercial, political and economical center south-west part of the country
for 184 years. Service and commercial trade are the dominant activities within the area of the
town. It is also a place where many large scale wholesale and retail trades, hotels and big
42
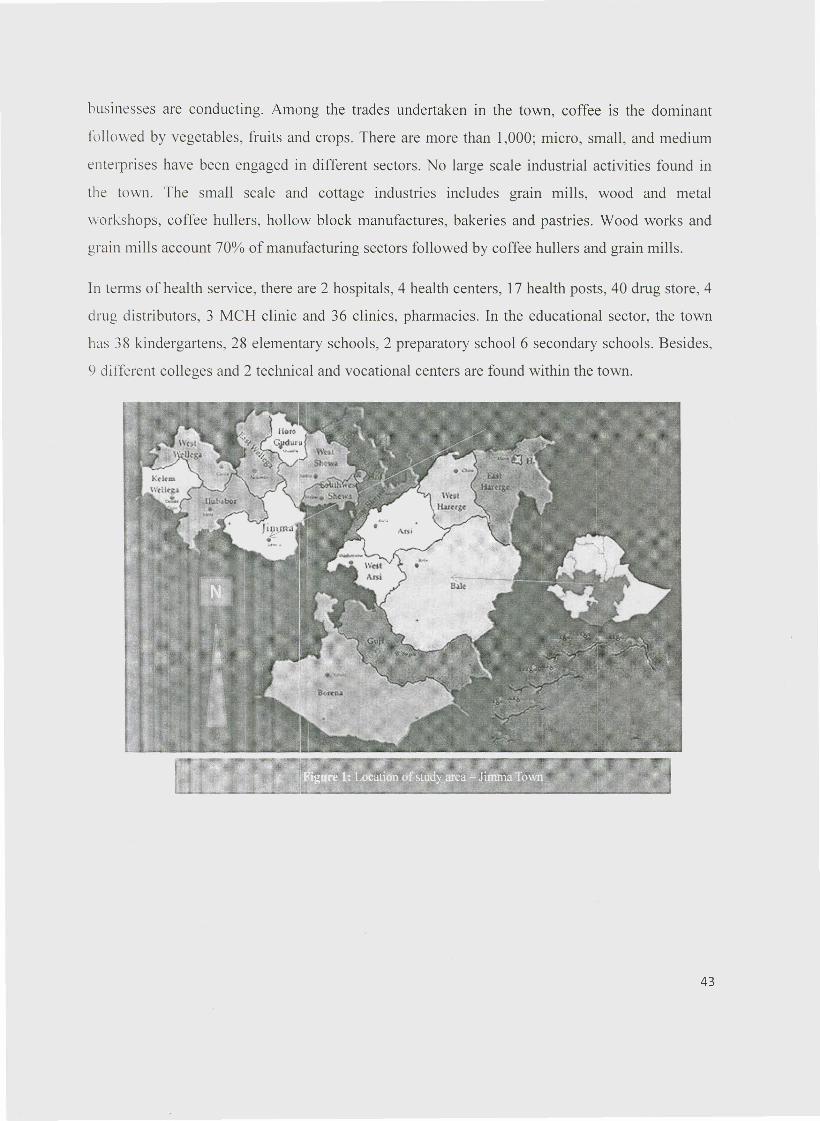
businesses are conducting. Among the trades undertaken in the town, coffee is the dominant
followed by vegetables, fruits and crops. There are more than 1,000; micro, small, and medium
enterprises have been engaged in different sectors. No large scale industrial activities found in
the town. The small scale and cottage industries includes grain mills, wood and metal
workshops, coffee hullers, hollow block manufactures, bakeries and pastries. Wood works and
grain mi lis account 70% of manufacturing sectors followed by coffee hullers and grain mills.
In terms of health service, there are 2 hospitals, 4 health centers, 17 health posts, 40 drug store, 4
drug distributors, 3 MCH clinic and 36 clinics, pharmacies. In the educational sector, the town
has 38 kindergartens, 28 elementary schools, 2 preparatory school 6 secondary schools. Besides,
9 different colleges and 2 technical and vocational centers are found within the town.
43
3.11 Limitations of the Study
Due to time and resource constraints, the study covered only the MSEs located around the sub-
ci ty L 3 and 4 of Jimma town. The choice of sub- city 1, 3 and 4 is due to the fact that these sub-
cities has large number of MSEs and well distributed of MSEs. The other limitation was the
MSE reluctant to give their time to respond to the survey questionnaires for various reasons. So,
repeated visits and attempts of clarifying objective of the visit were irritating and time taking.
And also it makes to incur more cost in terms of money and time to collect and distributed
questionnaire so as to maintain the predefined sample size. It was also observed from the
interview that the OCSSCO interviewer was not respond on some issues related to quantitative
variables.
44
CHAPTER FOUR
4. DATA PRESENTATION, ANALYSIS AND
INTERPRETA TION
4.1 Introduction
In the previous chapter, the overall methodology, which was focused on research approach,
research strategy and the specific method of data collection and data analysis used in the study,
has been presented. This chapter is dedicated to present the results and analysis of data collected
\ ia questionnaire, semi-structured interview and document analysis. Hence, the chapter was
di vided in to two main sub-sections. The first section presented and discussed descriptive statics
results related with the demographic factors and the independent variables of the study and then
followed by analysis of variance to examine in the variation on the performance MSEs in
relation to the variables of the study.
Under the first section of this chapter participants' response to the open ended and closed ended
item is presented as "yes" or "no" question to see factors affecting MSEs performance. Whereas,
the Likert scale items dealing with internal and external challenges affecting the performance of
MSE had a value where one represented "strongly disagree" to five "strongly agree" were
analyzed.
Based on the sample for this study, a total of 244 questionnaires were distributed to 46
manufacturing, 33 construction, 60 service, 76 trade and 27 urban agriculture MSE operators.
Out of the distributed questionnaires to manufacturing operators 46(95.8%), service operators
58(96.6%), trade operators 75(98.6%) were returned while the response rate of the construction
and urban agriculture were 100%. Thus, the overall response rate of the five sectors was 239
(98%) and adequate to conduct the analysis on the basis of this response rate.
45
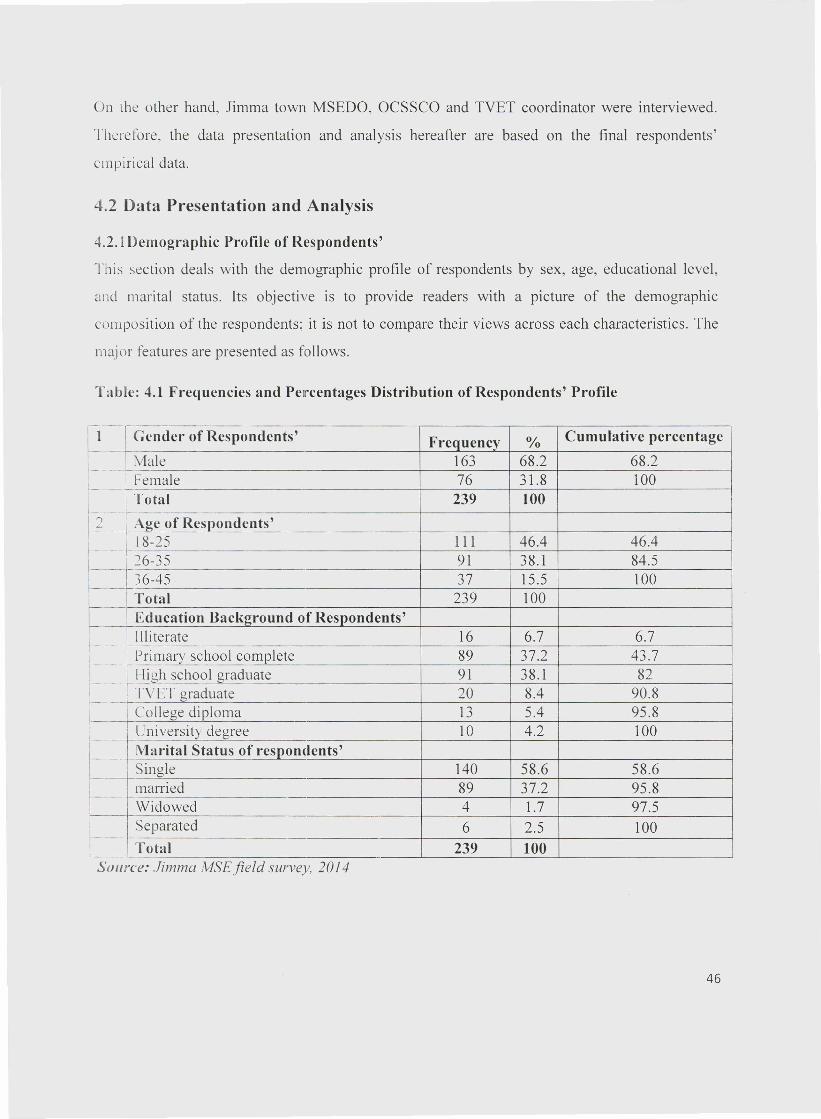
On the other hand, Jimma town MSEDO. OCSSCO and TVET coordinator were interviewed.
Therefore, the data presentation and analysis hereafter are based on the final respondents'
empirical data.
4.2 Data Presentation and Analysis
4.2.1 Demographic Profile of Respondents'
This section deals with the demographic profile of respondents by sex, age, educational level,
and marital status. Its objective is to provide readers with a picture of the demographic
composition of the respondents; it is not to compare their views across each characteristics. The
major features are presented as follows.
Table: 4.1 Frequencies and Percentages Distribution of Respondents' Profile
Q I Gender of Respondents' Frequency 0/0 Cumulative percentage,----i163 68.2 68.2I _~I Malet. I Female 76 31.8 100
! ' Total 239 1001--- I
2 __ I Age of Respondents'r-----, 18-25 111 46.4 46.4
~ 26-35 91 38.1 84.5----1 36-45 37 15.5 100t I Total 239 100_I Education Background of Respondents'
f ____ J Illiterate 16 6.7 6.71 ' Primary school complete 89 37.2 43.7r- ---,--.
lligh school graduate 91 38.1 82---~TV ET graduate 20 8.4 90.8.- -
, College diploma 13 5.4 95.8I-
I University degree 10 4.2 100t Marital Status of respondents'
Single 140 58.6 58.6married 89 37.2 95.8Widowed 4 1.7 97.5Separated 6 2.5 100
l_ Total 239 100-
Source: Jimma MSEfieid survey, 2014
46
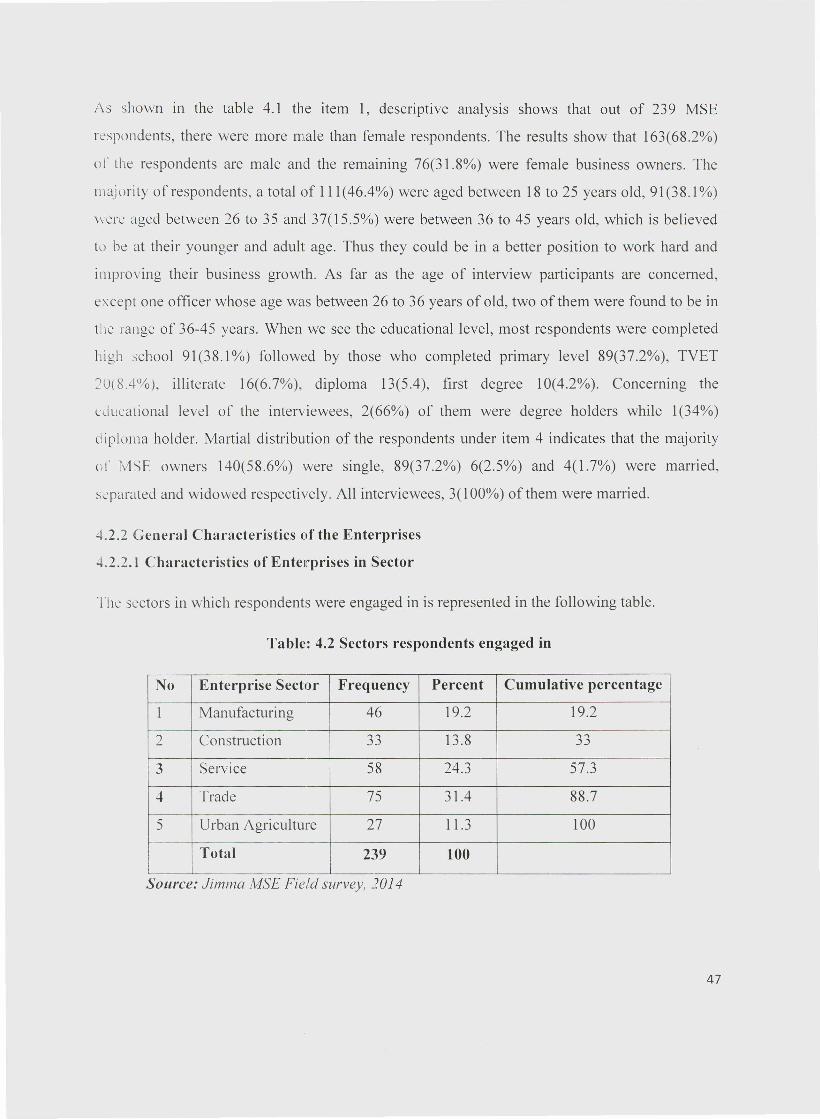
As shown in the table 4.1 the item 1, descriptive analysis shows that out of 239 MSE
respondents, there were more male than female respondents. The results show that 163(68.2%)
or the respondents are male and the remaining 76(31.8%) were female business owners. The
majority of respondents, a total of 111(46.4%) were aged between 18 to 25 years old, 91(38.1%)
were aged between 26 to 35 and 37(15.5%) were between 36 to 45 years old, which is believed
to be at their younger and adult age. Thus they could be in a better position to work hard and
improving their business growth. As far as the age of interview participants are concerned,
except one officer whose age was between 26 to 36 years of old, two of them were found to be in
the range of 36-45 years. When we see the educational level, most respondents were completed
high school 91(38.1 %) followed by those who completed primary level 89(37.2%), TVET
~O(8.4%), illiterate 16(6.7%), diploma l3(5.4), first degree 10(4.2%). Concerning the
educational level of the interviewees, 2(66%) of them were degree holders while 1(34%)
diploma holder. Martial distribution of the respondents under item 4 indicates that the majority
or MSE owners 140(58.6%) were single, 89(37.2%) 6(2.5%) and 4(1.7%) were married,
separated and widowed respectively. All interviewees, 3(100%) of them were married.
4.2.2 General Characteristics of the Enterprises
4.2.2.1 Characteristics of Enterprises in Sector
The sectors in which respondents were engaged in is represented in the following table.
Table: 4.2 Sectors respondents engaged in
No Enterprise Sector Frequency Percent Cumulative percentage
1 Manufacturing 46 19.2 19.2
2 Construction "" 13.8 33.J.J
3 Service 58 24.3 57.3.t Trade 75 31.4 88.7
5 Urban Agriculture 27 11.3 100
Total 239 100
Source: Jimma MSE Field survey, ]014
47
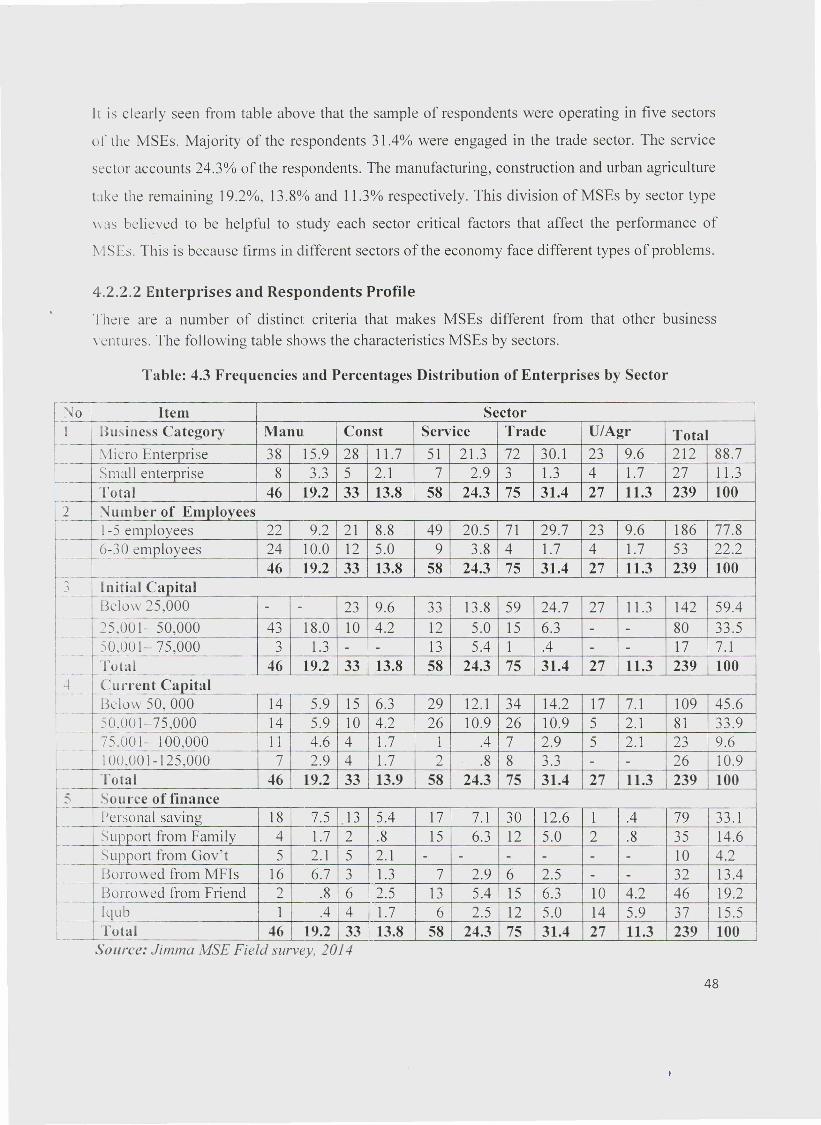
1t is clearly seen from table above that the sample of respondents were operating in five sectors
or the MSEs. Majority of the respondents 31.4% were engaged in the trade sector. The service
sector accounts 24.3% of the respondents. The manufacturing, construction and urban agriculture
take the remaining 19.2%, 13.8% and 11.3% respectively. This division of MSEs by sector type
\\ ClS believed to be helpful to study each sector critical factors that affect the performance of
MSEs. This is because firms in different sectors of the economy face different types of problems.
4.2.2.2 Enterprises and Respondents Profile
There are a number of distinct criteria that makes MSEs different from that other businessventures. The following table shows the characteristics MSEs by sectors.
Table: 4.3 Frequencies and Percentages Distribution of Enterprises by Sector
No Item Sector1 Business Category Manu Const Service Trade U/Agr Total-
Micro Enterprise 38 15.9 28 11.7 51 21.3 72 30.1 23 9.6 212 88.7-
Small enterprise 8,., ,.,
5 2.1 7 2.9,., 1.3 4 1.7 27 11.3J.J J
Total 46 19.2 33 13.8 58 24.3 75 31.4 27 11.3 239 1002 Number of Employees-
1-5 employees 22 9.2 21 8.8 49 20.5 71 29.7 23 9.6 186 77.8-
6-30 employees 24 10.0 12 5.0 9 3.8 4 1.7 4 1.7 53 22.246 19.2 33 13.8 58 24.3 75 31.4 27 11.3 239 100, Initial Capital.)
-Below 25,000 - - 23 9.6 33 13.8 59 24.7 27 11.3 142 59.4
---25,001- 50,000 43 18.0 10 4.2 12 5.0 15 6.3 - - 80 33.5
-50,001-75,000
,., 1.3 13 5.4 1 .4 17 7.1J - - - --_. --Total 46 19.2 33 13.8 58 24.3 75 31.4 27 11.3 239 100--~ -.+ Current Capital--Below 50, 000 14 5.9 15 6.3 29 12.1 34 14.2 17 7.1 109 45.6-- !--
50,001-75,000 14 5.9 10 4.2 26 10.9 26 10.9 5 2.1 81 33.9-- r-
75.001- 100,000 11 4.6 4 1.7 1 .4 7 2.9 5 2.1 23 9.6-- f-
100,001-125,000 7 2.9 4 1.7 2 .8 8 3.3 - - 26 10.9-
Total 46 19.2 33 13.9 58 24.3 75 31.4 27 11.3 239 1005 Source of finance--
Personal saving 18 7.5 13 5.4 17 7.1 30 12.6 1 .4 79 33.1--Support from Family 4 1.7 2 .8 15 6.3 12 5.0 2 .8 35 14.6
-Support from Gov't 5 2.1 5 2.1 - - - - - - 10 4.2--- --Borrowed from MFls 16 6.7 3 1.3 7 2.9 6 2.5 - - 32 13.4Borrowed from Friend 2 .8 6 2.5 13 5.4 15 6.3 10 4.2 46 19.2.- -Iqub 1 .4 4 1.7 6 2.5 12 5.0 14 5.9 37 15.5--- _.
Total 46 19.2 33 13.8 58 24.3 75 31.4 27 11.3 239 100Source: Jimma MSE Field survey, 2014
48
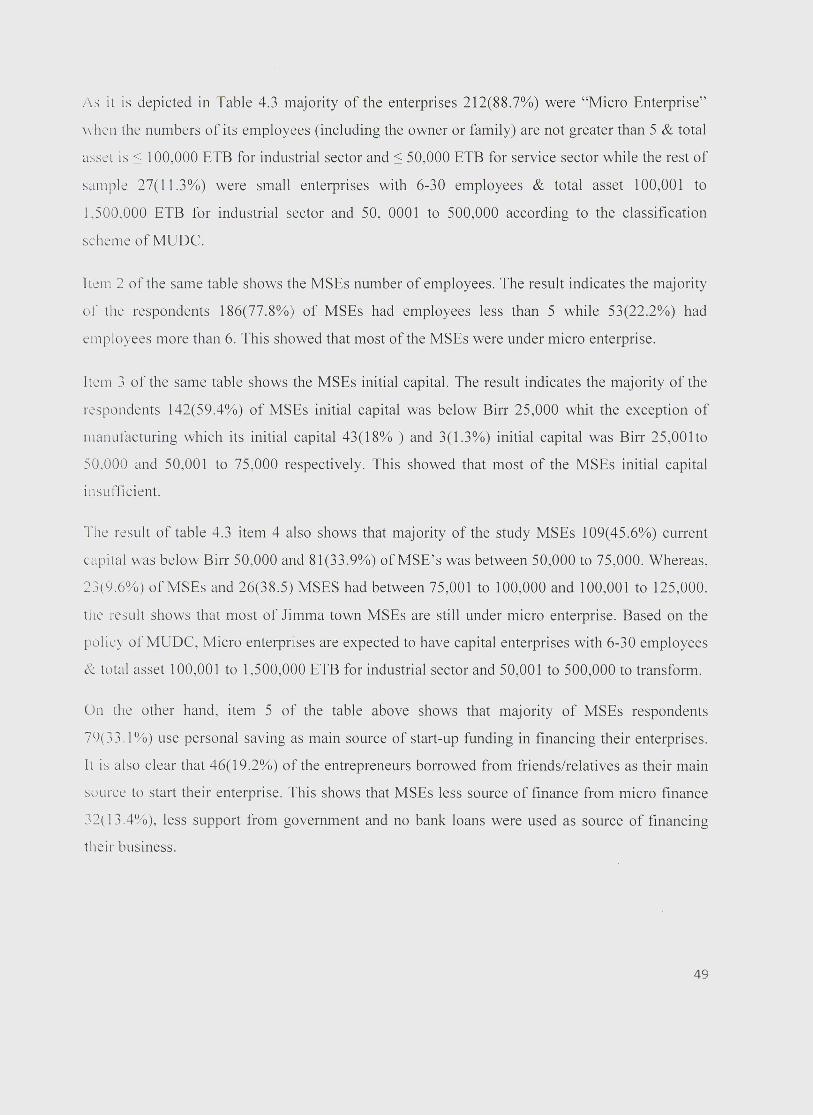
As it is depicted in Table 4.3 majority of the enterprises 212(88.7%) were "Micro Enterprise"
when the numbers of its employees (including the owner or family) are not greater than 5 & total
asset is :s 100,000 ETB for industrial sector and :s 50,000 ETB for service sector while the rest of
sample 27(11.3%) were small enterprises with 6-30 employees & total asset 100,001 to
1.500.000 ETB for industrial sector and 50, 0001 to 500,000 according to the classification
scheme of MUOC.
Item 2 of the same table shows the MSEs number of employees. The result indicates the majority
or the respondents 186(77.8%) of MSEs had employees less than 5 while 53(22.2%) had
employees more than 6. This showed that most of the MSEs were under micro enterprise.
Item 3 of the same table shows the MSEs initial capital. The result indicates the majority of the
respondents 142(59.4%) of MSEs initial capital was below Birr 25,000 whit the exception of
manufacturing which its initial capital 43(18% ) and 3(1.3%) initial capital was Birr 25,001to
50.000 and 50,001 to 75,000 respectively. This showed that most of the MSEs initial capital
insufficient.
The result of table 4.3 item 4 also shows that majority of the study MSEs 109(45.6%) current
capital was below Birr 50,000 and 81(33.9%) ofMSE's was between 50,000 to 75,000. Whereas,
23(9.6%) ofMSEs and 26(38.5) MSES had between 75,001 to 100,000 and 100,001 to 125,000.
the result shows that most of Jimma town MSEs are still under micro enterprise. Based on the
policy ofMUDC, Micro enterprises are expected to have capital enterprises with 6-30 employees
& total asset 100,00 I to 1,500,000 ETB for industrial sector and 50,001 to 500,000 to transform.
On the other hand, item 5 of the table above shows that majority of MSEs respondents
79( 33. I%) use personal saving as main source of start-up funding in financing their enterprises.
It is also clear that 46(19.2%) of the entrepreneurs borrowed from friends/relatives as their main
source to start their enterprise. This shows that MSEs less source of finance from micro finance
32( 13.4%), less support from government and no bank loans were used as source of financing
their business.
49
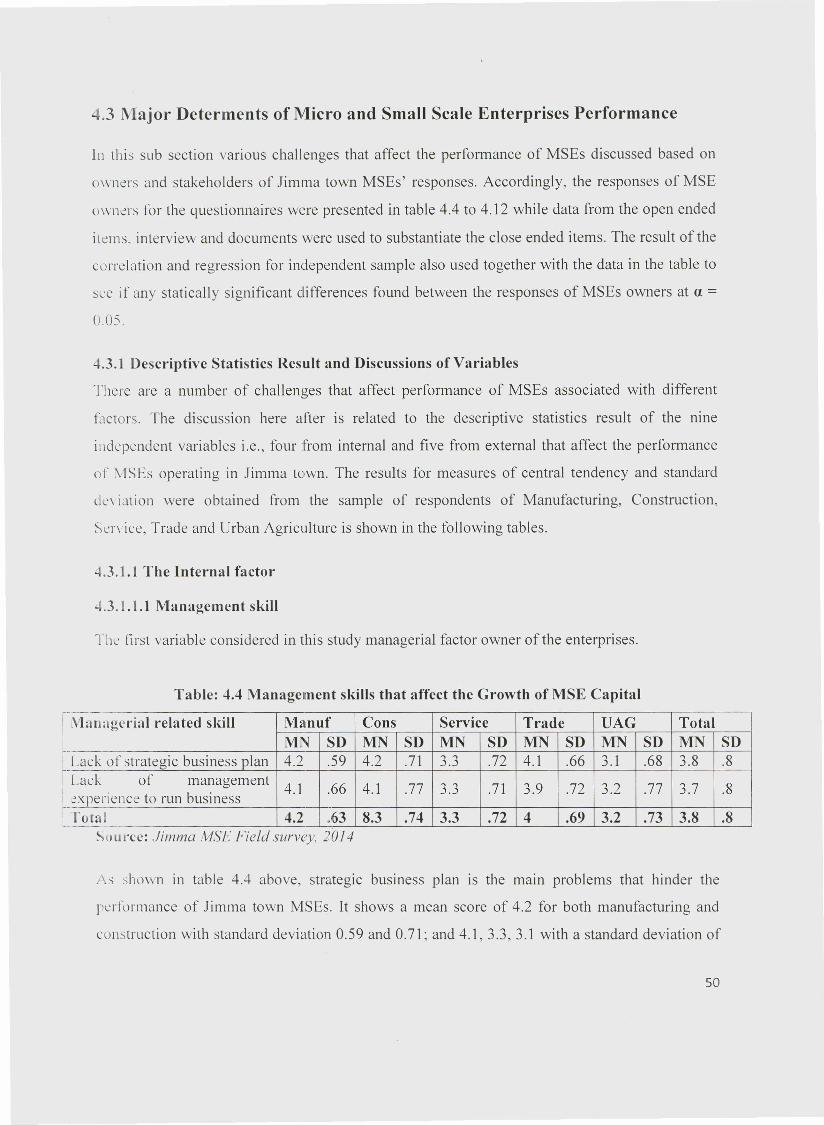
.3 Major Determents of Micro and Small Scale Enterprises Performance
In this sub section various challenges that affect the performance of MSEs discussed based on
owners and stakeholders of Jimma town MSEs' responses. Accordingly, the responses of MSE
owners for the questionnaires were presented in table 4.4 to 4.12 while data from the open ended
items. interview and documents were used to substantiate the close ended items. The result of the
correlation and regression for independent sample also used together with the data in the table to
see if any statically significant differences found between the responses of MSEs owners at (l =0.05.
4.3.1 Descriptive Statistics Result and Discussions of Variables
There are a number of challenges that affect performance of MSEs associated with different
factors. The discussion here after is related to the descriptive statistics result of the nine
independent variables i.e., four from internal and five from external that affect the performance
or MSEs operating in Jimma town. The results for measures of central tendency and standard
dc\ iation were obtained from the sample of respondents of Manufacturing, Construction,
Service, Trade and Urban Agriculture is shown in the following tables.
4.3.1.1 The Internal factor
4.3.1.1.1 Management skill
The first variable considered in this study managerial factor owner of the enterprises.
Table: 4.4 Management skills that affect the Growth of MSE Capital
Managerial related skill Manuf Cons Service Trade VAG TotalMN SD MN SD MN SD MN SD MN SD MN SD
Lack of strategic business plan 4.2 .59 4.2 .71 3.3 .72 4.1 .66 3.1 .68 3.8 .8Lack of management 4.1 .66 4.1 .77 3.3 .71 3.9 .72 3.2 .77 3.7 .8experience to run business
-
Total 4.2 .63 8.3 .74 3.3 .72 4 .69 3.2 .73 3.8 .8-_.
Source: Jimma MSE Field survey, 2014
j s shown in table 4.4 above, strategic business plan is the mam problems that hinder the
performance of Jimma town MSEs. It shows a mean score of 4.2 for both manufacturing and
construction with standard deviation 0.59 and 0.71; and 4.1, 3.3, 3.1 with a standard deviation of
50
U.66. 0.72 and 0.68 for enterprise engaged in trade, service and urban agriculture respectively.
Therefore, the average score of the respondents with regard to strategic plan indicates their
agreement with little deviations among them.
Regards to management experience the mean scores are 4.1 for both manufacturing and
construction with standard deviation 0.66 and 0.77; and 3.9, 3.3, 3.2 with a standard deviation of
0.72. 0.71 and 0.77 for enterprise engaged in trade, service and urban agriculture respectively.
The likert scale result shows that 112(46.8%) of the respondents agreed that managerial skills
lead to enterprise capital growth through improving business plan and relevant managerial skills
in fields like finance and human resource, thus attracting many of the customers.
As interview, open and close ended items conducted with operators of MSEs, it was confirmed
that f\ [SEs has many management problems business plan and management experience to run
their business. Accordingly, respondents were indicating the managerial problems faced by them
as follows. Most of these enterprises 163(68.2%) operate without business plan while 76(31.8%)
has plan less than one year. In line with interviewees commonly indicated that, 90% of micro
finance institutions loan allowance for MSE owners relay on business plan. So MSEs do not get
loan from micro finance institutions and fail before two years. Similarly, regarding management
practice majority of MSE owners 187(78.2%) do not have prior business management
experience while 37(15.5%) has manage experience.
To conclude, all these were by the respondents in this survey confirmed that management skill
\\ hich constitute (business plan and managerial practice) is a factor that hinders the MSE's
performance .
.3.1.1.2 Access oflnternal Finance
Starling own business requires finance. In order to get representative information regarding the
relative importance of the financial factor, owners were asked their initial capital, source of
finance, expenses and the way price product cost and whether they ever received credit from
each of a given list of sources of finance. The following table 4.5 bellow depicts various
challenges related MSEs finance.
51
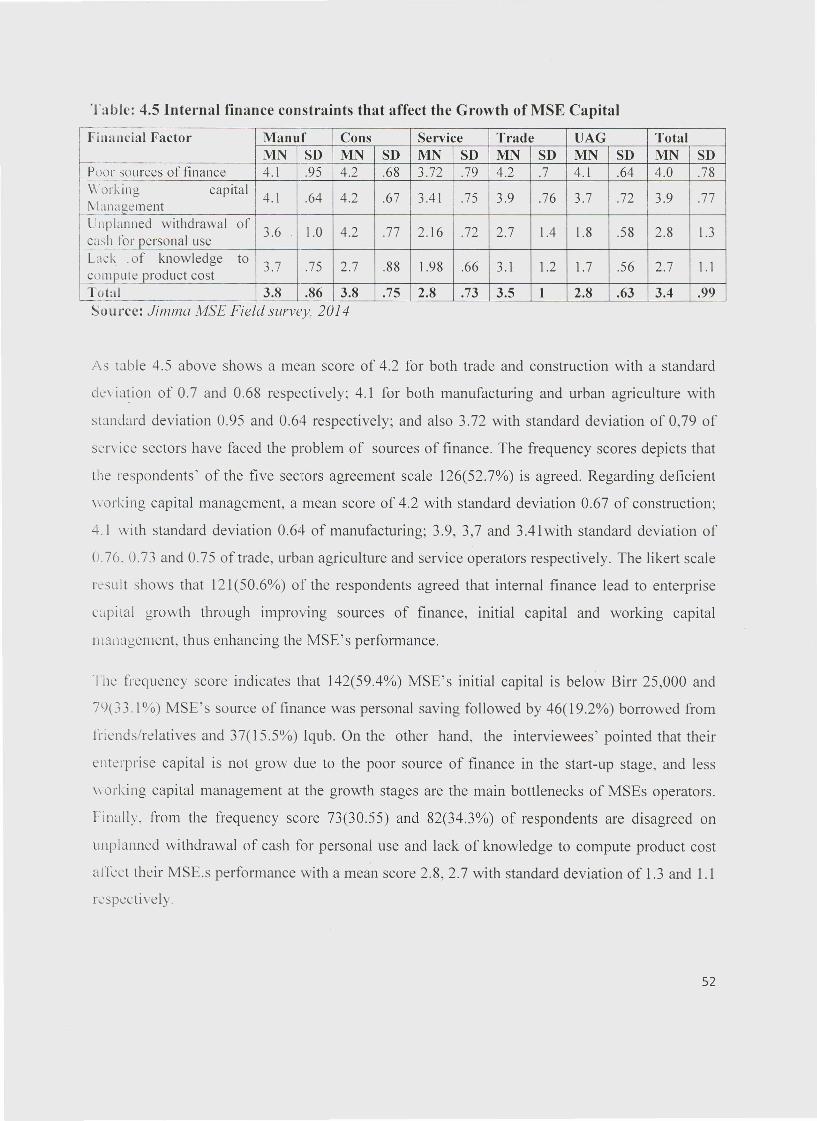
Table: 4.5 Internal finance constraints that affect the Growth of MSE Capital
I Financial Facto, Manuf Cons Service Trade VAG TotalMN SD MN SD MN SD MN SD MN SD MN SD
Poor sources of finance 4.1 .95 4.2 .68 3.72 .79 4.2 .7 4.1 .64 4.0 .78~. I' '1I or ,(lllg caprta 4.1 .64 4.2 .67 3.41 .75 3.9 .76 3.7 .72 3.9 .77Mnnaaementrc;lplanned withdrawal of 3.6 1.0 4.2 .77 2.16 .72 2.7 1.4 1.8 .58 2.8 1.3
cash for personal useLack .of knowledge to 3.7 .75 2.7 .88 1.98 .66 3.1 1.2 1.7 .56 2.7 1.1compute product costTotal 3.8 .86 3.8 .75 2.8 .73 3.5 1 2.8 .63 3.4 .99'---.Source: Jimma MSE Field survey, 2014
As table 4.5 above shows a mean score of 4.2 for both trade and construction with a standard
deviation of 0.7 and 0.68 respectively; 4.1 for both manufacturing and urban agriculture with
standard deviation 0.95 and 0.64 respectively; and also 3,72 with standard deviation of 0,79 of
service sectors have faced the problem of sources of finance. The frequency scores depicts that
the respondents' of the five sectors agreement scale 126(52.7%) is agreed, Regarding deficient
working capital management, a mean score of 4.2 with standard deviation 0.67 of construction;
4.1 with standard deviation 0,64 of manufacturing; 3.9, 3,7 and 3,41with standard deviation of
0.76.0.73 and 0.75 of trade, urban agriculture and service operators respectively. The likert scale
result shows that 121(50.6%) of the respondents agreed that internal finance lead to enterprise
capital growth through improving sources of finance, initial capital and working capital
management, thus enhancing the MSE's performance,
The frequency score indicates that 142(59,4%) MSE's initial capital is below Birr 25,000 and
79(33.1 %) MSE's source of finance was personal saving followed by 46(19,2%) borrowed from
friends/relatives and 37(15.5%) Iqub. On the other hand, the interviewees' pointed that their
enterprise capital is not grow due to the poor source of finance in the start-up stage, and less
\\ orking capital management at the growth stages are the main bottlenecks of MSEs operators.
Finally, from the frequency score 73(30,55) and 82(34,3%) of respondents are disagreed on
unplanned withdrawal of cash for personal use and lack of knowledge to compute product cost
affect their MSE.s performance with a mean score 2.8, 2.7 with standard deviation of 1.3 and 1.1
respectively.
52
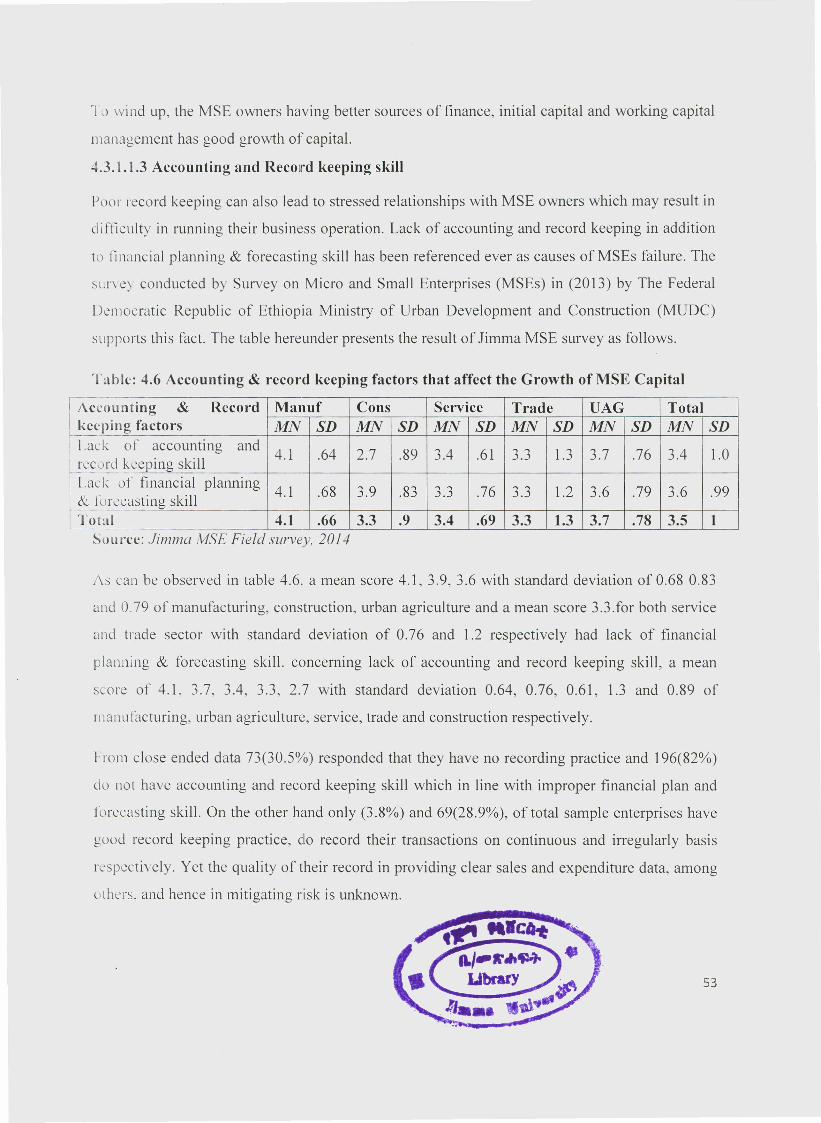
To wi nd up, the MSE owners having better sources of finance, initial capital and working capital
management has good growth of capital.
4.3. t .1.3 Accounting and RecoJrd keeping skill
Poor record keeping can also lead to stressed relationships with MSE owners which may result in
difficulty in running their business operation. Lack of accounting and record keeping in addition
to financial planning & forecasting skill has been referenced ever as causes of MSEs failure. The
SUl'\ e) conducted by Survey on Micro and Small Enterprises (MSEs) in (2013) by The Federal
Democratic Republic of Ethiopia Ministry of Urban Development and Construction (MUDC)
supports this fact. The table hereunder presents the result of Jimma MSE survey as follows.
Table: 4.6 Accounting & record keeping factors that affect the Growth ofMSE Capital
! Accounting & Record Manuf Cons Service Trade VAG TotalI keeping factors MN SD MN SD MN SD MN SD MN SD MN SDI Lack or accounting and 4.1 .64 2.7 .89 3.4 .61 3.3 l.3 3.7 .76 3.4 1.0r rec rd keeping skill
Lack of financial planning 4.1 .68 3.9 .83 " " .76 3.3 1.2 3.6 .79 3.6 .99Q forecasting skill.J . .J
Total 4.1 .66 3.3 .9 3.4 .69 3.3 1.3 3.7 .78 3.5 1Source: Jimma MSE Field survey. 2014
As can be observed in table 4.6 ..a mean score 4.1, 3.9, 3.6 with standard deviation of 0.68 0.83
and 0.79 of manufacturing, construction, urban agriculture and a mean score 3.3.for both service
and trade sector with standard deviation of 0.76 and 1.2 respectively had lack of financial
planning & forecasting skill. concerning lack of accounting and record keeping skill, a mean
score of 4. L 3.7. 3.4, 3.3, 2.7 with standard deviation 0.64, 0.76, 0.61, l.3 and 0.89 of
manufacturing, urban agriculture, service, trade and construction respectively.
From close ended data 73(30.5%) responded that they have no recording practice and 196(82%)
do not have accounting and record keeping skill which in line with improper financial plan and
forecasting skill. On the other hand only (3.8%) and 69(28.9%), of total sample enterprises have
good record keeping practice, clo record their transactions on continuous and irregularly basis
respectively. Yet the quality of their record in providing clear sales and expenditure data, among
others. and hence in mitigating risk is unknown.
53
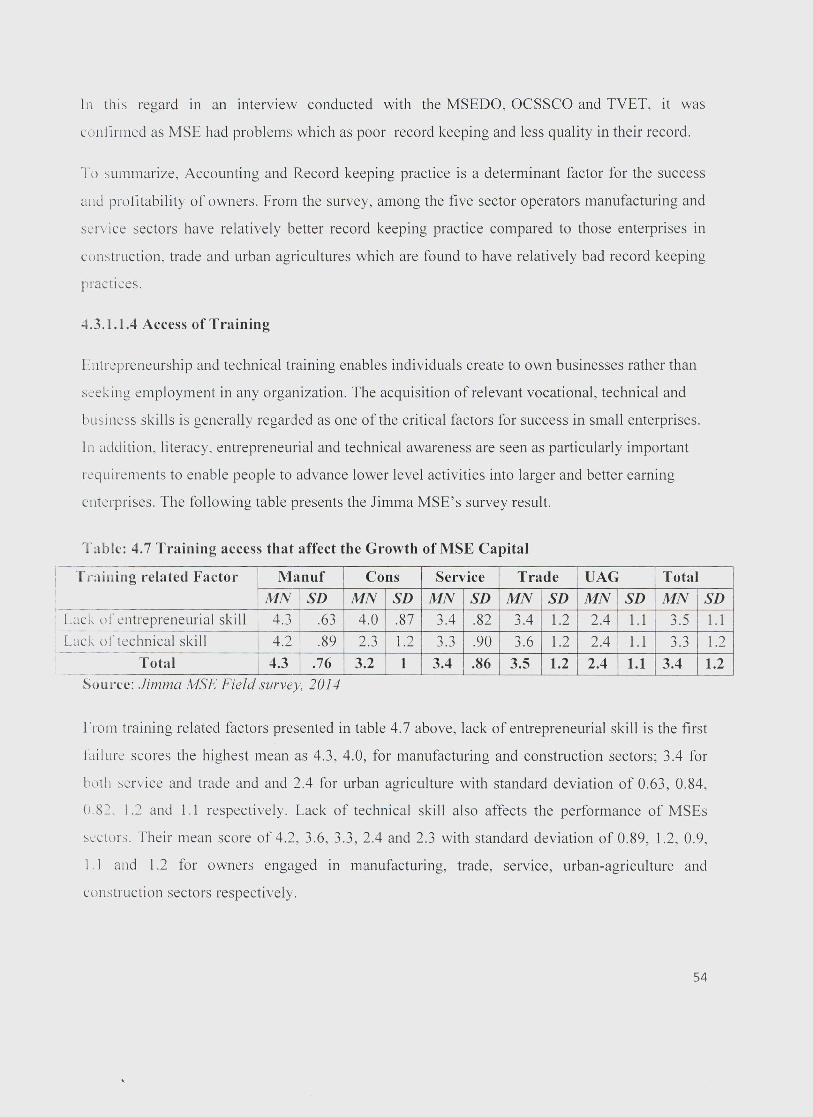
In this regard in an interview conducted with the MSEDO, OCSSCO and TVET, it was
confirmed as MSE had problems which as poor record keeping and less quality in their record.
To summarize, Accounting and Record keeping practice is a determinant factor for the success
and profitability of owners. From the survey, among the five sector operators manufacturing and
service sectors have relatively better record keeping practice compared to those enterprises in
construction, trade and urban agricultures which are found to have relatively bad record keeping
practices.
4.3.1.1.4 Access of Training
Entrepreneurship and technical training enables individuals create to own businesses rather than
seeking employment in any organization. The acquisition of relevant vocational, technical and
busi ness skills is generally regarded as one of the critical factors for success in small enterprises.
In addition, literacy, entrepreneurial and technical awareness are seen as particularly important
requirements to enable people to advance lower level activities into larger and better earning
enterprises. The following table presents the Jimma MSE's survey result.
Table: 4.7 Training access that affect the Growth of MSE Capital
TI'aining related Factor Manuf Cons Service Trade VAG TotalMN SD MN SD MN SD MN SD MN SD MN SD
k 01" entrepreneurial skill 4.3 .63 4.0 .87 3.4 .82 3.4 1.2 2.4 1.1 3.5 1.1k oftechnical skill 4.2 .89 2.3 1.2 " " .90 3.6 1.2 2.4 1.1 3.3 1.2-'.-'
Total 4.3 .76 3.2 1 3.4 .86 3.5 1.2 2.4 1.1 3.4 1.2
,--LacLac
1---1
Source: Jimma MSE Field survey, 2014
From training related factors presented in table 4.7 above, lack of entrepreneurial skill is the first
failure scores the highest mean as 4.3, 4.0, for manufacturing and construction sectors; 3.4 for
both service and trade and and 2.4 for urban agriculture with standard deviation of 0.63, 0.84,
(J.82. 1.2 and 1.1 respectively. Lack of technical skill also affects the performance of MSEs
sectors. Their mean score of 4.2, 3.6, 3.3, 2.4 and 2.3 with standard deviation of 0.89, 1.2, 0.9,
1.1 and 1.2 for owners engaged in manufacturing, trade, service, urban-agriculture and
construction sectors respectively.
S4
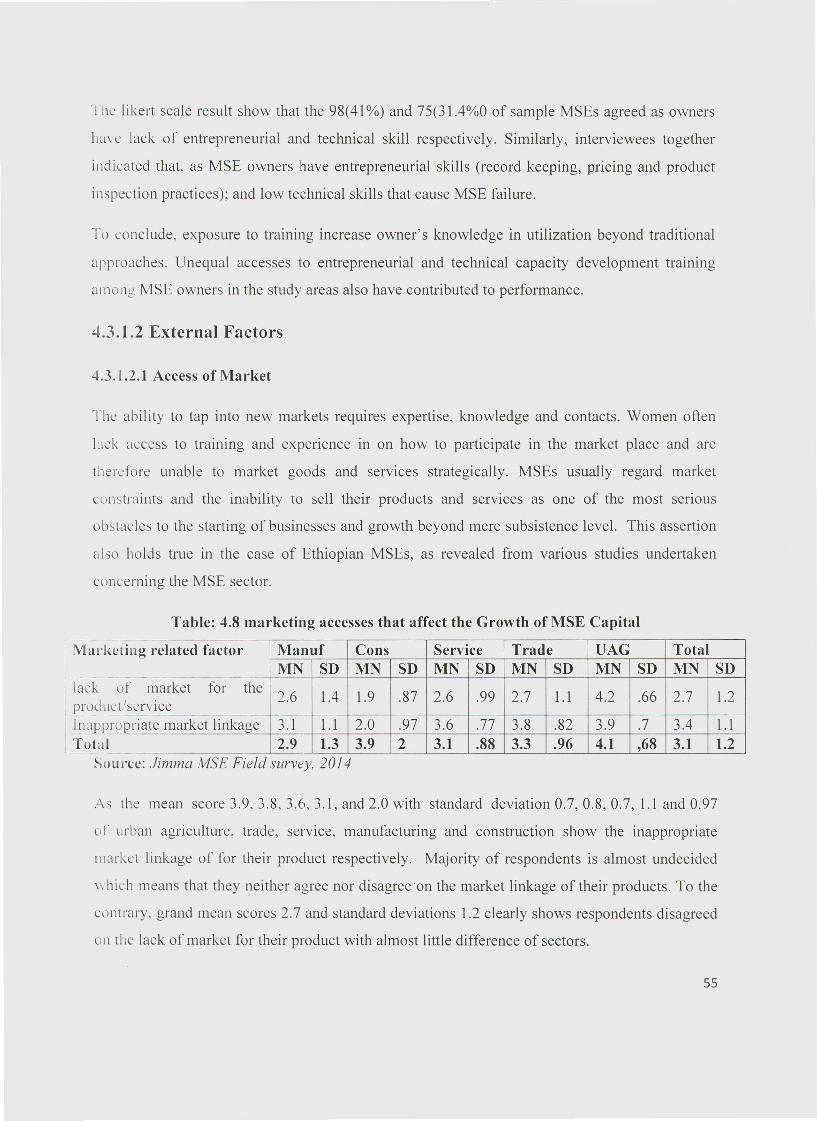
The likert scale result show that the 98(41 %) and 75(31.4%0 of sample MSEs agreed as owners
have lack of entrepreneurial and technical skill respectively. Similarly, interviewees together
indicated that, as MSE owners have entrepreneurial skills (record keeping, pricing and product
inspection practices); and low technical skills that cause MSE failure.
To conclude, exposure to training increase owner's knowledge in utilization beyond traditional
approaches. Unequal accesses to entrepreneurial and technical capacity development training
among MSE owners in the study areas also have contributed to performance.
4.3.1.2 External Factors
4.3.1.2.1 Access of Market
The ability to tap into new markets requires expertise, knowledge and contacts. Women often
luck access to training and experience in on how to participate in the market place and are
therefore unable to market goods and services strategically. MSEs usually regard market
constraints and the inability to sell their products and services as one of the most senous
obstacles to the starting of businesses and growth beyond mere subsistence level. This assertion
also holds true in the case of Ethiopian MSEs, as revealed from various studies undertaken
concerning the MSE sector.
Table: 4.8 marketing accesses that affect the Growth of MSE Capital
r Mar kcting related factor Manuf Cons Service Trade VAG TotalMN SD MN SD MN SD MN SD MN SD MN SD-
of market for the 2.6 1.4 l.9 .87 2.6 .99 2.7 l.1 4.2 .66 2.7 l.2rei/serviceoropriate market linkage 3.1 l.1 2.0 .97 3.6 .77 3.8 .82 3.9 .7 3.4 l.1I 2.9 1.3 3.9 2 3.1 .88 3.3 .96 4.1 ,68 3.1 1.2
,---I lack12.!~Odl
In,lPI~Tota
Source: Jimma MSE Field survey, 2014
As the mean score 3.9, 3.8,3.6,3.1, and 2.0 with standard deviation 0.7,0.8,0.7, l.1 and 0.97
or urban agriculture, trade, service, manufacturing and construction show the inappropriate
market linkage of for their product respectively. Majority of respondents is almost undecided
which means that they neither agree nor disagree'on the market linkage of their products. To the
contrary. grand mean scores 2.7 and standard deviations l.2 clearly shows respondents disagreed
on the lack of market for their product with almost little difference of sectors.
55
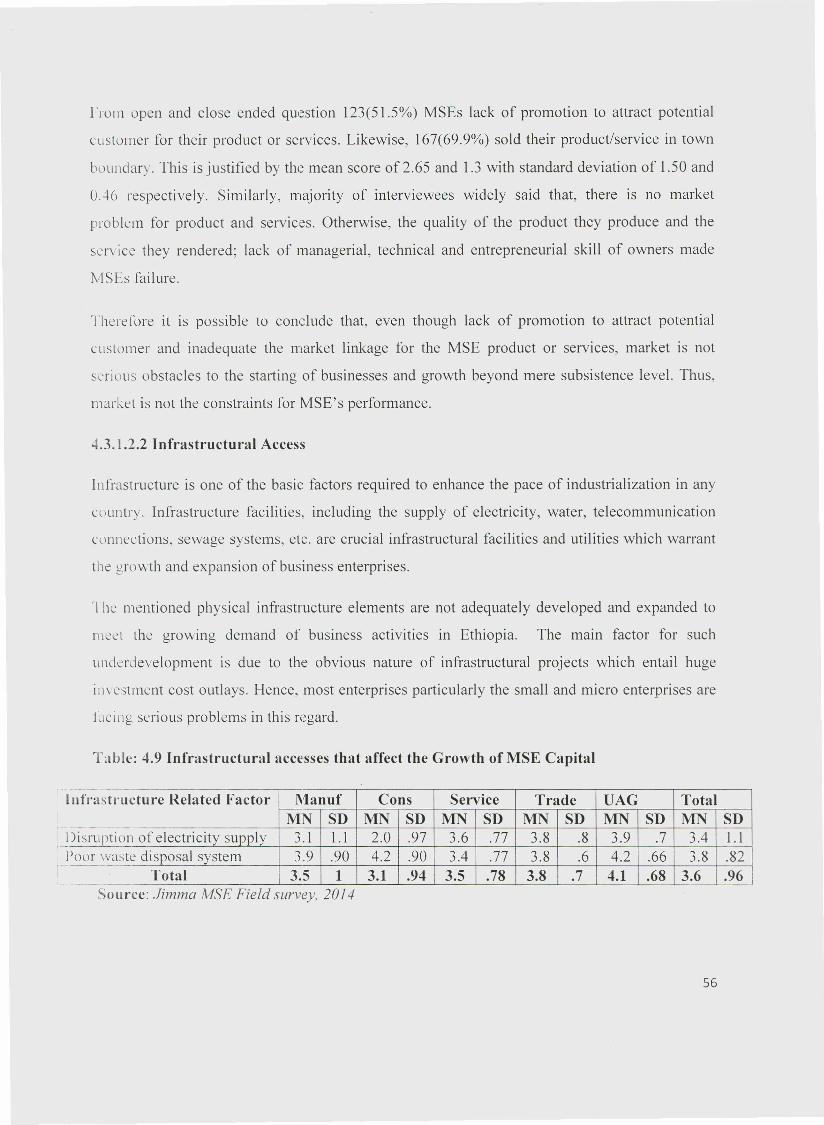
lrorn open and close ended question 123(51.5%) MSEs lack of promotion to attract potential
customer for their product or services. Likewise, 167(69.9%) sold their product/service in town
boundary. This is justified by the mean score of 2.65 and 1.3 with standard deviation of 1.50 and
0.46 respectively. Similarly, majority of interviewees widely said that, there is no market
problem for product and services. Otherwise, the quality of the product they produce and the
service they rendered; lack of managerial, technical and entrepreneurial skill of owners made
MSLs failure.
Therefore it is possible to conclude that, even though lack of promotion to attract potential
customer and inadequate the market linkage for the MSE product or services, market is not
serious obstacles to the starting of businesses and growth beyond mere subsistence level. Thus,
market is not the constraints for MSE's performance.
4.3.1.2.2 Infrastructural Access
Infrastructure is one of the basic factors required to enhance the pace of industrialization in any
country. Infrastructure facilities, including the supply of electricity, water, telecommunication
connections, sewage systems, etc. are crucial infrastructural facilities and utilities which wan-ant
the grow th and expansion of business enterprises.
The mentioned physical infrastructure elements are not adequately developed and expanded to
meet the growing demand of business activities in Ethiopia. The main factor for such
underdevelopment is due to the obvious nature of infrastructural projects which entail huge
investrnent cost outlays. Hence, most enterprises particularly the small and micro enterprises are
being serious problems in this regard.
Table: 4.9 Infrastructural accesses that affect the Growth of MSE Capital
Infrastructure Related Factor Manuf Cons Service Trade VAG TotalMN SD MN SD MN SD MN SD MN SD MN SD
)isruption of electricity supply 3.1 1.1 2.0 .97 3.6 .77 3.8 .8 3.9 .7 3.4 1.1)oor waste disposal system 3.9 .90 4.2 .90 3.4 .77 3.8 .6 4.2 .66 3.8 .82
Total 3.5 1 3.1 .94 3.5 .78 3.8 .7 4.1 .68 3.6 .96Source: Jimma MSE Field survey. 2014
56
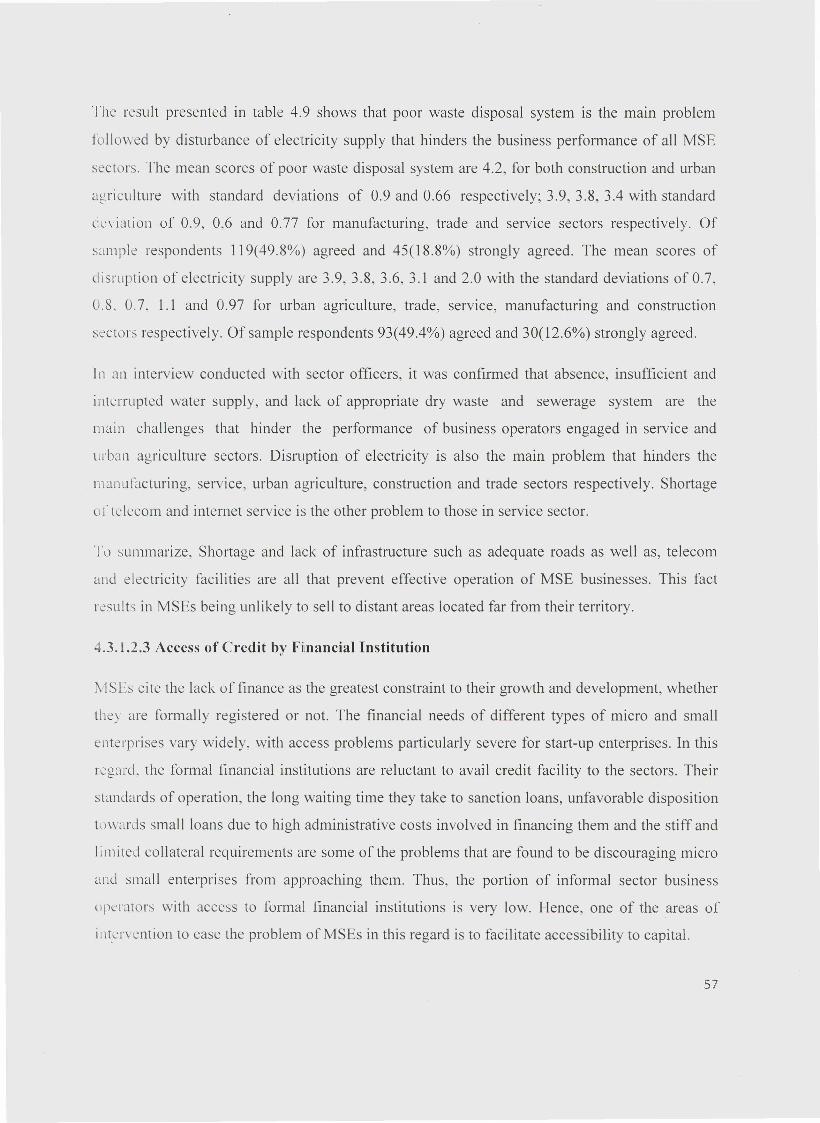
The result presented in table 4.9 shows that poor waste disposal system is the main problem
followed by disturbance of electricity supply that hinders the business performance of all MSE
sectors. The mean scores of poor waste disposal system are 4.2, for both construction and urban
agriculture with standard deviations of 0.9 and 0.66 respectively; 3.9, 3.8, 3.4 with standard
deviation of 0.9, 0.6 and 0.77 for manufacturing, trade and service sectors respectively. Of
sample respondents 119(49.8%) agreed and 45(18.8%) strongly agreed. The mean scores of
disruption of electricity supply are 3.9, 3.8, 3.6, 3.1 and 2.0 with the standard deviations of 0.7,
0.8. 0.7, 1.1 and 0.97 for urban agriculture, trade, service, manufacturing and construction
sectors respectively. Of sample respondents 93(49.4%) agreed and 30(12.6%) strongly agreed.
In an interview conducted with sector officers, it was confirmed that absence, insufficient and
interrupted water supply, and lack of appropriate dry waste and sewerage system are the
main challenges that hinder the performance of business operators engaged in service and
urban agriculture sectors. Disruption of electricity is also the main problem that hinders the
manufacturing, service, urban agriculture, construction and trade sectors respectively. Shortage
01' lelccom and internet service is the other problem to those in service sector.
To summarize, Shortage and lack of infrastructure such as adequate roads as well as, telecom
and electricity facilities are all that prevent effective operation of MSE businesses. This fact
results in MSEs being unlikely to sell to distant areas located far from their territory.
4.3.1.2.3 Access of Credit by Fiinancial Institution
!\/ISEs cite the lack of finance as the greatest constraint to their growth and development, whether
the) are formally registered or not. The financial needs of different types of micro and small
enterprises vary widely, with access problems particularly severe for start-up enterprises. In this
regard. the formal financial institutions are reluctant to avail credit facility to the sectors. Their
standards of operation, the long waiting time they take to sanction loans, unfavorable disposition
towards small loans due to high administrative costs involved in financing them and the stiff and
limited collateral requirements are some of the problems that are found to be discouraging micro
and small enterprises from approaching them. Thus, the portion of informal sector business
operators with access to formal financial institutions is very low. Hence, one of the areas of
intervention to ease the problem ofMSEs in this regard is to facilitate accessibility to capital.
57
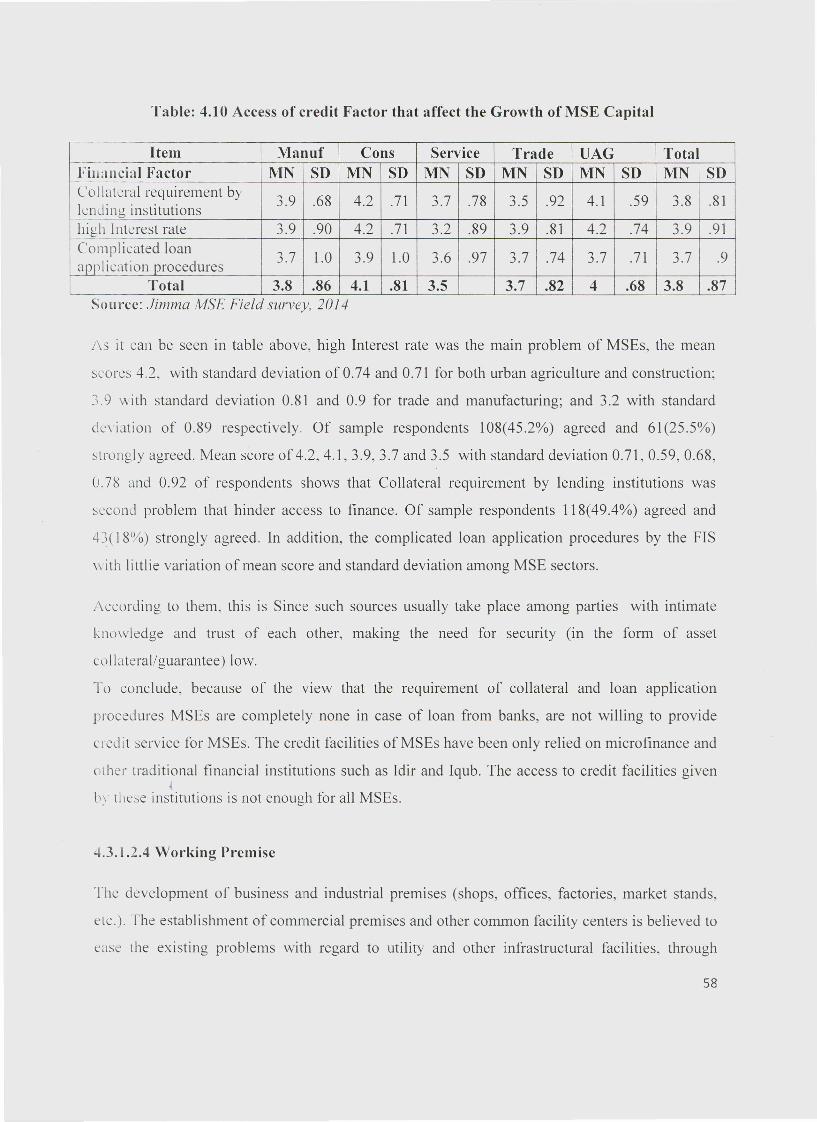
Table: 4.10 Access of credit Factor that affect the Growth of MSE Capital
---Item Manuf Cons Service Trade VAG Total
f------
Financial Factor MN SD MN SD MN SD MN SD MN SD MN SDCollateral requirement by 3.9 .68 4.2 .71 3.7 .78 3.5 .92 4.1 .59 3.8 .81lending institutionshigh Interest rate 3.9 .90 4.2 .71 3.2 .89 3.9 .81 4.2 .74 3.9 .91Complicated loan 3.7 1.0 3.9 1.0 3.6 .97 3.7 .74 3.7 .71 3.7 .9application procedures
Total 3.8 .86 4.1 .81 3.5 3.7 .82 4 .68 3.8 .87Source: Jimma MSE Field survey, 2014
As it can be seen in table above, high Interest rate was the main problem of MSEs, the mean
scores 4.2, with standard deviation of 0.74 and 0.71 for both urban agriculture and construction;
3.9 with standard deviation 0.81 and 0.9 for trade and manufacturing; and 3.2 with standard
deviation of 0.89 respectively. Of sample respondents 108(45.2%) agreed and 61(25.5%)
strongly agreed. Mean score of 4.2,4.1,3.9,3.7 and 3.5 with standard deviation 0.71,0.59,0.68,
0.78 and 0.92 of respondents shows that Collateral requirement by lending institutions was
second problem that hinder access to finance. Of sample respondents 118(49.4%) agreed and
4~( 18%) strongly agreed. In addition, the complicated loan application procedures by the FIS
\\ ith littIie variation of mean score and standard deviation among MSE sectors.
According to them, this is Since such sources usually take place among parties with intimate
knowledge and trust of each other, making the need for security (in the form of asset
collateral/ guarantee) low.
To conclude, because of the VIew that the requirement of collateral and loan application
procedures MSEs are completely none in case of loan from banks, are not willing to provide
credit service for MSEs. The credit facilities of MSEs have been only relied on microfinance and
other traditional financial institutions such as Idir and Iqub. The access to credit facilities given•b~ these institutions is not enough for all MSEs .
.3.1.2.4 Working Premise
The development of business and industrial premises (shops, offices, factories, market stands,
eic.). The establishment of commercial premises and other common facility centers is believed to
case the existing problems with regard to utility and other infrastructural facilities, through
58
sharing installation costs among beneficiaries and making efficient use of resources. Such
services could be given to the needy and emergent enterprises at affordable rents. The
implementation of such activities will be as follows:
Table: 4.11 working promises that affect the Growth of MSE Capital
Wor-king promises related Manuf Cons Service Trade VAG Totalfactor MN SD MN SD MN SD MN SD MN SD MN SD---Absence of own premises (land) 3.5 1.1 1.9 .91 3.31 .73 4.0 .77 4.2 .64 3.5 1.1to run business----inadequate working place for 3.7 .98 2.2 1.3 3.16 ,93 4.2 .58 4.3 .72 3.6 1.1business operation
Total 3.6 1.1 2.1 1.1 3.2 0.8 4.1 .68 4.3 .68 3.6 1.1Source: Jimma MSE Field survey, 2014
As it can be seen in table above, inadequate working place for business operation is the main
problem of MSEs. The mean scores are 4.3, 4.2,3.7 3.16 and 2.2 with and standard deviations
0.72, 0.58, 0.98, 3.16 and 1.3 for urban agriculture, trade, manufacturing, service and
construction respectively. Of sample respondents 101(42.3%) agreed and 49(20.5%) strongly
agreed. The mean and standard deviation of absence of own premises (land) to run business are
4.2,4.0,3.5,3.31 and 1.9 with standard deviation 0.64,0.77, 1.1,0.73 and 0.91 for urban
agriculture, trade, manufacturing, service and construction respectively. Of sample respondents
98(41%) agreed and 37(15.5%) strongly agreed.
According to the interview with the officials, the municipality in providing working premises
(land). the OCSSCO providing loan and TVET provide training to MSEs. In contrast to this,
according to some interviewees of MSEs operators, lack of working place is the major problem
followed by absence of own premises (land) to run their business.
To conclude, though municipality providing working promises to MSEs, the number of MSEs
and promises providing is not related. Thus, working promises related factor is the main
constraints among factors.
59
.3. t .2.5 Government Policy
Inappropriate or unduly restrictive legislative and regulatory conditions are often viewed as
critical constraints on micro and small enterprises access to market and as obstacles to their
growth. Since the federal and regional governments are responsible for the legislative and
regulatory framework and its ongoing adjustment, it is also their role to assure the
appropriateness of these rules and regulations for the micro and small enterprise sector at all
levels.
Cl'he government IS committed towards appropriate regulations, which are the result of
tr.uisparent. consultative processes, with all the interested groups having a chance to state their
interests and concerns, and with national economic growth and job creation framework as its
overriding objective.
Based on this approach the MSE strategy, in co-operation with the regional bureau, the Federal
Agency and Regional MSE development and promotion agencies, or the designated organs will
closely monitor and. where necessary, co-ordinate and assist the regulatory reform process, with
particular emphasis on the following spheres:
j sscssments by different Federal government ministries and Regional government bureau and
consultations with relevant stakeholders about the appropriateness of existing and proposed
legislation and regulations in the fields of tax assessment, registration and licensing, tendering
procedures, and how they can be made more suitable for small enterprises.
The government. in this regard shall also establish a user-friendly environment for the
simplification and standardization of documents. This includes: business registration and
licensing; financial and loan applications; purchasing and sub-contracting (tender) document;
export documentation and other commercial documents; registration of contracts with
municipalities, authentication of contracts at notary public and simplified tax declaration forms
for small businesses.
In this regard a task group will be appointed from among relevant government departments and
concerned parties to study and make recommendations about the simplification of existing
60
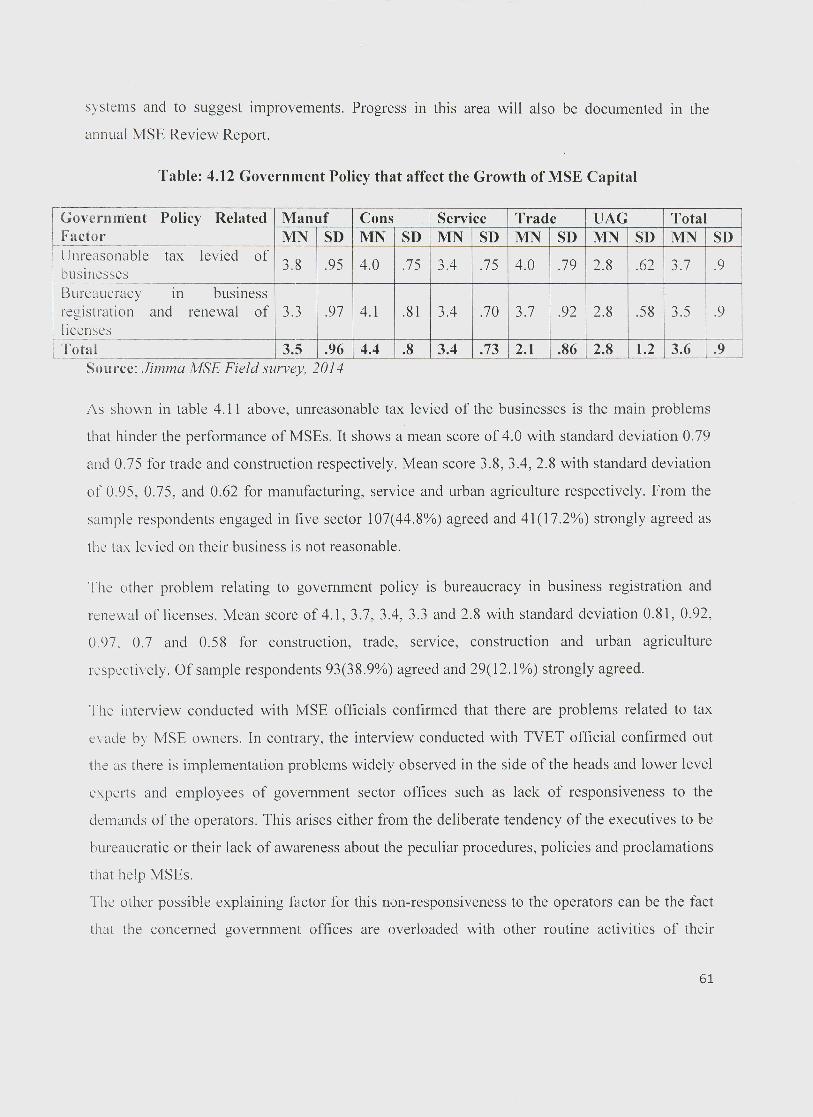
systems and to suggest improvements. Progress in this area will also be documented in the
annual MSE Review Report.
Table: 4.12 Government Policy that affect the Growth of MSE Capital
Government Policy Related Manuf Cons Service Trade VAG TotalFactor MN SD MN SD MN SD MN SD MN SD MN SDUnreasonable tax levied of 3.8 .95 4.0 .75 3.4 .75 4.0 .79 2.8 .62businesses 3.7 .9
Bureaucracy in businessregistration and renewal of 3.3 .97 4.1 .81 3.4 .70 3.7 .92 2.8 .58 3.5 .9licensesTotal 3.5 .96 4.4 .8 3.4 .73 2.1 .86 2.8 1.2 3.6 .9
Source: Jimma MSE Field survey, 2014
As shown in table 4.11 above, unreasonable tax levied of the businesses is the main problems
that hinder the performance of MSEs. It shows a mean score of 4.0 with standard deviation 0.79
and 0.75 for trade and construction respectively. Mean score 3.8, 3.4, 2.8 with standard deviation
of 0.95, 0.75, and 0.62 for manufacturing, service and urban agriculture respectively. From the
sample respondents engaged in five sector 107(44.8%) agreed and 41(17.2%) strongly agreed as
the tax levied on their business is not reasonable.
The other problem relating to government policy is bureaucracy in business registration and
renewal of licenses. Mean score of 4.1,3.7,3.4,3.3 and 2.8 with standard deviation 0.81,0.92,
0.97. 0.7 and 0.58 for construction, trade, service, construction and urban agriculture
respectively. Of sample respondents 93(38.9%) agreed and 29(12.1 %) strongly agreed.
The interview conducted with MSE officials confirmed that there are problems related to tax
c\ ade by MSE owners. In contrary, the interview conducted with TVET official confirmed out
the as there is implementation problems widely observed in the side of the heads and lower level
experts and employees of government sector offices such as lack of responsiveness to the
demands of the operators. This arises either from the deliberate tendency of the executives to be
bureaucratic or their lack of awareness about the peculiar procedures, policies and proclamations
that help MSEs.
The other possible explaining factor for this non-responsiveness to the operators can be the fact
that the concerned government offices are overloaded with other routine activities of their
61
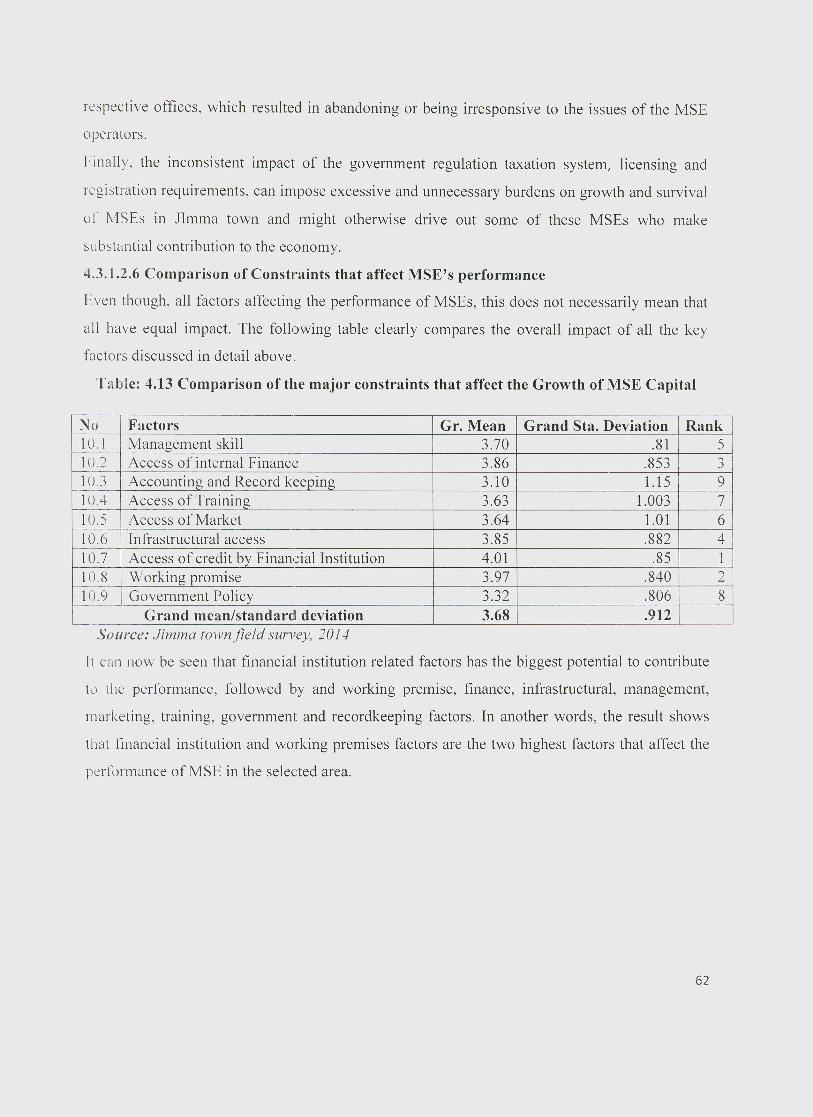
respective offices, which resulted in abandoning or being irresponsive to the issues of the MSE
operators.
Finally, the inconsistent impact of the government regulation taxation system, licensing and
registration requirements, can impose excessive and unnecessary burdens on growth and survival
of MSEs in Jlmma town and might otherwise drive out some of these MSEs who make
substantial contribution to the economy.
4.3.1.2.6 Comparison of Constraints that affect MSE's performance
Even though, all factors affecting the performance of MSEs, this does not necessarily mean that
all have equal impact. The following table clearly compares the overall impact of all the key
factors discussed in detail above.
Table: 4.13 Comparison of the major constraints that affect the Growth of MSE Capital
No Factors Gr. Mean Grand Sta. Deviation Rank10.1 Management skill 3.70 .81 510.2 Access of internal Finance 3.86 .853 310.3 Accounting and Record keeping 3.10 1.15 9f-.
10.4 Access of Training 3.63 1.003 710.5 Access of Market 3.64 1.01 6f---
10.6 Infrastructural access 3.85 .882 410.7 Access of credit by Financial Institution 4.01 .85 110.8 Working promise 3.97 .840 210.9 Government Policy 3.32 .806 8
I--
Grand mean/standard! deviation 3.68 .912L-
Source: Jimma town field survey, 2014
It can now be seen that financial institution related factors has the biggest potential to contribute
to the performance, followed by and working premise, finance, infrastructural, management,
marketing, training, government and recordkeeping factors. In another words, the result shows
that financial institution and working premises factors are the two highest factors that affect the
performance of MSE in the selected area.
62
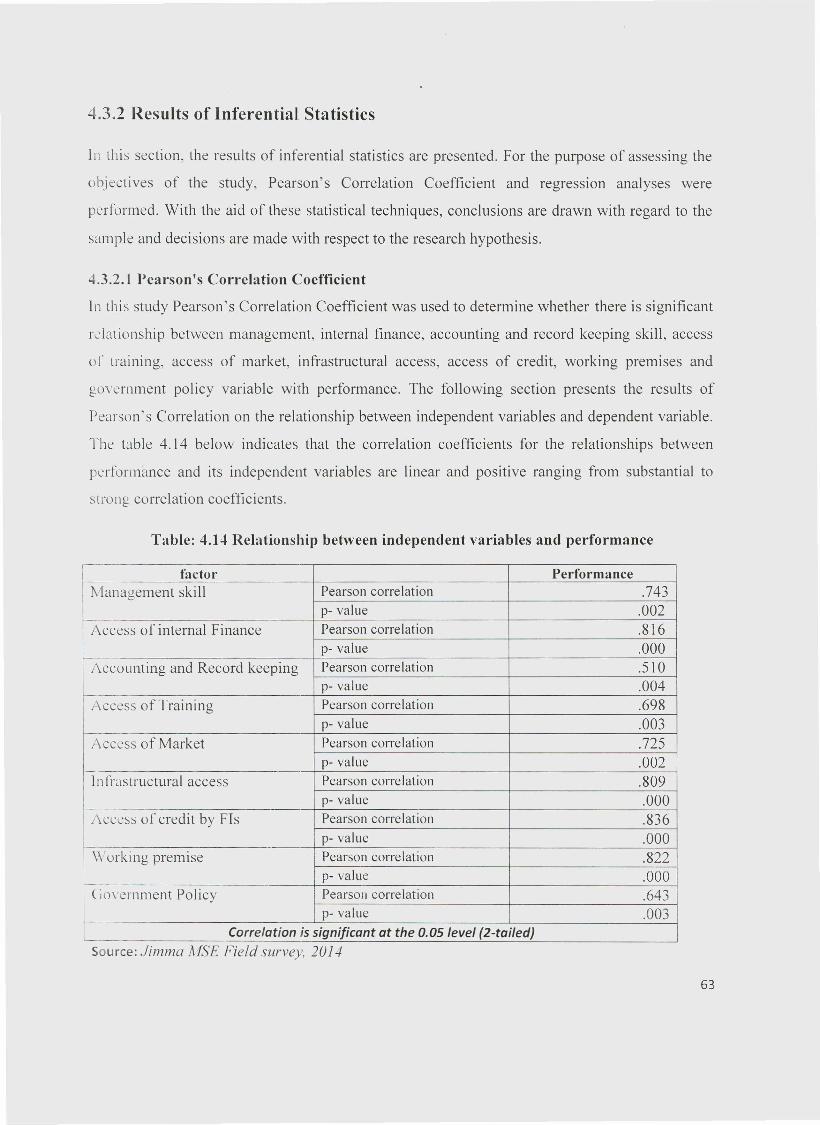
4.3.2 Results of Inferential Statistics
In this section, the results of inferential statistics are presented. For the purpose of assessing the
objectives of the study, Pearson's Correlation Coefficient and regression analyses were
performed. With the aid of these statistical techniques, conclusions are drawn with regard to the
sample and decisions are made with respect to the research hypothesis.
4.3.2.1 Pearson's Correlation Coefficient
In this study Pearson's Correlation Coefficient was used to determine whether there is significant
relationship between management, internal finance, accounting and record keeping skill, access
01' training, access of market, infrastructural access, access of credit, working premises and
government policy variable with performance. The following section presents the results of
Pearson's Correlation on the relationship between independent variables and dependent variable.
The table 4.14 below indicates that the correlation coefficients for the relationships between
performance and its independent variables are linear and positive ranging from substantial to
strong correlation coefficients.
Table: 4.14 Relationship between independent variables and performance
I factor PerformanceManagement skill Pearson correlation .743
p- value .002ACCeSS of internal Finance Pearson correlation .816
p- value .000Accounting and Record keeping Pearson correlation .510
p- value .004Access of Training Pearson correlation .698
p- value .003Access of Market Pearson correlation .725
[In fra st rue tural accessp- value .002Pearson correlation .809p- value .000
I }\CCl'SS of credit by FIs Pearson correlation .836
I Working premisep- value .000Pearson correlation .822
~Joyernment Policyp- value .000Pearson correlation .643
Ip- value .003
I Correlation is significant at the 0.05 level (2-tailed)Source: Jimma MSE Field survey, 2014
63
Where; Performance = Total sum of squares: the total Pearson correlation value of each independent variablecolumn in correlation matrix is divided by the square root of the total column sums; Column sums of eachindependent variable 3.57,3.93, 2.46, 3.36, 3.49, 3.89, 4.03, 3.96, 3.09; The total column square root of 23.08= 4.8; P the value from correlation matrix
It is indicated in the above table 4.14, a strong positive relationship was found between access of
credit by financial institution and performance (r =.836, p = .0001), working premise and
performance (r = .822, p = .0001), access of internal finance and performance (r = .816, P =
.0001), which are statistically significant at 95% confidence level. This implies that at a 5% level
or significance it was discovered that the access of credit by financial institution, working
premises and access of internal finance plays a significant role in determining the performance of
MSEs in the selected sub-cities.
lurtherrnore, the table presents the relationship between the selected variables and performance
orMSEs for a sample of239 operators in sub-city 1,3 and 4 of Jimma town. There is substantial,
however statistically significant relationship between infrastructures and performance (r = .909,
p = .0001), management and performance (r = .743, P = .002), marketing (r= .725, p = .003),
training (r = .698, p = .003), government policy (r = .643, p .003) and accounting and record
keeping skill (r = .510, p = .0(4). This would imply that, the more access of infrastructures,
management skill, market linkage, access of training, government policy application and
accounting and record keeping of MSEs' the better performance of MSEs would be, otherwise
MSEs performance poor. Thus the variables are statically significant at 95% confidence level.
4.3.2.2 Regressions Analysis
In order to determine the extent to which the explanatory variables explain the variance in the
explained variable, regression analysis was employed. The results of such analysis are narrated
under table 4.15.
64
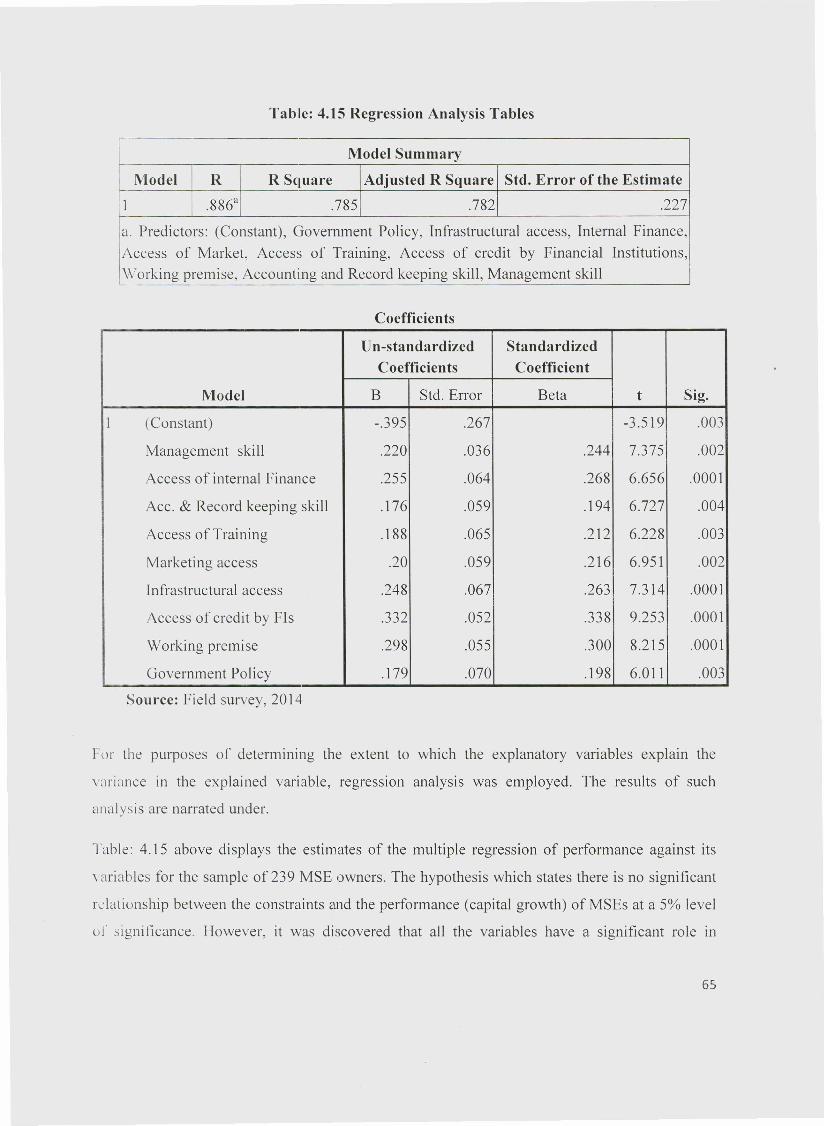
Tablle: 4.15 Regression Analysis Tables
Model Summary
Model R R Square Adjusted R Square Std. Error of the Estimate
1 .886<1 .785 .782 .227
a. Predictors: (Constant), Government Policy, Infrastructural access, Internal Finance,Access of Market, Access of Training, Access of credit by Financial Institutions,Working premise, Accounting and Record keeping skill, Management skillL
Coefficients
Un-standardized StandardizedCoefficients Coefficient
Model B Std. Error Beta t Sig.
1 (Constant) -.395 .267 -3.519 .003
Management skill .220 .036 .244 7.375 .002
Access of internal Finance .255 .064 .268 6.656 .0001
Acc. & Record keeping skill .176 .059 .194 6.727 .004
Access of Training .188 .065 .212 6.228 .003
Marketing access .20 .059 .216 6.951 .002
Infrastructural access .248 .067 .263 7.314 .0001
Access of credit by FIs .332 .052 .338 9.253 .0001
Working premise .298 .055 .300 8.215 .0001
Government Policy .179 .070 .l98 6.011 .003
Source: Field survey, 2014
For the purposes of determining the extent to which the explanatory variables explain the
variance in the explained variable, regression analysis was employed. The results of such
analysis are narrated under.
Table: 4.15 above displays the estimates of the multiple regression of performance against its
\ ariables for the sample of 239 MSE owners. The hypothesis which states there is no significant
relationship between the constraints and the performance (capital growth) ofMSEs at a 5% level
of significance. However, it was discovered that all the variables have a significant role in
65
determining the performance of MSEs'. Thus, the null hypothesis is rejected and it is accepted
that, the internal and external business environment have significant relationship with the
performance of MSEs in the study area, sub-city 1, 3 and 4 of Jimma town.
It also discovered that, the correlation between the observed value of performance and the
optimal linear combination of the independent variables (management, finance, accounting and
record keeping skill, access of training, Marketing, infrastructural access, access of finance by
financial institution, working premise and government policy factors) is 0.886, as indicated by
multiple R. Besides, given the R Square value of 0.785 and adjusted R square value of .782, it
may be realized that 78.5% of the variation in performance can be explained by the independent
\ ariables. The remaining 21.5 % of the variance is explained by other variables not included in
this study. The un-standardized coefficients B column, gives us the coefficients of the
independent variables in the regression equation including all the predictor variables as indicated
below.
Predicted performance score= -.395 + .220(managerial) + .255(finance) +
.176(Record keeping) + .188(training) +.20(marketing) + .248(infrastructural) +
.332(access of credit by Fl) + .298 (Working premise) + .179(Government Policy).
Table further shows that all the explanatory variables included in this study can significantly
explain at 95% confidence level to the variation on the dependent variable.
The standardized beta coefficient column shows the contribution that an individual variable
makes to the model. The beta weight is the average amount the dependent variable increases
when the independent variable increases by one standard deviation (all other independent
variables are held constant). As these are standardized we can compare them. Thus, the largest
influence on the performance of MSEs is from the access of credit (.332) working premises
factor (.298) and the next is financial factor (0.255). On the other hand training with the beta
value of .188, government policy with the beta value of .179 and accounting and record keeping
\\ ith beta .176 have the poorest predictor of performance when it is. compared with the other
explanatory variables under study.
66
CHAPTER FIVE
5. SUMMARY, CONCLUSIONS AND
RECOMMENDATIONS
This is the final part of the thesis. In this chapter, the major findings are summarized;
conclusions are drawn based on the findings and recommendations are forwarded for the
concerned bodies. For clarity purpose, the conclusions are drowning based on the research
objectives of the study. Based on the findings of the study recommendations are made to
concerned government bodies, MSE operators and suggestion for other researchers.
5.1 Summary
This study was designed to assess the factors that affect the performance of MSEs owners in
J imma town. To this effect, the descriptive survey method was employed. In addition to this.
from a total of 239 MSE respondents found in three sub cities those engaged in 5 sectors were
participated in the study as sources of information using stratified random sampling.
Questionnaire, semi-structured interview and document analysis were utilized as data collection
instruments to get the appropriate information from the targeted respondents.
Questionnaire that include demographic profiles and factors that affect the performance of MSEs
operators was designed in an open ended, closed ended and likert scales. Moreover, semi-
structured interviews were held with top officials of MSEs, OCSSCO and TVET. The collected
data \\"ere analyzed using simple statistical techniques (tables and percentages), descriptive
statistics (mean and standard deviations) and statistical tests Regression analysis for the
independent variable were used. While the qualitative data from open ended items and interview
used to supplement the quantitative data. In doing so, the data collected from both quantitative
and qualitative instruments addressed the following five basic research questions of the study:
67
The study was guided by the following basic research questions:
1. What are the constraints that affect the performance of MSEs in and how these constraints
influence the MSEs performance?
') What internal and the external environment affect the performance of MSEs?
3. What are the Government policies influence the performance ofMSEs in Jimma town?
-t. What strategies should be employed by concerned bodies to minimize the MSE performance
constraints?
5. What are the recommendations (guiding principles) used to improve the MSes performance?
Based on 239 respondents and interview results acquired from the concerned officials, the major
f ndings of this study are summarized as follows.
r 1t was confirmed that managerial skills were key to the MSEs and lack could lead to business
failure. This shows that managerial skills have a strong, positive and significant influence on
the growth of MSEs. The respondents clearly recognized the importance of managerial skills
as critical to MSE capital growth.
T Incapability of internal financing which include (poor sources of finance, less initial capital
and lack working capital management) an obstruction that hinders the capital growth of
MSE.
T It was revealed that most MSE owners did not employ financial record; determines optimal
financing planning, management and decisions that affect their performance.
r Unequal accesses to entrepreneurial and technical capacity development training among
0\\ ners in the study areas also affect the MSE's performance.
T Tile inconsistent governm nt regulation, taxation system, licensing and registration
requirements. can Impose excessive and unnecessary burdens on growth and survival of
MSEs in Jlmma town.
68
5.2 Conclusions
This research was conducted in the sub-city 1, 3, and 4 of Jimma town with the prime intent of
evaluating the performance constraints of MSE owners engaged in manufacturing, construction,
service, trade and urban agriculture. Specifically, the study attempted to examine the internal and
external factors and recommend possible solution used to lessen the problem. Based on the
objectives and findings of the study, the following conclusions are worth drawn.
The main internal or endogenous constraints that affect the performance of MSE owner's were access of
internal finance which hinder MSEs performance which includes less source of initial capital i.e., the
original investment or money used to start the enterprise is below 25,000 ETB. The main sources
or startup and expansion finance or funds for most MSEs are personal savings followed by
harrowed from friends/relative, lqub. Lack of working capital management skill is the other
problem. The second is management skill which includes lack of strategic business planning and
lack of management experience to run their business. The third problem was lack of training
which includes lack of technical and entrepreneurial skills. Informal training received by
entrepreneurs and workers to improve their technical skills or business management is more
practical than formal education. The fourth internal factor that affects the MSEs performance is
accounting and record keeping skill of MSEs owners.
Thus those enterprise owners start their business with high initial capital; having management skill;
having entrepreneurial and technical, accounting and record keeping skill through formal or informal
training have better performance than those started their business with less initial capital and those do not
have management, entrepreneurial and technical skill. MSE owners having accounting skill and employ
record keeping system have better performance than those do not apply.
The main external factor that affect the growth of capital of MSE is that access of credit by the
financial institutions followed by working premise, access of infrastructure, market access and
government policy. The supply of credit from the informal institutions and the inability of many
operators to meet formal financial institutions requirements like business plan were linked to less
performance. The workings premises factors include absence of own premises (land), lack of
enough working space and inappropriate working place for business operation.
69
Enterprises located at commercial district and road side grow faster than those outside. Creating
commercial centers and sewerage system could improve the growth of MSEs. The external
sources of finance by formal financial institutions have not been able to meet the credit needs of
the MSEs. High interest rate, complicated loan application procedures and collateral
requirement, most MSEs have been forced to use the informal institutions for credit.
According to the findings, the government policy implementation problem ranges from
unreasonable tax levied of businesses, bureaucracy in registration and renewal of licenses and
lack of commitment by some governmental bodies to implement MSE strategy was also the main
problem that hinders the MSE's growth of capital.
Enterprises those have access of credit from micro finance; appropriate working promise, i.e.,
near to market, road, having production and marketing place; having good access of
infrastructure i.e., power, water, Tele, internet and waste disposal system and those access of
market Iinkage and promote their business have good performance than don not have such
access.
Those enterprise found where the government policies are well implemented, have good
opportunity of to grow capital than those found where the government policy is poorly applied
\\ hich affect the performance of MSEs.
It is envisaged that this research will provide an explicit picture to both the academic and policy
community in regards to the internal and external obstacles faced by owners of MSEs. It should
assist the policy makers in designing and implementing specific and well targeted policies for the
overall benefit of MSEs.
70
5.3 Recommendations
Suggestions for corrective and harmonizing measures to enhance the potential performance of
MSLs are essential. Such recommendations demand a comprehensive analysis of the influence of
different factors regarding the sector. Based on the findings and conclusions of the study, the
following recommendations are forwarded to ORMDSDA, MSEDOs, Micro Finances Institutes
and TVET Institutions.
5.3.1 MSE Owners:
,. '1'0 enhance their enterprise performance owners should gain the required management skills.
,. MSE owners should capacitate their accounting skill in order to fill their gap in the areas of
financial management and financial planning.
r should uphold cash flow and financial planning skill
,. should minimize personal an d administrative costs;
5.3.2 ORMDSDA:
Since MSEs have less the internal source of capital, initial capital, the use of external finance is
Iound to have a positive contribution for enterprise growth. Therefore,
r .Should advocate adequate provision of finance to MSE development programs.
r Should specialized micro finance services that benefit MSE development.
r Initiating specialized lending services to MSE in the existing microfinance institutions i.e.,
OCSSCO must be required.
r Government sponsored programs for delivering credit and equity funds of MSEs.
5.3.3 MSEDO Officers:
r MSEs Officers should design the way of discussion municipalities and other administrative
bodies to improve and provide convenient work place with the necessary access (power
supply and waste disposal system) for all MSEs.
, They should also arrange mechanisms through which MSE owners can easily access
administrative bodies and OCSSCO so that they can be beneficiaries of different
governmental incentives such as to minimize the unreasonable tax levied and to make
sufficient loan.
r Improved business monitoring
71
,. Ensuring that MSEs keep proper financial records.
, Providing market linkage and promotion and display places the MSE product/service in areas
close to working area.
5.3.4 Micro finances Institutions:
'r In view of the fact that group cannot have the same thinking level, attitude and commitment
[IS there are personal differences, therefore institutes should allow individual lending systems.
, Should regulate the interest rate charged on MSE loan and simplifying loan application
process
, Increase in amounts of loans
»: Timely disbursement of the funds
, Should inspire and encourage MSE owners saving habits
5.3.5 TVET Officers:
, Should provide both technical and business trainings to MSEs so that these entrepreneurs can
with stand competitions, develop entrepreneurial sprits, improve managerial skill in such a
competitive world.
r Should be involved the recruitment and selection of candidates rather than making it as a sole
responsibility of MSEs.
r: Should implement targeted skills development training to promote the entrepreneurial skill(like accounting, marketing, and using record keeping mechanism) and technical skill ofMSE operators.
»: Should develop and equip youth with market-ready skills that will ensure the effectivetransition into employment, by understanding and identifying market opportunities in the, rcas in which they live.
Finally, a result of this the findings of study do not necessarily concern other MSEs operating in
sub-city 2, 5 and 6 of Jimma town or other business organization than MSEs. Therefore, the
results cannot be generalized to Micro and Small Enterprises that were not part of this study.
Repeating of this study using larger samples size and a broader geographic base is suggested for
cross-validation purposes. Another approach could be to conduct a longitudinal nationwide study
in order to identify the factors that hinder the performance ofMSEs.
72
References
Adjei. 02012, 'Micro, small and medium scale enterprises in Ghana: challenges and prospects,'
Master's thesis, Kwame Nkrumah University.
Bidzakin K 2009, 'Agribusinesses in northern Ghana: non-financial and stochastic frontier
analysis A Dissertation Submitted to Department of Agricultural Economics,
Agribusiness and Extension, Master's thesis, Kwame Nkrumah University.
Brown, M Makarius, M and Mureithi, S 2009, 'Management of business challenges among small
and micro enterprises in Nairobi,' KCA Journal of Business Management: vol. 2, no. 1,
pp.16-30
C.R. Kothari, 1990, "Research Methodology: methods and techniques, former principal collage
of commerce University of Rajahsthan Jaipure, New Age International PLC, Publishers,
New Delhi
Creswell, J W 2003, Research design: qualitative, quantitative and mixed methods approaches,
21ld ed., Sage Publications, California.
Diriba. S 2013, 'Socio-economic contributions of micro and small enterprises: The Case of
Jimma City,' Science, Technology and Arts Research Journal, April-June, pp. 123-134.
Fdward et al. (20l3), 'Performance and constraints of small scale enterprises in the Accra
Metropolitan Area of Ghana', European Journal of Business and Management, Vo1.5,
no.4, pp. 83-93
lshctu, T Ketema, M and Kassa, B 2013, 'Economic impact of support service program on
micro and small enterprises: The Case of Dire Dawa Administration, Ethiopia', Agris
online Papers in Economics and Informatics, Vol. V, no. 1, pp. 21-29.
1'cdcrul Democratic Republic of Ethiopia (FDRE), 'Background issue paper on legal
empowerment of the poor 2006', Entrepreneurship, Addis Ababa
lcderal Democratic Republic of Ethiopia (FDRE), 'Micro and small scale development strategy
of Ethiopia 2011,' Addis Ababa
Federal Democratic Republic of Ethiopia (FDRE), 'National Employment Policy and Strategy
2009', Ethiopia, Addis Ababa
Girrnay, G 2006, 'Managerial Performance Measurement in Small Scale Industries Case study in
selected small-scale industries in Addis Ababa & Database of Managerial Performance
Measurement with Solution Tool Box', Master's thesis, Addis Ababa University
73
llrity. A 2009, 'Work, employment, and globalization', Master's thesis, Addis Ababa University
Kanburi, B 2009, 'Assessing performance of micro and small scale agribusinesses in Northern
Ghana', Master's thesis, Kwame Nkrumah University, Ghana
Kokobe, S 2013, 'Determinants of micro and small enterprises growth', Master's thesis, Addis
Ababa University
Mahembe, E 2011, 'Access to Credit and Support for small and medium enterprise in South
Africa', Underhill Corporate Solutions (UCS) , Pretoria
Martha, K 2012. 'Employment Challenges in Ethiopia', Addis Ababa University, Ethiopia
Maihewos A Solomon Band Abebe Z 2011, 'Assessment of urban development practices on
business expansion in Ethiopia'
Ministry of Urban Development & Construction (MUDC), "Survey on Micro and Small
Enterprises (MSEs) in Selected Major Cities of Ethiopia", 2013, Addis Ababa
M ul ugeta Y 2011, 'The livelihoods reality of micro and small enterprise operators: evidences
from wereda one of Lideta sub-city', A Master's Thesis, Addis Ababa
Nkonoki, E 2010, 'Factors limiting the success and/or growth of small businesses in Tanzania',
Arcada University,
Olabisi, S Andrew, A Adewole, A 'Factors affecting small-scale business performance in
informal economy in Lagos state-Nigeria: a gendered based analysis', Department of
Sociology Lagos State university.
Ronnas, P 2004, 'Economic performance and the role of the private sector in Ethiopia' Country
Economic Report, Gote Hansson, pp.l- 38
Shi Ieraw. D 2013, 'The economic implications of comprehensive approach to learning on
industrial development (policy and managerial capability learning): A Case of Ethiopia',
Working Paper Prepared For JICAIIPD Africa Task Force Meeting Yokohama, Japan,
Vol. 1, June, pp. 2-3.
Stella et al. (2013), 'A survey of small scale enterprises in Kenya', Interdisciplinary Journal of
Contemporary Research in Business, Vol. 5, no. 1, pp. 292-300.
Tiruneh, A 2011, 'Analysis of the success factors of micro and small business enterprises inAddis Ababa', Master's thesis, Addis Ababa University
\\ .K .. Muraya 2004, 'Urban planning and small-scale enterprises in Nairobi', HabitatInternational. pp. 1-15
74

Appendix 1
JIMMA UNIVERSITY
COLLEGE OF BUSINESS AND ECONOMICS
DEPARTMENT OF ACCOUNTING AND FINANCE
MSCPROGRAM
Questionnaire to Be Filled By MSE Operators /Owners
Hear respondent,
1 am a graduate student In the department of Accounting and Finance, Jimma University.
Currently, I am undertaking a research entitled 'Performance Constraints of Micro and Small
S 'ale Enterprises: The Case of Jimma Town '. The aim of this study is to identify causes that
affect the performance of Micro and Small Enterprise in Jimma town. I would like to promise
you that the information you provide will be used purely for academic purpose; no
individual's responses will be identified as such and the identity of persons responding will not
be released to anyone. So its confidentiality is highly guaranteed. Your honest and thoughtful
response is helpful as a great input to the quality of the research results. And, Ibelieve that you
will broaden your assistance by participating in the study. This questionnaire contains only three
sections and will be expected to take approximately 15 to 25 minutes to complete. You are
therefore kindly requested to provide accurate answer to assuring questions.
Thank you in advance for your kind cooperation and donating your time.
Sincerely,
Esmael Sanbi
a

Instructions:
. II need of v. riting your name
II lor Open-ended questions indicate your answers by write the appropriate answer on the blank space
provided in front of the question.
Ill. For Close-ended questions indicate your answers by Circle one in the appropriate choice.
I\'. For Likert scale type statements indicate your answers with a check mark (>/) in the appropriate block.
\'. If YOLI have comments or if you want to provide further explanations, please use the space provided at
till: end of the questionnaire.
Part one: Demography
1. Y our Gender category: Male D Female D
:2. Your marital status: Single D Married D Widowed D Separated D
"'. Your educational background
l llitcrute 0 Primary school 0 High school D TVET D Diploma[] 151 DegreeCJ 2nd Degree D
-L Ilow old are you'? 18-25 I~ 26-35 D 36-45 D 46-55 D >55 D
Part 2: General Information on Business Enterprises
A. Open-Ended Questions
I. Your Business Category (micro, small) _
) In what sector your enterprise operates? _
3. \\"hen did your business start? (Year) , your business experience? __ years
4. The reason for starting your business is? _
5. The principal owners of your enterprise are male Female Total _
6. I low many employees are working currently in the enterprise including the principal owner
of your enterprise . _
7. \\. hat are the criteria for your business apply to pay members work in the business?
a. If payment is in regular payment per day amount paid (Birr) _
1>. If payment is in pieces of item produced/service rendered/ amount paid (Birr) _
c. If other, specify _
g. What is the average Expense of your business per annum? Birr
b

9. What is the average Sale of your business per annum? Birr
10. 1low much was your initial capital/working capital/ at the time your business start? Birr_.I
11. 110\\ much is the current capital of your enterprise? Birr _
B. Close-Ended Questions
1. 1)0 you have management skill to lead your enterprise?
A. Yes B. No
2. If your response for question 1 is "Yes", where have you got this skill?
i\. Through Training B. through Experience C. through Education D. Naturally gifted
E. If others specify _
3. What was the source of fund when you start your business?
i\ Personal saving B. Support from family C. Support from Government D. Borrowed
from Banks E. Borrowed from Micro finances F. Borrowed from Friends/ Relatives
G. Iqub H. If other, specify _
4. Did your business employ/use financial record keeping?
A. Yes B.No
5 If yo ur response for question 4 is "Yes", what kind of record was employed?
!\. Daily transaction record B. Occasional base record C. Income statement D. Balance
sheet E. If others specify
6. Where is the market boundary for your products/services?
i\. City boundary Market B. In and out of city boundary C. Outside the city boundary market
D. Others
7. Do you prepare plan for your business?
A. Yes B.No
g. If your response for question 7 is "Yes", what is the time span your business plan covers?
/\. Below 1 year B. 1 to 2 years C. 3 to 5 years D. Above 5 years
9. What is the type of promotion your business exercise?
1\. Posters B. Trade fair C. Business card D. No advertisement E. Others (Specify) _
c
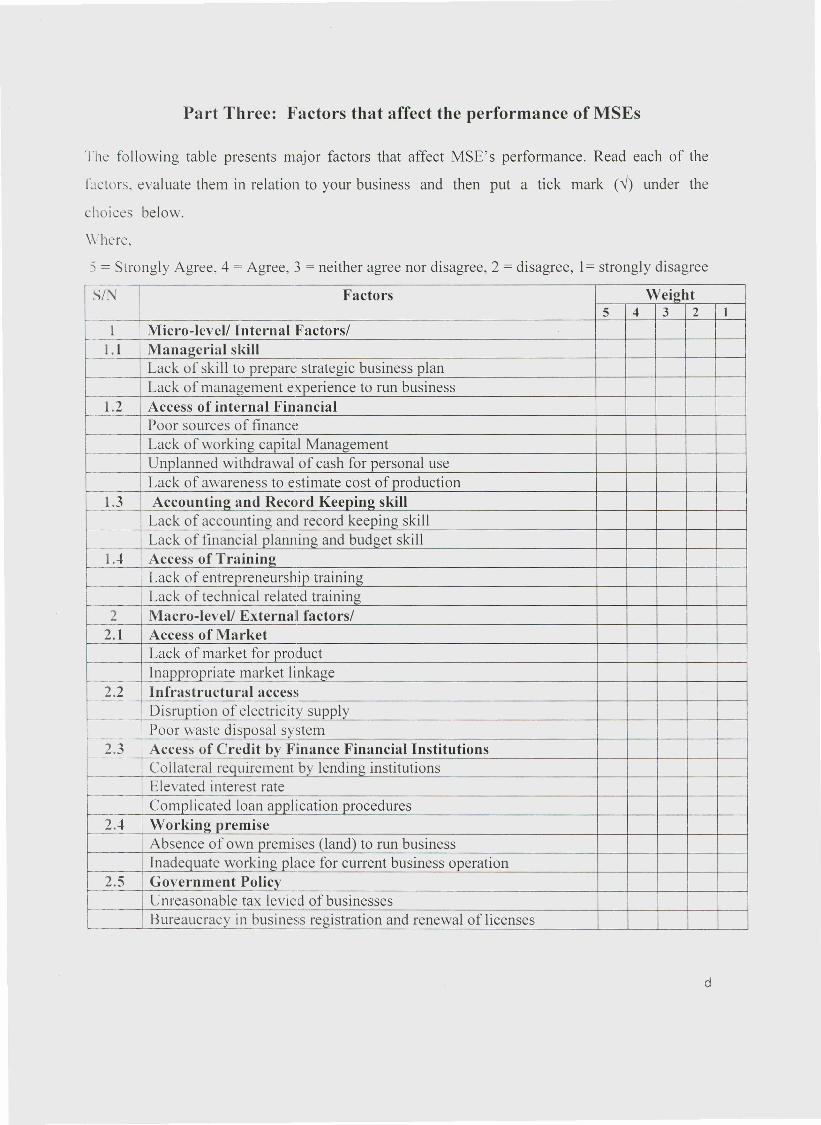
Part Three: Factors that affect the performance of MSEs
The following table presents major factors that affect MSE's performance. Read each of the
factors, evaluate them in relation to your business and then put a tick mark (--J) under the
choices below.
Where,
5 = Strongly Agree, 4 = Agree, 3 = neither agree nor disagree, 2 = disagree, 1= strongly disagree
fS/N Factors Weight5 4 3 2 I
1 Micro-level/ Internal Factors/1.1 Managerial skill
Lack of skill to prepare strategic business planLack of management experience to run business
1.2 Access of internal Financial~--~Poor sources of financeLack of working capital ManagementUnplanned withdrawal of cash for personal use
~-Lack of awareness to estimate cost of production
1.3 Accounting and Record Keeping skillI-
Lack of accounting and record keeping skillLack of financial planning and budget skill
1 ...• Access of TrainingI-~
1--Lack of entrepreneurship trainingLack of technical related training
2 Macro-level! External factors/2.1 Access of Market
Lack of market for productInappropriate market linkage
2.2 Infrastructural accessDisruption of electricity supplyPoor waste disposal system
2.3 Access of Credit by Finance Financial Institutions
f- Collateral requirement by lending institutionsI Elevated interest rateL1---
Complicated loan application procedures2.4 Working premise
Absence of own premises (land) to run businessInadequate working place for current business operation
2.5 Government PolicyE- Unreasonable tax levied of businessesBureaucracy in business registration and renewal of licenses
d
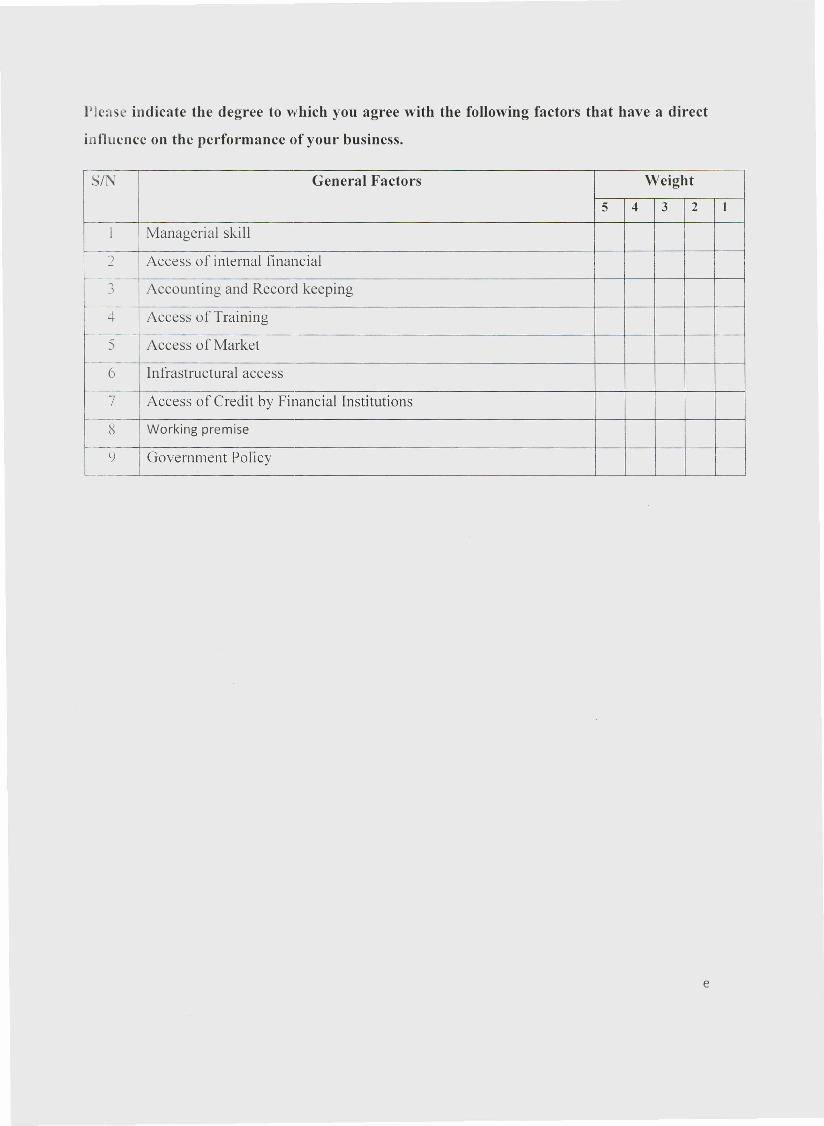
Please indicate the degree to which you agree with the following factors that have a direct
influence on the performance of your business.
SIN General Factors Weight
5 4 3 2 I
I Managerial skill
J Access of internal financialI- ..,
I Accounting and Record keeping-)
I4 I Access of Training
5 Access of Market
6 lnfrastructural access
7 Access of Credit by Financial Institutions
8 Working premise
__ ~ Government Policy
e

Appendix 2
INTERVIEW WITH MICRO AND SMALL ENTERPRISEOFFICE HEAD
The following Interview is part of a survey being conducted in partial fulfillment of a Masters in
Accounting and Finance (MSc) degree from Jimma University on the topic 'Performance
Constraints of Micro and Small Scale Enterprises: The Case of Jimma Town '. This
information is purely for academic purpose and therefore its confidentiality is highly guaranteed.
Y ou are therefore kindly requested to provide accurate answer to the promising questions. Your
co-operation and support will be appreciated.
SECTION 1
I. Respondent's Gender
2. Age
3. Place of Work -------------------------------------
-+. Position/Rank --------------------------------------
A. Male
A. below 25
B. Female
B. 25-35 C. 36 - 45 D. 46 -55 E. above 55
SECTION 2
5. What role do your organization provided to promote MSE's?
A. Training B. Advisory Services C. Material support
D. Others Specify . _
6. List five major challenges that face SMSE's? Please specify in order of ranking.
u. _
b. _
7. Why do you see them as challenge? _
g. In your view how can these challenges be solved -------------------------lJ. Does your organization have policies for MSE's?
A. Yes B. No
10. rl""Yes" state some of the policies --------------------------------------[ 1. What do you think government should do to develop MSE's? Please specify _
f

Appendix 3
INTERVIEW WITH MICRO FINANCE STAFF
The following Interview is part of a survey being conducted in partial fulfillment of a Masters in
Accounting and Finance (MSc) degree from Jimma University on the topic 'Performance
Constraints of Micro and Small Scale Enterprises: the Case of Jimma Town '. This information
is purely for academic purpose and therefore its confidentiality is highly guaranteed. You are
therefore kindly requested to provide accurate answer to the promising questions. Your co-
operation and support will be appreciated.
~ECTION 1
1. Respondent's Gender
2. Age
3. Place of Work ----------.----------------------------4. Position/Rank -----------------------------------------
A. Male B. Female
A. below 25 B.25-35 C. 36 - 45 D. 46 -55 E. above 55
SECTION 2
5. Does your organization hav a special loan facility for MSE's? A. Yes B. No
6. IfvYes" state the facility?
7. What are the modalities under which MSE's can obtain credit from you? _
8. If MSE's take loans from the bank are they able to pay back on time? A. Yes B. No
9. Ir "N 0" what are the reasons? -------------------------------------------
10. What policies do your organizations has put in place for MSE"s in future? _
11. From your point of view what are some of the challenges you have with MSEs' _
12. What are some of the possible solutions to deal with the challenges? _
g

Appendix 4
INTERVIEW VVITHTECHNICAL AND VOCATIONAL
EDUCATION TRAINING LEADER
Masters in Accounting and Finance (MSc) degree from Jimma University on the topic
'Performance Constraints of Micro and Small Scale Enterprises: The Case of Jimma Town '.
This information is purely for academic purpose and therefore its confidentiality is highly
guaranteed. You are therefore kindly requested to provide accurate answer to the promising
questions. Your co-operation and support will be appreciated.
SECTION 1
1. Respondent's Gender
Age
A. Male
A. 20-35
B. Female
B. 36 - 49 C. 50 -65
3. Place of Work -------------------------------------
4. Position/Rank ---------------------------------------
SECTION 2
5. How do you explain the relationship you have with MSEDO? _
6. Do you have regular meeting periods? _
7. What are the areas of support you have to MSE's?
r: Training
r: Technology
,- Others
8. What problem did you face to work jointly with MSEDO? _
9. What measures did you take to solve the problems you faced? _
10. How is your relationship with Micro finance and others? _
h
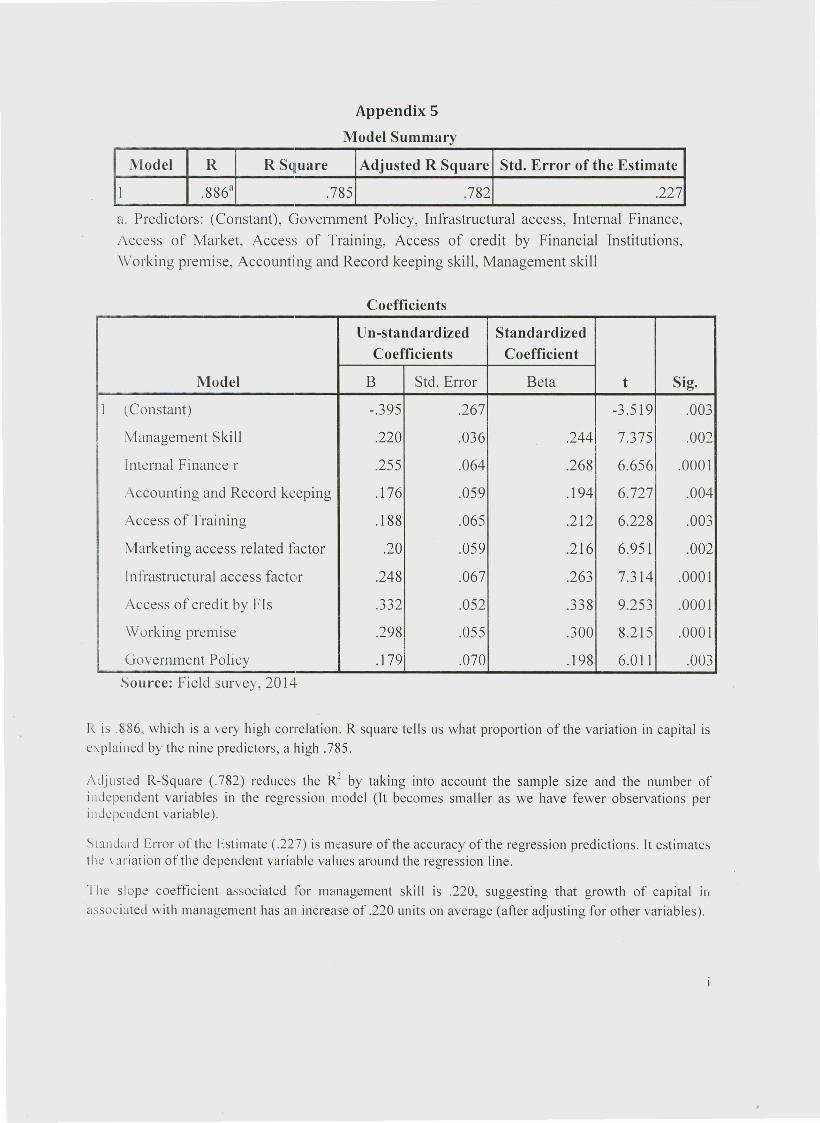
Model R R Square Adjusted R Square Std. Error of the Estimate
1 .886a .785 .782 .227
Appendix 5
Model Summary
a. Predictors: (Constant), Government Policy, Infrastructural access, Internal Finance,Access of Market, Access of Training, Access of credit by Financial Institutions,Working premise, Accounting and Record keeping skill, Management skill
Coefficients
Un-standardized StandardizedCoefficients Coefficient
Model B Std. Error Beta t Sig.
1 (Constant) -.395 .267 -3.519 .003
Management Skill .220 .036 .244 7.375 .002
Internal Finance r .255 .064 .268 6.656 .0001
. ccounting and Record keeping .176 .059 .194 6.727 .004
Access of Training .188 .065 .212 6.228 .003
Marketing access related factor .20 .059 .216 6.951 .002
lnfrastructural access factor .248 .067 .263 7.314 .0001
Access of credit by Fls .332 .052 .338 9.253 .0001
Working premise .298 .055 .300 8.215 .0001
Government Policy .179 .070 .198 6.011 .003Source: Field survey, 2014
R is .886, which is a very high correlation. R square tells us what proportion of the variation in capital isexplained by the nine predictors, a high .785.
Adjusted R-Square (.782) reduces the R2 by taking into account the sample size and the number ofindependent variables in the regression model (It becomes smaller as we have fewer observations perindependent variable).
Standard Error of the Estimate (.227) is measure of the accuracy of the regression predictions. It estimatesthe variation of the dependent variable values around the regression line.
The slope coefficient associated for management skill is .220, suggesting that growth of capital inassociated with management has an increase of .220 units on average (after adjusting for other variables).
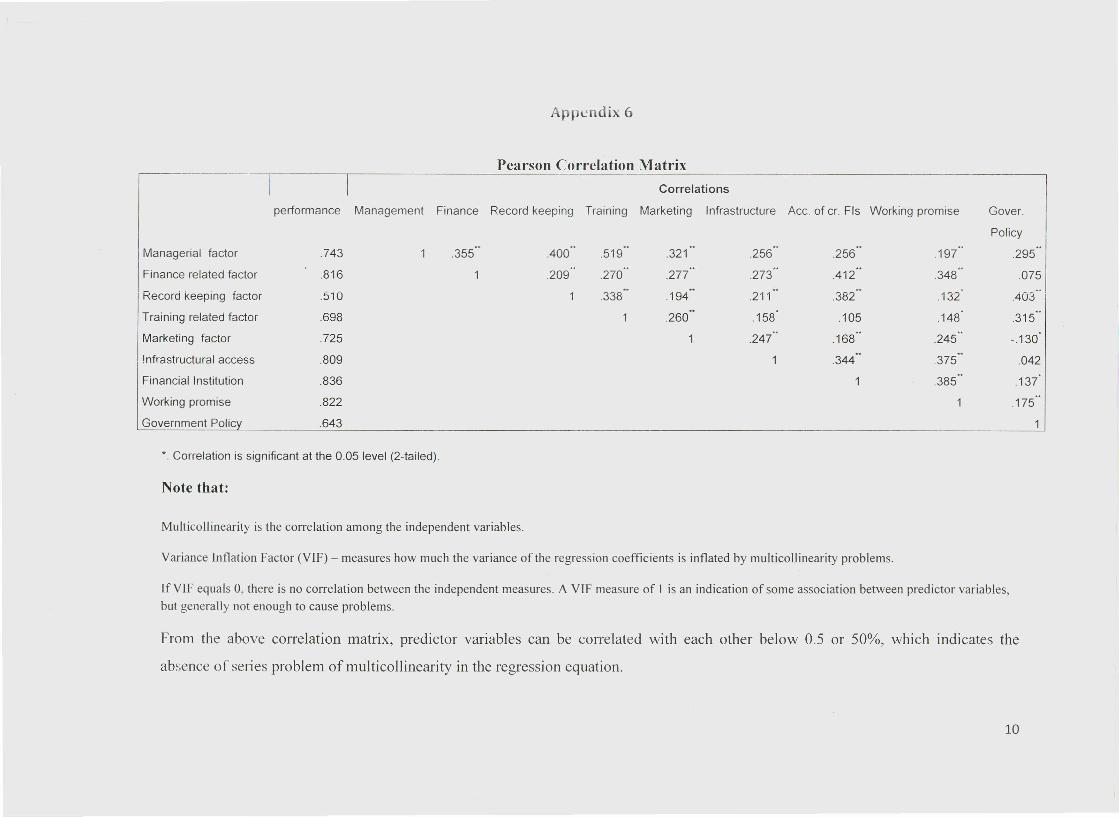
Appendix 6
Pearson Correlation Matrix
I I Correlations
Managerial factor .743
I ~inance. related f~ctor .816
Kecord Keeping tactor .5iO
Training related factor .698
Marketing factor .725
!nfrastructural access .809
Financial Institution .836
Working promise .822
Government Policy .643
AOO - .519- .321 .256..
.256..
- .270 - ., - ".209 .277 .273 A12
.338 .i94.,
.2i i .382.,
.260 - .158,
.105
.247 " .168 "
.344 "
Policy
.295-
performance Management Finance Record keeping Training Marketing Infrastructure Acc. of cr. Fls Working promise Gover.
.348" .075
.i32 .403
.148' .315"
.245" -.130'
.375- .042
.385- .13i
.175"
*. Correlation is significant at the 0.05 level (2-tailed).
Note that:
Multicollinearity is the correlation among the independent variables.
Variance Inflation Factor (VIF) - measures how much the variance of the regression coefficients is inflated by multicollinearity problems.
IfVIF equals 0, there is no correlation between the independent measures. A VIF measure of I is an indication of some association between predictor variables,but generally not enough to cause problems.
From the above correlation matrix, predictor variables can be correlated with each other below 0.5 or 50%, which indicates the
absence of series problem of multicollinearity in the regression equation.
10
This work is licensed under aCreative CommonsAttribution - NonCommercial - NoDerivs 3.0 License.
To view a copy of the license please see:htto:/ /creativecom mons.orq/licenses/bv-nc-nd/3. 0/
This is a download from the BLDS Digital Library on OpenDocshttp/lopendocs Ids. ac uk/ooendocs!
Related Documents