Deconstructing Black-Boxes: Notes from the field This post contains a detailed summary of the secondary research component and an early stage analysis of the three interviews that were completed as a part of the primary research component of this project. Two of these Interviews were conducted with data scientists working with large scale public data. The third Interview was with an Image processing expert now active in the field of data sciences. DERIVATIVES OF THE SECONDARY RESEARCH Work done until now was cursorily captured in the two research notes published earlier. Substantiating the conceptual metaphoric convergence of the Camera and the Interface were key conclusions such as 1. Building upon the “medium as a vector argument” put forward during the Gun- Camera narrative, the Camera and the Interface behave the same. 2. The stakeholders [1]are both physically and conceptually situated at the two ends of the medium. They assume media is the vector and then they play the roles aligned to the power structures associated with their position. What is shared in the shot/tweet is a private moment. However the backend - which is the invisible face of artificial learning, algorithmically cognizant data eating machine – generates the private moment. It generates the practice of using the media. It creates the idea of the image, the need to capture the 1.

Welcome message from author
This document is posted to help you gain knowledge. Please leave a comment to let me know what you think about it! Share it to your friends and learn new things together.
Transcript
Deconstructing Black-Boxes: Notes from the field
This post contains a detailed summary of the secondary research
component and an early stage analysis of the three interviews that
were completed as a part of the primary research component of this
project. Two of these Interviews were conducted with data
scientists working with large scale public data. The third
Interview was with an Image processing expert now active in the
field of data sciences.
DERIVATIVES OF THE SECONDARY RESEARCH
Work done until now was cursorily captured in the two research
notes published earlier. Substantiating the conceptual metaphoric
convergence of the Camera and the Interface were key conclusions
such as
1. Building upon the “medium as a vector argument” put forward
during the Gun- Camera narrative, the Camera and the Interface
behave the same.
2. The stakeholders [1]are both physically and conceptually
situated at the two ends of the medium. They assume media is
the vector and then they play the roles aligned to the power
structures associated with their position. What is shared in
the shot/tweet is a private moment. However the backend -
which is the invisible face of artificial learning,
algorithmically cognizant data eating machine – generates the
private moment. It generates the practice of using the media.
It creates the idea of the image, the need to capture the
1.
image and the need to pose for it. It, similarly constructs
the idea of systematic utility of the behavioral information
and the ritual of producing it [2] and consuming it [3]. The
participants in the practice assume that they are in a setup
where one of them or both of them have the agency over the
media whereas the media (and largely the backend) is the one
with the agency.
3. What makes the participant trust and hence engage with the
Media? It is the Interface. The Interface which was
constructed with the forces of user research (a combination of
usability studies and ethnographic studies) and Visual design
(aesthetic seduction informed by the rigour of color and form
theories and validated by cognitive sciences) and now,
supplemented by data sciences(with their statistically and
programmatically defined user cohorts being used to mass
customize the interface) . This attribute is the “Mirror”
which depicts familiarity, telling participants that they are
with themselves or with someone like them. In case of the
Camera, these are the well curated mass produced images
Norming (shaping the environment) and forming (shaping the
dream environment) participant’s world in the same time, drawn
from amongst social cohorts same or similar to the user’s on a
consumer scale.
4. Another attribute that the Interface has is its Slave/Agency-
less behavior which convinces the participants of its
invisibility and hence the innocence in the entire act. When
the shoot/tweet happens the media becomes invisible because it
1.
is capable of shifting focus away from itself and onto a
subject.
5. Intermittently and interchangeably referred to as media, the
Interface and the Camera are membranes, the spaces for
constant contestation If we reduce it to being a spectator
then it is witnessing the power struggles at the two end, the
supposed vector, which essentially was its doing
6. This point was largely derived out of my reading of “The
Networked Society” by Manuel Castells [4]. The Media, (I
called it the Affordance in the last post) gets this position
from the time and space it filters, coupled by the scale and
automation axes it rides on. The co-existence of various types
of affordances with various types of class (the sickle with
the farmer, the lathe with the factory worker and the Futures
and derivative trading interface with the banker) defines the
historic trajectory the Media has taken, which reveals its
politics.
The last point was not so much substantiation as an open thread
that needs to be closed by another body of work. This summarized
the “What” of the enquiry, the first part of my research
question[5]. The “How” part of the research, which I defined as the
Image and Interface Black-box, both of which function as Big Data
Black-boxes in the Social Media, are largely detailed out through
the Primary Research which have been a body of three interviews,
two with data scientists and the third with an image processing
expert turned data scientist. Highlights from this are made
1.
available below. A detailed analysis will follow in the study
report.
HIGHLIGHTS FROM THE PRIMARY RESEARCH
The Data Science duo I spoke to, co-found a company called Data
Weave. As their website reads, this company “provides actionable
data by aggregating, parsing, organizing and visualizing millions
of data points from the Web”. The enterprise largely operates in
fashion trend prediction and catalogue management space and will
soon expand into other spaces.
1. About the trajectory of Big Data and Social Media
A big part ofthe application space in computing has been dedicated
to management of various types of data-bases, be those medical
record systems, electronic logs from an access card reader or a
photo album. The Archive was considered to be a passive, legally
required beast of burden which companies were willing to outsource.
Data warehousing [6] with third party warehouses and access of data
using Mainframe computers were the norm till late 90’s. The data
archives were largely owned by a specific organization and so was
the structured metadata around specific processes or activities.
This data was centrally stored in warehouses and had multiple
layers of protocols to access it thus defining “Who” can access it
and “How” it can be accessed.
With the advent of Distributed Computing [7] and processing
capacities of Client Side Machines[8] ramping up manifolds,
efficient ways of creating- distributed storage, retrieval,
1.
processing and analysis of data- was arrived at. This created the
ground for the arrival of social networks which were capable of
generating massive amount of unstructured data that could be
analyzed for consumer insights.
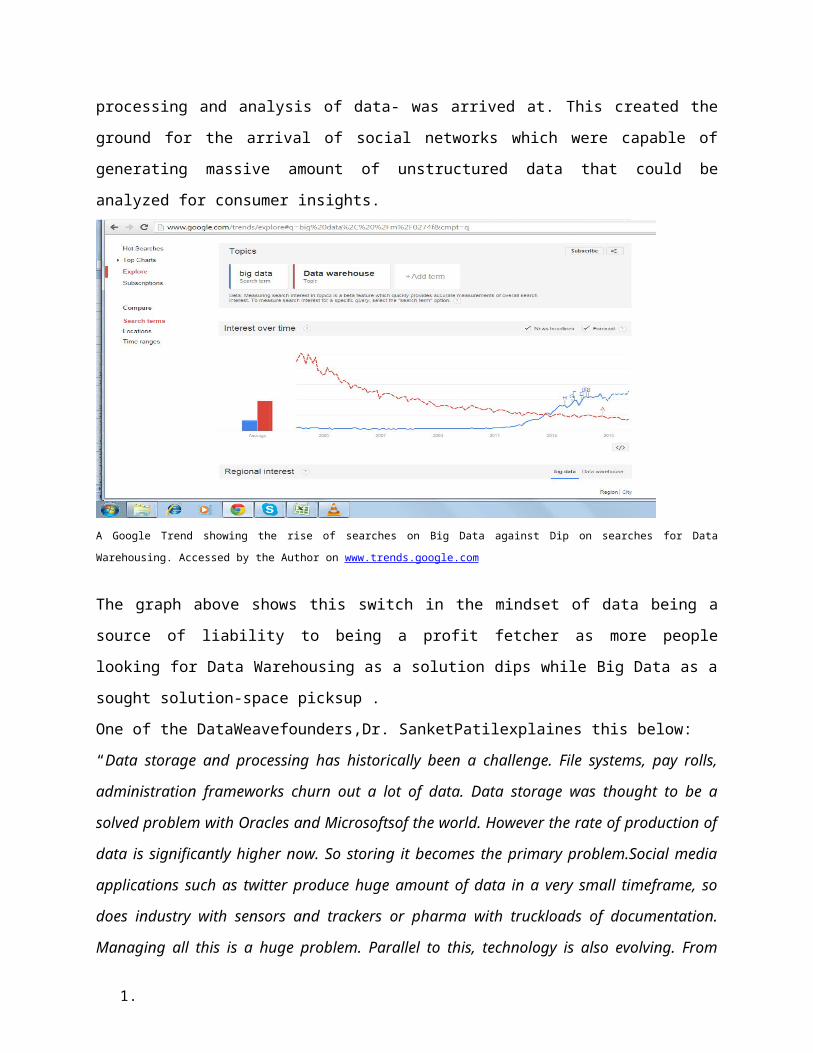
A Google Trend showing the rise of searches on Big Data against Dip on searches for Data
Warehousing. Accessed by the Author on www.trends.google.com
The graph above shows this switch in the mindset of data being a
source of liability to being a profit fetcher as more people
looking for Data Warehousing as a solution dips while Big Data as a
sought solution-space picksup .
One of the DataWeavefounders,Dr. SanketPatilexplaines this below:
“Data storage and processing has historically been a challenge. File systems, pay rolls,
administration frameworks churn out a lot of data. Data storage was thought to be a
solved problem with Oracles and Microsoftsof the world. However the rate of production of
data is significantly higher now. So storing it becomes the primary problem.Social media
applications such as twitter produce huge amount of data in a very small timeframe, so
does industry with sensors and trackers or pharma with truckloads of documentation.
Managing all this is a huge problem. Parallel to this, technology is also evolving. From
1.
Huge servers in Ac server rooms we have graduated to large number of small systems
under the paradigm of Distributed Computing. Since the processing and storage challenges
were growing at a much higher rate than processor speed and hard disk capacities,
technology and platform had to get better so data is now stored and processed in a
distributed manner to serve it to applications.”
Another co-founder, Dr.Mandar Mutallikdesai supplements:
“You see in older days there were accounts people and now data is being produced by
people and machines who are technologically enabled to do so. Due to this, the data has
scaled enormously. This has lead to problems in consumption and sanitization of the data.
Earlier the scale was lesser and the technological assistance was also lesser. (Pause) See,
data is always big for what it can tell us, its worth lies in what it answers”.
2. About the Big Data Framework (The Interface Black-box)
The Interface as discussed collects the user data actively(through
forms/text boxes, affordances) and passively (tags tracing user
footprint on the site). What user chooses to spend time on decides
what user gets to see next time they log in. Data is far from being
structured; it contains a lot of noise. It gets generated in high
volumes and does not leant itself easily to analysis. Big data is
coming together of a lot of technological events to produce
consistently fast data points for decision-making. DrPatil breaks
down the black-box as a series of activities
“Ok this I will explain in a sequence of steps. Data Aggregation i.e. how I get the data is the
first step. Next one is cleaning the data, removing noise to make public data ready to get
insights from (in our case). The next stage is storing data which should be according to how
that data should be processed (the multi-dimensionality of such data). This is followed by
representation, which is serving the data. A question at this stage is not just how one takes
1.
queries/usage patterns, but also how does one scale to accommodate a huge level of traffic
of queries. Each stage has a different kind of technology. The first stage, which is
Aggregation, has Crawlers [9] and Scrapers [10], which in our business help us aggregate
the data. Data clean-up is done by machine learning algorithms [11] which are trained over
domain specific knowledge base. Storage and processing is done via the Hadoop [12] and
MapReduce [13] frameworks. Serving is done through ElephantDB [14] and Memcashed [15]
(light and fast). For reporting and analytics Tableu [16] is used. For vizualization we show a
lot of aesthetic infographics via libraries that are Javascript and Python based. D3.js [17] is
one of them . Google and IBM have similar libraries. For dashboard we use a combination
of HTML and JS. twitter library called Bootstrap is also quite well known. Since we are
largely in retail which has traditionally not been a technology space we cannot just dump
data on them, it has to be shown as insights that are classifiable into actionables by
showing vizualizations and reports”.
He also gives a historical perspective on the development of
technologies related to this space.
Google was the pioneer in this field when they introduced this framework called Mapreduce
with google file system which is very similar to HDFS which is open source. Yahoo followed it
up with its open source framework Hadoop. You also have to understand that in case of big
data analytics, Data is not structured. By this i mean that the dataset is not fixed and more
data you have more possible number of questions it can answer. When one wishes to log
this data, they key variable they are looking at what questions do they want this data to
answer, which will dictate what would be the best way to save this data (the data structure )
and which, in turn will dictate what kind of infrastructure is required. An example which
explains how the question dictates the approach is say searching info about an individual
in a social network is a point query, while looking up a friend's friend is a network query
and will make use of network graphs(which is a model of data network). A query like this is
very difficult in a traditional network and needs new models of data network. We apply big
1.
data framework largely to retail problems like fashion analysis, scenario planning, trending
colors and palettes and Runway analysis. A lot of people are also using it in real estate
tracking. Largely businesses with massive information and transcation online, with
searchable data adopt big data frameworks to make sense of what is happening on their
website.People are using Big data in healthcare even though its tricky due to privacy issues,
but the step forward is to still adopt and use it.Archeologists are using it for pattern
recognition of older motifs and machine learning has revealed patterns missed by the
experts. Art, architecture and healthcare are few early adapters where production of data is
extremely high”
He explains the constrains around the ownership of data and running
analytics over it.
“So a traditional data analytics is called an Intra firewall, meaning whatever data is
available within the organization. Then there is something called Inter-firewall where
organizations in similar domain make a data syndicate and run analytics over it. The third
thing is called trans-firewall which is the analytics done beyond one's firewall i.e. Analytics
on public data.A lot of companies, like our clients, have intra firewall data that they
augment with trans-firewall data for better decision-making.We are in this space largely
looking at this problem industry by industry, currently focusing on retail, mainly on the
products being shown online”.
1.
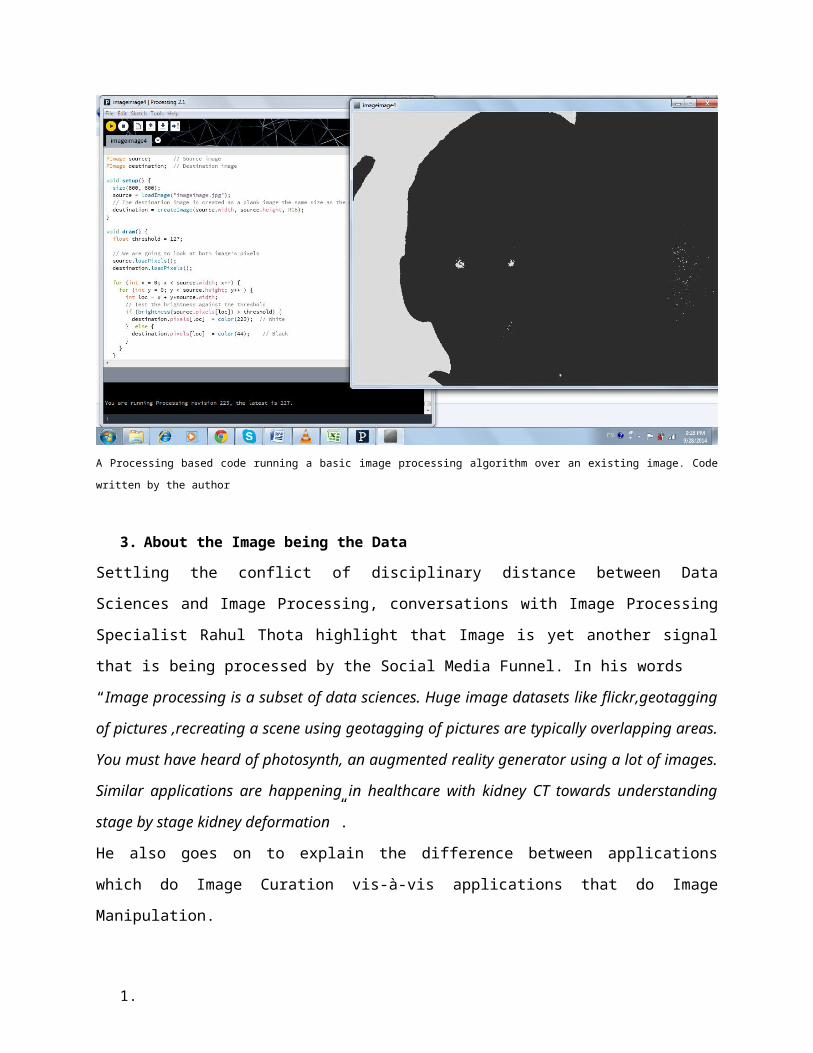
A Processing based code running a basic image processing algorithm over an existing image. Code
written by the author
3. About the Image being the Data
Settling the conflict of disciplinary distance between Data
Sciences and Image Processing, conversations with Image Processing
Specialist Rahul Thota highlight that Image is yet another signal
that is being processed by the Social Media Funnel. In his words
“Image processing is a subset of data sciences. Huge image datasets like flickr,geotagging
of pictures ,recreating a scene using geotagging of pictures are typically overlapping areas.
You must have heard of photosynth, an augmented reality generator using a lot of images.
Similar applications are happening in healthcare with kidney CT towards understanding
stage by stage kidney deformation”.
He also goes on to explain the difference between applications
which do Image Curation vis-à-vis applications that do Image
Manipulation.
1.
“Pinterest or similar apps manage albums which are image datasets. Various pattern
recognition algos try to define regions of interest in the image and also work on occlusion
of redundant content (such as sky in the backgrocund etc). Face detection and number of
faces is also a key parameter for sorting and ranking images. Contrast and details in an
image could also be an important parameter. Curatorial sites also have machine learning
algos which learn user behavior on album management.Algos also learn how data is labled
and try to find what rules are satisfied by this labeling and classification. Rule engines thus
manage the new "unlabeled" image”.
4. About the Image Blackbox
Rahul explains a basic image processing Blackbox through an Image
posting or a filter camera.
“Signal processing , Image processing and Graphics are related domains. Signal
processing is largely measuring and drawing inference from any signal. Things like
periodicity or frequencies are analyzed and inferences are taken. If you consider the image
as a 2d signal that will you a fair idea of what image processing does. Graphics combined
with image processing looks at rendering and recreating a scene, a popular example being
the Raytracing algorithm which places a light source at infinity and calculates how the light
gets reflects off various objects and thus renders the scene. Talking about the role image
processing plays in social media channels,it’s largely that subjective preferences are
standardized, with more details, like standard brightness and contrast enhancement.
Instagram for example was a big hit because it makes the image look vintage. It notches up
the red a little bit and then dulls the contrast. Image looks nostalgic. It took off because of
the network effect”.
REFERENCES
1. Refers to the human agents in the act, for example theshooter and the shot in case of the camera and the dataproducer and the data consumer in case of the Camera.
1.
2. Users produce such information through online forms, likes and comments on social media, mere movement of mouse from one section of page to another and offline movements in sensor environments such as access controlled rooms, public spaces with ip Cameras etc.
3. Users consume the analytics output through dashboards, machinelogs and automated to do lists or task lists. Auto switches such as action rules that machine or a user does after an alert has been generated come under this category.
4. Castells, Manuel. The rise of the network society: The information age: Economy, society, and culture. Vol. 1. JohnWiley & Sons, 2011.
5. First post in the series. http://sarai.net/the-so-far-of-shooting-with-the-interface/.
6. For a quick scan see http://en.wikipedia.org/wiki/Data_warehouse.
7. For a quick scan see http://en.wikipedia.org/wiki/Distributed_computing8. Client side machines are the Computers used to access data
stored on Servers using the internet. For more information see http://en.wikipedia.org/wiki/Client%E2%80%93server_model.
9. For a quick scan see http://en.wikipedia.org/wiki/Web_crawler.
10. For a quick scan see http://en.wikipedia.org/wiki/Data_scraping#Screen_scraping.
11. Details on various machine learning algorithms http://en.wikipedia.org/wiki/List_of_machine_learning_algorithms.
12. Information on Hadoophttp://hadoop.apache.org/.
1.
13. Information on MapReducehttp://en.wikipedia.org/wiki/MapReduce
14. Elephant DB is a very minimalist DB used to serve MapReduce results from Hadoophttps://github.com/nathanmarz/elephantdb.
15. Stores arbitrary data in-memoryhttp://memcached.org/.
16. Augments data visualization workflows http://www.tableausoftware.com/.
17. Javascript Library for visualization http://d3js.org/.
1.
Related Documents