The California Report on Coronary Artery Bypass Graft Surgery | CCORP California CABG Outcomes Reporting Program February 2014 2011 Hospital Data

Welcome message from author
This document is posted to help you gain knowledge. Please leave a comment to let me know what you think about it! Share it to your friends and learn new things together.
Transcript
The California Report on Coronary Artery Bypass Graft Surgery
| CCORP
California CABG Outcomes Reporting Program
February 2014
2011 Hospital Data

The California Report on Coronary Artery Bypass Graft Surgery
2011 Hospital Data
F e b r u a r y 2 0 1 4
Edmund G. Brown Jr., Governor State of California
Diana S. Dooley, Secretary Health and Human Services Agency
Robert P. David, Director Office of Statewide Health Planning and Development

THE CALIFORNIA REPORT ON CORONARY ARTERY BYPASS GRAFT SURGERY, 2011 HOSPITAL DATA
PREFACE
February 2014
The Office of Statewide Health Planning and Development (OSHPD) is pleased to share with you the ninth public release of data from the state’s mandatory heart bypass surgery reporting program, the California Coronary Artery Bypass Graft (CABG) Outcomes Reporting Program (CCORP). This report provides quality ratings for 122 state-licensed hospitals performing isolated CABG surgery during 2011. The hospital performance ratings are based on three risk-adjusted health outcomes: operative mortality, post-operative stroke, and hospital readmission. This is our third report that rates hospitals on their unplanned readmissions, a problem that has received considerable national attention because it contributes to increased costs to the healthcare system. This report also includes an important process measure of surgical quality: the use of the internal mammary artery during CABG surgery.
Isolated CABG surgery means that no other major procedure, such as valve repair or carotid endarterectomy, was performed at the same time as the bypass surgery. In 2011, the statewide operative mortality rate for isolated CABG surgery was 2.01%. This is a slight increase from the 2.00% rate in 2010, but a 31% reduction from the 2.91% rate in 2003, the first year of mandatory reporting.
This information is intended for cardiac patients and their families who are considering treatment plans with their doctors. It is also intended for hospitals and surgeons who are developing quality improvement activities and for organizations that purchase healthcare coverage for their members. The 2011 report provides accurate and valid findings; however, cardiac surgeon or hospital practices may have changed since the 2011 data were collected by OSHPD.
OSHPD commends the hospitals and cardiac surgeons in California and the CCORP Clinical Advisory Panel, which oversees this program, for their hard work and support of this public reporting program. OSHPD continues to work with hospitals, physicians, and professional surgical societies to ensure that these reports are accurate and fair, and that they contribute to improved cardiac surgical care for all residents of the Golden State.
Robert P. David Director California Office of Statewide Health Planning and Development
i

THE CALIFORNIA REPORT ON CORONARY ARTERY BYPASS GRAFT SURGERY, 2011 HOSPITAL DATA
ii

THE CALIFORNIA REPORT ON CORONARY ARTERY BYPASS GRAFT SURGERY, 2011 HOSPITAL DATA
Acknowledgments
The California Coronary Artery Bypass Graft (CABG) Outcomes Reporting Program (CCORP) is funded by the Office of Statewide Health Planning and Development’s California Health Data and Planning Fund.
This report represents the contributions of many individuals. Hospital staff dedicated time and resources to collect, report, and review the data for analysis. Hospitals provide ongoing feedback on the design of the program, which is vital to its success, and members of the CCORP Clinical Advisory Panel provide oversight and policy guidance for data collection and analysis. The California Department of Public Health provided vital statistics files needed for identifying post-surgery deaths after discharge. CCORP also benefited from collaboration with the Society of Thoracic Surgeons and its California Chapter for improved data quality.
CCORP reflects the efforts and significant contributions of the following individuals:
Office of Statewide Health Planning and Development
University of California, Davis Study Consultants
Ronald A. Spingarn, M.S. Deputy Director, Healthcare Information Division
Zhongmin Li, Ph.D. Principal Investigator
Joseph P. Parker, Ph.D. Manager, Healthcare Outcomes Center
Beate Danielsen, Ph.D. Co-investigator
Holly Hoegh, Ph.D. Manager, Clinical Data Programs
James P. Marcin, M.D., M.P.H. Co-investigator
Denise O’Neill Clinical Data Manager
Geeta Mahendra, M.A., M.S. Senior Programmer
Robert Springborn, Ph.D. Research Scientist
Dominique Ritley, M.P.H. Project Assistant
Mary Moseley, M.A. Contracts Manager
Garrett Wong, M.D. Clinical Consultant
Project Advisors Ezra Amsterdam, M.D. Richard White, M.D. Patrick Romano, M.D., M.P.H. University of California, Davis
Anthony E. Steimle, M.D., F.A.C.C. Kaiser Foundation Hospital – Santa Clara
Student Assistants
Justin Reyna Anna Le
iii
THE CALIFORNIA REPORT ON CORONARY ARTERY BYPASS GRAFT SURGERY, 2011 HOSPITAL DATA
California CABG Outcomes Reporting Program (CCORP) Clinical Advisory Panel
Chair
Ralph G. Brindis, M.D., M.P.H., F.S.C.A.I. Clinical Professor of Medicine Department of Medicine & the Philip R. Lee Institute for Health Policy Studies University of California, San Francisco
Members Andrew B. Bindman, M.D. Professor of Medicine, Health Policy Epidemiology & Biostatistics University of California, San Francisco
James MacMillan, M.D. Valley Heart Surgeons
Cheryl L. Damberg, Ph.D. Senior Researcher, RAND Corporation
Rita F. Redberg, M.D. Professor of Medicine Division of Cardiology University of California, San Francisco
Gordon L. Fung, M.D., MPH, Ph.D., F.A.C.C. F.A.C.P., F.A.H.A. Clinical Professor of Medicine UCSF School of Medicine
Richard J. Shemin, M.D. Cardiothoracic Surgery Chief, Division of Cardiothoracic Surgery Executive Vice Chair, Department of Surgery Co-Director, Cardiovascular Center at UCLA Medical Center
Hon S. Lee, M.D. Department of Cardiovascular Surgery The Permanente Medical Group
J. Nilas Young, M.D. Chief, Cardiothoracic Surgery University of California, Davis Medical Center
Suggested citation: State of California, Office of Statewide Health Planning and Development. The California Report on Coronary Artery Bypass Graft Surgery, 2011 Hospital Data, Sacramento, CA: Office of Statewide Health Planning and Development, February 2014. This report may also be accessed through the OSHPD Website (www.oshpd.ca.gov).
iv
THE CALIFORNIA REPORT ON CORONARY ARTERY BYPASS GRAFT SURGERY, 2011 HOSPITAL DATA
TABLE OF CONTENTS
Executive Summary ................................................................................................................................................................. 1
Introduction ................................................................................................................................................................................ 5
What is CABG surgery? ................................................................................................................................................... 5
What does this report measure? ................................................................................................................................ 5
What is Coronary Artery Disease? ............................................................................................................................. 5
Measure Definitions ......................................................................................................................................................... 5
Why are these outcomes important to measure? ............................................................................................... 6
Who is the intended audience for this report? ..................................................................................................... 6
Who is included in this report (study population)? ........................................................................................... 7
What data are used in this report? ............................................................................................................................ 7
Risk-Adjusted Isolated CABG Surgery Outcomes: Hospital Performance Ratings ........................................ 8
2011 Hospital Risk-Adjusted Operative Mortality Results ............................................................................. 8
2010-2011 Hospital Risk-Adjusted Post-Operative Stroke Results ............................................................ 8
2011 Hospital Risk-Adjusted 30-Day Readmission Results ........................................................................... 8
2011 Internal Mammary Artery Usage by Hospital: A Process Measure of Quality ............................. 9
Cardiac Revascularization Procedures: Statewide Volume and Observed In-Hospital Mortality of CABG Surgeries and PCI Procedures .................................................................................................... 16
Cardiac Revascularization Volume ......................................................................................................................... 16
Cardiac Revascularization Mortality ..................................................................................................................... 16
APPENDICES
APPENDIX A: Data Quality Review and Verification ............................................................................................... 20
APPENDIX B: Technical Notes on Hospital Operative Mortality Rate Calculations (2011) ................... 22
Statistical Details of Hospital Risk-Adjusted Operative Mortality Rate Results (2011)................... 26
APPENDIX C: Technical Notes on Risk-Adjusted Hospital Post-Operative Stroke Calculations ........... 37
Statistical Details of Hospital Risk-Adjusted Post-Operative Stroke Results, 2010-2011 .............. 41
APPENDIX D: Technical Notes for 30-Day Risk-Adjusted Hospital Readmission Results ...................... 52
Statistical Details of 30-Day Risk-Adjusted Readmission Results 2011 ................................................. 56
APPENDIX E: Statistical Details of Internal Mammary Artery Usage by Hospital, 2011: A Process Measure of Quality ........................................................................................................................................... 67
APPENDIX F: Definition of Readmission ...................................................................................................................... 73
APPENDIX G: Hospital Statements ................................................................................................................................. 77
v

THE CALIFORNIA REPORT ON CORONARY ARTERY BYPASS GRAFT SURGERY, 2011 HOSPITAL DATA
TABLES AND FIGURES
Tables
Table 1: Hospitals with “Better” Performance Ratings ........................................................................................... 3
Table 2: Hospitals with “Worse” or “Low” Performance Ratings ....................................................................... 3
Table 3: California Hospital Performance Ratings for Coronary Artery Bypass Graft (CABG) Surgery by Region as Compared to the Statewide Average, 2011 .................................................................... 10
Table B-1: Logistic Regression Risk Model for Operative Mortality, 2011.................................................... 23
Table B-2: Calibration of Risk Model for Operative Mortality, 2011 ............................................................... 25
Table B-3: Hospital Risk-Adjusted Mortality Results by Region, 2011 ........................................................... 28
Table C-1: Logistic Regression Risk Model for Post-Operative Stroke, 2010-2011 ................................... 38
Table C-2: Calibration of Risk Model for Post-Operative Stroke, 2010-2011 .............................................. 40
Table C-3: Hospital Risk-Adjusted Post-Operative Stroke Results by Region, 2010-2011 ..................... 43
Table D-1: Logistic Regression Risk Model for 30-Day Readmission, 2011 ................................................. 53
Table D-2: Calibration of Risk Model for 30-Day Readmission, 2011 ............................................................. 55
Table D-3: Hospital Risk-Adjusted Readmission Results by Region, 2011 ................................................... 58
Table E-1: Hospital Internal Mammary Artery Usage Results by Region, 2011 .......................................... 68
Figures
Figure 1: Volume of Isolated CABG, Non-Isolated CABG, Valve-Only, and PCI Procedures in California, 1997-2012 .......................................................................................................................................................... 17
Figure 2: In-Hospital Mortality Rates for Isolated CABG, Non-Isolated CABG, Valve-Only, and PCI Procedures in California, 1997-2012 ........................................................................................................... 18
vi
THE CALIFORNIA REPORT ON CORONARY ARTERY BYPASS GRAFT SURGERY, 2011 HOSPITAL DATA
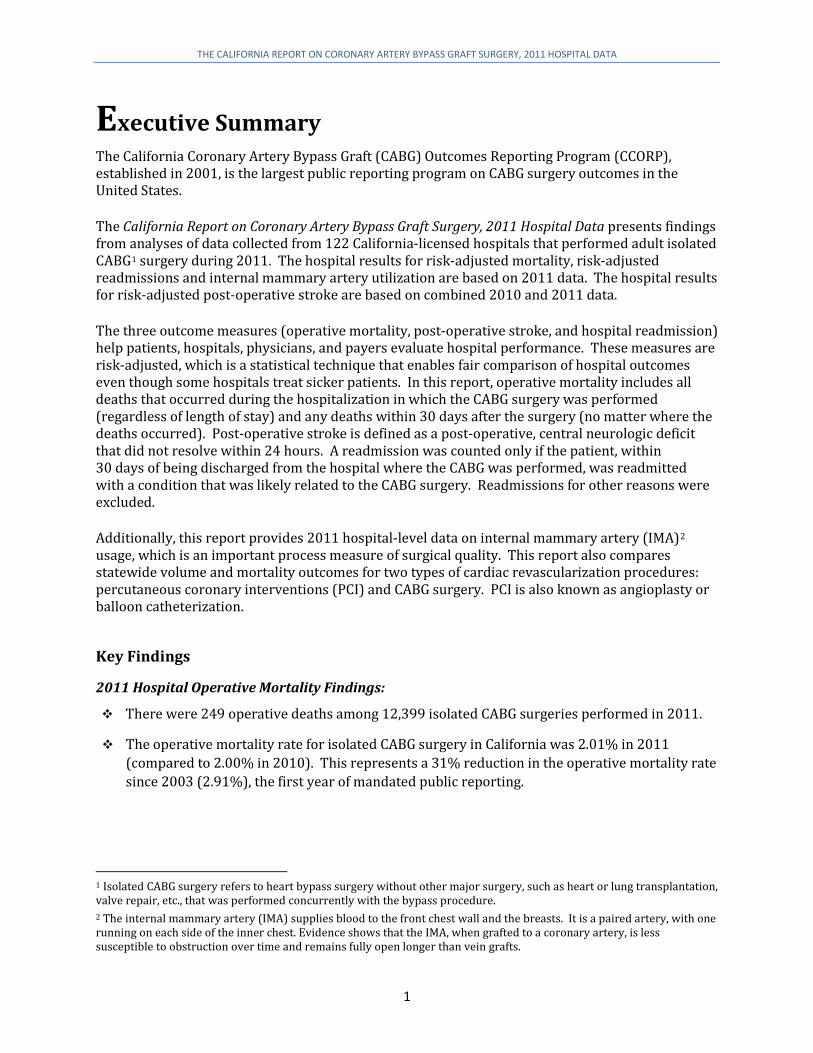
Executive Summary The California Coronary Artery Bypass Graft (CABG) Outcomes Reporting Program (CCORP), established in 2001, is the largest public reporting program on CABG surgery outcomes in the United States. The California Report on Coronary Artery Bypass Graft Surgery, 2011 Hospital Data presents findings from analyses of data collected from 122 California-licensed hospitals that performed adult isolated CABG1 surgery during 2011. The hospital results for risk-adjusted mortality, risk-adjusted readmissions and internal mammary artery utilization are based on 2011 data. The hospital results for risk-adjusted post-operative stroke are based on combined 2010 and 2011 data. The three outcome measures (operative mortality, post-operative stroke, and hospital readmission) help patients, hospitals, physicians, and payers evaluate hospital performance. These measures are risk-adjusted, which is a statistical technique that enables fair comparison of hospital outcomes even though some hospitals treat sicker patients. In this report, operative mortality includes all deaths that occurred during the hospitalization in which the CABG surgery was performed (regardless of length of stay) and any deaths within 30 days after the surgery (no matter where the deaths occurred). Post-operative stroke is defined as a post-operative, central neurologic deficit that did not resolve within 24 hours. A readmission was counted only if the patient, within 30 days of being discharged from the hospital where the CABG was performed, was readmitted with a condition that was likely related to the CABG surgery. Readmissions for other reasons were excluded. Additionally, this report provides 2011 hospital-level data on internal mammary artery (IMA)2 usage, which is an important process measure of surgical quality. This report also compares statewide volume and mortality outcomes for two types of cardiac revascularization procedures: percutaneous coronary interventions (PCI) and CABG surgery. PCI is also known as angioplasty or balloon catheterization.
Key Findings
2011 Hospital Operative Mortality Findings:
There were 249 operative deaths among 12,399 isolated CABG surgeries performed in 2011.
The operative mortality rate for isolated CABG surgery in California was 2.01% in 2011 (compared to 2.00% in 2010). This represents a 31% reduction in the operative mortality rate since 2003 (2.91%), the first year of mandated public reporting.
1 Isolated CABG surgery refers to heart bypass surgery without other major surgery, such as heart or lung transplantation, valve repair, etc., that was performed concurrently with the bypass procedure. 2 The internal mammary artery (IMA) supplies blood to the front chest wall and the breasts. It is a paired artery, with one running on each side of the inner chest. Evidence shows that the IMA, when grafted to a coronary artery, is less susceptible to obstruction over time and remains fully open longer than vein grafts.
1

THE CALIFORNIA REPORT ON CORONARY ARTERY BYPASS GRAFT SURGERY, 2011 HOSPITAL DATA
There was significant3 variation, from 0% to 8.18%, in hospital operative mortality rates after adjusting for patient pre-operative health. Despite such variation, 121 of 122 hospitals (99%) performed at a rate that did not differ significantly from the statewide average.
No hospital performed significantly “Better” than the state average in terms of risk-adjusted operative mortality (Table 1), and one hospital performed “Worse” than the state average (Table 2).
2010-2011 Hospital Post-Operative Stroke Findings:
329 of the 24,947 patients (1.32%) who underwent isolated CABG surgery in 2010-2011 experienced a post-operative stroke; this is a slight increase since 2009-2010 (1.31%), and just below the national rate of 1.4% reported by the Society of Thoracic Surgeons.4
There was wide variation in post-operative stroke rates among hospitals after adjusting for patient pre-operative health. Hospital risk-adjusted post-operative stroke rates ranged from 0% to 5.10% and 118 of 123 hospitals (96%) performed at a rate that did not differ significantly from the statewide average.
One hospital performed “Better” than the state average (Table 1), and four hospitals performed “Worse” than the state average (Table 2).
2011 Hospital Readmission Findings:
1,438 of the 11,085 patients (12.97%) who underwent isolated CABG surgery in 2011 and were discharged alive experienced a hospital readmission within 30 days of the surgery. This represents a 1.4% reduction from the 2010 rate of 13.15%.
There was wide variation in the readmission rates among hospitals performing CABG surgery after adjusting for patient pre-operative conditions. Hospital risk-adjusted readmission rates ranged from 0% to 33.05% and 116 of 122 hospitals (95%) performed at a rate that did not differ significantly from the statewide average.
Two hospitals performed “Better” than the state average on hospital readmissions (Table 1),
and four hospitals performed “Worse” than the state average (Table 2).
2011 Hospital Internal Mammary Artery (IMA) Usage Findings:
The IMA is the preferred conduit for CABG surgery of the left anterior descending (LAD) artery. Hospitals with high rates of IMA use are providing high quality care to their patients. California hospitals had a 96.65% IMA usage rate in 2011 compared to 89.6% in 2003.5
3 Significant refers to statistically significant with a less than 5% probability that the result is due to chance alone (p<0.05). 4 Shahian DM, O'Brien SM, Filardo G, et al. The Society of Thoracic Surgeons 2008 cardiac surgery risk models: part 1—coronary artery bypass grafting surgery. Ann Thorac Surg 2009; 88:S2-22. 5 The increase in the statewide IMA usage rate from 93.7% in 2007 to 95.9% in 2008, 96.2% in 2009, 96.0% in 2010, and 96.7% in 2011 is partly due to a change in the IMA measure. Beginning in 2008, patients who did not have the LAD bypassed were excluded from the denominator. If this exclusion were not used, the statewide IMA usage rate would be 94.4% for 2008, 94.8% for 2009, 94.7% for 2010, and 95.2% for 2011.
2
THE CALIFORNIA REPORT ON CORONARY ARTERY BYPASS GRAFT SURGERY, 2011 HOSPITAL DATA
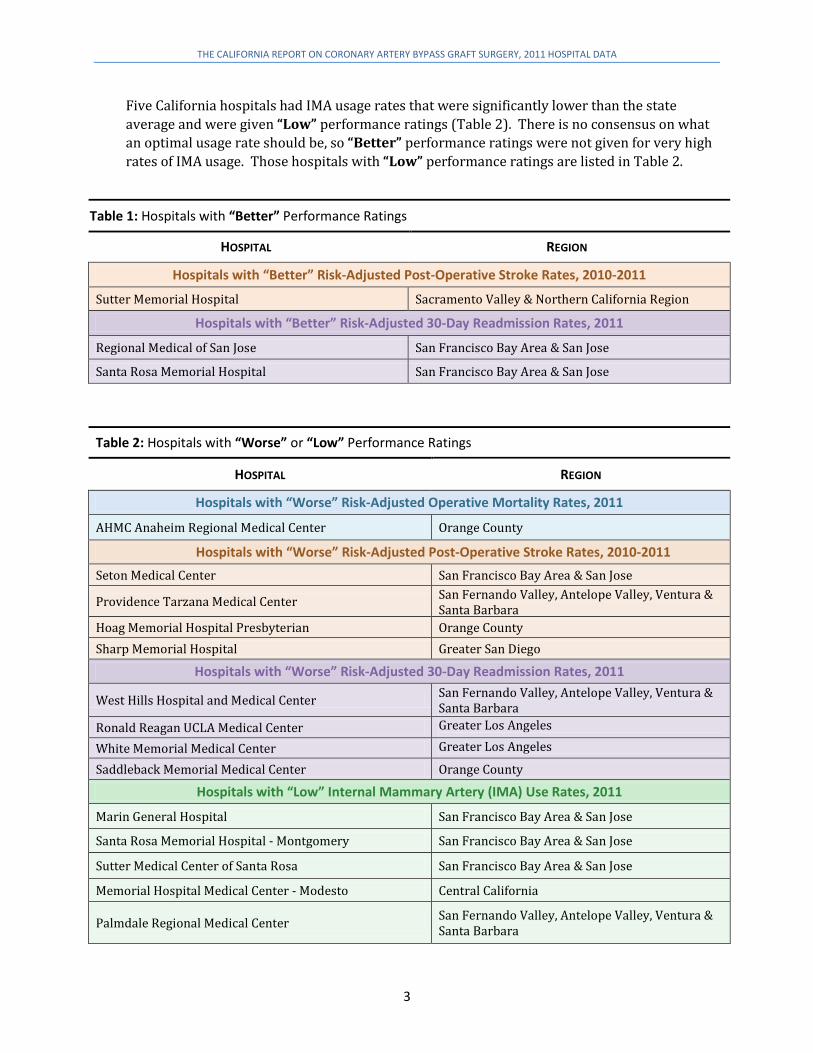
Five California hospitals had IMA usage rates that were significantly lower than the state average and were given “Low” performance ratings (Table 2). There is no consensus on what an optimal usage rate should be, so “Better” performance ratings were not given for very high rates of IMA usage. Those hospitals with “Low” performance ratings are listed in Table 2.
Table 1: Hospitals with “Better” Performance Ratings HOSPITAL REGION
Hospitals with “Better” Risk-Adjusted Post-Operative Stroke Rates, 2010-2011
Sutter Memorial Hospital Sacramento Valley & Northern California Region
Hospitals with “Better” Risk-Adjusted 30-Day Readmission Rates, 2011
Regional Medical of San Jose San Francisco Bay Area & San Jose
Santa Rosa Memorial Hospital San Francisco Bay Area & San Jose
Table 2: Hospitals with “Worse” or “Low” Performance Ratings
HOSPITAL REGION
Hospitals with “Worse” Risk-Adjusted Operative Mortality Rates, 2011
AHMC Anaheim Regional Medical Center Orange County
Hospitals with “Worse” Risk-Adjusted Post-Operative Stroke Rates, 2010-2011 Seton Medical Center San Francisco Bay Area & San Jose
Providence Tarzana Medical Center San Fernando Valley, Antelope Valley, Ventura & Santa Barbara
Hoag Memorial Hospital Presbyterian Orange County Sharp Memorial Hospital Greater San Diego
Hospitals with “Worse” Risk-Adjusted 30-Day Readmission Rates, 2011
West Hills Hospital and Medical Center San Fernando Valley, Antelope Valley, Ventura & Santa Barbara
Ronald Reagan UCLA Medical Center Greater Los Angeles White Memorial Medical Center Greater Los Angeles Saddleback Memorial Medical Center Orange County
Hospitals with “Low” Internal Mammary Artery (IMA) Use Rates, 2011
Marin General Hospital San Francisco Bay Area & San Jose
Santa Rosa Memorial Hospital - Montgomery San Francisco Bay Area & San Jose
Sutter Medical Center of Santa Rosa San Francisco Bay Area & San Jose
Memorial Hospital Medical Center - Modesto Central California
Palmdale Regional Medical Center San Fernando Valley, Antelope Valley, Ventura & Santa Barbara
3
THE CALIFORNIA REPORT ON CORONARY ARTERY BYPASS GRAFT SURGERY, 2011 HOSPITAL DATA
Percutaneous Coronary Intervention (PCI) vs. CABG Utilization and Outcomes Findings:
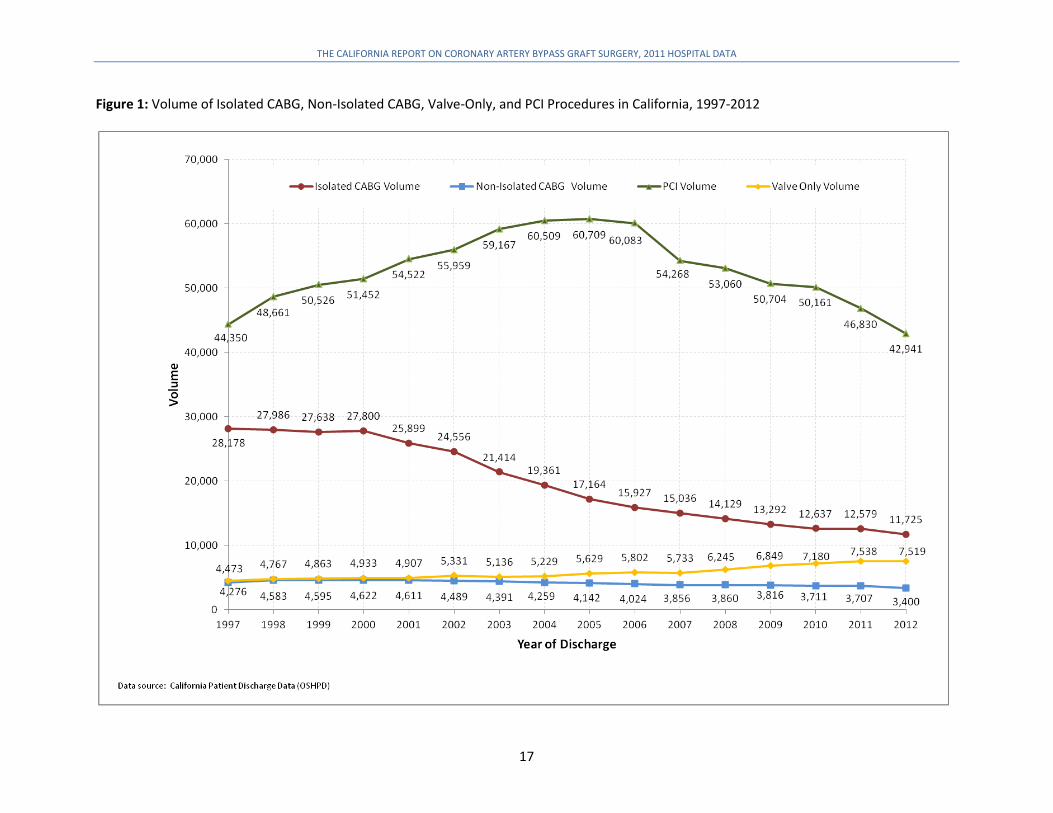
Volume: Between 1997 and 2012, PCI (angioplasty/balloon catheterization) volume decreased by 3% (from 44,350 to 42,941) while isolated CABG surgeries decreased by 58% (from 28,178 to 11,725) and non-isolated CABG surgeries decreased by 20% (from 4,276 to 3,400). For the same time period, valve-only procedures increased by 68% (from 4,473 to 7,519).
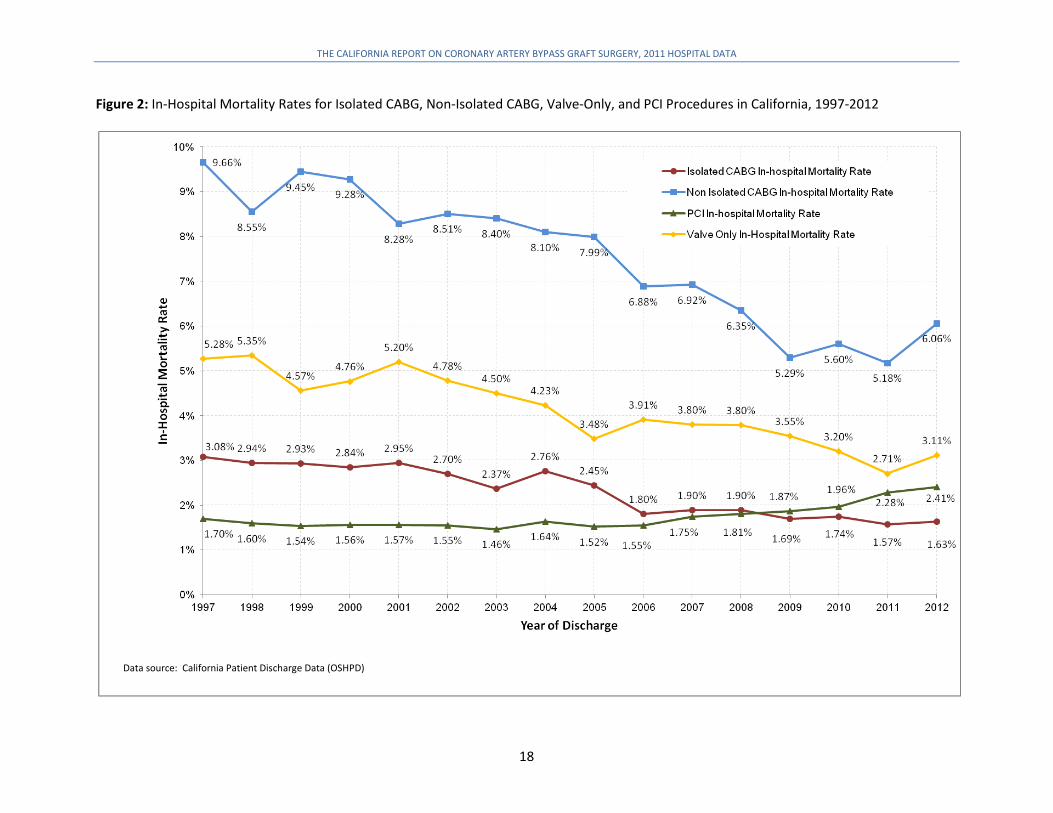
Mortality: Between 1997 and 2012, observed in-hospital mortality rates for isolated and non-isolated CABG surgeries decreased from 3.08% to 1.63% and from 9.66% to 6.06%, respectively. The observed in-hospital mortality for valve-only procedures decreased from 5.28% to 3.11%. However, the observed in-hospital mortality rate for PCIs increased from 1.70% to 2.41%, surpassing the in-hospital mortality rate for isolated CABG surgeries.
4
THE CALIFORNIA REPORT ON CORONARY ARTERY BYPASS GRAFT SURGERY, 2011 HOSPITAL DATA
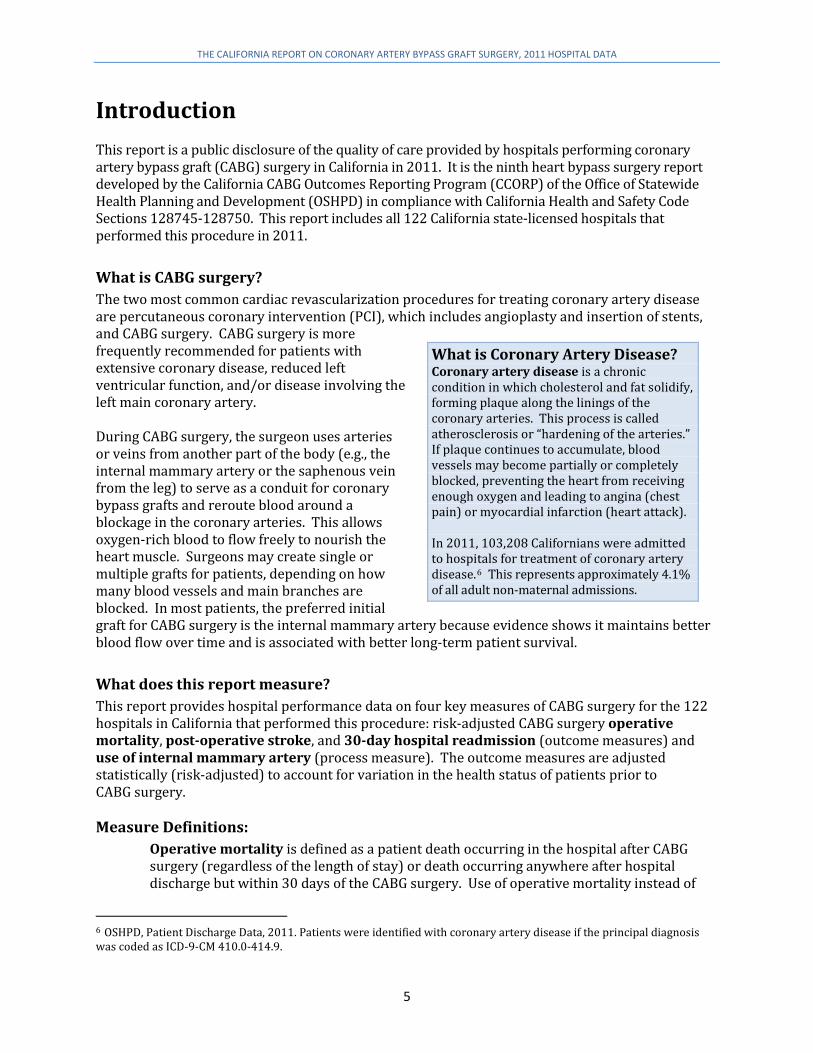
Introduction This report is a public disclosure of the quality of care provided by hospitals performing coronary artery bypass graft (CABG) surgery in California in 2011. It is the ninth heart bypass surgery report developed by the California CABG Outcomes Reporting Program (CCORP) of the Office of Statewide Health Planning and Development (OSHPD) in compliance with California Health and Safety Code Sections 128745-128750. This report includes all 122 California state-licensed hospitals that performed this procedure in 2011.
What is CABG surgery? The two most common cardiac revascularization procedures for treating coronary artery disease are percutaneous coronary intervention (PCI), which includes angioplasty and insertion of stents, and CABG surgery. CABG surgery is more frequently recommended for patients with extensive coronary disease, reduced left ventricular function, and/or disease involving the left main coronary artery. During CABG surgery, the surgeon uses arteries or veins from another part of the body (e.g., the internal mammary artery or the saphenous vein from the leg) to serve as a conduit for coronary bypass grafts and reroute blood around a blockage in the coronary arteries. This allows oxygen-rich blood to flow freely to nourish the heart muscle. Surgeons may create single or multiple grafts for patients, depending on how many blood vessels and main branches are blocked. In most patients, the preferred initial graft for CABG surgery is the internal mammary artery because evidence shows it maintains better blood flow over time and is associated with better long-term patient survival.
What does this report measure? This report provides hospital performance data on four key measures of CABG surgery for the 122 hospitals in California that performed this procedure: risk-adjusted CABG surgery operative mortality, post-operative stroke, and 30-day hospital readmission (outcome measures) and use of internal mammary artery (process measure). The outcome measures are adjusted statistically (risk-adjusted) to account for variation in the health status of patients prior to CABG surgery. Measure Definitions:
Operative mortality is defined as a patient death occurring in the hospital after CABG surgery (regardless of the length of stay) or death occurring anywhere after hospital discharge but within 30 days of the CABG surgery. Use of operative mortality instead of
6 OSHPD, Patient Discharge Data, 2011. Patients were identified with coronary artery disease if the principal diagnosis was coded as ICD-9-CM 410.0-414.9.
What is Coronary Artery Disease? Coronary artery disease is a chronic condition in which cholesterol and fat solidify, forming plaque along the linings of the coronary arteries. This process is called atherosclerosis or “hardening of the arteries.” If plaque continues to accumulate, blood vessels may become partially or completely blocked, preventing the heart from receiving enough oxygen and leading to angina (chest pain) or myocardial infarction (heart attack). In 2011, 103,208 Californians were admitted to hospitals for treatment of coronary artery disease.6 This represents approximately 4.1% of all adult non-maternal admissions.
5

THE CALIFORNIA REPORT ON CORONARY ARTERY BYPASS GRAFT SURGERY, 2011 HOSPITAL DATA
in-hospital mortality avoids potential manipulation of outcomes through discharge practices and holds hospitals accountable for patients who died at home or in other facilities shortly after discharge. The National Quality Forum (NQF), which serves as the national body for vetting quality measures, has endorsed the national Society of Thoracic Surgeons (STS) operative mortality measure for CABG surgery.7 CCORP uses the STS definition of operative mortality, and also verifies deaths following patient discharge using death records from the California Department of Public Health. Post-operative stroke is defined as a post-operative, central neurologic deficit that did not resolve within 24 hours after surgery. Hospital readmission includes only those patients readmitted to any hospital within 30 days of being discharged after CABG surgery, who had a principal diagnosis indicating a heart-related condition or an infection or a complication that was likely related to the CABG surgery. Readmissions for other reasons are excluded in this analysis. California adopted the diagnosis categories and associated ICD-9-CM codes used by the Pennsylvania Healthcare Cost Containment Council to identify readmissions. OSHPD extends its thanks to the Council for making these available (Appendix F). Use of the internal mammary artery (IMA) is the preferred method for CABG surgery of the left anterior descending artery. Research shows that high rates of IMA use result in long-term graft patency and improved patient survival.
Additionally, this report describes the longitudinal change in statewide volume of CABG surgeries and PCI (angioplasty) procedures and their related in-hospital mortality rates. These data provide an important context when considering California’s overall performance of cardiac revascularization procedures.
Why are these outcomes important to measure? CABG surgery is one of the most common major cardiac surgeries and one of the most expensive surgeries performed in California. It has a declining mortality rate, but major complications (e.g., stroke, surgical site infections) can occur. Reporting surgical outcomes makes the healthcare system more accountable to consumers, payers, and employers, and assists providers with improving their quality of care.
Who is the intended audience for this report? This report may help patients and their families make more informed decisions about their health care. Healthcare purchasers may use this information to allocate their dollars more effectively. Finally, these data provide benchmarks against which hospitals and surgeons may measure their own performance, review patient care practices, and improve their outcomes related to CABG surgery. OSHPD provided all hospitals listed in this report an opportunity to review their results prior to publication. Two hospitals submitted comment letters, which are included in Appendix G. These
7 National Quality Forum (NQF). National voluntary consensus standards for cardiac surgery, Washington, DC: National Quality Forum, January 2005. NQF recently updated the endorsed measure as part of the QPS tracking system (see www.qualityforum.org).
6

THE CALIFORNIA REPORT ON CORONARY ARTERY BYPASS GRAFT SURGERY, 2011 HOSPITAL DATA
statements may help readers understand the concerns of some hospitals regarding the information released about them.
Who is included in this report (study population)? Under state law, California-licensed hospitals are required to report all isolated and non-isolated CABG surgeries to OSHPD. Isolated CABG surgery is defined as CABG surgery performed without other major procedures, such as valve repair or carotid endarterectomy, during the same surgery. CCORP’s detailed definition of isolated CABG surgery can be found on page 39 of the training manual: http://www.oshpd.ca.gov/HID/CORC/ . In 2011, there were 16,284 adult CABG surgeries performed in California. Of these, 12,399 (76%) were isolated CABG surgeries and 3,885 (24%) were non-isolated CABG surgeries. Isolated CABG surgery cases are used as the study population because uniformity of the surgical process allows adequate pre-operative risk adjustment for patient conditions. Non-isolated CABG cases are not used to determine hospital performance ratings in this report. The study population for this report consists of all adult patients who underwent isolated CABG surgery and were discharged in 2011. However, for post-operative stroke by hospital, the study population included those patients who were discharged in 2010 and 2011 to ensure the risk-adjusted stroke rates were based on a large sample size.
What data are used in this report? The primary data source for this report is the 2011 clinical data registry collected by CCORP from 122 reporting hospitals. These data are linked to death records from the California Department of Public Health to identify patients who died at home or at facilities other than the operating hospital within 30 days following CABG surgery. These data are also linked to OSHPD’s Patient Discharge Data (PDD) to identify patients who were discharged alive, and were readmitted to a hospital within 30 days of CABG surgery. The CCORP clinical data registry primarily relies on a subset of data elements that are also collected by the Society of Thoracic Surgeons (STS) for their Adult Cardiac Surgery Database. However, a few data elements are exclusive to CCORP. Although STS and CCORP data definitions are generally identical, CCORP provides additional clarifications to assist hospitals with coding. All data elements collected by CCORP in 2011 and their definitions can be found at http://www.oshpd.ca.gov/HID/CORC/. For more details regarding the data collection, quality review, and verification methods, see Appendix A.
7
THE CALIFORNIA REPORT ON CORONARY ARTERY BYPASS GRAFT SURGERY, 2011 HOSPITAL DATA
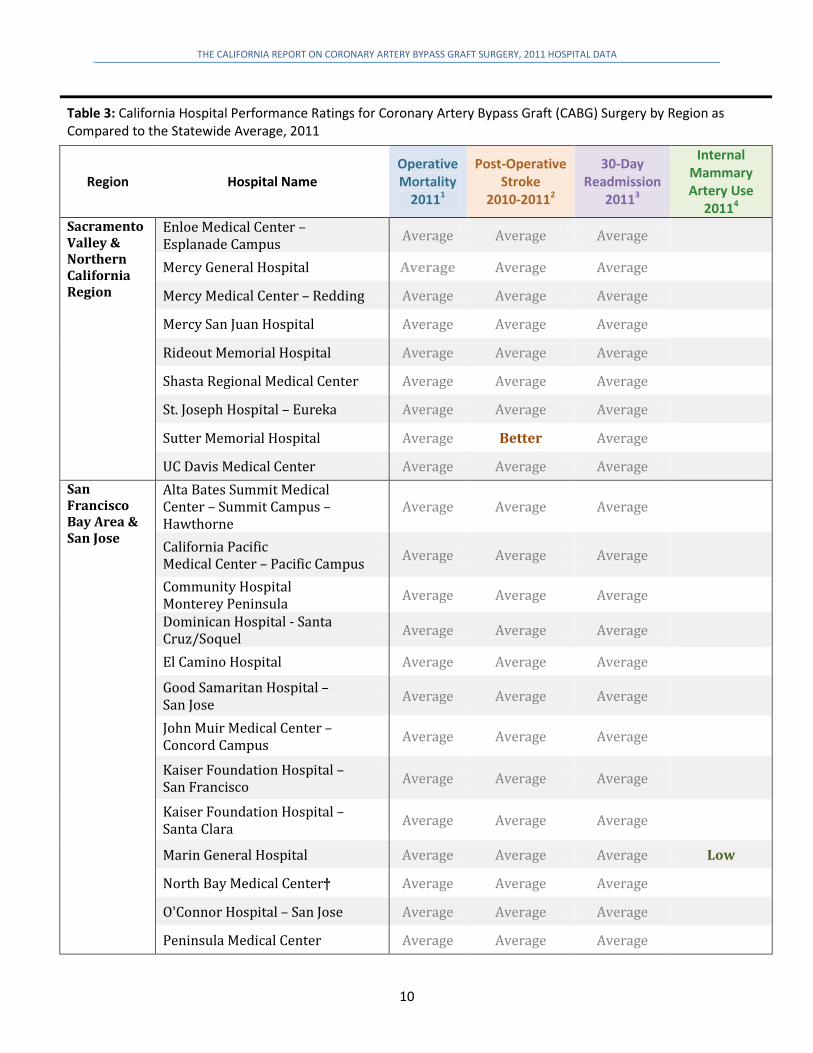
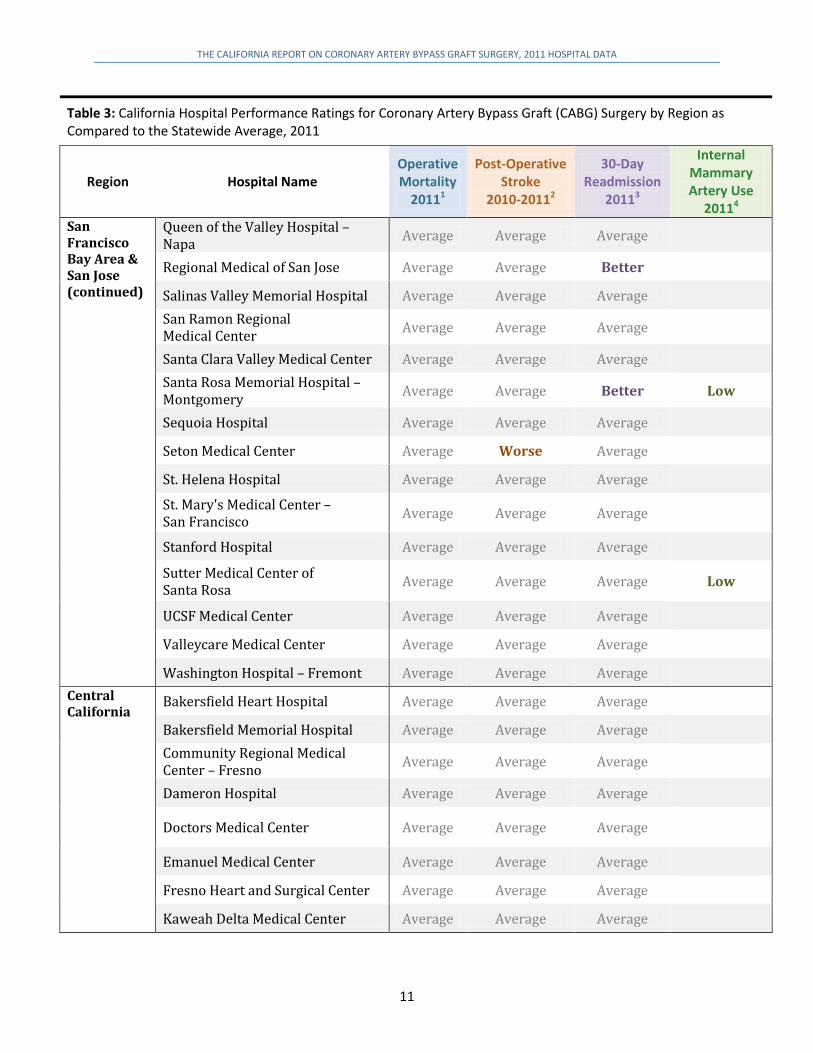
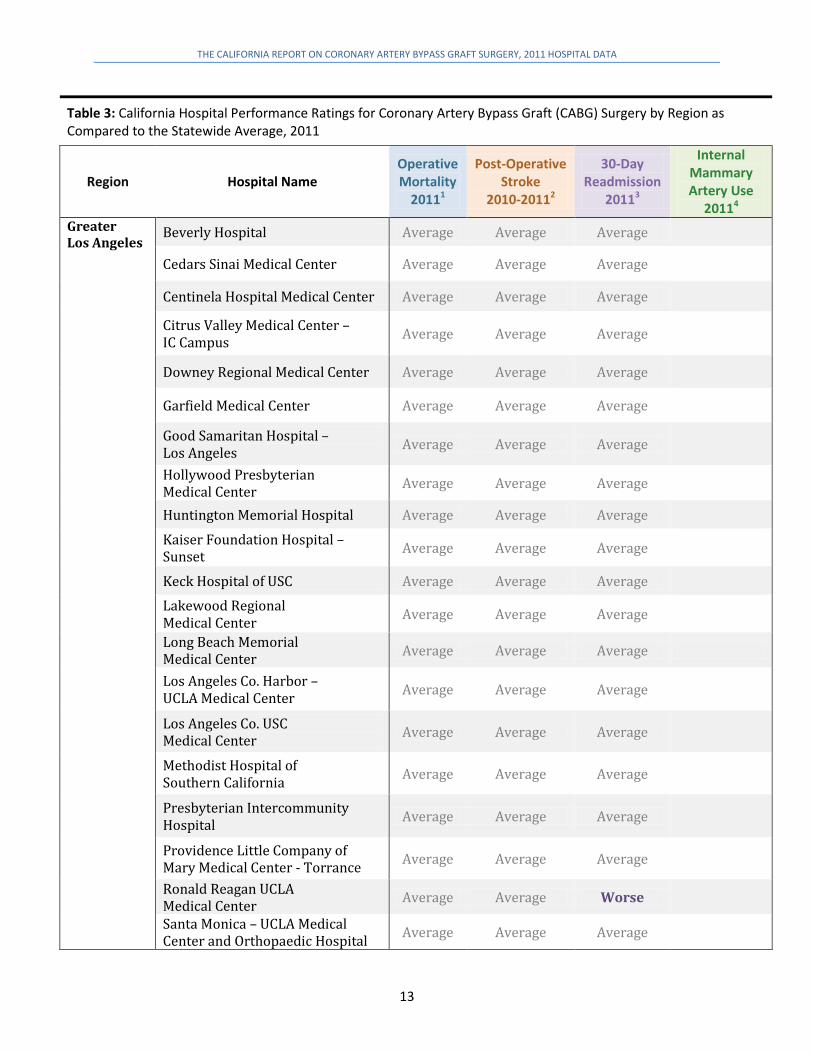
Risk-Adjusted Isolated CABG Surgery Outcomes: Hospital Performance Ratings Table 3 presents the performance ratings for each hospital’s risk-adjusted outcomes and one process of care measure: • Operative mortality (2011) • Post-operative stroke (2010-2011) • 30-day readmission (2011) • Use of the internal mammary artery (2011)
The table is sorted by geographic region. Detailed statistical results for the four measures are located in Appendices B, C, D, and E.
2011 Hospital Risk-Adjusted Operative Mortality Results The risk-adjusted operative mortality results represent the best estimate of what a hospital’s mortality rate would have been if the hospital had a patient case mix identical to the statewide average. OSHPD defines operative mortality as a patient death occurring in the hospital after CABG surgery regardless of length of stay, or death occurring anywhere after hospital discharge but within 30 days after the CABG surgery. Hospital ratings are risk-adjusted, which allows for fair comparison of hospital outcomes even though some hospitals have sicker patients than average. Of the 122 reporting hospitals, 121 hospitals (99%) performed within the expected range (“Average”) when compared to the state’s overall mortality rate of 2.01%. No hospital performed significantly “Better” than the state average, and one hospital performed significantly “Worse” than the state average. Hospitals marked with † in Table 3 submitted statements regarding this report (Appendix G).
2010-2011 Hospital Risk-Adjusted Post-Operative Stroke Results Table 3 also presents the risk-adjusted post-operative stroke results for each hospital for 2010-2011. OSHPD defines this measure as a post-operative central neurologic deficit persisting for more than 24 hours after CABG surgery (while in the operating hospital). Of the 123 reporting hospitals, 118 hospitals (96%) performed within the expected range (“Average”) compared to the state’s average stroke rate of 1.32%. One hospital performed significantly “Better” than the state average and four hospitals performed significantly “Worse” than the state average. Hospitals marked with † in Table 3 submitted statements regarding this report (Appendix G).
2011 Hospital Risk-Adjusted 30-Day Readmission Results Table 3 presents the risk-adjusted 30-day readmission results for each hospital for 2011. Readmission is defined as a CABG surgery patient being readmitted to an acute care hospital within 30 days of being discharged to home or a non-acute care setting with a principal diagnosis indicating a heart-related condition, or an infection or a complication that was likely related to the CABG surgery.
8
THE CALIFORNIA REPORT ON CORONARY ARTERY BYPASS GRAFT SURGERY, 2011 HOSPITAL DATA
Of the 122 reporting hospitals, 116 hospitals (95%) performed within the expected range compared to the state’s overall readmission rate (denoted as “Average”). Two hospitals performed significantly “Better” than the state average, and four hospitals performed significantly “Worse” than the state average. Hospitals marked with † in Table 3 submitted statements regarding this report (Appendix G).
2011 Internal Mammary Artery Usage by Hospital: A Process Measure of Quality In addition to publishing hospital outcomes (risk-adjusted operative mortality rates, risk-adjusted post-operative stroke rates, and risk-adjusted readmission rates), this report also provides a process of care8 measure: use of the internal mammary artery (IMA) in surgery. Both outcome and process of care measures are valuable to assessing quality of care. Outcome measurement permits a more comprehensive comparison of hospital performance over the long term and can be used for investigating internal processes and structures. Measuring the process of care provides a more immediate path to improving a particular aspect of patient care. If particular processes with clear links to health outcomes are monitored, some healthcare quality problems can be detected long before demonstrable health outcome differences occur. In most cases of first-time isolated CABG surgery where the operative status is elective or urgent, the surgeon has the option of using the IMA (also known as the internal thoracic artery). The IMA, and especially the left IMA, is considered the preferred conduit for CABG surgery of the left anterior descending (LAD) coronary artery. Clinical research shows that IMA grafts used in CABG surgery stay open longer and increase patient survival. Research also suggests that a reduction in immediate operative mortality is associated with use of the IMA rather than saphenous (leg) vein revascularization.9 Very low hospital utilization rates of IMA may be associated with poorer care. Table 3 presents hospital results for usage of the IMA by hospitals in 2011. Only first-time isolated CABG surgeries where the operative status is elective or urgent and the LAD was bypassed are included in calculating IMA usage rates. The statewide IMA usage rate remained nearly the same between 2010 and 2011 (96.0% and 96.7% respectively). Five hospitals received a “Low” rating for 2011. Hospital IMA usage rates above the statewide average rate were not evaluated because there is no consensus on what constitutes an optimal IMA usage rate. Hospitals marked with † in Table 3 submitted statements regarding this report. Their statements are presented in Appendix G.
8 Donabedian A. Evaluating the Quality of Medical Care. The Milbank Quarterly, 2005; 83(4):691-729. 9 Ferguson TB Jr., Coombs LP, Peterson ED. Internal thoracic artery grafting in the elderly patient undergoing coronary artery bypass grafting: room for process improvement? Journal of Thoracic and Cardiovascular Surgery, 2002; 123(5):869-80.
9
THE CALIFORNIA REPORT ON CORONARY ARTERY BYPASS GRAFT SURGERY, 2011 HOSPITAL DATA
Table 3: California Hospital Performance Ratings for Coronary Artery Bypass Graft (CABG) Surgery by Region as Compared to the Statewide Average, 2011
Region Hospital Name Operative Mortality
20111
Post-Operative Stroke
2010-20112
30-Day Readmission
20113
Internal Mammary Artery Use
20114 Sacramento Valley & Northern California Region
Enloe Medical Center – Esplanade Campus Average Average Average Mercy General Hospital Average Average Average Mercy Medical Center – Redding Average Average Average Mercy San Juan Hospital Average Average Average Rideout Memorial Hospital Average Average Average Shasta Regional Medical Center Average Average Average St. Joseph Hospital – Eureka Average Average Average Sutter Memorial Hospital Average Better Average UC Davis Medical Center Average Average Average
San Francisco Bay Area & San Jose
Alta Bates Summit Medical Center – Summit Campus – Hawthorne
Average Average Average
California Pacific Medical Center – Pacific Campus Average Average Average Community Hospital Monterey Peninsula Average Average Average Dominican Hospital - Santa Cruz/Soquel Average Average Average El Camino Hospital Average Average Average Good Samaritan Hospital – San Jose Average Average Average John Muir Medical Center – Concord Campus Average Average Average
Kaiser Foundation Hospital – San Francisco Average Average Average
Kaiser Foundation Hospital – Santa Clara Average Average Average
Marin General Hospital Average Average Average Low
North Bay Medical Center† Average Average Average O'Connor Hospital – San Jose Average Average Average Peninsula Medical Center Average Average Average
10
THE CALIFORNIA REPORT ON CORONARY ARTERY BYPASS GRAFT SURGERY, 2011 HOSPITAL DATA
Table 3: California Hospital Performance Ratings for Coronary Artery Bypass Graft (CABG) Surgery by Region as Compared to the Statewide Average, 2011
Region Hospital Name Operative Mortality
20111
Post-Operative Stroke
2010-20112
30-Day Readmission
20113
Internal Mammary Artery Use
20114 San Francisco Bay Area & San Jose (continued)
Queen of the Valley Hospital – Napa Average Average Average Regional Medical of San Jose Average Average Better Salinas Valley Memorial Hospital Average Average Average San Ramon Regional Medical Center Average Average Average Santa Clara Valley Medical Center Average Average Average Santa Rosa Memorial Hospital – Montgomery Average Average Better Low
Sequoia Hospital Average Average Average Seton Medical Center Average Worse Average St. Helena Hospital Average Average Average St. Mary's Medical Center – San Francisco Average Average Average
Stanford Hospital Average Average Average Sutter Medical Center of Santa Rosa Average Average Average Low
UCSF Medical Center Average Average Average Valleycare Medical Center Average Average Average Washington Hospital – Fremont Average Average Average
Central California
Bakersfield Heart Hospital Average Average Average Bakersfield Memorial Hospital Average Average Average Community Regional Medical Center – Fresno Average Average Average Dameron Hospital Average Average Average
Doctors Medical Center Average Average Average
Emanuel Medical Center Average Average Average Fresno Heart and Surgical Center Average Average Average Kaweah Delta Medical Center Average Average Average
11

THE CALIFORNIA REPORT ON CORONARY ARTERY BYPASS GRAFT SURGERY, 2011 HOSPITAL DATA
Table 3: California Hospital Performance Ratings for Coronary Artery Bypass Graft (CABG) Surgery by Region as Compared to the Statewide Average, 2011
Region Hospital Name Operative Mortality
20111
Post-Operative Stroke
2010-20112
30-Day Readmission
20113
Internal Mammary Artery Use
20114 Central California (continued)
Marian Medical Center Average Average Average Memorial Medical Center of Modesto Average Average Average Low
San Joaquin Community Hospital Average Average Average St. Agnes Medical Center Average Average Average St. Joseph's Medical Center of Stockton Average Average Average
San Fernando Valley, Antelope Valley, Ventura & Santa Barbara
Antelope Valley Hospital Average Average Average Community Memorial Hospital of San Buenaventura Average Average Average
French Hospital Medical Center Average Average Average Glendale Adventist Medical Center - Wilson Terrace Average Average Average
Glendale Memorial Hospital and Health Center Average Average Average
Lancaster Community Hospital No CABG Average No CABG No CABG Los Robles Hospital and Medical Center Average Average Average Northridge Hospital Medical Center Average Average Average Palmdale Regional Medical Center Average Average Average Low
Providence Holy Cross Medical Center Average Average Average
Providence St. Joseph Medical Center Average Average Average
Providence Tarzana Medical Center Average Worse Average
Santa Barbara Cottage Hospital Average Average Average St. John's Regional Medical Center Average Average Average Valley Presbyterian Hospital Average Average Average West Hills Hospital and Medical Center Average Average Worse
12
THE CALIFORNIA REPORT ON CORONARY ARTERY BYPASS GRAFT SURGERY, 2011 HOSPITAL DATA
Table 3: California Hospital Performance Ratings for Coronary Artery Bypass Graft (CABG) Surgery by Region as Compared to the Statewide Average, 2011
Region Hospital Name Operative Mortality
20111
Post-Operative Stroke
2010-20112
30-Day Readmission
20113
Internal Mammary Artery Use
20114 Greater Los Angeles
Beverly Hospital Average Average Average Cedars Sinai Medical Center Average Average Average Centinela Hospital Medical Center Average Average Average Citrus Valley Medical Center – IC Campus Average Average Average
Downey Regional Medical Center Average Average Average
Garfield Medical Center Average Average Average Good Samaritan Hospital – Los Angeles Average Average Average Hollywood Presbyterian Medical Center Average Average Average Huntington Memorial Hospital Average Average Average Kaiser Foundation Hospital – Sunset Average Average Average
Keck Hospital of USC Average Average Average Lakewood Regional Medical Center Average Average Average Long Beach Memorial Medical Center Average Average Average
Los Angeles Co. Harbor – UCLA Medical Center Average Average Average
Los Angeles Co. USC Medical Center Average Average Average
Methodist Hospital of Southern California Average Average Average
Presbyterian Intercommunity Hospital Average Average Average
Providence Little Company of Mary Medical Center - Torrance Average Average Average Ronald Reagan UCLA Medical Center Average Average Worse Santa Monica – UCLA Medical Center and Orthopaedic Hospital Average Average Average
13

THE CALIFORNIA REPORT ON CORONARY ARTERY BYPASS GRAFT SURGERY, 2011 HOSPITAL DATA
Table 3: California Hospital Performance Ratings for Coronary Artery Bypass Graft (CABG) Surgery by Region as Compared to the Statewide Average, 2011
Region Hospital Name Operative Mortality
20111
Post-Operative Stroke
2010-20112
30-Day Readmission
20113
Internal Mammary Artery Use
20114 Greater Los Angeles (continued)
St. Francis Medical Center Average Average Average St. John's Health Center Average Average Average St. Mary Medical Center Average Average Average St. Vincent Medical Center Average Average Average Torrance Memorial Medical Center Average Average Average White Memorial Medical Center Average Average Worse
Inland Empire, Riverside & San Bernardino
Desert Regional Medical Center Average Average Average Eisenhower Memorial Hospital Average Average Average Loma Linda University Medical Center Average Average Average Pomona Valley Hospital Medical Center Average Average Average Riverside Community Hospital Average Average Average San Antonio Community Hospital Average Average Average St. Bernardine Medical Center Average Average Average St. Mary Regional Medical Center Average Average Average
Orange County
AHMC Anaheim Regional Medical Center Worse Average Average Fountain Valley Regional Hospital and Medical Center - Euclid Average Average Average Hoag Memorial Hospital Presbyterian Average Worse Average
Mission Hospital Regional Medical Center Average Average Average
Orange Coast Memorial Medical Center Average Average Average
Saddleback Memorial Medical Center Average Average Worse
St. Joseph Hospital - Orange Average Average Average St. Jude Medical Center Average Average Average UC Irvine Medical Center Average Average Average
14

THE CALIFORNIA REPORT ON CORONARY ARTERY BYPASS GRAFT SURGERY, 2011 HOSPITAL DATA
Table 3: California Hospital Performance Ratings for Coronary Artery Bypass Graft (CABG) Surgery by Region as Compared to the Statewide Average, 2011
Region Hospital Name Operative Mortality
20111
Post-Operative Stroke
2010-20112
30-Day Readmission
20113
Internal Mammary Artery Use
20114 Orange County (continued)
West Anaheim Medical Center Average Average Average Western Medical Center - Santa Ana Average Average Average Western Medical Center Hospital – Anaheim Average Average Average
Greater San Diego
Alvarado Hospital Medical Center Average Average Average Palomar Medical Center Average Average Average Scripps Green Hospital Average Average Average Scripps Memorial Hospital – La Jolla Average Average Average Scripps Mercy Hospital Average Average Average Sharp Chula Vista Medical Center Average Average Average Grossmont Hospital Average Average Average Sharp Memorial Hospital† Average Worse Average Tri-City Medical Center Average Average Average UCSD Medical Center Average Average Average UCSD Medical Center – La Jolla, John M. & Sally B. Thornton Hospital
Average Average Average Note: “No CABG” indicates there was no coronary artery bypass operation performed in the hospital for the specified year. Note: †=See Appendix G for statements submitted by hospitals regarding this report. 1 Operative Mortality is defined as patient death occurring in the hospital after CABG surgery, regardless of length of stay, or death occurring anywhere after hospital discharge but within 30 days after the CABG surgery. Hospital ratings are risk-adjusted using a statistical technique that allows for fair comparison of hospital outcomes even though some hospitals have sicker patients than average. 2 Post-Operative Stroke is defined as a post-operative, central neurologic deficit persisting for more than 24 hours after CABG surgery while in the operating hospital. Hospital ratings are risk-adjusted using a statistical technique that allows for fair comparison of hospital outcomes even though some hospitals have sicker patients than average. 3 Readmission is defined as a CABG surgery patient being re-admitted to an acute care hospital within 30 days of being discharged to home or a non-acute care setting with a principal diagnosis indicating a heart-related condition, or an infection or a complication that was likely related to the CABG surgery. Hospital ratings are risk-adjusted using a statistical technique that allows for fair comparison of hospital outcomes even though some hospitals have sicker patients than average. 4 Internal Mammary Artery (IMA) usage in CABG surgery is an evidence-based indicator of surgery quality. Clinical research shows that IMA grafts used in CABG surgery stay open longer and increase patients’ survival. Very low hospital utilization rates may be associated with poorer care. Hospitals are not assessed for very high IMA-usage rates because there is no consensus on what constitutes an optimal rate. Most first-time CABG surgery patients are eligible to receive an IMA bypass.
15
THE CALIFORNIA REPORT ON CORONARY ARTERY BYPASS GRAFT SURGERY, 2011 HOSPITAL DATA
Cardiac Revascularization Procedures: Statewide Volume and Observed In-Hospital Mortality of CABG Surgeries and PCI Procedures There are two types of cardiac revascularization procedures: CABG surgery and percutaneous coronary interventions (PCI), also known as angioplasty, balloon catheterization, or intra-coronary stenting. These procedures, which have been refined during the past 30 years, have contributed to improved survival for heart attack patients. Since its introduction, the intra-coronary stent insertion procedure (using small wire cylinders to hold a narrow or clogged artery open) has largely replaced angioplasty without stents because of its lower rate of restenosis (re-narrowing of the arteries). New technologies and improved adjunctive medical therapy (e.g., medication) are making PCI a viable alternative to CABG for many patients. The advantages associated with PCI have been widely noted: PCI involves a shorter hospital stay, is suitable for most patients, can be repeated, and is performed by a cardiologist without anesthesia. However, CABG surgery is associated with lower rates of repeat revascularization, less overall angina (chest pain), and lower long-term mortality. A more comprehensive approach to examining and reporting on the quality of revascularization procedures in California would include measuring PCI outcomes.
Cardiac Revascularization Volume Figure 1 shows changes in the use of the two revascularization procedures, CABG and PCI, over time using data from OSHPD’s Patient Discharge Data. Despite a sharp increase between 1997 and 2005, PCI volume decreased 3.2% between 1997 and 2012 in California. During the same timeframe, the number of isolated CABG surgeries decreased 58%.10 Non-isolated CABG surgery volume remained relatively constant, with a slight decline each year since 2001. Meanwhile, the valve-only procedures increased by 68% from 4,473 in 1997 to 7,519 in 2012.
Cardiac Revascularization Mortality Figure 2 presents the trends in observed in-hospital mortality rates for isolated CABG surgeries, non-isolated CABG surgeries, valve-only procedures, and PCIs in California between 1997 and 2012. During the 16 years between 1997 and 2012, the in-hospital mortality rate for isolated CABG surgeries declined from 3.08%, when the voluntary California CABG Mortality Reporting Program (CCMRP) was launched in 1997 to 1.63% in 2012, the tenth year of the mandatory reporting program. Meanwhile, the observed in-hospital mortality rates for non-isolated CABG surgeries and valve-only procedures also declined from 9.66% to 6.06% and from 5.28% to 3.11%, respectively. However, the observed in-hospital mortality rate for PCIs increased from 1.70% in 1997 to 2.41% in 2012. The increase in the PCI mortality rate may be due, in part, to changes in selection criteria for certain high-risk patients getting PCIs.
10 This report uses two data sources to report isolated CABG volume. The numbers used in this section to compare isolated CABG and PCI volume were obtained from the OSHPD Patient Discharge Data (PDD). Note that the number of isolated CABGs reported in this section differs somewhat from the volume reported earlier in this report, which are based on the CCORP registry data. Because OSHPD does not maintain a PCI data registry, only the PDD provides a consistent source of numbers to compare both procedures.
16
THE CALIFORNIA REPORT ON CORONARY ARTERY BYPASS GRAFT SURGERY, 2011 HOSPITAL DATA
Figure 1: Volume of Isolated CABG, Non-Isolated CABG, Valve-Only, and PCI Procedures in California, 1997-2012
17
THE CALIFORNIA REPORT ON CORONARY ARTERY BYPASS GRAFT SURGERY, 2011 HOSPITAL DATA
Figure 2: In-Hospital Mortality Rates for Isolated CABG, Non-Isolated CABG, Valve-Only, and PCI Procedures in California, 1997-2012
Data source: California Patient Discharge Data (OSHPD)
18
THE CALIFORNIA REPORT ON CORONARY ARTERY BYPASS GRAFT SURGERY, 2011 HOSPITAL DATA
Appendices: Technical Notes on Statistical Methods
and Hospital Statements
19
THE CALIFORNIA REPORT ON CORONARY ARTERY BYPASS GRAFT SURGERY, 2011 HOSPITAL DATA
Appendix A: Data Quality Review and Verification CCORP reviews the data submitted by each hospital for completeness and errors. Using a three-step data quality review and verification process, CCORP asks hospitals to check data quality, data discrepancies and potential risk-factor coding problems.
Step 1: Data Collection and Acceptance
Hospitals report their data using CCORP’s online clinical data collection system, Cardiac Online Reporting for California (CORC). Data acceptance reports are generated electronically which notify hospitals of invalid, missing and abnormally high or low data values. Data quality reports are also generated each time a hospital submits data. Hospitals review these summary reports before they adjust, finalize and certify their data submission. Step 2: Data Discrepancy Reports
Data discrepancy reports compare the CCORP clinical data to OSHPD’s hospital administrative data source, the Patient Discharge Data (PDD). Hospitals are asked to review and account for discrepancies between the two data sources via patient medical chart review to verify that 1) all CABG surgeries discharged in 2011 were reported; 2) each CABG was accurately coded as isolated or non-isolated CABG surgery; 3) coding of Discharge Status was consistent; 4) Resuscitation occurred prior to CABG surgery; and 5) coding of Post-Operative Complications (including strokes) was consistent. Step 3: Risk-Factor Coding Reports
Risk-factor coding reports identify values that may be extreme by comparing the hospital reported prevalence rates in the current year compared to prior years and to administrative data from the PDD. CCORP requests hospitals to review and, when necessary, correct miscoded data elements.
Hospital Medical Chart Audit After completing the three-step data quality review and verification process, CCORP develops a preliminary risk model for in-hospital mortality and post-operative stroke to help identify candidate hospitals for an on-site medical chart audit. Candidate selection for the 2011 audit was based on results of the preliminary model which identified “Better” or “Worse” hospital performers and on data quality reports which identified problems in over- and under-reporting of patient risk prevalence. Additionally, a small number of hospitals were randomly selected for audit. The 2011 audit included 18 hospitals and a total of 1,291 patient records (15% of all hospitals and approximately 9% of all CABG surgery cases in 2011). On-site medical chart reviews were conducted by trained, independent auditors under contract with OSHPD. All isolated CABG deaths and post-operative strokes at selected hospitals were audited and high-risk patients were sampled at a higher rate. The number of patient records selected within a hospital was proportional to the isolated CABG volume of the hospital, but generally fell within a range of 40 to 160 cases. If a selected hospital performed fewer than 40 isolated CABG surgeries per year, all surgeries were audited. Individual audit summary reports were sent to audited hospitals for review and comment.
20
THE CALIFORNIA REPORT ON CORONARY ARTERY BYPASS GRAFT SURGERY, 2011 HOSPITAL DATA
Key findings from the 2011 hospital medical chart audit include:
• Discharge Status was coded correctly for all isolated and non-isolated CABG records audited.
• Auditors found eight CABG cases reported by hospitals to CCORP as non-isolated CABG cases were not CABG procedures.
• Auditors found ten CABG cases reported to CCORP as isolated were non-isolated cases.
• Kappa statistics11 show that most surgical data elements were well coded. The most poorly coded elements were Mitral Insufficiency, Chronic Lung Disease, Immunocompromise, NYHA Class IV, Peripheral Arterial Disease and Warfarin (use within 5 days of surgery).
• Kappa statistics for all post-operative complications ranged from moderate to excellent (0.50-
0.90). Post-Operative Stroke, which is publically reported, showed excellent agreement (0.80).
11 The Kappa statistic measures the degree to which CCORP data abstractors and auditors concurred in coding each data element. It measures agreement beyond that expected by chance, can range from 0 (no agreement) to 1.0 (perfect agreement), and is used to identify potential coding problems.
21
THE CALIFORNIA REPORT ON CORONARY ARTERY BYPASS GRAFT SURGERY, 2011 HOSPITAL DATA
Appendix B: Technical Notes on Hospital Operative Mortality Rate Calculations (2011)
Risk Model for Adjusting Hospital Operative Mortality Rates, 2011
Whether patients recover quickly, have complications, or die following CABG surgery is, in part, a result of the medical care they receive. However, it is difficult to compare outcomes and assess surgical performance because patients treated at different hospitals or by different surgeons vary in the severity of their pre-operative clinical conditions. This section explains the development and validation of CCORP’s risk model that accounts for the variation in patient severity of illness for hospital operative mortality. To make fair comparisons of care delivered by different hospitals, CCORP “levels the playing field” by considering the pre-operative condition of each patient. Hospitals handling more complex cases receive a larger risk-adjustment weight in the risk model, and hospitals that handle less complex cases receive a smaller weight. Thus, hospitals treating sicker patients are not at a disadvantage when their performance is compared with other hospitals. CCORP used a multivariable logistic regression model to estimate the relationship between each of the demographic and pre-operative risk factors and the probability of operative mortality. Multivariable logistic regression models relate the probability of death to the risk factor (e.g., patient age) while controlling for all other risk factors in the model. To develop the risk model, the 12,399 isolated (non-salvage) CABG surgery cases in 2011 were evaluated for missing data; 11,382 cases had no missing data in any field and were used for the risk model parameter estimation. The 1,017 (8.2%) isolated CABG cases with missing data fields were removed to ensure that the effects of risk factors were estimated based on the most complete data available. To generate the hospital specific results shown in this report, missing values for these 1,017 records were imputed (after risk model parameter estimation) by replacing most with the lowest risk category of the same variable (e.g., Chronic Lung Disease = none). CCORP assigned the lowest risk value for the following reasons: 1) some hospitals leave data fields blank by design when the risk factor is absent or the value is normal; 2) this maintains consistency with other major cardiac reporting programs that replace missing data with the lowest-risk or normal value; and 3) this imputing method creates an incentive for more complete reporting by hospitals. After imputing the missing values, the parameters of the risk model were applied to all cases to estimate each patient’s probability of death. CCORP summed these probabilities to estimate the expected mortality for each hospital. The risk model, based on the 2011 data, is presented in Table B-1 with statistically significant risk factors identified in bolded text.
22

THE CALIFORNIA REPORT ON CORONARY ARTERY BYPASS GRAFT SURGERY, 2011 HOSPITAL DATA
Table B-1: Logistic Regression Risk Model for Operative Mortality, 2011
Risk Factor Coefficient Standard Error p-value Odds Ratio
Intercept -7.997 0.704 <.0001 Age (Years) 0.039 0.007 <.0001 1.039
Gender Male Reference Female 0.418 0.151 0.006 1.519
Race White Reference Non-White -0.237 0.152 0.119 0.789
Body Mass Index
18.5-39.9 Reference < 18.5 0.670 0.490 0.171 1.954 ≥ 40 0.801 0.273 0.003 2.228
Status of the Procedure
Elective Reference Urgent -0.015 0.190 0.936 0.985 Emergent 0.301 0.361 0.405 1.351
Last Creatinine Level
1.134 0.200 <.0001 3.107 Hypertension 0.026 0.243 0.916 1.026 Peripheral Arterial Disease 0.629 0.164 0.001 1.876 Cerebrovascular Disease 0.397 0.237 0.093 1.487 Cerebrovascular Accident (CVA) Timing
No CVA Reference > 2 or ≤ 2 weeks 0.284 0.277 0.306 1.328
Chronic Lung Disease
None/Mild Reference Moderate 0.096 0.283 0.734 1.101 Severe 0.372 0.251 0.139 1.450
Arrhythmia Type Afib/Flutter 0.348 0.198 0.078 1.416 Sust VT/VF 0.458 0.275 0.096 1.581
Timing of Myocardial Infarction (MI)
No MI Reference 21 or more days 0.002 0.228 0.993 1.002 8-20 days ago 0.265 0.302 0.380 1.304 1-7 days ago 0.583 0.194 0.003 1.792 Within 24 Hours 1.196 0.311 0.001 3.308
Cardiogenic Shock 0.971 0.352 0.006 2.640 Heart Failure 0.025 0.170 0.884 1.025 Prior Cardiac Surgery
None Reference One or more 0.852 0.271 0.002 2.345
Interval from Prior PCI to Surgery
No prior PCIs Reference Prior PCI > 6 HRS 0.352 0.159 0.026 1.422 Prior PCI <= 6 HRS 0.899 0.428 0.036 2.457
Ejection Fraction (%) -0.023 0.005 <.0001 0.978 Left Main Disease (% Stenosis) 0.233 0.146 0.110 1.262 Number of Diseased Vessels
None, One, or Two Reference Three or more -0.024 0.173 0.892 0.977
Mitral Insufficiency None/Trivial/Mild Reference Moderate/Severe 0.308 0.208 0.139 1.360
Bolded text indicates statistically significant. Note: Last Creatinine level Pre-Op, Ejection Fraction, and Left Main Stenosis were modeled using piecewise linear transformations.
23
THE CALIFORNIA REPORT ON CORONARY ARTERY BYPASS GRAFT SURGERY, 2011 HOSPITAL DATA
Discrimination of the Risk Model for Operative Mortality Risk models that distinguish well between patients who die and those who survive are said to have good discrimination. A commonly used measure of discrimination is the C-statistic, also known as the area under the Receiver Operating Characteristic (ROC) curve. For all possible pairs of patients, where one dies and the other survives surgery, the C-statistic describes the proportion of pairs where the patient who died had a higher predicted risk of death than the patient who lived. C-statistics range from 0.5 to 1, with higher values indicating better discrimination. For the 2011 operative mortality risk model, the C-statistic was 0.806. In recently published CABG surgery mortality reports by other states (New Jersey, New York, and Pennsylvania), the C-statistic ranged from 0.791 to 0.836, which is similar to the 2011 CCORP model.12
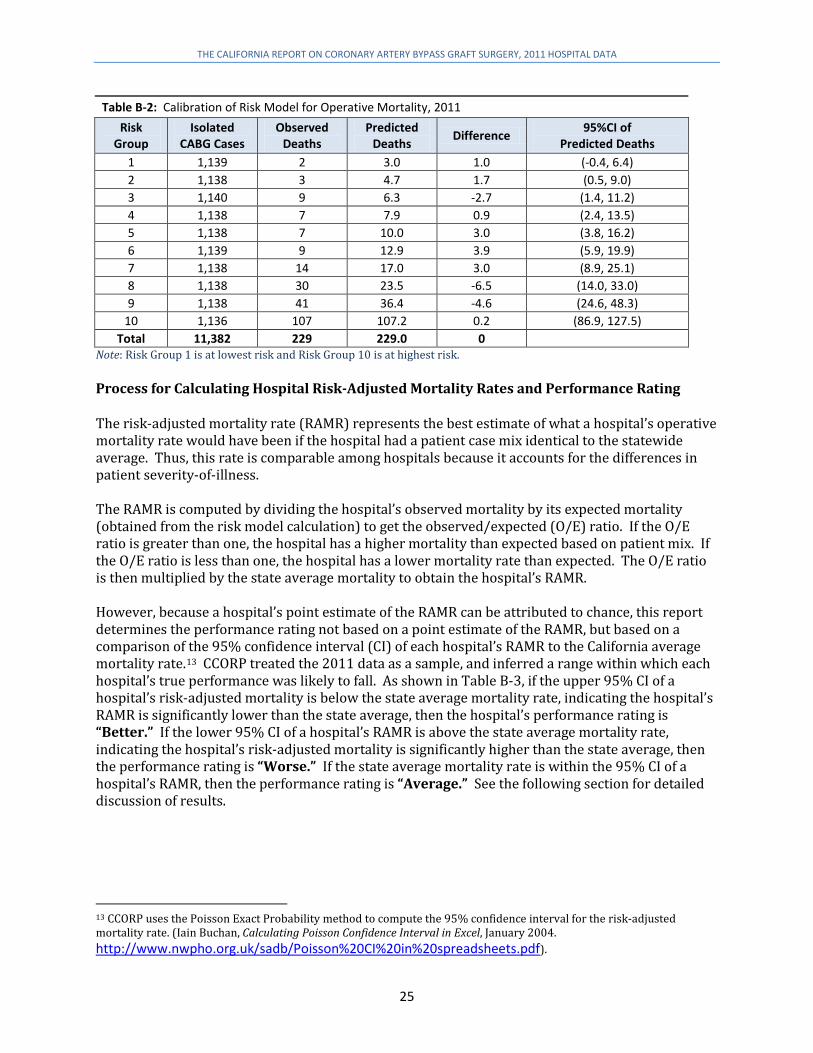
Calibration of the Risk Model for Operative Mortality Calibration refers to the ability of a risk model to match predicted mortality with observed mortality. A model in which the number of observed deaths matches closely with the number of deaths predicted by the model demonstrates good calibration. Good calibration is essential for accurate risk adjustment. A common measure of calibration is the Hosmer-Lemeshow χ2 test, which compares observed and predicted outcomes over deciles of risk. The p-value of the Hosmer-Lemeshow test statistic for this 2011 risk model is 0.500, indicating adequate calibration. That is, the predicted mortality was consistent with actual mortality in the data. Another way to test model calibration is to partition the data and compare observed deaths with predicted deaths in each of 10 risk groups. The 10 risk groups are created by sorting all observations by the predicted risk of death and then dividing the sorted observations into deciles of approximately equal size. As presented in Table B-2, Risk Group 10 shows the patients in the highest risk group. Among the 1,136 patients in Group 10, 107 patients died, and the model predicted 107.2 patient deaths. Assuming a Poisson distribution for a binary outcome, the predicted range of deaths for Risk Group 10 is 86.9 to 127.5. The observed number of 107 deaths falls within the range of predicted deaths. In fact, none of the 10 risk groups had significantly fewer or significantly more deaths than were predicted by the model. Overall, the risk model shows no systematic underestimation or overestimation of mortality at the extremes.
12 http://www.state.nj.us/health/healthcarequality/cardiacsurgery.shtml http://www.health.state.ny.us/statistics/diseases/cardiovascular/ http://www.phc4.org/reports/cabg
24
THE CALIFORNIA REPORT ON CORONARY ARTERY BYPASS GRAFT SURGERY, 2011 HOSPITAL DATA
Table B-2: Calibration of Risk Model for Operative Mortality, 2011 Risk
Group Isolated
CABG Cases Observed
Deaths Predicted
Deaths Difference 95%CI of Predicted Deaths
1 1,139 2 3.0 1.0 (-0.4, 6.4) 2 1,138 3 4.7 1.7 (0.5, 9.0) 3 1,140 9 6.3 -2.7 (1.4, 11.2) 4 1,138 7 7.9 0.9 (2.4, 13.5) 5 1,138 7 10.0 3.0 (3.8, 16.2) 6 1,139 9 12.9 3.9 (5.9, 19.9) 7 1,138 14 17.0 3.0 (8.9, 25.1) 8 1,138 30 23.5 -6.5 (14.0, 33.0) 9 1,138 41 36.4 -4.6 (24.6, 48.3)
10 1,136 107 107.2 0.2 (86.9, 127.5) Total 11,382 229 229.0 0
Note: Risk Group 1 is at lowest risk and Risk Group 10 is at highest risk. Process for Calculating Hospital Risk-Adjusted Mortality Rates and Performance Rating The risk-adjusted mortality rate (RAMR) represents the best estimate of what a hospital’s operative mortality rate would have been if the hospital had a patient case mix identical to the statewide average. Thus, this rate is comparable among hospitals because it accounts for the differences in patient severity-of-illness. The RAMR is computed by dividing the hospital’s observed mortality by its expected mortality (obtained from the risk model calculation) to get the observed/expected (O/E) ratio. If the O/E ratio is greater than one, the hospital has a higher mortality than expected based on patient mix. If the O/E ratio is less than one, the hospital has a lower mortality rate than expected. The O/E ratio is then multiplied by the state average mortality to obtain the hospital’s RAMR. However, because a hospital’s point estimate of the RAMR can be attributed to chance, this report determines the performance rating not based on a point estimate of the RAMR, but based on a comparison of the 95% confidence interval (CI) of each hospital’s RAMR to the California average mortality rate.13 CCORP treated the 2011 data as a sample, and inferred a range within which each hospital’s true performance was likely to fall. As shown in Table B-3, if the upper 95% CI of a hospital’s risk-adjusted mortality is below the state average mortality rate, indicating the hospital’s RAMR is significantly lower than the state average, then the hospital’s performance rating is “Better.” If the lower 95% CI of a hospital’s RAMR is above the state average mortality rate, indicating the hospital’s risk-adjusted mortality is significantly higher than the state average, then the performance rating is “Worse.” If the state average mortality rate is within the 95% CI of a hospital’s RAMR, then the performance rating is “Average.” See the following section for detailed discussion of results.
13 CCORP uses the Poisson Exact Probability method to compute the 95% confidence interval for the risk-adjusted mortality rate. (Iain Buchan, Calculating Poisson Confidence Interval in Excel, January 2004. http://www.nwpho.org.uk/sadb/Poisson%20CI%20in%20spreadsheets.pdf).
25
THE CALIFORNIA REPORT ON CORONARY ARTERY BYPASS GRAFT SURGERY, 2011 HOSPITAL DATA
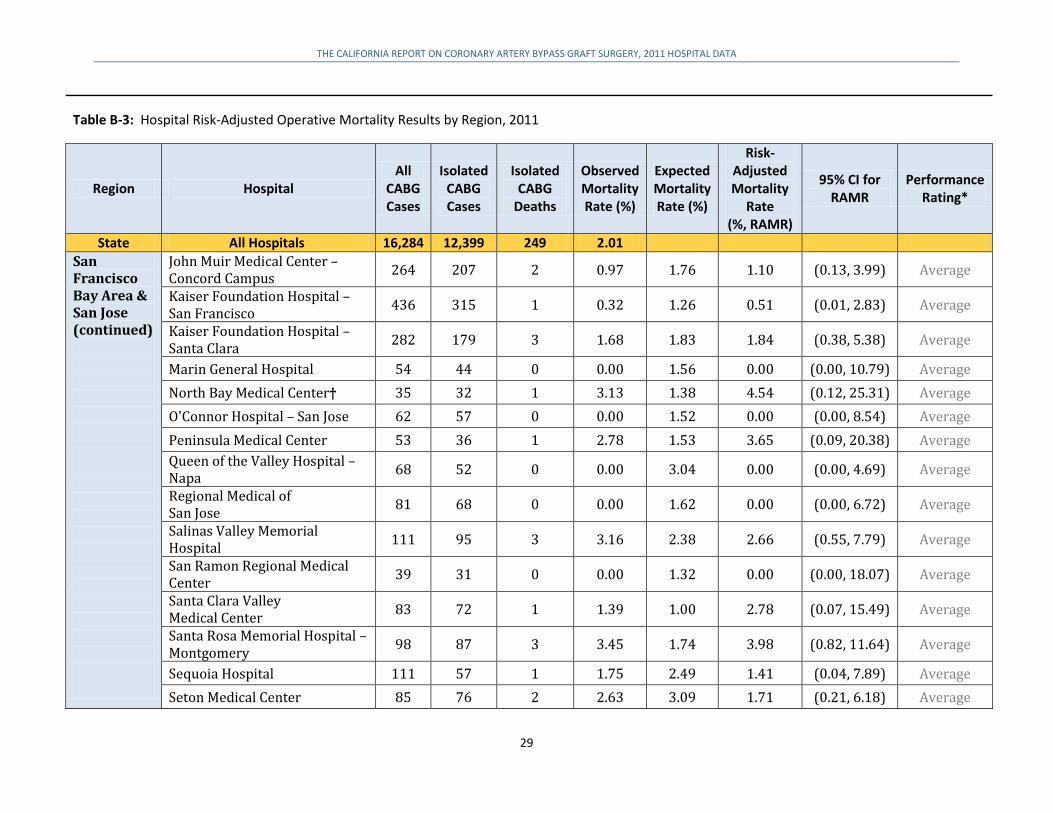
Statistical Details of Hospital Risk-Adjusted Operative Mortality Rate Results (2011) Table B-3 presents the risk-adjusted mortality rate (RAMR) results for each hospital for 2011. The table is sorted by geographic region and contains, for each hospital, total number of CABG surgeries performed (isolated and non-isolated combined), number of isolated CABG surgeries (excluding salvage cases), number of observed isolated CABG deaths, observed mortality rate, expected mortality rate predicted by the risk model, RAMR and 95% confidence intervals (CI) of the RAMR, and the associated hospital performance rating. Among the 12,399 isolated and non-salvage CABG surgeries performed at 122 hospitals in 2011, 249 patients died either in-hospital or within 30 days of the surgery date, reflecting an overall operative mortality rate of 2.01%. The observed mortality rates among hospitals ranged from 0% to 8.06%. The expected mortality rates, which are generated by the risk model and account for patient severity-of-illness, ranged between 0.63% and 7.26%. The RAMR, which measures hospital performance, ranged from 0% to 8.18%. Based on the 95% CI for risk-adjusted mortality rates, 121 of 122 hospitals (99%) performed within the expected range when compared to the state’s overall mortality rate (denoted by “Average” in the performance rating column of Table B-3), and one hospital performed significantly “Worse” than the state average. Hospitals marked with † in Table B-3 submitted statements regarding this report (Appendix G).
Definitions of Table B-3 Terms All CABG Cases: The total number of isolated and non-isolated CABG cases submitted to CCORP for 2011. Non-isolated CABG cases are not used in calculating performance ratings. Isolated CABG Cases: The number of isolated CABG cases submitted to CCORP in 2011. All patients in salvage operative status are excluded from the isolated CABG cases, thus only isolated CABG cases without salvage operative status are used in calculating performance ratings. Isolated CABG Deaths: The number of deaths includes 1) all deaths that occur during the hospitalization in which the isolated CABG surgery was performed, including those occurring after 30 days; and 2) all deaths occurring within 30 days after the CABG surgery. Observed Mortality Rate: The ratio of the number of isolated CABG deaths and the isolated CABG cases multiplied by 100: Observed Mortality Rate = Isolated CABG Deaths/Isolated CABG Cases × 100. Expected Mortality Rate: The ratio of the expected number of operative deaths predicted for a hospital (after risk adjusting for their patient population) and the isolated CABG cases multiplied by 100: Expected Mortality Rate = Expected Deaths/Isolated CABG Cases × 100. Risk-Adjusted Mortality Rate (95% CI): The Risk-Adjusted Mortality Rate (RAMR) is obtained by multiplying the statewide average mortality rate by a hospital's O/E ratio. The 95% CI represents the confidence in the estimate for the RAMR. The lower and upper confidence limits are calculated using Poisson exact confidence interval calculations.
26

THE CALIFORNIA REPORT ON CORONARY ARTERY BYPASS GRAFT SURGERY, 2011 HOSPITAL DATA
Performance Rating: The performance rating is based on a comparison of each hospital's risk-adjusted mortality rate to the California observed mortality rate. A hospital is classified as "Better" if the upper 95% confidence limit of its RAMR falls below the California observed mortality rate. A hospital is classified as "Worse" if the lower 95% confidence limit of its RAMR is higher than the California observed mortality rate. A hospital is classified as "Average" if the California mortality rate falls within the confidence interval of the hospital's risk-adjusted mortality rate.
27

THE CALIFORNIA REPORT ON CORONARY ARTERY BYPASS GRAFT SURGERY, 2011 HOSPITAL DATA
Table B-3: Hospital Risk-Adjusted Operative Mortality Results by Region, 2011
Region Hospital All
CABG Cases
Isolated CABG Cases
Isolated CABG
Deaths
Observed Mortality Rate (%)
Expected Mortality Rate (%)
Risk-Adjusted Mortality
Rate (%, RAMR)
95% CI for RAMR
Performance Rating*
State All Hospitals 16,284 12,399 249 2.01 Sacramento Valley & Northern California Region
Enloe Medical Center – Esplanade Campus 175 149 3 2.01 2.45 1.65 (0.34, 4.83) Average
Mercy General Hospital 803 539 5 0.93 1.62 1.15 (0.37, 2.69) Average Mercy Medical Center – Redding 145 102 2 1.96 3.00 1.31 (0.16, 4.75) Average
Mercy San Juan Hospital 185 128 0 0.00 1.56 0.00 (0.00, 3.72) Average Rideout Memorial Hospital 123 90 4 4.44 1.71 5.23 (1.43, 13.41) Average Shasta Regional Medical Center 66 59 1 1.69 1.99 1.71 (0.04, 9.51) Average
St. Joseph Hospital – Eureka 37 33 1 3.03 5.56 1.09 (0.03, 6.10) Average Sutter Memorial Hospital 454 314 6 1.91 2.04 1.88 (0.69, 4.09) Average UC Davis Medical Center 141 97 0 0.00 1.40 0.00 (0.00, 5.45) Average
San Francisco Bay Area & San Jose
Alta Bates Summit Medical Center – Summit Campus –Hawthorne
169 130 2 1.54 2.17 1.42 (0.17, 5.14) Average
California Pacific Medical Center – Pacific Campus 72 38 1 2.63 1.88 2.81 (0.07, 15.68) Average
Community Hospital Monterey Peninsula 82 61 2 3.28 1.88 3.51 (0.43, 12.68) Average
Dominican Hospital – Santa Cruz/Soquel 59 47 1 2.13 1.45 2.95 (0.07, 16.48) Average
El Camino Hospital 115 66 1 1.52 1.61 1.89 (0.05, 10.55) Average Good Samaritan Hospital – San Jose 87 62 1 1.61 2.47 1.31 (0.03, 7.31) Average
28
THE CALIFORNIA REPORT ON CORONARY ARTERY BYPASS GRAFT SURGERY, 2011 HOSPITAL DATA
Table B-3: Hospital Risk-Adjusted Operative Mortality Results by Region, 2011
Region Hospital All
CABG Cases
Isolated CABG Cases
Isolated CABG
Deaths
Observed Mortality Rate (%)
Expected Mortality Rate (%)
Risk-Adjusted Mortality
Rate (%, RAMR)
95% CI for RAMR
Performance Rating*
State All Hospitals 16,284 12,399 249 2.01 San Francisco Bay Area & San Jose (continued)
John Muir Medical Center – Concord Campus 264 207 2 0.97 1.76 1.10 (0.13, 3.99) Average
Kaiser Foundation Hospital – San Francisco 436 315 1 0.32 1.26 0.51 (0.01, 2.83) Average
Kaiser Foundation Hospital – Santa Clara 282 179 3 1.68 1.83 1.84 (0.38, 5.38) Average
Marin General Hospital 54 44 0 0.00 1.56 0.00 (0.00, 10.79) Average North Bay Medical Center† 35 32 1 3.13 1.38 4.54 (0.12, 25.31) Average O'Connor Hospital – San Jose 62 57 0 0.00 1.52 0.00 (0.00, 8.54) Average Peninsula Medical Center 53 36 1 2.78 1.53 3.65 (0.09, 20.38) Average Queen of the Valley Hospital – Napa 68 52 0 0.00 3.04 0.00 (0.00, 4.69) Average
Regional Medical of San Jose 81 68 0 0.00 1.62 0.00 (0.00, 6.72) Average
Salinas Valley Memorial Hospital 111 95 3 3.16 2.38 2.66 (0.55, 7.79) Average
San Ramon Regional Medical Center 39 31 0 0.00 1.32 0.00 (0.00, 18.07) Average
Santa Clara Valley Medical Center 83 72 1 1.39 1.00 2.78 (0.07, 15.49) Average
Santa Rosa Memorial Hospital – Montgomery 98 87 3 3.45 1.74 3.98 (0.82, 11.64) Average
Sequoia Hospital 111 57 1 1.75 2.49 1.41 (0.04, 7.89) Average Seton Medical Center 85 76 2 2.63 3.09 1.71 (0.21, 6.18) Average
29

THE CALIFORNIA REPORT ON CORONARY ARTERY BYPASS GRAFT SURGERY, 2011 HOSPITAL DATA
Table B-3: Hospital Risk-Adjusted Operative Mortality Results by Region, 2011
Region Hospital All
CABG Cases
Isolated CABG Cases
Isolated CABG
Deaths
Observed Mortality Rate (%)
Expected Mortality Rate (%)
Risk-Adjusted Mortality
Rate (%, RAMR)
95% CI for RAMR
Performance Rating*
State All Hospitals 16,284 12,399 249 2.01 San Francisco Bay Area & San Jose (continued)
St. Helena Hospital 54 46 1 2.17 5.21 0.84 (0.02, 4.67) Average St. Mary's Medical Center – San Francisco 43 35 2 5.71 2.34 4.91 (0.60, 17.75) Average
Stanford Hospital 102 62 2 3.23 2.73 2.38 (0.29, 8.60) Average Sutter Medical Center of Santa Rosa 97 65 1 1.54 1.30 2.38 (0.06, 13.29) Average
UCSF Medical Center 82 66 1 1.52 1.84 1.65 (0.04, 9.21) Average Valleycare Medical Center 48 34 1 2.94 2.44 2.42 (0.06, 13.49) Average Washington Hospital – Fremont 95 89 4 4.49 2.50 3.62 (0.99, 9.27) Average
Central California
Bakersfield Heart Hospital 111 94 5 5.32 2.36 4.53 (1.47, 10.59) Average Bakersfield Memorial Hospital 154 125 4 3.20 1.81 3.56 (0.97, 9.11) Average Community Regional Medical Center – Fresno 288 243 8 3.29 2.23 2.96 (1.28, 5.84) Average
Dameron Hospital 64 62 5 8.06 2.75 5.90 (1.92, 13.78) Average Doctors Medical Center 309 242 8 3.31 2.15 3.09 (1.33, 6.09) Average Emanuel Medical Center 19 16 1 6.25 3.08 4.08 (0.10, 22.74) Average Fresno Heart and Surgical Center 210 172 3 1.74 1.65 2.13 (0.44, 6.22) Average
Kaweah Delta Medical Center 231 201 3 1.49 1.83 1.64 (0.34, 4.79) Average Marian Medical Center 68 60 3 5.00 1.55 6.49 (1.34, 19.00) Average Memorial Hospital Medical Center – Modesto 236 186 6 3.23 2.05 3.16 (1.16, 6.88) Average
30

THE CALIFORNIA REPORT ON CORONARY ARTERY BYPASS GRAFT SURGERY, 2011 HOSPITAL DATA
Table B-3: Hospital Risk-Adjusted Operative Mortality Results by Region, 2011
Region Hospital All
CABG Cases
Isolated CABG Cases
Isolated CABG
Deaths
Observed Mortality Rate (%)
Expected Mortality Rate (%)
Risk-Adjusted Mortality
Rate (%, RAMR)
95% CI for RAMR
Performance Rating*
State All Hospitals 16,284 12,399 249 2.01 Central California (continued)
San Joaquin Community Hospital 83 77 1 1.30 2.74 0.95 (0.02, 5.31) Average
St. Agnes Medical Center 331 289 11 3.81 2.51 3.05 (1.52, 5.46) Average
St. Joseph's Medical Center of Stockton 313 249 7 2.81 2.60 2.17 (0.87, 4.47) Average
San Fernando Valley, Antelope Valley, Ventura & Santa Barbara
Antelope Valley Hospital 30 28 2 7.14 1.75 8.18 (0.99, 29.57) Average Community Memorial Hospital of San Buenaventura 56 48 3 6.25 3.52 3.57 (0.74, 10.44) Average
French Hospital Medical Center 107 76 0 0.00 1.91 0.00 (0.00, 5.11) Average
Glendale Adventist Medical Center – Wilson Terrace 134 110 1 0.91 1.72 1.06 (0.03, 5.92) Average
Glendale Memorial Hospital and Health Center 117 105 0 0.00 1.59 0.00 (0.00, 4.43) Average
Los Robles Hospital and Medical Center 78 51 4 7.84 2.34 6.73 (1.84, 17.25) Average
Northridge Hospital Medical Center 87 71 3 4.23 2.16 3.92 (0.81, 11.47) Average
Palmdale Regional Medical Center 9 8 0 0.00 1.48 0.00 (0.00, 62.65) Average
Providence Holy Cross Medical Center 67 52 1 1.92 1.89 2.04 (0.05, 11.40) Average
Providence St. Joseph Medical Center 70 47 0 0.00 1.47 0.00 (0.00, 10.76) Average
31
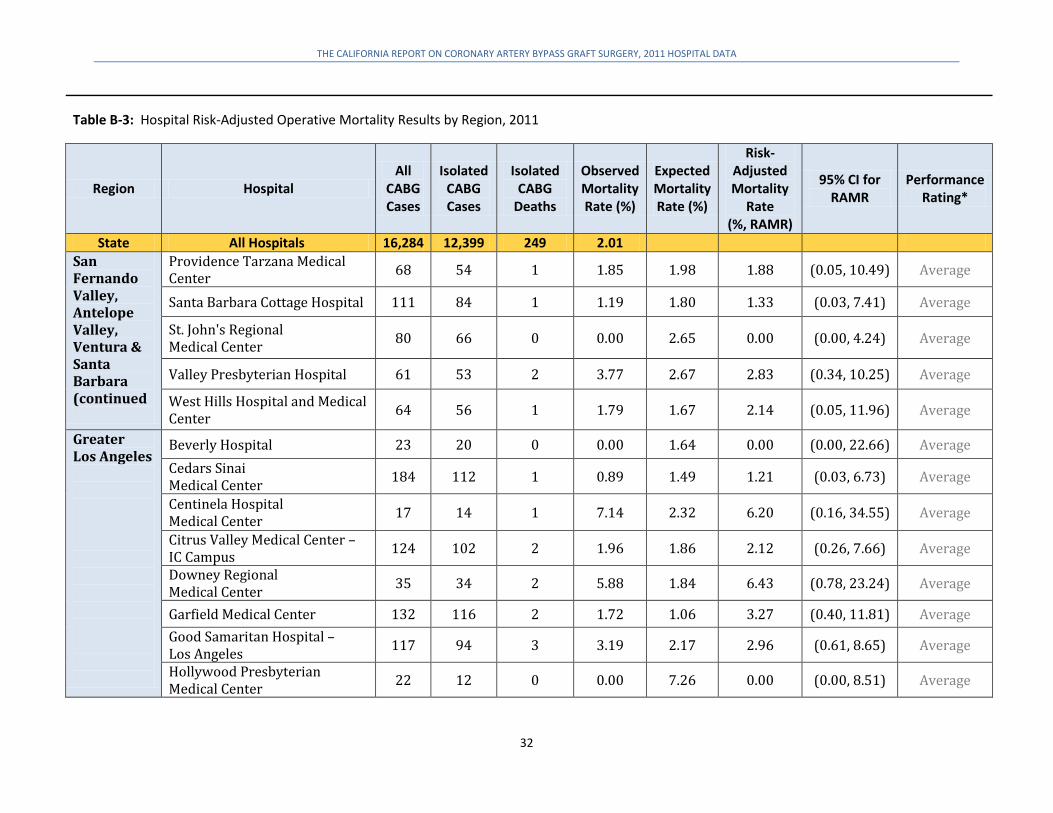
THE CALIFORNIA REPORT ON CORONARY ARTERY BYPASS GRAFT SURGERY, 2011 HOSPITAL DATA
Table B-3: Hospital Risk-Adjusted Operative Mortality Results by Region, 2011
Region Hospital All
CABG Cases
Isolated CABG Cases
Isolated CABG
Deaths
Observed Mortality Rate (%)
Expected Mortality Rate (%)
Risk-Adjusted Mortality
Rate (%, RAMR)
95% CI for RAMR
Performance Rating*
State All Hospitals 16,284 12,399 249 2.01 San Fernando Valley, Antelope Valley, Ventura & Santa Barbara (continued
Providence Tarzana Medical Center 68 54 1 1.85 1.98 1.88 (0.05, 10.49) Average
Santa Barbara Cottage Hospital 111 84 1 1.19 1.80 1.33 (0.03, 7.41) Average
St. John's Regional Medical Center 80 66 0 0.00 2.65 0.00 (0.00, 4.24) Average
Valley Presbyterian Hospital 61 53 2 3.77 2.67 2.83 (0.34, 10.25) Average
West Hills Hospital and Medical Center 64 56 1 1.79 1.67 2.14 (0.05, 11.96) Average
Greater Los Angeles
Beverly Hospital 23 20 0 0.00 1.64 0.00 (0.00, 22.66) Average Cedars Sinai Medical Center 184 112 1 0.89 1.49 1.21 (0.03, 6.73) Average
Centinela Hospital Medical Center 17 14 1 7.14 2.32 6.20 (0.16, 34.55) Average
Citrus Valley Medical Center – IC Campus 124 102 2 1.96 1.86 2.12 (0.26, 7.66) Average
Downey Regional Medical Center 35 34 2 5.88 1.84 6.43 (0.78, 23.24) Average
Garfield Medical Center 132 116 2 1.72 1.06 3.27 (0.40, 11.81) Average Good Samaritan Hospital – Los Angeles 117 94 3 3.19 2.17 2.96 (0.61, 8.65) Average
Hollywood Presbyterian Medical Center 22 12 0 0.00 7.26 0.00 (0.00, 8.51) Average
32

THE CALIFORNIA REPORT ON CORONARY ARTERY BYPASS GRAFT SURGERY, 2011 HOSPITAL DATA
Table B-3: Hospital Risk-Adjusted Operative Mortality Results by Region, 2011
Region Hospital All
CABG Cases
Isolated CABG Cases
Isolated CABG
Deaths
Observed Mortality Rate (%)
Expected Mortality Rate (%)
Risk-Adjusted Mortality
Rate (%, RAMR)
95% CI for RAMR
Performance Rating*
State All Hospitals 16,284 12,399 249 2.01 Greater Los Angeles (continued)
Huntington Memorial Hospital 97 78 0 0.00 1.59 0.00 (0.00, 5.98) Average Kaiser Foundation Hospital – Sunset 665 498 6 1.20 1.60 1.51 (0.56, 3.30) Average
Keck Hospital of USC 245 54 1 1.85 1.61 2.31 (0.06, 12.90) Average Lakewood Regional Medical Center 122 103 3 2.91 2.77 2.11 (0.44, 6.17) Average
Long Beach Memorial Medical Center 194 159 5 3.14 2.37 2.66 (0.86, 6.22) Average
Los Angeles Co. Harbor – UCLA Medical Center 93 77 0 0.00 1.43 0.00 (0.00, 6.71) Average
Los Angeles Co. USC Medical Center 146 117 2 1.71 0.63 5.47 (0.66, 19.76) Average
Methodist Hospital of Southern California 48 38 0 0.00 2.71 0.00 (0.00, 7.19) Average
Presbyterian Intercommunity Hospital 114 69 0 0.00 3.32 0.00 (0.00, 3.23) Average
Providence Little Company of Mary Medical Center – Torrance
73 58 3 5.17 2.38 4.37 (0.90, 12.77) Average
Ronald Reagan UCLA Medical Center 213 92 1 1.09 1.78 1.23 (0.03, 6.84) Average
Santa Monica – UCLA Medical Center and Orthopaedic Hospital
1 1 0 0.00 1.37 0.00 (0.00, 100.0) Average
St. Francis Medical Center 45 40 1 2.50 1.31 3.82 (0.10, 21.30) Average
33
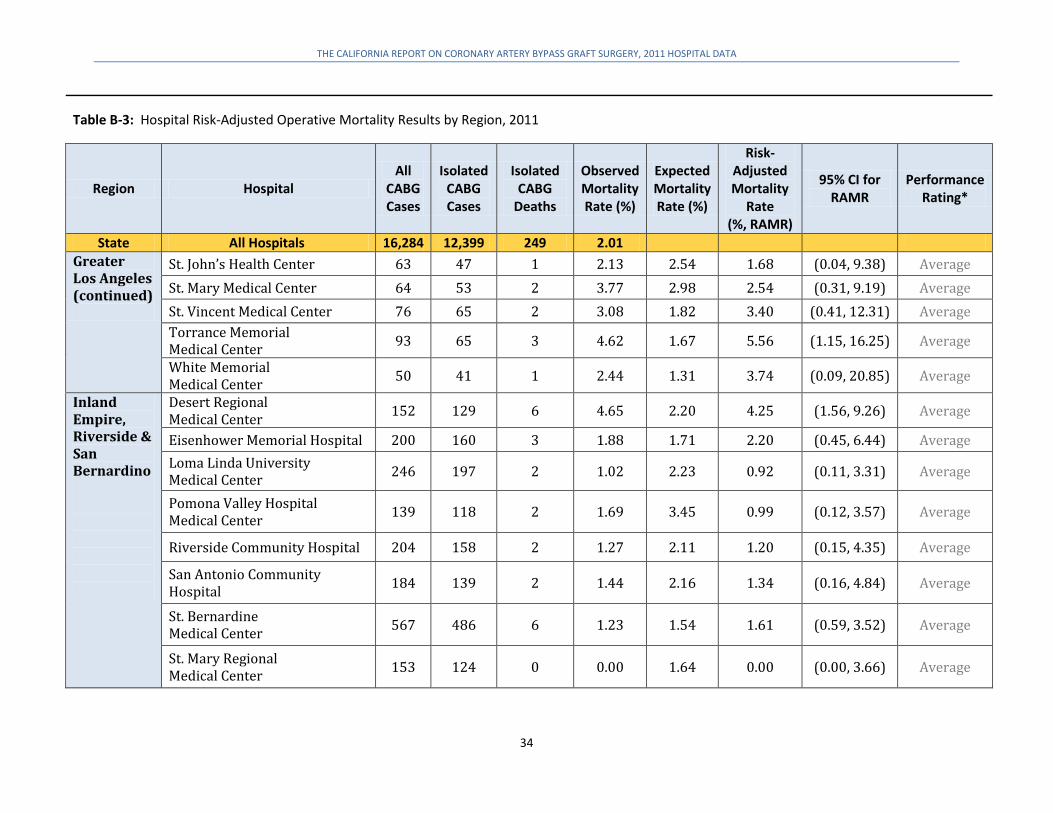
THE CALIFORNIA REPORT ON CORONARY ARTERY BYPASS GRAFT SURGERY, 2011 HOSPITAL DATA
Table B-3: Hospital Risk-Adjusted Operative Mortality Results by Region, 2011
Region Hospital All
CABG Cases
Isolated CABG Cases
Isolated CABG
Deaths
Observed Mortality Rate (%)
Expected Mortality Rate (%)
Risk-Adjusted Mortality
Rate (%, RAMR)
95% CI for RAMR
Performance Rating*
State All Hospitals 16,284 12,399 249 2.01 Greater Los Angeles (continued)
St. John’s Health Center 63 47 1 2.13 2.54 1.68 (0.04, 9.38) Average St. Mary Medical Center 64 53 2 3.77 2.98 2.54 (0.31, 9.19) Average St. Vincent Medical Center 76 65 2 3.08 1.82 3.40 (0.41, 12.31) Average Torrance Memorial Medical Center 93 65 3 4.62 1.67 5.56 (1.15, 16.25) Average
White Memorial Medical Center 50 41 1 2.44 1.31 3.74 (0.09, 20.85) Average
Inland Empire, Riverside & San Bernardino
Desert Regional Medical Center 152 129 6 4.65 2.20 4.25 (1.56, 9.26) Average
Eisenhower Memorial Hospital 200 160 3 1.88 1.71 2.20 (0.45, 6.44) Average Loma Linda University Medical Center 246 197 2 1.02 2.23 0.92 (0.11, 3.31) Average
Pomona Valley Hospital Medical Center 139 118 2 1.69 3.45 0.99 (0.12, 3.57) Average
Riverside Community Hospital 204 158 2 1.27 2.11 1.20 (0.15, 4.35) Average
San Antonio Community Hospital 184 139 2 1.44 2.16 1.34 (0.16, 4.84) Average
St. Bernardine Medical Center 567 486 6 1.23 1.54 1.61 (0.59, 3.52) Average
St. Mary Regional Medical Center 153 124 0 0.00 1.64 0.00 (0.00, 3.66) Average
34
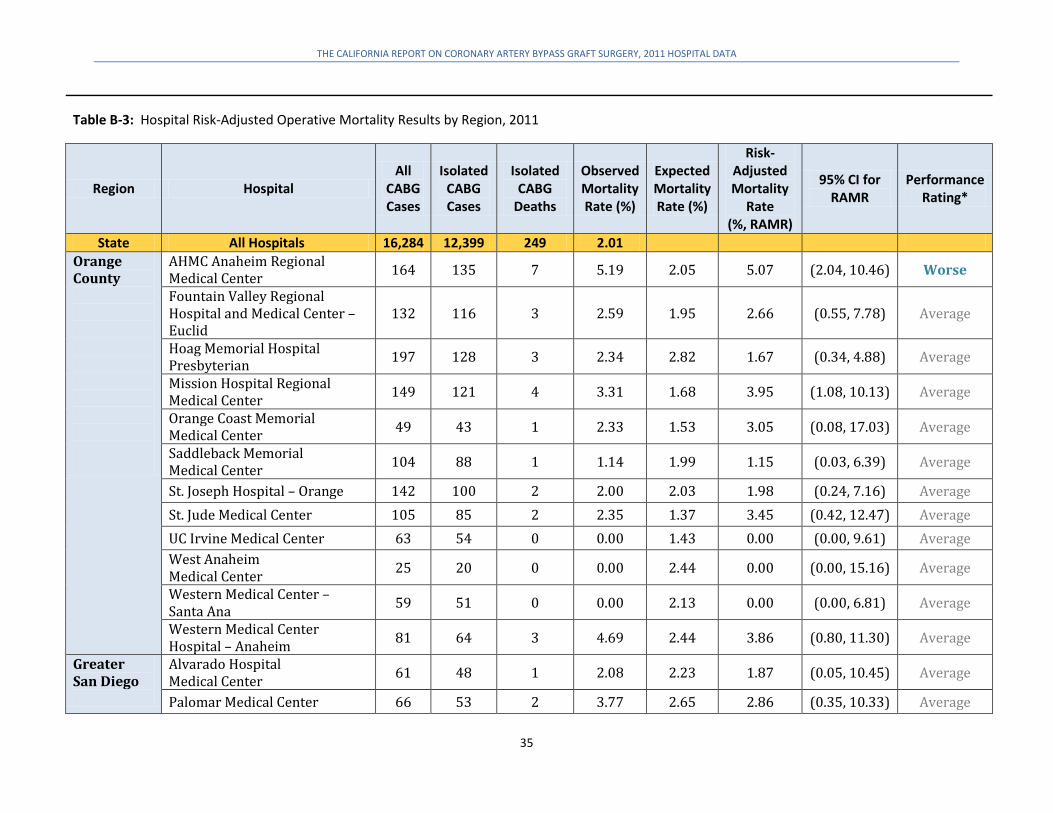
THE CALIFORNIA REPORT ON CORONARY ARTERY BYPASS GRAFT SURGERY, 2011 HOSPITAL DATA
Table B-3: Hospital Risk-Adjusted Operative Mortality Results by Region, 2011
Region Hospital All
CABG Cases
Isolated CABG Cases
Isolated CABG
Deaths
Observed Mortality Rate (%)
Expected Mortality Rate (%)
Risk-Adjusted Mortality
Rate (%, RAMR)
95% CI for RAMR
Performance Rating*
State All Hospitals 16,284 12,399 249 2.01 Orange County
AHMC Anaheim Regional Medical Center 164 135 7 5.19 2.05 5.07 (2.04, 10.46) Worse
Fountain Valley Regional Hospital and Medical Center – Euclid
132 116 3 2.59 1.95 2.66 (0.55, 7.78) Average
Hoag Memorial Hospital Presbyterian 197 128 3 2.34 2.82 1.67 (0.34, 4.88) Average
Mission Hospital Regional Medical Center 149 121 4 3.31 1.68 3.95 (1.08, 10.13) Average
Orange Coast Memorial Medical Center 49 43 1 2.33 1.53 3.05 (0.08, 17.03) Average
Saddleback Memorial Medical Center 104 88 1 1.14 1.99 1.15 (0.03, 6.39) Average
St. Joseph Hospital – Orange 142 100 2 2.00 2.03 1.98 (0.24, 7.16) Average St. Jude Medical Center 105 85 2 2.35 1.37 3.45 (0.42, 12.47) Average UC Irvine Medical Center 63 54 0 0.00 1.43 0.00 (0.00, 9.61) Average West Anaheim Medical Center 25 20 0 0.00 2.44 0.00 (0.00, 15.16) Average
Western Medical Center – Santa Ana 59 51 0 0.00 2.13 0.00 (0.00, 6.81) Average
Western Medical Center Hospital – Anaheim 81 64 3 4.69 2.44 3.86 (0.80, 11.30) Average
Greater San Diego
Alvarado Hospital Medical Center 61 48 1 2.08 2.23 1.87 (0.05, 10.45) Average
Palomar Medical Center 66 53 2 3.77 2.65 2.86 (0.35, 10.33) Average
35
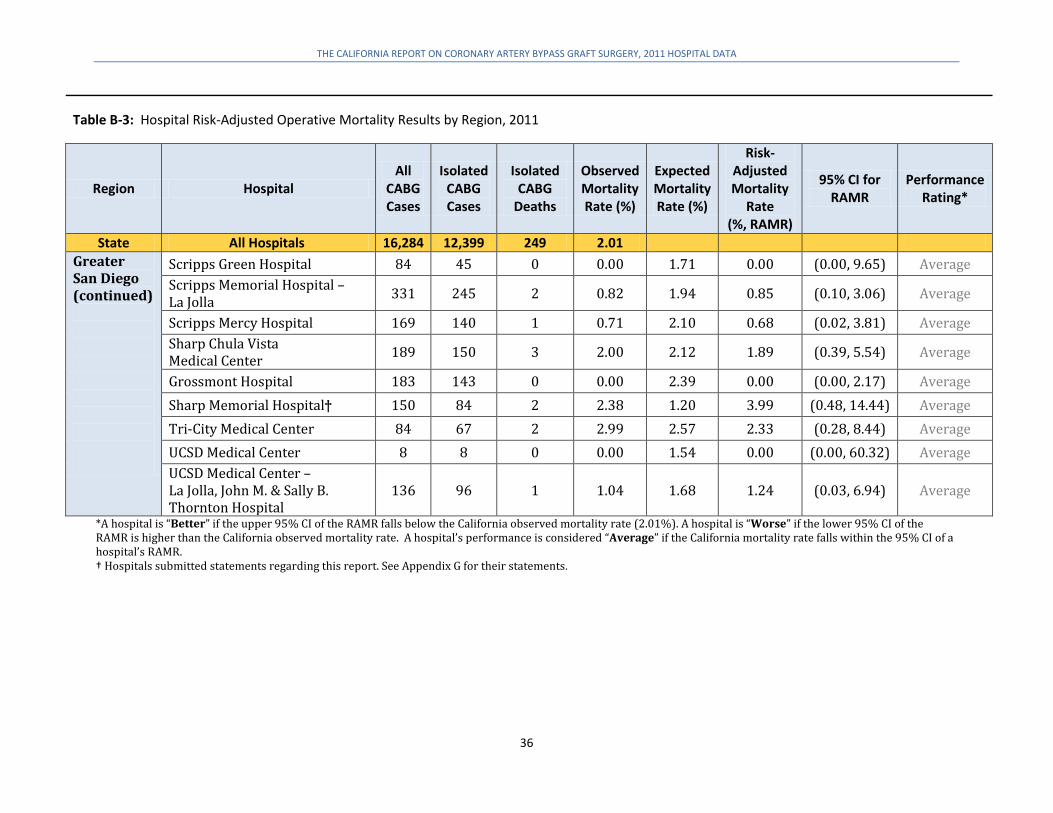
THE CALIFORNIA REPORT ON CORONARY ARTERY BYPASS GRAFT SURGERY, 2011 HOSPITAL DATA
Table B-3: Hospital Risk-Adjusted Operative Mortality Results by Region, 2011
Region Hospital All
CABG Cases
Isolated CABG Cases
Isolated CABG
Deaths
Observed Mortality Rate (%)
Expected Mortality Rate (%)
Risk-Adjusted Mortality
Rate (%, RAMR)
95% CI for RAMR
Performance Rating*
State All Hospitals 16,284 12,399 249 2.01 Greater San Diego (continued)
Scripps Green Hospital 84 45 0 0.00 1.71 0.00 (0.00, 9.65) Average Scripps Memorial Hospital – La Jolla 331 245 2 0.82 1.94 0.85 (0.10, 3.06) Average
Scripps Mercy Hospital 169 140 1 0.71 2.10 0.68 (0.02, 3.81) Average Sharp Chula Vista Medical Center 189 150 3 2.00 2.12 1.89 (0.39, 5.54) Average
Grossmont Hospital 183 143 0 0.00 2.39 0.00 (0.00, 2.17) Average Sharp Memorial Hospital† 150 84 2 2.38 1.20 3.99 (0.48, 14.44) Average Tri-City Medical Center 84 67 2 2.99 2.57 2.33 (0.28, 8.44) Average UCSD Medical Center 8 8 0 0.00 1.54 0.00 (0.00, 60.32) Average UCSD Medical Center – La Jolla, John M. & Sally B. Thornton Hospital
136 96 1 1.04 1.68 1.24 (0.03, 6.94) Average
*A hospital is “Better” if the upper 95% CI of the RAMR falls below the California observed mortality rate (2.01%). A hospital is “Worse” if the lower 95% CI of the RAMR is higher than the California observed mortality rate. A hospital’s performance is considered “Average” if the California mortality rate falls within the 95% CI of a hospital’s RAMR. † Hospitals submitted statements regarding this report. See Appendix G for their statements.
36

THE CALIFORNIA REPORT ON CORONARY ARTERY BYPASS GRAFT SURGERY, 2011 HOSPITAL DATA
Appendix C: Technical Notes on Risk-Adjusted Hospital Post-Operative Stroke Calculations
Risk Model for Adjusting Hospital Post-Operative Stroke Rates, 2010-2011 To assess hospital performance on this outcome, CCORP combined 2010 and 2011 data to increase the number of cases and reliability of hospital results. Similar to the methodology used to assess the operative mortality rate, CCORP used a multivariable logistic regression model to estimate the relationship between each of the demographic and pre-operative risk factors and the probability of post-operative stroke. To develop the risk model, the 24,947 isolated (non-salvage) CABG surgery cases (2010 and 2011) were evaluated for missing data (23,795 cases had no missing data in any field and were used for the risk model parameter estimation). The 1,152 (approximately 4.6%) isolated CABG cases with missing data fields were removed to ensure that the effects of risk factors were estimated based on the most complete data available. To generate the hospital-specific results shown in this report, missing values for these 1,152 records were imputed (after risk model parameter estimation) by replacing most with the lowest risk category of the same variable (e.g., Timing of Myocardial Infarction = No MI). After imputing the missing values, the parameters of the risk model were applied to all cases to estimate each patient’s probability of post-operative stroke. CCORP summed these probabilities to estimate the expected outcome for each hospital. The risk model, based on the 2010-2011 data, is presented in Table C-1 with statistically significant risk factors identified in bolded text.
37
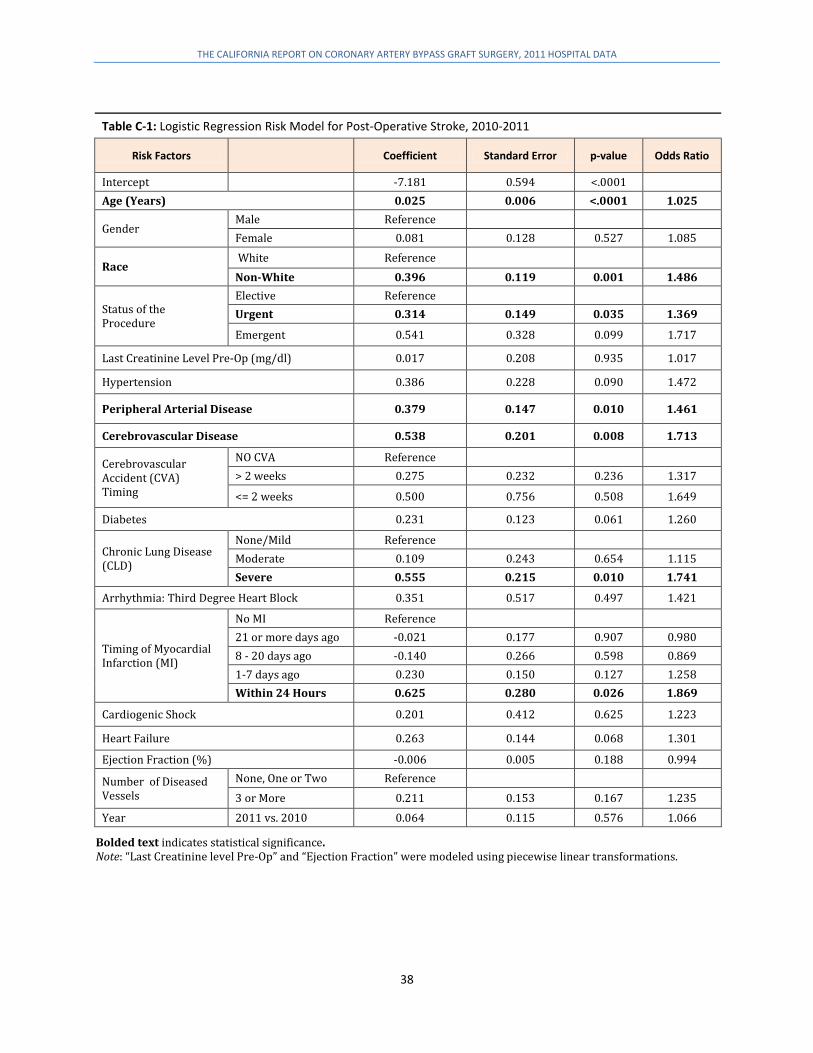
THE CALIFORNIA REPORT ON CORONARY ARTERY BYPASS GRAFT SURGERY, 2011 HOSPITAL DATA
Table C-1: Logistic Regression Risk Model for Post-Operative Stroke, 2010-2011
Risk Factors Coefficient Standard Error p-value Odds Ratio
Intercept -7.181 0.594 <.0001 Age (Years) 0.025 0.006 <.0001 1.025
Gender Male Reference Female 0.081 0.128 0.527 1.085
Race White Reference Non-White 0.396 0.119 0.001 1.486
Status of the Procedure
Elective Reference Urgent 0.314 0.149 0.035 1.369
Emergent 0.541 0.328 0.099 1.717
Last Creatinine Level Pre-Op (mg/dl) 0.017 0.208 0.935 1.017
Hypertension 0.386 0.228 0.090 1.472
Peripheral Arterial Disease 0.379 0.147 0.010 1.461
Cerebrovascular Disease 0.538 0.201 0.008 1.713
Cerebrovascular Accident (CVA) Timing
NO CVA Reference > 2 weeks 0.275 0.232 0.236 1.317
<= 2 weeks 0.500 0.756 0.508 1.649
Diabetes 0.231 0.123 0.061 1.260
Chronic Lung Disease (CLD)
None/Mild Reference Moderate 0.109 0.243 0.654 1.115 Severe 0.555 0.215 0.010 1.741
Arrhythmia: Third Degree Heart Block 0.351 0.517 0.497 1.421
Timing of Myocardial Infarction (MI)
No MI Reference 21 or more days ago -0.021 0.177 0.907 0.980 8 - 20 days ago -0.140 0.266 0.598 0.869 1-7 days ago 0.230 0.150 0.127 1.258 Within 24 Hours 0.625 0.280 0.026 1.869
Cardiogenic Shock 0.201 0.412 0.625 1.223
Heart Failure 0.263 0.144 0.068 1.301
Ejection Fraction (%) -0.006 0.005 0.188 0.994
Number of Diseased Vessels
None, One or Two Reference 3 or More 0.211 0.153 0.167 1.235
Year 2011 vs. 2010 0.064 0.115 0.576 1.066
Bolded text indicates statistical significance. Note: “Last Creatinine level Pre-Op” and “Ejection Fraction” were modeled using piecewise linear transformations.
38

THE CALIFORNIA REPORT ON CORONARY ARTERY BYPASS GRAFT SURGERY, 2011 HOSPITAL DATA
Discrimination of the Risk Model for Post-Operative Stroke Risk models that distinguish well between patients who have an adverse event and those who do not are said to have good discrimination. A commonly used measure of discrimination is the C-statistic, also known as the area under the Receiver Operating Characteristic (ROC) curve. For all possible pairs of patients, where one has post-operative stroke and the other does not, the C-statistic describes the proportion of pairs where the patient with a post-operative stroke had a higher predicted risk of post-operative stroke than the patient with no stroke. C-statistics range from 0.5 to 1, with higher values indicating better discrimination. For the 2010-2011 post-operative risk model, the C-statistic was 0.706, which compares favorably with the Society of Thoracic Surgeons’ recently published post-operative stroke model (C-statistic = 0.716 for isolated CABG surgery).14
Calibration of the Risk Model for Post-Operative Stroke Calibration refers to the ability of a risk model to match predicted and observed post-operative stroke cases. A model in which the number of observed stroke cases matches closely with the number of stroke cases predicted by the model demonstrates good calibration. Good calibration is essential for accurate risk adjustment. A common measure of calibration is the Hosmer-Lemeshow χ2 test, which compares observed and predicted outcomes over deciles of risk. The p-value of the Hosmer-Lemeshow test statistic for the 2010-2011 post-operative stroke risk model is 0.098, indicating adequate calibration. That is, the number of predicted post-operative stroke cases was consistent with actual post-operative stroke cases in the data. Another way to test model calibration is to partition the data and compare observed stroke cases with predicted stroke cases in each of 10 risk groups. The 10 risk groups are created by sorting all observations by the predicted risk of post-operative stroke and then dividing the sorted observations into deciles of approximately equal size. As presented in Table C-2, Risk Group 1 shows the patients in the lowest risk group. Among the 2,381 patients in this group, 7 patients had post-operative strokes, but the model predicted 9.1 cases. Assuming a Poisson distribution for a binary outcome, the predicted range of strokes for this group is 3.2 to 15.0. The observed number of 7 strokes falls within the range of predicted strokes. In fact, none of the 10 risk groups had significantly fewer or significantly more post-operative strokes than were predicted by the model. Overall the risk model shows no systematic underestimation or overestimation of stroke cases at the extremes.
14 Shahian DM, O'Brien SM, Filardo G, et al. The Society of Thoracic Surgeons 2008 cardiac surgery risk models: part 1—coronary artery bypass grafting surgery. Ann Thorac Surg 2009; 88:S2-22.
39

THE CALIFORNIA REPORT ON CORONARY ARTERY BYPASS GRAFT SURGERY, 2011 HOSPITAL DATA
Table C-2: Calibration of Risk Model for Post-Operative Stroke, 2010-2011
Risk Group
Isolated CABG Cases
Observed Post-Op Strokes
Predicted Post-Op Strokes Difference 95% CI of Predicted
Post-Op Strokes
1 2,381 7 9.1 2.1 (3.2, 15.0) 2 2,380 10 12.9 2.9 (5.9, 19.9) 3 2,380 9 15.8 6.8 (8.0, 23.6) 4 2,381 25 18.7 -6.3 (10.2, 27.2) 5 2,380 22 21.9 -0.1 (12.7, 31.0) 6 2,381 16 25.6 9.6 (15.7, 35.5) 7 2,380 38 30.4 -7.6 (19.6, 41.2) 8 2,380 34 37.4 3.4 (25.4, 49.3) 9 2,380 57 49.5 -7.5 (35.7, 63.3)
10 2,372 95 91.8 -3.2 (73.0, 110.6) Total 23,795 313 313.0 0
Note: Risk Group 1 is at lowest risk and Risk Group 10 is at highest risk.
Process for Calculating Risk-Adjusted Post-Operative Stroke Rate and Performance Ratings The risk-adjusted post-operative stroke rate (RASR) represents the best estimate of what a hospital’s post-operative stroke rate would have been if it had a patient case mix identical to the statewide average. Thus, this rate is comparable among hospitals because it accounts for the differences in patient severity-of-illness. The RASR is computed by dividing the hospital’s number of patient post-operative strokes by its expected number of post-operative strokes (obtained from the risk model) to obtain the observed/expected (O/E) ratio. If the O/E ratio is greater than one, the hospital has a higher stroke rate than expected based on patient mix. If the O/E ratio is less than one, the hospital has a lower stroke rate than expected. The O/E ratio is then multiplied by the state average post-operative stroke rate (1.32% for 2010-2011) to obtain the hospital’s RASR. The performance rating is based on a comparison of the 95% confidence interval (CI) of each hospital’s RASR to the California average post-operative stroke rate. Thus, CCORP treated 2010-2011 data as a sample, and inferred the range in which each hospital’s true performance was likely to fall. As shown in Table C-3, if the upper 95% CI of a hospital’s risk-adjusted stroke rate is below the state average stroke rate, indicating the hospital’s RASR is significantly lower than the state average, the performance rating is “Better.” If the lower 95% CI of a hospital’s RASR is above the state average stroke rate, indicating the hospital’s risk-adjusted stroke rate is significantly higher than the state average, the performance rating is “Worse.” If the state average stroke rate is within the 95% CI of a hospital’s RASR, the performance rating is “Average.” See the following section for a detailed discussion of results.
40
THE CALIFORNIA REPORT ON CORONARY ARTERY BYPASS GRAFT SURGERY, 2011 HOSPITAL DATA
Statistical Details of Hospital Risk-Adjusted Post-Operative Stroke Results, 2010-2011 Table C-3 presents the risk-adjusted results for each hospital for 2010-2011. The table is sorted by geographic region and contains, for each hospital, total number of CABG surgeries performed (isolated and non-isolated combined), number of isolated CABG surgeries (excluding salvage cases), number of observed isolated CABG post-operative stroke cases, observed post-operative stroke rate, expected post-operative stroke rate predicted by the risk model, RASR and 95% confidence interval (CI) of the RASR, and the associated hospital performance rating. Among the 24,947 isolated CABG surgeries performed in 2010-2011, 329 patients had a post-operative stroke in-hospital, reflecting an overall rate of 1.32%. Among 329 patients with post-operative stroke, 55 (16.7%) died either in-hospital or after discharge but within 30 days of CABG surgery. The observed stroke rate among hospitals ranged from 0% to 5.14%. The expected stroke rates, which are generated by the model and measure patient severity of illness, were between 0.87% and 2.03%. The risk-adjusted stroke rates, which measure hospital performance, ranged from 0% to 5.10%. Based on the 95% CI for risk-adjusted stroke rates, 118 of 123 hospitals (96%) performed within the expected range compared to the state’s average stroke rate (denoted by “Average” in the performance rating column of Table C-3), one hospital performed significantly “Better” than the state average, and four hospitals performed significantly “Worse” than the state average. Hospitals marked with † in Table C-3 submitted statements regarding this report and are presented in Appendix G.
Definitions of Table C-3 Terms All CABG Cases: The total number of isolated and non-isolated CABG cases submitted to CCORP for 2010 and 2011 combined. Non-isolated CABG cases are not used to calculate performance ratings. Isolated CABG Cases: The number of isolated CABG cases submitted to CCORP in 2010-2011. All patients in salvage operative status are excluded from the isolated CABG cases, thus only isolated CABG cases without salvage operative status are used in calculating performance ratings. Isolated CABG Post-Op Strokes: The actual number of post-operative strokes that were unresolved after 24 hours for isolated CABG cases for 2010-2011. Observed Post-Op Stroke Rate: The ratio of the number of isolated CABG with post-operative stroke and the isolated CABG cases multiplied by 100: Observed Post-Operative Stroke Rate = Isolated CABG Post-Operative Strokes/Isolated CABG Cases × 100. Expected Post-Op Stroke Rate: The ratio of the expected number of post-operative strokes predicted for a hospital (after risk adjusting for their patient population) and the isolated CABG cases multiplied by 100: Expected Post-Operative Stroke Rate = Expected Post-Operative Strokes/Isolated CABG Cases × 100. Risk-Adjusted Post-Operative Stroke Rate (95% CI): The Risk-Adjusted Post-Operative Stroke Rate (RASR) is obtained by multiplying the state average post-operative stroke rate by a hospital's O/E ratio. The 95% confidence interval represents the confidence we have in the estimate for the
41

THE CALIFORNIA REPORT ON CORONARY ARTERY BYPASS GRAFT SURGERY, 2011 HOSPITAL DATA
RASR. The lower and upper confidence limits are calculated using Poisson exact confidence interval calculations. Performance Rating: The performance rating is based on a comparison of each hospital's RASR to the state observed post-operative stroke rate. A hospital is classified as "Better" if the upper 95% confidence limit of its RASR falls below the California observed post-operative stroke rate. A hospital is classified as "Worse" if the lower 95% confidence limit of its RASR is higher than the California observed post-operative stroke rate. A hospital is classified as "Average" if the California post-operative stroke rate falls within the confidence interval of the hospital's RASR.
42

THE CALIFORNIA REPORT ON CORONARY ARTERY BYPASS GRAFT SURGERY, 2011 HOSPITAL DATA
Table C-3: Hospital Risk-Adjusted Post-Operative Stroke Results by Region, 2010-2011
Region Hospital All
CABG Cases
Isolated CABG Cases
Isolated CABG
Post-Op Strokes
Observed Post-Op Stroke
Rate (%)
Expected Post-Op Stroke
Rate (%)
Risk-Adjusted Post-Op
Stroke Rate (%, RASR)
95% CI for RASR
Performance Rating*
State All Hospitals 32,630 24,947 329 1.32 Sacramento Valley & Northern California Region
Enloe Medical Center – Esplanade Campus 345 297 2 0.67 1.28 0.69 (0.08, 2.51) Average
Mercy General Hospital 1,596 1,031 16 1.55 1.18 1.73 (0.99, 2.81) Average Mercy Medical Center – Redding 275 197 0 0.00 1.25 0.00 (0.00, 1.98) Average
Mercy San Juan Hospital 338 244 2 0.82 1.08 1.00 (0.12, 3.60) Average Rideout Memorial Hospital 272 213 3 1.41 1.15 1.62 (0.33, 4.73) Average Shasta Regional Medical Center 133 119 0 0.00 1.12 0.00 (0.00, 3.64) Average
St. Joseph Hospital – Eureka 79 66 0 0.00 1.46 0.00 (0.00, 5.04) Average Sutter Memorial Hospital 959 656 2 0.30 1.12 0.36 (0.04, 1.30) Better UC Davis Medical Center 304 216 3 1.39 1.12 1.64 (0.34, 4.79) Average
San Francisco Bay Area & San Jose
Alta Bates Summit Medical Center – Summit Campus –Hawthorne
458 364 2 0.55 1.49 0.48 (0.06, 1.75) Average
California Pacific Medical Center – Pacific Campus 150 91 0 0.00 1.01 0.00 (0.00, 5.32) Average
Community Hospital Monterey Peninsula 162 118 0 0.00 1.13 0.00 (0.00, 3.66) Average
Dominican Hospital – Santa Cruz/Soquel 141 111 2 1.80 1.01 2.35 (0.28, 8.49) Average
El Camino Hospital 197 117 4 3.42 1.08 4.16 (1.13, 10.66) Average
43
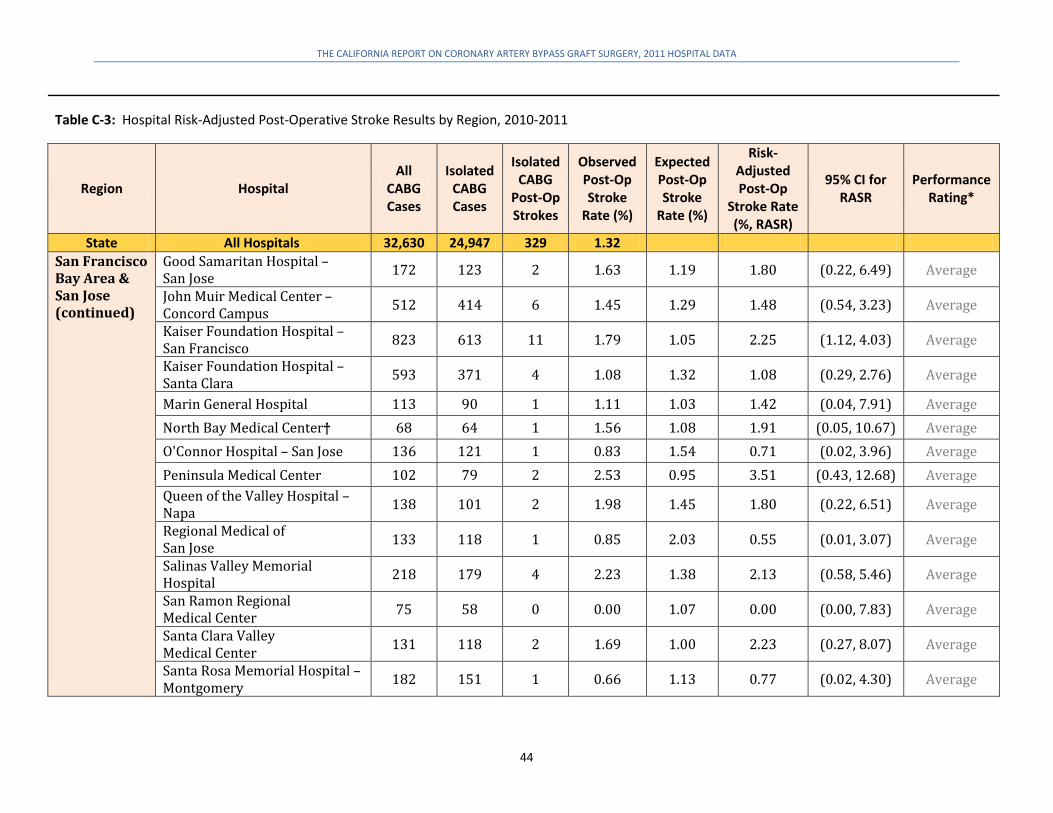
THE CALIFORNIA REPORT ON CORONARY ARTERY BYPASS GRAFT SURGERY, 2011 HOSPITAL DATA
Table C-3: Hospital Risk-Adjusted Post-Operative Stroke Results by Region, 2010-2011
Region Hospital All
CABG Cases
Isolated CABG Cases
Isolated CABG
Post-Op Strokes
Observed Post-Op Stroke
Rate (%)
Expected Post-Op Stroke
Rate (%)
Risk-Adjusted Post-Op
Stroke Rate (%, RASR)
95% CI for RASR
Performance Rating*
State All Hospitals 32,630 24,947 329 1.32 San Francisco Bay Area & San Jose (continued)
Good Samaritan Hospital – San Jose 172 123 2 1.63 1.19 1.80 (0.22, 6.49) Average
John Muir Medical Center – Concord Campus 512 414 6 1.45 1.29 1.48 (0.54, 3.23) Average
Kaiser Foundation Hospital – San Francisco 823 613 11 1.79 1.05 2.25 (1.12, 4.03) Average
Kaiser Foundation Hospital – Santa Clara 593 371 4 1.08 1.32 1.08 (0.29, 2.76) Average
Marin General Hospital 113 90 1 1.11 1.03 1.42 (0.04, 7.91) Average North Bay Medical Center† 68 64 1 1.56 1.08 1.91 (0.05, 10.67) Average O'Connor Hospital – San Jose 136 121 1 0.83 1.54 0.71 (0.02, 3.96) Average Peninsula Medical Center 102 79 2 2.53 0.95 3.51 (0.43, 12.68) Average Queen of the Valley Hospital – Napa 138 101 2 1.98 1.45 1.80 (0.22, 6.51) Average
Regional Medical of San Jose 133 118 1 0.85 2.03 0.55 (0.01, 3.07) Average
Salinas Valley Memorial Hospital 218 179 4 2.23 1.38 2.13 (0.58, 5.46) Average
San Ramon Regional Medical Center 75 58 0 0.00 1.07 0.00 (0.00, 7.83) Average
Santa Clara Valley Medical Center 131 118 2 1.69 1.00 2.23 (0.27, 8.07) Average
Santa Rosa Memorial Hospital – Montgomery 182 151 1 0.66 1.13 0.77 (0.02, 4.30) Average
44

THE CALIFORNIA REPORT ON CORONARY ARTERY BYPASS GRAFT SURGERY, 2011 HOSPITAL DATA
Table C-3: Hospital Risk-Adjusted Post-Operative Stroke Results by Region, 2010-2011
Region Hospital All
CABG Cases
Isolated CABG Cases
Isolated CABG
Post-Op Strokes
Observed Post-Op Stroke
Rate (%)
Expected Post-Op Stroke
Rate (%)
Risk-Adjusted Post-Op
Stroke Rate (%, RASR)
95% CI for RASR
Performance Rating*
State All Hospitals 32,630 24,947 329 1.32 San Francisco Bay Area & San Jose (continued)
Sequoia Hospital 211 109 0 0.00 1.18 0.00 (0.00, 3.77) Average Seton Medical Center 198 175 9 5.14 1.50 4.52 (2.07, 8.58) Worse St. Helena Hospital 127 109 1 0.92 1.62 0.75 (0.02, 4.16) Average St. Mary's Medical Center – San Francisco 78 66 2 3.03 1.39 2.87 (0.35, 10.37) Average
Stanford Hospital 233 135 1 0.74 1.29 0.76 (0.02, 4.22) Average Sutter Medical Center of Santa Rosa 193 135 0 0.00 0.89 0.00 (0.00, 4.06) Average
UCSF Medical Center 162 128 2 1.56 1.19 1.73 (0.21, 6.25) Average Valleycare Medical Center 84 60 0 0.00 1.34 0.00 (0.00, 6.06) Average Washington Hospital – Fremont 194 184 2 1.09 1.51 0.95 (0.12, 3.44) Average
Central California
Bakersfield Heart Hospital 233 199 4 2.01 1.26 2.10 (0.57, 5.39) Average Bakersfield Memorial Hospital 283 235 1 0.43 1.12 0.50 (0.01, 2.79) Average Community Regional Medical Center – Fresno 554 462 3 0.65 1.46 0.59 (0.12, 1.71) Average
Dameron Hospital 120 116 4 3.45 1.47 3.10 (0.84, 7.94) Average Doctors Medical Center 613 482 3 0.62 1.63 0.50 (0.10, 1.47) Average Emanuel Medical Center 19 16 0 0.00 1.59 0.00 (0.00, 19.14) Average Fresno Heart and Surgical Center 406 327 2 0.61 1.09 0.74 (0.09, 2.68) Average
Kaweah Delta Medical Center 539 462 10 2.16 1.57 1.81 (0.87, 3.34) Average
45

THE CALIFORNIA REPORT ON CORONARY ARTERY BYPASS GRAFT SURGERY, 2011 HOSPITAL DATA
Table C-3: Hospital Risk-Adjusted Post-Operative Stroke Results by Region, 2010-2011
Region Hospital All
CABG Cases
Isolated CABG Cases
Isolated CABG
Post-Op Strokes
Observed Post-Op Stroke
Rate (%)
Expected Post-Op Stroke
Rate (%)
Risk-Adjusted Post-Op
Stroke Rate (%, RASR)
95% CI for RASR
Performance Rating*
State All Hospitals 32,630 24,947 329 1.32 Central California (continued)
Marian Medical Center 161 147 5 3.40 1.23 3.65 (1.18, 8.52) Average Memorial Hospital Medical Center – Modesto 470 377 6 1.59 1.38 1.52 (0.56, 3.31) Average
San Joaquin Community Hospital 161 149 0 0.00 1.31 0.00 (0.00, 2.50) Average
St. Agnes Medical Center 645 553 4 0.72 1.29 0.74 (0.20, 1.89) Average St. Joseph's Medical Center of Stockton 594 465 7 1.51 1.49 1.33 (0.54, 2.75) Average
San Fernando Valley, Antelope Valley, Ventura & Santa Barbara
Antelope Valley Hospital 63 58 1 1.72 1.14 2.00 (0.05, 11.17) Average Community Memorial Hospital of San Buenaventura 156 133 1 0.75 1.42 0.70 (0.02, 3.90) Average
French Hospital Medical Center 230 169 4 2.37 1.15 2.71 (0.74, 6.96) Average
Glendale Adventist Medical Center – Wilson Terrace 241 207 0 0.00 1.18 0.00 (0.00, 1.99) Average
Glendale Memorial Hospital and Health Center 309 244 2 0.82 1.38 0.78 (0.09, 2.83) Average
Lancaster Community Hospital 8 8 0 0.00 1.33 0.00 (0.00, 45.89) Average Los Robles Hospital and Medical Center 167 117 2 1.71 1.13 2.00 (0.24, 7.24) Average
Northridge Hospital Medical Center 174 148 2 1.35 1.22 1.46 (0.18, 5.29) Average
Palmdale Regional Medical Center 9 8 0 0.00 1.29 0.00 (0.00, 47.06) Average
46
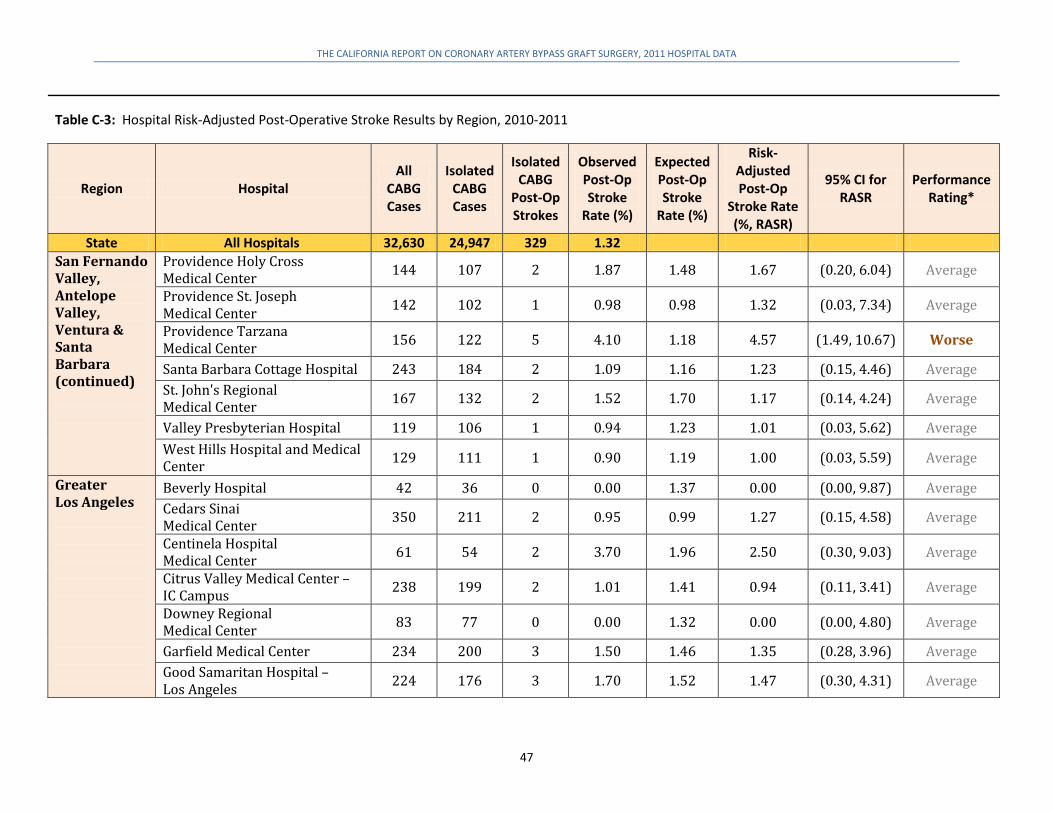
THE CALIFORNIA REPORT ON CORONARY ARTERY BYPASS GRAFT SURGERY, 2011 HOSPITAL DATA
Table C-3: Hospital Risk-Adjusted Post-Operative Stroke Results by Region, 2010-2011
Region Hospital All
CABG Cases
Isolated CABG Cases
Isolated CABG
Post-Op Strokes
Observed Post-Op Stroke
Rate (%)
Expected Post-Op Stroke
Rate (%)
Risk-Adjusted Post-Op
Stroke Rate (%, RASR)
95% CI for RASR
Performance Rating*
State All Hospitals 32,630 24,947 329 1.32 San Fernando Valley, Antelope Valley, Ventura & Santa Barbara (continued)
Providence Holy Cross Medical Center 144 107 2 1.87 1.48 1.67 (0.20, 6.04) Average
Providence St. Joseph Medical Center 142 102 1 0.98 0.98 1.32 (0.03, 7.34) Average
Providence Tarzana Medical Center 156 122 5 4.10 1.18 4.57 (1.49, 10.67) Worse
Santa Barbara Cottage Hospital 243 184 2 1.09 1.16 1.23 (0.15, 4.46) Average St. John's Regional Medical Center 167 132 2 1.52 1.70 1.17 (0.14, 4.24) Average
Valley Presbyterian Hospital 119 106 1 0.94 1.23 1.01 (0.03, 5.62) Average West Hills Hospital and Medical Center 129 111 1 0.90 1.19 1.00 (0.03, 5.59) Average
Greater Los Angeles
Beverly Hospital 42 36 0 0.00 1.37 0.00 (0.00, 9.87) Average Cedars Sinai Medical Center 350 211 2 0.95 0.99 1.27 (0.15, 4.58) Average
Centinela Hospital Medical Center 61 54 2 3.70 1.96 2.50 (0.30, 9.03) Average
Citrus Valley Medical Center – IC Campus 238 199 2 1.01 1.41 0.94 (0.11, 3.41) Average
Downey Regional Medical Center 83 77 0 0.00 1.32 0.00 (0.00, 4.80) Average
Garfield Medical Center 234 200 3 1.50 1.46 1.35 (0.28, 3.96) Average Good Samaritan Hospital – Los Angeles 224 176 3 1.70 1.52 1.47 (0.30, 4.31) Average
47

THE CALIFORNIA REPORT ON CORONARY ARTERY BYPASS GRAFT SURGERY, 2011 HOSPITAL DATA
Table C-3: Hospital Risk-Adjusted Post-Operative Stroke Results by Region, 2010-2011
Region Hospital All
CABG Cases
Isolated CABG Cases
Isolated CABG
Post-Op Strokes
Observed Post-Op Stroke
Rate (%)
Expected Post-Op Stroke
Rate (%)
Risk-Adjusted Post-Op
Stroke Rate (%, RASR)
95% CI for RASR
Performance Rating*
State All Hospitals 32,630 24,947 329 1.32 Greater Los Angeles (continued)
Hollywood Presbyterian Medical Center 22 12 0 0.00 1.36 0.00 (0.00, 29.93) Average
Huntington Memorial Hospital 195 161 1 0.62 1.21 0.68 (0.02, 3.78) Average Kaiser Foundation Hospital – Sunset 1,291 939 11 1.17 1.35 1.14 (0.57, 2.04) Average
Keck Hospital of USC 410 131 2 1.53 1.09 1.84 (0.22, 6.65) Average Lakewood Regional Medical Center 263 229 4 1.75 1.74 1.32 (0.36, 3.39) Average
Long Beach Memorial Medical Center 414 341 5 1.47 1.45 1.33 (0.43, 3.11) Average
Los Angeles Co. Harbor – UCLA Medical Center 207 162 1 0.62 1.42 0.57 (0.01, 3.19) Average
Los Angeles Co. USC Medical Center 251 193 3 1.55 1.04 1.97 (0.41, 5.75) Average
Methodist Hospital of Southern California 88 72 2 2.78 1.70 2.16 (0.26, 7.80) Average
Presbyterian Intercommunity Hospital 212 144 0 0.00 1.77 0.00 (0.00, 1.92) Average
Providence Little Company of Mary Medical Center – Torrance 146 118 2 1.69 1.97 1.13 (0.14, 4.10) Average
Ronald Reagan UCLA Medical Center 424 193 3 1.55 1.10 1.87 (0.39, 5.46) Average
Santa Monica – UCLA Medical Center and Orthopaedic Hospital
5 5 0 0.00 1.00 0.00 (0.00, 97.10) Average
48

THE CALIFORNIA REPORT ON CORONARY ARTERY BYPASS GRAFT SURGERY, 2011 HOSPITAL DATA
Table C-3: Hospital Risk-Adjusted Post-Operative Stroke Results by Region, 2010-2011
Region Hospital All
CABG Cases
Isolated CABG Cases
Isolated CABG
Post-Op Strokes
Observed Post-Op Stroke
Rate (%)
Expected Post-Op Stroke
Rate (%)
Risk-Adjusted Post-Op
Stroke Rate (%, RASR)
95% CI for RASR
Performance Rating*
State All Hospitals 32,630 24,947 329 1.32 Greater Los Angeles (continued)
St. Francis Medical Center 80 72 0 0.00 1.20 0.00 (0.00, 5.63) Average St. John’s Health Center 130 95 1 1.05 1.23 1.12 (0.03, 6.27) Average St. Mary Medical Center 125 111 1 0.90 1.84 0.65 (0.02, 3.60) Average St. Vincent Medical Center 157 137 2 1.46 1.56 1.23 (0.15, 4.46) Average Torrance Memorial Medical Center 174 117 4 3.42 1.50 3.00 (0.82, 7.68) Average
White Memorial Medical Center 104 92 3 3.26 1.48 2.90 (0.60, 8.48) Average
Inland Empire, Riverside & San Bernardino
Desert Regional Medical Center 284 233 1 0.43 1.40 0.41 (0.01, 2.26) Average
Eisenhower Memorial Hospital 402 318 4 1.26 1.24 1.34 (0.37, 3.44) Average Loma Linda University Medical Center 531 427 4 0.94 1.27 0.97 (0.26, 2.48) Average
Pomona Valley Hospital Medical Center 272 232 4 1.72 1.65 1.38 (0.38, 3.53) Average
Riverside Community Hospital 395 310 3 0.97 1.31 0.97 (0.20, 2.84) Average San Antonio Community Hospital 351 263 4 1.52 1.37 1.46 (0.40, 3.75) Average
St. Bernardine Medical Center 1,106 948 8 0.84 1.16 0.96 (0.42, 1.90) Average
St. Mary Regional Medical Center 339 289 2 0.69 1.29 0.71 (0.09, 2.56) Average
Orange County
AHMC Anaheim Regional Medical Center 328 265 5 1.89 1.63 1.53 (0.50, 3.56) Average
49
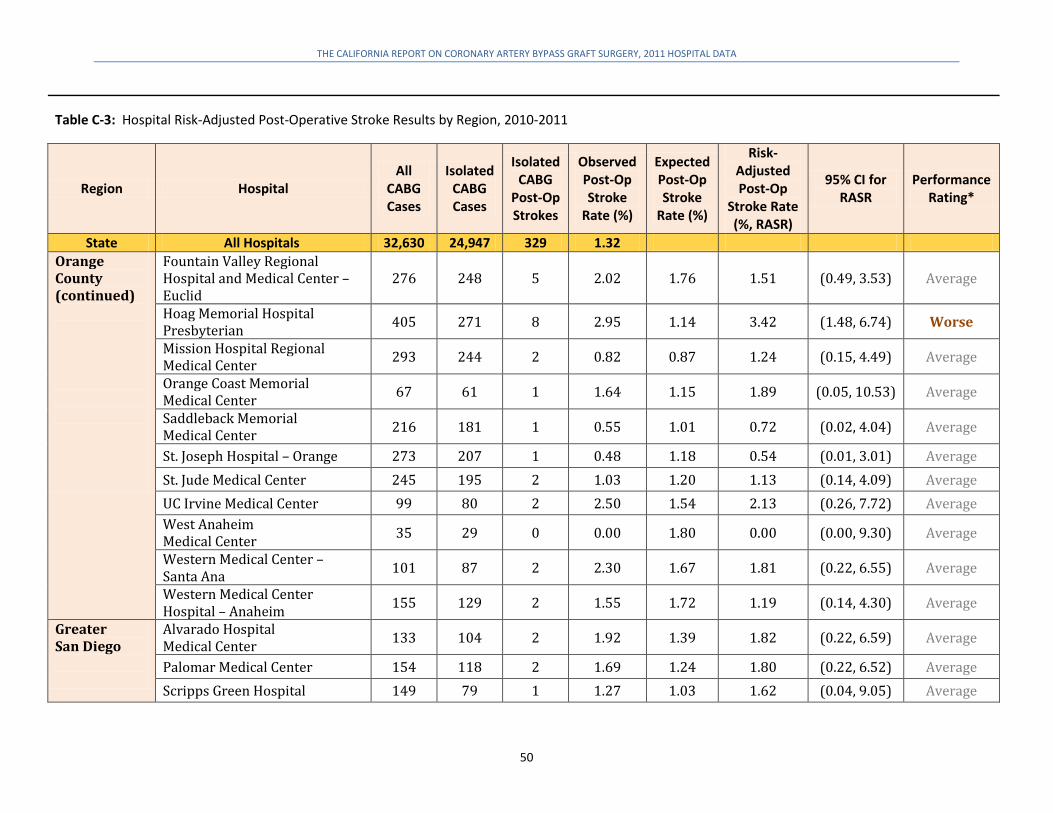
THE CALIFORNIA REPORT ON CORONARY ARTERY BYPASS GRAFT SURGERY, 2011 HOSPITAL DATA
Table C-3: Hospital Risk-Adjusted Post-Operative Stroke Results by Region, 2010-2011
Region Hospital All
CABG Cases
Isolated CABG Cases
Isolated CABG
Post-Op Strokes
Observed Post-Op Stroke
Rate (%)
Expected Post-Op Stroke
Rate (%)
Risk-Adjusted Post-Op
Stroke Rate (%, RASR)
95% CI for RASR
Performance Rating*
State All Hospitals 32,630 24,947 329 1.32 Orange County (continued)
Fountain Valley Regional Hospital and Medical Center – Euclid
276 248 5 2.02 1.76 1.51 (0.49, 3.53) Average
Hoag Memorial Hospital Presbyterian 405 271 8 2.95 1.14 3.42 (1.48, 6.74) Worse
Mission Hospital Regional Medical Center 293 244 2 0.82 0.87 1.24 (0.15, 4.49) Average
Orange Coast Memorial Medical Center 67 61 1 1.64 1.15 1.89 (0.05, 10.53) Average
Saddleback Memorial Medical Center 216 181 1 0.55 1.01 0.72 (0.02, 4.04) Average
St. Joseph Hospital – Orange 273 207 1 0.48 1.18 0.54 (0.01, 3.01) Average St. Jude Medical Center 245 195 2 1.03 1.20 1.13 (0.14, 4.09) Average UC Irvine Medical Center 99 80 2 2.50 1.54 2.13 (0.26, 7.72) Average West Anaheim Medical Center 35 29 0 0.00 1.80 0.00 (0.00, 9.30) Average
Western Medical Center – Santa Ana 101 87 2 2.30 1.67 1.81 (0.22, 6.55) Average
Western Medical Center Hospital – Anaheim 155 129 2 1.55 1.72 1.19 (0.14, 4.30) Average
Greater San Diego
Alvarado Hospital Medical Center 133 104 2 1.92 1.39 1.82 (0.22, 6.59) Average
Palomar Medical Center 154 118 2 1.69 1.24 1.80 (0.22, 6.52) Average Scripps Green Hospital 149 79 1 1.27 1.03 1.62 (0.04, 9.05) Average
50
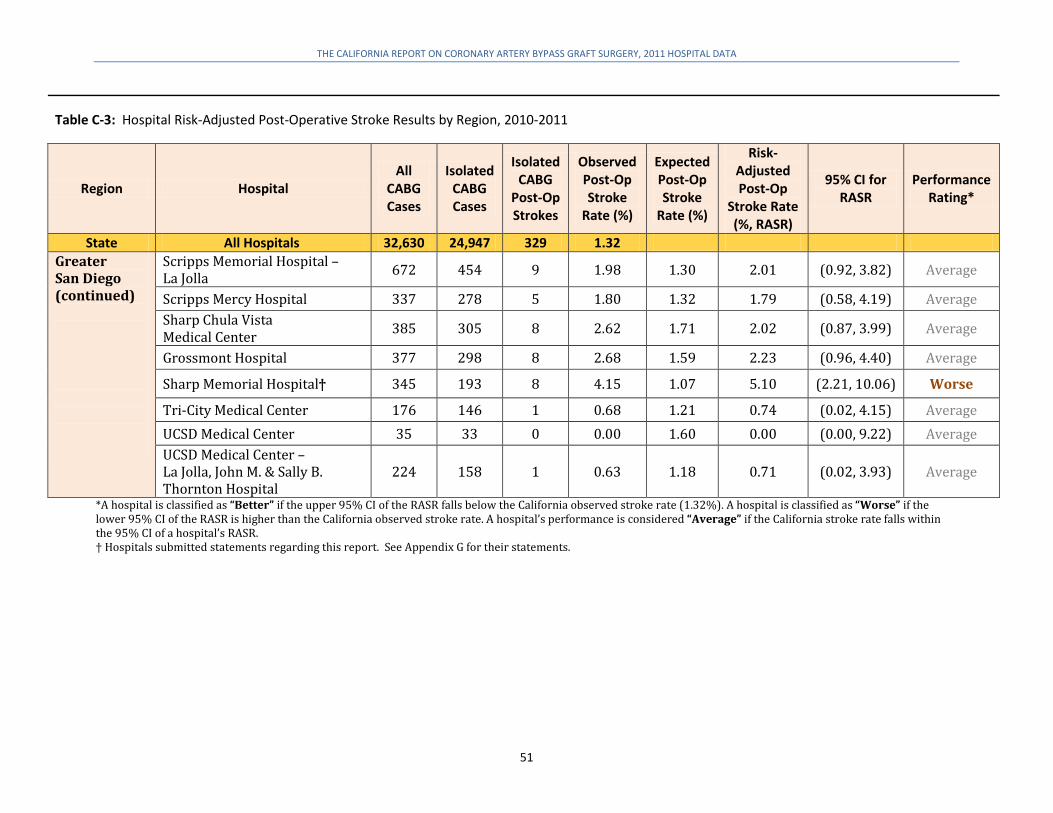
THE CALIFORNIA REPORT ON CORONARY ARTERY BYPASS GRAFT SURGERY, 2011 HOSPITAL DATA
Table C-3: Hospital Risk-Adjusted Post-Operative Stroke Results by Region, 2010-2011
Region Hospital All
CABG Cases
Isolated CABG Cases
Isolated CABG
Post-Op Strokes
Observed Post-Op Stroke
Rate (%)
Expected Post-Op Stroke
Rate (%)
Risk-Adjusted Post-Op
Stroke Rate (%, RASR)
95% CI for RASR
Performance Rating*
State All Hospitals 32,630 24,947 329 1.32 Greater San Diego (continued)
Scripps Memorial Hospital – La Jolla 672 454 9 1.98 1.30 2.01 (0.92, 3.82) Average
Scripps Mercy Hospital 337 278 5 1.80 1.32 1.79 (0.58, 4.19) Average Sharp Chula Vista Medical Center 385 305 8 2.62 1.71 2.02 (0.87, 3.99) Average
Grossmont Hospital 377 298 8 2.68 1.59 2.23 (0.96, 4.40) Average
Sharp Memorial Hospital† 345 193 8 4.15 1.07 5.10 (2.21, 10.06) Worse
Tri-City Medical Center 176 146 1 0.68 1.21 0.74 (0.02, 4.15) Average UCSD Medical Center 35 33 0 0.00 1.60 0.00 (0.00, 9.22) Average UCSD Medical Center – La Jolla, John M. & Sally B. Thornton Hospital
224 158 1 0.63 1.18 0.71 (0.02, 3.93) Average
*A hospital is classified as “Better” if the upper 95% CI of the RASR falls below the California observed stroke rate (1.32%). A hospital is classified as “Worse” if the lower 95% CI of the RASR is higher than the California observed stroke rate. A hospital’s performance is considered “Average” if the California stroke rate falls within the 95% CI of a hospital’s RASR. † Hospitals submitted statements regarding this report. See Appendix G for their statements.
51
THE CALIFORNIA REPORT ON CORONARY ARTERY BYPASS GRAFT SURGERY, 2011 HOSPITAL DATA
Appendix D: Technical Notes for 30-Day Risk-Adjusted Hospital Readmission Results
Risk Model for Adjusting 30-Day Hospital Readmission Rates, 2011 Readmissions account for a significant percentage of hospital healthcare costs. To assess hospital performance on this outcome, CCORP limited the analysis to isolated CABG surgery patients readmitted to an acute care hospital within 30 days of being discharged to home or a non-acute care setting. A readmission was counted only if the patient was readmitted with a principal diagnosis (i.e., principal reason for the readmission) that indicated a heart-related condition, or an infection or a complication that was likely related to the CABG surgery (see Appendix F for a list of principal diagnosis categories and their associated ICD-9-CM codes that were included in the readmissions analysis). Similar to the methodology used to assess the operative mortality and post-operative stroke rate, CCORP used a multivariable logistic regression model to estimate the relationship between each of the demographic and pre-operative risk factors and the probability of 30-day readmission. Multivariable logistic regression models relate the probability of readmission to the risk factor (e.g., patient age) while controlling for all other risk factors in the model. To develop the risk model, the 11,085 isolated (non-salvage) CABG surgery cases discharged alive in 2011 were evaluated for missing data (10,171 cases had no missing data in any field and were used for the risk model parameter estimation). The 914 (8.2%) isolated CABG cases with missing data fields were removed to ensure that the effects of risk factors were estimated based on the most complete data available. To generate the hospital results, missing values for these 914 records were imputed (after risk model parameter estimation) by replacing them with the lowest risk category of the same variable (e.g., Chronic Lung Disease = none). After imputing the missing values, the parameters of the risk model were applied to all cases to estimate each patient’s probability of readmission. CCORP summed these probabilities to estimate the expected readmission for each hospital. The risk model, based on the 2011 data, is presented in Table D-1 with statistically significant risk factors identified in bolded text.
52

THE CALIFORNIA REPORT ON CORONARY ARTERY BYPASS GRAFT SURGERY, 2011 HOSPITAL DATA
Table D-1: Logistic Regression Risk Model for 30-Day Readmission, 2011
Risk Factor Coefficient Standard Error p-value Odds
Ratio Intercept -4.189 0.290 <.0001 Age (Years) 0.012 0.003 0.001 1.012
Gender Male Reference Female 0.346 0.067 <.0001 1.413
Race White Reference Non-White 0.102 0.064 0.108 1.108
Body Mass Index
18.5-39.9 Reference < 18.5 0.196 0.302 0.516 1.216 ≥ 40 0.446 0.128 0.001 1.563
Status of the Procedure Elective Reference Urgent 0.273 0.067 <.0001 1.314 Emergent 0.470 0.155 0.002 1.600
Last Creatinine Level Pre-Op (mg/dl) 0.786 0.099 <.0001 2.194 Hypertension 0.228 0.110 0.038 1.256 Peripheral Arterial Disease 0.195 0.086 0.024 1.215 Cerebrovascular Disease 0.189 0.083 0.022 1.208 Diabetes 0.176 0.065 0.007 1.193
Chronic Lung Disease None/Mild Reference Moderate 0.322 0.122 0.008 1.380 Severe 0.265 0.136 0.052 1.303
Immunosuppressive Treatment 0.441 0.167 0.008 1.554 Arrhythmia Type Afib/Flutter 0.416 0.100 <.0001 1.515 Heart Failure 0.185 0.077 0.017 1.203
Prior Cardiac Surgery None Reference One or more 0.005 0.165 0.977 1.005
Ejection Fraction -0.007 0.002 0.004 0.993
Bolded text indicates statistical significance. Note: “Last Creatinine Level Pre-Op” and “Ejection Fraction” were modeled using piecewise linear transformations.
53
THE CALIFORNIA REPORT ON CORONARY ARTERY BYPASS GRAFT SURGERY, 2011 HOSPITAL DATA
Discrimination of the Risk Model for 30-Day Readmission
Risk models that distinguish well between patients who were readmitted to a hospital and those who were not are said to have good discrimination. A commonly used measure of discrimination is the C-statistic, also known as the area under the Receiver Operating Characteristic (ROC) curve. For all possible pairs of patients, where one patient is readmitted and the other is not readmitted, the C-statistic describes the proportion of pairs where the patient who was readmitted had a higher predicted risk of readmission than the patient who was not. C-statistics range from 0.5 to 1, with higher values indicating better discrimination. For the 2011 risk model, the C-statistic was 0.649. In recently published CABG surgery readmission reports by Pennsylvania (2008-2009 data), the C-statistic was 0.641, which is similar to the 2011 CCORP model.15
Calibration of the Risk Model for 30-Day Readmission
Calibration refers to the ability of a risk model to match predicted readmission with observed readmission. A model in which the number of observed readmissions matches closely with the number of readmissions predicted by the model demonstrates good calibration. Good calibration is essential for accurate risk adjustment. A common measure of calibration is the Hosmer-Lemeshow χ2 test, which compares observed and predicted outcomes over deciles of risk. The p-value of the Hosmer-Lemeshow test statistic for this 2011 risk model is 0.836, indicating adequate calibration. That is, the predicted readmission was consistent with actual readmission in the data. Another way to test model calibration is to partition the data and compare observed readmissions with predicted readmissions in each of 10 risk groups. The 10 risk groups are created by sorting all observations by the predicted risk of readmission and then dividing the sorted observations into deciles of approximately equal size. As presented in Table D-2, Risk Group 1 shows the patients in the lowest risk group. Among the 1,017 patients in this group, 56 patients were readmitted to hospital, but the model predicted 62.7 readmissions. Assuming a Poisson distribution for a binary outcome, the predicted range of deaths for Risk Group 1 is 47.2 to 78.3. The observed number of 56 readmissions falls within the range of predicted readmissions. In fact, none of the 10 risk groups had significantly fewer or significantly more readmissions than were predicted by the model. Overall, the risk model shows no systematic underestimation or overestimation of readmission at the extremes.
15 http://www.phc4.org/reports/cabg
54
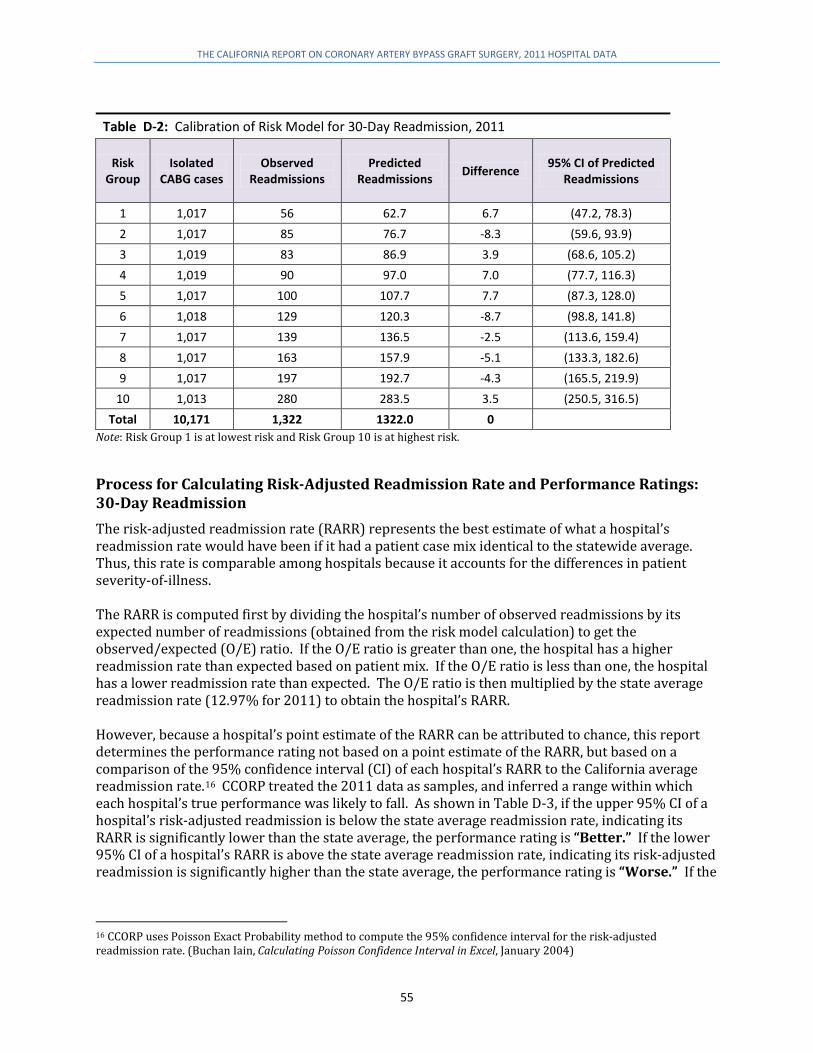
THE CALIFORNIA REPORT ON CORONARY ARTERY BYPASS GRAFT SURGERY, 2011 HOSPITAL DATA
Table D-2: Calibration of Risk Model for 30-Day Readmission, 2011
Risk Group
Isolated CABG cases
Observed Readmissions
Predicted Readmissions Difference 95% CI of Predicted
Readmissions
1 1,017 56 62.7 6.7 (47.2, 78.3) 2 1,017 85 76.7 -8.3 (59.6, 93.9) 3 1,019 83 86.9 3.9 (68.6, 105.2) 4 1,019 90 97.0 7.0 (77.7, 116.3) 5 1,017 100 107.7 7.7 (87.3, 128.0) 6 1,018 129 120.3 -8.7 (98.8, 141.8) 7 1,017 139 136.5 -2.5 (113.6, 159.4) 8 1,017 163 157.9 -5.1 (133.3, 182.6) 9 1,017 197 192.7 -4.3 (165.5, 219.9)
10 1,013 280 283.5 3.5 (250.5, 316.5) Total 10,171 1,322 1322.0 0
Note: Risk Group 1 is at lowest risk and Risk Group 10 is at highest risk.
Process for Calculating Risk-Adjusted Readmission Rate and Performance Ratings: 30-Day Readmission The risk-adjusted readmission rate (RARR) represents the best estimate of what a hospital’s readmission rate would have been if it had a patient case mix identical to the statewide average. Thus, this rate is comparable among hospitals because it accounts for the differences in patient severity-of-illness. The RARR is computed first by dividing the hospital’s number of observed readmissions by its expected number of readmissions (obtained from the risk model calculation) to get the observed/expected (O/E) ratio. If the O/E ratio is greater than one, the hospital has a higher readmission rate than expected based on patient mix. If the O/E ratio is less than one, the hospital has a lower readmission rate than expected. The O/E ratio is then multiplied by the state average readmission rate (12.97% for 2011) to obtain the hospital’s RARR. However, because a hospital’s point estimate of the RARR can be attributed to chance, this report determines the performance rating not based on a point estimate of the RARR, but based on a comparison of the 95% confidence interval (CI) of each hospital’s RARR to the California average readmission rate.16 CCORP treated the 2011 data as samples, and inferred a range within which each hospital’s true performance was likely to fall. As shown in Table D-3, if the upper 95% CI of a hospital’s risk-adjusted readmission is below the state average readmission rate, indicating its RARR is significantly lower than the state average, the performance rating is “Better.” If the lower 95% CI of a hospital’s RARR is above the state average readmission rate, indicating its risk-adjusted readmission is significantly higher than the state average, the performance rating is “Worse.” If the
16 CCORP uses Poisson Exact Probability method to compute the 95% confidence interval for the risk-adjusted readmission rate. (Buchan Iain, Calculating Poisson Confidence Interval in Excel, January 2004)
55

THE CALIFORNIA REPORT ON CORONARY ARTERY BYPASS GRAFT SURGERY, 2011 HOSPITAL DATA
state average readmission rate is within the 95% CI of a hospital’s RARR, the performance rating is “Average.” See the following section for a detailed discussion of results.
Statistical Details of 30-Day Risk-Adjusted Readmission Results, 2011 Table D-3 presents the risk-adjusted readmission rate (RARR) results for each hospital for 2011. The table is sorted by geographic region and contains, for each hospital, the total number of CABG surgeries performed (isolated and non-isolated combined), the number of patients discharged alive after isolated CABG surgeries (excluding salvage patients), the number of observed isolated CABG readmissions, observed readmission rate, expected readmission rate predicted by the risk model, RARR and 95% CI of the RARR, and the associated hospital performance rating. Among the 11,085 isolated (non-salvage) CABG surgeries performed in 2010 who were discharged alive, 1,438 patients were readmitted to the same or another acute care hospital within 30 days of the surgery date, reflecting an overall readmission rate of 12.97%. The observed readmission rates among hospitals ranged from 0% to 32.43%. The expected readmission rates, which are generated by the risk model and account for patient severity of illness, range between 9.55% and 17.06%. The RARR, which measures hospital performance, ranged from 0% to 33.05%. Based on the 95% confidence intervals for risk-adjusted readmission rates, 116 of 122 hospitals (95%) performed within the expected range compared to the state’s overall readmission rate (denoted by “Average” in the performance rating column of Table D-3), two hospitals performed significantly “Better” than the state average, and four hospitals performed significantly “Worse” than the state average. Hospitals marked with † in Table D-3 submitted statements regarding this report (presented in Appendix G).
Definitions of Table D-3 Terms
All CABG Cases: The total number of isolated and non-isolated CABG cases submitted to CCORP for 2011. Non-isolated CABG cases are not used in calculating performance ratings. Isolated CABG Cases (Discharged Alive): The number of isolated CABGs submitted to CCORP for 2011, where the patient was discharged alive from a CABG hospital and could be followed up via hospital patient discharge data (PDD) in 2011-2012. The following patients were excluded: patients in salvage operative status, patients who were transferred to acute care, and patients who left against medical advice. Isolated CABG Readmissions: The number of hospital readmissions within 30 days of being discharged from the hospital where an isolated CABG operation was performed, irrespective of the hospital to which they were readmitted. A readmission was included only if the patient was readmitted with a principal diagnosis that indicated a heart-related condition, an infection, or a complication that was likely related to the CABG surgery. Readmission was attributed to the hospital performing the initial CABG surgery. Observed Readmission Rate: The ratio of the number of isolated CABG readmissions within 30 days of discharge and the discharged-alive isolated CABG cases multiplied by 100: Observed Readmission Rate = Isolated CABG Readmissions within 30 Days of Discharge/Isolated CABG Cases (Discharged Alive) × 100.
56
THE CALIFORNIA REPORT ON CORONARY ARTERY BYPASS GRAFT SURGERY, 2011 HOSPITAL DATA
Expected Readmission Rate: The ratio of the expected number of readmissions predicted for a hospital (after adjusting for their patient population) and the discharged-alive isolated CABG cases multiplied by 100: Expected Readmission Rate = Expected Readmissions/Isolated CABG Cases (Discharged Alive) × 100. Risk-Adjusted Readmission Rate (95% CI): The Risk-Adjusted Readmission Rate (RARR) is obtained by multiplying the state average readmission rate by a hospital's O/E ratio. The 95% confidence interval represents the confidence in the estimate of the RARR. The lower and upper confidence limits are calculated using Poisson exact confidence interval calculations. Performance Rating: The performance rating is based on a comparison of each hospital's risk-adjusted readmission rate and the state observed readmission rate. This is a test of statistical significance. A hospital is classified as "Better" if the upper 95% confidence limit of its RARR falls below the California observed readmission rate. A hospital is classified as "Worse" if the lower 95% confidence limit of its RARR is higher than the California observed readmission rate. A hospital is classified as "Average" if the California readmission rate falls within the confidence interval of the hospital's risk-adjusted readmission rate.
57

THE CALIFORNIA REPORT ON CORONARY ARTERY BYPASS GRAFT SURGERY, 2011 HOSPITAL DATA
Table D-3: Hospital Risk-Adjusted Readmission Results by Region, 2011
Region Hospital All
CABG Cases
Isolated CABG Cases
Isolated CABG
Readmission
Observed Readmission
Rate (%)
Expected Readmission
Rate (%)
Risk-Adjusted
Readmission Rate
(%, RARR)
95% CI for RARR
Performance Rating*
State All Hospitals 16,284 11,085 1,438 12.97 Sacramento Valley & Northern California Region
Enloe Medical Center – Esplanade Campus 175 145 24 16.55 12.42 17.28 (11.07, 25.71) Average
Mercy General Hospital 803 444 41 9.23 11.94 10.03 (7.20, 13.61) Average Mercy Medical Center – Redding 145 97 8 8.25 12.39 8.63 (3.73, 17.01) Average
Mercy San Juan Hospital 185 118 12 10.17 11.57 11.40 (5.89, 19.91) Average
Rideout Memorial Hospital 123 83 11 13.25 11.96 14.38 (7.18, 25.72) Average Shasta Regional Medical Center 66 54 8 14.81 12.86 14.95 (6.45, 29.45) Average
St. Joseph Hospital – Eureka 37 32 2 6.25 14.59 5.56 (0.67, 20.07) Average
Sutter Memorial Hospital 454 291 34 11.68 12.09 12.54 (8.68, 17.51) Average
UC Davis Medical Center 141 86 6 6.98 11.62 7.79 (2.86, 16.95) Average San Francisco Bay Area & San Jose
Alta Bates Summit Medical Center – Summit Campus –Hawthorne
169 109 18 16.51 14.04 15.26 (9.04, 24.11) Average
California Pacific Medical Center – Pacific Campus 72 31 1 3.23 11.53 3.63 (0.09, 20.22) Average
Community Hospital Monterey Peninsula 82 57 6 10.53 11.45 11.92 (4.37, 25.94) Average
Dominican Hospital – Santa Cruz/Soquel 59 40 6 15.00 10.58 18.40 (6.75, 40.04) Average
El Camino Hospital 115 61 7 11.48 11.29 13.18 (5.30, 27.16) Average Good Samaritan Hospital – San Jose 87 59 10 16.95 12.45 17.66 (8.47, 32.48) Average
58
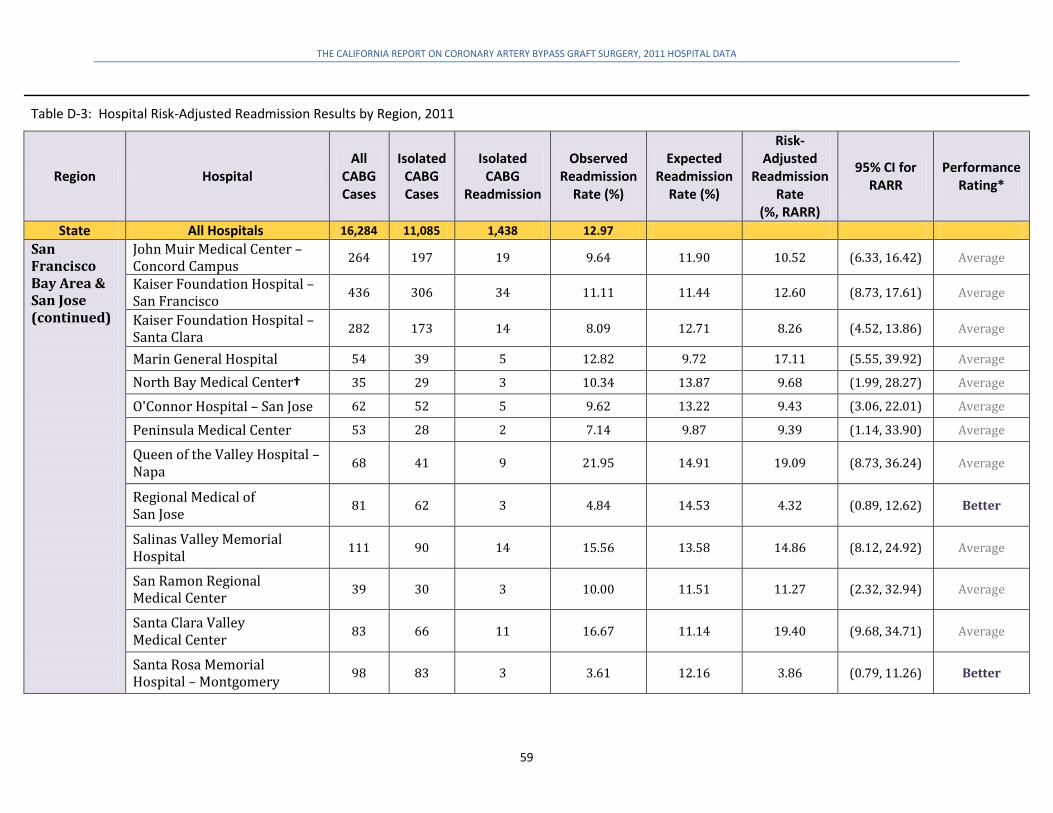
THE CALIFORNIA REPORT ON CORONARY ARTERY BYPASS GRAFT SURGERY, 2011 HOSPITAL DATA
Table D-3: Hospital Risk-Adjusted Readmission Results by Region, 2011
Region Hospital All
CABG Cases
Isolated CABG Cases
Isolated CABG
Readmission
Observed Readmission
Rate (%)
Expected Readmission
Rate (%)
Risk-Adjusted
Readmission Rate
(%, RARR)
95% CI for RARR
Performance Rating*
State All Hospitals 16,284 11,085 1,438 12.97 San Francisco Bay Area & San Jose (continued)
John Muir Medical Center – Concord Campus 264 197 19 9.64 11.90 10.52 (6.33, 16.42) Average
Kaiser Foundation Hospital – San Francisco 436 306 34 11.11 11.44 12.60 (8.73, 17.61) Average
Kaiser Foundation Hospital – Santa Clara 282 173 14 8.09 12.71 8.26 (4.52, 13.86) Average
Marin General Hospital 54 39 5 12.82 9.72 17.11 (5.55, 39.92) Average
North Bay Medical Center† 35 29 3 10.34 13.87 9.68 (1.99, 28.27) Average
O'Connor Hospital – San Jose 62 52 5 9.62 13.22 9.43 (3.06, 22.01) Average
Peninsula Medical Center 53 28 2 7.14 9.87 9.39 (1.14, 33.90) Average
Queen of the Valley Hospital – Napa 68 41 9 21.95 14.91 19.09 (8.73, 36.24) Average
Regional Medical of San Jose 81 62 3 4.84 14.53 4.32 (0.89, 12.62) Better
Salinas Valley Memorial Hospital 111 90 14 15.56 13.58 14.86 (8.12, 24.92) Average
San Ramon Regional Medical Center 39 30 3 10.00 11.51 11.27 (2.32, 32.94) Average
Santa Clara Valley Medical Center 83 66 11 16.67 11.14 19.40 (9.68, 34.71) Average
Santa Rosa Memorial Hospital – Montgomery 98 83 3 3.61 12.16 3.86 (0.79, 11.26) Better
59
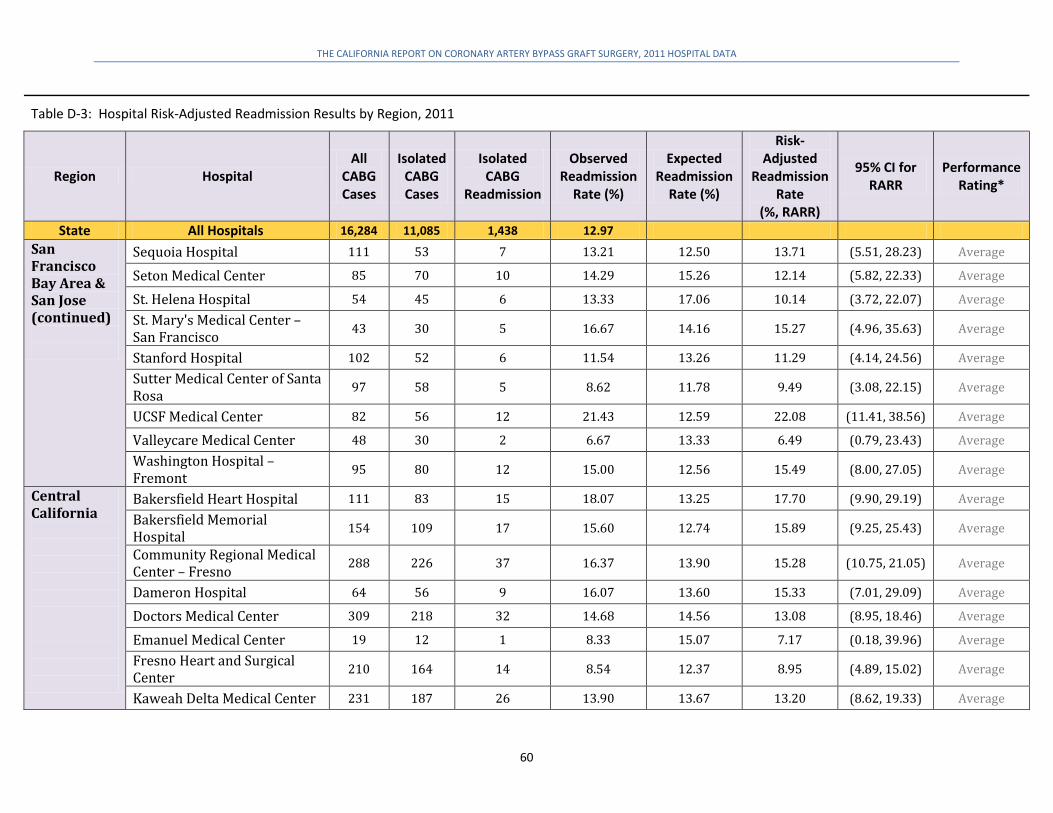
THE CALIFORNIA REPORT ON CORONARY ARTERY BYPASS GRAFT SURGERY, 2011 HOSPITAL DATA
Table D-3: Hospital Risk-Adjusted Readmission Results by Region, 2011
Region Hospital All
CABG Cases
Isolated CABG Cases
Isolated CABG
Readmission
Observed Readmission
Rate (%)
Expected Readmission
Rate (%)
Risk-Adjusted
Readmission Rate
(%, RARR)
95% CI for RARR
Performance Rating*
State All Hospitals 16,284 11,085 1,438 12.97 San Francisco Bay Area & San Jose (continued)
Sequoia Hospital 111 53 7 13.21 12.50 13.71 (5.51, 28.23) Average
Seton Medical Center 85 70 10 14.29 15.26 12.14 (5.82, 22.33) Average
St. Helena Hospital 54 45 6 13.33 17.06 10.14 (3.72, 22.07) Average St. Mary's Medical Center – San Francisco 43 30 5 16.67 14.16 15.27 (4.96, 35.63) Average
Stanford Hospital 102 52 6 11.54 13.26 11.29 (4.14, 24.56) Average Sutter Medical Center of Santa Rosa 97 58 5 8.62 11.78 9.49 (3.08, 22.15) Average
UCSF Medical Center 82 56 12 21.43 12.59 22.08 (11.41, 38.56) Average
Valleycare Medical Center 48 30 2 6.67 13.33 6.49 (0.79, 23.43) Average Washington Hospital – Fremont 95 80 12 15.00 12.56 15.49 (8.00, 27.05) Average
Central California
Bakersfield Heart Hospital 111 83 15 18.07 13.25 17.70 (9.90, 29.19) Average Bakersfield Memorial Hospital 154 109 17 15.60 12.74 15.89 (9.25, 25.43) Average
Community Regional Medical Center – Fresno 288 226 37 16.37 13.90 15.28 (10.75, 21.05) Average
Dameron Hospital 64 56 9 16.07 13.60 15.33 (7.01, 29.09) Average
Doctors Medical Center 309 218 32 14.68 14.56 13.08 (8.95, 18.46) Average
Emanuel Medical Center 19 12 1 8.33 15.07 7.17 (0.18, 39.96) Average Fresno Heart and Surgical Center 210 164 14 8.54 12.37 8.95 (4.89, 15.02) Average
Kaweah Delta Medical Center 231 187 26 13.90 13.67 13.20 (8.62, 19.33) Average
60

THE CALIFORNIA REPORT ON CORONARY ARTERY BYPASS GRAFT SURGERY, 2011 HOSPITAL DATA
Table D-3: Hospital Risk-Adjusted Readmission Results by Region, 2011
Region Hospital All
CABG Cases
Isolated CABG Cases
Isolated CABG
Readmission
Observed Readmission
Rate (%)
Expected Readmission
Rate (%)
Risk-Adjusted
Readmission Rate
(%, RARR)
95% CI for RARR
Performance Rating*
State All Hospitals 16,284 11,085 1,438 12.97 Central California (continued)
Marian Medical Center 68 50 5 10.00 11.86 10.94 (3.55, 25.52) Average Memorial Hospital Medical Center – Modesto 236 173 16 9.25 13.52 8.87 (5.07, 14.41) Average
San Joaquin Community Hospital 83 70 15 21.43 15.47 17.97 (10.05, 29.63) Average
St. Agnes Medical Center 331 240 25 10.42 13.30 10.16 (6.58, 15.00) Average St. Joseph's Medical Center of Stockton 313 233 32 13.73 14.44 12.34 (8.44, 17.42) Average
San Fernando Valley, Antelope Valley, Ventura & Santa Barbara
Antelope Valley Hospital 30 22 3 13.64 10.99 16.09 (3.32, 47.01) Average Community Memorial Hospital of San Buenaventura 56 41 8 19.51 13.83 18.31 (7.90, 36.06) Average
French Hospital Medical Center 107 68 12 17.65 13.10 17.48 (9.03, 30.53) Average
Glendale Adventist Medical Center – Wilson Terrace 134 95 15 15.79 11.28 18.15 (10.16, 29.93) Average
Glendale Memorial Hospital and Health Center 117 98 11 11.22 12.82 11.36 (5.67, 20.32) Average
Los Robles Hospital and Medical Center 78 45 7 15.56 13.43 15.03 (6.04, 30.96) Average
Northridge Hospital Medical Center 87 62 12 19.35 14.47 17.35 (8.96, 30.30) Average
Palmdale Regional Medical Center 9 7 2 28.57 11.96 30.99 (3.75, 100.0) Average
Providence Holy Cross Medical Center 67 50 9 18.00 14.79 15.79 (7.22, 29.96) Average
61

THE CALIFORNIA REPORT ON CORONARY ARTERY BYPASS GRAFT SURGERY, 2011 HOSPITAL DATA
Table D-3: Hospital Risk-Adjusted Readmission Results by Region, 2011
Region Hospital All
CABG Cases
Isolated CABG Cases
Isolated CABG
Readmission
Observed Readmission
Rate (%)
Expected Readmission
Rate (%)
Risk-Adjusted
Readmission Rate
(%, RARR)
95% CI for RARR
Performance Rating*
State All Hospitals 16,284 11,085 1,438 12.97 San Fernando Valley, Antelope Valley, Ventura & Santa Barbara (continued)
Providence St. Joseph Medical Center 70 43 3 6.98 11.47 7.89 (1.63, 23.05) Average
Providence Tarzana Medical Center 68 50 6 12.00 11.59 13.43 (4.93, 29.22) Average
Santa Barbara Cottage Hospital 111 79 9 11.39 12.22 12.09 (5.53, 22.95) Average
St. John's Regional Medical Center 80 59 9 15.25 14.32 13.82 (6.32, 26.23) Average
Valley Presbyterian Hospital 61 51 7 13.73 13.55 13.14 (5.28, 27.07) Average
West Hills Hospital and Medical Center 64 52 13 25.00 13.30 24.38 (12.98, 41.68) Worse
Greater Los Angeles
Beverly Hospital 23 16 2 12.50 14.07 11.52 (1.40, 41.61) Average Cedars Sinai Medical Center 184 94 11 11.70 10.09 15.04 (7.51, 26.90) Average
Centinela Hospital Medical Center 17 11 3 27.27 15.23 23.23 (4.79, 67.87) Average
Citrus Valley Medical Center – IC Campus 124 92 10 10.87 13.31 10.60 (5.08, 19.48) Average
Downey Regional Medical Center 35 32 6 18.75 11.86 20.52 (7.53, 44.65) Average
Garfield Medical Center 132 92 15 16.30 13.23 15.98 (8.94, 26.36) Average Good Samaritan Hospital – Los Angeles 117 68 13 19.12 14.38 17.25 (9.18, 29.49) Average
Hollywood Presbyterian Medical Center 22 10 3 30.00 11.96 32.54 (6.71, 95.07) Average
62
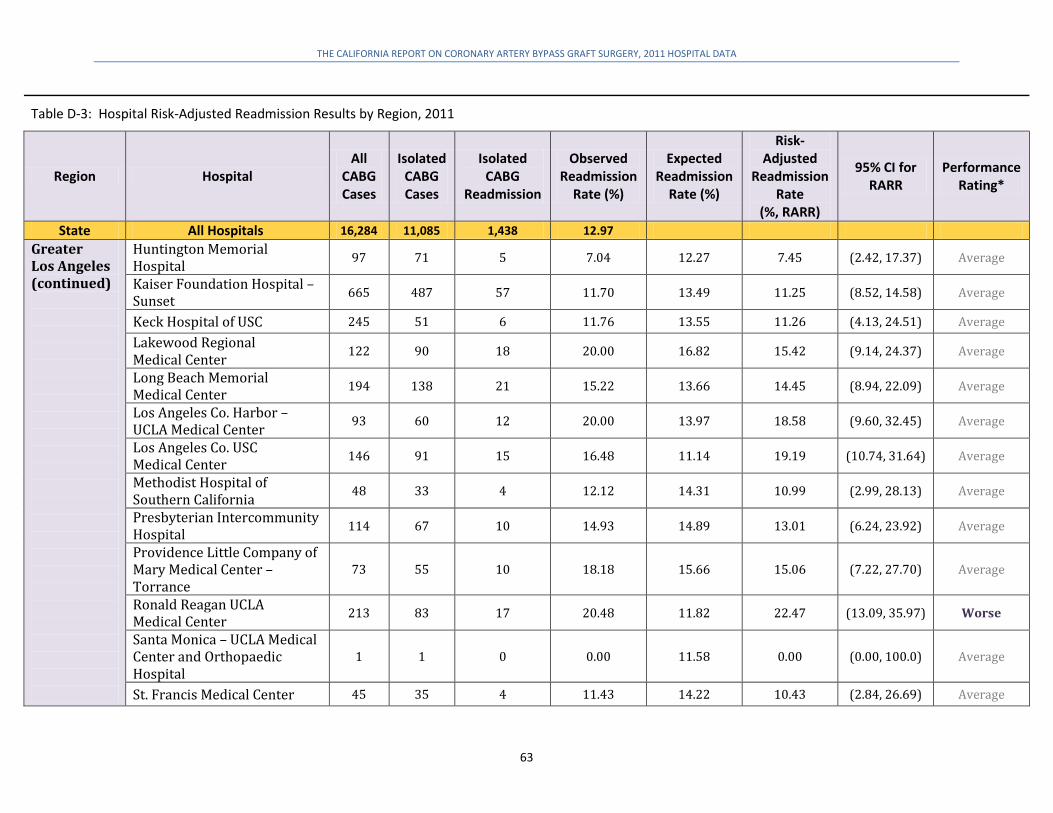
THE CALIFORNIA REPORT ON CORONARY ARTERY BYPASS GRAFT SURGERY, 2011 HOSPITAL DATA
Table D-3: Hospital Risk-Adjusted Readmission Results by Region, 2011
Region Hospital All
CABG Cases
Isolated CABG Cases
Isolated CABG
Readmission
Observed Readmission
Rate (%)
Expected Readmission
Rate (%)
Risk-Adjusted
Readmission Rate
(%, RARR)
95% CI for RARR
Performance Rating*
State All Hospitals 16,284 11,085 1,438 12.97 Greater Los Angeles (continued)
Huntington Memorial Hospital 97 71 5 7.04 12.27 7.45 (2.42, 17.37) Average
Kaiser Foundation Hospital – Sunset 665 487 57 11.70 13.49 11.25 (8.52, 14.58) Average
Keck Hospital of USC 245 51 6 11.76 13.55 11.26 (4.13, 24.51) Average Lakewood Regional Medical Center 122 90 18 20.00 16.82 15.42 (9.14, 24.37) Average
Long Beach Memorial Medical Center 194 138 21 15.22 13.66 14.45 (8.94, 22.09) Average
Los Angeles Co. Harbor – UCLA Medical Center 93 60 12 20.00 13.97 18.58 (9.60, 32.45) Average
Los Angeles Co. USC Medical Center 146 91 15 16.48 11.14 19.19 (10.74, 31.64) Average
Methodist Hospital of Southern California 48 33 4 12.12 14.31 10.99 (2.99, 28.13) Average
Presbyterian Intercommunity Hospital 114 67 10 14.93 14.89 13.01 (6.24, 23.92) Average
Providence Little Company of Mary Medical Center – Torrance
73 55 10 18.18 15.66 15.06 (7.22, 27.70) Average
Ronald Reagan UCLA Medical Center 213 83 17 20.48 11.82 22.47 (13.09, 35.97) Worse
Santa Monica – UCLA Medical Center and Orthopaedic Hospital
1 1 0 0.00 11.58 0.00 (0.00, 100.0) Average
St. Francis Medical Center 45 35 4 11.43 14.22 10.43 (2.84, 26.69) Average
63
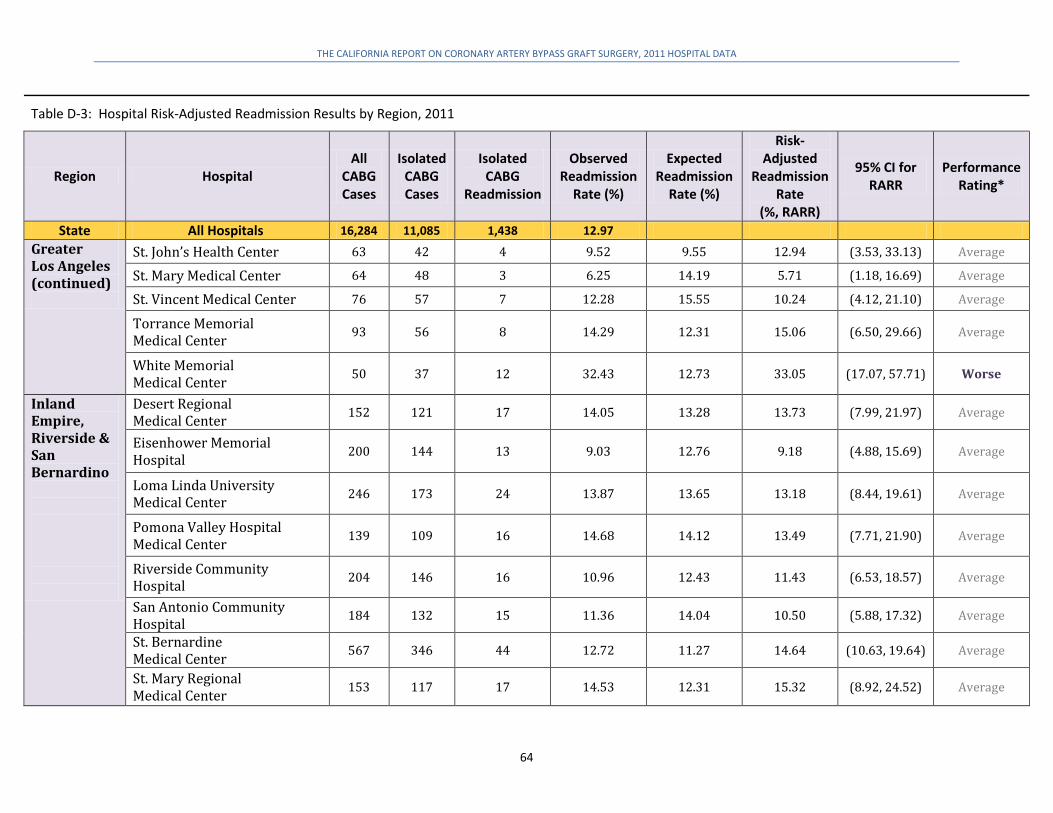
THE CALIFORNIA REPORT ON CORONARY ARTERY BYPASS GRAFT SURGERY, 2011 HOSPITAL DATA
Table D-3: Hospital Risk-Adjusted Readmission Results by Region, 2011
Region Hospital All
CABG Cases
Isolated CABG Cases
Isolated CABG
Readmission
Observed Readmission
Rate (%)
Expected Readmission
Rate (%)
Risk-Adjusted
Readmission Rate
(%, RARR)
95% CI for RARR
Performance Rating*
State All Hospitals 16,284 11,085 1,438 12.97 Greater Los Angeles (continued)
St. John’s Health Center 63 42 4 9.52 9.55 12.94 (3.53, 33.13) Average
St. Mary Medical Center 64 48 3 6.25 14.19 5.71 (1.18, 16.69) Average
St. Vincent Medical Center 76 57 7 12.28 15.55 10.24 (4.12, 21.10) Average
Torrance Memorial Medical Center 93 56 8 14.29 12.31 15.06 (6.50, 29.66) Average
White Memorial Medical Center 50 37 12 32.43 12.73 33.05 (17.07, 57.71) Worse
Inland Empire, Riverside & San Bernardino
Desert Regional Medical Center 152 121 17 14.05 13.28 13.73 (7.99, 21.97) Average
Eisenhower Memorial Hospital 200 144 13 9.03 12.76 9.18 (4.88, 15.69) Average
Loma Linda University Medical Center 246 173 24 13.87 13.65 13.18 (8.44, 19.61) Average
Pomona Valley Hospital Medical Center 139 109 16 14.68 14.12 13.49 (7.71, 21.90) Average
Riverside Community Hospital 204 146 16 10.96 12.43 11.43 (6.53, 18.57) Average
San Antonio Community Hospital 184 132 15 11.36 14.04 10.50 (5.88, 17.32) Average
St. Bernardine Medical Center 567 346 44 12.72 11.27 14.64 (10.63, 19.64) Average
St. Mary Regional Medical Center 153 117 17 14.53 12.31 15.32 (8.92, 24.52) Average
64

THE CALIFORNIA REPORT ON CORONARY ARTERY BYPASS GRAFT SURGERY, 2011 HOSPITAL DATA
Table D-3: Hospital Risk-Adjusted Readmission Results by Region, 2011
Region Hospital All
CABG Cases
Isolated CABG Cases
Isolated CABG
Readmission
Observed Readmission
Rate (%)
Expected Readmission
Rate (%)
Risk-Adjusted
Readmission Rate
(%, RARR)
95% CI for RARR
Performance Rating*
State All Hospitals 16,284 11,085 1,438 12.97 Orange County
AHMC Anaheim Regional Medical Center 164 104 15 14.42 15.16 12.34 (6.91, 20.35) Average
Fountain Valley Regional Hospital and Medical Center – Euclid
132 112 20 17.86 14.79 15.66 (9.57, 24.18) Average
Hoag Memorial Hospital Presbyterian 197 118 8 6.78 11.38 7.73 (3.34, 15.22) Average
Mission Hospital Regional Medical Center 149 108 10 9.26 9.84 12.20 (5.85, 22.43) Average
Orange Coast Memorial Medical Center 49 39 5 12.82 11.95 13.91 (4.52, 32.47) Average
Saddleback Memorial Medical Center 104 83 17 20.48 11.80 22.51 (13.11, 36.04) Worse
St. Joseph Hospital – Orange 142 93 10 10.75 12.75 10.94 (5.25, 20.12) Average
St. Jude Medical Center 105 81 4 4.94 10.86 5.90 (1.61, 15.11) Average
UC Irvine Medical Center 63 42 5 11.90 13.42 11.51 (3.74, 26.85) Average West Anaheim Medical Center 25 15 2 13.33 15.00 11.53 (1.40, 41.65) Average
Western Medical Center – Santa Ana 59 44 7 15.91 12.30 16.78 (6.75, 34.57) Average
Western Medical Center Hospital – Anaheim 81 61 7 11.48 15.79 9.43 (3.79, 19.42) Average
Greater San Diego
Alvarado Hospital Medical Center 61 40 5 12.50 13.77 11.78 (3.82, 27.48) Average
Palomar Medical Center 66 45 6 13.33 13.18 13.13 (4.82, 28.57) Average
65
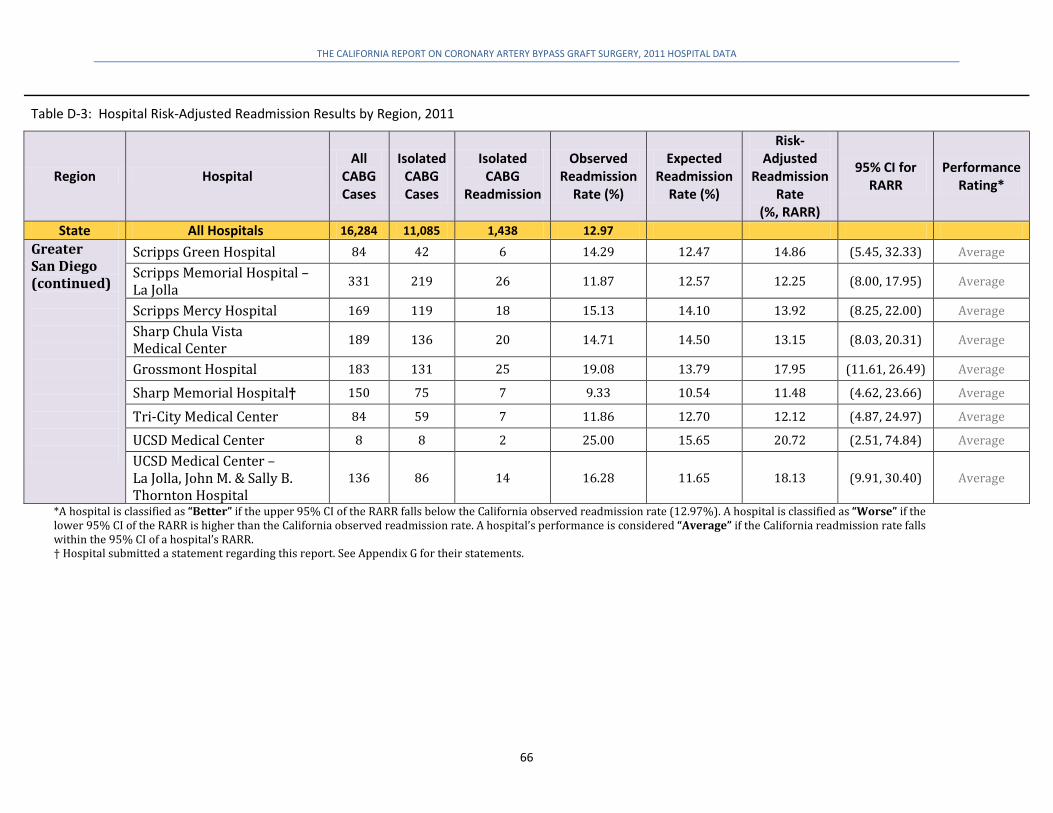
THE CALIFORNIA REPORT ON CORONARY ARTERY BYPASS GRAFT SURGERY, 2011 HOSPITAL DATA
Table D-3: Hospital Risk-Adjusted Readmission Results by Region, 2011
Region Hospital All
CABG Cases
Isolated CABG Cases
Isolated CABG
Readmission
Observed Readmission
Rate (%)
Expected Readmission
Rate (%)
Risk-Adjusted
Readmission Rate
(%, RARR)
95% CI for RARR
Performance Rating*
State All Hospitals 16,284 11,085 1,438 12.97 Greater San Diego (continued)
Scripps Green Hospital 84 42 6 14.29 12.47 14.86 (5.45, 32.33) Average Scripps Memorial Hospital – La Jolla 331 219 26 11.87 12.57 12.25 (8.00, 17.95) Average
Scripps Mercy Hospital 169 119 18 15.13 14.10 13.92 (8.25, 22.00) Average Sharp Chula Vista Medical Center 189 136 20 14.71 14.50 13.15 (8.03, 20.31) Average
Grossmont Hospital 183 131 25 19.08 13.79 17.95 (11.61, 26.49) Average
Sharp Memorial Hospital† 150 75 7 9.33 10.54 11.48 (4.62, 23.66) Average
Tri-City Medical Center 84 59 7 11.86 12.70 12.12 (4.87, 24.97) Average
UCSD Medical Center 8 8 2 25.00 15.65 20.72 (2.51, 74.84) Average UCSD Medical Center – La Jolla, John M. & Sally B. Thornton Hospital
136 86 14 16.28 11.65 18.13 (9.91, 30.40) Average
*A hospital is classified as “Better” if the upper 95% CI of the RARR falls below the California observed readmission rate (12.97%). A hospital is classified as “Worse” if the lower 95% CI of the RARR is higher than the California observed readmission rate. A hospital’s performance is considered “Average” if the California readmission rate falls within the 95% CI of a hospital’s RARR. † Hospital submitted a statement regarding this report. See Appendix G for their statements.
66

THE CALIFORNIA REPORT ON CORONARY ARTERY BYPASS GRAFT SURGERY, 2011 HOSPITAL DATA
Appendix E: Statistical Details of Internal Mammary Artery Usage by Hospital, 2011: A Process Measure of Quality
A widely accepted definition of healthcare quality measurement contains three dimensions: process, structure, and outcomes.17 In addition to publishing hospital outcomes (risk-adjusted operative mortality rates, risk-adjusted post-operative stroke rates, and risk-adjusted readmission rates), this report also assesses a process of care measure by reporting hospital use of the internal mammary artery (IMA) in surgery. Although outcomes measurement permits comparison of hospital performance and can be used for investigating internal processes and structures, assessing the process of care provides a more immediate path to improvement in patient care since it involves measurement of the care patients actually receive. If diagnostic and therapeutic strategies with clear links to outcomes are monitored, some healthcare quality problems can be detected long before demonstrable health outcome differences occur. In most cases of first-time isolated CABG surgery where the operative status is elective or urgent, the surgeon has the option of using the IMA (also known as the internal thoracic artery). Clinical literature strongly supports use of the IMA to promote long-term graft patency (durability) and patient survival. Recent research also suggests a reduction in immediate operative mortality associated with use of the internal mammary artery rather than saphenous (leg) vein revascularization.18 The IMA, and especially the left IMA, is considered the preferred conduit for CABG surgery of the left anterior descending (LAD) coronary artery. Many national organizations encourage use of the IMA when appropriate. Currently, the Leapfrog Evidence-Based Hospital Referral program endorses the goal of 80% hospital adherence to IMA use. The National Quality Forum (NQF) does not endorse a specific rate, but states that the goal is to raise the IMA usage rates of hospitals with low utilization. The Society of Thoracic Surgeons (STS) states that IMA use should be given primary consideration in every CABG surgery patient. Furthermore, a number of healthcare quality advocates recommend public reporting of IMA usage rates for CABG surgery. Table E-1 presents hospital results for usage of the IMA by region for 2011. Only first-time isolated CABG surgeries where the operative status is elective or urgent and the LAD was bypassed are included in calculating IMA usage rates. The statewide IMA usage rate was slightly higher (96.65% in 2011 vs. 95.99%). Five hospitals received a “Low” rating for 2011. Hospital IMA usage rates above the statewide average rate are not rated because there is no consensus on what constitutes an optimal IMA usage rate. Hospitals marked with † in Table E-1 submitted statements regarding this report. Their statements are presented in Appendix G.
Definitions of Table E-1 Terms
Isolated CABG Cases (eligible for IMA grafts): This is a subset of total isolated CABG surgeries and includes only first-time non-cardiogenic shock isolated CABG surgeries for 2011 where the operative status was elective or urgent and the left anterior descending (LAD) artery was bypassed. Therefore, this number will be smaller than the total isolated CABG cases performed by the hospital.
17 Donabedian A. Evaluating the Quality of Medical Care. The Milbank Quarterly, 2005; 83(4):691-729. 18 Ferguson TB Jr., Coombs LP, Peterson ED. “Internal thoracic artery grafting in the elderly patient undergoing coronary artery bypass grafting: room for process improvement?” Journal of Thoracic and Cardiovascular Surgery, 2002; 123(5):869-80.
67

THE CALIFORNIA REPORT ON CORONARY ARTERY BYPASS GRAFT SURGERY, 2011 HOSPITAL DATA
IMA Usage Rate: The ratio of the number of eligible isolated CABG surgeries with IMA grafts (including left IMA, right IMA and bilateral IMA) and isolated CABG cases eligible for IMA grafts multiplied by 100: Percent IMA use = Isolated CABG Surgeries with IMA Grafts/Isolated CABG Cases eligible for IMA Grafts × 100. Performance Rating: A blank rating indicates that the IMA usage rate is acceptable. A “Low” rating indicates that the IMA usage rate for a hospital is less than 86.53%, i.e., two standard deviations (0.0516 × 1.96) below the state average IMA usage rate (96.65%). IMA usage rates above the state average IMA usage rate was not evaluated because there is no consensus on what constitutes an optimal rate of usage.
Table E-1: Hospital Internal Mammary Artery Usage Results by Region, 2011
Region Hospital Isolated CABGs*
Percent IMA Use RankƗ
State All Hospitals 10,978 96.65% Sacramento Valley & Northern California Region
Enloe Medical Center – Esplanade Campus 121 95.04% Mercy General Hospital 487 98.97% Mercy Medical Center – Redding 60 100.00% Mercy San Juan Hospital 118 98.31% Rideout Memorial Hospital 80 97.50% Shasta Regional Medical Center 52 92.31% St. Joseph Hospital – Eureka 28 96.43% Sutter Memorial Hospital 285 97.54% UC Davis Medical Center 92 97.83%
San Francisco Bay Area & San Jose
Alta Bates Summit Medical Center – Summit Campus – Hawthorne 118 100.00% California Pacific Medical Center – Pacific Campus 36 97.22% Community Hospital Monterey Peninsula 57 98.25% Dominican Hospital – Santa Cruz/Soquel 43 95.35% El Camino Hospital 59 100.00% Good Samaritan Hospital – San Jose 54 98.15% John Muir Medical Center – Concord Campus 186 97.85% Kaiser Foundation Hospital – San Francisco 301 98.34% Kaiser Foundation Hospital – Santa Clara 170 97.65% Marin General Hospital 41 75.61% Low North Bay Medical Center† 32 100.00%
68

THE CALIFORNIA REPORT ON CORONARY ARTERY BYPASS GRAFT SURGERY, 2011 HOSPITAL DATA
Table E-1: Hospital Internal Mammary Artery Usage Results by Region, 2011
Region Hospital Isolated CABGs*
Percent IMA Use RankƗ
State All Hospitals 10,978 96.65% San Francisco Bay Area & San Jose (continued)
O'Connor Hospital – San Jose 55 100.00% Peninsula Medical Center 33 96.97% Queen of The Valley Hospital – Napa 48 100.00% Regional Medical of San Jose 62 98.39% Salinas Valley Memorial Hospital 85 97.65% San Ramon Regional Medical Center 27 100.00% Santa Clara Valley Medical Center 69 98.55% Santa Rosa Memorial Hospital – Montgomery 75 85.33% Low
Sequoia Hospital 46 97.83% Seton Medical Center 63 87.30% St. Helena Hospital 36 94.44% St. Mary's Medical Center, San Francisco 31 90.32% Stanford Hospital 55 98.18% Sutter Medical Center of Santa Rosa 59 61.02% Low UCSF Medical Center 61 100.00% Valleycare Medical Center 30 100.00% Washington Hospital – Fremont 84 100.00%
Central California
Bakersfield Heart Hospital 81 92.59% Bakersfield Memorial Hospital 96 93.75% Community Regional Medical Center – Fresno 206 100.00% Dameron Hospital 50 98.00% Doctors Medical Center 216 93.52% Emanuel Medical Center, Inc 14 100.00% Fresno Heart and Surgical Center 152 98.03% Kaweah Delta Medical Center 182 99.45% Marian Medical Center 54 100.00% Memorial Hospital Medical Center – Modesto 167 85.63% Low
San Joaquin Community Hospital 68 94.12% St. Agnes Medical Center 240 98.75% St. Joseph's Medical Center of Stockton 207 98.07% San Fernando
Valley, Antelope Valley, Ventura & Santa Barbara
Antelope Valley Hospital 24 100.00% Community Memorial Hospital of San Buenaventura 39 97.44% French Hospital Medical Center 67 100.00%
69
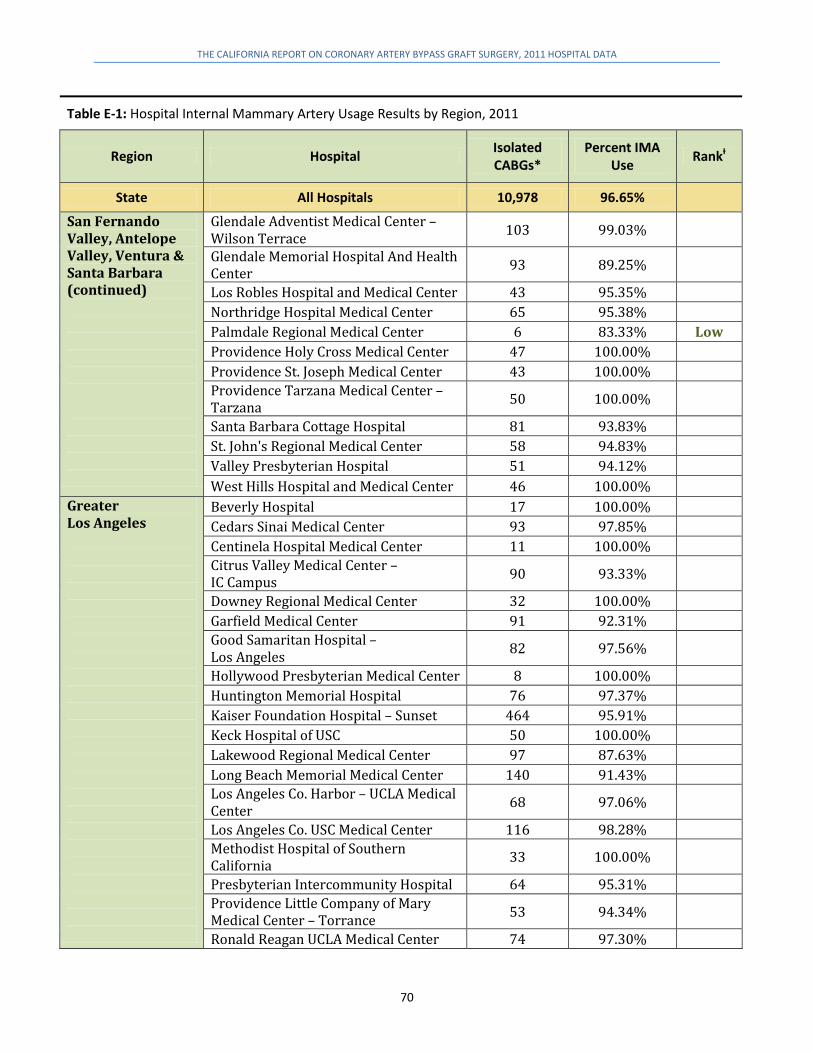
THE CALIFORNIA REPORT ON CORONARY ARTERY BYPASS GRAFT SURGERY, 2011 HOSPITAL DATA
Table E-1: Hospital Internal Mammary Artery Usage Results by Region, 2011
Region Hospital Isolated CABGs*
Percent IMA Use RankƗ
State All Hospitals 10,978 96.65% San Fernando Valley, Antelope Valley, Ventura & Santa Barbara (continued)
Glendale Adventist Medical Center – Wilson Terrace 103 99.03% Glendale Memorial Hospital And Health Center 93 89.25% Los Robles Hospital and Medical Center 43 95.35% Northridge Hospital Medical Center 65 95.38% Palmdale Regional Medical Center 6 83.33% Low Providence Holy Cross Medical Center 47 100.00% Providence St. Joseph Medical Center 43 100.00% Providence Tarzana Medical Center – Tarzana 50 100.00% Santa Barbara Cottage Hospital 81 93.83% St. John's Regional Medical Center 58 94.83% Valley Presbyterian Hospital 51 94.12% West Hills Hospital and Medical Center 46 100.00%
Greater Los Angeles
Beverly Hospital 17 100.00% Cedars Sinai Medical Center 93 97.85% Centinela Hospital Medical Center 11 100.00% Citrus Valley Medical Center – IC Campus 90 93.33% Downey Regional Medical Center 32 100.00% Garfield Medical Center 91 92.31% Good Samaritan Hospital – Los Angeles 82 97.56% Hollywood Presbyterian Medical Center 8 100.00% Huntington Memorial Hospital 76 97.37% Kaiser Foundation Hospital – Sunset 464 95.91% Keck Hospital of USC 50 100.00% Lakewood Regional Medical Center 97 87.63% Long Beach Memorial Medical Center 140 91.43% Los Angeles Co. Harbor – UCLA Medical Center 68 97.06% Los Angeles Co. USC Medical Center 116 98.28% Methodist Hospital of Southern California 33 100.00% Presbyterian Intercommunity Hospital 64 95.31% Providence Little Company of Mary Medical Center – Torrance 53 94.34% Ronald Reagan UCLA Medical Center 74 97.30%
70

THE CALIFORNIA REPORT ON CORONARY ARTERY BYPASS GRAFT SURGERY, 2011 HOSPITAL DATA
Table E-1: Hospital Internal Mammary Artery Usage Results by Region, 2011
Region Hospital Isolated CABGs*
Percent IMA Use RankƗ
State All Hospitals 10,978 96.65% Inland Empire, Riverside & San Bernardino
Santa Monica – UCLA Medical Center and Orthopaedic Hospital 1 100.00% St. Francis Medical Center 38 94.74% St. John’s Health Center 44 95.45% St. Mary Medical Center 44 100.00% St. Vincent Medical Center 62 100.00% Torrance Memorial Medical Center 60 100.00% White Memorial Medical Center 39 94.87% Desert Regional Medical Center 115 94.78% Eisenhower Memorial Hospital 150 93.33% Loma Linda University Medical Center 168 98.21% Pomona Valley Hospital Medical Center 55 98.18% Riverside Community Hospital 138 97.83% San Antonio Community Hospital 110 99.09% St. Bernardine Medical Center 453 97.35% St. Mary Regional Medical Center 112 96.43%
Orange County
AHMC Anaheim Regional Medical Center 122 98.36% Fountain Valley Regional Hospital and Medical Center – Euclid 105 91.43% Hoag Memorial Hospital Presbyterian 109 97.25% Mission Hospital Regional Medical Center 105 99.05% Orange Coast Memorial Medical Center 38 100.00% Saddleback Memorial Medical Center 75 89.33% St. Joseph Hospital – Orange 97 100.00% St. Jude Medical Center 72 100.00% UC Irvine Medical Center 51 98.04% West Anaheim Medical Center 12 100.00% Western Medical Center – Santa Ana 37 97.30% Western Medical Center Hospital – Anaheim 57 96.49%
Greater San Diego
Alvarado Hospital Medical Center 44 100.00% Palomar Medical Center 47 100.00% Scripps Green Hospital 43 100.00% Scripps Memorial Hospital – La Jolla 224 98.66% Scripps Mercy Hospital 132 100.00% Sharp Chula Vista Medical Center 130 99.23%
71
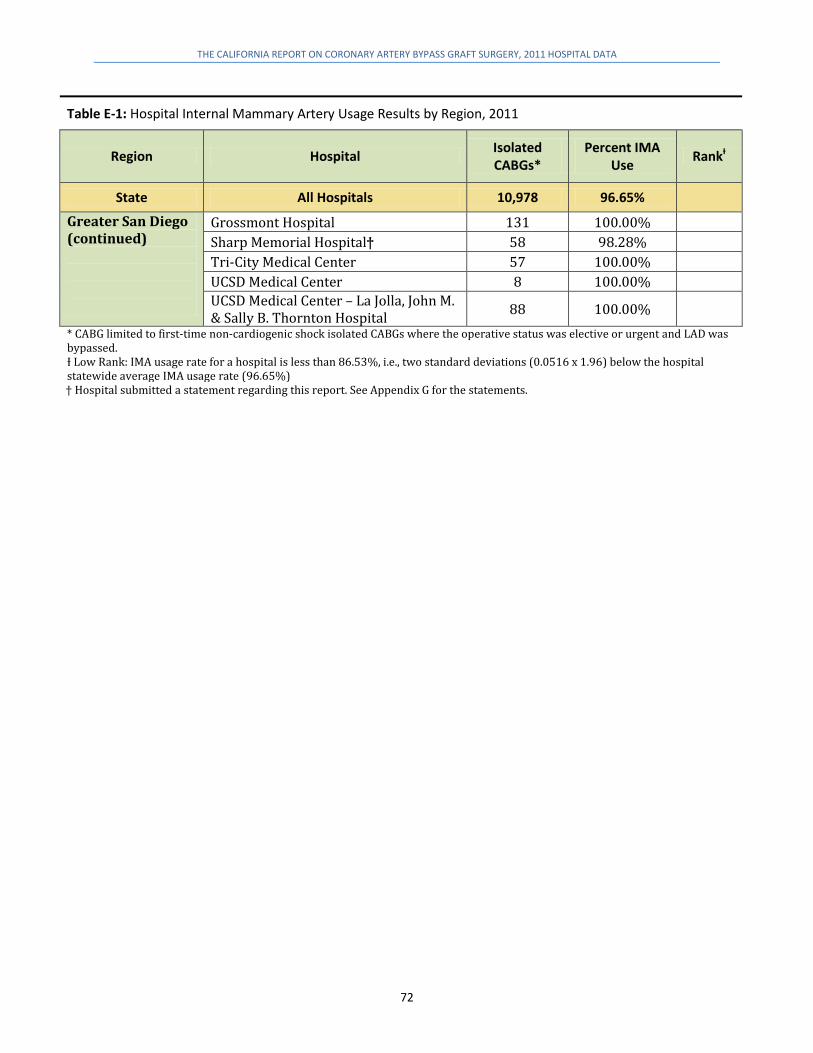
THE CALIFORNIA REPORT ON CORONARY ARTERY BYPASS GRAFT SURGERY, 2011 HOSPITAL DATA
Table E-1: Hospital Internal Mammary Artery Usage Results by Region, 2011
Region Hospital Isolated CABGs*
Percent IMA Use RankƗ
State All Hospitals 10,978 96.65% Greater San Diego (continued)
Grossmont Hospital 131 100.00% Sharp Memorial Hospital† 58 98.28% Tri-City Medical Center 57 100.00% UCSD Medical Center 8 100.00% UCSD Medical Center – La Jolla, John M. & Sally B. Thornton Hospital 88 100.00%
* CABG limited to first-time non-cardiogenic shock isolated CABGs where the operative status was elective or urgent and LAD was bypassed. Ɨ Low Rank: IMA usage rate for a hospital is less than 86.53%, i.e., two standard deviations (0.0516 x 1.96) below the hospital statewide average IMA usage rate (96.65%) † Hospital submitted a statement regarding this report. See Appendix G for the statements.
72
THE CALIFORNIA REPORT ON CORONARY ARTERY BYPASS GRAFT SURGERY, 2011 HOSPITAL DATA
Appendix F: Definition of Readmission A readmission was counted only if the patient was readmitted with a principal diagnosis (i.e., the reason for the readmission) that indicated a heart-related condition, an infection or a complication that was likely related to the CABG surgery hospitalization. California adopted the diagnosis categories and associated ICD-9-CM codes used by the Pennsylvania Healthcare Cost Containment Council for readmissions. The following list shows the ICD-9-CM codes that were counted as readmissions if the code was located in the principal diagnosis position. CIRCULATORY SYSTEM
Cardiac Dysrhythmias Heart Block: 426.0, 426.10, 426.11, 426.12, 426.13, 426.2, 426.3, 426.4, 426.50, 426.51, 426.52, 426.53, 426.54, 426.6, 426.7, 426.81, 426.82, 426.89, 426.9 Paroxysmal Tachycardia: 427.0, 427.1, 427.2 Atrial Fibrillation and Atrial Flutter: 427.31, 427.32 Ventricular Fibrillation and Ventricular Flutter: 427.41, 427.42, 427.5 Premature Heart Beats: 427.60, 427.61, 427.69 Other Cardiac Dysrhythmias: 427.81, 427.89, 427.9 Heart Failure: 398.91, 428.0, 428.1, 428.20, 428.21, 428.22, 428.23, 428.30, 428.31, 428.32, 428.33, 428.40, 428.41, 428.42, 428.43, 428.9 Functional Disturbances Following Cardiac Surgery (Postcardiotomy Syndrome): 429.4 Hypertension and Hypotension: Essential Hypertension: 401.0, 401.1, 401.9 Hypertensive Heart Disease: 402.00, 402.01, 402.10, 402.11, 402.90, 402.91 Hypertensive Chronic Kidney Disease: 403.00, 403.01, 403.10, 403.11, 403.90, 403.91 Hypertensive Heart and Chronic Kidney Disease: 404.00, 404.01, 404.02, 404.03, 404.10, 404.11, 404.12, 404.13, 404.90, 404.91, 404.92, 404.93 Secondary Hypertension: 405.01, 405.09, 405.11, 405.19, 405.91, 405.99 Hypotension: 458.0, 458.1, 458.21, 458.29, 458.8, 458.9, 796.3 Myocardial Infarction and Ischemia Acute Myocardial Infarction, Initial Episode: 410.01, 410.11, 410.21, 410.31, 410.41, 410.51, 410.61, 410.71, 410.81, 410.91 Acute Myocardial Infarction, Unspecified or Subsequent Episode: 410.00, 410.02, 410.10, 410.12, 410.20, 410.22, 410.30, 410.32, 410.40, 410.42, 410.50, 410.52, 410.60, 410.62, 410.70, 410.72, 410.80, 410.82, 410.90, 410.92 Other Forms of Myocardial Ischemia: 411.0, 411.81, 411.89, 429.79 Angina Pectoris and Chest Pain: 411.1, 413.0, 413.1, 413.9, 786.50, 786.51, 786.59 Atherosclerosis Coronary Atherosclerosis: 414.00, 414.01, 414.02, 414.03, 414.04, 414.05, 414.06, 414.07, 414.2, 414.3
Other Atherosclerosis: 429.2, 440.0, 440.1, 440.20, 440.21, 440.22, 440.23, 440.24, 440.29, 440.30, 440.31, 440.32, 440.8, 440.9 Heart Aneurysm and Dissection: 414.10, 414.11, 414.12, 414.19 Pericarditis, Endocarditis and Myocarditis: 397.9, 398.0, 420.90, 420.91, 420.99, 421.0, 421.9, 422.90, 422.91, 422.92, 422.93, 422.99, 423.1, 423.2, 423.3, 423.8, 423.9, 424.90, 424.99, 429.0, 429.1 Heart Valve Disease: Mitral Valve Disease: 394.0, 394.1, 394.2, 394.9, 424.0 Aortic Valve Disease: 395.0, 395.1, 395.2, 395.9, 424.1 Tricuspid Valve Disease: 397.0, 424.2 Pulmonary Valve Disease: 397.1, 424.3 Multiple Valve Disease: 396.0, 396.1, 396.2, 396.3, 396.8, 396.9 Other Endocardial Structure Disease: 429.5, 429.6, 429.71, 429.81 Cardiomyopathies: 425.0, 425.1, 425.3, 425.4, 425.9 Other Aneurysm and Dissection Aortic Aneurysm and Dissection: 441.00, 441.01, 441.02, 441.03, 441.1, 441.2, 441.3, 441.4, 441.5, 441.6, 441.7, 441.9 Other Arterial Aneurysm: 442.0, 442.1, 442.2, 442.3, 442.81, 442.82, 442.83, 442.84, 442.89, 442.9 Other Arterial Dissection: 443.21, 443.22, 443.23, 443.24, 443.29
73
THE CALIFORNIA REPORT ON CORONARY ARTERY BYPASS GRAFT SURGERY, 2011 HOSPITAL DATA
Arterial Embolism and Thrombosis Abdominal and Thoracic Aorta: 444.0, 444.1 Arteries of the Extremities: 444.21, 444.22, 445.01, 445.02 Other Arteries Excluding Precerebral and Cerebral Arteries: 444.81, 444.89, 444.9, 445.81, 445.89, 449, 593.81 Venous Embolism and Thrombosis Lower Extremity Venous Embolism and Thrombosis: 453.40, 453.41, 453.42 Renal Vein Embolism and Thrombosis: 453.3 Other Venous Embolism and Thrombosis: 453.8, 453.9 Phlebitis and Thrombophlebitis Lower Extremity Phlebitis and Thrombophlebitis: 451.0, 451.11, 451.19, 451.2 Upper Extremity Phlebitis and Thrombophlebitis: 451.82, 451.83, 451.84 Other Vessel Phlebitis and Thrombophlebitis: 451.81, 451.89, 451.9 Occlusion and Stenosis Precerebral Artery Occlusion and Stenosis: 433.00, 433.20, 433.30, 433.80, 433.90 Cerebral Artery Occlusion and Stenosis: 433.10, 434.00, 434.10, 434.90 Retinal Artery Occlusion and Visual Loss: 362.30, 362.31, 362.32, 362.33, 362.34, 362.35, 362.36, 362.37, 368.11, 368.12, 368.40 Other Diseases and Symptoms of the Circulatory System: 398.90, 398.99, 414.8, 414.9, 423.0, 429.3, 429.82, 429.89, 429.9, V533.1, V533.2, V533.9
RESPIRATORY SYSTEM
Pulmonary Embolism and Infarction Pulmonary Embolism and Infarction: 415.0, 415.12, 415.19 Postoperative Pulmonary Embolism and Infarction: 415.11 Pleural Effusion and Atelectasis: 511.0, 511.8, 511.89, 511.9, 518.0 Pneumothorax Pneumothorax: 512.0, 512.8 Postoperative Pneumothorax: 512.1 Pulmonary Edema: 514, 518.4, 518.5 Acute Respiratory Failure: 518.81, 518.82, 518.84, 799.1 Other Diseases and Symptoms of the Respiratory System: 518.1, 519.19, 519.2, 733.6, 786.00, 786.02, 786.04, 786.05, 786.06, 786.09, 786.3, 786.52, 786.6, 786.7, 786.8, 786.9, 998.81
NERVOUS SYSTEM
Stroke Ischemic Stroke: 433.01, 433.11, 433.21, 433.31, 433.81, 433.91, 434.01, 434.11, 434.91 Hemorrhagic Stroke: 430, 431, 432.0, 432.1, 432.9 Transient Cerebral Ischemia: 435.0, 435.1, 435.2, 435.3, 435.8, 435.9 Postoperative Stroke: 997.02 Encephalopathies: 348.30, 348.31, 348.39, 349.82, 437.2 Cerebral Edema and Brain Compression: 348.4, 348.5 Anoxic Brain Damage: 348.1 Coma and Stupor: 780.01, 780.03, 780.09 Postoperative Pain: 338.12, 338.18 Other Diseases and Symptoms of the Nervous System: 336.1, 436, 780.2, 780.4, 780.97
74
THE CALIFORNIA REPORT ON CORONARY ARTERY BYPASS GRAFT SURGERY, 2011 HOSPITAL DATA
DIGESTIVE SYSTEM
Ischemic Bowel and Vascular Insufficiency of the Intestine: 557.0, 557.9 Intestinal Obstruction and Ileus: 560.1, 560.81, 560.89, 560.9 Ulceration, Bleeding and Perforation of the Digestive System: 528.00, 528.02, 528.09, 530.10, 530.12, 530.20, 530.21, 530.82, 531.00, 531.01, 531.10, 531.11, 531.20, 531.21, 531.30, 531.31, 531.40, 531.41, 531.50, 531.51, 531.60, 531.61, 531.70, 531.71, 531.90, 531.91, 532.00, 532.01, 532.10, 532.11, 532.20, 532.21, 532.30, 532.31, 532.40, 532.41, 532.50, 532.51, 532.60, 532.61, 532.70, 532.71, 532.90, 532.91, 533.00, 533.01, 533.10, 533.11, 533.20, 533.21, 533.30, 533.31, 533.40, 533.41, 533.50, 533.51, 533.60, 533.61, 533.70, 533.71, 533.90, 533.91, 534.00, 534.01, 534.10, 534.11, 534.20, 534.21, 534.30, 534.31, 534.40, 534.41, 534.50, 534.51, 534.60, 534.61, 534.70, 534.71, 534.90, 534.91, 535.00, 535.01, 535.40, 535.41, 535.50, 535.51, 535.60, 535.61, 569.3, 569.82, 569.83, 578.9 Acute Liver Failure: 570, 572.2 Other Diseases and Symptoms of the Digestive System: 560.30, 560.39, 568.81, 577.0, 578.0, 578.1
URINARY SYSTEM
Acute Glomerulonephritis and Pyelonephritis: 580.0, 580.4, 580.89, 580.9, 590.10, 590.11, 590.80 Nephrotic Syndrome: 581.0, 581.1, 581.2, 581.3, 581.89, 581.9 Acute Renal Failure: 584.5, 584.6, 584.7, 584.8, 584.9 Other Diseases and Symptoms of the Urinary System: 593.9, 599.7, 599.70, 599.71, 599.72, 788.20, 788.29
COMPLICATIONS OF SURGICAL AND MEDICAL CARE
Mechanical Complication of Cardiac Device, Implant and Graft Mechanical Complication of Cardiac Pacemaker and AICD: 996.00, 996.01, 996.04 Mechanical Complication of Heart Valve Prosthesis: 996.02 Mechanical Complication of Coronary Artery Bypass Graft: 996.03 Other and Unspecified Mechanical Complication: 996.09, 996.1, 996.59 Other Complication of Internal Prosthetic Device, Implant and Graft Other Complication of Heart Valve Prosthesis: 996.71 Other Complication of Other Cardiac Device, Implant and Graft: 996.72 Other Complication of Vascular Device, Implant and Graft: 996.74 Shock Postoperative Shock: 998.0 Cardiogenic Shock: 785.51 Other Shock: 785.50, 785.59 Hemorrhage and Hematoma Complicating a Procedure: 459.0, 998.11, 998.12, 998.13 Foreign Body Accidentally Left or Accidental Laceration During a Procedure: 998.2, 998.4, 998.7 Dehiscence and Rupture of Operation Wound: 998.31, 998.32, 998.6, 998.83 Other Complications of Surgical and Medical Care Nervous System Complication: 997.00, 997.01, 997.09 Circulatory System Complication: 997.1, 997.2, 997.71, 997.72, 997.79, 999.1, 999.2 Respiratory System Complication: 519.00, 519.02, 519.09, 997.3, 997.39
Digestive System Complication: 536.40, 536.42, 536.49, 997.4 Urinary System Complication: 997.5 Other Complications: 998.89, 998.9, 999.8, 999.89
INFECTIONS
Postoperative Infections: 997.31, 998.51, 998.59, 99.3, 999.31, 999.39
Sepsis and Bacteremia: 038.0, 038.10, 038.11, 038.12, 038.19, 038.2, 038.3, 038.40, 038.41, 038.42, 038.43, 038.44, 038.49, 038.8, 038.9, 785.52, 790.7, 995.90, 995.91, 995.92
75

THE CALIFORNIA REPORT ON CORONARY ARTERY BYPASS GRAFT SURGERY, 2011 HOSPITAL DATA
Pneumonia Pneumonia: 481, 482.0, 482.1, 482.2, 482.30, 482.31, 482.32, 482.39, 482.40, 482.41, 482.42, 482.49, 482.81, 482.82, 482.83, 482.84, 482.89, 482.9, 485, 486, 511.1 Aspiration Pneumonia: 507.0 Empyema and Abscess of Lung: 510.0, 510.9, 513.0, 513.1 Infection due to Device, Implant and Graft Cardiac Device, Implant and Graft: 996.61 Vascular Device, Implant and Graft: 996.62 Other and Unspecified Infections due to Device, Implant and Graft: 519.01, 536.41 Urinary Tract Infection: 590.3, 590.9, 595.0, 599.0, 996.64 Cellulitis: 681.00, 681.01, 681.02, 681.10, 681.11, 681.9, 682.0, 682.1, 682.2, 682.3, 682.4, 682.5, 682.6, 682.7, 682.8, 682.9 Osteomyelitis: 730.03, 730.06, 730.07, 730.08, 730.09 Intestinal Infection due to Clostridium difficile: 008.45 Other Infection Related Conditions and Symptoms: 567.21, 567.29, 567.9, 590.2, 780.6, 780.60, 780.61, 780.62
FLUID AND ELECTROLYTE IMBALANCE
Hyperosmolality and Hyposmolality: 276.0, 276.1 Acidosis and Alkalosis: 276.2, 276.3, 276.4 Dehydration and Hypovolemia: 276.50, 276.51, 276.52 Fluid Overload: 276.6 Hyperpotassemia and Hypopotassemia: 276.7, 276.8 Other Electrolyte and Fluid Disorders: 276.9
ANEMIA AND COAGULATION DEFECTS
Anemia Acute Posthemorrhagic Anemia: 285.1 Anemia: 280.0, 285.8, 285.9 Coagulation Defects Hemorrhagic Disorders due to Anticoagulants: 286.5 Thrombocytopenia: 287.4, 287.5, 289.84, 446.6 Other Coagulation Defects: 286.6, 286.7, 286.9, 289.82, 790.92
76

THE CALIFORNIA REPORT ON CORONARY ARTERY BYPASS GRAFT SURGERY, 2011 HOSPITAL DATA
Appendix G: Hospital Statements CCORP provided each hospital with a preliminary report containing the risk adjustment models, explanatory materials, and results for all hospitals. Hospitals were given a 60-day review period to submit statements to CCORP for inclusion in this report. Two hospitals submitted statements, which are included here.
77
THE CALIFORNIA REPORT ON CORONARY ARTERY BYPASS GRAFT SURGERY, 2011 HOSPITAL DATA
78

THE CALIFORNIA REPORT ON CORONARY ARTERY BYPASS GRAFT SURGERY, 2011 HOSPITAL DATA
79

Office of Statewide HealthPlanning & Development
February 2014Additional copies of the California Report on Coronary Artery Bypass Graft Surgery
may be obtained by visiting www.oshpd.ca.gov
Related Documents


![Treatment of Coronary Artery Bypass Graft Failure · anastomosis to the right coronary artery. [7] The bypass graft technique as we know today was developed by Favaloro in 1967. [8]](https://static.cupdf.com/doc/110x72/5f64ee26d0110f7644248fc6/treatment-of-coronary-artery-bypass-graft-failure-anastomosis-to-the-right-coronary.jpg)


