The Business Group Advantage in Mutual Funds: Evidence from India * Santosh Anagol Wharton Ankur Pareek Rutgers Business School December 2014 Abstract Indian business group-owned mutual funds earn substantially more on their investments in industries where the group has significant real operations, with stocks in related industries out- performing stocks in unrelated industries by 6 percent per year; this out-performance increases to 13 percent per year in over-weighted stocks. The business groups’ own stock performance explains much of the advantage, suggesting that business-group fund managers use information on their own group’s performance to trade profitably on stocks whose performance is correlated with their own group. Policymakers should consider the informational advantage business groups have in determining mutual fund regulation in emerging markets. * We thank Shawn Cole, Todd Gormley, Simi Kedia, Amit Khandelwal, Michael Long, Vikram Nanda, Jeremy Tobacman, Shing-Yi Wang and participants at the 2014 European Finance Association conference, Darden Inter- national Finance Conference, Indian School of Business Center for Analytical Finance conference, IGIDR Emerging Markets Finance conference, and Rutgers Business School for comments. We thank Matt Cox and Jaclyn Carney at Morningstar for help with the Morningstar Direct data, and Ashutosh Agrawal, Minkwang Jang, Maria Gao, Mengshu Shen, and Jason Tian for research assistance. All errors are our own. 1

Welcome message from author
This document is posted to help you gain knowledge. Please leave a comment to let me know what you think about it! Share it to your friends and learn new things together.
Transcript

The Business Group Advantage in Mutual Funds: Evidence from
India∗
Santosh Anagol
Wharton
Ankur Pareek
Rutgers Business School
December 2014
Abstract
Indian business group-owned mutual funds earn substantially more on their investments inindustries where the group has significant real operations, with stocks in related industries out-performing stocks in unrelated industries by 6 percent per year; this out-performance increasesto 13 percent per year in over-weighted stocks. The business groups’ own stock performanceexplains much of the advantage, suggesting that business-group fund managers use informationon their own group’s performance to trade profitably on stocks whose performance is correlatedwith their own group. Policymakers should consider the informational advantage business groupshave in determining mutual fund regulation in emerging markets.
∗We thank Shawn Cole, Todd Gormley, Simi Kedia, Amit Khandelwal, Michael Long, Vikram Nanda, JeremyTobacman, Shing-Yi Wang and participants at the 2014 European Finance Association conference, Darden Inter-national Finance Conference, Indian School of Business Center for Analytical Finance conference, IGIDR EmergingMarkets Finance conference, and Rutgers Business School for comments. We thank Matt Cox and Jaclyn Carneyat Morningstar for help with the Morningstar Direct data, and Ashutosh Agrawal, Minkwang Jang, Maria Gao,Mengshu Shen, and Jason Tian for research assistance. All errors are our own.
1

1 Introduction
Business groups dominate formal economic activity across many emerging markets. Group-affiliated
firms constitute on average 36 percent of stock market capitalization in the 15 countries in the MSCI
Emerging Markets index where data is available (Masulis et al., 2011). The importance of business
groups extends to the asset management industry as well. In India, business groups manage more
than 30 percent of the total assets under management in the industry, and two of the top five fund
companies are owned by two of India’s largest business groups (Reliance and Birla). In Korea, 36
percent total assets are managed by business groups (chaebol), with some very large conglomerates
such as Samsung and Hyundai in the industry.
Given their name recognition and financial strength, business groups are natural potential
owners of asset management companies. To the extent that new equity investors seek “names they
trust”, regulations allowing a strong business group presence in the asset management industry
could quicken financial development and economic growth in emerging markets. One important
potential risk, however, of business groups in the asset management industry is that business group
mutual fund managers have access to a large amount of proprietary information emanating from
other divisions within the group. If there is a perception that business-group fund managers use
non-public information in their trading decisions, the presence of business groups in the asset
management industry could potentially slow the development of financial markets.
We explore this issue in the context of the Indian mutual fund industry, where business groups
already play an important role, and where monthly holdings data allow us to carefully measure per-
formance in related and non-related industries. The first contribution of our paper is to document
that business group-owned mutual fund managers in India have abnormally good stock-picking
ability specifically in the industries where the business group has real operations. This finding
is consistent with the idea that being situated in a business group gives business group funds an
advantage in related industries.1 Our second contribution is to examine the mechanisms driving
this business group advantage; while the mechanisms we consider are non-exclusive and likely all
1This finding is related to past work on specific advantages certain mutual fund managers have. Cohen et al. (2008)show that fund managers with school based connections to company managers earn abnormal returns, and Coval andMoskowitz (1999, 2001) show that fund managers have an informational advantage on the future performance of firmslocated nearby. Our paper extends this literature by focusing on a mutual fund company level characteristic, i.e.whether the fund is owned by a business group, and testing whether that fund company level characteristic conveysan informational advantage.
2

play a role, we find the most evidence for the idea that business groups use information they have
about their own firms’ future performance to gain an advantage in stocks whose performance is
correlated with the group.
We document the business group advantage in related industries as follows. We define stocks
within these business group mutual fund portfolios as “Same Industry” if the stock is in the same
industry as one of the business group’s real operations.2 For example, if a Reliance-owned mutual
fund owns the stock Bharti Airtel (an Indian telecom company), then Bharti Airtel would be
classified as a Same Industry stock, as Reliance has a substantial real presence in the telecom
industry. We define a stock as “Different Industry” if the stock’s industry is different from all of
the industries where the business group operates.
We find that a value-weighted portfolio of Same Industry stocks outperforms a value-weighted
portfolio of Different Industry stocks by 6 percent per year; our most conservative estimate of this
difference, where we adjust by industry returns, is 2.76 percent per year, although adjusting by
industry returns may in fact “over-control” for our effect of interest if business group information
networks provide private information at the industry level. We find that very little of the out-
performance of Same Industry stocks comes through the business group mutual fund’s holdings of
companies that are owned by the business group directly.3
When we focus on a sample of Same and Different industry stocks in the top ten percentile in
terms of how much the manager overweights the stock, we find the Same Industry stocks outperform
the Different Industry stocks by 13.3 percent per year in terms of raw value-weighted returns. In
this sample of over-weighted stocks, we find that a portfolio of Same Industry stocks earns 7.3
percent more per year even in our most conservative estimate where we adjust by industry returns.
These performance differences are economically large and statistically significant, and suggest that
business group-owned mutual funds have substantial stock picking skills in industries where the
2We categorize a business group as having operations in an industry if more than five percent of its real assetsare in that industry.
3Regulation prevents Indian business group funds from owning more than 25 percent of their portfolio in owngroup stocks, although actual holdings are substantially lower; we find business group funds only hold three percentof their portfolios in own business group stocks and do not over-weight them relative to the market. This low holdingpercentage explains why our results are not due to holdings of own group firms. A few recent studies examine theissue of asset management companies investing directly in firms within the same conglomerate. In a contemporaneouspaper, Ghosh et al. (2014) focus on whether Indian business group funds maximize value for their investors overall,finding evidence that investments in own and rival firms are consistent with opportunistic behavior on the part ofbusiness group fund managers. Golez and Marin (2014) shows that bank affiliated mutual funds in Spain supportthe stock price of their owner banks by purchasing their stock around the time of negative events.
3

group has real operations.
In further results we find that the out-performance of Same Industry stocks in business group
mutual funds has meaningful impacts on business group-owned mutual fund performance. We
construct an index to measure the degree of concentration a specific fund has within the industries
where its business group operates, and show that funds with higher levels of this index indeed earn
significantly higher returns. Funds in the top quintile of our “Business Group Index” outperform
funds in the bottom quintile by approximately 48-56 basis points per month.
We conduct a number of robustness tests to determine that the business group advantage in
Same Industry stocks is not due to omitted risk factors or other characteristics. In our stock
level analysis we find that business groups earn more in their Same Industry holdings even after
adjusting for size, industry, and risk (as measured by a four-factor alpha) of holdings. We also find
that the business group Same Industry portfolio outperforms non-business group fund holdings of
the Same Industry stocks. This result is important because it suggests that our results are not being
driven by reverse causality, i.e. that all mutual funds have information about sectors that will be
successful in the future and those happen to be the industries where business groups make real
investments. In our regression analysis we find that our results are robust to the inclusion of the
direct effect of the industry concentration of the fund as in Kacperczyk et al. (2005) as well as other
fund characteristics that have been shown to predict performance (as in Chen et al. (2004)). We
also show that our results are robust to defining “related” funds as those that the fund companies
self-identity as having a sector focus; we find that when business groups have sector focused funds
in industries where they operate those funds out-perform.4 We also find that financial analysts
systematically under-estimate the earnings of Same Industry stocks relative to Different Industry
stocks, so the result is not driven by business group owned funds simply using publicly available
information from analysts more effectively.
Turning to the mechanisms behind the business group advantage, one possible explanation is
that managers on the “real” side of the business group have access to proprietary information about
major events that will occur in their industry, and they share this information with fund managers
within the business group. This is the easiest explanation to test for because major industry events
can be identified ex-post. This kind of insider trading also seems plausible in India given previous
4See Section 4.4.3 and Table 8 for more details.
4

findings on information leakage in emerging markets (Bhattacharya et al., 2000). On the other
hand, trading ahead of major events is perhaps the riskiest way for business group owned mutual
fund managers to take advantage of their proprietary information, as this type of informed trading
is easily identified by regulators.
To assess how much of the business group advantage in Same Industry stocks comes from
trading on specific information events, we analyze how our results change if we exclude Same and
Different Industry stocks that experienced a merger or major capital expenditure announcement in
a given month. We find that our results are very similar, suggesting that a negligible part of the
business group advantage comes from abnormal returns earned around related industry mergers or
capital expenditure announcements. Given that mergers and capital expenditure announcements
are typically the most common unpredictable announcements, these results suggest it is unlikely
that the business group advantage is coming from the targeted exploitation of specific information
events.
A second explanation is that business group fund managers are better able to process infor-
mation related to the industries they operate in. In a sense, the mutual fund manager within
a business group has a “research” department that actually operates in specific industries, and
therefore is likely to have non-public information on future industry trends, as well as informa-
tion on which firms in those industries are likely to benefit the most.5,6 These benefits could be
particularly large in the Indian context where formal information institutions, such as financial an-
alysts, a financial press, and institutional investor advisory services, are all less mature than those
in developed markets. For example, it seems plausible that business group-owned fund managers
have better information on future demand, cost, or regulatory developments in their industries, as
well as information on which specific firms within their industries are likely to prosper or lose from
those developments. This kind of knowledge is harder to test for, because it may not show up in
major events, but instead leaks out over time through earnings announcements.7 Nonetheless, the
5In this sense, our paper is related to the value of buy-side research within mutual fund companies as discussedin Kacperczyk and Seru (2007) and Rebello and Wei (2014).
6We find evidence that some of the business group advantage in related industries comes from stock-pickingabilities within industries, and some of the advantage comes from better information about related industries overall.
7We examine how much of the performance gain in Same Industry stocks is driven by the information releasedsurrounding earnings announcements. If the mechanism driving the high performance of Same Industry stocks is thatbusiness group-owned fund managers have earlier access to fundamental information, we expect a disproportionateamount of the out-performance of Same Industry stocks to be concentrated around earnings announcements. We findthat 32 percent of the quarterly excess returns earned by Same Industry stocks accrues in just the three days around
5

following evidence appears consistent with this interpretation.
First, we find that much of the business group out-performance in Same Industry stocks occurs
in time periods when the business group owned firms also out-performed. This finding is consistent
with a simple theory of how business groups generate their advantage in Same Industry stocks.
Business-group managers can forecast when firms in their own group are going to do well; however,
exploiting this information by trading in stocks within their business group is deemed risky due to
potential regulatory scrutiny. Instead, managers use this information to profitably trade in stocks
whose performance is highly correlated with the stocks of the business group firm. Consistent with
this hypothesis, we find that much of the business group advantage in Same Industry stocks can be
explained by adjusting for the performance of group owned companies themselves. Second, group-
owned funds also earn abnormal returns in industries that are major suppliers to or customers of
the industries the group operates in. This finding is consistent with the idea that group-owned fund
managers have general information on industry growth patterns that is relevant for their suppliers
and customers.
A third possible explanation is that fund managers select in to particular business groups
because they have knowledge about the industries that the business groups operate in. This might
be because business group mutual fund managers are hired from other parts of the business group,
and so they enter the mutual fund business with knowledge about specific industries. To assess this
possibility we hand collected past work experience and education history data on the 376 mutual
fund managers in our sample. We find that less than two percent of these managers worked in any
other industry besides finance prior to their joining the mutual fund firm, suggesting it is unlikely
that business group fund managers bring operational knowledge from other divisions of the firm
from past work experience. We also conduct a test specifically on managers who either joined or
left a business group mutual fund during our sample period. We find these managers’ abnormal
returns are only correlated with their affiliated business group stock abnormal returns when they
actually worked at the business group; given this result, it seems unlikely that the business group
advantage in related industries is due to manager selection.
We believe our results are particularly important for the development of the mutual fund in-
earnings announcements. Given that quarters typically include 60 trading days, this implies that 32 percent of theabnormal returns are generated in a (0,2) day window around earnings announcements which are only 5 percent ofthe trading days within a quarter.
6

dustry in emerging markets. We highlight an important potential risk with business groups owning
mutual funds; there is an obvious incentive for firms within the group to share non-public informa-
tion with the mutual fund company. Much academic and policy discourse examines whether U.S.
institutional investors use information from other parts of their firms to gain a trading advantage,
with the most recent research finding little evidence of such information transfer (Griffin et al.,
2012).8 Very little of this work studies business group ownership of mutual funds in emerging
markets, despite the fact that group owned funds might have even greater advantages than U.S.
financial conglomerate funds: business groups are involved in nearly all sectors of the economy, so
their access to information is large relative to the information available to U.S. financial conglomer-
ates, and, regulations, enforcement, and internal controls on insider trading are all less likely to be
stringent in emerging market settings. Our results also suggest that regulations that limit business
group mutual funds from trading in their own groups’ stocks may not be sufficient, as our findings
are mainly based on business group trading in firms that are not owned by the business group.9
Our paper also contributes to the literature on the costs and benefits of business group affiliation
in emerging markets. On the cost side, previous work has mainly focused on testing whether
controlling shareholders in business group firms “tunnel” profits across group divisions as a way to
expropriate minority shareholders.10 On the benefits side, studies find that access to internal capital
markets helps group-affiliated firms in countries with less developed financial markets (Almeida and
Wolfenzon, 2006; Masulis et al., 2011; Bena and Ortiz-Molina, 2013). We expand this literature by
highlighting the advantage business group firms may have in making financial investments based on
information gathered through the business-group’s real operations. Our results are also consistent
8Recent related papers include Massa and Rehman (2008) and Ivashina and Sun (2011), who find that mutualfunds make information driven investments in firms that borrow from an affiliated firm to the mutual fund, Irvine etal. (2007) who find that funds earn abnormal returns on purchases before earnings announcements, Haushalter andLowry (2010) who find information transfer between banks and affiliated analysts, and Mola and Guidolin (2009),who find that analysts raise the ratings of firms after an affiliated mutual fund increases its holdings in the firm. Allof these papers focus specifically on financial conglomerates in the United States.
9Of course, it is important to note that our paper is not a full welfare analysis of the presence of business groupsin the mutual fund industry; the benefits of business group presence in the asset management industry may stilloutweigh the costs.
10Business groups are typically characterized by controlling shareholders who own greater control rights than cashflow rights; this wedge between control and cash flow rights creates an incentive for firms to “tunnel” profits fromaffiliated firms with low cash flow rights to firms with high cash flow rights. Previous studies have found tunneling tobe an important empirical phenomenon in India (Bertrand et al., 2010; Choudhary and Siegel, 2011), China (Jianget al., 2010), Hong Kong (Cheung et al., 2006), Bulgaria (Atanasov et al., 2010), and South Korea (Bae et al., 2008).An earlier set of papers finds that firms in business groups where the owner has larger cash flow rights have highervaluations (Bianchi et al., 2001; Claessens et al., 2000, 2002).
7

with the Khanna and Palepu (2000) finding that firms affiliated with large diversified business
groups in India have higher market valuations, as all of the business group firms that own mutual
funds in India are large diversified business groups.
2 Background
The Indian mutual fund industry started in 1964 with the formation of a government owned mutual
fund entitled the “Unit Trust of India.”11The Unit Trust of India was the only mutual fund firm
in operation over the period from 1965 through 1987. In 1987 the government allowed entry by a
small number of state owned banks and state owned life insurance companies. In 1993 the mutual
funds industry was opened to the private sector, and a specific set of regulations were created to
govern the industry.
Indian mutual fund assets in December 2012 amounted to approximately U.S.$157 billion.
India’s total assets under management are comparable to the total assets under management in
the U.S. mutual fund industry of $134 billion in 1981.12 While the size of the Indian mutual
fund industry may be only 1/100th the size of the US mutual fund industry today, assets under
management in India have grown by 445 percent since 2003, which is large relative to the 56 percent
growth in the U.S. mutual fund industry over the same time period.
There are approximately 10 million mutual fund investors in India (Halan, 2010) and about 40
asset management companies. Assets in Indian equity-oriented mutual funds constitute approxi-
mately seven percent of the market capitalization of the Bombay Stock Exchange. In the past five
years the sector has seen a number of new regulations passed regarding the level and types of fees
that mutual funds could charge, although no major regulation regarding the investment decisions
of funds were passed during our study period.13
Business groups have played an important role in the industry since it was first opened to the
private sector in 1993. All but one of the business groups we study in this paper entered the mutual
11See http://www.amfiindia.com/showhtml.aspx?page=mfindustry for additional details on the history of theIndian mutual funds industry.
12These data come from the 2012 Investment Company Fact Book produced by the Investment Company Institute(the trade association of mutual funds and other asset management companies in the United States).
13For details on major fee regulations passed in the Indian mutual funds sector see Anagol and Kim (2012) andAnagol et al. (2013).
8

fund industry within the first two years after the sector was opened to private firms.14 Including
investments in all asset classes (debt, equity, etc.), business group affiliated funds hold 30 percent
of the total industry assets under management as of December 2012.
3 Data
Our sample construction begins with all of the India based open-end mutual funds included in
the Morningstar Direct database. Morningstar includes both existing funds as well as historical
information on funds no longer in existence, so our results should not be affected by survivorship
bias. We drop any funds that only invest in fixed income securities by excluding those whose
Morningstar Global category is Asian Fixed Income or India Fixed Income. A large number of the
open-end funds in India are debt oriented funds that firms use for short term cash management.
We also drop funds that have more than 30 percent of assets in non-equity securities to ensure
our sample represents equity funds. Lastly, in some cases a single fund will have a retail and
institutional class of units, but with exactly the same holdings, returns, and total net assets. We
only keep the retail fund observations as these have the most complete data. Our sample covers
the period January 2003 through June 2013.
One unique feature of the Indian mutual funds market is that almost all mutual funds offer
investors two types of payout options. The “Growth” option is similar to standard open-end funds
where gains in the fund are realized at the time of sale of the units. The “Dividend” option is a
payout option where the mutual fund company periodically announces “dividends” that it returns
to investors in the mutual fund. These “dividends” are in reality simply the mutual fund company
returning the investors money back to them; they are not based on any actual dividend payments
made by the stocks held in the fund’s portfolio. The assets in the “Growth” and “Dividend” options
are invested in the same securities, and there is no difference in the returns earned by these two
options. Thus, we also exclude the dividend options of funds from our analysis as they provide the
same information as the Growth option.
For each of our funds, we download monthly portfolio holdings and returns data through the
Morningstar Direct system. For each fund company represented in the Morningstar data, we
14The exception is Larsen and Toubro, which entered the industry in 2009. See Table 1, Panel C for a listing ofthe business groups in our sample.
9

visited the fund company’s website and collected information on the fund company’s sponsor.
These sponsors fall in to four general categories: Indian business group, Indian financial company
(insurance or investments), Indian Bank, or foreign financial company. For each of these sponsor
firms we collected information from the Prowess database on historical profits, sales and assets as
well as the historical profits, sales and assets information for each of their group affiliated firms.15
A key decision in designing this analysis is how to define which industries business groups are
likely to have proprietary information on. Given the multiple possible ways that industries might
be defined in this setting, we choose to “tie our hands” on this issue by defining the industries as
closely as possible to the 10 industry definitions used in Kacperczyk et al. (2005).16 We get the
SIC code of each stock traded on the Indian stock market from the Compustat Global database.
Similarly, we get the Indian industry classification code (NIC) for each business group affiliated firm
for the nine business groups in our sample from the Prowess database and match these NIC codes
to the corresponding SIC codes. Next, we match each SIC code to one of the Fama and French 48
industries using the industry definitions provided on Kenneth French’s website. Finally, using the
classification table from Kacperczyk et al. (2005), we map the Fama and French industries to one
of the 10 industry groups.
Table 1, Panel A presents summary statistics on the number of funds and assets under man-
agement both in the full sample of equity oriented funds in the Morningstar Direct data, as well as
for the sub-sample of business group-owned funds. Both series show a large increase in both the
number of funds and the amount of assets in these funds over time. Group affiliated funds have
constituted between 21 and 40 percent of total equity fund assets over this period. Business group
funds have been a stable 28 to 32 percent of the total number of funds.
Table 1, Panel B presents summary statistics for our main variables specifically on our sample of
business group affiliated funds. We have a total of 6,481 fund*month observations, and an average
of 52 unique business-group affiliated equity funds per month. The mean assets under management
for these group affiliated funds is 4,703 million rupees, which is approximately 94 million dollars
15The Prowess database, produced by the Center for Monitoring the Indian Economy, is the Indian equivalent ofCompustat and has been used in a large number of studies including Bertrand et al. (2002), Choudhary and Siegel(2011), and Khanna and Palepu (2000).
16The industry classification in Kacperczyk et al. (2005) is in turn based on the Fama-French 10 industry classi-fication available here: http://mba.tuck.dartmouth.edu/pages/faculty/ken.french/Data_Library/det_10_ind_
port.html.
10

(assuming an exchange rate of 50 rupees per dollar). Assets under management are skewed, with
the median fund*month having approximately 31 million dollars assets under management, and
the largest fund*month observation having 1.6 billion dollars in assets under management. The
average fund is 6 years old and has an expense ratio of 2.23 percent per year. The average monthly
return is 1.41 percent per month, however, the average return after subtracting out the market’s
return in the same month is 0.14 percent per month. The BGI variables measure the exposure
of the business group fund in a given month to the industries where the business group operates,
and the ICI (Industry Concentration Index) measures the concentration of the mutual fund in an
industry (Kacperczyk et al. (2005)). We define these variables formally when we introduce them
in to the analysis.
Table 1, Panel C, presents the breakdown of business group real assets by different industry
groups at the beginning of our sample (March 2003) and at the end of our sample (March 2012).17
Business groups are well diversified with Manufacturing (31.9 percent), Utilities (13.7 percent),
Telecom (15 percent), Finance (20 percent) and Consumer Durables (9.5 percent) as the major
sectors of business operations in the fiscal year ending in March 2012. Comparing the last three
rows in Panel C, investment or aggregate portfolio weights of both the business group and non-
business group affiliated funds across different industries are similar to each other and also to the
industry weights in the Indian stock market.
4 Documenting the Business Group Advantage in Related Indus-
tries
We begin our empirical analysis by testing whether business group-owned funds are more likely to
over-weight industries where the business group has real operations. Table 2 presents these results.
The unit of observation in the regressions presented in Columns (1) - (4) is a fund*industry*month
cell. For example, if the Reliance Equity Growth Fund owned 12 percent in the utilities industry in
March 2012, then the value of the dependent variable in the Reliance Equity Growth Fund*Utilities
Industry*March 2012 observation would be 6.1 percent (12 percent minus the market weight of 5.9
percent). We use two different independent variables as measures of the business group’s presence
17These statistics are presented for March as March 31 is the end of the Indian financial year.
11

in the industry. The first is the variable Business Group Industry Weight, which is the fraction of
real assets in that business group within the industry of the observation at the end of the previous
financial year. For example, in the case of Reliance in July 2012, this variable would be equal to 40
percent for the Utilities industry (Table 1, Panel C). This provides a continuous measure of how
exposed a business group is to a particular industry. We also report specifications with a variable
Business Group Industry Dummy, which takes a value of one if the business group has at least five
percent of its real assets in the industry of the observation at the end of the previous financial year,
and zero otherwise.
In Column (1) we find that a one percent increase in a group’s assets in an industry is correlated
with that business group’s mutual funds over-weighing that industry by .083 percent. This correla-
tion is significant at the 5 percent level. In Column (2) we find that a holding in an industry where
the business group has at least 5 percent of assets is correlated with 2.2 percent over-weighting in
the industry. Column (3) adds industry fixed effects. On the one hand, controlling for industry
fixed effects may “over-control” for part of the effect we are testing for, in the sense that business
groups may specialize in particular industries which leads to over-weighting even on average for that
industry. On the other hand, controlling for industry fixed effects removes any omitted variables
bias that would cause certain industries to be over-weighted by funds in general. Including the
industry fixed effects does reduce the coefficient on the Business Group Industry Dummy; however,
the coefficient is still large and statistically significant, suggesting that even when we focus on vari-
ation within industries, business group-owned funds make greater investments in industries where
they have real operations. Column (4) adds month fixed effects to control for any time trends in
overall concentration levels; the results are similar.
One weakness of the models in Columns (1) through (4) is that holdings in large funds are
weighted equally to those in small funds. If a business group has a small fund that strongly over-
weights related industry stocks, then we would find a significant correlation, but this might not
have much economic significance given the size of the fund. Columns (5) through (7) aggregate
the holdings across all funds owned by the business group as a way to weight larger funds more
significantly. In these columns an observation is at the business group*industry group*month level.
For example, suppose Birla Aditya business group owned two funds, the Birla Growth Fund and the
Birla Manufacturing Fund, and that the Birla Growth Fund was twice as large as the manufacturing
12

fund. Further suppose that the Birla growth fund over-weighted Manufacturing by 1 percent, while
the Birla Manufacturing Fund over-weighted Manufacturing by 10 percent. The holdings of both
of these funds would be combined, so the over-weighting of the Manufacturing industry would be
the weighted average of the over-weightings in each of these funds, where the weighting is by the
size of the fund (i.e. the dependent variable in Columns (5) - (7) would be Business Group Weight
- Market Weight = 231 + 1
310). We find that aggregating holdings up to the business group level
does not meaningfully change our estimates, suggesting that these results are not driven by a small
set of heavily over-weighted funds.
4.1 Results: Same Industry Stock Returns
We now turn to the main results of our paper. Table 3, Panel A, compares the returns of stocks in
industries where the business group has a presence versus industries where the business group does
not have a presence. At the beginning of each month, stocks in each business group-owned mutual
fund portfolio are assigned to one of two portfolios: Same Industry or Different Industry. A stock
holding is classified in the Same Industry group if the business group-owned fund that owns that
holding has greater than five percent of real assets in that stock’s industry. Analogously, the stock
holdings in industries where the business group owner of the mutual fund does not have greater
than five percent are sorted in to the Different Industry group. All the stock positions of business
group-owned mutual funds are pooled within one of these two portfolios and returns for the two
portfolios are calculated. The stocks within each portfolio are value weighted by the combined
dollar holdings of all the business group affiliated funds.
The results are reported in Table 3, Panel A. Column (1) shows the average number of stocks
in the Different Industry and Same Industry portfolios at the beginning of the month. Column (2)
shows that the stocks in the Same Industry portfolio outperform the Different Industry portfolio by
53 basis points per month. This difference is significant at the 5 percent level. The difference in size
adjusted returns, presented in Column (3), is similar at 52 basis points per month.18 In column (4),
we subtract the average industry returns from the raw stock return to get the industry adjusted
return, to provide some sense of how much of the advantage comes from within industry versus
18The size-adjustment is done by substracting the average return in the same market capitalization quintile as thestock before averaging within the portfolio.
13

across industry holdings.19 The difference in industry adjusted return between the Same Industry
and Different Industry stocks decreases to 23 basis points per month and is statistically significant
at the 10 percent level. Note that this industry adjustment is testing whether business groups
investing in Same Industry stocks do well because they pick specific stocks within the industry;
the fact that our results here are smaller, but still significant at the ten percent level, suggests
that information about industry trends and information about specific stocks within industries are
both important in generating the overall abnormal returns. In column (5), we report the Carhart
4 Factor Alpha which is positive at 0.42 percent per month and close to significant at the 5 percent
level.
Columns (6) and (7) explore alternative methods of weighting the holdings across different
funds within the Same and Different Industry portfolios. Column (6) weights holdings across funds
equally, as opposed to based on their dollar value in the fund portfolios. The result here is somewhat
close to significant at the 10 percent level, although the magnitude is smaller at 20 basis points
per month. The fact that this result is smaller suggests that the effect is larger when bigger dollar
value investments are made; there is important information in the size of the investments funds
make in Same Industry stocks. Column (7) weights holdings across funds based on the market cap
of the stock. Market cap weighting produces similar returns on Same and Different Industry stocks
as the equal weighting portfolios, again suggesting there is valuable information in business group’s
decisions of how to weight Same Industry stocks.
One possible explanation for our results is that all mutual funds happen to have an informational
advantage in the industries where business groups tend to operate. If this were the case, we would
expect that non-business group owned funds would also do well in the Same Industry stock portfolio.
Column (8) uses non-business group funds as a comparison group to confirm that our effects are
driven by an informational advantage specific to business groups. To conduct this comparison we
first estimate the returns non-business group funds earn on their holdings of the stocks that are
in the Same and Different industry portfolios.20 These results are presented in Appendix Table
19Industry adjustment is done by substracting the average return of stocks in the same 10 digit industry codedescribed above.
20Note that Same and Different industry stocks are identified in exactly the same way as before; in each monthSame Industry stocks are those that are owned by a business group mutual fund and in an industry where thatbusiness group mutual fund’s owner has greater than five percent of real assets. The difference is we now use theweightings of non-business group funds in these stocks to estimate returns on Same and Different Industry portfolios.
14

1.21 We then adjust the returns that business groups earn on their holdings of Same and Different
Industry stocks by the returns that non-business groups earn on these same stocks. We find that
business groups earn 47 basis points per month more on there holdings of Same Industry stocks
than non-business groups (Table 3, Panel A, Same Industry Stocks row); however, business groups
do not appear to have much of an advantage over non-business groups in Different Industry stocks,
earning a statistically insignificant 12 basis points per month more than non-business group firms.
These results make it seem unlikely that the business group advantage in Same Industry stocks is
due to information that all mutual funds have.
Our analysis so far has compared the performance of all Same versus Different Industry stocks.
It is reasonable to expect, however, that the largest differences in performance across these two
groups will appear once we condition on how much the funds overweight each particular stock; i.e.
we expect business group funds to do particularly well in the Same Industry stocks they choose
to overweight relative to the market. Table 3, Panel B explores the relationship between a fund’s
over-weighting of Same and Different industry stocks and returns performance. At the beginning of
each month we first sort stocks from highest to lowest based on how much the stock is over-weighted
in the portfolio relative to the market. We then take those stocks that fall in the top 10 percent
of this ranking and separate them in the Same and Different industry portfolios. In the case of the
Different Industry Stocks portfolio, there are 60 stocks in the top 10 percentile of the over-weight
ranking. In the case of Same Industry stocks, there are on average 42 stocks in the top 10 percentile
of the overweight rank.
Once we focus on stocks that are over-weighted by business group-owned funds, we now find
that the difference in performance between the Same and Different Stocks portfolios is substantially
larger. Based on simple value-weighted returns, highly over-weighted Same Industry stocks earn
111 basis points more per month than heavily over-weighted Different Industry stocks. All of
the value-weighted return measures show large monthly abnormal returns, ranging from 61 basis
points per month (value-weighted industry adjusted returns) up to 114 basis points per month
(value-weighted size adjusted returns). We continue to find that value-weighting by the size of the
holdings is important; if we equal-weight portfolios of Same and Different Industry stocks the returns
21We find that non-business groups appear to have some advantage in the Same versus Different industry stocks,however this advantage is much smaller than the advantage that business groups have in Same Industry stocks. SeeAppendix Table 1 for details.
15

drop to 36 basis points per month (significant at the ten percent level). Market-cap weighting the
stocks in the portfolio, however, delivers a statistically significant 69 basis point per month return.
In Column (8) we also find that business group-owned funds earn 93 basis points more per month
on their over-weighted Same Industry stocks relative to non-business group fund holdings in the
Same Industry stocks (business groups also appear to have a smaller and insignificant advantage
in Different Industry stocks).22,23
An analogous prediction is that Same Industry stocks owned by business group funds that
are under-weighted should under-perform Different Industry stocks that are under-weighted, as
we expect business groups to have more information about Same Industry stocks. We find some
evidence consistent with this prediction in Panel C of Table 3. In this table we “value” weight stocks
within the Same and Different Industry portfolios according to their market cap; this is because
weighting by dollar values is not sensible when looking at under-weighting.24 Same Industry stocks
in the bottom ten percentile of the over-weight distribution earn between 13 and 23 basis points less
than Different Industry stocks in the bottom ten percentile of the over-weight distribution. While
these differences are not typically significant at the ten percent level, the sign and magnitude of
the coefficients are similar across specifications. Our finding of less strong results amongst under-
weighted stocks is consistent with the fact that Indian mutual funds typically do not short sell
stocks, and thus the under-weighting here is perhaps more reflective of over-weighting in other
parts of the portfolio as opposed to an active strategy of under-weighting certain stocks. Given the
small number of stocks in the under-weight portfolios, we do not have power to detect economically
important advantages in terms of under-weighting.
In Appendix Table 2 we compare the returns on Same Industry stocks that are over-weighted
with the returns on Same Industry stocks that are under-weighted. This is perhaps the comparison
where we will find the largest difference, because business groups use their information advantage
to over-weight stocks that will do well and under-weight stocks that will do poorly. In Panel A
22We have also calculated returns defining over-weight stocks as those in the top fifth percentile of the over-weightdistribution. The difference between Same and Different industry portfolios are slightly larger but qualitativelysimilar. These results are available on request.
23As a robustness check, in Appendix Table 4 we separately estimate the Same Industry stock returns presentedin Table 3 in the first half of our sample (March 2003 - March 2008) and the second half of our sample (April 2008 -May 2013). We find that after accounting for different risk factors across these two periods the excess returns earnedby the Same Industry portfolio are similar in the two periods.
24The column for Market Cap weighting is not applicable for Panel C because we already have been using marketcap weighting to do the value weighting in this Panel.
16

we find that Same industry stocks in the top ten percentile of the over-weight distribution earn
175 basis points per month more than Same Industry stocks in the bottom ten percentile of the
over-weight distribution. In Panel B we define under-weighted stocks as the Same Industry stocks
in the top ten percentile of market capitalization that are not held by business group mutual funds
(not holding a stock is in a sense a form of under-weighting it). Here we find over-weighted stocks
earn 131 basis points more than the stocks that are not held.
In Figure 1a we plot the cumulative abnormal return (CAR) of the Same Industry value-
weighted size adjusted portfolios (including all stocks) for 36 months after portfolio formation. For
comparison purposes, we have also plotted the CAR earned by non-business group funds in the
same set of Same Industry stocks, and also the CAR earned on a market-cap weighted portfolio of
of Same Industry stocks. The difference in CARs earned by the business and non-business group
funds in the Same Industry stocks gives an indication of the information there is specifically in how
business group funds weight the Same Industry stocks. Twelve months after portfolio formation,
the business group Same Industry stock portfolio has a CAR that is 2.9 times larger than the CAR
on the non-business group’s portfolio of the same stocks (5.15 percent versus 1.76 percent).25 As
we move forward in time, the difference in CARs between the business and non-business group
weightings continues to grow. Figure 1b plots the CAR on the Same minus Different Industry
portfolios according to the weightings by business group funds, non-business group funds, and
market-cap. Interestingly, when looking at the Same minus Different portfolio return the non-
business group weighting conveys no advantage over a market cap weighting, but the weighting of
business-group funds displays a large advantage.26
Given that fund managers in business groups likely have the most information about the future
performance of the firms within their groups, one might also suspect that business groups would do
particularly well in their holdings of firms within the business group (i.e. when a Reliance mutual
25It is more difficult to interpret our estimated CARs as we move further in time from the date of portfolioinformation as other trends may outweigh the signal in the mutual funds’ choices at time zero. Nonetheless, it isinteresting to note that the Same minus Different Portfolio of non-business group funds has a lower CAR than theSame Industry portfolio, suggesting that most of the information advantage that non-business group funds have onSame Industry stocks is present for Different Industry stocks as well (comparing Figures 1a and 1b). However, forbusiness group funds, the Same Industry and Same Minus Different Industry CARs are quite similar, showing thatbusiness groups have most of their informational advantage in Same Industry stocks.
26The fact that the CAR does not reverse even when we examine 36 months into the future suggests that there isreal information in the Same Industry portfolio, as opposed to a transient difference right after portfolio formation.The long persistence of this advantage implies that the informational efficiency of the Indian market is less developedthan the US market, where advantages of this sort typically only persist for a few months.
17

fund directly invests in the Reliance Energy company). On the other hand, business group-owned
fund managers may be hesitant to trade on private information regarding their own business group
firms as this is more likely to attract the regulator’s attention. It is also possible that business
group-owned mutual funds do worse in their investments in own group firms because the group
uses the funds to “prop” up the stock price in bad times (Bae et al., 2008). Table 3, Panel D, tests
this hypothesis. At the beginning of each month we pool all of the holdings of business group-
owned mutual funds, and then pick out the stocks where the business group is also the owner of
the firm. On average, there are only 15 own group firms owned by business group mutual funds per
month, leaving us a with a small sample and not much power to detect economically meaningful
differences. The value weighted size adjusted returns of these own group firms’ portfolio is 35 basis
points per month, although this is not close to significant at the 10 percent level. Even when we
focus on the own group firms where the over-weighting is large (above the 10th percentile in terms
of over-weighting), we do not find evidence of significant abnormal performance. These results
suggest that our main results on the out-performance of Same Industry stocks are not being driven
by out-performance of own group company stocks in the portfolio.
4.2 Robustness of Same vs. Different Industry Stock Results
4.2.1 Finer Industry Classification
Our results so far are based on a relatively broad ten industry classification. Appendix Table 3
defines a stock holding as Same Industry only if the business group owner has real investment of
at least five percent in the same Fama French 48 industry as the stock itself. Ex-ante, it is unclear
whether a finer industry classification will improve our measurement of which industries are related;
if the business group specializes in a few very specific industries, then using the finer classification
can increase the precision of our measurement. However, if the group has broader operations, then
we may miss connections across the more finely defined industries.
Using the finer Fama-French 48 industry definition, we find that Same Industry stocks out-
perform Different Industry stocks by between 20 and 37 basis points per month, depending on
the type of risk-adjustment employed, with the value-weighted returns results significant at the 10
percent level. In Panel B we focus on stocks in the top ten percentile of the over-weight distribution,
18

and find the Same minus Different returns are between 53 and 79 basis points, and two out of the
four risk-adjustment methods are significant at the ten percent level. Overall, the results are broadly
similar using the finer industry classification, but it appears there may be important connections
across these finer industries that confer business groups an additional advantage.
4.2.2 Robustness: Same Industry Stock Returns Around Earnings Announcements
So far we have documented that Same Industry stocks out-perform Different Industry stocks, and
that this out-performance is largest when business group-owned funds overweight Same Industry
stocks. Appendix Table 5 conducts a similar analysis to Table 3, however we now focus on returns
earned on the Same and Different industry stocks specifically around earnings announcements. This
test is motivated by Baker et al. (2010), who use performance of mutual fund held stocks around
earnings announcement as a measure of informed trading.
The sample of stocks represented in Appendix Table 5 are those in the Same Industry stock
portfolio that fall within the top ten overweight percentile. We calculate cumulative abnormal
returns within a three day window around the earnings announcement (day zero through day
two), and compare this to the average quarterly return of the Same Industry portfolio.27 We
find that the Same Industry stock abnormal returns around earnings announcements account for
a disproportionate amount of the Same Industry’s stocks’ abnormal returns throughout a quarter.
For example, the value weighted size adjusted difference between Same and Different portfolios
around earnings announcements of 108 basis points represents 32 percent of the total quarterly
abnormal Same minus Different Industry portfolio (Column 8). Given that the three days around
earnings announcements are only approximately five percent of the total trading days in a quarter,
these results suggest that much of the out-performance of the same industry stocks is generated
around the news releases associated with earnings announcements. The quantitative size of this
estimate is consistent with the finding in Baker et al. (2010) that between 18-51 percent of the
abnormal returns of a portfolio of stocks traded by mutual funds occur specifically around earnings
announcements.27We obtain earnings announcement dates from the Prowess database.
19

4.3 Results: Same Industry Stock Returns and Analyst Forecast Errors
As mentioned earlier, one possibility is that business groups simply use publicly available informa-
tion more effectively in the industries they operate in. For example, business groups might follow
analysts more closely in the industries they operate in, and update their holdings to reflect the lat-
est publicly available analyst predictions. In this case, we would not expect business groups to be
able to forecast earnings beyond analyst predictions, even though we would find out-performance
in related industry stocks.
Table 4 reports the results of regressions where an observation is an earnings announcement by
a stock held by a business group mutual fund. Note that an earnings announcement of a particular
stock in a particular month may appear multiple times in our sample, if that stock was held by
multiple business group-owned mutual funds.28 The dependent variable is the mean forecast error
across analysts for that particular earnings announcement, where mean forecast error is defined
as the difference between the actual earnings per share minus the forecasted earnings per share,
divided by the firm’s stock price lagged by two quarters.29 Positive values of this mean forecast
error indicate analysts on average under-estimated earnings (i.e. there were positive surprises).
The Business Group Industry Weight variable is the fraction of the business group’s real assets in
the industry of the stock represented by the observation at the end of the previous financial year.
The Business Group Industry Dummy variable is an indicator for whether that particular holding
is in the Same Industry. The Fund - Market Weight variable measures the difference between the
fund’s weight of the holding minus the market weight of the holding.
Column (1) regresses the mean forecast error across analysts for each earnings announcement
on the Business Group Industry Dummy variable and the Fund - Market Weight variable. Analysts
systematically under-estimate earnings for stocks in the same industry by 20 basis points. So, for
example, analysts would on average forecast earnings of 1.8 rupees per share for a company with
a stock price of 100 and actual earnings per share of 2 rupees. Column (2) interacts the weighting
28We cluster our standard errors at the quarter level to account for the fact that each of these earnings announce-ments should not be treated as an independent observation. We have also calculated standard errors clustering at theOwner*Industry*Financial Year, which is the level our main independent variable of interest varies at (Angrist andPischke (2009)). The resulting t-statistics are larger when we do this, so we choose to report the more conservativeestimates.
29We divide by the stock price to account for the fact that stocks with higher stock prices will have mechanicallyhigher earnings per share.
20

of the stock (Fund - Market Weight) with the Business Group Industry Dummy variable. The
coefficient on this interaction term indicates that for stocks in the same industry where the business
group has operations, a 10 percent over-weighting is correlated with a mean forecast error increase
of 62 basis points. Column (3) uses the continuous variable Business Group Industry Weight as a
measure of the business group’s exposure to the industry of the stock; here we find that the effect
of the weighting (Fund - Market Weight) variable is strongest for stocks where the business group
owner has greater exposure to the industry. Overall, the results suggest that business groups have
information about future earnings beyond that of analysts.
In Columns (4) and (5) we focus on sub-samples of stock holdings where the over-weighting
of the stock holding was in the top 10 percent of over-weightings overall. In Column (4) we find
that amongst these highly over-weighted positions there is a larger analyst forecast error for stocks
in the same industry as the business group (50 basis points). Column (5) uses the continuous
measure of the group’s exposure to the stock industry; here we find a 10 percent increase in the
weight of the business group’s assets in the industry of the stock is correlated with an 8 basis point
larger forecast error. In Columns (6) and (7) we test whether the business group exposure variables
predict analyst forecast errors when the business group-owned fund under-weights the stock. We
would expect that if business groups were purposefully under-weighting stocks where they had
private information of future poor performance, then the business group variables would predict
negative mean forecast errors. The business group variables, however, have positive coefficients and
the dummy variable specification (Column (6)) is significant at the ten percent level. This result
is not too surprising, however, given that we found that under-weighted Same Industry stocks did
not perform substantially worse than under-weighted Different Industry stocks.30
4.4 Results: Portfolio Returns
We now test whether this informed trading drives business group-owned funds to have better
performance overall. We first introduce a fund level measure, the Business Group Index (BGI),
which is a quantitative measure of how much the fund focuses on Same Industry stocks. Our
30We also tested whether coefficient on the Business Group Industry Dummy variable in Column (4) is larger thanthat an Column (6), and found that it is significantly larger at the ten percent level. However, we do not have thepower to reject the hypothesis that the coefficient on the Business Group Industry Weight variable in Column (5) isequal to the corresponding coefficient in Column (7)).
21

Business Group Index is calculated for fund i in month t as follows:
BGIi,t =10∑
j=1
γi,j,t|wi,j,t − wj,t| (1)
γi,j,t is an indicator variable for whether the business group that owns fund i had greater than
5 percent of its total capital stock in industry j at time t. We use the 5 percent cut-off to avoid
defining business groups as having a presence in an industry where they have a very small level
of assets. wi,j,t is the value weight of fund i in industry j at time t. wj,t is the market weight in
industry j at time t. Note that we take the absolute value of the difference between the fund’s
weight and the market’s weight; this causes funds that purposefully either over-weight or under-
weight certain industries where they have a presence to have a higher BGI index. Overall, our
BGI index will be larger for a fund if the fund invests in industries where the business group has
a presence, and will be larger in the case where the fund strongly over-weights or under-weights
(relative to the market) industries where the business group has a presence. We are interested in
testing whether having a higher BGI index is correlated with stronger return performance at the
fund level. We also analyze versions of the BGI index that separately measure whether the fund
tends to overweight stocks in related industries (“BGI Overweight”) versus underweight stocks in
related industries (“BGI-Underweight”).
Table 5, Panel A, presents summary statistics on the performance of all Indian equity funds,
non-business group owned funds, and business-group owned funds. The first two columns weight
funds equally in computing average returns, while the remaining columns compute returns weighing
funds by the total value of the fund. When we calculate equal weighted returns, we find all of these
groups have had an approximate 2 percent month return over our sample period, and business
group funds have a 9 basis point per advantage, although this is not significant at the ten-percent
level. Turning to raw and excess value-weighted returns (Columns (3) and (4)), we find business
group funds have a 14 basis point advantage, with t-statistics of 1.38. In Columns (5) and (6) we
focus on holdings based returns, i.e. the return of a fund is calculated based on the returns of the
stocks held at the end of the previous month. Focusing on holdings based returns, we find larger
and more statistically significant advantages of 18 to 21 basis points per month. The four factor
22

alpha value weighted returns in Column (7), however, returns to 14 basis points per month and
is not statistically significant. Taken together, these results provide some suggestive evidence that
business group funds may have an an advantage over other funds, but this advantage is likely to
be small.
It is perhaps not that surprising that business-group funds do not appear to have a strong
advantage in overall returns, because there may be important constraints on how much they can
exploit their proprietary information on related industries. For example, focusing too much on same
industry stocks could increase idiosyncratic risk in a way that is not compensated by the additional
returns.31 Or, too much of a focus on Same Industry stocks might attract unwanted regulator
attention. We note that, even if business group affiliated funds do not have a large advantage in
general, this does not mean that the welfare consequences of business groups exploiting information
on related industries are small. The small average out-performance may mask the fact that some
business groups, or types of funds within business groups, exploit this advantage substantially and
create large welfare losses accordingly. In the next table we show that business groups that focus
more on related industry stocks do have substantial out-performance at the fund level.
Table 5, Panel B, presents summary statistics on the returns business-group owned funds earn
by the level of investment in business group related sectors. At the end of each month, funds
affiliated with business groups are sorted into quintiles based on their BGI index (see Equation (1)
for the definition of the BGI index) and average returns are calculated over the next one month. The
rows refer to the average returns earned by funds in each quintile of the BGI index. Funds classified
in the BGI quintile 5 are funds that are the most over-weighted/under-weighted towards industries
where the business group has operations. Column (1) presents the equal-weighted average monthly
return of funds in these different quintiles of the BGI index. The bottom row shows the difference
between the monthly return in quintiles 1 and 5 of the BGI index. We find that funds in the 5th
BGI quintile earn approximately 24 basis points more per month than funds in the 1st BGI quintile
(significant at the 10 percent level). Column (2) calculates monthly excess returns by subtracting
out the risk-free rate. The gap between BGI quintile 5 and 1 funds remains the same at 24 basis
points, with the same level of significance as Column (1).
31We examine this issue more carefully in Section 6 when we formally estimate the fraction of funds that couldactually increase their Sharpe ratio by investing more in Same Industry stocks.
23

In the remaining columns we focus on value-weighted returns, as our previous stock-level results
suggested that there is important information in the weighting of the Same Industry stocks across
funds. We find that funds in the 5th quintile of the BGI index earn 48 basis points more per month
than those in the 1st quintile, and this simple difference is significant at the 5 percent level. We find
this difference ranges from 48 to 56 basis points when we risk-adjust by looking at excess returns
over the market index, calculate CAPM alphas (Column 7), or FF Carhart alphas Column (8),
and all of these differences are significant at the 5 percent level. Overall, the results suggest that
business-group owned funds that focus on Same Industry stocks have substantially higher returns.
One thing to note about the results in Panel B is that when we value-weight returns across funds
(Columns (3) - (6)) the advantage of a high BGI mainly appears in the fifth (highest) quintile. This
is likely due to the fact that BGI does not increase linearly across the BGI quintiles. Over BGI
quintiles one through four the mean BGI in the quintile increases by .07 points across successive
quintiles. However the change in the mean BGI from quintile four to five is .25 points; this suggests
that the effect appears mainly in the highest quintile because there is not as much variation in BGI
in the lower quintiles. It is important to note, however, that 15.4 percent of assets of business-group
owned mutual funds is in BGI quintile 5, suggesting that a large fraction of funds is deployed in
assets that appear to have a strong advantage.
Panel C explores the fund level results further, by separating the sample first by whether the
fund is more or less “active,” in the sense that its positions in stocks are different from the market
weighting of stocks. We use the “Active Share” measure first defined in Cremers and Petajisto
(2009) to quantify how active a fund is:
Active Share =12
N∑
i=1
|ωfund,i − ωindex,i|
ωfund,i is the fraction of the fund’s value in stock i, and ωindex,i is the fraction of the fund’s
benchmark index portfolio in stock i. The sum is taken over all stocks held by the fund plus all
stocks in the benchmark index not held by the fund.32 In calculating the average return in month t
funds are first sorted on their Active Share measure as calculated in month t−1, and then based on
32We assume that funds benchmark themselves against a portfolio of all Indian stocks available on CompustatGlobal. Dividing by two normalizes the Active Share index to lie between 0 and 1, as there is no short-selling reportedin our data.
24

the BGI measuare in month t− 1. Our BGI measure already incorporates Active Share somewhat,
because we are looking at over- and under-weighting of stocks, but the advantage of first sorting
by Active Share and then comparing high and low BGI funds is that we might expect that high
BGI funds will do even better compared to low BGI funds that also attempted to have a high
Active Share. We find some evidence for this, as in Columns (4)-(6) we find the returns difference
between high and low BGI funds is between 54 and 64 basis points per month (all significant at
the 5 percent level).
4.4.1 Robustness of Portfolio Results: Holdings Based Portfolio Returns
In Panel A, Table 6, we use a holdings based return measure to examine the effect of the business
group concentration index on mutual funds’ stock selection skills. Each month we sort the business
group affiliated funds into quintiles based on their BGI measure. We then calculate that month’s
return as the return on the portfolio holdings at the beginning of the month. Table 6, Panel A
reports the average holding-based returns for the funds in different BGI quintiles.
The results are consistent with the previous results on portfolio returns in Table 5. Columns (1)
and (2) compute returns across funds by weighting funds equally, while Columns (3) - (5) weight
funds according to their value. Beginning of the month stock holdings of the funds in the top BGI
quintile outperform the holdings of the funds in the bottom BGI quintile by 32 basis points per
month (raw holdings-based returns and size-adjusted returns), and this difference is significant at
the 5 percent level. The simple value-weighted and value-weighted size-adjusted holdings based
return differences are larger at 39 and 36 basis points per month respectively. The most conservative
estimate of stock selection skills is the industry adjusted return in column (5), which controls for
the overall performance of all the same industry stocks in a given month. This measure captures the
stock selection skills of a mutual fund manager within an industry. The high BGI funds outperform
the low BGI funds by 23 basis points per month after adjusting for the overall industry returns,
and this result is significant at the 10 percent level. Panel B conducts a similar analysis to Table
Panel C, where we first split the sample by the Active Share of the portfolio. Again, we find that
the advantage of business group funds with high BGI is even larger amongst these high Active
Share funds.
25
4.4.2 Robustness of Portfolio Returns: Regression Analysis
We next examine the relationship between the BGI index and fund performance using multivariate
pooled-panel regressions that allow us to control for fund characteristics known to affect future
returns (e.g. Chen et al. (2004) document a negative relationship between fund size and future
returns for US mutual funds). The results are reported in Table 7. The dependent variable is
either the fund’s excess monthly returns above the S&P 500 CNX index (Columns (1) - (6)) or
size adjusted holdings-based monthly returns (Columns (7) - (8)). The independent variables are
lagged by one month and include the BGI index, BGI Overweight (equal to BGI for over-weight
positions and zero for under-weight positions), BGI Underweight (equal to the BGI index for under-
weight positions, and zero for over-weight positions), the Industry Concentration Index (“ICI”, see
Kacperczyk et al. (2005)), the Active Share of the fund, fund size (log of Total Net Assets), the
expense ratio, log of Fund Age, and monthly fund flows.33 All of the specifications also include
a fixed effect for the owner of the business group; this controls for the possibility that certain
business groups have better performance overall. We also include fund style fixed effects based on
the Morningstar style classifications.34 We cluster our standard errors at the fund level.
The coefficient corresponding to BGI is positive and significant at the 5 percent level in Columns
(1) through (4), where we just focus on the continuous BGI measure. Column (1) shows the
correlation between the BGI index and the fund’s monthly return over the index conditional on our
owner and style fixed effects. This correlation is significant at the five percent level and economically
meaningful; a one standard deviation increase in the BGI measure leads to an approximate 9 basis
point increase in the fund’s excess performance above the market index per month. This confirms
our earlier finding that fund returns increase with increasing investment in stocks in industries
where the business group owners have a significant presence. In Column (2) we add controls for the
fund’s size, age, expense ratio and monthly flows. Including these controls does not substantially
change the coefficient on the BGI index. Column (3) includes the industry concentration index
(ICI) studied in Kacperczyk et al. (2005). We are interested in whether part of our result is
33BGI Overweight is a measure of the business group index that only values over-weighting in indus-tries where the group operates, but does not value under-weighting. It is defined as BGI overweighti,t =∑10
j=1γi,j,t max {wi,j,t − wj,t, 0}. Analogously, BGI Underweight is defined as BGI Underweighti,t =
∑10
j=1γi,j,t|min {wi,j,t − wj,t, 0}|.
34Morningstar classifies funds in to value, blend, or growth styles and separately as small, mid, or large capitlizationstyles. We define each of the nine possible combinations of these definitions as a style.
26

driven not by the exposure to related industries, but instead simply because high BGI index funds
concentrate on a smaller set of industries. We find, however, that the inclusion of the ICI control
variable actually slightly increases the coefficient on the BGI variable. In Column (4) we control
for the Active Share of the fund directly as in Cremers and Petajisto (2009), and find that the
this does not change the coefficient on BGI substantially. This result suggests that the business
group advantage in related industries is not coming solely from the fact that these funds take more
active positions, but instead because these funds take more active positions specifically in related
industry stocks.
In Column (5) we break down the effect of the BGI index in to the effect due to over-weighting
stocks in the related industries and under-weighting stocks in related industries. We find that over-
weighting the related industry stocks is positively and significantly correlated with out-performance,
whereas under-weighting the related industries is not. This suggests that mutual fund managers
primarily take advantage of the information within business groups by over-weighting stocks where
they have more information (consistent with our stock level results). In Column (6) we break down
the relationship between BGI and fund performance across high and low Active share funds, and
find that the relationship is driven primarily by high Active Share funds.35 Columns (7) and (8)
show that the results are similar when we use holdings based size adjusted returns as the dependent
variable.
4.4.3 Robustness of Portfolio Returns: Alternative Definition of Related Funds Using
Sector Funds
To provide some re-assurance that our results on portfolio returns are not due to the specific way
we have defined our business-group index, here we use an alternative natural definition that takes
advantage of the Indian institutional context. We define a fund as being “connected” to the business
group’s industries if the theme of the fund is a sector where the business group has a major presence.
For example, the Reliance Diversified Power Sector Fund is a fund set up to specifically invest in
the energy sector. Given that Reliance has substantial real operations in energy, it seems plausible
that a related sector fund like this would out-perform. We view this as a simple alternative way to
define certain funds as being more closely related to the business group’s real operations.
35A fund is defined as high Active Share if it falls above the median Active Share measure for all funds.
27

Table 8 presents these results. Note that the sample here only includes sector funds because
we are primarily interested in the comparison of sector funds that are in related industries versus
sector funds that are in unrelated industries. Columns (1) and (2) focus on all sector funds, (3)
and (4) on business group sector funds, and (5) and (6) non-business group owned sector funds.
The regression model is the same as that in Table 7, the only difference being the introduction of
the Same Industry variable, which equals 1 if the sector fund is in a sector that overlaps with one
of the major areas of operation of the firm that owns the mutual fund. Note that it is possible for
a non-business group owned fund to have Same Industry equal to one because there are financial
firms that own mutual fund companies, and those financial firms might market a financial sector
focused mutual fund.
Column (1) shows that sector funds in the same sector as one of the fund owner’s major business
lines earn approximately 70 basis points more per month (significant at the one percent level).
Column (2) shows this result holds when we introduce fund owner fixed effects and a set of standard
control variables regarding performance. Columns (3) and (4) tests whether business group owned
sector funds that focus on a sector where the business group has operations out-perform business-
group owned funds that focus on a sector that does not overlap with the business-group owner’s
major operations.36 Without controls, the business group out-performance of related sector funds
is 84 basis points per month, and with controls it increases to almost 100 basis points per month.
Columns (5) and (6) repeat the analysis for non-business group sector funds; we also find that these
sector funds outperform when they focus on an industry where the non-business group fund owner
operates.
4.5 Financial Conglomerates
Our main analysis has focused on broadly diversified business groups in India, as these are the
types of firms that have received attention in the broader business groups literature (Khanna
and Palepu, 2000). Nonetheless, our hypothesis could plausibly apply to mutual fund companies
owned by financial conglomerates, such as mutual fund companies that are owned by banking
firms. In Appendix Table 6 we test whether a portfolio of financial stocks held by funds owned by
36We do not need to control separately for a Same Industry dummy here because a non-sector fund can never bedefined as Same Industry.
28

financial companies outperforms a portfolio of non-financial stocks held by funds owned by financial
companies. Panel A includes all stocks held by financial company owned mutual funds, and splits
them in to two portfolios: non-financial stocks and financial stocks. We find that the financial
stock portfolio earns approximately 57 basis points more, although this result is not statistically
significant at conventional levels. Panel B restricts the sample within each portfolio to those stocks
in the top 10 over-weight percentile. Given we are restricted to only financial sector stocks, the
number of stocks in this portfolio averages only 19 per month. This limits the statistical power of
these tests. Focusing on the over-weight sample we find that the difference between financial and
non-financial stocks is only 51 basis points, and again not significant at standard levels. Overall,
the results suggest that mutual funds owned by financial firms do not seem to enjoy the same
informational advantage that funds owned by more diversified business groups do, although we do
not have the power for any strong conclusion.
5 Sources of the Business Group Advantage
5.1 Specific Information Event Channel
One method business groups could use to generate a return advantage is to gather non-public
information about major events in their industries. For example, managers on the real side of
the business might provide fund managers information about impending mergers or major capital
announcements in the industry.37 In this Section we explore to what extent trading on specific
information events can explain the business-group advantage in Same Industry stocks.
Table 9 presents our main comparison between Same Industry and Different Industry stocks,
however now we exclude any stock that was involved in a merger or acquisition in a given month.
If trading ahead of merger and acquisition events represents a large share of the business group
advantage in Same Industry stocks then we would expect the difference in abnormal returns across
Same and Different industry stocks to decline when merger/acquisition stocks are excluded. We
find that the difference in Same-Different portfolio has a value weighted size adjusted return of 49
basis points per month (significant at the 10 percent level), which is very similar to the difference we
found in our full sample (Table 3). Table 9, Panels B and C exclude stocks affected by any capital
37For a detailed analysis of the stock price returns to capital expenditure announcements see Gopalan et al. (2013).
29

expenditure project announcement (Panel B) or those affected by a major capital expenditure
announcement (Panel C). Again, we find that the main results are similar even when we exclude
these project-related stocks, suggesting that information about future project announcements does
not drive a large part of the business group advantage.
Given that mergers and capital expenditure announcements are the most common unpredictable
announcements that affect stock prices, the fact that our main results change very little when we
exclude stocks affected by such events suggests that trading on specific information events is unlikely
to be a major explanation for our findings. To further explore this, in Appendix Table 7 we test
whether business groups earn higher returns on Same Industry stocks versus Different Industry
stocks that are affected by mergers. First, it is important to note that on average there are only
four stocks in any given month that are affected by a merger and in the Same Industry portfolio.
We find no evidence of out-performance of Same versus Different Industry stocks that were were
affected by mergers. We also find insignificant differences between Same and Different Industry
stocks that announced major capital expenditure projects (Panel B). When we focus on major
capital expenditure announcements (Panel C) we do see some out-performance in Same Industry
stocks. This is interesting evidence that business group managers may have early information
about major announcements in their industry, but it is not plausible that trading ahead of these
major announcements drives our main results on the business group advantage because of the small
number of stocks involved.
5.2 Business Group Information Channel
Another simple hypothesis is that business groups use private information about the performance
of their own group companies to generate returns in related industries. We have already shown
that they do not use this information to trade within their own group stocks; however, another way
business groups could exploit this information is by trading in stocks whose performance is highly
correlated with their own group stocks. For example, if a business group mutual fund manager
learns that earnings at one of his group’s divisions are going to be particularly good, he can exploit
this information by buying stocks of firms that are likely to experience a similar earnings shock. 38
38To our knowledge there is little research documenting specific ways different divisions of business groups helpeach other. Some previous research has looked within mutual fund families within the U.S. and found evidence oflower value funds supporting higher value funds (Gaspar et al., 2006; Nanda et al., 2004).
30

If this hypothesis is correct, then we should observe that the business group advantage in Same
Industry stocks is largely driven by the performance of their own business group stocks around the
same time. Table 10 presents a test of this hypothesis.
The first row presents the returns on a portfolio of the stocks of the business group companies
weighted by market cap, as an index of how the business group stocks have performed over our
sample period. The raw returns of business-group owned stocks have been 2.08 percent per month
(significant at 5 percent level), but size-adjusted and Fama-French Carhart 4 Factor returns have
been relatively small and statistically insignificant. Row 2 also presents returns on business-group
owned stocks, except they are weighted in proportion to how much business-group owned mutual
funds own stocks in the same industries as these specific business-group stocks. In particular, for
each fund owned by a business group in each month, we create a set of weights based on the fraction
of holdings in each industry. We then calculate the return an investor would earn if he invested,
according to those industry weights, only in the stocks of the firms owned by the business group
(owned in the sense that the firm is a part of the business group). The key result is presented
in the last row; we find that adjusting for the return on this own-business-group stocks portfolio,
where the weightings are according to the weightings of industries in business group mutual funds,
reduces the business group advantage in Same Industry stocks to close to zero. This suggests that
much of the business group advantage can be explained by movements in business group-owned
firm stocks.
Panel B of Table 10 presents the analogous results where we focus on stocks that were in the
top ten percent of the over-weight distribution. Among these over-weighted stocks we find that
adjusting for the returns earned in business group stocks also reduces the returns substantially.
For example, focusing on the Fama-French Carhart 4-Factor returns, Same Industry stocks in the
top ten percent of the overweight distribution earn abnormal returns of 81 basis points per month.
However, when we adjust this return by the return on business group owned stocks this return falls
to 11 basis points per month (statistically insignificant). These results again suggest that much of
the business group advantage in Same Industry stocks comes from knowledge that is also relevant
for the performance of the business group’s own stock.
Business group mutual fund managers are also likely to have better information on the future
performance of major customers and suppliers of business group affiliated firms. Cohen and Frazzini
31

(2008) find that publicly available information on customer/supplier links can be used to predict
returns in the U.S., so it seems plausible that business group fund managers could use private
information on their own group firms’ performance to predict how customer and supplier firms to
the group will perform. We use data from the United States Bureau of Economic Analysis input-
output tables to define industries that are major customers or suppliers to the industries where
a given business group operates.39 We then test whether business group mutual fund holdings of
these customer/suppliers also show abnormal returns. Table 11 presents these results.
Panel A defines Related stocks as those that are in the same Bureau of Economic Analysis
(BEA) industry as one of the industries where the business group operates. These results should
be similar to our previous results on Same Industry stocks; we find that stocks in the same BEA
industry earn between 35 and 45 more basis points per month than those in unrelated industries.
Note that the Unrelated industries group excludes any stock that is in the same industry or in a
customer/supplier industry of the industries where the business group operates. Panel B defines
Related stocks as those that are in a major customer industry of the BEA industries where the
business group operates. We find that business-group owned mutual funds earn between 49 and 64
basis points more on their investments in customer industries than they do in Unrelated industries,
and these results are significant at the 10 percent level in two out of three cases. For supplier
industries, however, we find the corresponding difference to be between 22 and 26 basis points, and
not significant at the 10 percent level.
5.3 Manager Selection
Another possible mechanism is that business group mutual funds attract fund managers who have
knowledge specifically about the real industries where the business group operates; i.e. our results
39We first merge the annual BEA Input-Output Use Tables from 2001 to 2011 with the Prowess Accounting Datafor the fiscal year ending in the next year’s March (e.g March 2002 to March 2012 in our case). The BEA Input-Output tables report the amount of inter-industry flow of goods and services between 66 private sector industries. Weuse this information to identify 5 major customer industries and 5 major supplier industries for each of the 66 BEAindustries. Each business group firm is then matched to one of the 66 BEA industries by mapping the NAICS code tothe NIC code (BEA industries are defined based on NAICS codes). If a business group has more than 5 percent realassets in a given BEA industry, that industry is classified as “Same Industry” for this business group. The customerand supplier industries for a business group are then identified as the top 5 customer and supplier industries of thecorresponding BEA industry. The “Same Industry” set is excluded from the customer-supplier industries if there isan overlap. Next each stock in the Indian stock market is mapped to one of the 66 BEA industries. For each businessgroup mutual fund we can now classify each stock holding as belonging to the same industry or to a customer or asupplier industry.
32

are driven by the selection of managers that work for business groups. Perhaps the most plausible
cause of this type of selection is that business groups recruit fund managers from other divisions
within their firm. For example, the business group might recruit a successful manager from their
manufacturing division to manage a fund focused on manufacturing stocks.
Appendix Table 8 presents summary statistics on the work and educational history of non-
business group versus business-group managers. Using the names of the 376 fund managers in the
Morningstar database, we conducted manual online searches to collect information on the work and
educational experience of business and non-business group fund managers. We were able to find
this work experience information for 83 percent of these managers, and education information for
60 percent of these managers.
Non-business group and business group managers have 13.9 and 14.4 years of experience re-
spectively, and these are not statistically different at the 10 percent level.40 Panel B classifies
managers based on their work experience. Only 1.3 percent of mutual fund managers have any
work experience outside of the financial industry. This makes it seem unlikely that our results are
largely driven by mutual fund managers who have gained work experience in other industries while
working in other divisions of their business groups. Business group fund managers are actually
slightly more likely to have mutual fund experience. 22 and 21 percent of non-business group and
business group managers have worked only in the mutual fund industry, and 69 and 75 percent
of managers have worked in the mutual fund and other financial industries. In terms of graduate
degrees (Panel C), business group mutual fund managers are also, if anything, more concentrated
in the finance area. They are more likely to have MBA, chartered accountant (CA), chartered
financial accountant (CFA) degrees and less likely to have masters of science degrees.41 Lastly,
business group managers are also more likely to have business related undergrad degrees such as
the BCOM, and less likely to have technology degrees such as the BTech. Overall, it seems unlikely
that business group managers have substantial work experience in other parts of the business that
allows them to have an investing advantage, nor do they have meaningfully different educational
backgrounds.
40Most fund managers have an online bio where they report the number of years experience they have in themutual fund industry; we use this self-reported number as our measure of years experience in the industry.
41Non-business group fund managers are more likely to have post-graduate degrees in management (PGDM), butoverall they are still less likely to have finance-related degrees when you compare the overall proportion in MBA, CA,CFA, and PGDM programs.
33

To further test whether information in the form of managerial capital is likely to explain our
results, we assess the investment style of managers who transitioned in to and out of business group
mutual funds. If manager selection is an important determinant of the business group advantage in
Same Industry stocks, then we would expect managers to demonstrate a similar investment style
both before and after they join the business group. We test this prediction in the sample of 14
business group fund managers that either transitioned into our out of a business group.42 Together
these managers have managed a total of 74 mutual funds, of which 36 are business-group owned
funds.
Table 12 presents these results. In Column (1) the sample includes all fund*month observations
for any manager that managed a business-group fund and a non-business-group fund for at least
one month in the sample. The dependent variable is the fund’s return minus the return on the
S&P 500 CNX index. Bgroupstockret is a variable that measures the market cap weighted return of
the publicly traded firms in the business group where the relevant manager worked. For example,
take a manager who transitioned from a non-business group fund house such as the Unit Trust of
India, to a business-group fund such as Reliance. The Bgroupstockret variable for this manager in
any given month would be the market cap weighted return of all the publicly traded firms owned
by the Reliance business group minus the S&P 500 CNX return43; Bgroupstockret is a measure
of the abnormal return available on the business group’s own stock in a given month. The main
independent variable of interest is Max(Bgroupstockret,0). Because Indian mutual funds do not
short stock, a business group managed fund has the best opportunity of taking advantage of their
information when their own stocks have positive abnormal returns. The Bgroup Current variable is
a dummy for those fund-month observations where the manager worked at the business group. For
example, if a manager worked for the Unit Trust of India for January 2007 - December 2008, and
then switched to the business-group owned fund from January 2009 through the end our sample,
this variable would equal 1 for this second period.
We are primarily interested in the Max(Bgroupstockret,0) variable and its interaction with
the Bgroup Current variable. The coefficient on the Max(Bgroupstockret,0) variable measures the
4213 of these managers have worked for one business group and at least one non-business group. One managertransitioned from a business group to a non-business group and then to a different business group.
43To be consistent with our previous results, we only include industries where the business group allocates morethan 5 percent of its total assets.
34

correlation between the abnormal returns available in the business group stocks and the abnormal
returns earned by the fund the manager is currently operating. A positive and significant coefficient
on this variable would suggest that managers who work for business groups tend to have abnormal
returns that are similar to the business group they worked for. The coefficient on the interaction
of this variable and the Bgroup current variable measures the correlation specifically for when the
manager in question was actually working at the business group. The finding of a close to zero
and insignificant coefficient on the main variable, and a positive and significant variable on the
interaction suggests that business group managers do not use a similar strategy when they were
not working for the business group. Their strategy mimics the business group firm stocks only
when the manager works at the business group.
Columns (2) - (4) separate the sample into the fund*month observations where the manager
worked at the business group (Column 2), the fund*month observations where the manager worked
for a business group in the past but now no longer does so (Column 3), and the fund*month
observations where the manager will work for a business group in the future (Column 4). The
results from these columns show that the manager’s abnormal returns are only correlated with
the business group’s abnormal returns when he works at the business group, again suggesting
that business groups are not specifically hiring managers who specialize in related industries. The
remaining columns report the same tests but measure holdings based returns and holdings based
sized adjusted returns. The results are similar.
6 Can Business Group-Owned Funds Exploit the Business Group
Advantage More?
Could fund managers working for business groups increase their performance by investing a greater
fraction of assets in stocks in the same industry as their business group? In other words, would the
additional expected returns earned by investing more in Same Industry stocks be large enough to
justify the additional idiosyncratic risk? We evaluate this question as follows. For each mutual fund
portfolio we calculate a Sharpe ratio on a portfolio of just the Same Industry stocks, and another
Sharpe ratio for the portfolio as a whole. The Sharpe ratios are calculated using the monthly
holdings based returns for each fund over the entire sample period and the standard errors are
35

estimated using the methodology in Lo (2002).44 These results are presented in Table 13. The
first row presents the mean, 25th percentile, 50th percentile, and 75th percentile of the Sharpe
ratios across the 97 funds in our sample. The second row takes the portfolio of Same Industry
stocks within each fund and calculates the same summary statistics on the Sharpe ratio. The third
row calculates the summary statistics on Sharpe ratios for a portfolio that only included different
industry stocks. Note that the Same Industry stock Sharpe ratio is higher at the mean, 25th, 50th,
and 75th percentiles than the Different Industry portfolio Sharpe ratio. This is consistent with our
previous results on the out-performance of Same Industry stocks.
The fourth row subtracts the Sharpe ratios of the All Holdings portfolios from the Same Industry
stock portfolios. Here we find that, on average, Same Industry stocks do not have a higher Sharpe
ratio. But when we look at the median and 75 percentile of the difference, we find positive values.
The fifth row summarizes this information. We find that 13 percent of funds have a statistically
significant higher Sharpe ratio in their Same Industry stock portfolio versus their whole portfolio.
Columns (6) through (9) present the same calculations as in Columns (2) - (5), but now the Sharpe
ratios are calculated with size adjusted abnormal returns. With the size adjusted abnormal returns,
we find that 34 percent of funds have a significantly larger Sharpe ratio in their portfolio of Same
Industry stocks versus their full portfolio. Given the overall small number of business group funds,
it is difficult to determine precisely the number of funds that could improve their performance
by focusing more on Same Industry stocks, but these results suggest that there are a reasonable
number of funds that could take more advantage of this.
We see a few plausible explanations for why business group funds have not exploited this
advantage more. First, if all funds in a business group were to focus on Same Industry stocks,
regulators would likely observe this and potentially create new regulations limiting business group
participation in the industry. A second possibility is that individual fund managers in business
groups have cultivated contacts within the group to gain information, but choose not to share
this information with other managers due to career concerns. In this case, it is possible that the
advantage will become larger over time as high-level business group executives devise incentives to
encourage the sharing of this type of information to all business fund managers. Distinguishing
44In particular, we use the formula given in equation (9) of Lo (2002), which is the standard error of a Sharperatio estimated on a portfolio with identically and independently distributed returns.
36

these explanations is not possible with the currently available data, so we leave this for future work.
7 Conclusion
Business groups dominate formal economic activity around the world, and it seems natural that
they would play an important role in the development of the asset management industry in emerging
markets given their financial strength and brand reputation. A potential problem with business
groups owning mutual funds, however, is that they may take advantage of proprietary information
generated in their real operations to gain an informational advantage in financial markets. We find
evidence that Indian business group owned mutual funds do appear to have such an advantage. A
portfolio of “Same Industry” stocks (stocks held by business group-owned funds in industries where
the business group has real operations) earns on average 6 percent more per year than a portfolio
of stocks in unrelated industries; this difference increases to 13 percent per year when we focus on
those stocks that business group funds choose to substantially over-weight. We find these stock
level results are robust to a variety of different risk-adjustment methods, and beyond any general
advantage the mutual fund industry has in industries that are generally related to business groups.
We find some evidence that funds focused on these related industry stocks perform better overall,
although some funds could improve their performance (as measured by Sharpe ratios) by focusing
even more on Same Industry stocks.
While we have focused on the mutual funds industry, our results highlight that regulators should
be cognizant of the informational advantage business groups may have in designing regulation in
emerging markets across many financial industries. As an example, consider the debate on whether
business groups should be allowed to enter the banking sector. Information transfer from the bank-
ing division to other divisions within a business group could have important welfare consequences.
Most directly related to this paper, business group-owned mutual funds might trade on propri-
etary information about borrowing behavior among borrowers of their banking division, making
profits at the consequence of less informed investors. More broadly, the banking division of the
business group might reveal proprietary information on the product design or capital budgeting
decisions of borrowers to other divisions within the business group, giving business group divisions
an opportunity to “front-run” on profitable business ideas.
37

We conclude with a few areas for future research. As noted in our introduction, our paper
does not offer a full welfare evaluation of the presence of business groups in the asset management
industry; there are likely important benefits of business group participation in the asset management
industry as well. One important area of future research is to test whether consumers are more
likely to adopt formal financial products, such as bank accounts, mutual funds, and life insurance,
that are marketed by brands they are familiar with, such as major business groups. Another
interesting avenue is to better understand how divisions within business groups share information,
and whether this process of sharing information can shed light on why business groups dominate
economic activity in so many countries. More clarity on the costs and benefits of business group
participation in specific sectors, such as the mutual fund industry, is clearly important for devising
welfare enhancing regulation in emerging markets.
38

References
Almeida, Heitor V and Daniel Wolfenzon, “A theory of pyramidal ownership and familybusiness groups,” The Journal of Finance, 2006, 61 (6), 2637–2680.
Anagol, Santosh and Hoikwang Kim, “The Impact of Shrouded Fees: Evidence from a NaturalExperiment in the Indian Mutual Funds Market,” American Economic Review, 2012, 102 (1),576–593., Vijaya Marisetty, Renuka Sane, and Eshwar Venugopal, “On the Impact of RegulatingCommissions: Evidence from the Indian Mutual Funds Market,” 2013. Working Paper.
Angrist, Joshua and Jorn-Steffen Pischke, Mostly Harmless Econometrics, Princeton Univer-sity Press, 2009.
Atanasov, Vladimir, Bernard Black, Conrad Ciccotello, and Stanley Gyoshev , “HowDoes Law Affect Finance: An Examination of Equity Tunneling in Bulgaria,” Journal of Finan-cial Economics, 2010, 96, 155–173.
Bae, Gil, Youngsoon Cheon, and Jun-Koo Kang, “Intragroup Propping: Evidence fromthe Stock-Price Effects of Earnings Announcements by Korean Business Groups,” Review ofFinancial Studies, 2008, 21 (5), 2015–2060.
Baker, Malcolm, Lubomir Litov, Jessica A Wachter, and Jeffrey Wurgler , “Can MutualFund Managers Pick Stocks? Evidence from Their Trades Prior to Earnings Announcements,”Journal of Financial and Quantitative Analysis, 2010, 45 (05), 1111–1131.
Bena, Jan and Hernan Ortiz-Molina, “Pyramidal ownership and the creation of new firms,”Journal of Financial Economics, 2013, 108 (3), 798–821.
Bertrand, Marianne, Paras Mehta, and Sendhil Mullainathan, “Ferreting Out Tunneling:An Application to Indian Business Groups,” Quarterly Journal of Economics, 2002, pp. 121–148., Sendhil Mullainathan, and Parag Mehta, “Ferreting out Tunneling: An Application toIndian Business Groups,” Quarterly Journal of Economics, 2010, 117 (1), 121–148.
Bhattacharya, Utpal, Hazem Daouk, Brian Jorgenson, and Carl-Heinrich Kehr , “Whenan event is not an event: the curious case of an emerging market,” Journal of Financial Eco-nomics, 2000, 55 (1), 69–101.
Bianchi, Marcello, Magda Bianco, and Luca Enriques, “Pyramidal Groups and the Sepa-ration Between Ownership and Control in Italy,” in Fabrizio Barca and Marco Becht, eds., TheControl of Corporate Europe, Oxford University Press, 2001, pp. 154–186.
Chen, Joseph, Harrison Hong, Ming Huang, and Jeffrey D Kubik, “Does fund size erodemutual fund performance? The role of liquidity and organization,” American Economic Review,2004, pp. 1276–1302.
Cheung, Yan-Leung, Lihua Jing, Raghevandra Rau, and Aris Stoutaitis , “Tunneling,Propping, and Expropriation: Evidence from Connected Party Transactions in Hong Kong,”Journal of Financial Economics, 2006, 82, 343–386.
Choudhary, Prithviraj and Jordan Siegel, “A Re-examination of Tunneling and BusinessGroups: New Data and New Methods,” Review of Financial Studies, 2011, forthcoming.
Claessens, Stijn, Simeon Djankov, and Larry Lang, “The Separation of Ownership andControl in East Asian Corporations,” Journal of Financial Economics, 2000, 58, 81–112., , and , “Disentangling the Incentive and Entrenchment Effects of Large Shareholdings,”Journal of Finance, 2002, 57 (6), 2741–2771.
Cohen, Lauren and Andrea Frazzini, “Economic links and predictable returns,” The Journalof Finance, 2008, 63 (4), 1977–2011., , and Christopher Malloy, “The Small World of Investing: Board Connections and MutualFund Returns,” Journal of Political Economy, 2008, 116 (5), 951–979.
39

Coval, Joshua D and Tobias J Moskowitz, “Home bias at home: Local equity preference indomestic portfolios,” The Journal of Finance, 1999, 54 (6), 2045–2073.and , “The geography of investment: Informed trading and asset prices,” Journal of PoliticalEconomy, 2001, 109 (4), 811–841.
Cremers, KJ Martijn and Antti Petajisto, “How active is your fund manager? A new measurethat predicts performance,” Review of Financial Studies, 2009, 22 (9), 3329–3365.
Gaspar, Jose-Miguel, Massimo Massa, and Pedro Matos, “Favoritism in Mutual FundFamilies? Evidence on Strategic Cross-Fund Subsidization,” The Journal of Finance, 2006, 61(1), 73–104.
Ghosh, Pulak, Jayant R Kale, and Venky Panchapagesan, “Do Indian Business GroupOwned Mutual Funds Maximize Value For Their Investors?,” IIM Bangalore Research Paper,2014, (463).
Golez, Benjamin and Jose M Marin, “Price Support by Bank-Affiliated Mutual Funds,”Journal of Financial Economics, 2014. forthcoming.
Gopalan, Radhakrishnan, Meghana Ayyagari, and Vijay Yerramilli, “Insider Ownershipand Shareholder Value: Evidence from New Project Announcements,” Technical Report 2013.
Griffin, John, Tao Shu, and Selim Topaloglu, “Examining the Dark Side of Financial Markets:Do Institutions Trade on Informations from Investment Bank Connections,” Review of FinancialStudies, 2012, 25 (7), 2155–2188.
Halan, Monika, “Mint 50: Mutual Funds to Invest In,” Livemint, 2010.Haushalter, David and Michelle Lowry, “When do banks listen to their analysts? Evidence
from mergers and acquisitions,” Review of Financial Studies, 2010, p. hhq087.Irvine, Paul, Marc Lipson, and Andy Puckett, “Tipping,” Review of Financial Studies, 2007,
20 (3), 741–768.Ivashina, Victoria and Zheng Sun, “Institutional stock trading on loan market information,”
Journal of Financial Economics, 2011, 100 (2), 284–303.Jiang, Guohua, Charles Lee, and Heng Yue, “Tunneling Through Inter-Corporate Loans:
the China Experience,” Journal of Financial Economics, 2010, 98, 1–20.Kacperczyk, Marcin and Amit Seru, “Fund manager use of public information: New evidence
on managerial skills,” The Journal of Finance, 2007, 62 (2), 485–528., Clemens Sialm, and Lu Zheng, “On the Industry Concentration of Actively ManagedMutual Funds,” Journal of Finance, 2005, 60 (4), 1983–2012.
Khanna, Tarun and Krishna Palepu, “Is Group Affiliation Profitable in Emerging Markets?An Analysis of Diversified Indian Business Groups,” Journal of Finance, 2000, 55 (2), 867–891.
Lo, Andrew W, “The statistics of Sharpe ratios,” Financial Analysts Journal, 2002, pp. 36–52.Massa, Massimo and Zahid Rehman, “Information flows within financial conglomerates: Ev-
idence from the banks–mutual funds relation,” Journal of Financial Economics, 2008, 89 (2),288–306.
Masulis, Ronald W, Peter Kien Pham, and Jason Zein, “Family business groups aroundthe world: financing advantages, control motivations, and organizational choices,” Review ofFinancial Studies, 2011, 24 (11), 3556–3600.
Mola, Simona and Massimo Guidolin, “Affiliated mutual funds and analyst optimism,” Jour-nal of Financial Economics, 2009, 93 (1), 108–137.
Nanda, Vikram, Z Jay Wang, and Lu Zheng, “Family values and the star phenomenon:Strategies of mutual fund families,” Review of Financial Studies, 2004.
Rebello, Michael and Kelsey D Wei, “A Glimpse Behind a Closed Door: The Long-TermInvestment Value of Buy-Side Research and Its Effect on Fund Trades and Performance,” Journalof Accounting Research, 2014, 52 (3), 775–815.
40

40
Table 1: Summary Statistics
Panel A reports the total assets under management for Indian equity funds and the proportion of these assets or funds managed by the business-group affiliated mutual funds. USD bn refers to billions of U.S. dollars (conversion from rupees at 50 rupees per dollar). Panel B presents the summary statistics for the Indian equity mutual funds in our sample. Business Group Concentration Index (BGI) is defined in
equation (1) of the text: 𝐵𝐺𝐼𝑖,𝑡 = ∑ 𝛾𝑖,𝑗,𝑡𝑎𝑏𝑠(𝑤𝑖,𝑗,𝑡 − ��𝑗,𝑡)10𝑗=1 , where 𝛾𝑖,𝑗,𝑡 is a dummy variable equal to
1 if the fraction of assets that the parent company of fund i has in industry j is greater than 5% at the end of the previous financial year and is 0 otherwise . 𝑤𝑖,𝑗,𝑡 is the value weight of fund i in industry j at
the end of month t. ��𝑗,𝑡 is the market weight in industry j at the end of month t. See text for other BGI
and ICI variables. Panel C presents the distribution of each business group’s real assets across our 10 industry groups at the beginning of our data sample in year 2003 and at the end in year 2012.
Table 1, Panel A All Mutual Funds Business Group Owner
Year Number of
Funds Total Assets
(USD bn) Number of
Funds Total Assets
( USD bn) % Assets %Funds
(1) (2) (3) (4) (5) (6)
2003 123 5.67 35 1.19 21% 28%
2004 159 8.06 48 1.79 22% 30%
2005 205 14.21 64 3.34 24% 31%
2006 203 20.28 63 5.66 28% 31%
2007 239 35.41 74 10.72 30% 31%
2008 283 20.21 89 6.75 33% 31%
2009 310 37.39 98 13.16 35% 32%
2010 268 36.53 101 14.67 40% 38%
2011 338 37.64 101 10.94 29% 30%
2012 351 40.30 103 10.70 27% 29%
Table 1, Panel B N Mean Stdev Min Median Max
(1) (2) (3) (4) (5) (6)
Total Assets (Rs million) 6481 4703.7 8090.1 0.4 1542.6 81066.2 Fund Age (year) 6481 5.98 3.93 0.08 5.42 18.33 Expense Ratio 6481 2.23 0.46 0.17 2.34 5.23 % Portfolo in Stocks 6481 86.7 7.4 70.0 87.6 100.0 Number of Funds per month 123 52 19 21 51 83 Monthly Return (%) 6481 1.41 7.78 -39.91 1.37 51.66 Monthly Abnormal Return_MktAdj (%) 6481 0.14 3.05 -32.06 0.14 28.23 Active Share 6481 0.75 0.12 0.39 0.74 0.99 Monthly Flow 6241 -0.01 0.09 -0.95 -0.01 0.60 BGI 6481 0.24 0.19 0.00 0.19 1.11 BGI Overweight 6481 0.14 0.16 0.00 0.11 0.89 BGI Underweight 6481 0.09 0.09 0.00 0.07 0.63 Industry Concentration Index (ICI) 6481 0.11 0.19 0.00 0.05 1.06

41
Table 1, Panel C
Consumer Non-
Durables Consumer Durables Healthcare Manufacturing Energy Utilities Telecom
Business Equipment &
Services Wholesale and Retail Finance
(1) (2) (3) (4) (5) (6) (7) (8) (9) (10)
March 2003 Birla Aditya
73.2% 0.5%
21.1% 0.7% 1.5% 3.1%
Escorts
1.2%
79.0%
0.5% 0.3% 18.9% Larsen & Toubro
85.5%
4.7%
1.9%
7.9%
Mahindra & Mahindra
37.2%
12.8%
0.02% 27.6% 2.5% 19.9% Murugappa Chettiar Group 26.1% 2.1%
41.5%
0.3%
0.2% 29.9%
Reliance Group (Anil Ambani) 0.7%
0.5%
41.2% 42.5% 0.0% 0.1% 15.0% Sahara India 80.7%
6.5% 9.4%
0.1% 3.4%
Tata 2.3% 12.6%
26.4% 0.3% 12.6% 16.5% 2.6% 5.5% 21.1% TVS 0.4% 36.6%
3.9%
0.1% 2.7% 7.0% 49.3%
All Business Groups 1.5% 9.2% 0.02% 36.2% 0.2% 12.4% 17.7% 3.8% 3.2% 15.8% Market Weight 6.7% 12.2% 7.4% 14.5% 24.9% 2.4% 3.3% 17.0% 0.7% 10.9% Business Group Affiliated Mutual Fund Weights 8.9% 13.1% 12.1% 17.2% 11.6% 1.2% 3.7% 11.5% 3.2% 17.5% Non Business Group Mutual Fund Weights 8.6% 10.5% 8.4% 21.3% 15.7% 1.3% 1.6% 17.2% 0.4% 14.9%
March 2012 Birla Aditya 0.2%
61.4% 0.03% 0.0001% 28.1% 0.5% 6.1% 3.8%
Escorts
97.4%
2.1%
0.5% Larsen & Toubro
0.1%
65.6% 0.005% 3.2%
1.7% 0.3% 29.1%
Mahindra & Mahindra 0.0002% 38.7%
4.6%
0.02% 23.3% 3.7% 29.6% Murugappa Chettiar Group 13.3%
39.2%
0.1%
0.02% 0.01% 47.4%
Reliance Group (Anil Ambani) 1.1%
40.0% 42.9%
16.1% Sahara India 73.3%
2.9% 0.7% 23.1%
Tata 1.2% 15.8%
29.8%
12.0% 4.7% 10.1% 3.3% 23.1% TVS Iyengar
32.5%
3.6%
1.5%
0.7% 5.4% 56.3%
All Business Groups 0.9% 9.5%
31.9% 0.005% 13.7% 15.0% 6.3% 2.6% 20.0% Market Weight 6.6% 9.3% 5.1% 18.2% 17.5% 5.9% 3.8% 12.7% 2.6% 18.1% Business Group Affiliated Mutual Fund Weights 6.4% 9.8% 9.8% 19.0% 9.3% 5.5% 3.4% 13.3% 1.6% 21.8% Non Business Group Mutual Fund Weights 7.4% 9.4% 6.9% 17.3% 10.3% 5.1% 4.6% 13.9% 0.7% 24.2%

42
Table 2: Business Group Affiliation and Stock Holdings
This table presents the results of regressions of a business group owned fund’s over-weighting in an industry on whether the business group is present in that industry and other controls. The fund sample includes all Indian equity funds owned by a business group in the Morningstar database over the period 2002 – 2013. The unit of observation in Columns (1) – (4) is the fund*industry*month. In the first four columns the dependent variable is Fund Weight – Market Weight, which is defined as the fund’s weighting in industry j minus the market’s weighting in industry j in month t. The Business Group Industry Weight variable is a continuous variable form 0 – 100 that is the fraction of the business group’s real assets in industry j at the end of the previous financial year. The Business Group Industry Dummy variable is an indicator for whether the business group has more than 5 percent of its real assets in industry j at the end of the previous financial year. Columns (5) - (7) pool all mutual fund holdings up to the business group level, so in those columns the unit of observation is the business group*industry*month. Pooling holdings up to the business group level is a natural way to weight larger funds more than smaller funds. t-statistics are in parentheses and *,**,*** indicate significance at the 10, 5, and 1 percent levels respectively.
Dependent Variable: Fund Weight – Market Weight Business Group Weight – Market Weight
(1) (2) (3) (4) (5) (6) (7)
Intercept -0.008*** -0.008*** 0.007 0.007 -0.010*** -0.011*** 0.010
(-3.53) (-2.98) (1.09) (0.97) (-4.65) (-4.61) (1.06)
Business Group Industry Weight 0.083*** 0.102***
(8.82) (8.97)
Business Group Industry Dummy 0.022*** 0.011*** 0.012*** 0.032*** 0.008**
(5.03) (3.55) (3.53) (7.24) (2.27)
Cluster(Fund) Yes Yes Yes Yes No No No
Cluster(Business Group) No No No No Yes Yes Yes
Month Fixed Effects No No No Yes No No Yes
Industry Fixed Effects No No Yes Yes No No Yes
R2 (%) 1.89 0.96 12.45 12.45 7.58 5.26 39.87
Observations 66730 66730 66730 66730 8940 8940 8940

43
Table 3: The Business Group Advantage in Mutual Funds, Evidence from Stock Returns
The Same Industry portfolio includes stocks in industries where the business group has more than 5% real assets. Similarly, the Different Industry portfolio includes stocks where the business group has less than a 5% presence. The stocks within each portfolio are value weighted by the combined dollar holdings by all business group affiliated funds. Value weighted raw returns is the simple return on the portfolio. Value weighted size-adjusted returns subtract the average return in the stock’s market cap quintile before averaging the returns in the portfolio. Value weighted industry adjusted returns similarly adjust based on our 10 industry classification. The Carhart 4-factor alpha is the intercept from a regression of the value weighted portfolio return on the market, book to market, size and momentum factors for Indian stocks. The equal weighted size adjusted returns take the raw average of returns in the stocks irrespective of the size of the holdings in the stock in the mutual fund. The market cap weighted size adjusted returns weight stocks by market cap. The Non-Business Group Adjusted Returns adjusts the portfolio’s return by the return non-business group funds owned on the same set of stocks. All the returns are in monthly percentages. t-statistics are in parentheses and *,**,*** indicate significance at the 10, 5, and 1 percent levels respectively.
Avg number
of Stocks
Value Weighted Returns
Value Weighted
Size Adjusted Returns
Value Weighted Industry Adjusted Returns
Value Weighted 4 Factor
Alpha
Equal Weighted
Size Adjusted Returns
Market Cap weighted
Size Adjusted Returns
Value Weighted
Non-Business
Group Adjusted Returns
(1) (2) (3) (4) (5) (6) (7) (8)
Panel A : All Stocks Different Industry Stocks 226 1.98*** 0.07 0.16 0.11 0.18 -0.15 0.12 (2.80) (0.45) (1.43) (0.71) (1.13) (-1.23) (0.97) Same Industry Stocks 197 2.51*** 0.59*** 0.39*** 0.532*** 0.37** 0.04 0.47*** (2.95) (2.89) (3.11) (2.59) (1.96) (0.36) (2.63) Same-Different 0.53** 0.52** 0.23* 0.42* 0.20 0.19 0.35** (2.08) (2.01) (1.79) (1.90) (1.30) (1.60) (2.01)
Panel B : Top 10 Percentile Overweight Different Industry Stocks 60 1.97*** 0.06 0.17 0.03 0.17 -0.39 0.36
(2.73) (0.20) (0.75) (0.09) (1.04) (-1.56) (1.40) Same Industry Stocks 42 3.08*** 1.20*** 0.78*** 1.02*** 0.52*** 0.30 0.93*** (3.45) (3.77) (3.15) (3.12) (2.77) (1.27) (3.23) Same-Different 1.11*** 1.14*** 0.61** 0.99** 0.36* 0.69** 0.57* (2.49) (2.57) (2.10) (2.32) (1.69) (2.04) (1.74)

44
Table 3, Panel C
In Panel C we focus on stocks in the Same and Different Industry portfolios that business group fund managers chose to under-weight
substantially. In each month we rank stocks based on their over-weighting across all funds. We then take stocks in the bottom ten percentile of
this over-weight distribution in to the Same Industry and Different Industry portfolios as described in Panel A, Table 3.
Average Number of
Stocks
Market Weighted Returns
Market Weighted Size Adjusted
Returns
Market Weighted Industry Adjusted
Returns
Market Weighted 4 Factor Alpha
Equal Weighted Size Adjusted
Returns
(1) (2) (3) (4) (5) (6)
Different Industry Stocks 25 1.54*** -0.32 -0.21 -0.20 -0.13 (2.34) (-1.46) (-1.44) (-1.09) (-0.79)
Same Industry Stocks 27 1.31* -0.54*** -0.44*** -0.32 -0.32* (1.89) (-2.36) (-2.43) (-1.46) (-1.94)
Same-Different -0.23 -0.23 -0.23* -0.13 -0.19 (-1.03) (-1.04) (-1.95) (-0.57) (-1.02)
Table 3, Panel D
Panel D reports average returns for business group mutual fund holdings of firms that are directly owned by the business group. A stock enters
the portfolio analyzed in this table if in month t the stock represents a firm that is owned by a business group, and the business group that owns
that firm’s stock runs a mutual fund that owns the stock.
Average Number of
Stocks Value Weighted
Returns Value Weighted Size
Adjusted Returns Value Weighted 4
Factor Alpha Market Cap Weighted Size Adjusted Returns
Equal Weighted Size Adjusted Returns
(1) (2) (3) (4) (5) (6)
All Stocks 15 2.23** 0.35 0.16 0.21 0.40 (2.09) (0.73) (0.34) (0.63) (1.27)
Top 10 Percentile 3 1.38 -0.02 0.03 0.17 0.92 (0.94) (-0.03) (0.03) (0.21) (1.06)

45
Table 4: Business Group Affiliation and Information Flow: Evidence from Analyst Forecast Errors
This table presents regressions of the mean forecast error across analysts at the stock level on indicators for whether the holding was in an industry where the business group mutual fund owner had real operations. The unit of observation is the stock holding*fund*earnings announcement level. The sample includes all earnings announcements of stocks held by business group owned mutual funds. A stock held by multiple business group funds would appear multiple times as a different holding. The dependent variable, Mean Forecast Error, is the average forecast error (actual minus forecast) across all analysts that made forecasts. Business Group Industry Dummy is an indicator for whether the business group that owns the stock in the current observation also has more than 5 percent of real assets in the stock’s industry. The Business Group Industry Weight variable is a continuous measure of the fraction of real assets the business group owns in the stock’s industry at the end of the preceding financial year. The Fund – Market Weight variable is the difference between the fund’s weighting of the stock and the market’s weighting of the stock. Standard errors are clustered at the quarter level. t-statistics are in parentheses and *,**,*** indicate significance at the 10, 5, and 1 percent levels respectively.
Sample: All Positions Top 10% Overweight Bottom 10% Overweight
(1) (2) (3) (4) (5) (6) (7)
Intercept -0.001 0.000 0.000 0.001 0.002*** 0.001*** 0.001***
(-0.91) (-0.42) (0.26) (1.20) (2.75) (2.41) (3.19)
Business Group Industry Dummy (BGID) 0.002*** 0.001 0.005*** 0.002*
(2.56) (1.74) (2.64) (1.81)
Business Group Industry Weight (BGIW) -0.001 0.008** 0.004
(-0.80) (2.17) (1.26)
Fund – Market Weight (FMW) 0.024*** -0.001 0.008
(3.49) (-0.05) (1.15)
BGID*FMW 0.062***
(2.33)
BGIW*FMW 0.137**
(2.08)
Cluster(Quarter) Yes Yes Yes Yes Yes Yes Yes
R2 (%) 0.76 1.00 0.40 3.93 1.79 1.67 0.78
Observations 11133 11133 11133 1178 1178 1084 1084

46
Table 5: Business Group Industry Concentration and Fund Performance: Portfolio Tests
This table reports raw and risk-adjusted returns for Indian equity mutual funds from 2003 to 2013. Panel A reports the unconditional returns for different subsets of mutual funds. Return over CNX 500 is the return of the fund in excess to the return on S&P CNX 500 index which is a value-weighted index of 500 of the largest stocks traded in the Indian stock market. Columns (5) and (6) calculate returns based on the holdings at the end of the prior month (i.e. they remove returns based on intra-month trades). In Column (5) the size adjustment is done by first subtracting the return in the stock’s given size quintile before averaging to get the portfolio’s return. In Column (6) the industry adjustment is done by first subtract the stock’s industry return (based on our 10 industry classification) and then averaging to get the portfolio return. The Carhart 4-Factor Alpha is obtained from regressing the mean fund returns on market, book to market, size and momentum factors for Indian stocks. All returns are reported in monthly percentage. t-statistics are in parentheses and *,**,*** indicate significance at the 10, 5, and 1 percent levels respectively.
Panel A
Equally Weighted
Return
Equally Weighted
Return over S&P CNX
500
Value Weighted
Return
Value Weighted
Return Over S&P CNX
500
Value Weighted
Size Adjusted Holdings Return
Value Weighted Industry Adjusted Holdings Return
FF Carhart 4- Factor Alpha
of Value Weighted
Excess Return
(1) (2) (3) (4) (5) (6) (7)
All Equity Funds 1.87*** 0.11 1.87*** 0.11 0.14 0.11 0.15 (2.83) (0.80) (2.85) (0.72) (1.15) (1.33) (1.22) Non-Business Group Affiliated Funds 1.84*** 0.08 1.84*** 0.08 0.10 0.07 0.12 (2.81) (0.60) (2.83) (0.54) (0.79) (0.77) (1.00) Business Group Affiliated Funds 1.93*** 0.17 1.98*** 0.22 0.28** 0.29*** 0.26* (2.88) (1.18) (2.94) (1.29) (2.17) (2.83) (1.80) Business Group-Non Business Group 0.09 0.09 0.14 0.14 0.18* 0.21** 0.14 (1.37) (1.37) (1.38) (1.38) (1.74) (2.19) (1.42)

47
Table 5, Panel B Panel B reports the return for the equity mutual funds conditional on their Business Group concentration index (BGI) calculated according to equation (1) of the text. At the end of each month, funds affiliated with business groups are sorted in quintiles based on their BGI index and average monthly returns are calculated over the next month.
BGI
Equally Weighted
Return
Equally Weighted Return over S&P CNX
500
Value Weighted
Return
Value Weighted Return Over S&P CNX
500
CAPM Alpha of Value Weighted Excess
Return
FF Carhart 4- Factor Alpha of Value Weighted Excess
Return
(1) (2) (3) (4) (5) (6)
1 1.89*** 0.13 1.86*** 0.10 0.12 0.13 (2.84) (0.82) (2.65) (0.82) (0.70) (0.78) 2 1.84*** 0.08 1.90*** 0.14 0.21 0.14 (2.72) (0.52) (2.82) (0.52) (1.33) (0.91) 3 1.84*** 0.08 1.67*** -0.09 0.00 -0.04 (2.75) (0.49) (2.50) (0.49) (0.02) (-0.22) 4 1.97*** 0.21 1.88*** 0.12 0.16 0.07 (2.86) (1.26) (2.70) (1.26) (0.86) (0.40) 5 2.13*** 0.37** 2.34*** 0.58** 0.65*** 0.69*** (3.17) (1.96) (3.39) (1.96) (2.79) (2.93) 5-1 0.24* 0.24* 0.48** 0.48** 0.53*** 0.56*** (1.78) (1.78) (2.26) (2.26) (2.52) (2.54)

48
Table 5, Panel C In Panel C we first sort funds in to either a low Active Share group (Active Share < Median Active Share in the preceding month) or high Active
Share group (Active Share > Median Active Share in the preceding month). See text for definition of Active Share. We then sort the funds in each
Active Share group in to BGI quintiles and calculate returns. See Table 5, Panel A for full description of return calculations.
Active Share < Median Active Share Active Share >= Median Active Share
BGI
Equally Weighted
Return over S&P CNX 500
Value Weighted Return Over S&P CNX 500
FF Carhart 4- Factor Alpha of Value Weighted Excess Return
Equally Weighted
Return over S&P CNX 500
Value Weighted Return Over S&P CNX 500
FF Carhart 4- Factor Alpha of Value
Weighted Excess Return
(1) (2) (3) (4) (5) (6)
1 0.21 0.15 0.15 -0.06 0.13 0.22 (1.59) (1.10) (1.04) (-0.26) (0.55) (1.05) 2 0.12 0.18 0.19 0.21 0.26 0.35* (0.94) (1.12) (1.21) (0.99) (1.14) (1.75) 3 0.14 0.20 0.07 0.20 -0.02 0.13 (0.89) (1.09) (0.45) (0.78) (-0.07) (0.64) 4 0.17 0.23 0.11 0.15 0.43 0.64*** (1.09) (1.28) (0.67) (0.63) (1.35) (2.40) 5 0.09 0.00 -0.09 0.48** 0.77*** 0.80*** (0.51) (0.01) (-0.52) (2.30) (2.79) (2.97) 5-1 -0.13 -0.15 -0.24 0.54*** 0.64*** 0.58** (-0.74) (-0.83) (-1.32) (2.55) (2.35) (2.08)

49
Table 6: Mutual Fund Performance, Holdings Based Returns
Panel A reports the average holding-based returns for the funds in different BGI quintiles. Column (1) reports the average return across funds (equally weighted), where a fund’s return is calculated as the sum of the monthly returns for different stocks held at the beginning of the month. Column 2 calculates equally weighted returns across funds where a fund’s return is calculated using the size-adjusted return for each stock in the portfolio. Columns (3) and (4) replicated Columns (1) and (2) but now the averages across funds are calculated by weighting according to the size of the fund. The industry adjusted in Column (5) is done based on the 10 industry classification we use to define BGI (see text for details). All the returns are in monthly percentages. t-statistics are in parentheses and *,**,*** indicate significance at the 10, 5, and 1 percent levels respectively.
Panel A
BGI
Equally Weighted
Holdings Return
Equally Weighted Size Adjusted
Return Value Weighted Holdings Return
Value Weighted Size
Adjusted Return
Value Weighted Industry Adjusted
Return
(1) (2) (3) (4) (5)
1 2.08*** 0.18 2.08*** 0.20 0.23* (2.77) (1.29) (2.68) (1.40) (1.85)
2 2.10*** 0.17 2.00*** 0.07 0.10 (2.77) (1.32) (2.71) (0.44) (0.79)
3 2.15*** 0.18 2.16*** 0.21 0.29** (2.88) (1.29) (2.87) (1.33) (2.04)
4 2.24*** 0.38*** 2.11*** 0.25 0.23* (2.84) (2.76) (2.67) (1.61) (1.70)
5 2.40*** 0.50*** 2.47*** 0.56*** 0.46*** (3.03) (3.03) (2.94) (2.71) (3.52)
5-1 0.32** 0.32*** 0.39** 0.36* 0.23* (2.32) (2.43) (1.99) (1.80) (1.72)

50
Table 6, Panel B
In Panel B we first sort funds in to either a low Active Share group (Active Share < Median Active Share in the preceding month) or high Active
Share group (Active Share > Median Active Share in the preceding month). See text for definition of Active Share. We then sort the funds in each
Active Share group in to BGI quintiles and calculate holdings based returns. See Table 5, Panel A for full description of return calculations.
Low Active Share
High Active Share
BGI
Equal Weighted Size Adjusted Abnormal
return
Value Weighted Size Adjusted
Abnormal return
Value Weighted Industry Adjusted
Return
Equal Weighted Size Adjusted Abnormal
return
Value Weighted Size Adjusted
Abnormal return
Value Weighted Industry Adjusted
Return
(1) (2) (3) (4) (5) (6)
1 0.28** 0.24* 0.21* -0.02 0.14 0.30 (2.17) (1.65) (1.66) (-0.11) (0.68) (1.55)
2 0.18 0.17 0.13 0.31* 0.28 0.27 (1.40) (1.12) (0.99) (1.69) (1.38) (1.52)
3 0.17 0.19 0.19 0.17 0.12 0.13 (1.25) (1.24) (1.37) (0.90) (0.57) (0.72)
4 0.29** 0.31** 0.30*** 0.49*** 0.45** 0.40* (2.16) (2.13) (2.52) (2.62) (1.97) (1.90)
5 0.28* 0.24 0.23* 0.66*** 1.00*** 0.79*** (1.77) (1.45) (1.81) (2.86) (3.10) (3.80)
5-1 0.00 0.00 0.03 0.68*** 0.85*** 0.49* (-0.01) (0.03) (0.17) (2.85) (2.55) (1.80)

51
Table 7: Business Group Industry Concentration and Fund Performance: Regression Evidence
This table reports the coefficients from the regressions explaining the mutual fund performance for each fund in month t+1 and includes one of the following performance measures as the dependent variable: monthly return in excess of the market return (S&P CNX 500 index return) or holdings-based size adjusted return. BGI stands for the Business Group Index in equation (1) of the text. BGI Overweight is calculated the same as BGI except under-weight positions are valued at zero (see text for formal definition). BGI Underweight is calculated as BGI except over-weight positions are valued at zero. ICI is the Industry Concentration Index (see text for definition of ICI and Active Share). t-statistics are in parentheses and *,**,*** indicate significance at the 10, 5, and 1 percent levels respectively.
Dependent Variable: Monthly Return-S&P 500 CNX Holdings based size adjusted return
(1) (2) (3) (4) (5) (6) (7) (8)
Intercept -0.002 -0.0067 -0.0067 -0.0046 -0.0040 -0.0035 0.0023 -0.0038 (-0.68) (-0.49) (-0.49) (-0.36) (-0.30) (-0.26) (0.33) (-0.59) Business Group Index (BGI) 0.0059*** 0.0059*** 0.0078*** 0.0081** -0.0029 0.0093*** 0.0125*** (3.44) (3.03) (2.40) (2.23) (-0.60) (3.62) (2.87) BGI Overweight 0.0088*** (2.37) BGI Underweight 0.0052 (0.70) Industry Concentration Index (ICI) -0.0027 -0.0024 -0.0021 -0.0032 -0.0071** (-0.81) (-0.77) (-0.68) (-0.98) (-1.96) Active Share -0.0026 -0.0025 0.0071* (-0.42) (-0.42) (1.74) BGI*High Active Share 0.0137*** (2.38) High Active Share -0.0032* (-1.75) Log(Total Net Assets) 0.00001 -0.00002 -0.00003 -0.00006 0.0000 -0.0003 -0.0004 (0.03) (-0.05) (-0.07) (-0.10) (0.02) (-1.09) (-1.42) Log(Fund Age) -0.0002 -0.0002 -0.0002 -0.0001 -0.0003 0.0004 0.0003 (-0.38) (-0.36) (-0.29) (-0.21) (-0.48) (0.77) (0.63) Expense Ratio 0.0020 0.0021 0.0022 0.0022 0.0021 -0.0012 -0.0012 (1.37) (1.40) (1.40) (1.41) (1.39) (-0.85) (-0.81) Monthly Flow -0.0025 -0.0025 -0.0026 -0.0026 -0.0027 -0.0034 -0.0033 (-0.53) (-0.54) (-0.55) (-0.55) (-0.59) (-0.65) (-0.62)
Cluster(Fund) Yes Yes Yes Yes Yes Yes Yes Yes Owner Fixed Effects Yes Yes Yes Yes Yes Yes Yes Yes Style Fixed Effects Yes Yes Yes Yes Yes Yes Yes Yes R2 (%) 0.62 0.78 0.80 0.80 0.81 0.88 0.88 0.99 Observations 6481 6241 6241 6241 6241 6241 6164 6164 Number of Months 123 123 123 123 123 123 122 122

52
Table 8: Sector Funds Performance Regressions
This table presents regression results on the performance of Sector focused funds based on the connection of the sector of the fund to the industries the business group operates in. The unit of observation is a month*fund, and the dependent variable is the fund’s monthly return minus the S&P 500 CNX. Columns (1) and (2) include all Sector funds in the sample, and the remaining columns split the sample of Sector funds in to Business Group owned sector funds (Columns (3) and (4)) and non-business group owned sector funds (Columns (5) and (6)). Same Industry is a dummy for sector funds that are in an industry where the owner of the mutual fund operates. See the text for other variable definitions. t-statistics are in parentheses and *,**,*** indicate significance at the 10, 5, and 1 percent levels respectively.
Sample: All Sector Funds
Business Group Sector Funds
Non-Business Group Sector Funds
(1) (2) (3) (4) (5) (6)
Intercept -0.0002 0.0667*** -0.0004 0.0945*** -0.0001 0.074*** (-0.19) (3.49) (-0.18) (2.53) (-0.08) (2.51)
Same Industry 0.0070*** 0.0063*** 0.0084 0.0097*** 0.0053*** 0.0064*** (4.78) (3.15) (3.05) (2.87) (4.30) (2.63)
Log(Total Net Assets) 0.0030*** -0.0029* -0.004*** (-3.82) (-1.79) (-2.79)
Log(Fund Age) -0.0007 -0.0028 0.001 (-0.40) (-0.89) (0.49)
Expense Ratio -0.0020 -0.0124*** -0.001 (-1.36) (-3.31) (-1.14)
Monthly Flow -0.0069 -0.0235 0.009 (-0.54) (-1.24) (0.70)
Cluster(Fund) Yes Yes Yes Yes Yes Yes
Owner Fixed Effects No Yes No Yes No Yes
R2 (%) 0.44 1.32 0.93 3.8 0.18 0.77
Observations 1725 1649 668 637 1057 1012
Number of Months 123 123 123 123 123 123

53
Table 9: Excluding Major Information Events, M&A and Capital Expenditure Announcements
This table reproduces our main results comparing Same and Different Industry stocks in Table 3 but excludes stocks affected by major information events such as mergers and acquisitions (Panel A), project announcements (Panel B), and large project announcements (Panel C). Large project announcements are defined as those whose value is above 100 million rupees. t-statistics are in parentheses and *,**,*** indicate significance at the 10, 5, and 1 percent levels respectively.
Avg number
of Stocks
Value Weighted
Size Adjusted Returns
Value Weighted Industry Adjusted Returns
(1) (2) (3)
Panel A: Excluding Stocks with Merger Events (Acquiror or Target)
Different Industry Stocks 223 0.05 0.14
(0.31) (1.21)
Same Industry Stocks 190 0.54*** 0.34***
(2.66) (2.67)
Same-Different 0.49* 0.20
(1.91) (1.54)
Panel B: Excluding Stocks with Project Announcements
Different Industry Stocks 215 0.05 0.14
(0.28) (1.11)
Same Industry Stocks 187 0.63*** 0.42***
(2.88) (3.13)
Same-Different 0.58** 0.28**
(2.13) (2.13)
Panel C: Excluding Stocks with Large Project Announcements
Different Industry Stocks 222 0.06 0.16
(0.34) (1.30)
Same Industry Stocks 193 0.61*** 0.41***
(2.90) (3.07)
Same-Different 0.55** 0.25*
(2.12) (1.92)

54
Table 10: Returns Adjusting for Own Business Group Performance
This table compares our Same Industry stock returns with the returns of the business group’s own
stocks. The first row in Panel A calculates the average market cap weighted returns for all business
group company stocks from industries where the business group owner has a real investment of greater
than 5% (i.e. this is a portfolio of stocks that are divisions of our business group fund owners). The
second row presents returns on business group stocks weighted by the amount of holdings in the
corresponding industry in business group mutual funds (see text for further detail). The third row
replicates the value Same Industry returns from Table 3, Panel A. Panel B presents the analogous results
to Panel A for the Top ten percentile of the overweight distribution. t-statistics are in parentheses and
*,**,*** indicate significance at the 10, 5, and 1 percent levels respectively.
Raw
Returns Size Adjusted
Returns FF Carhart 4-Factor Alpha
(1) (2) (3)
Panel A: All Stocks
Business Group Stocks (Market Cap Weighted) 2.08*** 0.20 0.11 (2.50) (0.74) (0.39)
Business Group Stocks (Value Weighted) 2.39*** 0.47 0.53 (2.40) (1.20) (1.50)
Same Industry Stocks (Value Weighted) 2.51*** 0.59*** 0.53*** (2.91) (2.75) (2.51)
Same Industry Stocks-Bgroup Marketcap Weighted 0.43 0.39 0.43 (1.32) (1.20) (1.24)
Same Industry Stocks-Bgroup Value Weighted 0.12 0.12 -0.01 (0.37) (0.36) (-0.02)
Panel B: Top 10 Percentile of Overweight Distribution
Business Group Stocks (Market Cap Weighted) 2.08*** 0.20 0.11 (2.50) (0.74) (0.39)
Business Group Stocks (Value Weighted) 2.70** 0.78 0.71 (2.22) (1.23) (1.28)
Same Industry Stocks (Value Weighted) 2.89*** 1.02*** 0.81*** (3.20) (3.13) (2.47)
Same Industry Stocks-Bgroup Marketcap Weighted 0.81** 0.82** 0.70 (1.98) (1.99) (1.64)
Same Industry Stocks-Bgroup Value Weighted 0.19 0.23 0.11 (0.34) (0.41) (0.21)

55
Table 11: Returns in Customer and Supplier Industries
This table presents returns on stocks held by business group mutual funds that are in industries that are
customers and/or suppliers to the industries where the business group operates. Panel A defines related
stocks as those that are in the same BEA industry as one of the firms that the business group operates.
Panel B defines related stocks as those stocks in industries that are customers of one of the industries
the business group operates in (based on the BEA input/output tables). Panel C defines related stocks as
those in an industry that supply to at least one of the industries the business group operates in.
Portfolios are formed using the same method as in Table 3, see Table 3 notes for details. t-statistics are
in parentheses and *,**,*** indicate significance at the 10, 5, and 1 percent levels respectively.
Avg
number of Stocks
Value Weighted Returns
Value Weighted Size
Adjusted Returns
Value Weighted 4 Factor Alpha
(1) (2) (3) (4)
Panel A: Related = Stock in Same BEA Industry
Unrelated Stocks 184 1.86*** -0.06 0.01
(2.52) (-0.25) (0.04)
Related Stocks 109 2.30*** 0.39** 0.36*
(2.87) (2.16) (1.91)
Related-Unrelated 0.44 0.45 0.35
(1.52) (1.61) (1.23)
Panel B: Related = Customer BEA Industry
Unrelated Stocks 184 1.86*** -0.06 0.01
(2.52) (-0.25) (0.04)
Related Stocks 139 2.49*** 0.57** 0.50*
(2.92) (2.25) (1.85)
Related-Unrelated 0.64* 0.63* 0.49
(1.86) (1.84) (1.43)
Panel C: Related = Supplier BEA Industry
Unrelated Stocks 184 1.86*** -0.06 0.01
(2.52) (-0.25) (0.04)
Related Stocks 109 2.12*** 0.18 0.23
(2.58) (0.89) (1.11)
Related-Unrelated 0.26 0.24 0.22
(0.84) (0.77) (0.73)

56
Table 12: Return Performance of Managers Who Switch Switch from Business Group to Non-Business Group Funds
This table presents results on how the investment style of managers change as they switch to a business group fund from a non-business group fund (or vice-versa). The sample
here includes only fund*month returns for funds that were operated by a manager who switched between a business group and non-business group fund. Bgroupstockret is a
variable that measures the market cap weighted return of the publicly traded firms in the business group where the relevant manager worked. We take the max of
Bgroupstockret and zero as we expect managers are most likely to benefit from information that drives their own business group stocks up, rather than down, as Indian mutual
funds do not short stocks. The Bgroup_Current variable is a dummy for those fund-month observations where the manager worked at the business group. Column (2) limits the
sample to months where the manager worked for the business group, Column (3) for the months before the manager worked for the business group, and Column (4) for months
where the manager worked after the business group. The remaining columns use an alternate dependent variable. t-statistics are in parentheses and *,**,*** indicate
significance at the 10, 5, and 1 percent levels respectively.
Dependent Variable: Monthly Return-S&P 500 CNX Holdings Based Mkt adjusted Ret Holdings based size
adjusted return
All Current Future Past All Current Future Past All
(1) (2) (3) (4) (5) (6) (7) (8) (9)
Intercept -0.019 -0.0274 0.022 0.0104 0.004 0.0107 0.034 0.0083 -0.0083 (-1.59) (-1.40) (0.54) (0.80) (0.25) (0.34) (0.68) (0.59) (-0.66) Max(Bgroupstockret,0) -0.005 0.1180*** 0.031 -0.0632 0.042 0.1346*** 0.066 0.0012 0.0174 (-0.15) (3.77) (0.84) (-1.10) (1.26) (4.28) (1.57) (0.02) (0.50) Bgroup_Current*Max(Bgroupstockret,0) 0.122*** 0.092** 0.100*** (2.61) (1.99) (2.34) Bgroup_Current -0.004*** -0.004 -0.0027* (-2.57) (-2.37) (-1.72) Log(Total Net Assets) 0.000 0.0010 0.000 -0.0005 0.000 0.0004 -0.001 -0.0011* 0.0000 (0.74) (1.56) (0.15) (-1.07) (-0.64) (0.34) (-0.45) (-1.79) (-0.04) Log(Fund Age) -0.001 -0.0019** -0.001 -0.0007 0.000 -0.0024* 0.000 0.0010 0.0006 (-1.62) (-2.04) (-1.59) (-0.57) (-0.23) (-1.91) (-0.25) (0.79) (0.78) Expense Ratio 0.001 -0.0016 0.002 0.0044 -0.001 -0.0079 0.003 0.0041 -0.0006 (0.53) (-0.45) (0.58) (1.56) (-0.23) (-1.76) (0.57) (1.46) (-0.26) Monthly Flow -0.009 -0.0171 -0.023 -0.0016 -0.011 -0.0210 -0.016 -0.0075 -0.0069 (-0.56) (-0.97) (-0.82) (-0.07) (-0.67) (-1.12) (-0.50) (-0.40) (-0.52)
Cluster(Fund) Yes Yes Yes Yes
Yes Yes Yes Yes
Yes Owner Fixed Effects Yes Yes Yes Yes Yes Yes Yes Yes Yes Style Fixed Effects Yes Yes Yes Yes Yes Yes Yes Yes Yes R2 (%) 2.66 5.82 5.86 1.43 3.43 6.76 5.00 2.03 2.78 Observations 2230 1180 436 614 2231 1181 436 614 2231 Number of Months 118 118 103 81 118 118 103 81 118

57
Table 13: Could Business Group Funds Exploit the Same Industry Advantage More?
This panel presents summary statistics on Sharpe ratios calculated across holdings in business group-owned mutual funds, as well as in the portfolio of
Same Industry stocks. The first row presents the mean, 25th percentile, 50th percentile, and 75th percentile of the Sharpe ratios across the 97 funds in
our sample. The second row takes the portfolio of Same Industry stocks within each fund and calculates the same summary statistics on the Sharpe
ratio. The third row calculates the summary statistics on Sharpe ratios for a portfolio that only included Different Industry stocks. The fourth row
presents differences between the Same Industry and All Holdings portfolios, and the last row presents a count and percentage of how many funds have
Same Industry portfolios with higher Sharpe ratios than the full portfolio of All Holdings. Columns (2) – (5) use excess returns above the market to
calculate the Sharpe ratios, and Columns (6) – (9) use Size Adjusted Abnormal Returns to calculate Sharpe ratios.
Return Specification: Excess Return Size Adjusted Abnormal Return
Sharpe Ratio N Mean p25 Median p75 Mean p25 Median p75
(1) (2) (3) (4) (5) (6) (7) (8) (9)
All Holdings 97 0.112 0.038 0.128 0.193
0.073 0.008 0.085 0.152
Same Industry Stocks 97 0.115 0.042 0.125 0.193
0.085 0.015 0.088 0.160
Different Industry Stocks 97 0.094 0.041 0.117 0.180
0.012 -0.048 0.032 0.106
Same Industry Stocks -All Holdings 97 0.003 -0.022 0.001 0.015
0.012 -0.049 0.010 0.057
Funds with Significant Positive Difference 97 13 (13%)
33 (34%)

58
Figure 1: Same Minus Different Stock Returns Over Time
This figure plots Same and Different Industry value-weighted size-adjusted returns against the number of months after portfolio formation. Figure 1a shows the Same Industry portfolio cumulative abnormal return, and Figure 1b shows the Same – Different Industry portfolio cumulative abnormal return. The Business Group (Non-Business Group) lines weight the Same Industry stocks as the business group owned (non-business group owned) funds do in their portfolios. The Market Cap weighted line weights the Same Industry stocks according to market cap.
Figure 1a) Same Industry Portfolio Cumulative Abnormal Returns
Figure 1b) Same – Different Portfolio Cumulative Abnormal Returns
0
2
4
6
8
10
12
14
0 5 10 15 20 25 30 35
Cu
mu
lati
ve A
bn
orm
al R
etu
rn (
%)
MonthSame Industry: Business Group
Same Industry: Non-Business Group
Same Industry: Market Cap Weighted
0
2
4
6
8
10
12
14
0 5 10 15 20 25 30 35Cu
mu
lati
ve A
bn
orm
al R
etu
rn (
%)
Month
Same-Different: Business Group
Same-Different: Non-Business Group
Same-Different: Market Cap Weighted

59
Appendix Table 1: Non-Business Group Funds Returns on Same vs. Different Industry Stocks
This Table presents the returns that non-business group affiliated funds earn on their portfolios of Different and Same Industry stocks as defined
in Table 3. The weighting of the stocks is according to how the non-business group funds weight these stocks in their portfolios. t-statistics are in
parentheses and *,**,*** indicate significance at the 10, 5, and 1 percent levels respectively.
Avg
number of Stocks
Value Weighted Returns
Value Weighted
Size Adjusted Returns
Value Weighted Industry Adjusted Returns
Value Weighted 4
Factor Alpha
Equal Weighted
Size Adjusted Returns
Market Cap weighted size
adjusted returns
(1) (2) (3) (4) (5) (6) (7)
Panel A: Non-Business Group Funds Different Industry Stocks 198 1.86*** -0.01 0.04 0.05 0.15 -0.16
(2.76) (-0.07) (0.42) (0.36) (0.93) (-1.27) Same Industry Stocks 174 2.04*** 0.17 0.11 0.23 0.35* 0.02 (2.77) (1.05) (0.99) (1.40) (1.89) (0.19) Same-Different 0.18 0.18 0.07 0.18 0.20 0.18 (1.37) (1.35) (1.15) (1.54) (1.39) (1.52)
Panel B : Top 10 Percentile Overweight Different Industry Stocks 56 1.62*** -0.25 -0.04 -0.16 0.07 -0.40
(2.52) (-1.02) (-0.26) (-0.78) (0.28) (-1.57) Same Industry Stocks 40 2.15*** 0.28 0.03 0.35 0.70*** 0.29 (2.71) (1.03) (0.16) (1.20) (3.01) (1.22) Same-Different 0.53 0.53 0.07 0.50 0.63** 0.68** (1.54) (1.53) (0.41) (1.53) (1.99) (2.03)

60
Appendix Table 2: Overweight Versus Underweight Same Industry Stocks
This table compares the returns on over-weighted versus under-weighted Same Industry stocks. Panel A
defines under-weighted stocks as those in the bottom ten percentile in the over-weight distribution of
stocks held in a given month. Panel B defines under-weighted stocks as those Same Industry stocks in
the top ten percentile of market capitalization that were not held by business group mutual funds. t-
statistics are in parentheses and *,**,*** indicate significance at the 10, 5, and 1 percent levels
respectively.
Avg
number of Stocks
Value Weighted Size Adjusted
Value weighted Industry Adjuted
Value weighted 4 Factor Alpha
(1) (2) (3) (4)
Panel A: Top 10 Percent Held Underweights
Same Industry Under-weights 27 -0.54*** -0.44*** -0.32
(-2.36) (-2.43) (-1.46)
Same Industry Over-weights 42 1.20*** 0.78*** 1.02***
(3.77) (3.15) (3.12)
Overweight-Underweight 1.75*** 1.22*** 1.34***
(4.14) (3.82) (3.33)
Panel B: Top 10 largest stocks not held
Same Industry Not Held 123 -0.10 -0.16 -0.09
(-0.33) (-0.73) (-0.33)
Same Industry Over-weights 42 1.20*** 0.78*** 1.02***
(3.77) (3.15) (3.12)
Overweight-Not Held 1.31*** 0.94*** 1.10***
(3.12) (2.68) (2.61)

61
Appendix Table 3: Fama-French 48 Industry Definition Results
This table reproduces the results from Panels A and B of Table 3, but we now define a Same Industry stock as those holdings that are in the same Fama-French 48 industry as one (or more) of the firms owned by the business group mutual fund. See Table 3 notes for further description. t-statistics are in parentheses and *,**,*** indicate significance at the 10, 5, and 1 percent levels respectively.
Avg number of
Stocks Value
Weighted_Returns Value Weighted Size
Adjusted Returns
Value Weighted Industry Adjusted
Returns
Value Weighted 4 Factor Alpha
(1) (2) (3) (4) (5)
Panel A: All Stocks
Different Industry Stocks 294 2.12*** 0.21 0.11 0.24
(2.83) (1.47) (1.25) (1.59)
Same Industry Stocks 110 2.49*** 0.55*** 0.31* 0.46**
(2.90) (2.66) (1.89) (2.31)
Same-Different 0.37* 0.34 0.20 0.22
(1.68) (1.53) (1.25) (1.09)
Panel B : Top 10 Percentile Overweight
Different Industry Stocks 79 2.30*** 0.40 0.11 0.38
(2.99) (1.49) (0.64) (1.37)
Same Industry Stocks 23 3.06*** 1.18*** 0.78** 0.91**
(3.25) (2.94) (2.25) (2.26)
Same-Different 0.76 0.79* 0.67* 0.53
(1.62) (1.70) (1.87) (1.16)

62
Appendix Table 4: Time Varying Returns of Same and Different Industry Stocks
This table presents returns to the Same and Different Industry portfolios, calculated the same as those in Table 2, separately for the first half of our sample (March 2003 – March 2008) and the second half of our sample (April 2008 – May 2013). t-statistics are in parentheses and *,**,*** indicate significance at the 10, 5, and 1 percent levels respectively.
Avg number
of Stocks
Value Weighted_Returns
Value Weighted
Size Adjusted Returns
Value Weighted Industry Adjusted Returns
Value Weighted 4 Factor
Alpha
(1) (2) (3) (4) (5)
Panel A: March 2003-March 2008 Different Industry Stocks 191 3.28*** -0.06 0.24 0.10 (3.42) (-0.27) (1.29) (0.40) Same Industry Stocks 153 4.11*** 0.74*** 0.38* 0.50 (3.81) (2.44) (1.68) (1.53) Same-Different 0.83*** 0.80*** 0.15 0.40 (2.64) (2.53) (0.67) (1.24)
Panel B: April 2008- May 2013 Different Industry Stocks 262 0.66 0.21 0.08 0.14
(0.65) (0.94) (0.65) (0.73) Same Industry Stocks 241 0.89 0.44 0.40*** 0.59*** (0.68) (1.60) (3.79) (2.89) Same-Different 0.23 0.23 0.31*** 0.44 (0.56) (0.56) (2.35) (1.59)
Panel C: Top 10% Overweights, March 2003 - March 2008 Different Industry Stocks 45 3.39*** 0.02 0.40 0.09
(3.19) (0.05) (1.06) (0.17) Same Industry Stocks 31 4.84*** 1.54*** 0.99** 1.18*** (4.21) (3.29) (2.27) (2.38) Same-Different 1.45*** 1.52*** 0.59 1.09* (2.50) (2.60) (1.28) (1.70)
Panel D: Top 10% Overweights, April 2008 - May 2013 Different Industry Stocks 75 0.54 0.10 -0.06 0.01 (0.56) (0.25) (-0.23) (0.03) Same Industry Stocks 55 1.29 0.86** 0.57*** 1.01*** (0.96) (2.00) (2.44) (2.50) Same-Different 0.75 0.76 0.63* 1.00* (1.12) (1.13) (1.78) (1.74)

63
Appendix Table 5: Business Group Affiliation and Information Flow: Evidence from Earnings Announcement Returns
This table presents the average returns of stocks in the Different and Same Industry portfolios around quarterly earnings announcements. At the beginning of each quarter we sort stocks in to either the Same Industry portfolio or the Different Industry portfolio. The sample here includes those stocks in the top ten percent of the over-weight distribution within these portfolios. For each stock within the Same Industry portfolio, we calculate the stock’s return in the three day window [day 0, day 1, and day 2] following its quarterly earnings announcement. We then average these earnings announcement returns across all stocks in the Same Industry portfolio in the same quarter. The same procedure is used for the Different Industry stocks. All the returns are in monthly percentage. t-statistics are in parentheses and *,**,*** indicate significance at the 10, 5, and 1 percent levels respectively.
Return Specification: Earnings Announcement Return: (0,+2) Average Quarterly Return
Avg number
of Stocks
Value Weighted Returns
Value Weighted
Market Adjusted Returns
Value Weighted
Size Adjusted Returns
Equal Weighted Returns
Equal Weighted
Market Adjusted Returns
Value Weighted
Market Adjusted Returns
Value Weighted
Size Adjusted Returns
(1) (2) (3) (4) (5) (6) (7) (8)
Different Industry Stocks 49 -0.05 -0.19 -0.25 0.28 0.10 0.13 0.58 (-0.13) (-0.65) (-0.82) (1.30) (0.51) (0.16) (0.70) Same Industry Stocks 37 1.17*** 0.97*** 0.83** 0.59** 0.31* 3.60*** 3.94*** (2.38) (2.46) (2.17) (2.29) (1.95) (3.50) (3.64) Same-Different 1.21*** 1.16*** 1.08*** 0.31 0.21 3.48*** 3.36*** (2.49) (2.99) (2.88) (1.57) (1.11) (2.95) (2.89)

64
Appendix Table 6: Financial Mutual Fund Firms and Returns on Financial Stock Holdings
The fund sample includes all Indian equity funds owned by a financial firm (life insurance, bank or asset management company) in the Morningstar database over the period 2002 – 2012. At the beginning of each month, stocks in each mutual fund portfolio are assigned to one of the two portfolios: Non-Financial or Financial. All stock positions are then pooled within one of these two portfolios and returns for the two portfolios are calculated. The stocks within each portfolio are value weighted by the combined dollar holdings by all the business group affiliated funds. The results for the full sample are reported in Panel A. Panel B presents the results for those stocks in each portfolio in the top 10 percent of the over-weight distribution. All the returns are in monthly percentage. t-statistics are in parentheses and *,**,*** indicate significance at the 10, 5, and 1 percent levels respectively.
Avg number
of Stocks
Value Weighted Returns
Value Weighted Size
Adjusted Returns
Value Weighted 4 Factor
Alpha
Equal-Weighted
Size Adjusted Returns
Market Cap
Weighted Size
Adjusted Returns
(1) (2) (3) (4) (5) (6)
Panel A: All Stocks Non-Financial Stocks 364 1.90*** 0.02 0.08 0.05 -0.10 (2.80) (0.13) (0.57) (0.40) (-0.87) Financial Stocks 49 2.47*** 0.61 0.70 0.87* 0.42 (2.54) (1.25) (1.39) (1.78) (1.10) Same-Different 0.57 0.59 0.62 0.82* 0.52 (1.01) (1.04) (1.12) (1.69) (1.02)
Panel B : Top 10 Percentile Overweight Non-Financial Stocks 113 1.92*** 0.05 0.01 0.31* -0.15
(2.90) (0.19) (0.03) (1.87) (-0.76) Financial Stocks 19 2.44*** 0.60 0.61 0.99** 0.61 (2.39) (1.11) (1.11) (2.16) (1.46) Same-Different 0.52 0.55 0.61 0.69 0.76 (0.78) (0.82) (0.98) (1.32) (1.40)
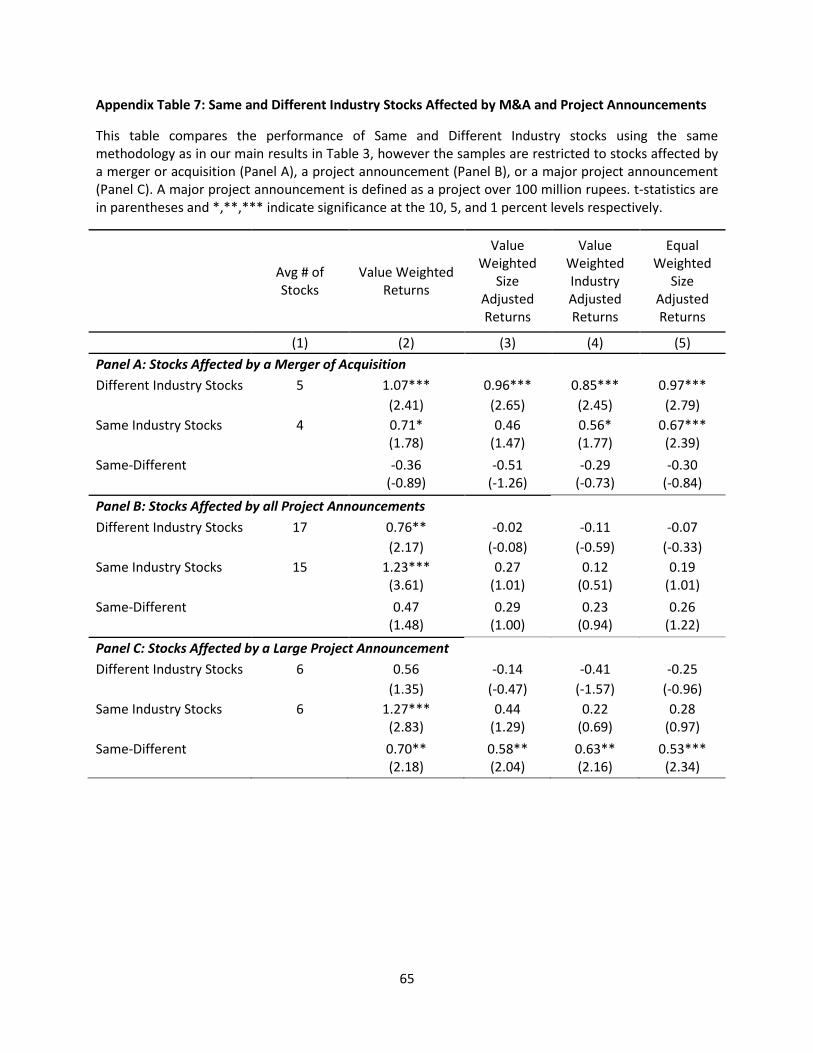
65
Appendix Table 7: Same and Different Industry Stocks Affected by M&A and Project Announcements
This table compares the performance of Same and Different Industry stocks using the same methodology as in our main results in Table 3, however the samples are restricted to stocks affected by a merger or acquisition (Panel A), a project announcement (Panel B), or a major project announcement (Panel C). A major project announcement is defined as a project over 100 million rupees. t-statistics are in parentheses and *,**,*** indicate significance at the 10, 5, and 1 percent levels respectively.
Avg # of Stocks
Value Weighted Returns
Value Weighted
Size Adjusted Returns
Value Weighted Industry Adjusted Returns
Equal Weighted
Size Adjusted Returns
(1) (2) (3) (4) (5)
Panel A: Stocks Affected by a Merger of Acquisition
Different Industry Stocks 5 1.07*** 0.96*** 0.85*** 0.97*** (2.41) (2.65) (2.45) (2.79)
Same Industry Stocks 4 0.71* 0.46 0.56* 0.67*** (1.78) (1.47) (1.77) (2.39)
Same-Different -0.36 -0.51 -0.29 -0.30 (-0.89) (-1.26) (-0.73) (-0.84)
Panel B: Stocks Affected by all Project Announcements
Different Industry Stocks 17 0.76** -0.02 -0.11 -0.07 (2.17) (-0.08) (-0.59) (-0.33)
Same Industry Stocks 15 1.23*** 0.27 0.12 0.19 (3.61) (1.01) (0.51) (1.01)
Same-Different 0.47 0.29 0.23 0.26
(1.48) (1.00) (0.94) (1.22)
Panel C: Stocks Affected by a Large Project Announcement
Different Industry Stocks 6 0.56 -0.14 -0.41 -0.25 (1.35) (-0.47) (-1.57) (-0.96)
Same Industry Stocks 6 1.27*** 0.44 0.22 0.28 (2.83) (1.29) (0.69) (0.97)
Same-Different 0.70** 0.58** 0.63** 0.53*** (2.18) (2.04) (2.16) (2.34)

66
Appendix Table 8: Characteristics of Business vs. Non-Business Group Fund Managers
This table reports summary statistics on the work and education experience of non-business group and
business-group fund managers in our sample. The observations rows indicated the number of managers
were able to find data on out of the total 376 managers. *, **, *** indicate differences between the two
columns are significant at the 10, 5, and 1 percent levels respectively.
Non-Business Group Business Group
Panel A: Years Experience Years Experience 13.9 14.4
Obs with Experience Data 232 80
Panel B: Work Experience Only Mutual Fund 0.22 0.21
Mutual Fund and Other Finance 0.69 0.75
Only Other Finance 0.078 .025*
Not Finance Related 0.0086 0.013
Obs with Experience Data 232 80
Panel C: Graduate Degree Vars Graduate Degree MBA 0.34 0.44
Graduate Degree CA 0.041 0.073
Graduate Degree CFA 0.024 .091**
Graduate Degree MMS 0.12 0.11
Graduate Degree MS 0.083 .018*
Graduate Degree PGDM 0.29 0.2
Graduate Degree MA 0.036 0
Graduate Degree Other 0.19 0.24
Obs with Graduate Degree Data 169 55
Panel D: Undergrad Degree Vars Undergraduate Degree BCom 0.39 0.49
Undergraduate Degree BA 0.074 0.07
Undergraduate Degree BE 0.28 0.25
Undergraduate Degree BSc 0.099 0.12
Undergraduate Degree BTech 0.13 .018**
Undergraduate Degree Other 0.031 0.053
Obs with Undergraduate Data 162 57
Related Documents