© 2014, MK Continuity & Availability LLC The Business Continuity Management Risk Index (BCM‐RI) The Comprehensive Program Metric Michael Kadar, MBCP, CISSP 1 © 2014, MK Continuity & Availability LLC

Welcome message from author
This document is posted to help you gain knowledge. Please leave a comment to let me know what you think about it! Share it to your friends and learn new things together.
Transcript

© 2014, MK Continuity & Availability LLC
The Business Continuity Management Risk Index (BCM‐RI)
The Comprehensive Program Metric
Michael Kadar, MBCP, CISSP
1
© 2014, MK Continuity & Availability LLC

© 2014, MK Continuity & Availability LLC
Questions• How can we demonstrate the overall value of the business
continuity management (BCM) program to executive management?
• How can we establish the measurement criteria necessary to quantify risk tolerance?
• Does reporting the number of BCPs developed, reviewed, and exercised assist executive management with making informed risk management decisions?
• How can we quantitatively measure current risk levels that can be compared with established risk tolerances?
• How can we report this to management in order to drive both risk management and BCM initiatives?
2

© 2014, MK Continuity & Availability LLC
Objectives• Provide a framework for developing and effectively
implementing the business continuity management risk index (BCM‐RI) for your organization.
• You will learn how the BCM‐RI can be used to measure the overall risk/preparedness level of each business unit, each department, each subsidiary, and the entire organization.
• You will see how gap analyses can be performed to effectively compare BCM‐RI levels to risk tolerance levels previously defined by management.
• Finally, you will learn how the BCM‐RI can be expanded to develop risk indices for use by enterprise risk management and business resilience management programs.
3

© 2014, MK Continuity & Availability LLC
Overview
• Prerequisites for Management Support• Risk vs. Preparedness• Business Continuity Management ‐ Risk Index• Composite Metrics• BCM‐RI Development• BCM‐RI Scoring System• BCM‐RI & Risk Tolerance• BCM‐RI Reporting• Additional Risk Indices & Resilience
4© 2013, MK Continuity & Availability LLC

© 2014, MK Continuity & Availability LLC
Elevator Meet ‘n’ Greet
15
© 2013, MK Continuity & Availability LLC 5
123456789101112131415“Hello. I’ve seen you around. What group are you with?”
You“Business Continuity Management.”
Senior Exec.
“Who? What does your group do?”
“We develop and exercise plans to assure the organization is prepared for crises.”
“What is our current level of preparedness and what is the preparedness goal?”
“(insert your answer here).”

© 2014, MK Continuity & Availability LLC
There are two key prerequisites for getting executive support:
1.Visibility: Senior management is aware the BCM Program exists.
2.Interest: Senior management has reasons to be interested in BCM Program deliverables.
Then it becomes easier to get …
Acceptance/Buy‐In: Senior management has reasons to give approvals and support the BCM Program with requested resources
6
Executive Support Prerequisites
1.Visibility: Senior management is aware the BCM Program exists.

© 2014, MK Continuity & Availability LLC
Yin and Yang• In Chinese philosophy, the concept of "yin and yang", is used to describe how seemingly opposite or contrary forces are interconnected, interdependent, and how they give rise to each other as they interrelate to one another. This concept applies to:
© 2013, MK Continuity & Availability LLC 7
Risk
Preparedness
and

© 2014, MK Continuity & Availability LLC
• Preparedness and Risk are not opposites. They are aspects of the same thing
8
• It is difficult to see one without the other – IF one really looks.
Risk
Preparedness
Yin and Yang

© 2014, MK Continuity & Availability LLC
Actually• Executive management sees, understands, and has concerns about risk‐related issues much more than preparedness issues.
9
• In many cases, preparedness issues are almost invisiblealong with their relationship to risk management, leading to loss of interest in preparedness and BCM.
Risk
Preparedness

© 2014, MK Continuity & Availability LLC
There are two key prerequisites for getting executive support:
1.Visibility: Senior management is aware the BCM Program exists
2.Interest: Senior management has reasons to be interested in BCM Program deliverables
Then it becomes easier to get …
Acceptance/Buy‐In: Senior management has reasons to give approvals and support the BCM Program with requested resources
10
Prerequisite: Interest
2.Interest: Senior management has reasons to be interested in BCM Program deliverables.

© 2014, MK Continuity & Availability LLC
Which is Your BCM Modus Operandi?
Do you push preparedness onto organizations?
11
Do organizations pull or request preparedness?
OrIdeally, this is executive management

© 2014, MK Continuity & Availability LLC
Is it working well?
It’s about as easy as pushing a rope!
12
How do you get them to pull?Give them something they want – a way to measure ‘BCM Risk’

© 2014, MK Continuity & Availability LLC
• Even if you have metrics, does executive management really care:– how many BCPs exist– which groups have them, and – when they were last reviewed or exercised? What do such statistics really mean to them and their concerns?.
13
• Perhaps they have higher level interests –perhaps they might be more interested in the performance of the BCM ‘forest’ rather than the ‘trees’.
Gaining Management Interest

© 2014, MK Continuity & Availability LLC
Study
“37% say they don't measure the performance of their program. … Most of the performance metrics are self‐referencing and not related to the business. If we want to raise the profile of BCM and get executive‐level buy‐in, then we need to measure the value contribution of BCM programs, not just program performance.”
‐ Lee Glendon, Head of Research and Advocacy, BCI
2011‐2012 Continuity Insights and KPMG LLP Global Business Continuity Management (BCM) Program Benchmark Study
14
© 2014, MK Continuity & Availability LLC
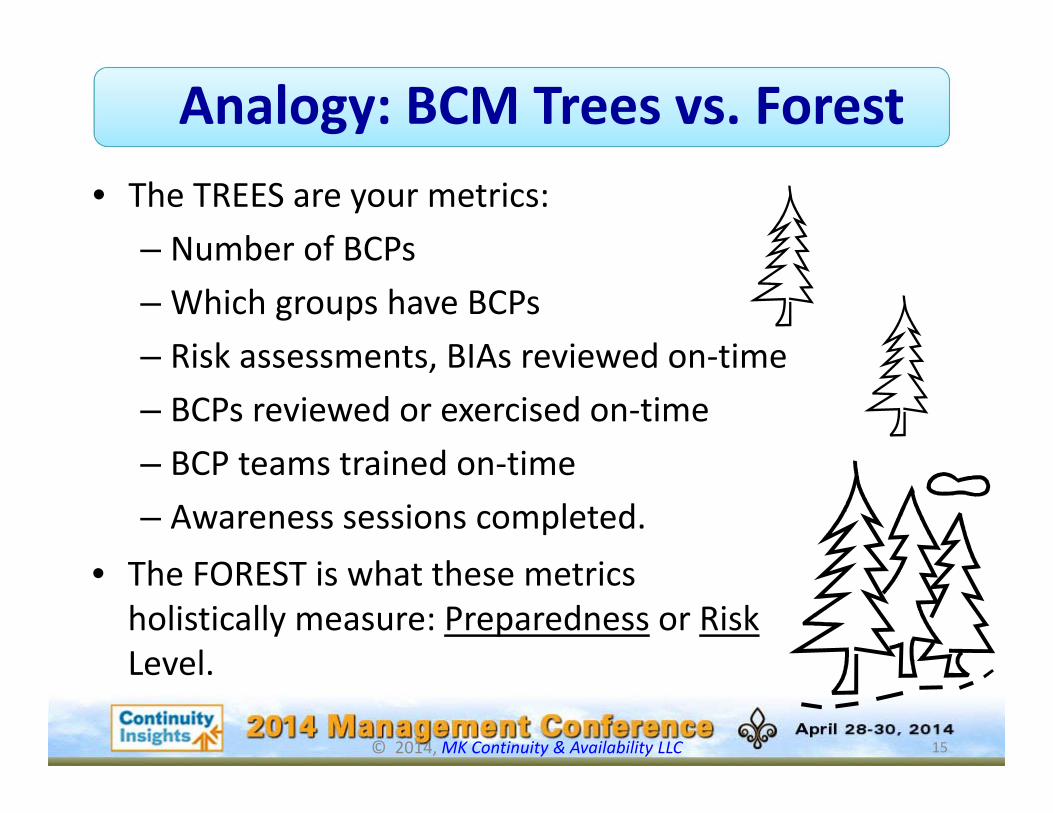
Analogy: BCM Trees vs. Forest• The TREES are your metrics:
– Number of BCPs– Which groups have BCPs– Risk assessments, BIAs reviewed on‐time– BCPs reviewed or exercised on‐time– BCP teams trained on‐time– Awareness sessions completed.
15
• The FOREST is what these metrics holistically measure: Preparedness or RiskLevel.

© 2014, MK Continuity & Availability LLC
• What does management care about? BCM? Hardly.• Part of management’s concerns involve the management of risk.
• Most organizations have had risk management groups for decades. More recently we have seen the emergence of Enterprise Risk Management (ERM). Why?
• Risk management is a key BOD and senior management concern.
16
Interest in Risk Management

© 2014, MK Continuity & Availability LLC
Low Risk
17
High Preparedness.
Low Preparedness
High Risk.
What is the current Risk or Preparedness Level?
Perspective: Preparedness or Risk?The Preparedness/Risk Continuum
What will attain management visibility and interest?

© 2014, MK Continuity & Availability LLC
Low Risk
18
High Preparedness
Low Preparedness
High Risk
What is the current Risk or Preparedness Level?
The current Risk Level is the BCM‐RI
The Business Continuity Management Risk Index
© 2014, MK Continuity & Availability LLC
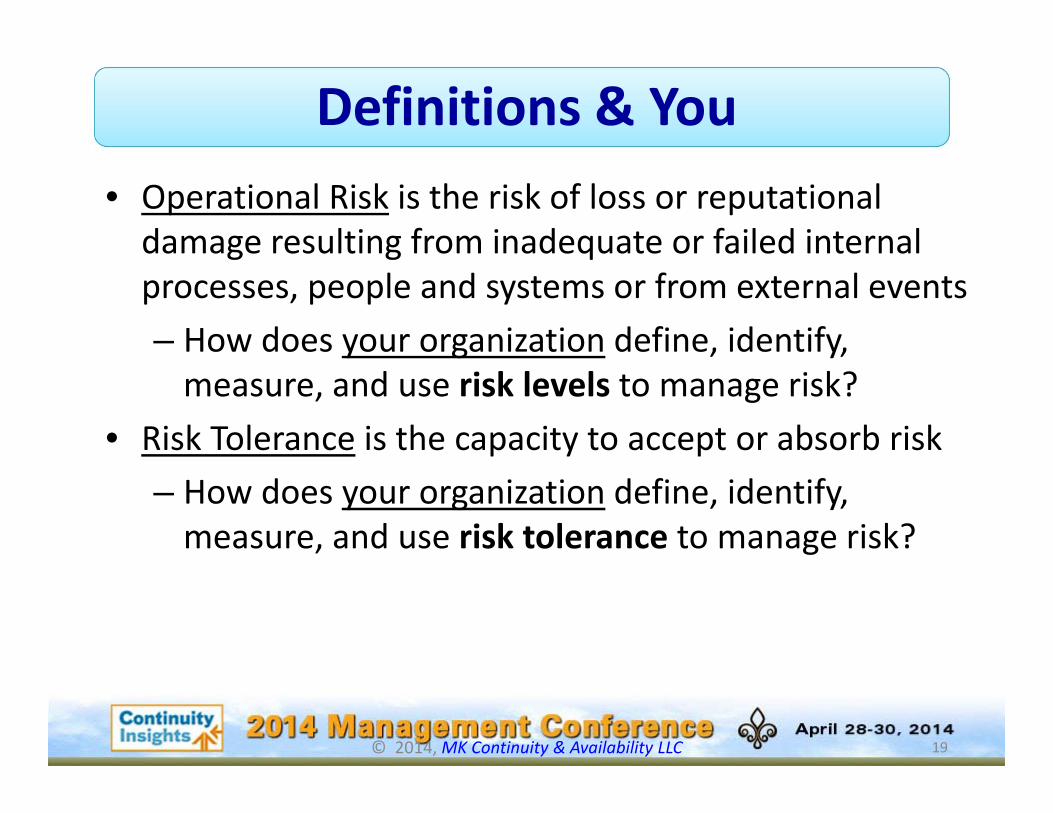
Definitions & You• Operational Risk is the risk of loss or reputational damage resulting from inadequate or failed internal processes, people and systems or from external events– How does your organization define, identify, measure, and use risk levels to manage risk?
• Risk Tolerance is the capacity to accept or absorb risk– How does your organization define, identify, measure, and use risk tolerance to manage risk?
19

© 2014, MK Continuity & Availability LLC
Risk Tolerance
Low Risk
20
High Preparedness
Low Preparedness
High Risk
What is management’s Risk Tolerance?
Risk Gap
Current Risk Level
Risk Tolerance.
When considering risk or risk tolerance, is management thinking in terms of preparedness or Preparedness Tolerance?

© 2014, MK Continuity & Availability LLC
• The deliverables of BCM are controls and safeguards that manage risk.
• To quantify “BCM risk tolerance” we must define, then quantify “BCM risk”.
• BUT FIRST, how does your ERM organization determine, define, and measure risk levels and risk tolerance targets?
• Review BCM‐RI development, definitions, criteria, etc. with ERM to assure it is an acceptable measure of risk.
21
Quantify BCM Risk Tolerance

© 2014, MK Continuity & Availability LLC
• Generally and simply, BCM Risk can be defined by the readiness/preparedness – or lack of preparedness – of the organization to recover.
• Specifically, BCM Risk is defined by the probability a particular threat/scenario will occur, the probability it will result in loss (vulnerability), and the impact of that loss.
• Now ‐ how do we quantify BCM Risk or preparedness?
• Show management a key deliverable of BCM is increased preparedness or decreased risk.
22
BCM Risk

© 2014, MK Continuity & Availability LLC
Low PreparednessHigh Preparedness
Preparedness (controls)• RA, BIA• Plans, Teams, Resources• Reviews, Training, Exercises.
Risk• Threats• Vulnerabilities• Impacts
High RiskLow Risk
23
Risk Management

© 2014, MK Continuity & Availability LLC
Measure Risk or Preparedness
24
What is Risk?• Risk = T x V x I (product of Threat, Vulnerability, Impact).• What Controls are you using to manage/decrease Risks?
– Controls that decrease Threat Occurrence (likelihood)– Controls that decrease Vulnerability (loss likelihood)– Controls that decrease Impact (losses).
• Measure Levels of: Threat occurrence, Vulnerability, Actual Impacts.
• Composite Measure: Average of Risk Levels for relevant Threats?
• What should BCM be measuring: Risk? Preparedness?
© 2014, MK Continuity & Availability LLC
Measure Risk or Preparedness
25
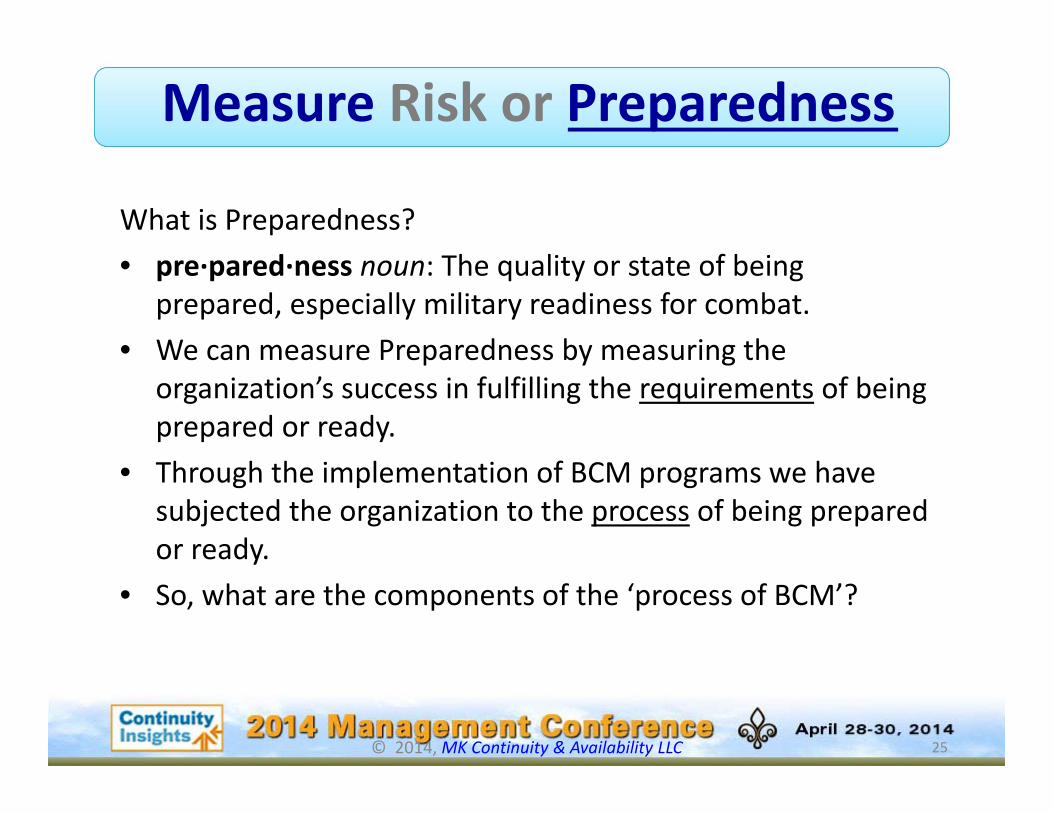
What is Preparedness?• pre∙pared∙ness noun: The quality or state of being
prepared, especially military readiness for combat.• We can measure Preparedness by measuring the
organization’s success in fulfilling the requirements of being prepared or ready.
• Through the implementation of BCM programs we have subjected the organization to the process of being prepared or ready.
• So, what are the components of the ‘process of BCM’?

© 2014, MK Continuity & Availability LLC
Components of BCM• The components of BCM are defined in:
– Professional Practices for Business Continuity Practitioners, NFPA 1600, BS 25999, ASIS SPC.1, ISO/IEC 27031, ISO/IEC 22399:2007, ISO 22301.
• Example ‘BCM Process’: DRII Professional Practices– Program Initiation and Management– Risk Evaluation and Control– Business Impact Analysis– Business Continuity Strategies– Emergency Preparedness and Response– Business Continuity Plans– Awareness and Training Program– Business Continuity Plan Exercise, Audit, and Maintenance– Crisis Communications– Coordination with External Agencies.
• Assumption: We can measure Preparedness by measuring the organization’s success in fulfilling the requirements of the BCM program.
26
But, aren’t these just ‘metrics’?
© 2014, MK Continuity & Availability LLC
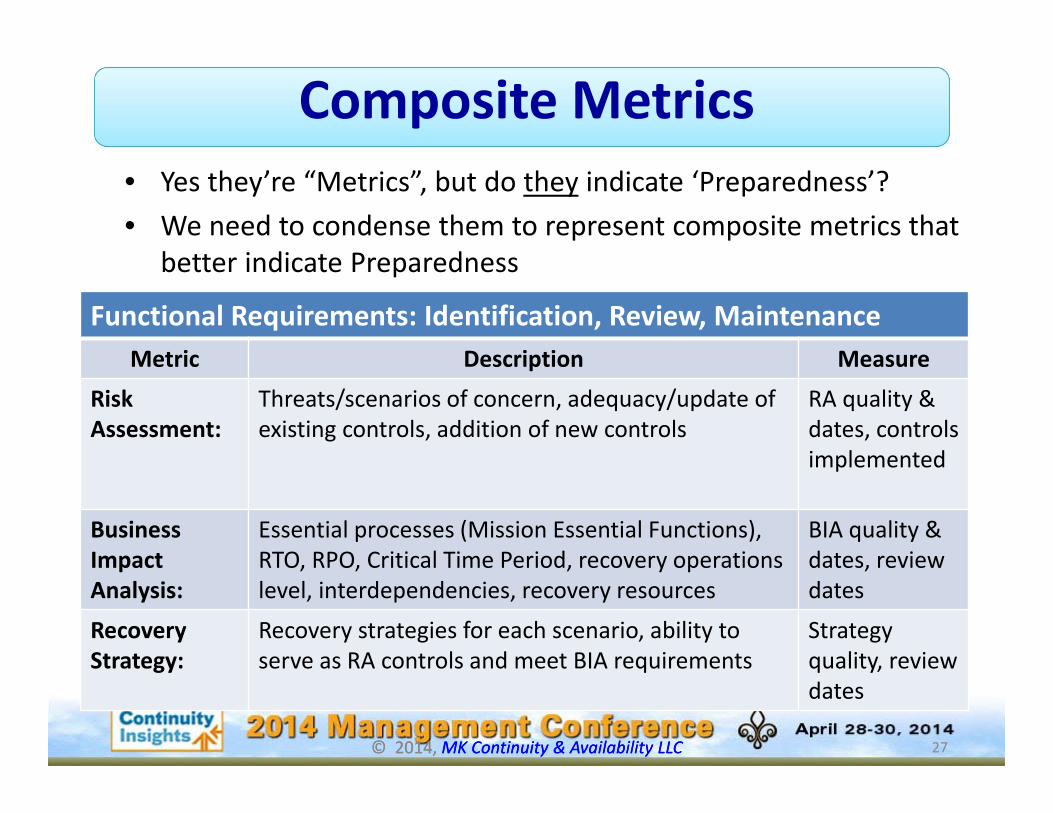
Composite Metrics• Yes they’re “Metrics”, but do they indicate ‘Preparedness’?• We need to condense them to represent composite metrics that
better indicate Preparedness
© 2014, MK Continuity & Availability LLC 27
Functional Requirements: Identification, Review, MaintenanceMetric Description Measure
Risk Assessment:
Threats/scenarios of concern, adequacy/update of existing controls, addition of new controls
RA quality & dates, controls implemented
Business Impact Analysis:
Essential processes (Mission Essential Functions), RTO, RPO, Critical Time Period, recovery operations level, interdependencies, recovery resources
BIA quality & dates, review dates
Recovery Strategy:
Recovery strategies for each scenario, ability to serve as RA controls and meet BIA requirements
Strategy quality, review dates

© 2014, MK Continuity & Availability LLC
Composite Metrics (cont.)• Another possible composite metric
28
Plan Quality (ERP, CMP, BCP, DRP)Metric Description Measure
Existence of Plans:
Essential facilities and business processes (high “Tier”) have plans
Plan inventory/count, compliance to standards
Relevance of Plans:
Plans address scenarios (risks) of most concern
Scenarios addressed
Viability of Plans: Demonstrated in exercises Plan exercise dates, problems corrected
Currency of Plans: Plans are reviewed periodically, teams are trained
Plan review dates, training dates

© 2014, MK Continuity & Availability LLC
BCM‐RI Development: Phase 1• Possible initial composite metric for a Risk Index – ‘Exercise
Completion Date’.– Develop BCM Program Standards that requires the following before an
Exercise Completion Date is assigned• Plan exists: The document meets a Plan Requirements Standard.• Review: The BIA, RA, plan document, team, and recovery resources have been evaluated using a Review Checklist based on a Plan Maintenance Standard.
• Training: The team defined in the BCP attends training in compliance with a Plan Maintenance Standard.
• Exercise: The plan document, team, and recovery resources have been exercised in compliance with a Plan Maintenance Standard.
• When choosing a BCM‐RI measure ask yourself, “Does this composite metric indicate the level of risk (preparedness)”?
29

© 2014, MK Continuity & Availability LLC
Low Risk = 0
30
High Preparedness = 100 0 = Low Preparedness
100 = High Risk
BCM‐RI Development: Phase 1
• OK, we have an ‘Exercise Completion Date’ metric, now what?• We need to develop a quantitative way to express the current
level of Risk – we need a scoring system.• Recommendation: Use a normalized system with a scale of zero
(0) to one hundred (100)

© 2014, MK Continuity & Availability LLC
BCM‐RI Score & Time
• Assigning the BCM‐RI score– When the Exercise Completion Date is approved by the BCM group, and if
this is the business unit’s only plan, they earn a BCM‐RI score of zero• BCM‐RI = 0 (i.e. low score ~ low risk).
• But is the risk as low a few months later?– Plan Document: May now have outdated procedures or contact numbers.– Team: Someone may have left or joined the business unit.– Resources: Offsite copies of backup documents or data may be out‐of‐date,
vendor services may have changed, equipment or supplies may have been removed from offsite storage.
• Need to modify the BCM‐RI score to indicate increasing risk or decreasing preparedness as time passes.
31

© 2014, MK Continuity & Availability LLC
Sample BCM‐RI Scoring System• Develop a system where ‘exercised’ plans have low risk scores.• As time passes, the risk, and risk score increases automatically
until it is exercised again according to a Maintenance Cycle.• Sample scoring system:
32
Plan Type
Plan Value (points)
Tier 1 Maint Cycle
Tier 2 Maint Cycle
Tier 3 Maint Cycle
Tier 4 Maint Cycle
Age 1 Mult.
Age 2 Mult.
Age 3 Mult.
Age 4 Mult.
Age 5 Mult.
BCP 150 12 24 36 48 0 0.25 0.5 0.75 1.0
ERP 150 12 24 36 48 0 0.25 0.5 0.75 1.0
CMP 500 12 na na na 0 0.25 0.5 0.75 1.0
Business Unit or Facility Tiers Plan Age Multipliers (6 mos. each)
Months
Tiering/prioritizing ensures cost‐effective mitigation.

© 2014, MK Continuity & Availability LLC
BCM‐RI: Single Plan ExampleA Tier 1 business unit was assigned an ‘Exercise Completion Date’ of 5/22/13 by the BCP Program Office which calculated their score•BCM‐RI = [(Plan Value x Age Mult.)/Total Plan Values] x 100.•BCM‐RI = [(150 x 0)/150] x 100 = 0 for 5/23 to 11/22•BCM‐RI = [(150 x 0.25)/150] x 100 = 25 for 11/23 to 5/22/14•BCM‐RI = [(150 x 0.50)/150] x 100 = 50 for 5/23/14 to 11/22/14•BCM‐RI = [(150 x 0.75)/150] x 100 = 75 for 11/23/14 to 5/22/15•BCM‐RI = [(150 x 1.0)/150] x 100 = 100 after 5/23/15
33
Plan Type
Plan Value
Tier 1 Maint Cycle
Tier 2 Maint Cycle
Tier 3 Maint Cycle
Tier 4 Maint Cycle
Age 1 Mult.
Age 2 Mult.
Age 3 Mult.
Age 4 Mult.
Age 5 Mult.
BCP 150 12 24 36 48 0 0.25 0.5 0.75 1.0
ERP 150 12 24 36 48 1.0 0.75 0.5 0.25 0
CMP 500 12 na na na 1.0 0.75 0.5 0.25 0
Business Unit or Facility Tiers Plan Age Multipliers (6 mos. Each)
© 2014, MK Continuity & Availability LLC
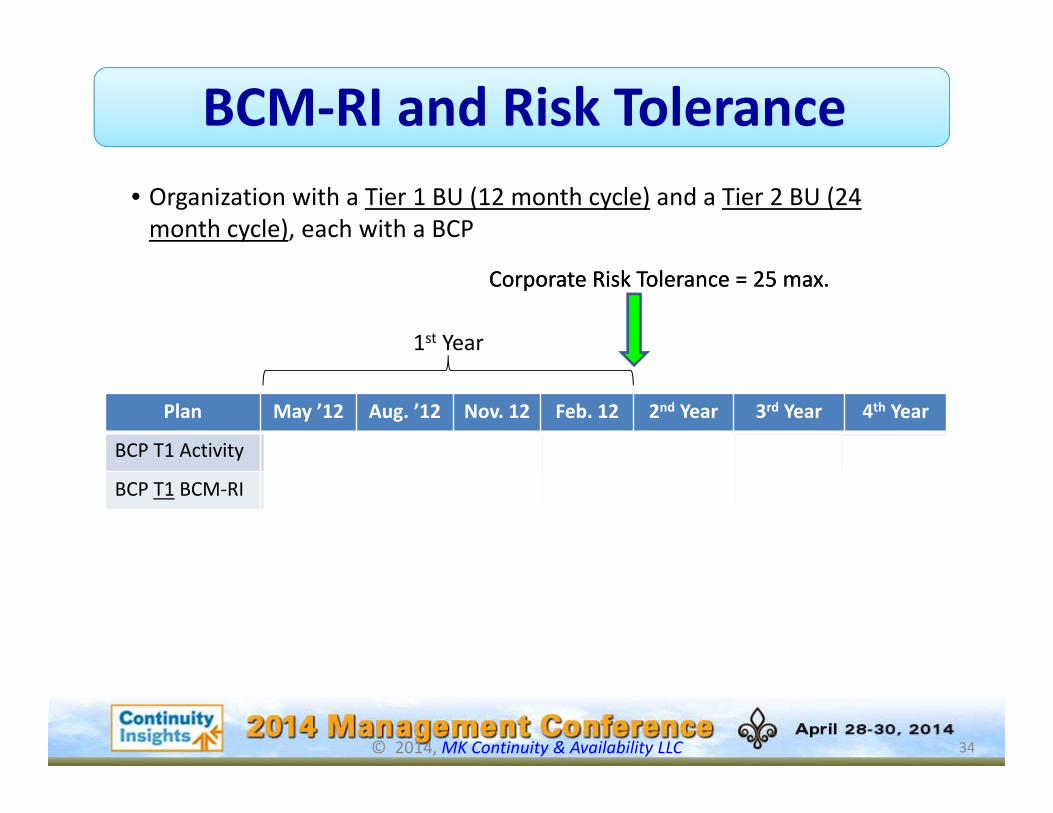
BCM‐RI and Risk Tolerance
34
Plan May ’12 Aug. ’12 Nov. 12 Feb. 12 2nd Year 3rd Year 4th Year
BCP T1 Activity Exercise None None None None None Exercise
BCP T1 BCM‐RI 0 0 25 25 50‐75 100 0
BCP T2 Activity Exercise None None None None Exercise None
BCP T2 BCM‐RI 0 0 0 0 25 0 25
Org. BCM‐RI avg 0 0 12.5 12.5 37.5‐50 50 12.5
• Organization with a Tier 1 BU (12 month cycle) and a Tier 2 BU (24 month cycle), each with a BCP
1st Year
Corporate Risk Tolerance = 25 max.
Org. Above Acceptable Risk Tolerance
Corporate Risk Tolerance = 25 max.

© 2014, MK Continuity & Availability LLC
Reporting by Organization
35
BCM‐RI by OrganizationOrganization BCM‐RI # of Plans % of All Plans
Supply Chain 12 8 4%
Human Resources 9 11 5%
Information Technology 31 104 50%
Operations 48 87 41%
CORPORATE 36 210 100%
Corporate BCM‐RI = (Org 1 RI x Org1 % of All Plans) + (Org 2 RI x Org2 % of All Plans) + …..
Corporate BCM‐RI = (12 x 4%) + (9 x 5%) + (31 x 50%) + (48 x 41%) = 36
If the Risk Tolerance level is 25, is this company’s Current Risk Level acceptable?Is this company prepared?
© 2014, MK Continuity & Availability LLC
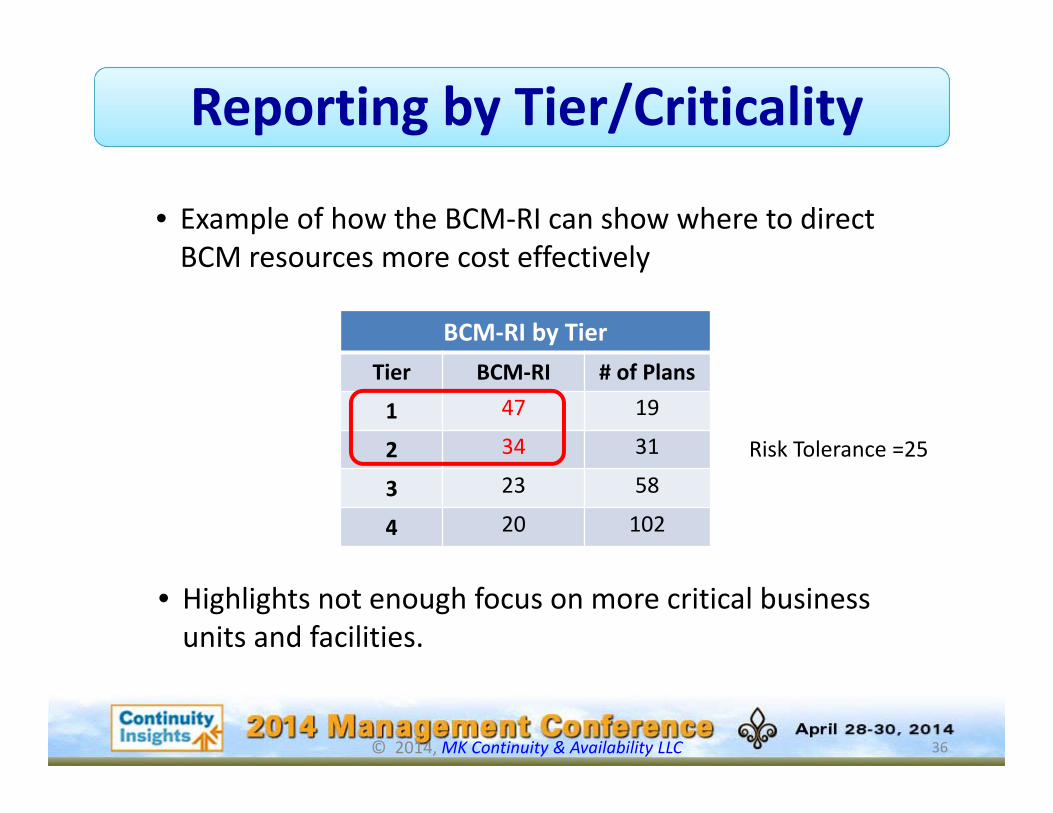
Reporting by Tier/Criticality
36
BCM‐RI by TierTier BCM‐RI # of Plans
1 47 19
2 34 31
3 23 58
4 20 102
• Example of how the BCM‐RI can show where to direct BCM resources more cost effectively
Risk Tolerance =25
• Highlights not enough focus on more critical business units and facilities.

© 2014, MK Continuity & Availability LLC 37
BCMRisk IndexPhysical
Security Risk Index
Environmental Risk Index
Safety Risk Index
Supply Chain Risk Index
Information Technology Risk Index
Information Protection Risk Index
Customer Risk Index
Production Risk Index
Reputation Risk Index
Financial Risk Index
Low Risk High Risk
Hazard Risk Financial Risk
Operational Risk Strategic Risk
ERM’s ‘RiskCategories?
Risk Indices & Resilience

© 2014, MK Continuity & Availability LLC 38
Business Resiliency Framework
Objective To enable the organization's preparedness and ability to recognize, react to, adapt to, and recover from unexpected HILF (Higher Impact, Lower Frequency) events.
Resilience Function
Reputation Protection
Business Function Protection
Resilience OversightAsset Protection
Occupant Safety & Protection
Organization Information Technology
Enterprise Risk Management
Human Resources
Business Continuity
Management
Corporate Communications Safety Corporate
Security
Information Protection & Security ERM:
Undue Risk Exposure
Resilience Task Technology Continuity
Financial Risk Assessment & Management
Medical and Employee & Labor
RelationsOperational Risk
Prevention & Preparation for
Response
Protect People, Assets, and
Operations from Harm
Managing the Digital Perimeter
Key Processes
Data Backup & Recovery
Risk Tolerance Management
Labor Contract Management BCPs Media Relations Existing Programs Investigations Network Security
BCM Risk Index
Application Failover / Recovery
Corporate Threat List
Work Stoppage Planning Crisis Mgt Plans Customer
CommunicationsLife Safety Team
Program Physical SecurityElectronic Credential
ManagementApplication &
Network StabilityEmployee Relations Crisis Mgt Team Employee
Communications Evacuation Drills Compliance Cyber Security Awareness
Medical Need Management: Special Parking
Emergency Operations Center
Management Communications Evac Chairs Site Security Profile
ProgramAudit: Plan CoverageMedical Need
Management: Evac‐Chairs, etc.
BCM Risk Index Site Emergency Response Plans
Business Resilience

© 2014, MK Continuity & Availability LLC
There are two key prerequisites for getting executive support:
1.Visibility: Senior management is aware the BCM Program exists
2.Interest: Senior management has reasons to be interested in BCM Program deliverables
Then it becomes easier to get …
Acceptance/Buy‐In: Senior management has reasons to give approvals and support the BCM Program with requested resources
39
Prerequisites Met
Acceptance/Buy‐In: Senior management has reasons to give approvals and support the BCM Program with requested resources.

© 2014, MK Continuity & Availability LLC
Summary/Action ItemsVisibility• Determine methods to align the BCM Program with ERM
initiatives that have the attention of executive management.
Interest• Identify the BCM deliverables of most interest to your
executive management.• Determine what would get executive management to
want (pull) BCM deliverables.• Learn how ERM measures/reports risk levels and risk
tolerance.• With ERM’s help determine whether your BCM Program
should monitor and report ‘risk’ or ‘preparedness’.
40

© 2014, MK Continuity & Availability LLC
Summary/Action ItemsInterest (cont.)• Determine how your BCM Program can define and quantify
BCM Risk or preparedness.• Identify the BCM Program criteria/metrics that can be used
to develop a ‘composite metric’ that quantitatively indicates the degree an organization is ‘prepared’ (is at low risk).
• Identify how a composite metric BCM‐RI score can indicate increasing risk or decreasing preparedness as time passes.
• Review BCM‐RI development, definitions, criteria, etc. with ERM to assure it is an acceptable measure of risk.
• Identify cost‐effectiveness criteria: BU or facility Tiering, Plan/Team/Resource Maintenance Cycles.
41
© 2014, MK Continuity & Availability LLC
Summary/Action ItemsAcceptance/Buy‐In• Determine how to use the BCM‐RI:
– To define and report the BCM risk tolerance level of operations and administrative organizations.
– To measure and report the current BCM risk level of operations and administrative organizations.
– As the reason for organizations to ‘pull’.– To perform ‘gap analyses’ (BCM risk tolerance level vs. current BCM risk level), obtain approval for gap remediation projects, and report progress to organization and executive management.
– To represent the BCM Risk Level and/or the BCM Preparedness Level of the company/agency.
42
© 2014, MK Continuity & Availability LLC
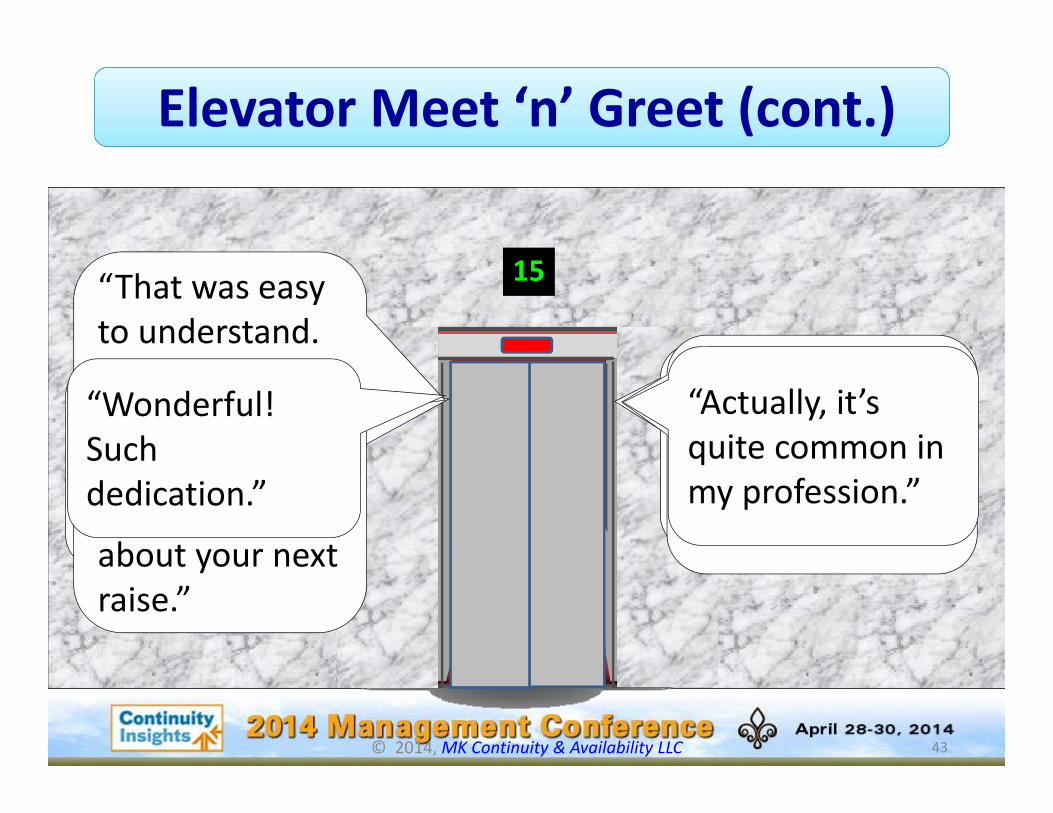
Elevator Meet ‘n’ Greet (cont.)
15
43
15
“So, the organization’s current Risk Rating is 33.”
“Yes, which is within our risk tolerance range of 25 to 35.”
“That was easy to understand. Thank you. I’ll have to talk to your management about your next raise.”
“That’s not necessary. I do this for the enjoyment.”
“Wonderful! Such dedication.”
“Actually, it’s quite common in my profession.”

© 2014, MK Continuity & Availability LLC
Finis
Questions?
44

© 2014, MK Continuity & Availability LLC
Contact Info & Reference
45
Michael Kadar, MBCP, CISSPMK Continuity & Availability LLC
[email protected] (cell)
313.235‐5515
****************************Book: “A Risk Management Approach to Business Continuity ‐ Aligning
Business Continuity with Corporate Governance”Julia Graham, David KayeISBN #1‐931332‐36‐3
Related Documents