The Business Case for Quality Gerry Marr Chief Executive

The Business Case for Quality Gerry Marr Chief Executive.
Jan 01, 2016
Welcome message from author
This document is posted to help you gain knowledge. Please leave a comment to let me know what you think about it! Share it to your friends and learn new things together.
Transcript

The Business Case for Quality
Gerry MarrChief Executive

BUDGET - UK Economic Forecasts
35 90175 173 140 118 97
527609
792
9771130
12621370
0
200
400
600
800
1000
1200
1400
1600
2007-08
2008-09
2009-10
2010-11
2011-12
2012-13
2013-14
Fiscal Year
£b
n
Net Borrowing Public sector net debt - end year
Multiplied by 5 in 2 years & represents 12.4% of GDP
c £44K for each economically active person in the UK
Calculated using latest data from National Statistics
76.2% of GDP
36.5% of GDP
c £17K for each economically active person in the UK
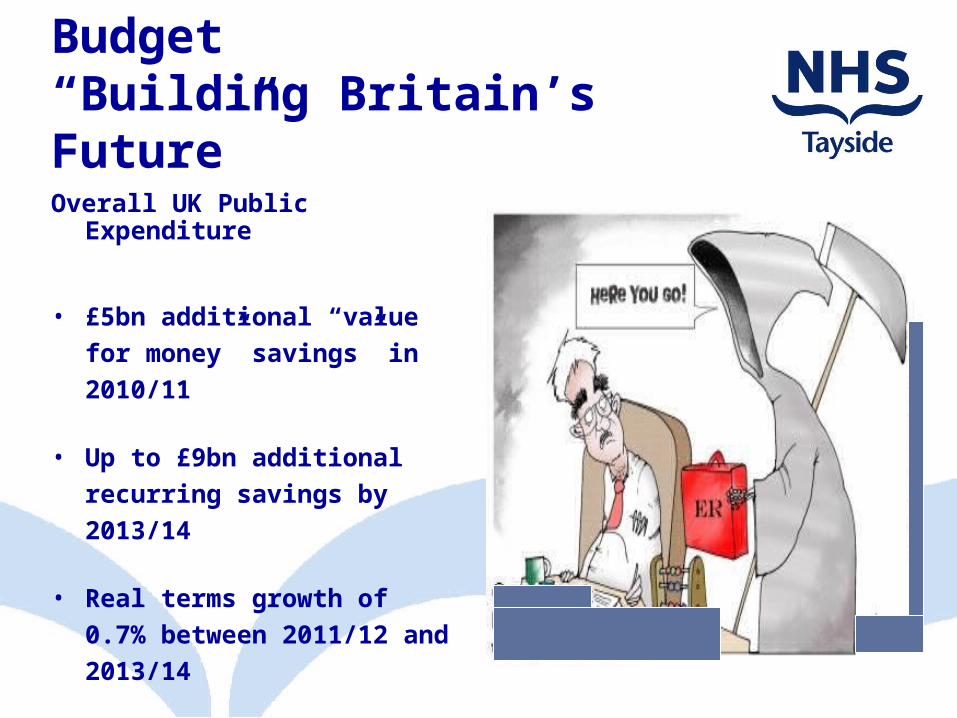
Budget “Building Britain’s Future”Overall UK Public
Expenditure
• £5bn additional “value for money” savings” in 2010/11
• Up to £9bn additional recurring savings by 2013/14
• Real terms growth of 0.7% between 2011/12 and 2013/14

Scottish Parliament Finance Committee -Report On Strategic Budget ScrutinyJune 2009The Centre for Public Policy for Regions (CPPR) Risk
Analysis
• “By 2013-14 the (Scottish) Budget will be between roughly £2 billion and £4 billion lower in real terms than at its peak in 2009-10.
• That represents a 7 to 13 per cent real terms cut over that four to five-year period.”
• In the period forward to 2017-18 it expects “a return to positive, but very low, real-terms growth of perhaps around 1 per cent.”
• This compares with its estimate of an average of 6 per cent per year growth in the Scottish budget over the first six or seven years of devolution.
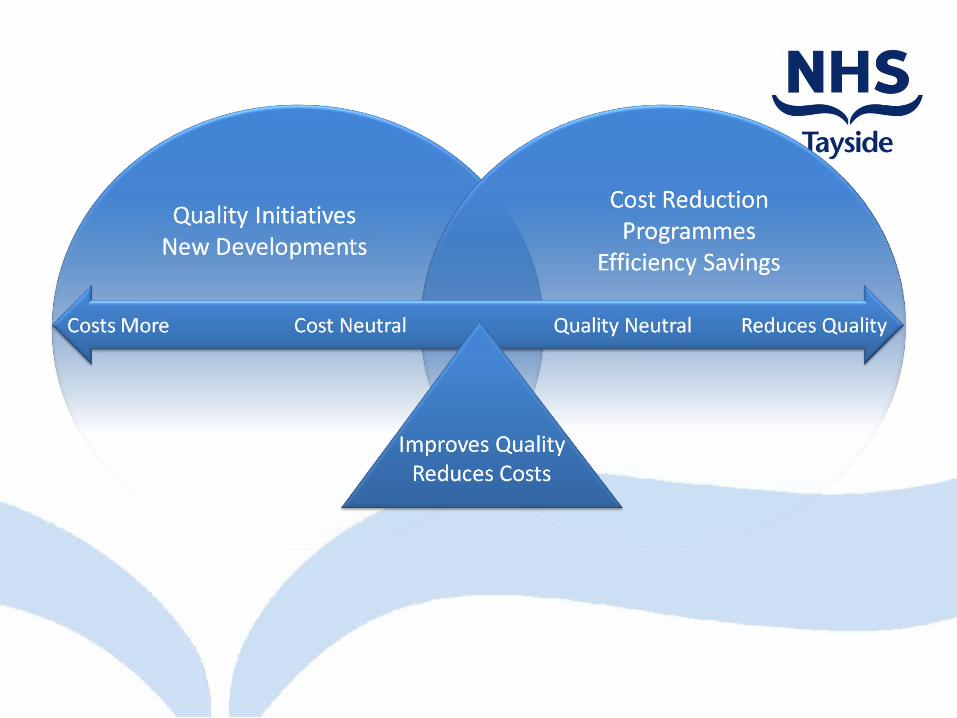
The Balance of Quality and Cost


Responding to what patients want and need
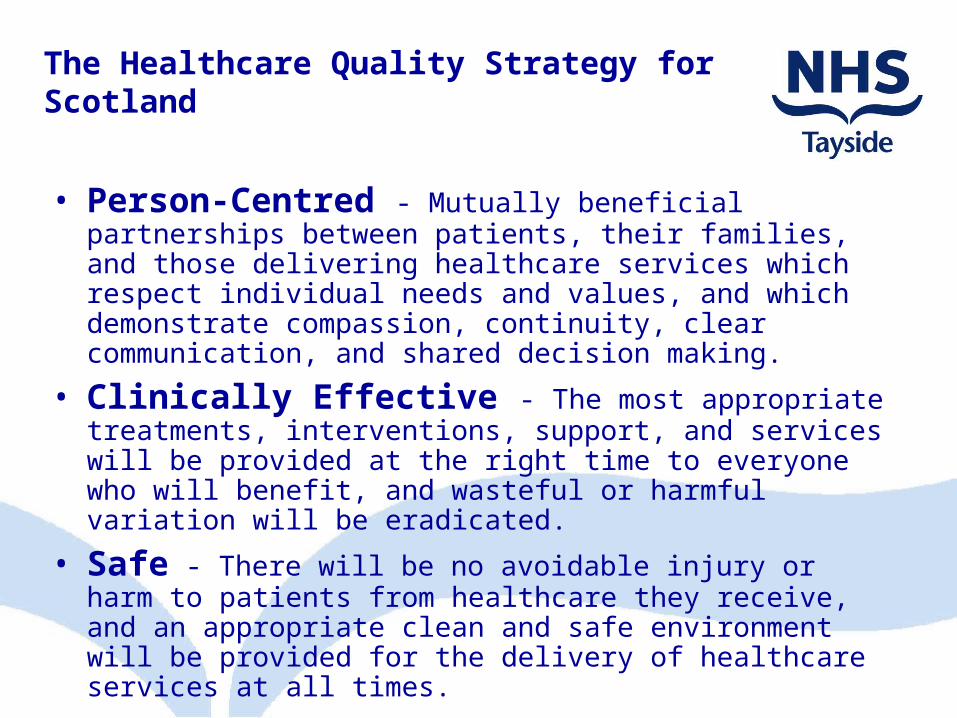
The Healthcare Quality Strategy for Scotland
• Person-Centred - Mutually beneficial partnerships between patients, their families, and those delivering healthcare services which respect individual needs and values, and which demonstrate compassion, continuity, clear communication, and shared decision making.
• Clinically Effective - The most appropriate treatments, interventions, support, and services will be provided at the right time to everyone who will benefit, and wasteful or harmful variation will be eradicated.
• Safe - There will be no avoidable injury or harm to patients from healthcare they receive, and an appropriate clean and safe environment will be provided for the delivery of healthcare services at all times.
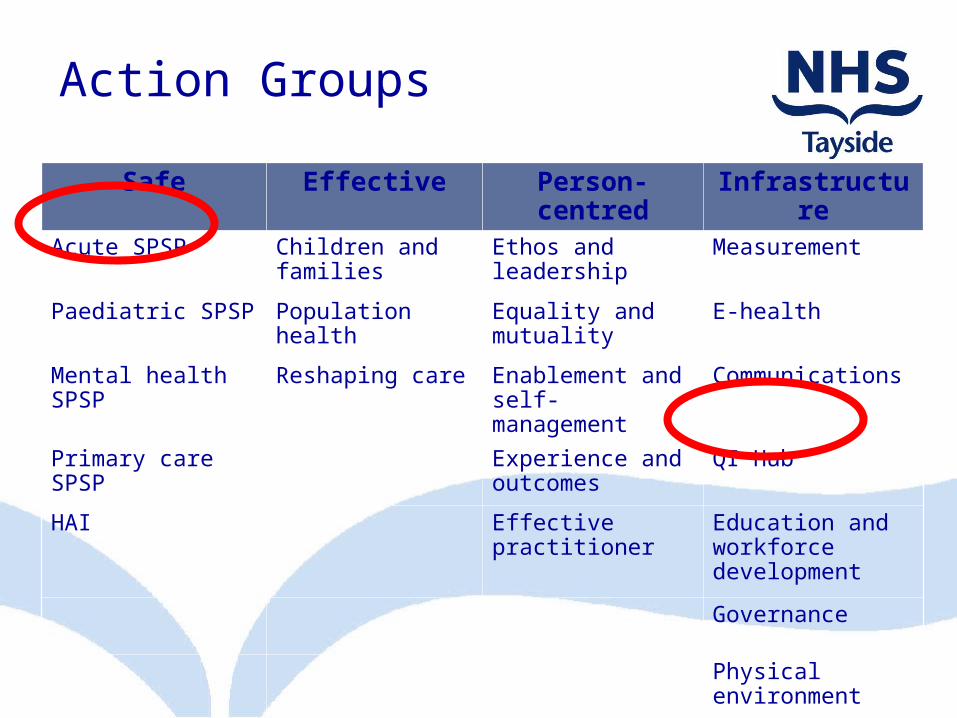
Action Groups
Safe Effective Person-centred
Infrastructure
Acute SPSP Children and families
Ethos and leadership
Measurement
Paediatric SPSP Population health
Equality and mutuality
E-health
Mental health SPSP
Reshaping care Enablement and self-management
Communications
Primary care SPSP
Experience and outcomes
QI Hub
HAI Effective practitioner
Education and workforce development
Governance
Physical environment


Aim, Objectives & ScopeThree Framework themes:
• Support – supporting our workforce.
• Enablers – identifying, sharing, sustaining good practice.
• Cost reductions – reducing variation, waste and harm.
Framework objectives:• Quality is not
compromised,• NHSScotland will achieve
financial balance over the SR10 period,
• NHS Boards are supported in achieving efficiency targets and improving services, and
• Central co-ordination of support, monitoring, benefits realisation and challenge will be available to NHS Boards.
“To improve the overall quality and efficiency of NHSScotland while ensuring good value for money and achieving financial targets.”


Tackling Variation – high cost, high volume services
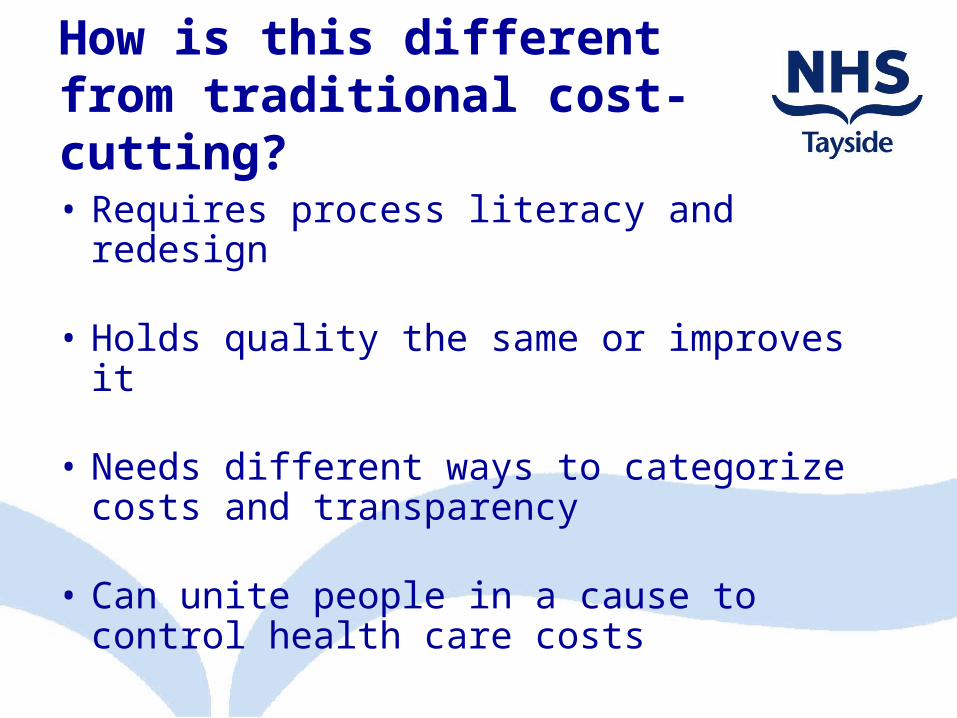
How is this different from traditional cost-cutting?
• Requires process literacy and redesign
• Holds quality the same or improves it
• Needs different ways to categorize costs and transparency
• Can unite people in a cause to control health care costs

The paradox of plentyWhat do higher spending regions -- and systems -- get?
Technical quality worseNo more elective surgeryMore hospital stays, visits, specialist use, tests
Content / Quality of Care1,2
Slightly higher mortalityNo better function
Health Outcomes1,2
Worse communication among physiciansGreater difficulty ensuring continuity of careGreater difficulty providing high quality careGreater perception of scarcity
Physician’s perceptions5
Patient-perceived quality1,3 Lower satisfaction with hospital careWorse access to primary care
Trends over time4 Greater growth in per-capita resource useLower gains in survival (following AMI)
(1) Ann Intern Med: 2003; 138: 273-298 (2) Health Affairs web exclusives, October 7, 2004(3) Health Affairs, web exclusives, Nov 16, 2005(4) Health Affairs web exclusives, Feb 7, 2006(5) Ann Intern Med: 2006; 144: 641-649
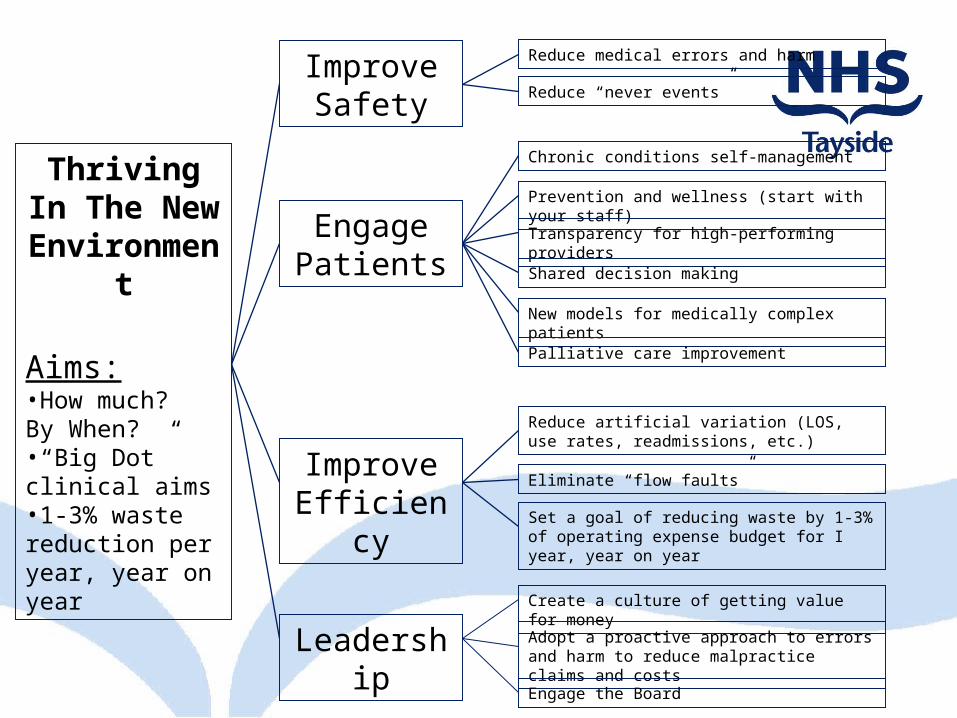
Thriving In The New
Environment
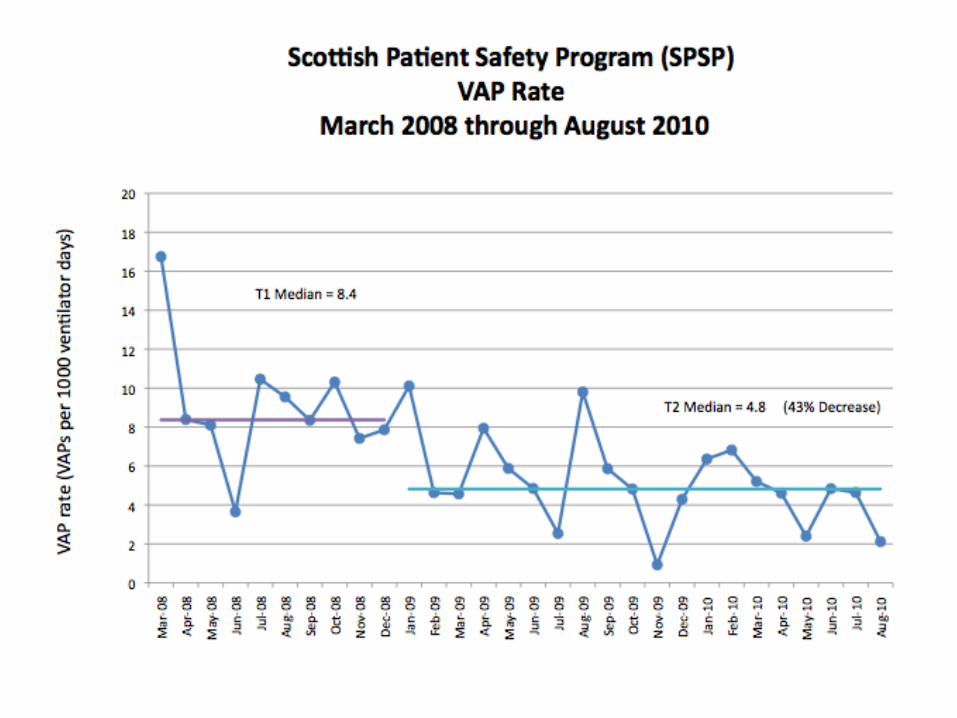
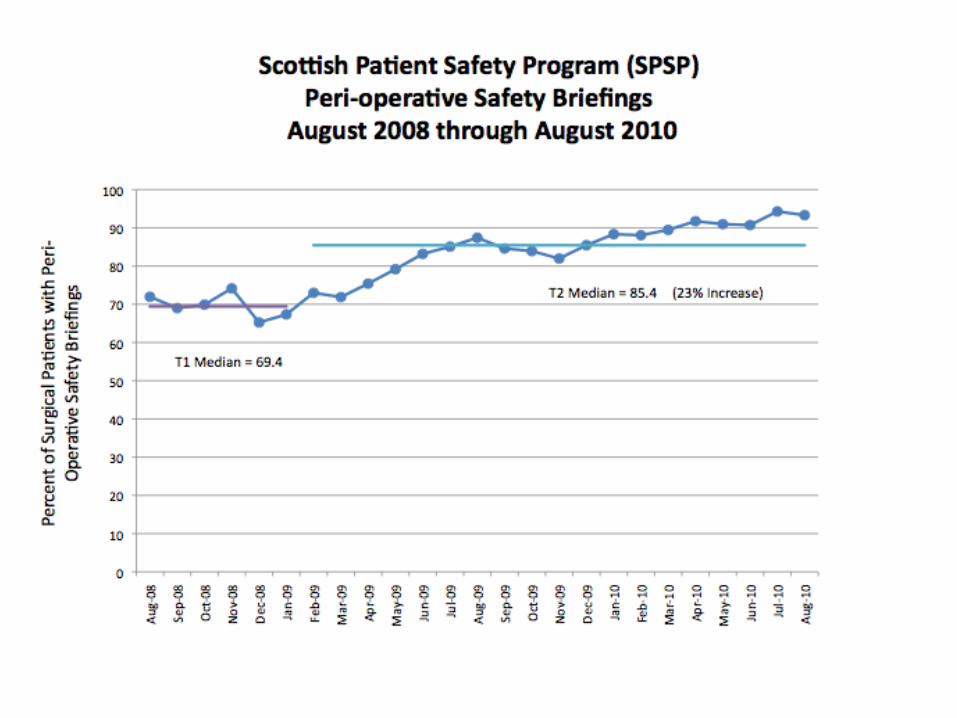
Aims:•How much? By When?•“Big Dot” clinical aims•1-3% waste reduction per year, year on year
Improve Safety
Engage Patients
Improve Efficiency
Leadership
Reduce medical errors and harm
Reduce “never events”
Chronic conditions self-management
Prevention and wellness (start with your staff)
Transparency for high-performing providers
Shared decision making
New models for medically complex patients
Palliative care improvement
Reduce artificial variation (LOS, use rates, readmissions, etc.)
Eliminate “flow faults”
Set a goal of reducing waste by 1-3% of operating expense budget for I year, year on year
Create a culture of getting value for money
Adopt a proactive approach to errors and harm to reduce malpractice claims and costs
Engage the Board
Integrating Finance and Quality
Context
Financial Waste
Demographic Harm
Safety & Quality Variation

Demographic change for population aged 65+ ScotlandPotential impact on emergency bed numbers 2007-2031
0
2000
4000
6000
8000
10000
12000
14000
16000
Y/E Mar 2007 Projected2011
Projected2016
Projected2021
Projected2026
Projected2031
Year
Be
ds
9%24%
41%61%
84%
NHS Tayside+148 beds 2016+517 beds 2031
Healthcare demand is growing
A new NinewellsHospital by 2031!
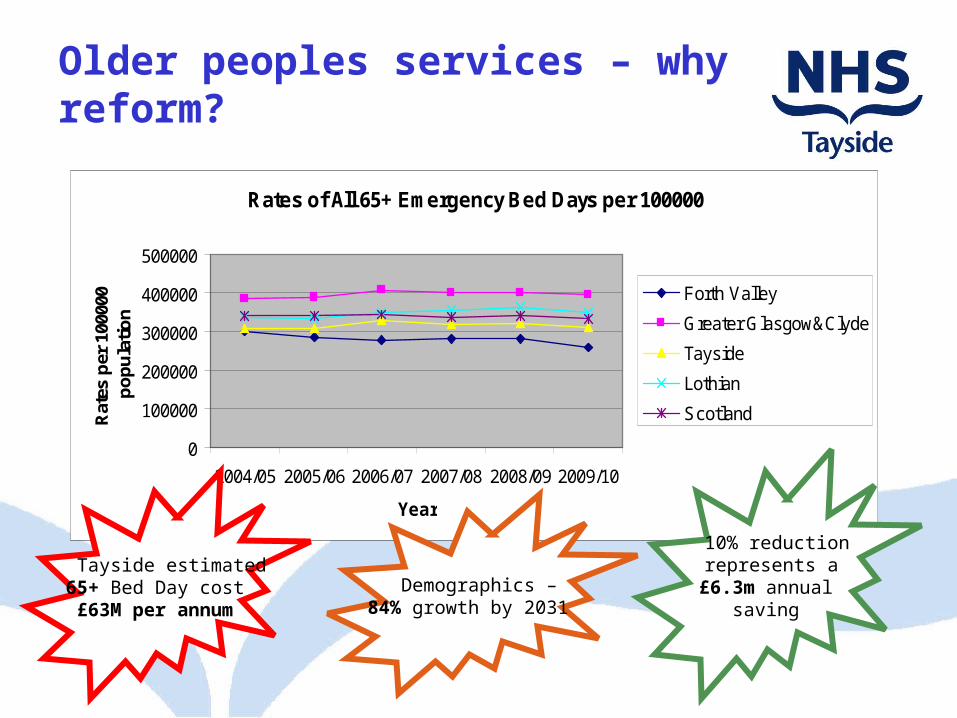
Older peoples services – why reform?
Rates of All 65+ Emergency Bed Days per 100000
0
100000
200000
300000
400000
500000
2004/05 2005/06 2006/07 2007/08 2008/09 2009/10
Year
Rat
es p
er 1
0000
0 p
op
ula
tio
n
Forth Valley
Greater Glasgow&Clyde
Tayside
Lothian
Scotland
Tayside estimated65+ Bed Day cost£63M per annum
10% reduction represents a£6.3m annual
saving Demographics –
84% growth by 2031

= Constraint
A&E
in-patient
out-patient
rehab
day case
acute services
acutereceiving
ward(Med/Surg)
MIU
SAS
OOH
OOH, urgent & emergency services (community)
NHS 24
GDP
GP
Community Pharmacists
family health services
Optom
refer to GP
sub-contractout-reach
Specialist acute care
tertiary services
routinedischarge
complexdischarge
LocalAuthorities
Partner & Vol organisations
refer on-going community care
Walk-In
RadiologyEndoscopy
GP referral
GP direct
access
GP referral
day patient
OutpatientClinic
Community Services – partnership model with LA
Home Visit
district nursinghealth visitingspecialist nursingAHP (e.g. physio, OT)
elderly care
Care in the community
Community (day) Hospitals
mental health
Day Patient
Inpatient
other
OutpatientClinic
Community Services – partnership model with LA
Home Visit
district nursinghealth visitingspecialist nursingAHP (e.g. physio, OT)
elderly care
Care in the community
Community (day) Hospitals
mental health
Day Patient
Inpatient
other
Laboratory
GP feedback
Tayside Whole System Model - Imbalance
= Queue Before Activity
= Target Challenge
= Trend in Volume
= Known Issue
= Suspected Issue
Q
T
Areas of Imbalance:
1. Queues in the system• Referral to 1st Appointment• Admission queues post
Decision to admit (Ward 15)
• Awaiting inpatient beds in the Community
2. Performance Vs. Target• Utilisation of some
community beds• 18 week RTT• Internal targets on
Turnaround
3. Trends• Increasing trend in GP
referrals up 12%• Urgent & Emergency
admissions up 7%
4. Constraints• Average Length of Stay in
Community Hospitals is 21 days
• Availability of data
T
T
acutereceiving
ward(Med/Surg)
out-patient
Q
routinedischarge
complexdischarge
Q
T
Q
C
Q
Q
C
Evidence of Waste in Healthcare Systems

Six Categories of Waste (Muda)
1. Delay: idle time spent waiting for something, such as utilization reviews, insurer payments, test results, patient bed assignments, OR prep, medical appointments.
2. Re-work: performing the same task a second time, such as re-testing, re-scheduling, re-filing of lost claim forms, re-writing of patient demographic data, multiple bed moves.
3. Overproduction: manufacturing of products or information that is not needed, such as precautionary “defensive” medical tests, surplus medications, excessive levels of paperwork.
Cont.
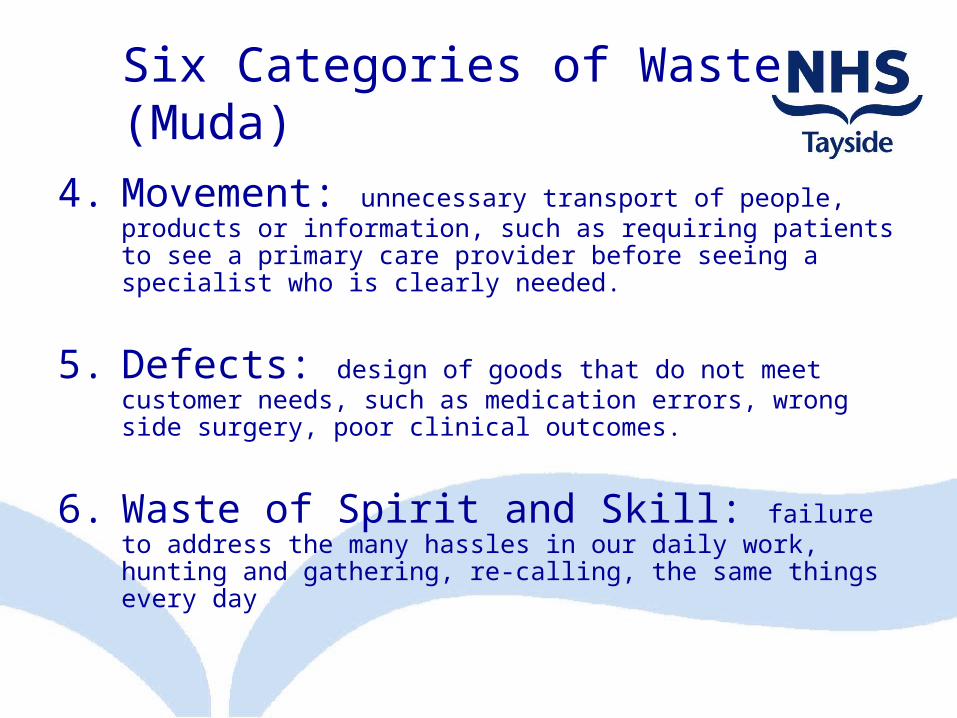
4. Movement: unnecessary transport of people, products or information, such as requiring patients to see a primary care provider before seeing a specialist who is clearly needed.
5. Defects: design of goods that do not meet customer needs, such as medication errors, wrong side surgery, poor clinical outcomes.
6. Waste of Spirit and Skill: failure to address the many hassles in our daily work, hunting and gathering, re-calling, the same things every day
Six Categories of Waste (Muda)

• 27% of New Outpatient appointments are being wasted!
Are there significant Outpatient Capacity losses?
Increase Capacity of Outpatient Clinics?
Opportunity?
0.0
5.0
10.0
15.0
20.0
25.0
Discharged AWAITING TESTRESULT
REFD OTHERCLIN/HOSP
DNA-Total Could Not Wait - FA REFER TO OTHERHOSP
%
New
Return

Evidence of Clinical Variation in Healthcare Systems

Are there significant variations in hospital expenditure by GP practice?
0
200
400
600
800
1,000
1,200
Practices
£ p
er
we
igh
ted
he
ad
Emergency Elective
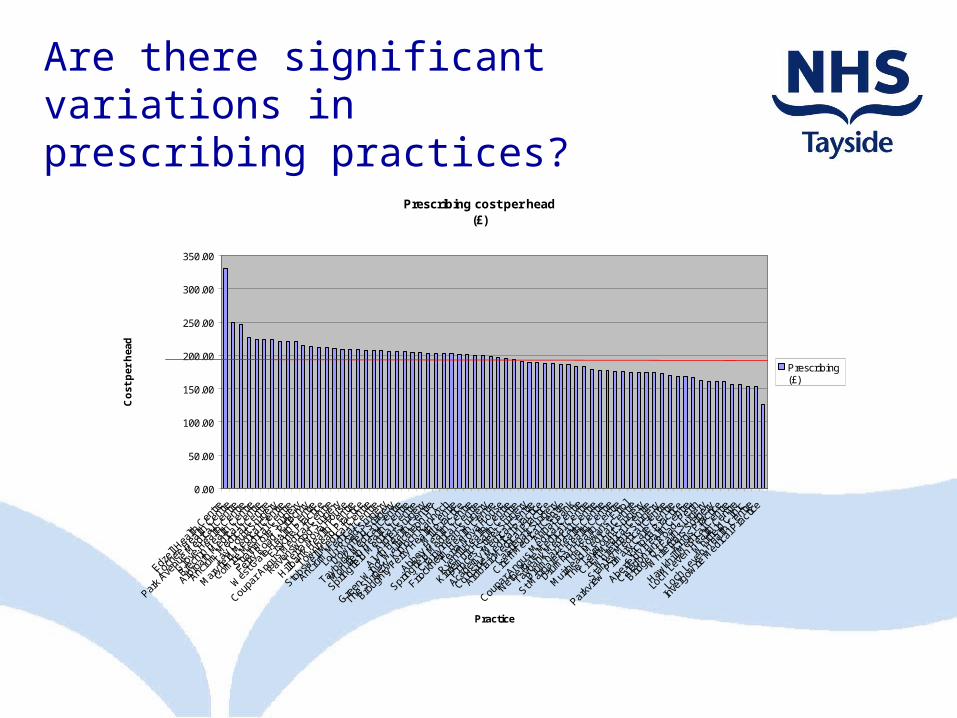
Are there significant variations in prescribing practices?
Prescribing cost per head(£)
0.00
50.00
100.00
150.00
200.00
250.00
300.00
350.00
Edzell
Hea
lth C
entre
Loch
ee H
ealth
Cen
tre
Park A
venu
e M
edica
l Cen
tre
Grove
Hea
lth C
entre
Brech
in Hea
lth C
entre
Arbro
ath
Med
ical C
entre
Ancru
m M
edica
l Cen
tre
Tay C
ourt
Surge
ry
Mar
yfield
Med
ical C
entre
Comrie
Med
ical C
entre
Strath
mor
e Sur
gery
Ferry
Roa
d, P
itloch
ry
Wes
t Gat
e Hea
lth C
entre
Erskin
e Pra
ctice
Coupa
r Ang
us M
edica
l Cen
tre
Raven
swoo
d Sur
gery
Terra
Nov
a Hou
se
Hillban
k Hea
lth C
entre
Townh
ead
Practi
ce
Stobs
well M
edica
l Cen
tre
Ancru
m M
edica
l Cen
tre
Lour
Roa
d Sur
gery
Downf
ield
Surge
ry
Tayba
nk M
edica
l Cen
tre
Mon
ifieth
Hea
lth C
entre
Spring
field
Med
ical C
entre
Ardler
Sur
gery
Alyth
Health
Cen
tre
Green
Wing
, Wall
acet
eon
H.C
The S
urge
ry, K
inloc
h Ran
noch
Broug
hty F
erry
Hea
lth C
entre
Mill
Practi
ce
Abbey
Hea
lth C
entre
Spring
field
Med
ical C
entre
Craigv
inean
Sur
gery
Friock
heim
Hea
lth C
entre
Terra
Nov
a Hou
se
Ryehil
l Hea
lth C
entre
Kirriem
uir H
ealth
Cen
tre
Prince
s Stre
et S
urge
ry
Acade
my M
edica
l Cen
tre
Coldsid
e M
edica
l Pra
ctice
Ardbla
ir M
edica
l Pra
ctice
Castle
gait S
urge
ry
Crieff
Med
ical C
entre
Annat
Ban
k
Coupa
r Ang
us M
edica
l Cen
tre
Nethe
rgat
e M
edica
l Cen
tre
Tayba
nk M
edica
l Cen
tre
Drum
har H
ealth
Cen
tre
St Mar
gare
t's H
ealth
Cen
tre
Drum
har H
ealth
Cen
tre
The R
owan
s, Erro
l
Muir
head
Med
ical C
entre
The T
aym
ount
Sur
gery
Crieff
Med
ical C
entre
Whit
efria
rs S
urge
ry
Stanle
y Med
ical C
entre
Parkv
iew P
rimar
y Car
e Cen
tre
Victor
ia Pra
ctice
Aberfe
ldy H
ealth
Cen
tre
Caledo
nian
Road,
Per
th
Bridge
Of E
arn
Surge
ry
Whit
efria
rs S
urge
ry
Kings P
racti
ce
Hawkh
ill M
edica
l Cen
tre
Loch
Lev
en H
ealth
Cen
tre
Whit
field
Clinic
Loch
Lev
en H
ealth
Cen
tre
Inve
rgow
rie M
edica
l Pra
ctice
Practice
Co
st p
er h
ead
Prescribing (£)
Average £194.5

Are there significant variations in clinical practices in
prescribing medicines?
GIC per 1000 Patients during the period:-July 2008 to September 2008
£0
£10,000
£20,000
£30,000
£40,000
£50,000
£60,000
£70,000
1309
111
005
1283
111
096
1010
610
708
1319
511
645
1193
111
382
1221
011
861
1357
110
799
1018
211
058
1362
113
335
1130
610
233
1117
113
284
1263
311
486
1323
111
433
1450
111
823
1141
410
322
1165
010
407
1116
610
498
1044
510
125
1028
611
289
1304
913
532
1228
110
638
1434
212
991
1370
612
493
1424
910
002
1456
913
975
1366
010
751
1036
114
037
1394
110
553
1003
613
369
1384
813
891
1136
314
291
1349
613
481
1001
710
835
1290
113
142
Practice Reference (CHP)
Cos
t per
100
0 P
atie
nts
Variation in Gross Ingredient Cost (GIC) per 1,000 patients across practices

Are there significant variations in clinical
practices in prescribing medicines?
Variation by Defined Daily Dose per 1000 patients
Hypnotics and Anxiolytics DDDs per 1000 Patients during the period:-July 2008 to September 2008
0
1000
2000
3000
4000
5000
6000
7000
8000
9000
1100
512
633
1221
010
445
1283
110
182
1109
611
058
1165
011
306
1333
511
931
1141
412
281
1397
510
106
1079
911
861
1040
713
369
1128
910
708
1117
111
363
1384
811
433
1164
514
249
1403
710
125
1304
914
342
1349
610
361
1032
210
036
1001
713
941
1357
114
291
1000
211
166
1182
310
751
1028
612
991
1348
110
498
1370
613
195
1353
210
233
1148
611
382
1328
413
660
1063
810
835
1450
113
891
1362
112
901
1055
313
091
1249
313
231
1314
214
569
Practice Reference (CHP)
DD
Ds
per
1000
Pat
ient
s
Prescribing _(£)
Gen &
Acu
te IP/DC T
ota
l
350300250200150100
800
700
600
500
400
300
200
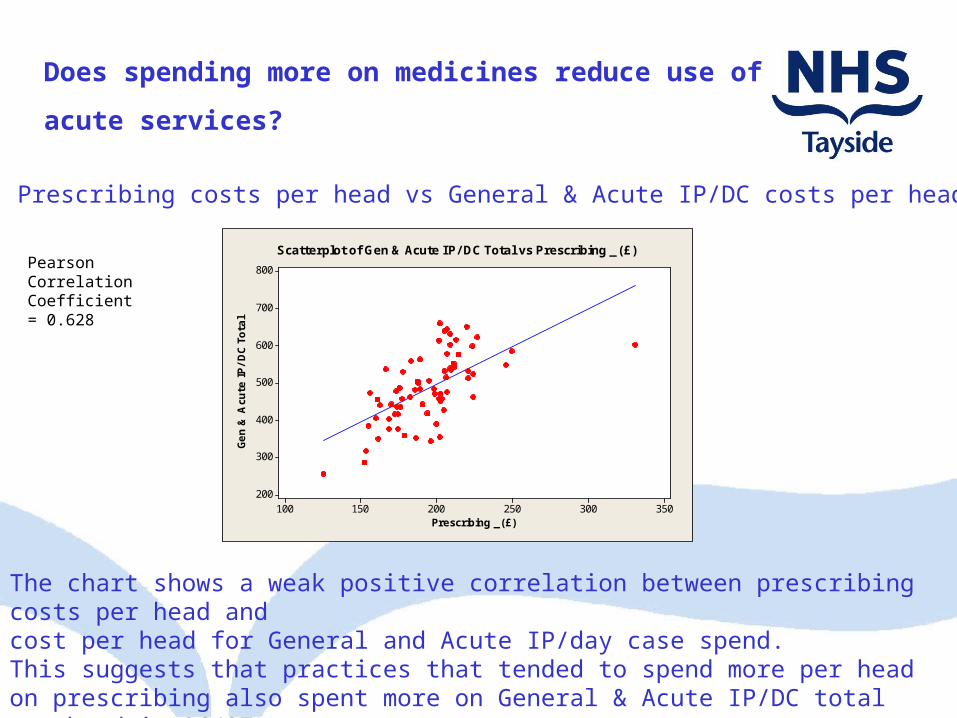
Scatterplot of Gen & Acute IP/ DC Total vs Prescribing _ (£)Pearson Correlation Coefficient = 0.628
The chart shows a weak positive correlation between prescribing costs per head andcost per head for General and Acute IP/day case spend.This suggests that practices that tended to spend more per head on prescribing also spent more on General & Acute IP/DC total per head in 06/07
Prescribing costs per head vs General & Acute IP/DC costs per head
Does spending more on medicines reduce use of
acute services?
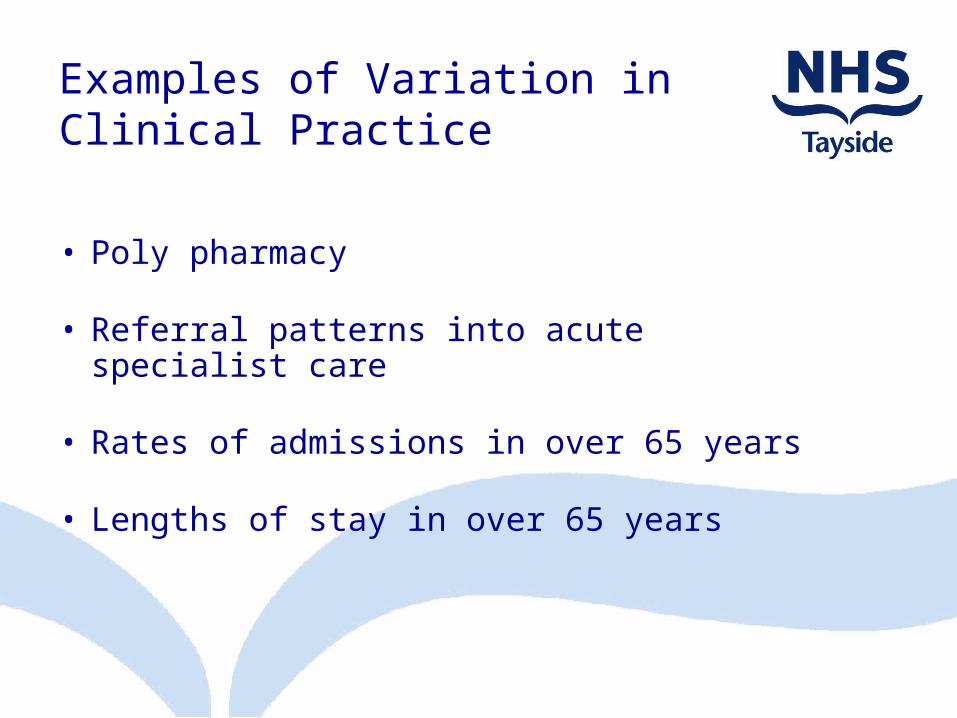
Examples of Variation in Clinical Practice
• Poly pharmacy
• Referral patterns into acute specialist care
• Rates of admissions in over 65 years
• Lengths of stay in over 65 years

Achieving Quality Improvement and Cost ReductionDeveloping and Improving Services
QUALITY INITIATIVES COST REDUCTION PROGRAMMESNEW DEVELOPMENTS EFFICIENCY SAVINGS
1 2 3 4 5
Costs more Cost neutral Improves quality Quality neutral Reduces & reduces costs quality

Improving Quality and Reducing Costs
Our Choice
Surviving – the 5%
Thrive – the 95%


TACTICAL STRATEGIC
DEALING WITH THE 5%
SPENDING THE 95% BETTER
PRODUCTIVITY & EFFICIENCY
CRES
SERVICE OPTIMISATION
TRANSFORMATION
2009 - 2011
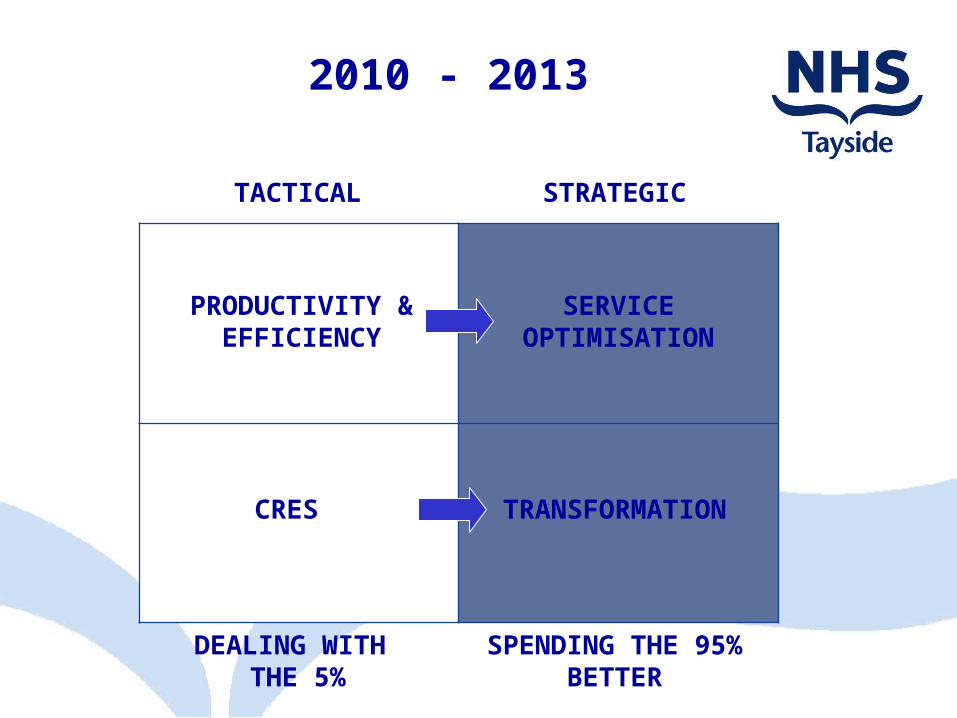
2010 - 2013
TACTICAL STRATEGIC
DEALING WITH THE 5%
SPENDING THE 95% BETTER
PRODUCTIVITY & EFFICIENCY
CRES
SERVICE OPTIMISATION
TRANSFORMATION
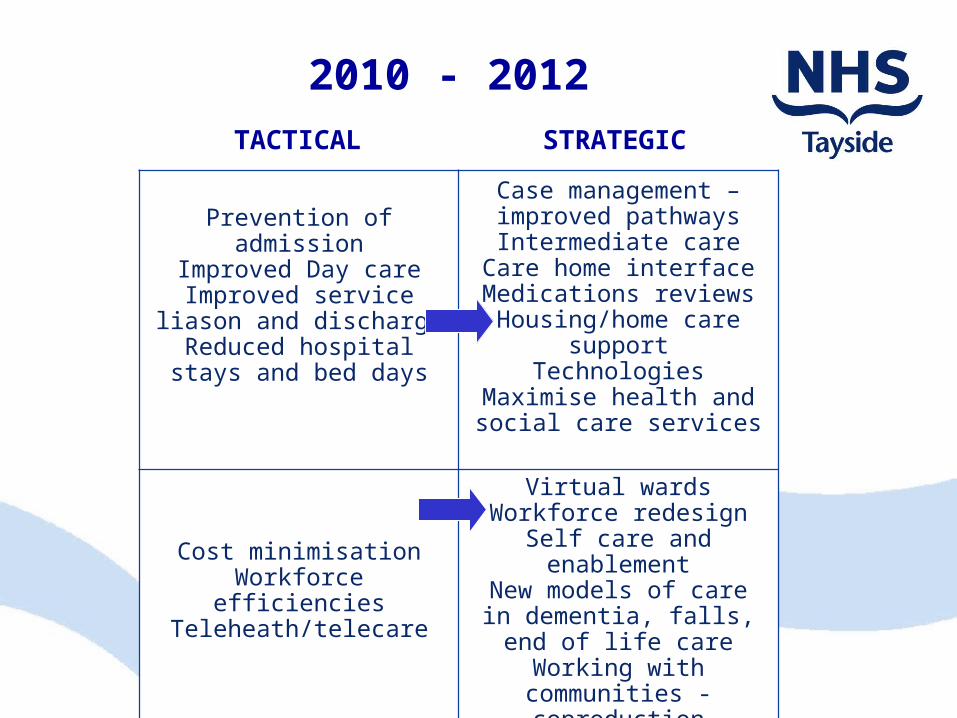
2010 - 2012TACTICAL STRATEGIC
DEALING WITH THE 5%
SPENDING THE 95% BETTER
Prevention of admissionImproved Day care
Improved service liason and discharge
Reduced hospital stays and bed days
Case management – improved pathwaysIntermediate care
Care home interfaceMedications reviewsHousing/home care
supportTechnologies
Maximise health and social care services
Cost minimisationWorkforce efficiencies
Teleheath/telecare
Virtual wardsWorkforce redesign
Self care and enablement
New models of care in dementia, falls, end of
life careWorking with communities - coproduction
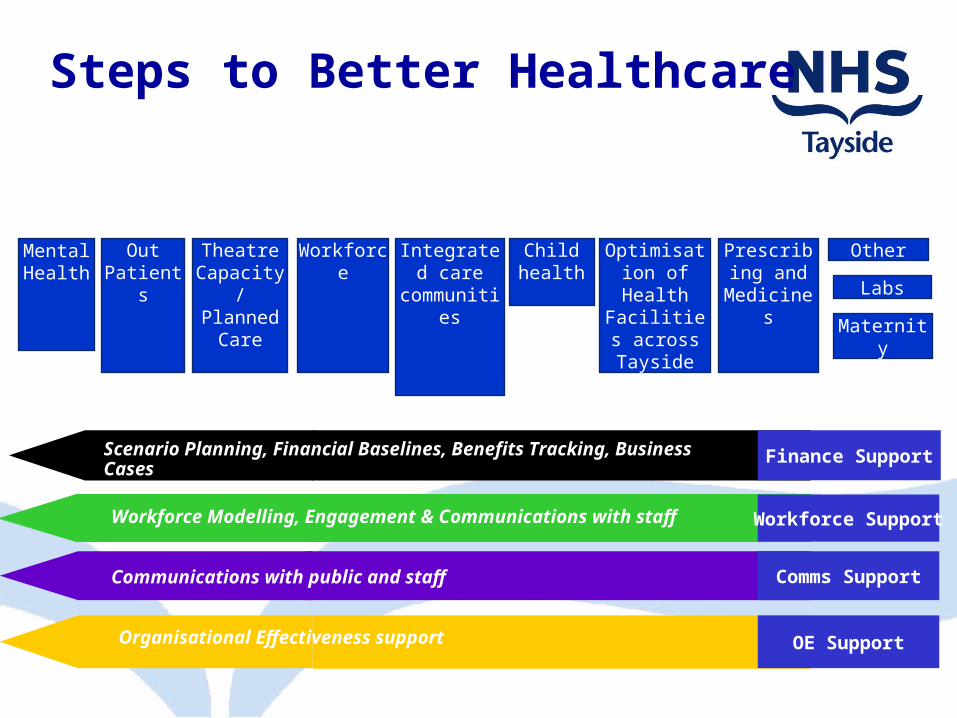
Steps to Better Healthcare
Mental Health
OutPatients
Theatre Capacity / Planned
Care
Workforce Integrated care
communities
Child health
Optimisation of Health Facilities across Tayside
Prescribing and
Medicines
Finance Support
Workforce Support
Scenario Planning, Financial Baselines, Benefits Tracking, Business Cases
Workforce Modelling, Engagement & Communications with staff
Comms SupportCommunications with public and staff
Other
OE SupportOrganisational Effectiveness support
Labs
Maternity

There Is No Recession In Innovation
“Fortunes are NOT made in the boom times...That
is merely the collection period. Fortunes are
made in depressions or lean times when the wise
man overhauls his mind, his methods, his
resources, and gets in training for the race to
come."
George Wood Bacon
Related Documents