The Burden of Chronic Diseases in Missouri: Opportunities and Challenges for Public Health Shumei Yun, MD, PhD Chronic Disease Public Health Epidemiologist Office of Epidemiology

The Burden of Chronic Diseases in Missouri: Opportunities and Challenges for Public Health Shumei Yun, MD, PhD Chronic Disease Public Health Epidemiologist.
Dec 22, 2015
Welcome message from author
This document is posted to help you gain knowledge. Please leave a comment to let me know what you think about it! Share it to your friends and learn new things together.
Transcript

The Burden of Chronic Diseases in Missouri: Opportunities and Challenges for Public Health
Shumei Yun, MD, PhD
Chronic Disease Public Health Epidemiologist
Office of Epidemiology
Chronic Diseases
Chronic diseases can be defined as diseases that have a prolonged course, that do not resolve spontaneously, and which a complete cure is rarely achieved.
Chronic disease epidemiology and control, 2nd Edition

Chronic Diseases
Characteristics of Chronic Diseases– Uncertain etiology – Multiple risk factors– A long latency period– A prolonged course of illness
Chronic disease epidemiology and control, 2nd Edition

Major Chronic Diseases
Cardiovascular Disease Cancer
– Lung Cancer– Colorectal Cancer– Breast Cancer– Cervical Cancer– Prostate Cancer

Major Chronic Diseases
Chronic Lung Diseases– Asthma– Chronic Obstructive Pulmonary Disease
Diabetes Arthritis and Other Musculoskeletal Diseases
– Osteoarthritis– Rheumatoid Arthritis– Osteoporosis
Chronic Neurologic Disorders– Alzheimer’s Disease– Parkinson’s Disease

Chronic Diseases in the U.S.
According to CDC, more than 90 million people in the U.S. live with a chronic illness.
Chronic diseases—such as heart disease, cancer, and diabetes —are the leading causes of death and disability.
Chronic diseases account for 7 out of every 10 deaths.
The treatment of chronic diseases accounts for 75% of total health care cost each year.

Leading Causes of Death in Missouri, 2004
Septicemia
Source: DHSS-MICA
15,432
12,429
3,483
2,738
2,639
1,466
1,406
1,384
1,080
728
0 5,000 10,000 15,000 20,000
Heart disease
Cancer
Cerebrovascular disease
Chronic lower respiratory diseases
Unintentional injury
Diabetes
Pneumonia & influenza
Alzheimer's disease
Kidney disease
Suicide
Source: DHSS-MICA

Missouri is among the States with Highest CVD Deaths in the Nation
More than 1 in 5 Missourians have some form of CVD.
More than 21,000 CVD deaths occur each year. CVD deaths remained high compared to other
states.

CVD Hospitalization Rates* in Missouri, 1994-2004
*Age Adjustment Uses 2000 Standard US PopulationSource: DHSS-MICA. * CVD as the principal diagnosis
0
50
100
150
200
250
300
350
400
1994
1995
1996
1997
1998
1999
2000
2001
2002
2003
2004
Ra
tes
pe
r 1
0,0
00
White
Black
Overall

CVD Inpatient Hospitalization Charges* in Missouri, by Pay Sources, 1994-2004
Source: DHSS-MICA. * CVD as the principal diagnosis
0
500
1000
1500
2000
2500
3000
3500
4000
1994
1995
1996
1997
1998
1999
2000
2001
2002
2003
2004
Mil
lio
n d
oll
ars
Medicare
Medicaid
All pay sources
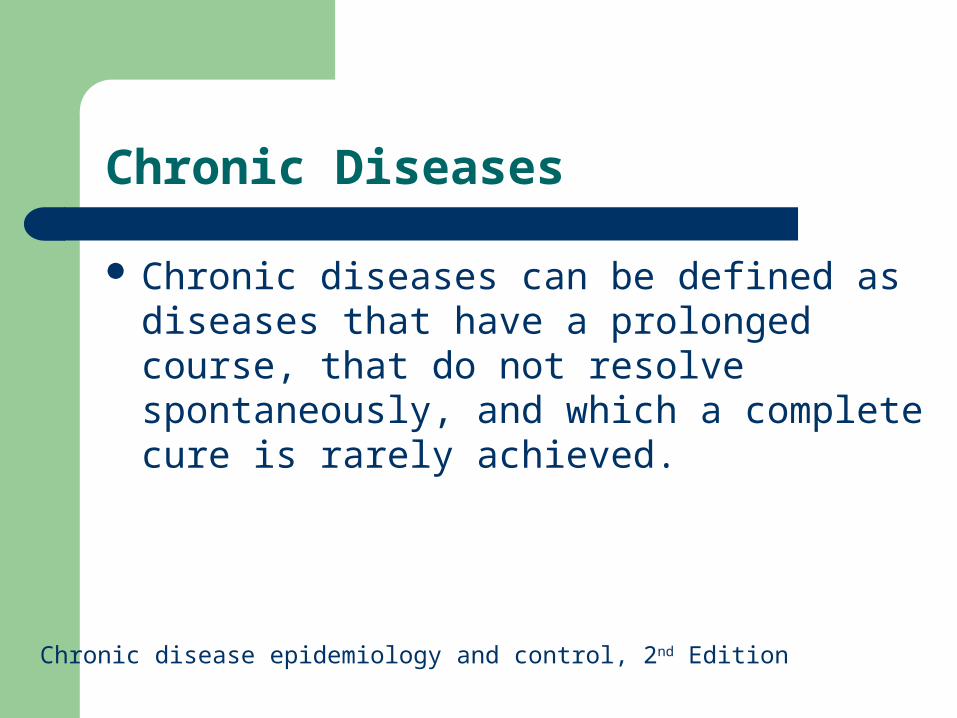
CVD Inpatient Hospitalization Charges* in Missouri, by Pay Sources, 1994-2004
Source: DHSS-MICA. * CVD the principal diagnosisTaking into account population change and CPI medical component
0
500
1000
1500
2000
2500
1994
1995
1996
1997
1998
1999
2000
2001
2002
2003
2004
Mill
ion
Do
llars
Medicare
Medicaid
All pay sources

CVD Mortality Rates* in Missouri, 1990-2004
Age Adjustment Uses 2000 Standard US PopulationSource: DHSS-MICA. * CVD as the underlying cause
0
100
200
300
400
500
600
1990
1992
1994
1996
1998
2000
2002
2004
Rat
es p
er 1
00,0
00
White
Black
Overall
US

CVD Death Rates in the US , 1999
Source: http://www.cdc.gov/nccdphp/bb_heartdisease/index.htmAge-adjusted Death Rates per 100,000 Population
Cancer- Missourians Most Concerned Diseases
Cancer affects three out of four Missouri families.
More than 28,000 new cases are diagnosed each year in Missouri.
Over 12,000 cancer deaths occur each year.

All Cancer Incidence Rates* in Missouri, 1996-2002
*Age Adjustment Uses 2000 Standard US Population
Data Source: Missouri Cancer Registry
0
100
200
300
400
500
600
1996 1997 1998 1999 2000 2001 2002
Rat
es p
er 1
00,0
00
White
Black
Overall
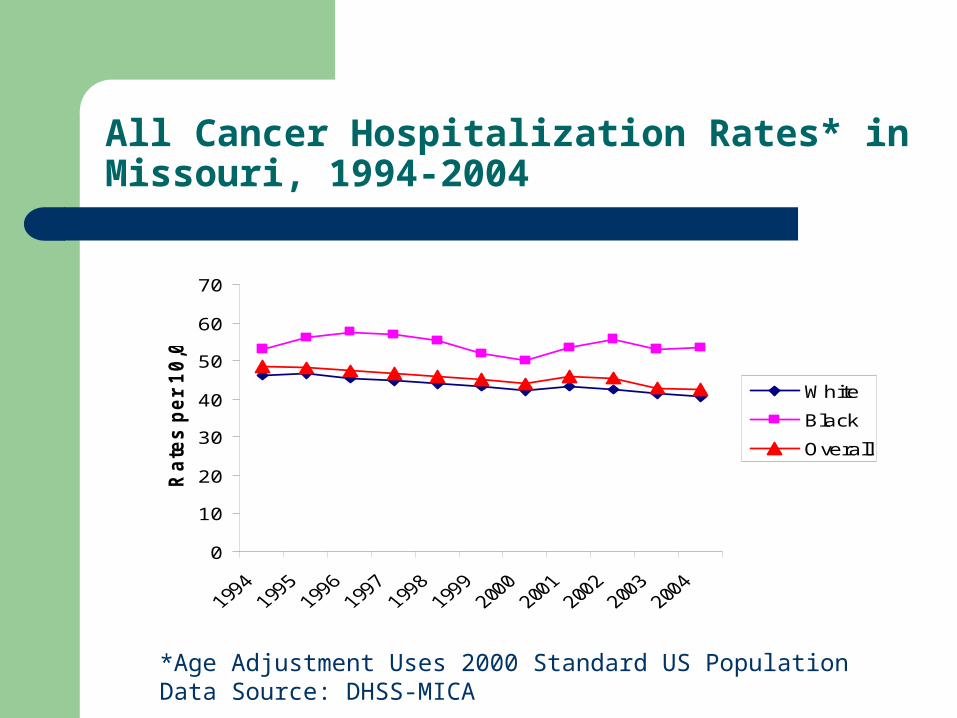
All Cancer Hospitalization Rates* in Missouri, 1994-2004
*Age Adjustment Uses 2000 Standard US PopulationData Source: DHSS-MICA
0
10
20
30
40
50
60
70
Ra
tes
pe
r 1
0,0
00
White
Black
Overall
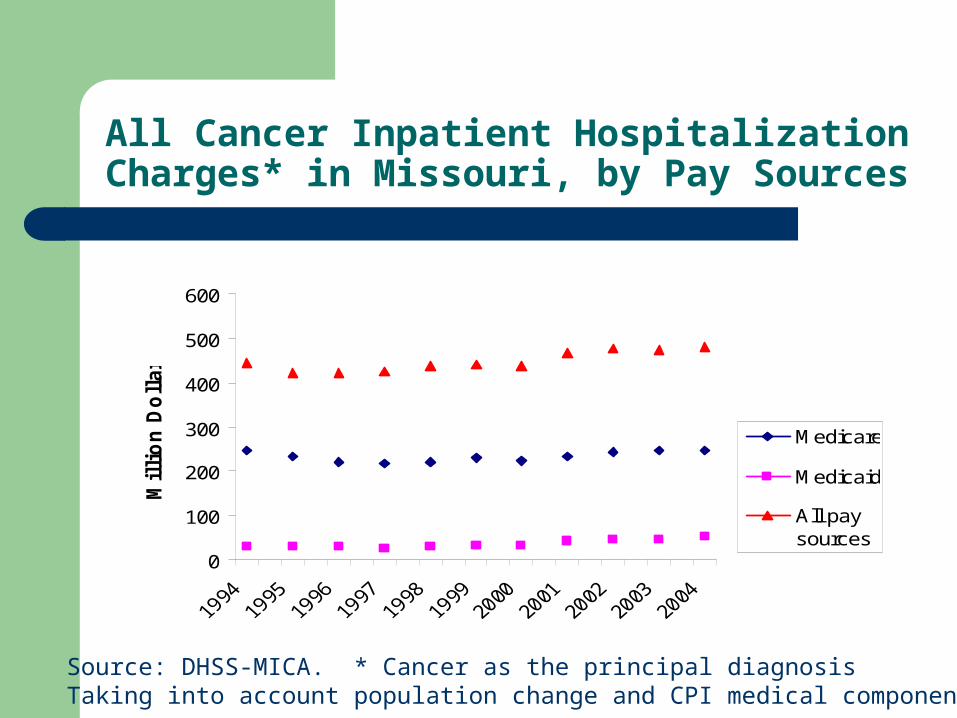
All Cancer Inpatient Hospitalization Charges* in Missouri, by Pay Sources
Source: DHSS-MICA. * Cancer as the principal diagnosisTaking into account population change and CPI medical component
0
100
200
300
400
500
600
Mil
lio
n D
oll
ars
Medicare
Medicaid
All paysources

All Cancer Mortality Rates* in Missouri, 1990-2004
* Age Adjustment Uses 2000 Standard US PopulationData Source: DHSS-MICA
0
50
100
150
200
250
300
350
Rate
s p
er
100,0
00
White
Black
Overall
US

Breast Cancer Mortality Rates* Among Women in Missouri, 1990-2004
* Age Adjustment Uses 2000 Standard US PopulationData Source: DHSS-MICA
05
1015
2025
3035
4045
50
Rate
s p
er
100,0
00
White
Black
Overall
US

Breast Cancer Mortality Rates* in Missouri, 1990-2004
* Age Adjustment Uses 2000 Standard US PopulationData Source: DHSS-MICA
05
1015
2025
3035
4045
50
Rate
s p
er
100,0
00
White
Black
Overall
US
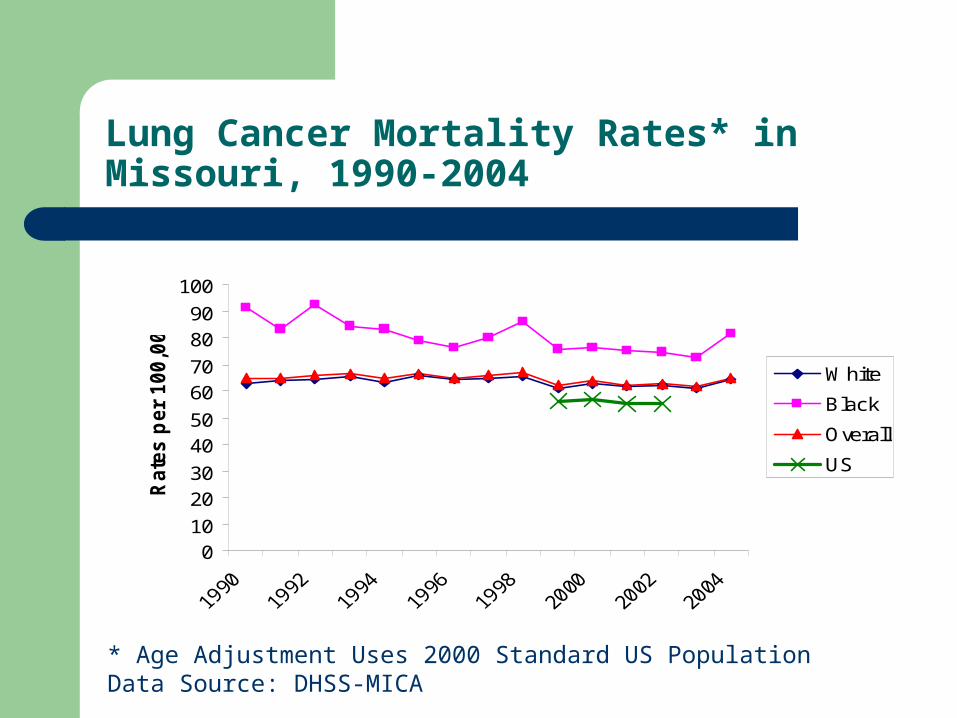
Lung Cancer Mortality Rates* in Missouri, 1990-2004
* Age Adjustment Uses 2000 Standard US PopulationData Source: DHSS-MICA
010
2030
4050
6070
8090
100
Rate
s p
er
100,0
00
White
Black
Overall
US

Lung Cancer Mortality Rates* in Missouri, by Sex, 1990-2004
* Age Adjustment Uses 2000 Standard US PopulationData Source: DHSS-MICA
0
20
40
60
80
100
120
Rate
s p
er
100,0
00
Male
Female
Overall

Diabetes is on the rise in Missouri
In 2005, 7.7% of adults aged 18 or older have physician diagnosed diabetes.
About 1/3 of all persons with diabetes are unaware of their condition.
The number of children with type 2 diabetes is increasing.
Minorities and people with low SES are disproportionately affected.
Diabetes is a severe illness
Without appropriate management, diabetes can lead to – Kidney failure– Blindness– Amputations– Cardiovascular diseases– Death due to flu and pneumonia complications.

Prevalence of Self-reported Physician Diagnosed Diabetes in Missouri, 1990-2005
0
2
4
6
8
10
12
14
Pre
vale
nce (
%)
White
Black
Overall
Data Source: Missouri BRFSS
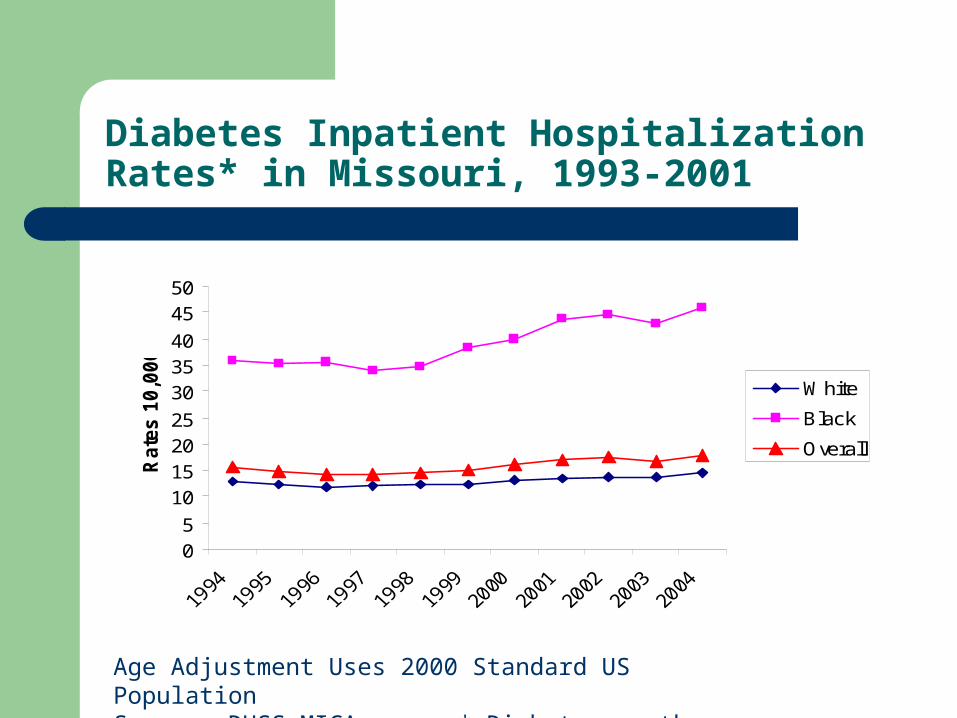
Diabetes Inpatient Hospitalization Rates* in Missouri, 1993-2001
Age Adjustment Uses 2000 Standard US PopulationSource: DHSS-MICA. * Diabetes as the principal diagnosis
05
10152025
303540
4550
Rate
s 1
0,0
00
White
Black
Overall

Diabetes* Emergency Room Visit Rates in Missouri, 1994 - 2004
Age Adjustment Uses 2000 Standard US PopulationSource: DHSS-MICA. * Diabetes as the principal diagnosis
00.5
11.5
22.5
33.5
44.5
5
1994
1995
1996
1997
1998
1999
2000
2001
2002
2003
2004
Rat
es p
er 1
,000
White
Black
Overall

Diabetes Inpatient Hospitalization Charges* in Missouri, by Pay Sources, 1994-2004
0
20
40
60
80
100
120
1994
1995
1996
1997
1998
1999
2000
2001
2002
2003
2004
Mil
lio
n D
oll
ars
Medicare
Medicaid
Total
* Diabetes as the principal diagnosisTaking into account population change and CPI medical component

Diabetes Mortality Rates* in Missouri, 1990-2004
*Age Adjustment Uses 2000 Standard US PopulationSource: DHSS-MICA. * Diabetes as the underlying cause
0
10
20
30
40
50
60
1990
1992
1994
1996
1998
2000
2002
2004
Rat
es p
er 1
00,0
00
White
Black
Overall

Arthritis: the Leading Cause of Disability
In 2005, 32.1% of Missourians have physician diagnosed arthritis.
About 15.5% of Missourians have certain activity limitation due to arthritis or joint symptoms.
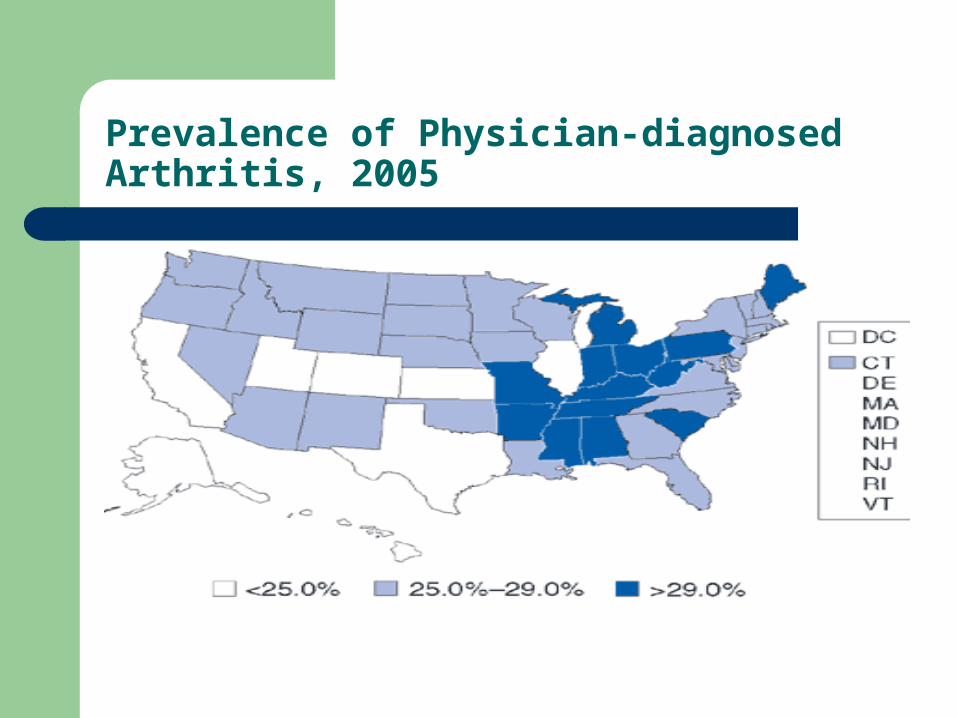
Prevalence of Physician-diagnosed Arthritis, 2005

Arthritis Hospitalization Rates* in Missouri, 1993-2003
*Age Adjustment Uses 2000 Standard US PopulationSource: DHSS-Community Data Profile
0
5
10
15
20
25
30
35
40
1993-5
1994-6
1995-7
1996-8
1997-9
1998-2000
1999-2001
2000-2
2001-3
Rate
s p
er
10,0
00
White
Black
Overall

Osteoarthritis Inpatient Hospital Charges* in Missouri, by Pay Sources, 1994-2004
Source: DHSS-MICA. * Osteoarthritis as the principal diagnosisTaking into account population change and CPI medical component
0
50
100
150
200
250
300
1992 1994 1996 1998 2000 2002 2004 2006
Mil
lio
ns D
oll
ars
Medicare
Medicaid
All PaySources

Asthma: Leading Cause of Hospitalization among Children <15 Yrs
More than 30,000 ER visits each year in Missouri– More than 1/3 by children < 15 yrs
More than 7,000 hospitalizations each year– More than 1/3 by children < 15 yrs
Adults with current asthma in 2005: 9%
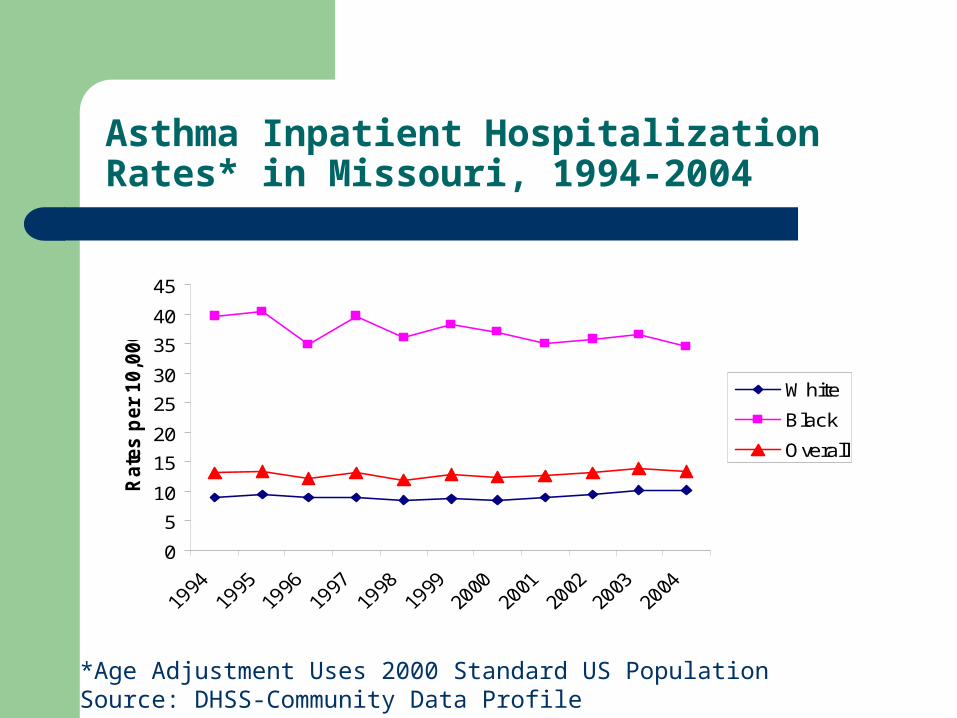
Asthma Inpatient Hospitalization Rates* in Missouri, 1994-2004
0
5
10
15
20
25
30
35
40
45
Rate
s p
er
10,0
00
White
Black
Overall
*Age Adjustment Uses 2000 Standard US PopulationSource: DHSS-Community Data Profile

Asthma Inpatient Hospitalization Charges* in Missouri, by Pay Sources
Source: DHSS-MICA. * Asthma as the principal diagnosisTaking into account population change and CPI medical component
0
5
10
15
20
25
30
35
40
45
1994
1995
1996
1997
1998
1999
2000
2001
2002
2003
2004
Mil
lio
ns D
oll
ars
Medicare
Medicaid
All Pay Sources

Asthma ER Rates in Missouri, 1994-2004
02
46
810
1214
1618
20
Rate
s p
er
1,0
00
White
Black
Overall
Age Adjustment Uses 2000 Standard US PopulationSource: DHSS-MICA. * Asthma as the principal diagnosis

Opportunities
Chronic diseases are preventable. Prevention is cost-effective. Public health interventions work. Infrastructure for chronic disease prevention
and control exists.

Evidence-Based Interventions
Become Involved Send comments and
suggestions
Topics Alcohol Cancer Diabetes Mental Health Motor Vehicle Nutrition Oral Health Physical Activity
Pregnancy Sexual Behavior Social Environment Substance Abuse Tobacco Vaccines
Violence
http://www.thecommunityguide.org/alcohol/default.htm

Challenges
High prevalence of risk factors Lack of support for prevention Lack of funding for prevention Sustained multi-sectoral commitments needed Social determinants of chronic diseases Aging Population

Risk Factors among Missouri Youth, 2003
Overweight prevalence – High school students 12.1– Middle school students 15.9%
Tobacco use prevalence– High school students 24.8%– Middle school students 8.8%
Not meeting CDC physical activity recommendations– High school students 28.4%– Middle school students 26.1%
No vigorous or moderate physical activity– High school students 8%– Middle school students 7.3%

Prevalence of Smoking among Adults in Missouri

Obesity Prevalence among Adults in Missouri, 1990 - 2002
0
5
10
15
20
25
1990 1991 1992 1993 1994 1995 1996 1997 1998 1999 2000 2001 2002
Pre
va
len
ce
(%
)

Prevalence of No Leisure-time Physical Activity among Missouri Adults, 1990-2002
0
10
20
30
40
50
60
1988 1990 1992 1994 1996 1998 2000 2002 2004
Pre
va
len
ce
(%
)

Aging population


Thank You
Related Documents