The bottleneck mechanism of a freeway diverge Juan Carlos Mu~ noz 1 , Carlos F. Daganzo * Department of Civil and Environmental Engineering, Institute of Transportation Studies, University of California, 416 McLaughlin Hall, Berkeley, CA 94720, USA Received 7 August 2000; received in revised form 18 January 2001; accepted 19 March 2001 Abstract This paper describes the behavior of multi-lane freeway traffic, upstream of an oversaturated off-ramp. It is based on empirical evidence from freeway I-880 (northbound) near Oakland, CA. The main findings are: FIFO blockage. Even on wide freeways, an off-ramp queue can grow across all lanes and entrap through vehicles in a first-in-first-out (FIFO) system with similar speeds on all lanes and a well-defined kinematic wave (KW). This can hamper freeway flow much more than an on-ramp bottleneck. (In our case the FIFO regime arose a little over 2 km upstream of the exit and reduced discharge flow approximately to an average of 1500 veh/h per lane across all lanes.) Variable capacity. Under FIFO, the freeway discharge flow can change significantly without a change in the off-ramp flow when the percent of exiting vehicles changes. (In our case, it increased to 5750 veh/h after 30 min at 4520 veh/h when the exit percentage declined from 29% to 24%.) Non-FIFO congested regimes. Multi-pipe traffic states, where queued lanes move at different speeds, can persist for a long time. Presumably, this happens because different drivers prefer different lanes depending on their destination. (In our case, multi-pipe queued regimes were detected immediately upstream and immediately downstream of the FIFO queue.) Semi-congested traffic regimes, where some lanes are queued and others are not, also exist. (They were detected downstream of the FIFO queue.) Regularity of the flow-density scatter-plots. If one excludes the periods of time corresponding to multi- pipe flow and regime transitions, flow-density points across all lanes are quite close to a ‘‘fundamental diagram’’ with two branches. During multi-pipe periods, flow-density scatter points cluster along an inner line, parallel to the congested branch, because drivers give themselves longer spacings when driving under these conditions. Ó 2002 Elsevier Science B.V. All rights reserved. * Corresponding author. Tel.: +1-510-642-3853; fax: +1-510-643-8919. E-mail address: [email protected] (C.F. Daganzo). 1 Instructor at the Pontificia Universidad Cat olica de Chile, Ph.D. student at U.C. Berkeley. 0965-8564/02/$ - see front matter Ó 2002 Elsevier Science B.V. All rights reserved. PII:S0965-8564(01)00017-9 Transportation Research Part A 36 (2002) 483–505 www.elsevier.com/locate/tra

Welcome message from author
This document is posted to help you gain knowledge. Please leave a comment to let me know what you think about it! Share it to your friends and learn new things together.
Transcript
The bottleneck mechanism of a freeway diverge
Juan Carlos Mu~nnoz 1, Carlos F. Daganzo *
Department of Civil and Environmental Engineering, Institute of Transportation Studies,
University of California, 416 McLaughlin Hall, Berkeley, CA 94720, USA
Received 7 August 2000; received in revised form 18 January 2001; accepted 19 March 2001
Abstract
This paper describes the behavior of multi-lane freeway traffic, upstream of an oversaturated off-ramp. Itis based on empirical evidence from freeway I-880 (northbound) near Oakland, CA. The main findings are:
FIFO blockage. Even on wide freeways, an off-ramp queue can grow across all lanes and entrap throughvehicles in a first-in-first-out (FIFO) system with similar speeds on all lanes and a well-defined kinematicwave (KW). This can hamper freeway flow much more than an on-ramp bottleneck. (In our case the FIFOregime arose a little over 2 km upstream of the exit and reduced discharge flow approximately to an averageof 1500 veh/h per lane across all lanes.)
Variable capacity. Under FIFO, the freeway discharge flow can change significantly without a change inthe off-ramp flow when the percent of exiting vehicles changes. (In our case, it increased to 5750 veh/h after30 min at 4520 veh/h when the exit percentage declined from 29% to 24%.)
Non-FIFO congested regimes. Multi-pipe traffic states, where queued lanes move at different speeds, canpersist for a long time. Presumably, this happens because different drivers prefer different lanes dependingon their destination. (In our case, multi-pipe queued regimes were detected immediately upstream andimmediately downstream of the FIFO queue.) Semi-congested traffic regimes, where some lanes are queuedand others are not, also exist. (They were detected downstream of the FIFO queue.)
Regularity of the flow-density scatter-plots. If one excludes the periods of time corresponding to multi-pipe flow and regime transitions, flow-density points across all lanes are quite close to a ‘‘fundamentaldiagram’’ with two branches. During multi-pipe periods, flow-density scatter points cluster along an innerline, parallel to the congested branch, because drivers give themselves longer spacings when driving underthese conditions. � 2002 Elsevier Science B.V. All rights reserved.
* Corresponding author. Tel.: +1-510-642-3853; fax: +1-510-643-8919.
E-mail address: [email protected] (C.F. Daganzo).1 Instructor at the Pontificia Universidad Cat�oolica de Chile, Ph.D. student at U.C. Berkeley.
0965-8564/02/$ - see front matter � 2002 Elsevier Science B.V. All rights reserved.
PII: S0965-8564(01)00017-9
Transportation Research Part A 36 (2002) 483–505www.elsevier.com/locate/tra
1. Introduction
This paper describes the behavior of multi-lane freeway traffic, upstream of an oversaturatedoff-ramp. The paper is based on a longer report (Mu~nnoz and Daganzo, 2000) which includes amore detailed description of the data and some of the procedures that were used to process it.Reference will be made to that report as needed. The present paper stresses findings focusing onthe behavior of the bottleneck, the front of the queue and the queue itself. This paper attempts toincrease the research community’s awareness of the pernicious effects that saturated off-ramps canhave on freeway traffic flow. The behavior of the back of the queue is also examined in Mu~nnozand Daganzo (2000), but these findings are left for another publication.
Perhaps, the simplest model of a diverge-bottleneck would be based on the first-in-first-out(FIFO) rule, where queued vehicles share the same delay independent of destination. Althoughthe FIFO rule facilitates modeling, e.g., as proposed in Daganzo (1995), FIFO off-ramp bottle-necks are undesirable because they can generate major problems, even on wide freeways. This isfurther explained in Daganzo (1999) and Daganzo et al. (1999). The latter reference also presentssome evidence of real-world FIFO effects, although not conclusive. It shows that an off-rampqueue propagated upstream, moved in the transverse direction to flow and reduced the speed andflow on all lanes until the speed on all lanes was roughly equal.
The present paper strengthens these results by examining the same site in more detail for adifferent day with longer queues that lasted for over 1 h. A kinematic wave (KW) was found 2 kmupstream of the off-ramp for all lanes combined. This means that the traffic stream is in a ‘‘1-pipe’’regime where lanes flow at the same average speed and need not be differentiated. It was alsofound that on that particular day the queue discharge rate increased by more than 25% becausethe origin–destination (O/D) mix in the arrivals changed. These findings are a ‘‘signature’’ of theFIFO mechanism for diverges proposed in Daganzo (1995). Since the observations were made ona wide freeway, FIFO blockages across all lanes should be expected on all types of freeways –especially narrow ones. FIFO problems should be expected whenever the delay to exiting vehiclesis considerable.
Between the FIFO blockage and the exit ramp, drivers may segregate themselves by destina-tion, and different speeds may prevail on different lanes. We call this a ‘‘multi-pipe’’ regime. Multi-pipe states have been noted in Lawson et al. (1999), where it was shown that the shoulder lanesupstream of a congested off-ramp exhibited higher occupancies than the median lanes and that thedifferences across lanes increased in magnitude close to the off-ramp. The present paper repro-duces these results. In addition, it shows that very close to the exit, the speed differences can belarge enough to generate a ‘‘semi-congested’’ multi-pipe state where kinematic waves travel inopposite directions on different lanes. It is also shown that the multi-pipe states persist in a sta-tionary state for a long time, as long as the queue discharge rate is steady, and that the particularpattern may depend on queue composition.
Multi-pipe states were also detected at the back of the queue. It was found that drivers con-tinued to adopt predictable average spacings under multi-pipe conditions, and that these spacingswere consistently longer. The effect is that for the same total flow, a multi-pipe queue is somewhatless dense than a 1-pipe queue.
This paper is organized as follows. Section 2 describes the site, the data set, and what generallyhappened during the observation period; it establishes in particular that multi-pipe, congested
484 J.C. Mu~nnoz, C.F. Daganzo / Transportation Research Part A 36 (2002) 483–505
regimes can persist on multi-lane freeways for a long time. Section 3 examines the 1-pipe queuethat grew well upstream of the off-ramp, and the variations in its discharge rate. Section 4 takes acloser look at the two ends of the queue; it shows that semi-congested regimes existed at the frontof the queue and that the queue became less dense when multi-pipe conditions appeared. Section 5discusses the implications.
2. Data analysis and overview
Geometry. Previously examined in Lawson et al. (1999), the study site is a section of US In-terstate Freeway I-880 (northbound), directly upstream of the connecting off-ramp with freeway I-238. A diagram is shown in Fig. 1(a). Lanes are numbered from 1–5 starting with the median lane,which is a high occupancy vehicle (HOV) lane. Detector station labels are shown along thebottom of the figure. They differ from those used by Caltrans and Lawson et al. (1999). The labelsused in this report express the approximate distance between each station and the I-238 off-rampin multiples of 100 m. (For example, the first station from the left which is 2705 m away fromstation 0 is labeled ‘‘27’’.) The HOV lane ends between stations 22 and 17. The HOV designationis in force between 15:00 and 19:00 h.
Traffic data. The site is interesting because a troublesome queue starts to backup from the I-238off-ramp every weekday sometime between 14:30 and 15:00 h. The queue eventually grows andfills all the non-HOV lanes, disrupting through flow in a big way. The resulting main-line con-gestion lasts until 18:00 h and beyond. The freeway service patrol (FSP) data set (Skabardoniset al., 1994) was used for our study because of the high fidelity equipment that was used to collectdata, and their fine level of detail. The data set includes 2-s counts and 2-min occupancies at everystation and lane (except for lane 2 of station 17, which had a malfunctioning detector) for March5, 1993. The available information for this day was treated as described in Mu~nnoz and Daganzo(2000), in order to recover from it pertinent speed and cumulative N-curve information. (The rawdata have been posted on the web at ‘‘www.ce.berkeley.edu/�daganzo/’’, and will be kept therefor 2 yr.) The following is a summary of what was done, and the main features of the systemrevealed by the data.
Speeds. The flow–occupancy ratio for each detector was multiplied by a constant to convert itinto space-mean speed. The constants were chosen so as to force a match between: (a) the pre-dicted space-mean speed for each detector during the uncongested interval from 14:00 to 14:10 h,and (b) the average speed across all lanes observed for the same time-of-day interval during arecent field trip. This speed was found to be 108 km/h, with only small variations across lanes. Theresults are not exact, but they are sufficiently accurate for our purposes.
Fig. 2(a) shows the speed time-series obtained from the detector on lane 3 of station 12. Notehow the measured speeds drop gradually but substantially after 14:00 h and then stabilize at alower value. This is estimated to occur at around 15:10 h. A similar pattern, with a gradual dropand subsequent stabilization, was observed at the remaining detectors; see Figs. 10–15 of Ap-pendix A. Fig. 2(b) shows the estimated times when the stabilization occurs at all the locationswhere data were available. The picture indicates that a queue started from within the off-ramp at14:50 h, grew upstream, and about 45 min later reached all the lanes of station 27 simultaneously(at 15:38 h). From this time on, the speeds at all the locations remained approximately constant
J.C. Mu~nnoz, C.F. Daganzo / Transportation Research Part A 36 (2002) 483–505 485
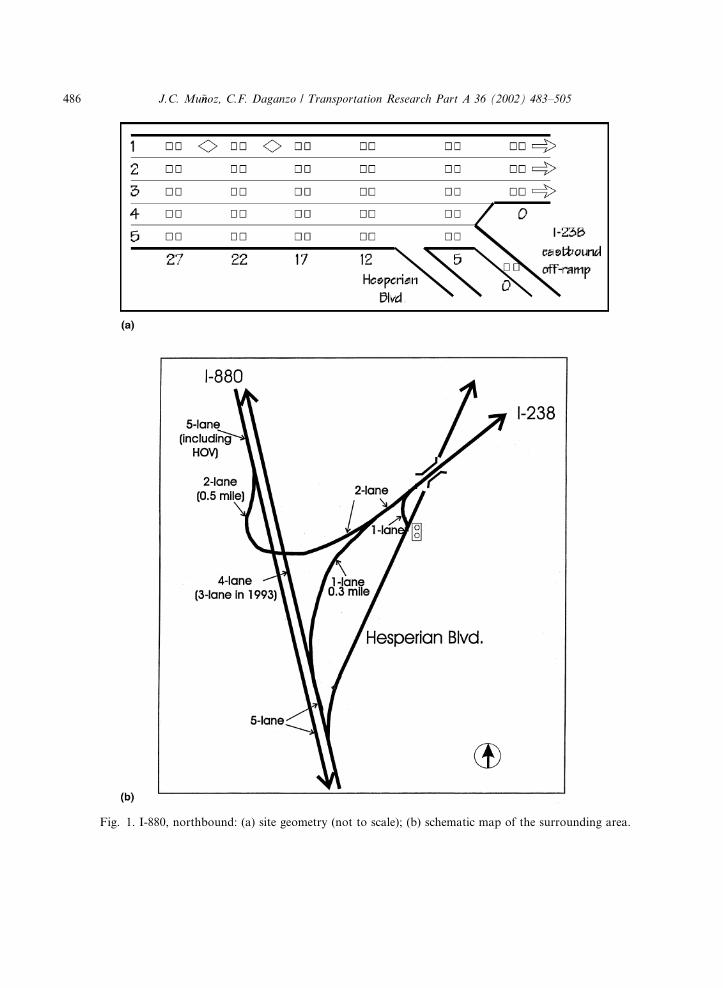
Fig. 1. I-880, northbound: (a) site geometry (not to scale); (b) schematic map of the surrounding area.
486 J.C. Mu~nnoz, C.F. Daganzo / Transportation Research Part A 36 (2002) 483–505
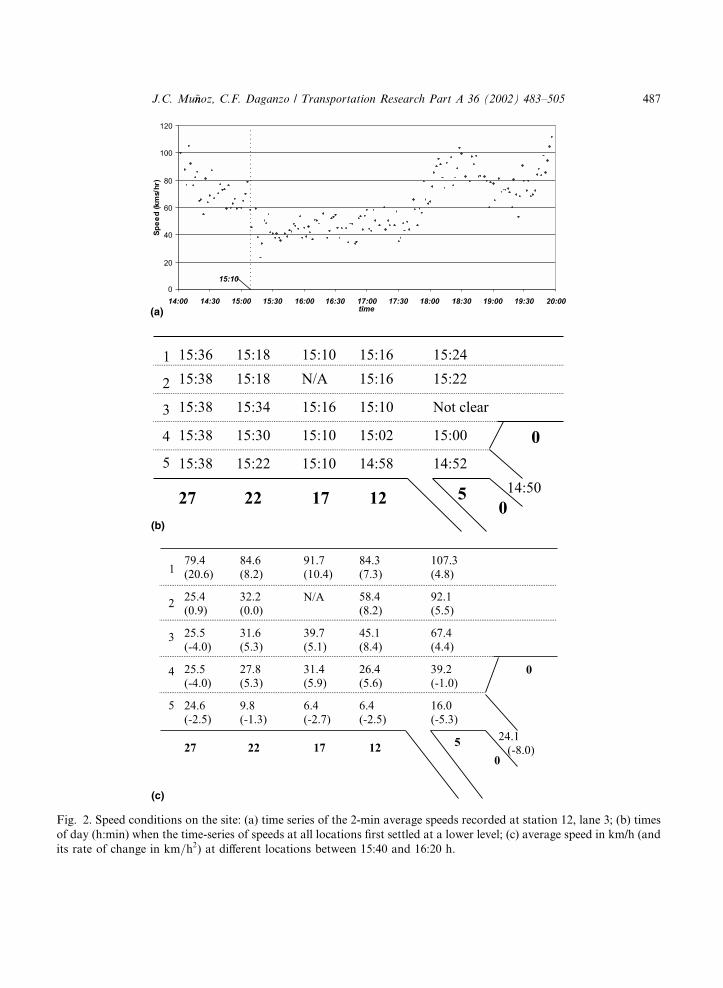
Fig. 2. Speed conditions on the site: (a) time series of the 2-min average speeds recorded at station 12, lane 3; (b) times
of day (h:min) when the time-series of speeds at all locations first settled at a lower level; (c) average speed in km/h (and
its rate of change in km=h2) at different locations between 15:40 and 16:20 h.
J.C. Mu~nnoz, C.F. Daganzo / Transportation Research Part A 36 (2002) 483–505 487
for just over 40 min, suggesting that the traffic stream between stations 27 and 5 was in a steadystate from 15:40 to 16:20 h. Part c of the figure shows the average speeds observed at each detectorand their (small) rate of change over the period. 2 These data show that the speeds on the medianlanes increased in the downstream direction when the freeway was congested, and that they werealways quite high at station 5. This indicates that the diverge area was unblocked by downstreamfreeway queues, and confirms that the upstream congestion was indeed caused by the off-rampspillover.
Note as well that the closer one is to the bottleneck the wider is the variation in speed across thenon-HOV lanes. The spread is largest (76.1 km/h) for station 5, and smallest (under 1 km/h) forstation 27. The HOV lane remains largely unaffected by the queue. These data strengthen thefindings in Lawson et al. (1999) by showing that congested states with different speeds on differentlanes not only exist, but can also persist without change for a long time.
N-curves (Newell-curves). These curves display cumulative vehicle count vs. time at differentlocations. Counts are started at the different locations with the passage of a reference vehicle, so asto ensure that if vehicles are conserved (no entrances and exits) vertical separations betweencurves denote vehicle accumulations, and horizontal separations trip times. Additional infor-mation on N-curves can be found in introductory books such as Newell (1982) and Daganzo(1997b). As usual, to construct the N-curves, clocks had to be synchronized, and detector countshad to be corrected for systematic bias and random drift.
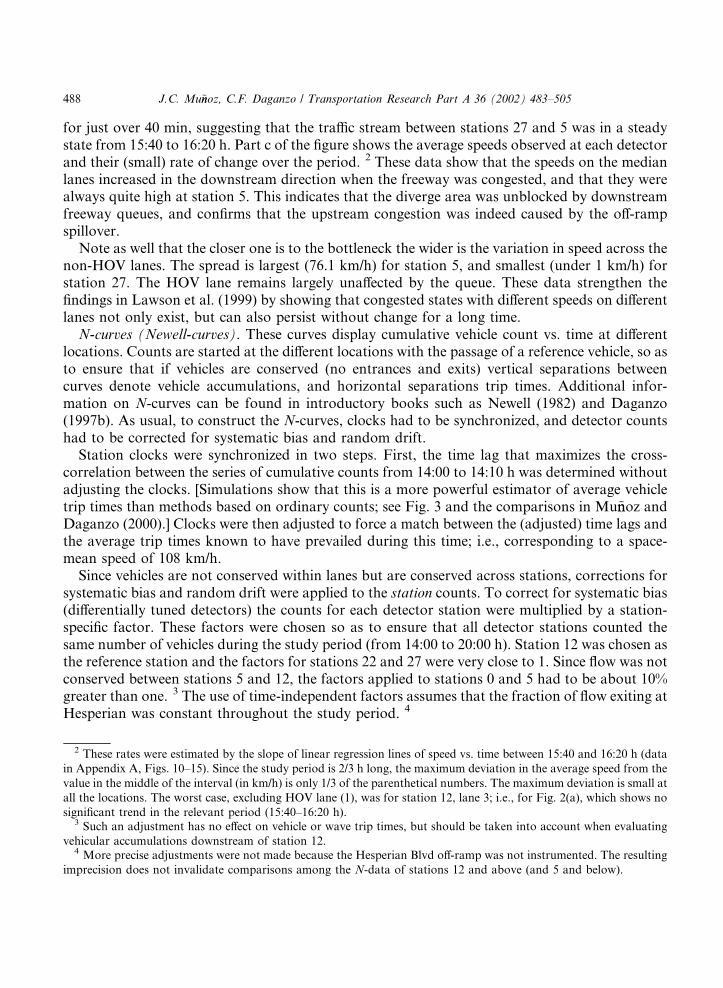
Station clocks were synchronized in two steps. First, the time lag that maximizes the cross-correlation between the series of cumulative counts from 14:00 to 14:10 h was determined withoutadjusting the clocks. [Simulations show that this is a more powerful estimator of average vehicletrip times than methods based on ordinary counts; see Fig. 3 and the comparisons in Mu~nnoz andDaganzo (2000).] Clocks were then adjusted to force a match between the (adjusted) time lags andthe average trip times known to have prevailed during this time; i.e., corresponding to a space-mean speed of 108 km/h.
Since vehicles are not conserved within lanes but are conserved across stations, corrections forsystematic bias and random drift were applied to the station counts. To correct for systematic bias(differentially tuned detectors) the counts for each detector station were multiplied by a station-specific factor. These factors were chosen so as to ensure that all detector stations counted thesame number of vehicles during the study period (from 14:00 to 20:00 h). Station 12 was chosen asthe reference station and the factors for stations 22 and 27 were very close to 1. Since flow was notconserved between stations 5 and 12, the factors applied to stations 0 and 5 had to be about 10%greater than one. 3 The use of time-independent factors assumes that the fraction of flow exiting atHesperian was constant throughout the study period. 4
2 These rates were estimated by the slope of linear regression lines of speed vs. time between 15:40 and 16:20 h (data
in Appendix A, Figs. 10–15). Since the study period is 2/3 h long, the maximum deviation in the average speed from the
value in the middle of the interval (in km/h) is only 1/3 of the parenthetical numbers. The maximum deviation is small at
all the locations. The worst case, excluding HOV lane (1), was for station 12, lane 3; i.e., for Fig. 2(a), which shows no
significant trend in the relevant period (15:40–16:20 h).3 Such an adjustment has no effect on vehicle or wave trip times, but should be taken into account when evaluating
vehicular accumulations downstream of station 12.4 More precise adjustments were not made because the Hesperian Blvd off-ramp was not instrumented. The resulting
imprecision does not invalidate comparisons among the N-data of stations 12 and above (and 5 and below).
488 J.C. Mu~nnoz, C.F. Daganzo / Transportation Research Part A 36 (2002) 483–505
To correct for random drift, the trip times observed from the curves were checked for con-sistency with the average speeds that were recorded. Surprisingly, no corrections were necessary,except a very minor one for station 22, which appeared to have drifted by about 30 vehicles by18:00 h. (This is a tribute to the reliability of the special detection equipment that was installed atthe site.)
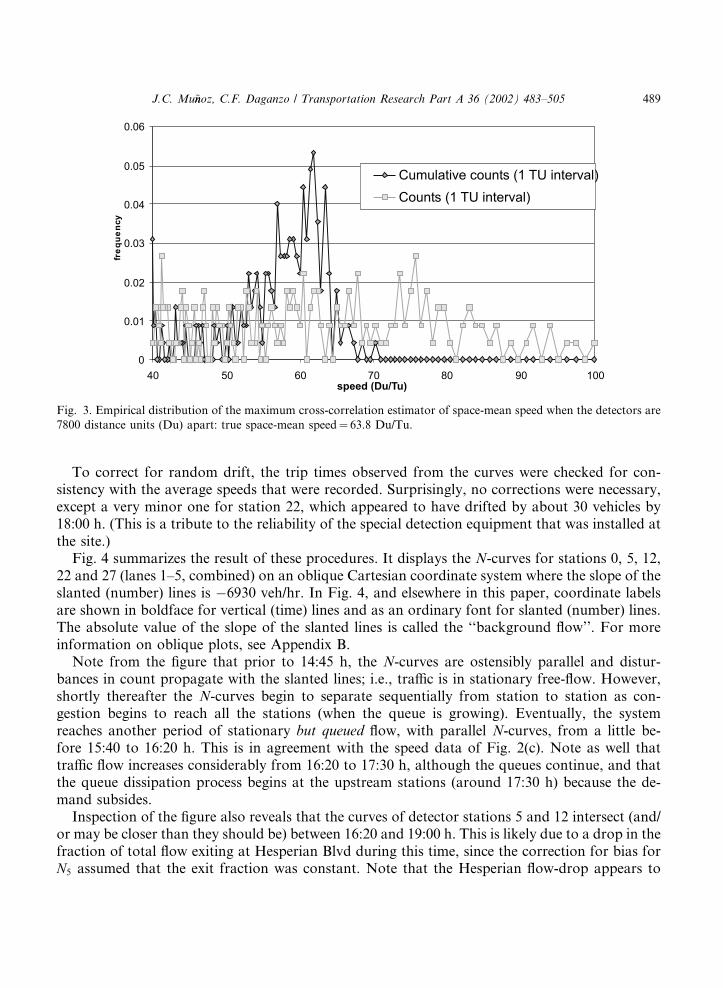
Fig. 4 summarizes the result of these procedures. It displays the N-curves for stations 0, 5, 12,22 and 27 (lanes 1–5, combined) on an oblique Cartesian coordinate system where the slope of theslanted (number) lines is �6930 veh/hr. In Fig. 4, and elsewhere in this paper, coordinate labelsare shown in boldface for vertical (time) lines and as an ordinary font for slanted (number) lines.The absolute value of the slope of the slanted lines is called the ‘‘background flow’’. For moreinformation on oblique plots, see Appendix B.
Note from the figure that prior to 14:45 h, the N-curves are ostensibly parallel and distur-bances in count propagate with the slanted lines; i.e., traffic is in stationary free-flow. However,shortly thereafter the N-curves begin to separate sequentially from station to station as con-gestion begins to reach all the stations (when the queue is growing). Eventually, the systemreaches another period of stationary but queued flow, with parallel N-curves, from a little be-fore 15:40 to 16:20 h. This is in agreement with the speed data of Fig. 2(c). Note as well thattraffic flow increases considerably from 16:20 to 17:30 h, although the queues continue, and thatthe queue dissipation process begins at the upstream stations (around 17:30 h) because the de-mand subsides.
Inspection of the figure also reveals that the curves of detector stations 5 and 12 intersect (and/or may be closer than they should be) between 16:20 and 19:00 h. This is likely due to a drop in thefraction of total flow exiting at Hesperian Blvd during this time, since the correction for bias forN5 assumed that the exit fraction was constant. Note that the Hesperian flow-drop appears to
Fig. 3. Empirical distribution of the maximum cross-correlation estimator of space-mean speed when the detectors are
7800 distance units (Du) apart: true space-mean speed¼ 63.8 Du/Tu.
J.C. Mu~nnoz, C.F. Daganzo / Transportation Research Part A 36 (2002) 483–505 489
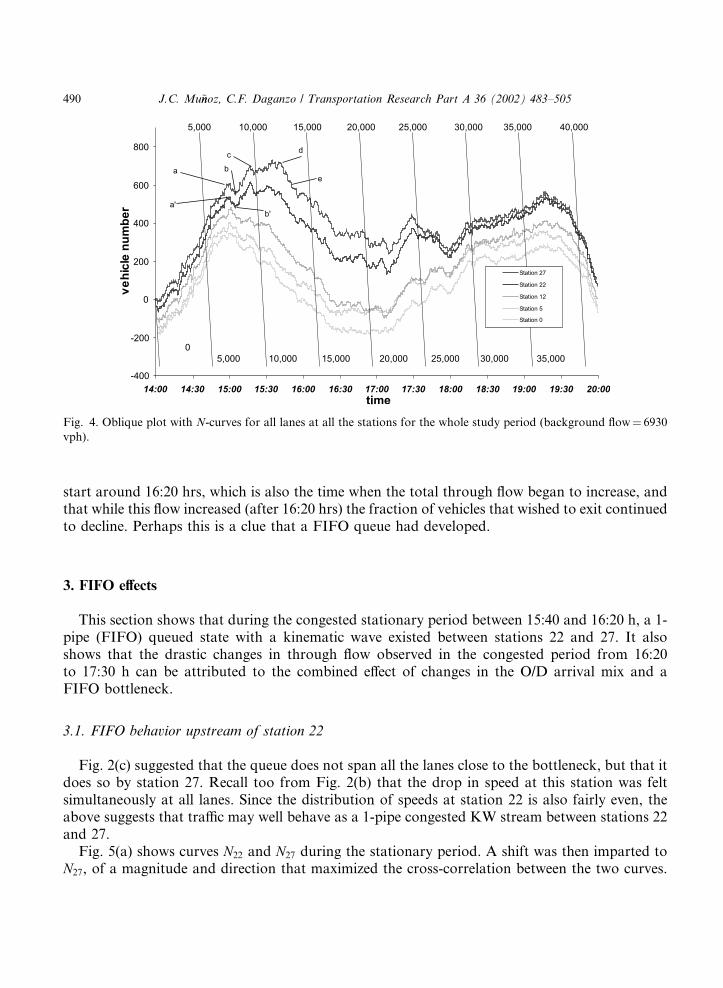
start around 16:20 hrs, which is also the time when the total through flow began to increase, andthat while this flow increased (after 16:20 hrs) the fraction of vehicles that wished to exit continuedto decline. Perhaps this is a clue that a FIFO queue had developed.
3. FIFO effects
This section shows that during the congested stationary period between 15:40 and 16:20 h, a 1-pipe (FIFO) queued state with a kinematic wave existed between stations 22 and 27. It alsoshows that the drastic changes in through flow observed in the congested period from 16:20to 17:30 h can be attributed to the combined effect of changes in the O/D arrival mix and aFIFO bottleneck.
3.1. FIFO behavior upstream of station 22
Fig. 2(c) suggested that the queue does not span all the lanes close to the bottleneck, but that itdoes so by station 27. Recall too from Fig. 2(b) that the drop in speed at this station was feltsimultaneously at all lanes. Since the distribution of speeds at station 22 is also fairly even, theabove suggests that traffic may well behave as a 1-pipe congested KW stream between stations 22and 27.
Fig. 5(a) shows curves N22 and N27 during the stationary period. A shift was then imparted toN27, of a magnitude and direction that maximized the cross-correlation between the two curves.
Fig. 4. Oblique plot with N-curves for all lanes at all the stations for the whole study period (background flow¼ 6930
vph).
490 J.C. Mu~nnoz, C.F. Daganzo / Transportation Research Part A 36 (2002) 483–505
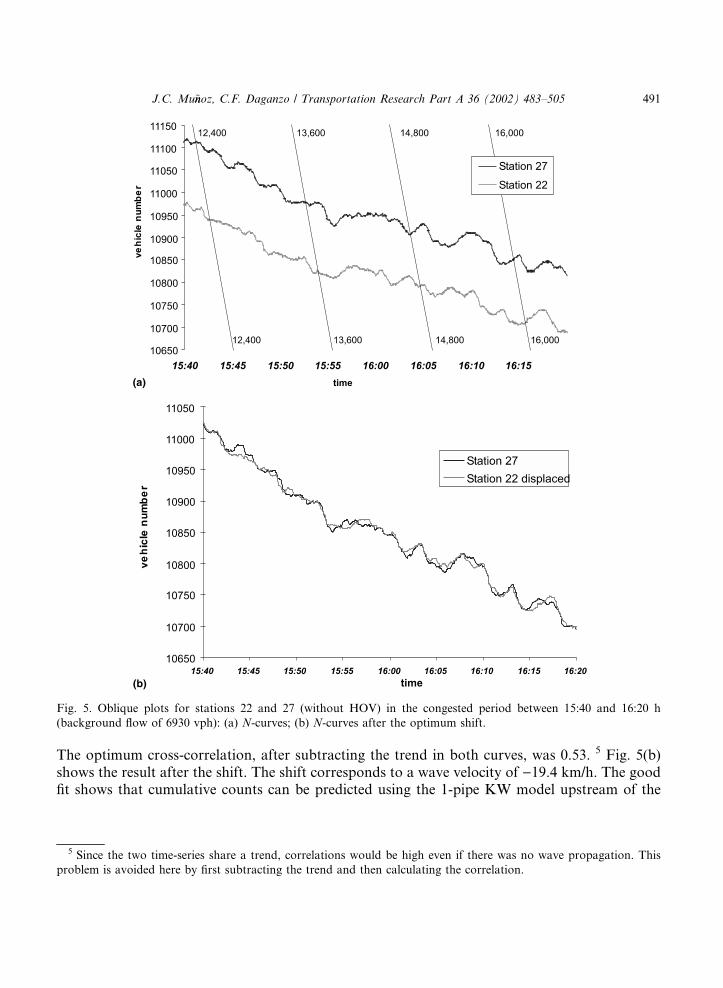
The optimum cross-correlation, after subtracting the trend in both curves, was 0.53. 5 Fig. 5(b)shows the result after the shift. The shift corresponds to a wave velocity of )19.4 km/h. The goodfit shows that cumulative counts can be predicted using the 1-pipe KW model upstream of the
Fig. 5. Oblique plots for stations 22 and 27 (without HOV) in the congested period between 15:40 and 16:20 h
(background flow of 6930 vph): (a) N-curves; (b) N-curves after the optimum shift.
5 Since the two time-series share a trend, correlations would be high even if there was no wave propagation. This
problem is avoided here by first subtracting the trend and then calculating the correlation.
J.C. Mu~nnoz, C.F. Daganzo / Transportation Research Part A 36 (2002) 483–505 491
2-km mark. This distance will probably be different at sites with different numbers of lanes andmay also depend on the O/D mix within the queue.
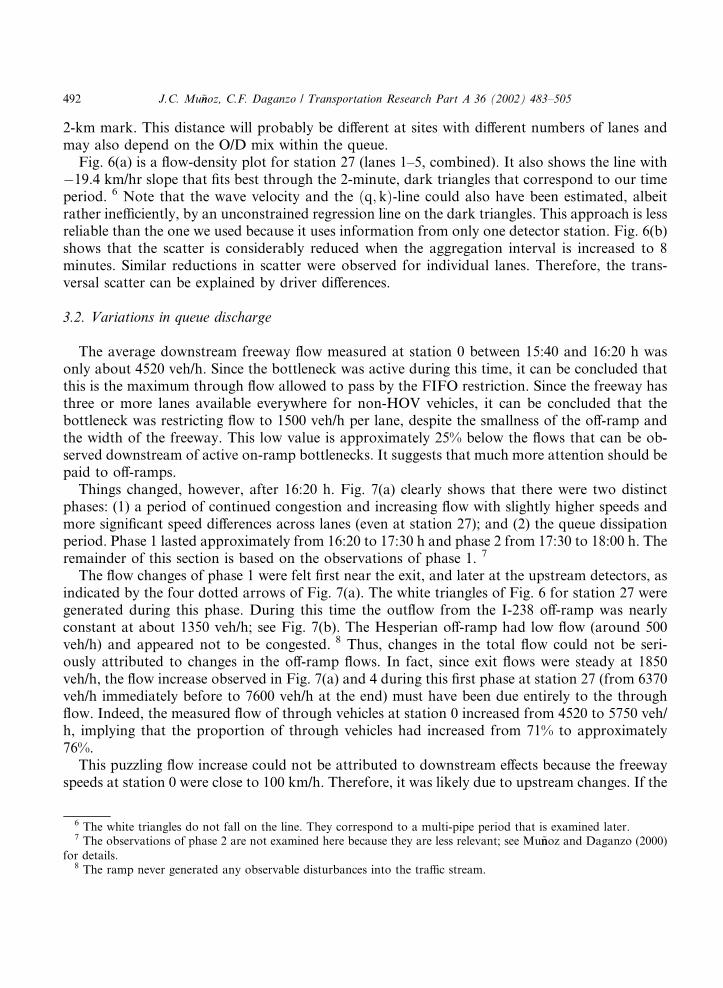
Fig. 6(a) is a flow-density plot for station 27 (lanes 1–5, combined). It also shows the line with�19.4 km/hr slope that fits best through the 2-minute, dark triangles that correspond to our timeperiod. 6 Note that the wave velocity and the ðq; kÞ-line could also have been estimated, albeitrather inefficiently, by an unconstrained regression line on the dark triangles. This approach is lessreliable than the one we used because it uses information from only one detector station. Fig. 6(b)shows that the scatter is considerably reduced when the aggregation interval is increased to 8minutes. Similar reductions in scatter were observed for individual lanes. Therefore, the trans-versal scatter can be explained by driver differences.
3.2. Variations in queue discharge
The average downstream freeway flow measured at station 0 between 15:40 and 16:20 h wasonly about 4520 veh/h. Since the bottleneck was active during this time, it can be concluded thatthis is the maximum through flow allowed to pass by the FIFO restriction. Since the freeway hasthree or more lanes available everywhere for non-HOV vehicles, it can be concluded that thebottleneck was restricting flow to 1500 veh/h per lane, despite the smallness of the off-ramp andthe width of the freeway. This low value is approximately 25% below the flows that can be ob-served downstream of active on-ramp bottlenecks. It suggests that much more attention should bepaid to off-ramps.
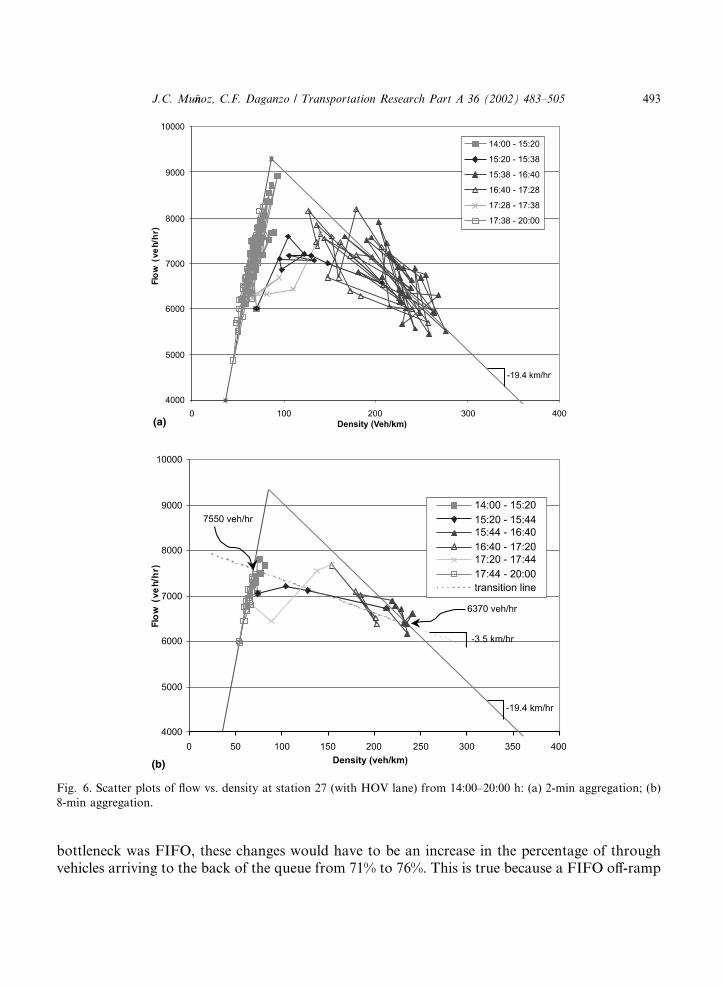
Things changed, however, after 16:20 h. Fig. 7(a) clearly shows that there were two distinctphases: (1) a period of continued congestion and increasing flow with slightly higher speeds andmore significant speed differences across lanes (even at station 27); and (2) the queue dissipationperiod. Phase 1 lasted approximately from 16:20 to 17:30 h and phase 2 from 17:30 to 18:00 h. Theremainder of this section is based on the observations of phase 1. 7
The flow changes of phase 1 were felt first near the exit, and later at the upstream detectors, asindicated by the four dotted arrows of Fig. 7(a). The white triangles of Fig. 6 for station 27 weregenerated during this phase. During this time the outflow from the I-238 off-ramp was nearlyconstant at about 1350 veh/h; see Fig. 7(b). The Hesperian off-ramp had low flow (around 500veh/h) and appeared not to be congested. 8 Thus, changes in the total flow could not be seri-ously attributed to changes in the off-ramp flows. In fact, since exit flows were steady at 1850veh/h, the flow increase observed in Fig. 7(a) and 4 during this first phase at station 27 (from 6370veh/h immediately before to 7600 veh/h at the end) must have been due entirely to the throughflow. Indeed, the measured flow of through vehicles at station 0 increased from 4520 to 5750 veh/h, implying that the proportion of through vehicles had increased from 71% to approximately76%.
This puzzling flow increase could not be attributed to downstream effects because the freewayspeeds at station 0 were close to 100 km/h. Therefore, it was likely due to upstream changes. If the
6 The white triangles do not fall on the line. They correspond to a multi-pipe period that is examined later.7 The observations of phase 2 are not examined here because they are less relevant; see Mu~nnoz and Daganzo (2000)
for details.8 The ramp never generated any observable disturbances into the traffic stream.
492 J.C. Mu~nnoz, C.F. Daganzo / Transportation Research Part A 36 (2002) 483–505
bottleneck was FIFO, these changes would have to be an increase in the percentage of throughvehicles arriving to the back of the queue from 71% to 76%. This is true because a FIFO off-ramp
Fig. 6. Scatter plots of flow vs. density at station 27 (with HOV lane) from 14:00–20:00 h: (a) 2-min aggregation; (b)
8-min aggregation.
J.C. Mu~nnoz, C.F. Daganzo / Transportation Research Part A 36 (2002) 483–505 493
bottleneck ‘‘meters’’ the flow on the free branch so as to keep the outflows of the two branches inthe ratio of destinations in the queue; i.e., in the ratio of arrivals at a trip time earlier.
Confirmation of the change in vehicle arrival mix was found elsewhere in the data, in twodifferent ways: (a) from the anomalous variation in the N12 and N5 curves, and (b) from variationsin the speed data at the back of the queue.
(a) If the fraction of through flow had increased from 16:20 to 17:30 h, then the time-indepen-dent bias-correction factor that was used to construct curve N5 would have overestimated thereal cumulative counts at station 5 during this period. This is precisely what happened, as notedat the end of Section 2 by the convergence N12 and N5. This effect is a rather weak confirmation
Fig. 7. (a) Oblique plot with N-curves for all the stations, with all lanes combined, between 15:00 and 18:30 h
(background flow¼ 6930 vph). (b) Oblique plot with N-curve for exit off-ramp at station 0 (background flow¼ 1620
vph). (c) Speed estimation at station 27, lane 5.
494 J.C. Mu~nnoz, C.F. Daganzo / Transportation Research Part A 36 (2002) 483–505
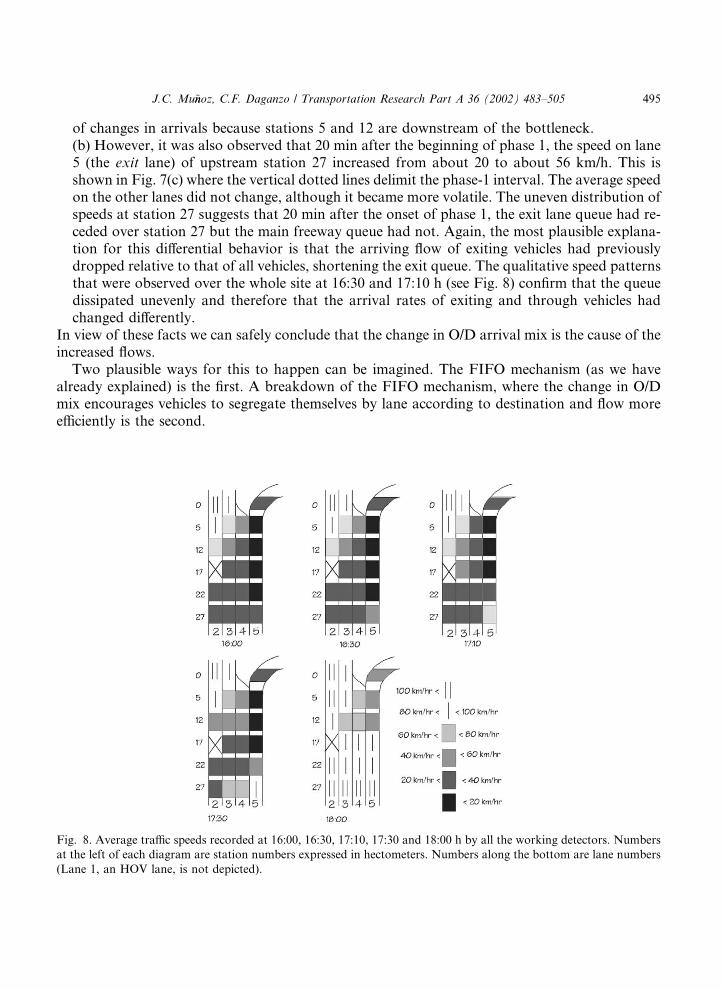
of changes in arrivals because stations 5 and 12 are downstream of the bottleneck.(b) However, it was also observed that 20 min after the beginning of phase 1, the speed on lane5 (the exit lane) of upstream station 27 increased from about 20 to about 56 km/h. This isshown in Fig. 7(c) where the vertical dotted lines delimit the phase-1 interval. The average speedon the other lanes did not change, although it became more volatile. The uneven distribution ofspeeds at station 27 suggests that 20 min after the onset of phase 1, the exit lane queue had re-ceded over station 27 but the main freeway queue had not. Again, the most plausible explana-tion for this differential behavior is that the arriving flow of exiting vehicles had previouslydropped relative to that of all vehicles, shortening the exit queue. The qualitative speed patternsthat were observed over the whole site at 16:30 and 17:10 h (see Fig. 8) confirm that the queuedissipated unevenly and therefore that the arrival rates of exiting and through vehicles hadchanged differently.
In view of these facts we can safely conclude that the change in O/D arrival mix is the cause of theincreased flows.
Two plausible ways for this to happen can be imagined. The FIFO mechanism (as we havealready explained) is the first. A breakdown of the FIFO mechanism, where the change in O/Dmix encourages vehicles to segregate themselves by lane according to destination and flow moreefficiently is the second.
Fig. 8. Average traffic speeds recorded at 16:00, 16:30, 17:10, 17:30 and 18:00 h by all the working detectors. Numbers
at the left of each diagram are station numbers expressed in hectometers. Numbers along the bottom are lane numbers
(Lane 1, an HOV lane, is not depicted).
J.C. Mu~nnoz, C.F. Daganzo / Transportation Research Part A 36 (2002) 483–505 495
We believe that the FIFO effect does not break down in our case. If it did, one would expect tosee a large and sustained increase in the speed of the through lanes between 16:20 and 17:30 h atall stations, but this is not the case. See Figs. 10–15 of Appendix A. To the contrary, the continuedlow speeds at stations 17 and 22 (see Fig. 8) suggest that exiting vehicles continue to use themiddle lanes and interfere with through flow, much as they did at 16:00 h. A FIFO restrictionentrapping all vehicles appears to be still in force around station 22, even though the exit queuehas begun to dissipate at station 27. 9
4. Multi-pipe regimes
4.1. Multi-pipe queue density
Fig. 8 shows that at 16:30 and 17:10 h lane 5 of station 27 had a significantly higher speed thanthe neighboring lanes. Thus, there was no FIFO behavior at station 27 during phase-1, when theexit queue had receded over this station. This is in contrast to the growth period, when a singlequeue reached all the detectors of station 27 simultaneously. Therefore, station 27 was in a FIFOmode when the traffic stream was rich in exiting vehicles (prior to 16:20 h) and in a non-FIFOmode when such vehicles were scarce. This dependence of queue structure on O/D compositionmay be a peculiarity of our site which, by dropping two lanes between stations 5 and 0, trulydiscouraged through vehicles from using the shoulder lane. It is not clear whether it can begeneralized to sites without lane drops. 10
The way drivers space themselves can probably be generalized, however. The data indicate thatthey do so regularly. This can be seen from the white triangles of Fig. 6, which depict the status ofstation 27 during the (non-FIFO) phase. Note that they are noticeably beneath the congestedbranch of the 1-pipe (q; k)-curve and that they cluster along a parallel lower branch. This islogical. It indicates that vehicles travel more cautiously, with slightly wider but predictablespacings, when different lanes move at different speeds and more lane changes can be expected.The figure indicates that multi-pipe queues can be expected to be about 10% less dense than 1-pipequeues for the same flow.
4.2. Existence of semi-congested regimes
It was noted in Section 2 that multi-pipe, congested states existed and persisted near the off-ramp between 15:40 and 16:20 h. Fig. 8 shows that they continued until 17:30 h. Here, it is shownthat on some occasions when speed differences were greatest, waves actually moved forward onthe faster lanes, creating a semi-congested state.
9 Although the speeds do not increase, there is some evidence that the flow in the through lanes between stations 22
and 12 became more organized around 16:20 h. Section 4.2 shows that a positive wave speed could be weakly detected
on lanes 1 and 2 after 16:20 h, but not before. This is likely due to a decrease in the number of lane-changes, and further
corroborates that the number of vehicles diving for the exit ramps had declined around 16:20 h.10 Since the FSP experiments, the lane-4 drop has been removed. Unfortunately, the detection equipment was also
removed so that the site cannot be studied in detail today.
496 J.C. Mu~nnoz, C.F. Daganzo / Transportation Research Part A 36 (2002) 483–505
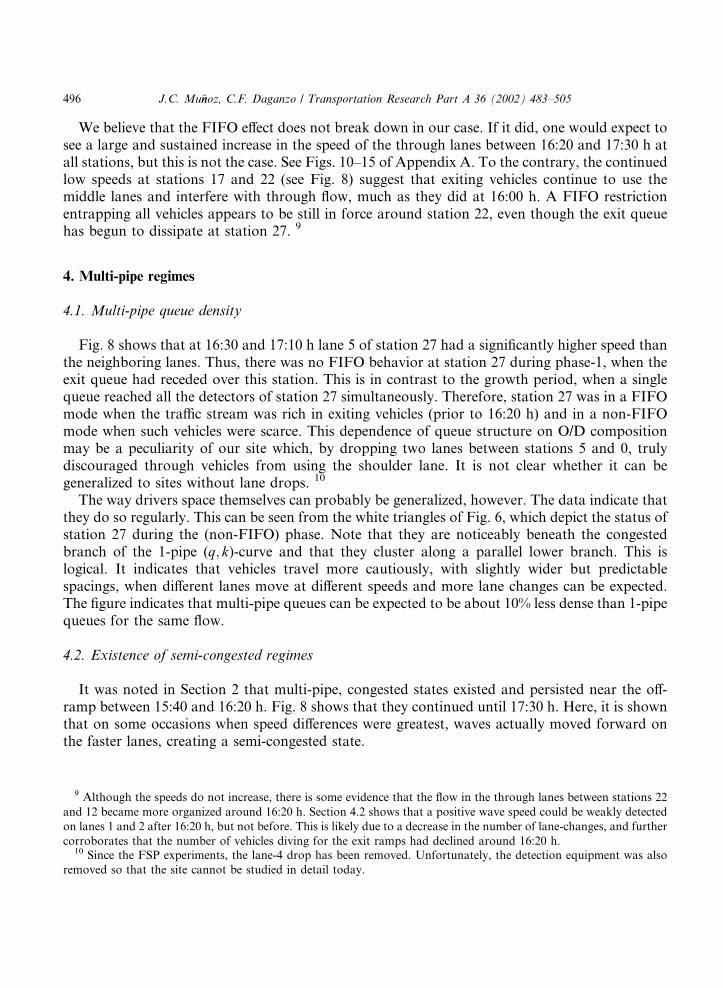
Because station 17 does not have a full complement of detectors, and an off-ramp exists be-tween stations 5 and 12, the section between stations 22 and 12 was examined. Cross-correlationplots like those of Fig. 3 for the cumulative flows at stations 22 and 12 were developed for medianlanes 1 and 2, grouped together, and then for shoulder lanes 4 and 5, also grouped together. Lane3 was not included in either group to increase the difference in the two sets of average speeds. Forthis set-up, well-defined correlations should be expected only if the lane changing maneuvers inand out of lane 3 do not interfere significantly with the flow on the two lane groups.
The cross-correlations for the median lane group did not reveal a strong pattern prior to 16:20h. No evidence of a positive wave velocity was found on these lanes before this time. However,this suddenly changed after the onset of phase-1, perhaps indicating that the crossover flows ofexiting vehicles had declined. Maximum-correlation wave velocities for this period (16:20–16:30 h)were +56.6 km/h for lanes (1, 2), and )16.1 km/h for lanes (4, 5); see Fig. 9. Although the cor-relation curve for lanes (4, 5) has another peak at )8.6 km/h, this curve shows no evidence offorward-moving information. Note as well that information moved forward on lanes (1, 2) at anaverage speed of 57 km/h, which is very close (just a bit lower) than the estimated average speed ofthese lanes. Most importantly, the two curves of Fig. 9 clearly establish that semi-congested statescan exist for quite a distance upstream of a congested diverge.
5. Conclusion
The evidence in this paper suggests that FIFO blockages can arise upstream of congested di-verges where the exiting flow experiences significant delay. The effect should be even more pro-nounced on narrow freeways. Thus, simple FIFO models may be useful as a first approximation.The next approximation would recognize driver tendencies to favor certain lanes in the region
Fig. 9. Cross-correlation of the zero-trend N-curves for stations 12 and 22, from 16:20 to 16:30 h.
J.C. Mu~nnoz, C.F. Daganzo / Transportation Research Part A 36 (2002) 483–505 497
upstream of the diverge. A model of this type, which extends KW theory to account for two setsof lanes and two driver classes, has been proposed in Daganzo (1997a,b) and further examined in
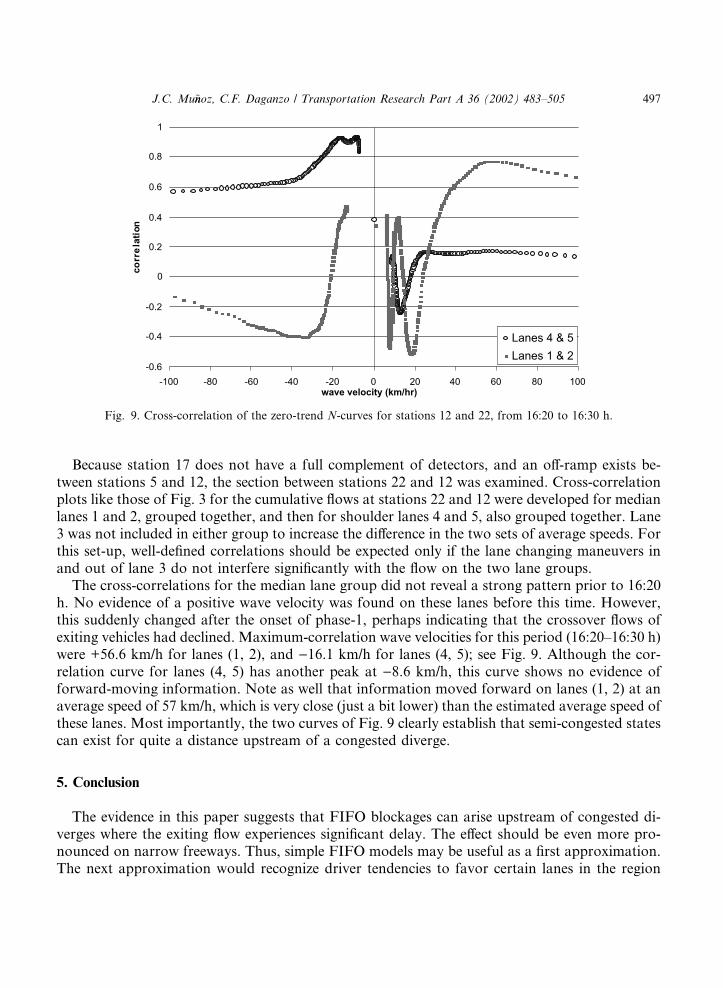
Fig. 10. Speeds on individual lanes of station 27 (in km/h) vs. time-of-day.
498 J.C. Mu~nnoz, C.F. Daganzo / Transportation Research Part A 36 (2002) 483–505
Newell (1999). Daganzo et al. (1997) presents a general computational methodology that caneasily be extended to more driver classes and sets of lanes; e.g., as would be necessary to modelfreeway sections with HOV lanes and exit-only lanes, and/or surface streets with lane markings for
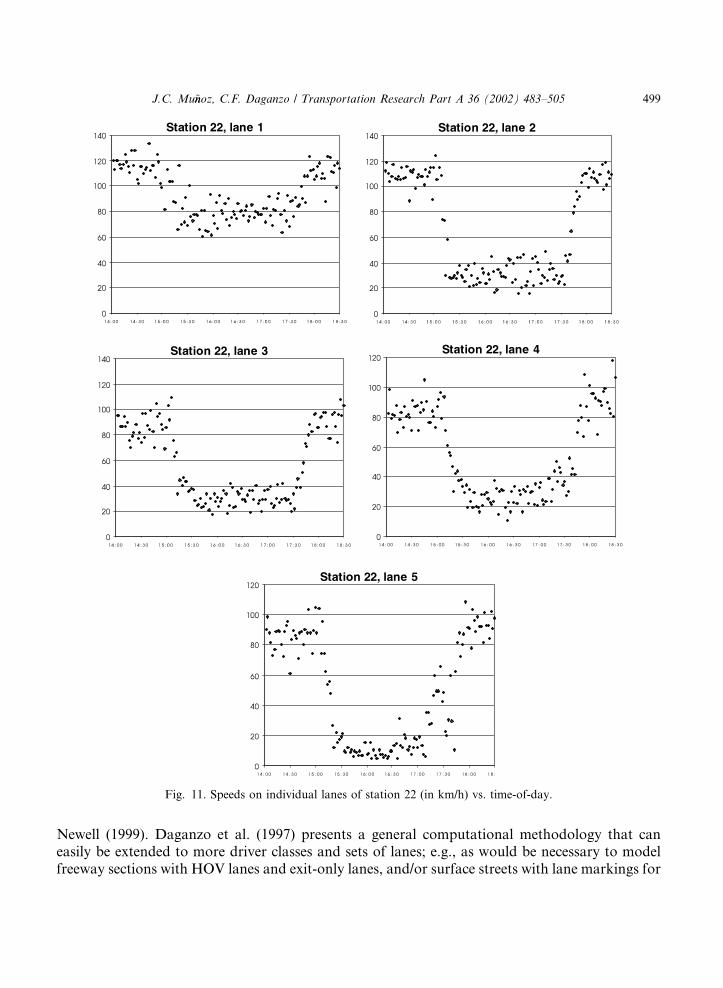
Fig. 11. Speeds on individual lanes of station 22 (in km/h) vs. time-of-day.
J.C. Mu~nnoz, C.F. Daganzo / Transportation Research Part A 36 (2002) 483–505 499
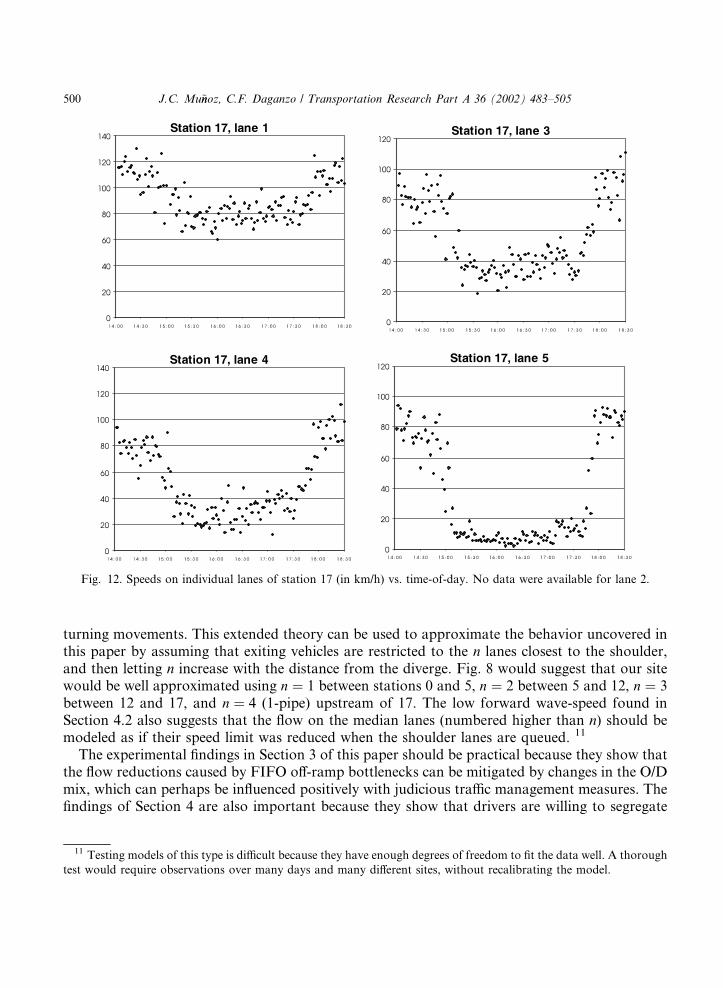
turning movements. This extended theory can be used to approximate the behavior uncovered inthis paper by assuming that exiting vehicles are restricted to the n lanes closest to the shoulder,and then letting n increase with the distance from the diverge. Fig. 8 would suggest that our sitewould be well approximated using n ¼ 1 between stations 0 and 5, n ¼ 2 between 5 and 12, n ¼ 3between 12 and 17, and n ¼ 4 (1-pipe) upstream of 17. The low forward wave-speed found inSection 4.2 also suggests that the flow on the median lanes (numbered higher than n) should bemodeled as if their speed limit was reduced when the shoulder lanes are queued. 11
The experimental findings in Section 3 of this paper should be practical because they show thatthe flow reductions caused by FIFO off-ramp bottlenecks can be mitigated by changes in the O/Dmix, which can perhaps be influenced positively with judicious traffic management measures. Thefindings of Section 4 are also important because they show that drivers are willing to segregate
Fig. 12. Speeds on individual lanes of station 17 (in km/h) vs. time-of-day. No data were available for lane 2.
11 Testing models of this type is difficult because they have enough degrees of freedom to fit the data well. A thorough
test would require observations over many days and many different sites, without recalibrating the model.
500 J.C. Mu~nnoz, C.F. Daganzo / Transportation Research Part A 36 (2002) 483–505
themselves according to destination for long distances. This offers hope that ‘‘smart’’ controlstrategies that promote segregation can be used to reduce the negative effects of FIFO. Aforthcoming paper will introduce and evaluate some new strategies.
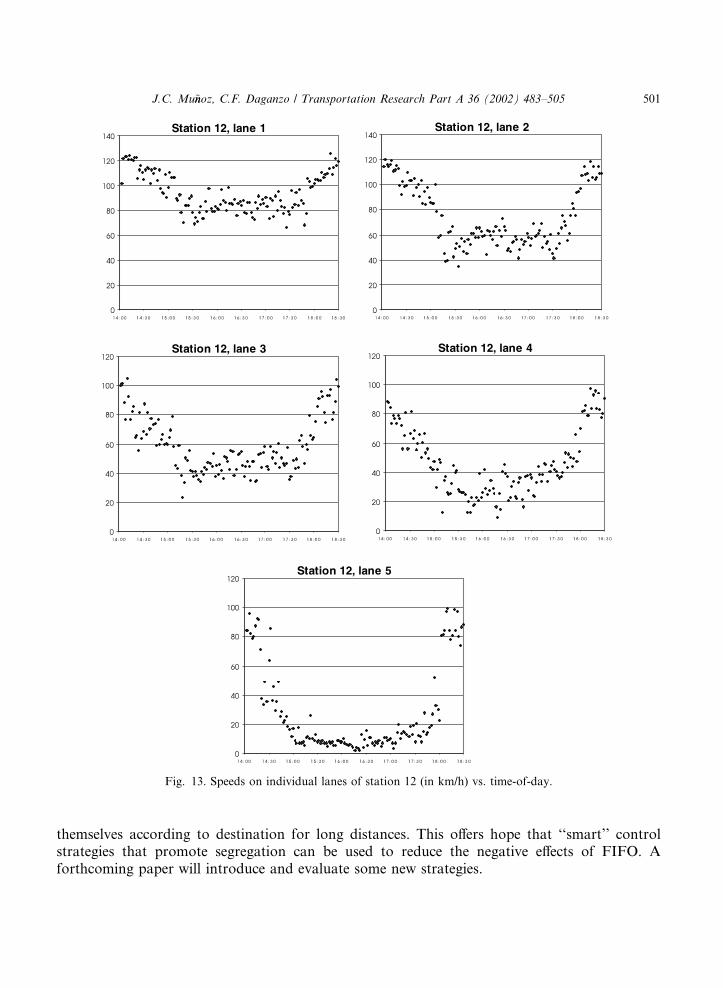
Fig. 13. Speeds on individual lanes of station 12 (in km/h) vs. time-of-day.
J.C. Mu~nnoz, C.F. Daganzo / Transportation Research Part A 36 (2002) 483–505 501
Acknowledgements
This research was supported by Caltrans under PATH MOU-3004.
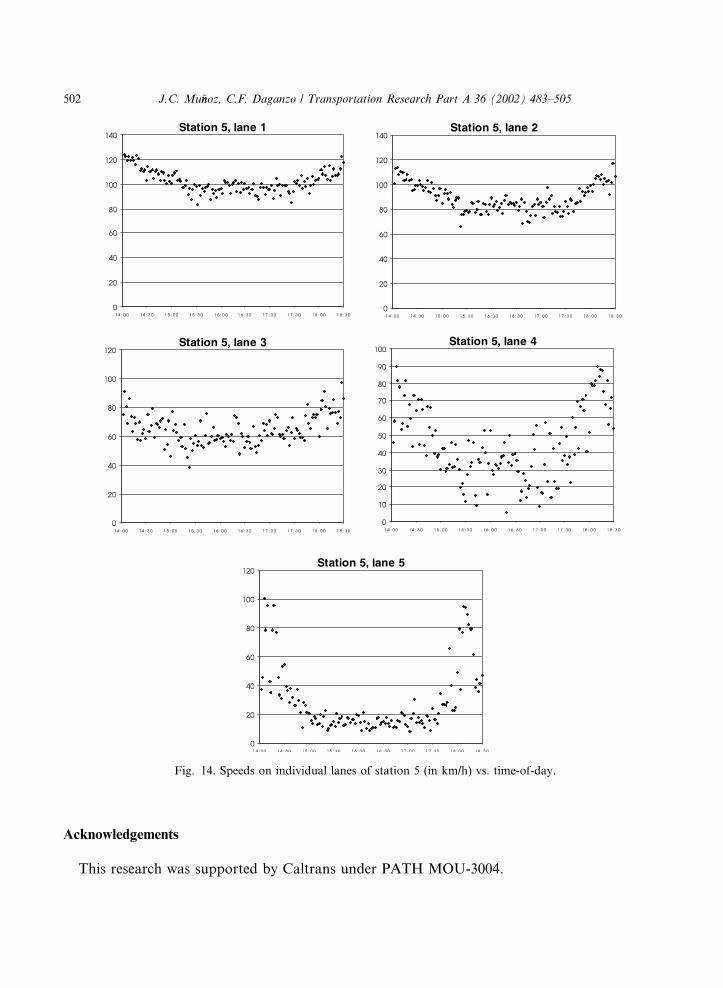
Fig. 14. Speeds on individual lanes of station 5 (in km/h) vs. time-of-day.
502 J.C. Mu~nnoz, C.F. Daganzo / Transportation Research Part A 36 (2002) 483–505
Appendix A. Speed data
This appendix contains Figs. 10–15 with the time series of average speed at all the detectorlocations, similar to Figs. 2(a) and 7(c) of the text.
Appendix B. Oblique plots
An oblique plot is a visualization tool for sets of N-curves of cumulative traffic flow vs. timefNiðtÞg, where each curve is defined at a different location, i. Oblique plots are related to the re-scaled curves of cumulative flow introduced in Cassidy and Windover (1995). They proposedsubtracting a ‘‘background flow’’, qb, from all the data and then plotting N-curves for themodified data; i.e., plotting the functions: NiðtÞ � ðt � t0Þqb. The range of the count variable forthe modified N-curves could be reduced in this way by orders of magnitude with judicious choiceof qb, and this allows a smaller scale to be used. This trick restores desired detail to the N-plots without changing the vertical separation between curves, which continues to representaccumulation. However, as mentioned in Cassidy and Windover (1995), horizontal distance be-tween curves no longer represents travel time so that some information may be lost with the
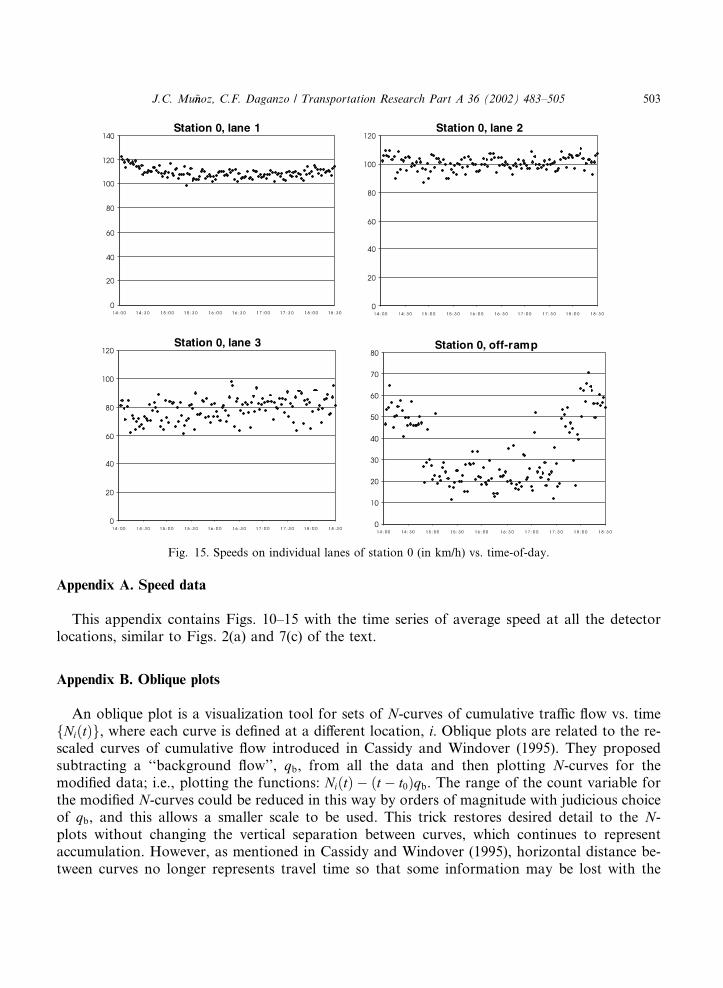
Fig. 15. Speeds on individual lanes of station 0 (in km/h) vs. time-of-day.
J.C. Mu~nnoz, C.F. Daganzo / Transportation Research Part A 36 (2002) 483–505 503
transformation. It is shown below that overlaying a set of slanted lines on the Cassidy–Windoverplots restores this information.
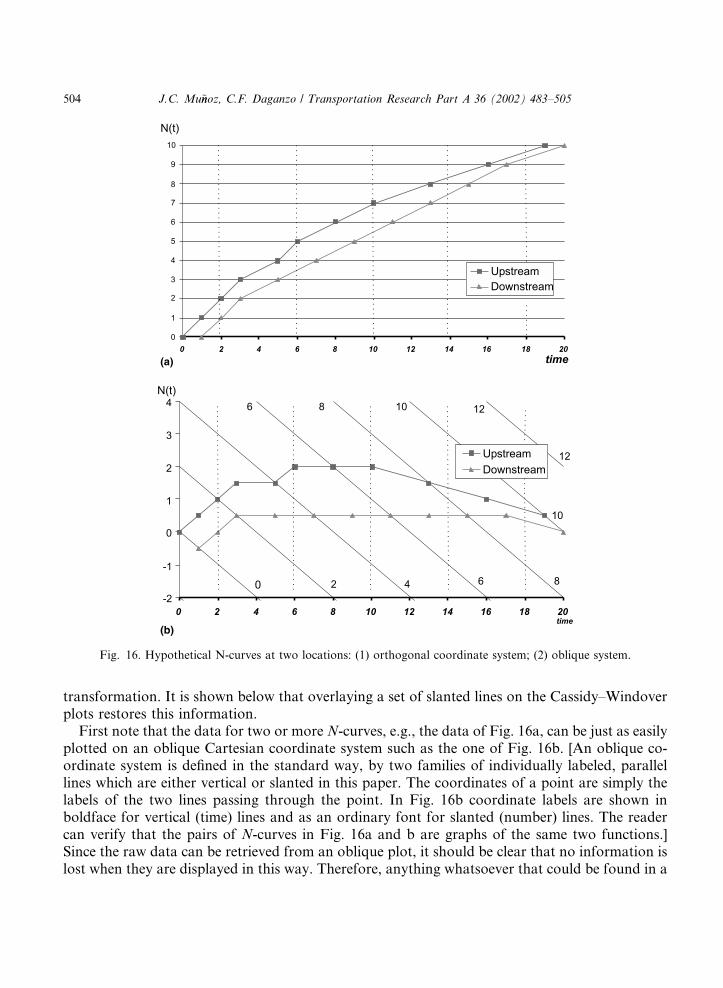
First note that the data for two or more N-curves, e.g., the data of Fig. 16a, can be just as easilyplotted on an oblique Cartesian coordinate system such as the one of Fig. 16b. [An oblique co-ordinate system is defined in the standard way, by two families of individually labeled, parallellines which are either vertical or slanted in this paper. The coordinates of a point are simply thelabels of the two lines passing through the point. In Fig. 16b coordinate labels are shown inboldface for vertical (time) lines and as an ordinary font for slanted (number) lines. The readercan verify that the pairs of N-curves in Fig. 16a and b are graphs of the same two functions.]Since the raw data can be retrieved from an oblique plot, it should be clear that no information islost when they are displayed in this way. Therefore, anything whatsoever that could be found in a
Fig. 16. Hypothetical N-curves at two locations: (1) orthogonal coordinate system; (2) oblique system.
504 J.C. Mu~nnoz, C.F. Daganzo / Transportation Research Part A 36 (2002) 483–505
standard plot can also be found in an oblique plot. With oblique plots, some things can be vi-sualized as before but others change. For example, vehicle accumulations are still proportional tothe vertical separation between curves and should be obtained by noting the change in slantedcoordinates across the separation. Because the vertical separation between curves is the same aswith rectangular N-plots, accumulations can also be obtained by projecting the separation inquestion perpendicularly onto the vertical axis. The slope of the N-curves as seen by the eye on anoblique plot is the excess flow relative to the background flow. Thus, a flow equal to qb would beseen as a horizontal line on the diagram. Positive slopes signify higher flows and negative slopeslesser ones. Vehicle trip times can also be obtained by noting the times when a (number) coor-dinate line intersects the various N-curves. They are proportional to the separation between the N-curves along the slanted lines. The total time spent by all the vehicles between two detector stationscontinues to be given by the area between curves, measured as with rectangular plots.
The advantage of oblique plots is that they magnify angles in the N-curves and in this way allowan analyst to see subtle things, such as changing trip times and platoon formation in unqueuedtraffic, without losing any information. The desired level of magnification can be obtained bychoosing the angle of the slanted number lines and the scale of the plot appropriately.
The reader can verify that if one redraws the curves of Fig. 16a, subtracting from the flow dataa background flow equal to the negative slope of the slanted lines of Fig. 16b (i.e., one plots theCassidy–Windover curves), then the resulting curves are identical to those of Fig. 16b. Consid-eration shows that this is always true. Therefore, if one overlays a family of slanted lines withslope equal to the negative background flow on a Cassidy–Windover plot, and then labels theslanted lines (e.g., along the edges of the plot as suggested above), one has converted the pictureinto a full-information oblique plot.
References
Cassidy, M., Windover, J., 1995. Methodology for assessing dynamics of freeway traffic flow. Trans. Res. Rec. 1484,
73–79.
Daganzo, C.F., 1995. The cell transmission model. Part II: Network traffic. Trans. Res. 29B (2), 79–93.
Daganzo, C.F., 1997a. A continuum theory of traffic dynamics for freeways with special lanes. Trans. Res. 31B (2), 83–102.
Daganzo, C.F., 1997b. Fundamentals of Transportation and Traffic Operations. Pergamon-Elsevier, Oxford, UK.
Daganzo, C.F., 1999. Remarks on traffic flow modeling and its applications. In: Brilon, W., Huber, F., Schreckenberg,
M., Wallentowitz, H. (Eds.), Traffic and Mobility. Proc. Traffic and Mobility—Simulation, Economics and
Environment Conference, Aachen, Germany. Springer, pp. 105–115.
Daganzo, C.F., Cassidy, M.J., Bertini, R., 1999. Possible explanations of phase transitions in highway traffic. Trans.
Res. 33A, 365–379.
Daganzo, C.F., Lin, W.H., Del Castillo, J.M., 1997. A simple physical principle for the simulation of freeways with
special lanes and priority vehicles. Trans. Res. 31B (2), 105–125.
Lawson, T., Lin, W.H., Cassidy, M., 1999. Validation of the incremental transfer model, PATH Working Paper UCB-
ITS-PWP-99-16. Institute of Transportation Studies, University of California, Berkeley, CA.
Mu~nnoz, J.C., Daganzo, C.F., 2000. Experimental characterization of multi-lane freeway traffic upstream of an off-ramp
bottleneck, PATH Working Paper 2000-13. Institute of Transportation Studies, University of California, CA.
Newell, G.F., 1982. Applications of Queueing Theory, second ed. Chapman and Hall, London.
Newell, G.F., 1999. Delays caused by a queue at an exit ramp. Trans. Res. 33B (5), 337–350.
Skabardonis, A., Noeimi, H., Petty, K., Rydzewski, D., Varaiya, P., 1994. Freeway service patrol evaluation, Research
Report UCB-ITS-PRR-94. Institute of Transportation Studies, University of California, Berkeley, CA.
J.C. Mu~nnoz, C.F. Daganzo / Transportation Research Part A 36 (2002) 483–505 505
Related Documents


