Technologies that Change the World Annual Report 2016 Year Ended March 31, 2016

Welcome message from author
This document is posted to help you gain knowledge. Please leave a comment to let me know what you think about it! Share it to your friends and learn new things together.
Transcript
Technologies that Change
the World
Annual Report 2016Year Ended March 31, 2016

The Birth of Transistors and Integrated Circuits (ICs)
From the Era of LSIs to VLSIs
Computers and calculators emerged in the early development stage of the semiconductor industry
Evolution of semiconductors led to rapid miniaturization and higher performance of electronic devices
1970 to 1989Founding to 1969
Our History
Line width: 10,000 to 700nm
Founded as a high purity chemicals business
Leading position estab-lished in photoresists based on “Japan’s first” and “World’s first” products
Semiconductor Process Rules:Helping to Make Line Width 1/1,000 of its Former Size
“We shall conduct manufacturing to create products that others
cannot imitate, to be original, to focus on high purity products, and
to support manufacturing with advanced technological
capabilities.”—Management Principle at the time of founding
TOK has made a tremendous contribution to the miniaturization of semiconductors by driving the evolution of photoresists. TOK is also honing its strengths in new fields, including high-density integration and 3D packaging of semiconductors.
TOK’s track record of involvement in semiconductor miniaturization(1970–2015):
Line width → 1/1,000Processing speed → 1,000 timesPower consumption → 1/1,0002
* A rough estimate for two-dimensional semiconductors based on scaling laws
Origin
Shigemasa MukaiTOK founder
Over the 75 years since its founding, TOK has developed many of its core competencies based on the foundation of its unique high purity processing and microprocessing technologies.
1936 · Founded. Started domestic production of potassium hydroxide (high purity caustic potash)
1943 · Obtained first patent, for chlorinated naphthalene
1956 · Became a world-leading manufacturer of
high purity cinnamate
1962 · First manufacture of TPR photoresist for printed circuit boards. Established a founda-tion for photoresist technology
1964 · Began manufacturing and exporting the world’s highest purity potassium hydroxide
1968 · First manufacture of OMR-81, a negative photoresist for semiconductors, marking the start of full-scale development of the photo-resist business
1971 · First Japanese production of plasma ashing
and stripping machine. Started a semiconduc-tor manufacturing equip-ment business
· First manufacture of OMR-83, an eco-friendly synthetic rubber photo-resist. OMR-83 became a mainstream photoresist for IC manufacturing
1972 · Developed Japan’s first positive photoresist for semiconductors
1977 · First manufacture of world’s first fully automatic sheet plasma etching machine
1978 · Developed an electron beam photoresist for LSIs · Developed a deep UV photoresist
1981 · Developed photoresist coater
1985 · First manufacture of a high resolution positive photoresist for VLSI production, enabling resolutions of 1,000nm or below
1987 · Developed vacuum UV hardening machine · Established OHKA AMERICA, INC.
1989 · Established TOK INTERNATIONAL INC. in the United States
· Developed a large circuit board coater line
2 TOKYO OHKA KOGYO CO., LTD.

Line width: 700 to 200nm Line width: 200 to 10nm node Line width: 10nm node to the single- digit nm node
The de facto standard for photoresists created through an upgraded production and development system
Strengthening our strategy of building close relationships with customers, while focusing on non-miniaturization fields
Multi-tracking strengths targeting all manner of performance-enhancing processes 2016 · Currently developing next-generation
technologies in an expansive range of fields encompassing high-density integration, 3D packaging, and areas peripheral to semicon-ductors, in addition to microprocessing
1991 · Developed LCD color filter manufacturing pigment dispersion-type negative photoresist
1992 · TOK INTERNATIONAL, INC. merged with OHKA AMERICA INC. and changed its name to OHKA AMERICA, INC.
1995 · Developed a high-resolution positive photo-resist for KrF excimer lasers
· Developed an LCD color filter manufacturing pigment dispersion-type negative photoresist for black matrix
1997 · First manufacture of
positive, chemically- amplified photoresists for use in KrF lithog-raphy. This photo-resist attained a line width of 250 nm, becoming the global de facto standard
1998 · Established TOK TAIWAN CO., LTD.
The Era of ULSIsThe Era of Memory and Logic Semiconductors
Towards the Internet of Things (IoT) era
Emergence of mobile phones and hybrid vehicles, along with production of large-size, high-resolution LCDs
Smaller and more sophisti-cated PCs, with continuing evolution in smartphones and tablet devices
Increasing demands for high-performance servers and various sensors with an eye on market expansion of autonomous vehicles and AI
From 2016 onward
2000 to 20151990 to 1999
Oregon Plant of OHKA AMERICA, INC. (1993)
Black matrix
The Koriyama Plant became a production base for positive, chemically-amplified photoresists for KrF lithography (opened in 1994)
Semiconductor Process Rules:Helping to Make Line Width 1/1,000 of its Former Size
Long-term Growth Strategy >> pages 20–51
2001 · Developed a positive type photoresist for OEL
2002 · Developed a negative photoresist for electron beams
· Established the Singapore Office · Established the Shanghai Representative Office
2003 · Developed high-density integration materi-
als (permanent photoresists for MEMS)
2004 · Established TOK KOREA CO., LTD. · Established CHANG CHUN TOK (CHANGSHU) CO., LTD.
2005 · Established TOKYO OHKA KOGYO EUROPE B.V.
2008 · Developed a through-silicon-via (TSV)
system for 3D packaging
2009 · Developed a diffusing agent for manufacturing solar cells
2012 · Established TOK Advanced Materials Co., Ltd. (Korea). Began development, manufac-turing, and sales of various photoresists from 2013
2014 · Established the Tongluo Plant of TOK TAIWAN CO., LTD.
2015 · Started producing KrF
excimer laser photo-resists for the 3D-NAND market
Fulfilling our “overarching aspiration”
for the fiscal year ending March 31, 2021, our 80th founding anniversary
Annual Report 2016 1Annual Report 2016 1Annual Report 2016
Customer-
Performance Enhancement of Semiconductor Devices
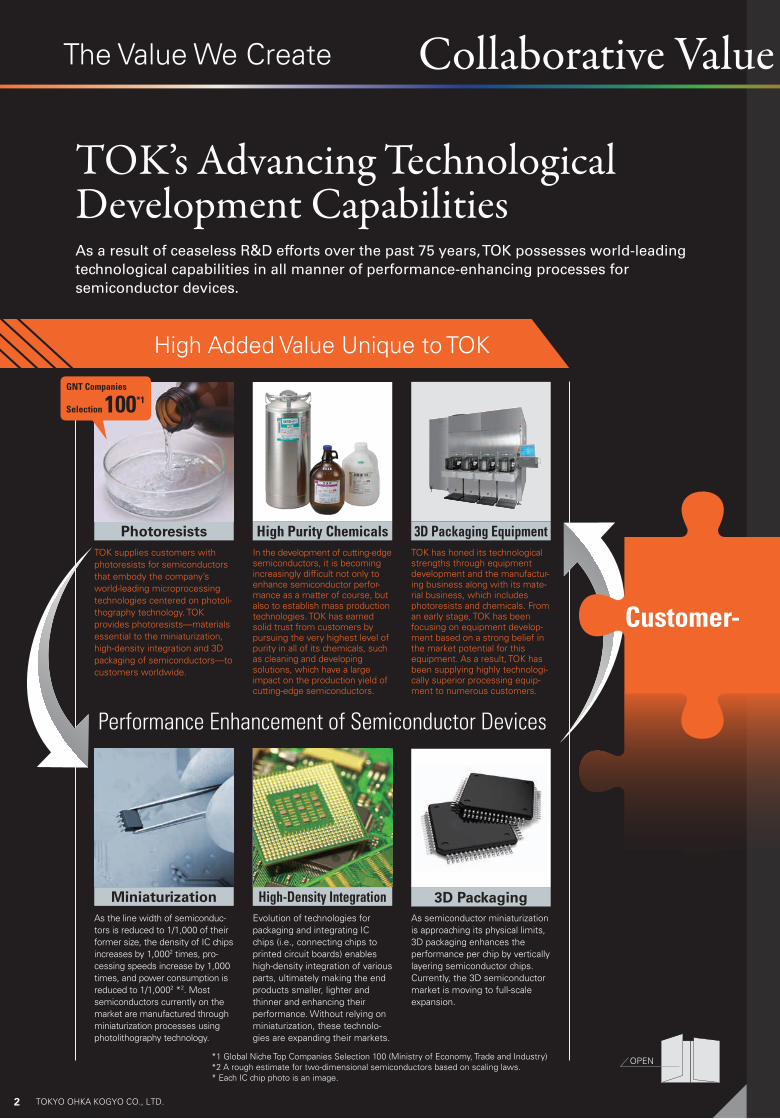
TOK supplies customers with photoresists for semiconductors that embody the company’s world-leading microprocessing technologies centered on photoli-thography technology. TOK provides photoresists—materials essential to the miniaturization, high-density integration and 3D packaging of semiconductors—to customers worldwide.
As the line width of semiconduc-tors is reduced to 1/1,000 of their former size, the density of IC chips increases by 1,0002 times, pro-cessing speeds increase by 1,000 times, and power consumption is reduced to 1/1,0002 *2. Most semiconductors currently on the market are manufactured through miniaturization processes using photolithography technology.
*1 Global Niche Top Companies Selection 100 (Ministry of Economy, Trade and Industry)*2 A rough estimate for two-dimensional semiconductors based on scaling laws.* Each IC chip photo is an image.
Photoresists
Miniaturization
In the development of cutting-edge semiconductors, it is becoming increasingly difficult not only to enhance semiconductor perfor-mance as a matter of course, but also to establish mass production technologies. TOK has earned solid trust from customers by pursuing the very highest level of purity in all of its chemicals, such as cleaning and developing solutions, which have a large impact on the production yield of cutting-edge semiconductors.
Evolution of technologies for packaging and integrating IC chips (i.e., connecting chips to printed circuit boards) enables high-density integration of various parts, ultimately making the end products smaller, lighter and thinner and enhancing their performance. Without relying on miniaturization, these technolo-gies are expanding their markets.
High Purity Chemicals
High-Density Integration
GNT Companies
Selection 100*1
3D Packaging Equipment
3D Packaging
TOK has honed its technological strengths through equipment development and the manufactur-ing business along with its mate-rial business, which includes photoresists and chemicals. From an early stage, TOK has been focusing on equipment develop-ment based on a strong belief in the market potential for this equipment. As a result, TOK has been supplying highly technologi-cally superior processing equip-ment to numerous customers.
As semiconductor miniaturization is approaching its physical limits, 3D packaging enhances the performance per chip by vertically layering semiconductor chips. Currently, the 3D semiconductor market is moving to full-scale expansion.
High Added Value Unique to TOK
Collaborative Value Creation by TOK and Its Customers
TOK’s Advancing Technological Development Capabilities
OPEN
As a result of ceaseless R&D efforts over the past 75 years, TOK possesses world-leading technological capabilities in all manner of performance-enhancing processes for semiconductor devices.
The Value We Create
2 TOKYO OHKA KOGYO CO., LTD.
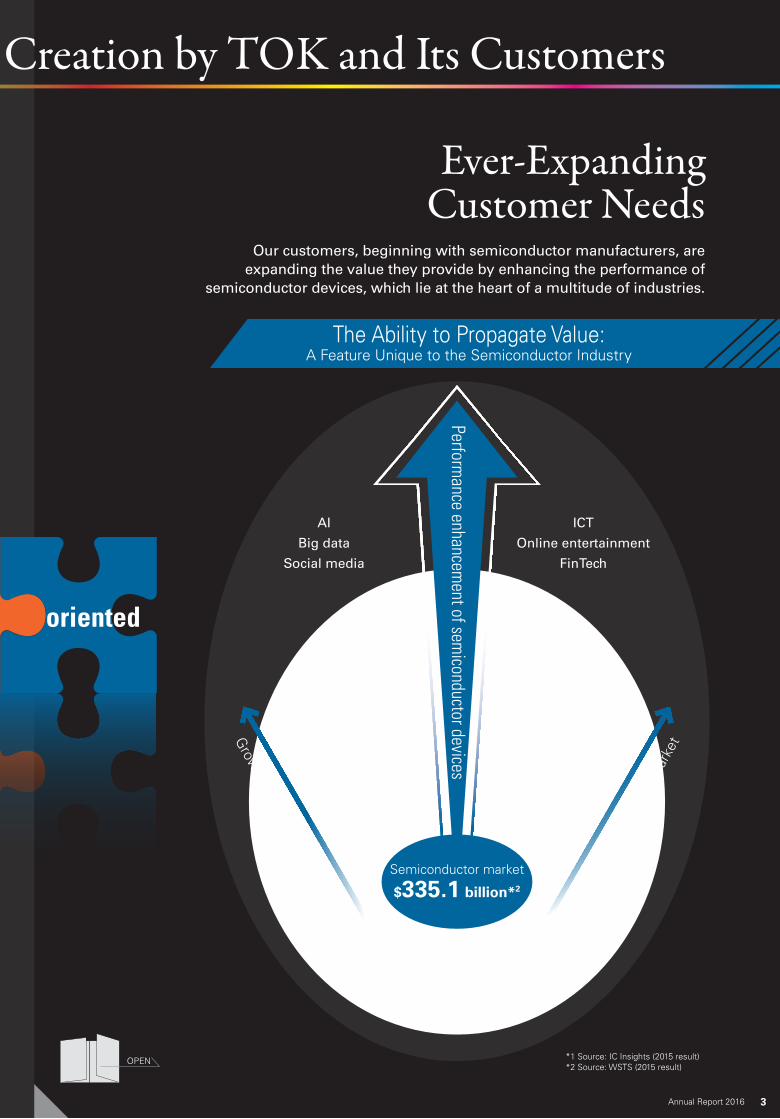
*1 Source: IC Insights (2015 result)*2 Source: WSTS (2015 result)
Performance enhancem
ent of semiconductor devices
AI
Big data
Social media
Energy
Automobiles
Robots
HealthcareGrow
th of the electronics market G
row
th o
f the
ele
ctro
nics
mar
ket
Infrastructure
Aerospace
Industrial equipment
Semiconductor market
$335.1 billion*2
Electronics market
$1,423.0 billion*1
Customer- oriented
ICT
Online entertainment
FinTech
The Ability to Propagate Value: A Feature Unique to the Semiconductor Industry
Ever-Expanding Customer Needs
Collaborative Value Creation by TOK and Its Customers
OPEN
Our customers, beginning with semiconductor manufacturers, are expanding the value they provide by enhancing the performance of
semiconductor devices, which lie at the heart of a multitude of industries.
3Annual Report 2016

Demand for automotive discrete (analog) semiconductors is growing, supported by growth in the market for advanced driver assistance systems (ADAS) such as automated braking sys-tems, and the accelerated development of autonomous driving systems. TOK holds the leading global market shares of g-Line and i-Line photoresists, which are essential to the manufacture of these semiconductors.
Safer and More Reliable Transportation
The smartphone market offers tremendous scale and growth potential, despite experiencing a slower growth rate recently. Accordingly, smartphones will continue to have an impact on people’s lives as a transformative force that makes society and daily life more convenient and comfortable and as a platform that connects people around the world. TOK is supplying many different products that help to enhance the performance of smartphones.
Connecting People Around the World
Creating Value for Society
Market potential of semiconductors for mobile phones*● $94.3 billion (2019)● CAGR: 6.7% (2015–2019)* Source: IC Insights
TOK’s products● ArF excimer laser photoresists● KrF excimer laser photoresists● Photoresists for semiconductor package manufacturing● Photoresists for use in image sensors and MEMS● High purity chemicals● 3D packaging equipment
➝ See pages 14–15 for the functions and classifications of photoresists
➝ See pages 14–15 for the functions and classifications of photoresists
Market potential of automotive semiconductors*● $29.2 billion (2019)● CAGR: 6.7% (2014–2019)
* Source: IC Insights
TOK’s products● g-Line and i-Line photoresists● High purity chemicals
4 TOKYO OHKA KOGYO CO., LTD.

Sales/Marketing
Human Resource Development
Safer and More Reliable Transportation
Connecting People Around the World
Changing the World by Maximizing the Value We Deliver
Customer-
5

Environmental Management
New Business Development
R&D
Changing the World by Maximizing the Value We Deliver
Customer- oriented
6

With the arrival of the age of the Internet of Things (IoT), it is estimated that more than 1 trillion sensors will be required every year by 2023, over 100 times more than at present. Growth is projected particularly in the market for high-value-added MEMS sensors that employ semiconductor microprocessing technologies. TOK provides high-value-added pho-toresists essential to the manufacture of MEMS sensors.
IoT (Internet of Things)
As a major performance factor, power savings have become a focal point for cutting-edge semiconductors to help reduce CO2 emissions and realize an environmentally friendly society. In addition, power semiconductors for eco-friendly vehicles, transportation infrastructure, electric power systems and other applications continue to evolve. TOK is focusing on ensuring a steady supply of materials essential to the manufacturing of these semiconductors.
Leaving a Pristine Global Environment for Future Generations
Creating Value for Society
Market potential of power semiconductors*● $13.5 billion (2018)● CAGR: 3.2% (2015–2018)* Source: IC Insights
TOK’s products● ArF excimer laser photoresists● KrF excimer laser photoresists● g-Line and i-Line photoresists● High purity chemicals
Market potential of MEMS sensors*● $6.1 billion (2020)● CAGR: 5.5% (2015–2020)* Source: IC Insights
TOK’s products● Photoresists for image sensors● MEMS photoresists
➝ See pages 14–15 for the functions and classifications of photoresists
➝ See pages 14–15 for the functions and classifications of photoresists
7Annual Report 2016

Management PrinciplesContinue efforts to enhance our technology; Raise the quality levels of our products; Contribute to society; and, Create a frank and open-minded business culture.
Management VisionAim to be a globally trusted corporate group by inspiring customers with high value-added products that have satisfying features, low cost and superior quality.
The Source of the Value We Create—Microprocessing Technologies That Create Inspiration
TOK delivers value in a wide variety of fields, including the manufacture of semiconductors, by rolling out microprocessing and applied technologies for the nanoscale* domain, along with implementing our strategy of building close relationships with customers and developing high value-added technologies from new standpoints.* Nanometer (1nm) = one millionth of a millimeter; one hundred-thousandth the width of a human hair
8 TOKYO OHKA KOGYO CO., LTD.

Forward-looking statementsThis annual report contains forward-looking statements that describe future prospects of TOKYO OHKA KOGYO CO., LTD. (the Company) in terms of business planning, earnings and management strategies. Such statements are based on management’s judgment, derived from information available to it at the time such information was prepared. Readers are cautioned not to rely solely on these forward-looking statements, as actual results and strategies may differ substantially according to changes in the Company’s business environment.
10 10-Year Financial and Non-Financial Highlights
12 Trend in Major Indicators
14 Readers’ Guide—Semiconductor Photoresists
16 At a Glance Business Portfolio/ Product Portfolio & “TOK Medium-Term Plan 2015” Highlights
18 Management Resources
The Value TOK Creates
Corporate Governance
52 Interview with an Outside Director
54 Strengthen Corporate Governance
64 Relationship with Society
66 Board of Directors/Corporate Auditors and Officers
Financial Information/Corporate Information
68 Historical 10-Year Performance and Analysis
70 FY2016 Results of Operations, Financial Position and FY2017 Performance Outlook
74 Consolidated Financial Statements
79 Corporate Information / Stock Information
80 Global Network
Growth Strategy
20 Achieving “Overarching Aspiration,” the TOK Management Vision for the Fiscal Year Ending March 31, 2021
22 A Message from the President
28 A Message from the CFO
30 Dialogue between the President and an Analyst
32 Review of Operations
40 Special Feature— Value Creation Process in New Medium-Term Plan
CONTENTS
9Annual Report 2016
Highlights
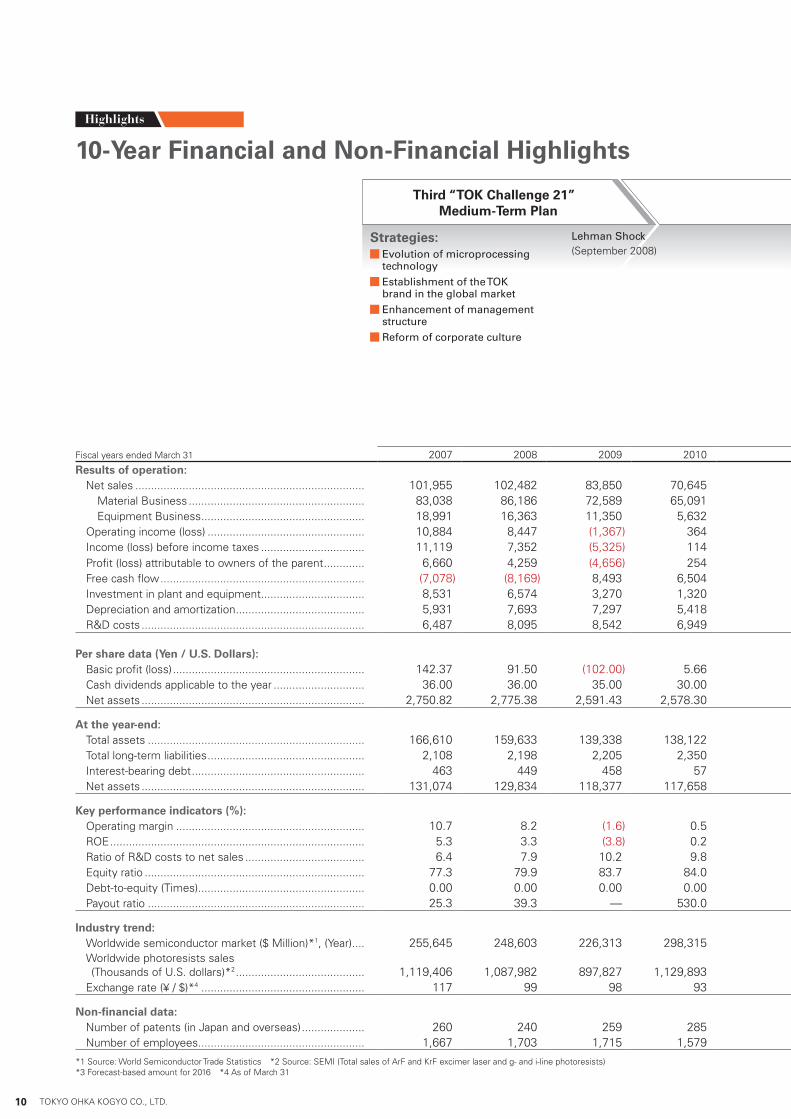
10-Year Financial and Non-Financial Highlights
Strategies: Evolution of microprocessing technology Establishment of the TOK brand in the global market Enhancement of management structure Reform of corporate culture
Lehman Shock(September 2008)
Urgent business profitability and structural reforms
Third “TOK Challenge 21” Medium-Term Plan
Millions of yenThousands of
U.S. dollars
Fiscal years ended March 31 2007 2008 2009 2010 2011 2012 2013 2014 2015 2016 2016Results of operation:
Net sales ......................................................................... 101,955 102,482 83,850 70,645 80,016 80,037 72,919 75,269 88,086 89,969 803,296 Material Business ........................................................ 83,038 86,186 72,589 65,091 71,482 66,645 67,697 72,866 84,611 87,280 779,287 Equipment Business .................................................... 18,991 16,363 11,350 5,632 8,622 13,500 5,302 2,484 3,581 2,748 24,542Operating income (loss) .................................................. 10,884 8,447 (1,367) 364 6,123 6,102 7,872 10,025 13,253 12,438 111,054Income (loss) before income taxes ................................. 11,119 7,352 (5,325) 114 6,427 6,577 8,031 11,666 14,301 11,777 105,159Profit (loss) attributable to owners of the parent ............. 6,660 4,259 (4,656) 254 3,649 3,818 5,443 7,549 8,818 7,716 68,899Free cash flow ................................................................. (7,078) (8,169) 8,493 6,504 12,435 (6,641) 12,363 (2,610) 3,380 7,517 67,116Investment in plant and equipment ................................. 8,531 6,574 3,270 1,320 1,699 3,162 5,332 14,577 7,276 5,919 52,848Depreciation and amortization ......................................... 5,931 7,693 7,297 5,418 4,393 4,038 3,758 2,672 4,276 5,631 50,277R&D costs ....................................................................... 6,487 8,095 8,542 6,949 6,360 6,157 6,211 6,389 6,903 7,015 62,637
Per share data (Yen / U.S. Dollars):Basic profit (loss) ............................................................. 142.37 91.50 (102.00) 5.66 81.08 84.86 121.69 168.54 196.61 177.30 1.58Cash dividends applicable to the year ............................. 36.00 36.00 35.00 30.00 33.00 38.00 44.00 52.00 60.00 64.00 0.57Net assets ....................................................................... 2,750.82 2,775.38 2,591.43 2,578.30 2,597.72 2,641.28 2,796.37 3,044.24 3,285.81 3,298.00 29,446.42
At the year-end:Total assets ..................................................................... 166,610 159,633 139,338 138,122 147,085 138,767 145,664 155,859 174,863 167,300 1,493,751Total long-term liabilities .................................................. 2,108 2,198 2,205 2,350 2,105 2,613 2,811 1,518 3,569 2,899 25,884Interest-bearing debt ....................................................... 463 449 458 57 0 610 488 366 814 534 4,767Net assets ....................................................................... 131,074 129,834 118,377 117,658 118,567 119,590 127,838 139,962 151,999 147,270 1,314,916
Key performance indicators (%):Operating margin ............................................................ 10.7 8.2 (1.6) 0.5 7.7 7.6 10.8 13.3 15.0 13.8ROE ................................................................................. 5.3 3.3 (3.8) 0.2 3.1 3.3 4.5 5.8 6.2 5.3Ratio of R&D costs to net sales ...................................... 6.4 7.9 10.2 9.8 7.9 7.7 8.5 8.5 7.8 7.8Equity ratio ...................................................................... 77.3 79.9 83.7 84.0 79.5 85.1 85.9 87.5 84.3 85.1Debt-to-equity (Times)..................................................... 0.00 0.00 0.00 0.00 0.00 0.01 0.00 0.00 0.00 0.00Payout ratio ..................................................................... 25.3 39.3 — 530.0 40.7 44.8 36.2 30.9 30.5 36.1
Industry trend:Worldwide semiconductor market ($ Million)*1, (Year) .... 255,645 248,603 226,313 298,315 299,521 291,562 305,584 335,843 335,168 327,180*3
Worldwide photoresists sales (Thousands of U.S. dollars)*2 ......................................... 1,119,406 1,087,982 897,827 1,129,893 1,220,078 1,279,706 1,152,306 1,288,713 1,230,022
Exchange rate (¥ / $)*4 .................................................... 117 99 98 93 83 82 94 103 120 112
Non-financial data:Number of patents (in Japan and overseas) .................... 260 240 259 285 247 253 271 378 293 332Number of employees ..................................................... 1,667 1,703 1,715 1,579 1,443 1,443 1,487 1,505 1,540 1,564
*1 Source: World Semiconductor Trade Statistics *2 Source: SEMI (Total sales of ArF and KrF excimer laser and g- and i-line photoresists) *3 Forecast-based amount for 2016 *4 As of March 31
10 TOKYO OHKA KOGYO CO., LTD.
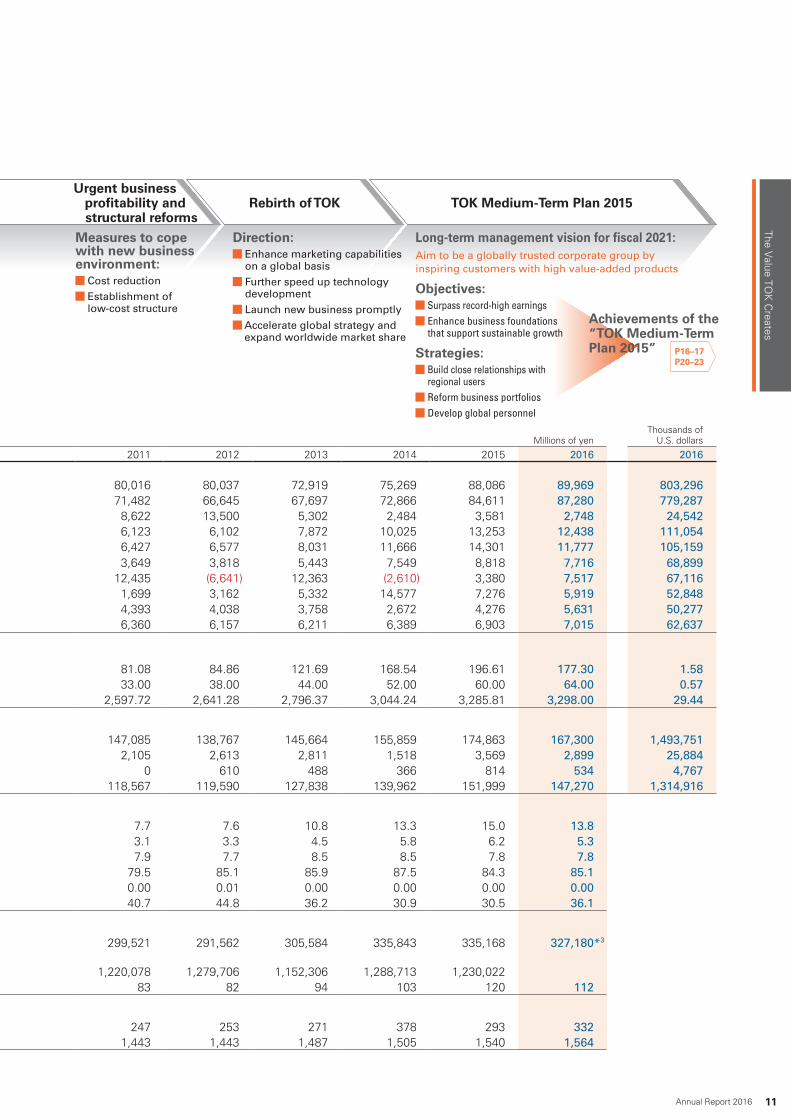
Long-term management vision for fiscal 2021:Aim to be a globally trusted corporate group by inspiring customers with high value-added products
Objectives: Surpass record-high earnings Enhance business foundations that support sustainable growth
Strategies: Build close relationships with regional users Reform business portfolios Develop global personnel
Measures to cope with new business environment:
Cost reduction Establishment of low-cost structure
Direction: Enhance marketing capabilities on a global basis Further speed up technology development Launch new business promptly Accelerate global strategy and expand worldwide market share
TOK Medium-Term Plan 2015Rebirth of TOKUrgent business
profitability and structural reforms
Millions of yenThousands of
U.S. dollars
Fiscal years ended March 31 2007 2008 2009 2010 2011 2012 2013 2014 2015 2016 2016Results of operation:
Net sales ......................................................................... 101,955 102,482 83,850 70,645 80,016 80,037 72,919 75,269 88,086 89,969 803,296Material Business ........................................................ 83,038 86,186 72,589 65,091 71,482 66,645 67,697 72,866 84,611 87,280 779,287Equipment Business .................................................... 18,991 16,363 11,350 5,632 8,622 13,500 5,302 2,484 3,581 2,748 24,542
Operating income (loss) .................................................. 10,884 8,447 (1,367) 364 6,123 6,102 7,872 10,025 13,253 12,438 111,054Income (loss) before income taxes ................................. 11,119 7,352 (5,325) 114 6,427 6,577 8,031 11,666 14,301 11,777 105,159Profit (loss) attributable to owners of the parent ............. 6,660 4,259 (4,656) 254 3,649 3,818 5,443 7,549 8,818 7,716 68,899Free cash flow ................................................................. (7,078) (8,169) 8,493 6,504 12,435 (6,641) 12,363 (2,610) 3,380 7,517 67,116Investment in plant and equipment ................................. 8,531 6,574 3,270 1,320 1,699 3,162 5,332 14,577 7,276 5,919 52,848Depreciation and amortization ......................................... 5,931 7,693 7,297 5,418 4,393 4,038 3,758 2,672 4,276 5,631 50,277R&D costs ....................................................................... 6,487 8,095 8,542 6,949 6,360 6,157 6,211 6,389 6,903 7,015 62,637
Per share data (Yen / U.S. Dollars):Basic profit (loss) ............................................................. 142.37 91.50 (102.00) 5.66 81.08 84.86 121.69 168.54 196.61 177.30 1.58Cash dividends applicable to the year ............................. 36.00 36.00 35.00 30.00 33.00 38.00 44.00 52.00 60.00 64.00 0.57Net assets ....................................................................... 2,750.82 2,775.38 2,591.43 2,578.30 2,597.72 2,641.28 2,796.37 3,044.24 3,285.81 3,298.00 29.44
At the year-end:Total assets ..................................................................... 166,610 159,633 139,338 138,122 147,085 138,767 145,664 155,859 174,863 167,300 1,493,751Total long-term liabilities .................................................. 2,108 2,198 2,205 2,350 2,105 2,613 2,811 1,518 3,569 2,899 25,884Interest-bearing debt ....................................................... 463 449 458 57 0 610 488 366 814 534 4,767Net assets ....................................................................... 131,074 129,834 118,377 117,658 118,567 119,590 127,838 139,962 151,999 147,270 1,314,916
Key performance indicators (%):Operating margin ............................................................ 10.7 8.2 (1.6) 0.5 7.7 7.6 10.8 13.3 15.0 13.8ROE ................................................................................. 5.3 3.3 (3.8) 0.2 3.1 3.3 4.5 5.8 6.2 5.3Ratio of R&D costs to net sales ...................................... 6.4 7.9 10.2 9.8 7.9 7.7 8.5 8.5 7.8 7.8Equity ratio ...................................................................... 77.3 79.9 83.7 84.0 79.5 85.1 85.9 87.5 84.3 85.1Debt-to-equity (Times)..................................................... 0.00 0.00 0.00 0.00 0.00 0.01 0.00 0.00 0.00 0.00Payout ratio ..................................................................... 25.3 39.3 — 530.0 40.7 44.8 36.2 30.9 30.5 36.1
Industry trend:Worldwide semiconductor market ($ Million)*1, (Year) .... 255,645 248,603 226,313 298,315 299,521 291,562 305,584 335,843 335,168 327,180*3
Worldwide photoresists sales (Thousands of U.S. dollars)*2 ......................................... 1,119,406 1,087,982 897,827 1,129,893 1,220,078 1,279,706 1,152,306 1,288,713 1,230,022
Exchange rate (¥ / $)*4 .................................................... 117 99 98 93 83 82 94 103 120 112
Non-financial data:Number of patents (in Japan and overseas) .................... 260 240 259 285 247 253 271 378 293 332Number of employees ..................................................... 1,667 1,703 1,715 1,579 1,443 1,443 1,487 1,505 1,540 1,564
*1 Source: World Semiconductor Trade Statistics *2 Source: SEMI (Total sales of ArF and KrF excimer laser and g- and i-line photoresists)*3 Forecast-based amount for 2016 *4 As of March 31
Achievements of the “TOK Medium-Term Plan 2015” P16–17
P20–23
11Annual Report 2016
The Value TO
K C
reates

Highlights
Trend in Major Indicators
Fiscal years ended March 31
Net sales Operating income (loss)
Profit (loss) attributable to owners of the parent Investment in plant and equipment
Depreciation and amortization R&D costs
Basic profit (loss) per share Dividends applicable to the year per share
2010 2011 2012 2013 2014 2015 2016200920082007
(Millions of yen)
101,955 102,482
83,85070,645
80,016 80,03772,919 75,269
88,086 89,969
TOK Medium-Term Plan 2015
(Millions of yen)
2010 2011 2012 2013 2014 2015 2016200920082007
5,6315,931
7,693 7,297
5,418
4,393 4,038 3,758
2,672
4,276
TOK Medium-Term Plan 2015
(Millions of yen)
2010 2011 2012 2013 2014 2015 2016200920082007
7,0156,487
8,095 8,542
6,9496,360 6,157 6,211 6,389
6,903
TOK Medium-Term Plan 2015
(Yen)
2010 2011 2012 2013 2014 2015 2016200920082007
64.00
36.00 36.00 35.0030.00 33.00
38.0044.00
52.00
60.00
TOK Medium-Term Plan 2015
(Millions of yen)
2010 2011 2012 2013 2014 2015 2016200920082007
7,7166,660
4,259
254
3,649 3,8185,443
7,5498,818
–4,656
TOK Medium-Term Plan 2015
2010 2011 2012 2013 2014 2015 2016200920082007
(Millions of yen)
5,919
8,531
6,574
3,270
1,320 1,6993,162
5,332
14,577
7,276
TOK Medium-Term Plan 2015
2010 2011 2012 2013 2014 2015 2016200920082007
(Yen)177.30
142.37
91.50
5.66
81.08 84.86121.69
168.54196.61
–102.00
TOK Medium-Term Plan 2015
2010 2011 2012 2013 2014 2015 2016200920082007
(Millions of yen)
12,43810,884
8,447
364
6,123 6,1027,872
10,025
13,253
–1,367
TOK Medium-Term Plan 2015
12 TOKYO OHKA KOGYO CO., LTD.

Total assets Net assets
Operating margin ROE
Ratio of R&D costs to net sales Debt-to-equity
Equity ratio Worldwide semiconductor market
2010 2011 2012 2013 2014 2015 2016200920082007
167,300166,610 159,633139,338 138,122 147,085 138,767 145,664
155,859174,863
TOK Medium-Term Plan 2015
(Millions of yen)
TOK Medium-Term Plan 2015
(Millions of yen)
2010 2011 2012 2013 2014 2015 2016200920082007
147,270131,074 129,834
118,377 117,658 118,567 119,590127,838
139,962151,999
(%)
2010 2011 2012 2013 2014 2015 2016200920082007
13.8
10.78.2
0.5
–1.6
7.7 7.6
10.813.3
15.0
TOK Medium-Term Plan 2015
(%)
2010 2011 2012 2013 2014 2015 2016200920082007
7.86.4
7.9
10.2 9.8
7.9 7.78.5 8.5
7.8
TOK Medium-Term Plan 2015
(%)
2010 2011 2012 2013 2014 2015 2016200920082007
85.177.3 79.9 83.7 84.0
79.585.1 85.9 87.5 84.3
TOK Medium-Term Plan 2015
(Times)
2010 2011 2012 2013 2014 2015 2016200920082007
0.00 0.00 0.00 0.00 0.00 0.00
0.01
0.00 0.00 0.00
TOK Medium-Term Plan 2015
2010 2011 2012 2013 2014 2015 2016200920082007
(%)
5.35.33.3
0.2
–3.8
3.1 3.34.5
5.8 6.2
TOK Medium-Term Plan 2015
2010 2011 2012 2013 2014 2015 2016(Forecast)
200920082007 (Year)
(Millions of dollars)327,180
255,645 248,603226,313
298,315 299,521 291,562 305,584335,843 335,168
13Annual Report 2016
The Value TO
K C
reates

Guidance
Semiconductor Photoresists This section explains various aspects of TOK’s flagship semiconductor photoresists, including their functions and performance, as well as applications and market trends.
The basic principle of photolithography, which is essential to forming semiconductor circuits, is the same as taking a picture of a subject with a camera.The silicon wafer is equivalent to the film and photographic paper, whereas photoresist is equivalent to the photosensitizing agent.
Most semiconductors currently available on the global market are manufactured through lithography using these photoresists.
The markets for g-Line and i-Line photoresists, KrF excimer laser photoresists, and ArF excimer laser photoresists* are all following a growth trajectory.Notably, high value-added ArF excimer photoresists* are experiencing double-digit annual growth rates, thereby driving the growth of the entire market.
■ Global Market Projections for Semiconductor Photoresists (Source: Overview of Photo-Functional Material and Product Market 2016/Fuji Keizai)
Continuing high growth centered on high value-added fields
Performance and end applications differ depending on the light source used.
Roles of photoresists in forming semiconductor circuits (pre-process of semiconductor manufacturing) Light
source
Performance & Applications
Functions
■ Main Classifications of Semiconductor Photoresistsg-Line and i-Line photoresists KrF excimer laser photoresists ArF excimer laser photoresists*2
Added value of photoresists High
Light source for lithography g-Line and i-Line KrF (krypton fluoride) excimer laser ArF (argon fluoride) excimer laser
Wavelength of light source436nm (g-Line) / 365nm (i-Line) 248nm 193nm
Long Short
Line width of semiconductors*1 ≧250nm 250nm>∼≧130nm 130nm>∼≧10nmWide Narrow
Main applications and end products, etc.
Automotive power semiconductorsSensors
LEDs, etc.
High-performance serversMass-market smartphones
Game consoles, etc.
Next-generation smartphonesWearable devices
Tablet devices, etc.
*1 Only the round figures of primary ranges are shown *2 ArF excimer laser photoresists and immersion ArF photoresists
Silicon wafer Exposure Circuit formation (development)
Supplying photoresists
Readers’ Guide
2014(Result)
2015(Result)
2016(Forecast)
2017(Forecast)
2018(Forecast)
2019(Forecast)
2020(Forecast)
1,500
1,000
500
0(Year)
ArF excimer laser photoresists*KrF excimer laser photoresistsg-Line and i-Line photoresists
2,000($ Million)
Market Trends
* ArF excimer laser photoresists and immersion ArF photoresists
14 TOKYO OHKA KOGYO CO., LTD.

This section explains various aspects of TOK’s flagship semiconductor photoresists, including their functions and performance, as well as applications and market trends.
TOK has been selected as a Global Niche Top company in the electricity and electronics category by the Ministry of Economy, Trade and Industry based on a strong evalua-tion of TOK’s semiconductor photo-resists in terms of their strategic importance, market share, interna-tional appeal, and other aspects.
There are growing needs for photoresists not only for semiconductor manufacturing processes, but also for processing after manufacturing (i.e., the post-process of semiconductor manufacturing) to achieve more compact, lighter and thinner, and higher performance semiconductors.
■ Comparison of light sources (i-Line vs. ArF excimer laser)
* Based on 2015 total sales volume of ArF, KrF excimer lasers and g-Line and i-Line photoresists (calculated based on data from Overview of Photo-Functional Material and Product Market 2016/Fuji Keizai)
Worldwide share*
Roles of photoresists in semiconductor packaging (post-process of semiconductor manufacturing)
Relationship between the wavelengths of lithography light sources and the semiconductor line width
Raw materials
World-leading micro-
processing technology
The ability to research, develop,
and manufacture the world’s
highest quality photoresists
PolymersPhotoacid generators
Solvents
The shorter the wavelength of the lithography light source (i.e., the narrower line width), the greater the possibilities for adding value to semiconductors by making them more compact, faster, and more power efficient.
Bump
Plating melts, adheres to board
Resist is stripped Photoresist patterningElectroplating
Plating
Wireless bonding for more compact, lighter and thinner, and higher performance semiconductor packages and end products
Wireless bonding
IC chips
Printed circuit board (PCB)
Electrodes
Wide line width
For i-LineLong wavelength
Photomask
Lens
Wafer
Light
365nm
Photoresist
193nmLight
Short wavelength
For immersion ArF excimer lasers
Pure water
Narrow line width
TOK24.6%
Company A18.3%
Company B13.8%
Company C12.6%
Company D9.9%
Company E6.6%
Others14.2%
15Annual Report 2016
The Value TO
K C
reates

Portfolio Highlight
Portfolio
Business Portfolio
Product Portfolio & “TOK Medium-Term Plan 2015” Highlights
Semiconductor Manufacturing Field
Main Target Markets, Applications, and End Products, etc.*
*TOK → Semiconductor manufacturers, etc. → Electronics manufacturers
i-Line Resists
ArF Excimer Laser Photoresists
EUV Resists
Electron Beam Photoresists
Interlayer Insulating Film
Diffusing Agents
Materials for Shrink Process
Directed Self-Assembly
Materials (DSA)
Automobiles Lower fuel consumption
Automobiles Driving assist
Lift-off Resists Resists for Micro Lens
Smartphones, tablet devices, PCs, wearable devices Higher performance/more compact/energy saving
Cloud servers Higher performance/more compact/energy saving
Game machines, etc. Higher performance/more compact
Net Sales of ArF Excimer Laser Photoresists:
3 years growth 50%Net Sales of KrF Excimer Laser Photoresists:
3 years growth 30%
Electronic functional materials
We are leveraging our Material Business which develops high value-added products as an earnings driver and realizing synergy with our Equipment Business, getting one step ahead of market needs.
In TOK Medium-Term Plan 2015, we developed the following product portfolio centered on the Material Business, and made significant progress in four fields.
PhotoresistsWidely used materials indispensable for the microprocessing of devices including semiconductors, panels, and other electronic products
High-density integration materialsPackaging photoresists and photosensitive insulation film compatible with multi-layer stacking accompanying advances made in semiconduc-tor microprocessing
High purity chemicalsDeveloping solutions, stripping solutions, rinsing solutions, thinners and other chemicals leveraging our advanced expertise in ultra-high purity processing and microprocessing
Inorganic and organic chemicalsChemicals used in a wide range of industries
Business segment Main products Net sales Operating income Sales breakdown(2016)
Sales by region(2016)
High purity chemicals
Develops high value-added products as an earnings driver
g-Line Resists
Semiconductor Packaging Manufacturing Field
Bump Photoresists
Image SensorMEMS Manufacturing Field
Materials for Photosensitive
Permanent Films
Net Sales of High-Density Integration Field:
3 years growth 2.4 times
High Purity Chemicals
High Purity Chemicals
Krf Excimer Laser Photoresists
High Purity Chemicals
Semiconductor manufacturing equipmentVarious types of equipment centered on TOK’s Zero Newton wafer handling system that enables significant increases in efficiency and cost performance of the 3D packaging process of semiconductors
Process equipment for LCD panelsVarious types of process equipment including coating machines that can achieve high-precision performance, UV curing machines, and coating machines for R&D
Process equipment
Getting one step ahead of market needs in synergy with the Material Business
At a Glance
Materials for Cover Coat
Material Business
Equipment Business
16 TOKYO OHKA KOGYO CO., LTD.

We are leveraging our Material Business which develops high value-added products as an earnings driver and realizing synergy with our Equipment Business, getting one step ahead of market needs.
In TOK Medium-Term Plan 2015, we developed the following product portfolio centered on the Material Business, and made significant progress in four fields.
Business segment Main products Net sales Operating income Sales breakdown(2016)
Sales by region(2016)
2015 2016201420132012
(Millions of yen)
908
232
–889
–423
20
2015 2016201420132012
(Millions of yen)
13,500
5,302
2,484 2,7483,581
3D Packaging Field
Zero Newton Wafer Handling
System
High Purity Chemicals
2015 2016201420132012
(Millions of yen)
OtherHigh purity chemicalsElectronic functional materials
66,645 67,69772,866
84,611
22,789
609
24,144
435
29,194
410
34,844
−52
43,246 43,116 43,26149,818
87,280
35,931
214
51,134
TVs, various displays
Smartphones, tablet devices
Panel Manufacturing Field
Black Resists
TFT Resists
High-reliability Transparent Materials
XXXHigh Purity Chemicals
High Purity Chemicals
Semiconductor manufacturing lines, etc.
Panel manufacturing lines, etc.
Net Sales of High Purity Chemicals:
3 years growth 50%
Cleaning Solutions
Inorganic Chemicals
Developing Solutions
Thinner Stripping Solutions
Organic Chemicals
Material Business: Electronic functional
materials
Equipment business
Other
Material Business: High purity chemicals
3.0%
56.8%
0.3%
39.9%
Japan
23.0%
Taiwan
36.1%
South Korea12.8%
The U.S.
13.3%
Other
14.8%
UV Curing Machines
Adhesive Material
(FY)
Resists for Organic EL
2015 2016201420132012
8,303
10,716
14,086
16,355 16,203(Millions of yen)
(FY)
17Annual Report 2016
The Value TO
K C
reates

Intellectual Capital
High Ratio of R&D Costs to Net SalesAs an R&D-driven company whose competitiveness derives from microprocessing and high purity processing technolo-gies, TOK devotes approximately 8% of net sales to R&D, significantly above the 3.9%* average for all industries.
In addition to R&D in Japan and overseas in cutting-edge semiconductor-related fields, deeply rooted in our strategy of building close relationships with customers, TOK contin-ues its founding focus on delivering first-in-the-world prod-ucts and gaining leadership in niche fields, while also accelerating the move toward open innovation.*Actual as of FY2015/Source: The Nikkei Business Daily, August 17, 2016
Strategic Patent PortfolioTo ensure flexibility in business development and a compet-itive advantage in the market through the intellectual prop-erty derived from our R&D efforts, TOK is focused on aggressively applying for, protecting, exercising and strate-gically licensing its patents.
We also immediately deal with patent applications in South Korea, Taiwan and other overseas jurisdictions. Our patent portfolio is also designed to enable the stable pursuit of business development in new, promising technologies and to build barriers to entry.
Focus on R&D and strategic utilization of intellectual property rights
Introduction to the strengths and characteristics of the management resources TOK has cultivated over the past 75 years
Solid Financial PositionTOK has an equity ratio of 85.1% and a debt-to-equity ratio of less than 0.01 times as of March 31, 2016, making it one of the most financially sound enterprises in the chemi-cals sector.
Our strategy of building leadership in niche fields, part of our DNA since our founding, as well as our willingness to take aggressive risks as an R&D-driven company, and our competitiveness against much larger companies, are all supported by our solid financial position.
Pursuit of Capital EfficiencyWe work to maintain financial soundness while engaging in a full-fledged pursuit of capital efficiency.
Currently, TOK is working to achieve a newly established ROE target figure by advancing an investment strategy that emphasizes efficiency indicators such as total asset turn-over ratio, IRR and ROIC. At the same time, by continuing to pursue an ideal balance between investment, cash reserves and shareholder returns, we are focused on fur-ther strengthening our foundation for long-term growth from the perspective of financial capital.
Balance Sheets (As of March 31, 2016)
Building a foundation for long-term growth through a solid financial position and the pursuit of capital efficiency
See Message from the CFO on pages 28–29
Financial Capital
Property, plant and equipment/
Investments and other
assets
¥80.1 billion
Current assets
¥87.1 billion
Assets Liabilities/Net assets
Net assets
¥147.2 billion
Other liabilities
¥19.4 billion
Interest- bearing debt
¥0.5 billion
Ratio of R&D Costs to Net Sales
(%)
(FY)
2010 2011 2012 2013 2014 2015 2016200920082007
7.86.4 7.910.2 9.8 7.9 7.7 8.5 8.5 7.8
Debt-to-equity ratio
0.00 times
Equity ratio
85.1%
0
120
60
Management Resources
Japan The U.S. Asia Europe■Semiconductor 85 56 53 8
■Panels 19 6 22 0■Chemical cells (rechargeable
batteries and fuel cells) 2 3 2 0
■MEMS 0 0 0 0
■Nanoimprint 3 1 0 0
■WHS 5 10 32 0
■Other 12 3 10 0
Total 126 79 119 8 See Special Feature (R&D and New Business Development) on pages 44–47
Patents Acquired (country, classification/FY2016)
18 TOKYO OHKA KOGYO CO., LTD.

Low Turnover Rate Among Younger EmployeesTOK has established a consistent philosophy of regarding human resources as one asset of the company since our establishment and we view all employees as valuable assets, so have stipulated the items on the right in line with this belief.
As surety for our long-term growth capabilities and in line with one of our management principles, namely the creation of a frank and open-minded business culture, we are committed to developing a safe and sound working environment where each and every one of our employees can work in a motivated manner.
Partly thanks to these efforts, in recent years we have maintained a zero turnover rate among employees with three years or less in the Company.
Develop Global PersonnelGiven that sales overseas now represent just under 80% of net sales, primarily in cutting-edge semiconductor-related fields, TOK is focused on a medium- to long-term human resource development policy of global personnel development. We are currently advancing strategic human resource development under the TOK Global Practical Training for Selected Members and the TOK Group Core Human Resources Training Program.
Putting into practice worldwide the basic philosophy of regarding human resources as a company asset
See Special Feature (Human Resource Development) on pages 50–51
Building Solid Trust Through a Strategy of Close Relationships with CustomersTOK has established manufacturing and development sites in South Korea, Taiwan, the U.S. and other places where many of our customers are located. By introducing proto-type production lines equal to the customers’ lines, we can quickly commercialize the results of development and in the fast-changing electronics industry, build solid trust relationships.
R&D as a Way Into Building Deep Social and Relationship CapitalAs technical development in cutting-edge semiconductor fields grows increasingly difficult with each passing year, building ties with a variety of stakeholders aside from cus-tomers will become a key to achieving breakthroughs and innovation.
TOK is working to build deep social and relationship capital through R&D. These efforts include discovering and supporting venture companies with superior technological capabilities, participation in a variety of consortiums, and projects to subsidize R&D through the Tokyo Ohka Foundation for The Promotion of Science and Technology.
Business evolution through ties to a wide range of stakeholders
Social and Relationship Capital
Human Capital
Policy on Utilizing Human Resources
Turnover Rate among Employees with Three Years or Less in the Company
Example of Customer Evaluation
Key Examples of Consortium Participation
(%)
2011 2012 2013 2014 2015 (FY)
22.0
0.0 0.0 0.0 0.0
Never forget that business always starts with “people.” Any discrimination within the Company and among employees is strictly prohibited. Ensure full compliance with applicable laws and regulations, as well as fair and equal compensation. Educate personnel and promote creativity to become a company that develops innovative technologies. Ensure personnel systems are based upon performance, emphasizing and ensuring transparency.
Consortium Head Office Description of Participation
Interuniversity Microelectronics Centre (IMEC)
BelgiumDevelopment of next-generation
photoresists, etc.
Institute of Microelectronics
(IME)Singapore
Development of next-generation
semiconductor packaging materials, etc.
Award Customer Year
Preferred Quality Supplier Award Intel Corporation (U.S.)
20142015
Best Supplier Award ASE Kaohsiung (Taiwan) 2014
Supplier Excellence Award
Texas Instruments Incorporated (U.S.) 2014
Turnover Rate: 0
See Special Feature (R&D and New Business Development) on pages 44–47
19Annual Report 2016
The Value TO
K C
reates

Global financial crisis
Urgent business profitability
reforms
Business structural reforms
Lean corporate structure
Our Future
Achieving “Overarching Aspiration,” the TOK Management Vision for the Fiscal Year Ending March 31, 2021Based on the strengths and management resources we have built over our 75-year history, TOK aspires to further long-term growth.
Even as we are affected by the silicon cycle, TOK will maintain its upward trajectory, aiming to achieve operating income of ¥20.0 billion in the fiscal year ending March 31, 2021 and to become a 100-year company in the fiscal year ending March 31, 2041 by remaining a leader in niche fields and accelerating our high value-added strategy.
TOK Medium-Term Plan 2015
• Achieved record-high profits• Strategy of building close relationships
with customers made significant progress• Diversified earnings drivers
2009 2011 2012 20162015201420132010
Results
1st step to achieve “overarching aspiration”
Consolidated operating income (loss)
Achieved record-high profits*
¥13.2 billion
TOK Medium-Term Plan 2015
CAGR: +16.5%*
* Based on operating income
20 TOKYO OHKA KOGYO CO., LTD.

Operating income
target of ¥20 billion
ROE of over 8%
2017 2021 (FY)202020192018
TARGETS
2nd step
Cultivate new business domains
Existing business
Deepen and expand existing business domains
New business domains
Existing business domains
Future business
composition
Rebuild existing business domains
TOK Medium-Term Plan 2018
1. Reform business portfolios2. Evolve strategy of building close relationships
with customers3. Develop global personnel4. Strengthen management foundation
Strategy
“Aim to be a globally trusted corporate group by inspiring customers with high value-added products that have satisfying features, low cost and superior quality”
80th anniversaryFiscal year ending March 31, 2021
“Overarching aspiration”
Fiscal year ending March 31, 2041
Becoming
a 100-year company
TOK Medium-Term Plan 2018
CAGR: +6.4%*
Fiscal year ending March 31, 2019
TARGETS
Net sales Over ¥120 billion
Operating income Over ¥15 billion
Net income Over ¥10 billion
ROE Over 7%
21Annual Report 2016
Grow
th Strategy
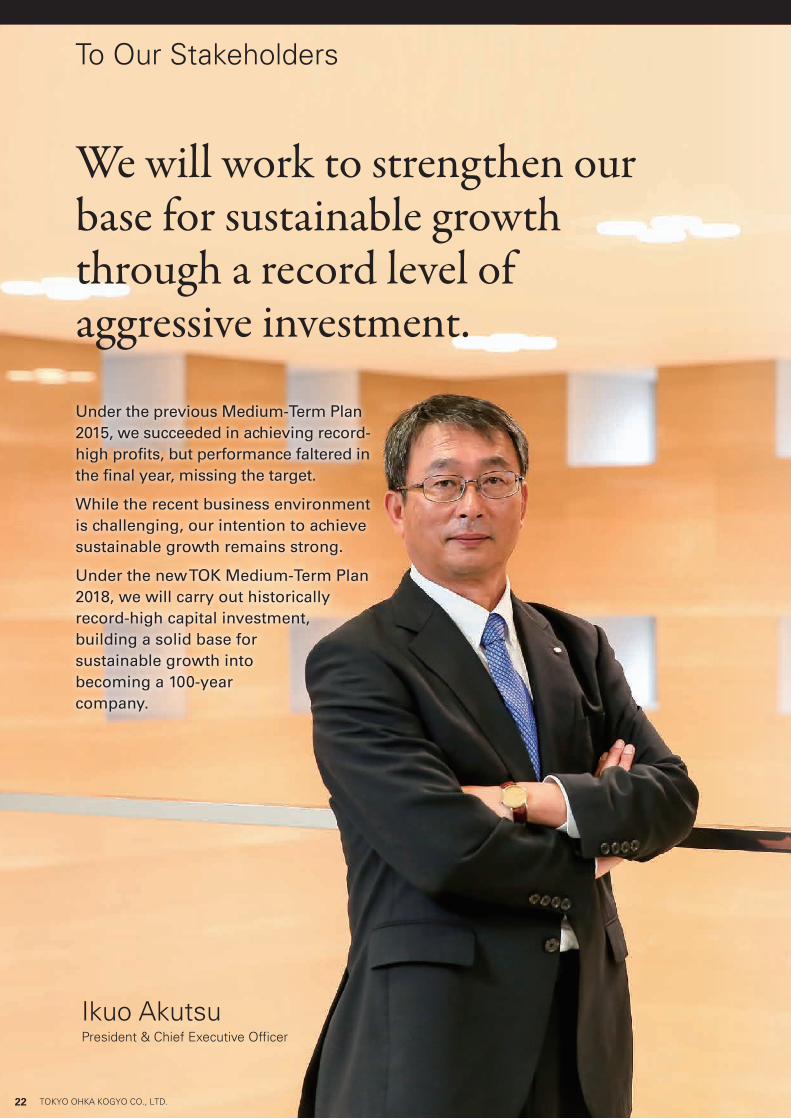
We will work to strengthen our base for sustainable growth through a record level of aggressive investment.
Under the previous Medium-Term Plan 2015, we succeeded in achieving record-high profits, but performance faltered in the final year, missing the target.
While the recent business environment is challenging, our intention to achieve sustainable growth remains strong.
Under the new TOK Medium-Term Plan 2018, we will carry out historically record-high capital investment, building a solid base for sustainable growth into becoming a 100-year company.
To Our Stakeholders
22 TOKYO OHKA KOGYO CO., LTD.
President & Chief Executive Officer
Ikuo Akutsu

Record-High Profits, and a Certain Level of Quantitative SuccessBased on our vision for our 80th anniversary of achieving
an “overarching aspiration” by the fiscal year ending
March 31, 2021, the TOK Group is working to achieve its
“Aim to be a globally trusted corporate group by inspiring
customers with high value-added products that have
satisfying features, low cost and superior quality,” and to
achieve a consolidated operating income of ¥20 billion.
Under this vision, in April 2013 we began a three-
year TOK Medium-Term Plan 2015, with the goals of
surpassing record-high profits, enhancing business foun-
dations that support sustainable growth, and expanding
new business domains. To accomplish this, we worked
to build close relationships with regional users, reform
our business portfolios and develop global personnel.
Thanks to these efforts, we achieved a certain level of
quantitative results, including record-high operating
income in the fiscal year ended March 31, 2015—the
second year of the plan. While we missed our earnings
target for the final year of the plan, we set a new record
for operating income for the first time in 30 years (the
last being the fiscal year ended November 30, 1985),
which will provide a solid foothold for achieving our goal
of ¥20 billion in operating income in the fiscal year
ending March 31, 2021.
Building a Powerful Bridgehead in Cutting-Edge Semiconductor DomainsOn the qualitative side, in 2012 we established our
South Korean subsidiary, TOK Advanced Materials Co.,
Ltd. (TOKAM), a customer-oriented site, and also
strengthened our development frameworks in the U.S.
and Taiwan. Communicating closely with leading cus-
tomers in the global semiconductor industry, we suc-
ceeded in building a powerful development framework
that allows us to interact daily with live feedback from
customers in high value-added, cutting-edge semicon-
ductor domains. This led to another major achievement
on the qualitative side, giving us the ability to strengthen
our advantage toward capturing the volume zone for ArF
excimer laser photoresists, the main market for the
semiconductor miniaturization process as it breaks
through the 10nm level.
Reforming Our Business PortfoliosIn TOK’s business portfolios, we were largely successful
in achieving our targets in earnings drivers, with sales of
ArF excimer laser photoresists growing by about 1.5
times in three years, KrF excimer laser photoresists by
about 1.3 times, and high-density integration materials
about 2.4 times. In high purity chemicals, we also gener-
ated new value by developing a high quality grade tailored
to customer processes, and sales grew by about 1.5
times over three years, exceeding the target. As a result,
we believe we have succeeded in making appropriate
progress in the renewal of our existing businesses.
In contrast, one issue that remains is the creation of
new business domains, a priority theme of the previous
medium-term plan. Initial prospects for renewable energy
(related to solar cells) fell through, and rechargeable bat-
tery field (rechargeable microbatteries, etc.) failed to reach
commercialization, while in the Equipment Business,
delays in the start-up of the market also had an impact. As
a result, we failed to make progress in reforming our
business portfolio through the creation of new busi-
nesses, and were unable to reduce our reliance on the
Material Business (e.g. strengthen our tolerance for the
negative aspects of the silicon cycle), centered on photo-
resists. These and other factors contributed to our having
missed the targets for the final fiscal year of the plan.
Cultivating new businesses takes time, and success
requires both enormous effort and persistence, something
which the TOK Group has experienced for itself over the
course of more than 75 years in business. Nevertheless,
establishing new earning pillars is essential for TOK as we
target sustainable, stable growth with a goal of reaching
¥20 billion in operating income in the fiscal year ending
March 31, 2021, and eventually becoming a 100-year com-
pany. Thus, under the new medium-term plan, the TOK
Group has placed the highest priority on a strategy for the
“reform of its business portfolios,” with a strong focus on
generating solid results from new businesses. While we
cannot reveal the details due to customer contracts,
during the previous medium-term plan, we were success-
ful in cultivating the shoots of new businesses, including
in the area of high-functional film, that we believe can
indeed generate results. At this point, we can report that
we are currently moving forward with building a produc-
tion line in anticipation of mass production.
Summary of TOK Medium-Term Plan 2015:The first step in achieving our “overarching aspiration,” a vision for the fiscal year ending March 31, 2021.
23Annual Report 2016
Grow
th Strategy
The Global Semiconductor Market Returns to a Growth Path Beginning in 2017With slowing growth in the smartphone market and a
shrinking market for PCs, the global market for semicon-
ductors shrank 0.2% year-on-year in 2015, to $335.1
billion, falling into minus growth territory for the first
time since 2012. Negative growth is expected for 2016
as well, with a decline of 2.4% year-on-year.
Still, thanks to growth in automotive ICs and various
types of sensors, growth in demand for servers used in
analyzing big data, the launch of new high value-added
smartphone models and the wider use of low-cost
smartphones in emerging countries, the market is
expected to return to a growth path in 2017, increasing
2.0% year-on-year. Growth will continue at about 2.2%,
with the size of the global semiconductor market in 2018
forecast to surpass the record set in 2014, at $340.9
billion. As a result, average annual growth in the market
between 2015 and 2018 is projected to continue at a
gradual rate of 0.6%.
(Source: World Semiconductor Trade Statistics, etc.)
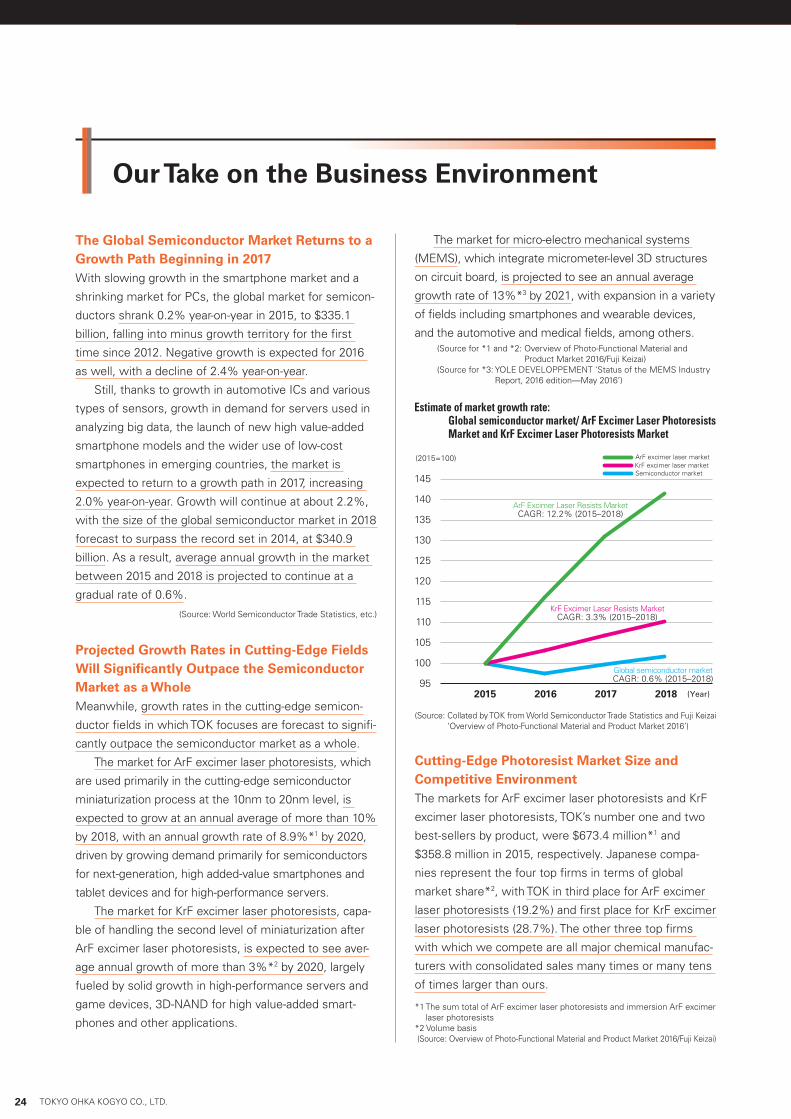
Projected Growth Rates in Cutting-Edge Fields Will Significantly Outpace the Semiconductor Market as a WholeMeanwhile, growth rates in the cutting-edge semicon-
ductor fields in which TOK focuses are forecast to signifi-
cantly outpace the semiconductor market as a whole.
The market for ArF excimer laser photoresists, which
are used primarily in the cutting-edge semiconductor
miniaturization process at the 10nm to 20nm level, is
expected to grow at an annual average of more than 10%
by 2018, with an annual growth rate of 8.9%*1 by 2020,
driven by growing demand primarily for semiconductors
for next-generation, high added-value smartphones and
tablet devices and for high-performance servers.
The market for KrF excimer laser photoresists, capa-
ble of handling the second level of miniaturization after
ArF excimer laser photoresists, is expected to see aver-
age annual growth of more than 3%*2 by 2020, largely
fueled by solid growth in high-performance servers and
game devices, 3D-NAND for high value-added smart-
phones and other applications.
The market for micro-electro mechanical systems
(MEMS), which integrate micrometer-level 3D structures
on circuit board, is projected to see an annual average
growth rate of 13%*3 by 2021, with expansion in a variety
of fields including smartphones and wearable devices,
and the automotive and medical fields, among others.
Cutting-Edge Photoresist Market Size and Competitive EnvironmentThe markets for ArF excimer laser photoresists and KrF
excimer laser photoresists, TOK’s number one and two
best-sellers by product, were $673.4 million*1 and
$358.8 million in 2015, respectively. Japanese compa-
nies represent the four top firms in terms of global
market share*2, with TOK in third place for ArF excimer
laser photoresists (19.2%) and first place for KrF excimer
laser photoresists (28.7%). The other three top firms
with which we compete are all major chemical manufac-
turers with consolidated sales many times or many tens
of times larger than ours.
*1 The sum total of ArF excimer laser photoresists and immersion ArF excimer laser photoresists
*2 Volume basis(Source: Overview of Photo-Functional Material and Product Market 2016/Fuji Keizai)
(Source for *1 and *2: Overview of Photo-Functional Material and Product Market 2016/Fuji Keizai)
(Source for *3: YOLE DEVELOPPEMENT ‘Status of the MEMS Industry Report, 2016 edition—May 2016’)
Estimate of market growth rate:Global semiconductor market/ ArF Excimer Laser Photoresists Market and KrF Excimer Laser Photoresists Market
2016 2017201595
145
140
135
130
125
120
115
110
105
100
2018
Semiconductor market
(Year)
(2015=100)
ArF Excimer Laser Resists MarketCAGR: 12.2% (2015–2018)
KrF Excimer Laser Resists MarketCAGR: 3.3% (2015–2018)
Global semiconductor marketCAGR: 0.6% (2015–2018)
ArF excimer laser marketKrF excimer laser market
Our Take on the Business Environment
(Source: Collated by TOK from World Semiconductor Trade Statistics and Fuji Keizai ‘Overview of Photo-Functional Material and Product Market 2016’)
24 TOKYO OHKA KOGYO CO., LTD.

A Record Level of Capital Investment to Strengthen Base for Long-term GrowthThe new three-year TOK Medium-Term Plan 2018, which
began in the current fiscal year ending March 31, 2017,
represents the second step toward achieving our “over-
arching aspiration,” and is positioned as an important
three-year period that holds the key to achieving ¥20 billion
in operating income in the fiscal year ending March 31, 2021.
Under the TOK Medium-Term Plan 2018, we will use our
strategy of building close relationships with customers to
further develop our world-leading microprocessing and high
purification technologies, our core competencies, solidifying
our advantage in cutting-edge semiconductor fields, and
making concrete progress in reforming our business port-
folio, a major issue left over from the previous medium-term
plan. To do this, we will carry out a record ¥34 billion capital
investment. As a milestone toward achieving our goal of
¥20 billion in operating income in the fiscal year ending
March 31, 2021, we will also aim to achieve a new record
for operating income of ¥15 billion in the fiscal year ending
March 31, 2019, the final year of the medium-term plan.
Moving to the Harvesting Stage by Adding Even Greater Value to Earnings DriversIn reforming our business portfolio, we will first focus on
moving forward to add even higher value to our earnings
drivers, shifting to the harvesting stage and ensuring a
solid path to long-term growth.
In ArF excimer laser photoresists, demand is growing for
products beyond the 10nm level, the cutting edge of minia-
turization. Therefore, the success or lack thereof in capturing
that demand will affect photoresist manufacturers’ future
competitive power. By deploying a strategy of building close
relationships with our customers, emphasizing the unique
features and quality of our products and our responsiveness
to customers, TOK has already captured a partial share of this
market, including products adopted by major semiconductor
manufacturers. Under the TOK Medium-Term Plan 2018, we
will move forward with new capital investment, including
deployment of inspection equipment similar to that of our
customers, with the goal of achieving a global share of more
than 30% of the ArF excimer laser photoresist market.
In KrF excimer laser photoresists, we have secured
adoption of our product by a major customer working to
mass produce 3D-NAND flash memory, and in the near
term, market expansion is beginning to accelerate. We
will push ahead with a strategy to further solidify our top
global position in the market for KrF excimer laser photo-
resists by further improving product features in line with
the increase in integration layers.
In high-density integration materials, photoresists for
packaging have become a new earnings driver for TOK, the
result of more than 10 years of persistent research and devel-
opment. Leveraging our competitive strength in high-
resolution positive photoresists, an area of strength for TOK,
we will work to expand sales in fields that demand even
greater functionality and space savings. In the near term,
demand for thick-film photoresists for new fan-out wafer level
packages* for use in next-generation smartphones is begin-
ning to grow, and through our strategy of building close rela-
tionships with our customers, we will work to turn this into a
solid earner. In MEMS materials, demand is growing for use
in IoT-related and smartphone sensors, and there is an
increasing emphasis on performance, which represents an
opportunity for TOK to increase its share in permanent photo-
resists. We will continue our wide-ranging sales and develop-
ment activities as we work to further explore customer
needs while also capturing new customers.
In high purity chemicals (stripping solutions, thinners,
developing fluids, etc.), we will further refine our product
quality using our high purification technology, one of our
core technologies, and by further elaborating our strat-
egy of building close relationships with customers, work
to build long-term stable growth and an expanded
market share in this field.
* Fan-out Wafer Level Package (FOWLP): A packaging technology to form a redistribution layer in a wide field that exceeds the chip area, thereby enabling us to respond to multi-pin packages, such as processors.
The second step in achieving our “overarching aspiration,” a vision for the fiscal year ending March 31, 2021:
The TOK Medium-Term Plan 2018
25Annual Report 2016
Grow
th Strategy

Roadmap to Reach Our ROE TargetThrough our dialogue with shareholders and investors, the
TOK Group is strongly aware that improving our ROE is
essential, and in our new TOK Medium-Term Plan 2018, we
have established a numerical target for ROE. Our goal for
the fiscal year ending March 31, 2021 is to achieve a solid
financial position and ROE of 8%. A “solid financial posi-
tion” is specified because R&D in the cutting-edge fields in
which TOK focuses requires large capital investments, and
also because production technology, including technology
Efforts Toward Open Innovation, Keeping in Mind the Goal of Becoming a 100-Year CompanyAnother priority strategy in reforming our business portfo-
lio is the creation of new businesses and new materials.
Our goal is to reach ¥5 billion in sales from new busi-
nesses in the fiscal year ending March 31, 2019. By diver-
sifying our microprocessing technology, and leveraging
collaboration and alliances with outside institutions includ-
ing consortiums and university research laboratories, we
will work to expand our business domains, and to com-
mercialize themes we have previously focused on, includ-
ing high-functional films and nanoimprint materials.
We have also started an “open innovation” initiative, a
new concept under the TOK Medium-Term Plan 2018. As
the TOK Group aims at becoming a 100-year company, we
will continue to specialize in high value-added fields while
achieving long-term growth. This requires an even greater
degree of cooperation with our customers, of course, but
also with suppliers, business partners, outside research
institutes and so on. By incorporating a wide range of
seeds of technologies, needs, ideas, and concepts from
outside the Company, we will accelerate the reform of
the TOK Group’s business portfolios.
To get a head start on this open innovation effort, in
October 2015 we established a new organization, the
Corporate Venturing Div., within the New Business
Development Dept. The objective of this organization is to
discover and support ventures both inside and outside Japan
that represent potential synergies with the TOK Group, with
the aim of creating business in new fields through invest-
ment stakes and business partnerships designed to build
cooperative relationships. The organization has already estab-
lished several deals, and in March 2016, we invested about
¥180 million in Inpria Corporation in the U.S., which has an
excellent track record in research in the EUV resist field,
which is expected to have applications for semiconductor
ultra-microprocessing (at the single-digit nm level). This invest-
ment will not only support Inpria’s R&D, but will help them
enlarge the scale of their resist production and prepare to
provide peripheral materials. While some are of the opinion
that the EUV resist market will take time to ramp up, we are
promoting this initiative with an eye on the future and in
anticipation of long-term, stable growth for the TOK Group.
Continuing Investment in the Equipment Business as a Future Core Business3D packaging, on which we have been focusing for some
time, is a technology that entails stacking thinned semi-
conductor chips in layers. In addition to being 3D, it real-
izes higher density and miniaturization of devices. The 3D
semiconductor market is gradually taking shape, chiefly
for cutting-edge smartphones and high-end servers. TOK
is also developing its “Zero Newton”(TSV: Through Silicon
Via equipment) wafer handling system that helps make
this packaging process more efficient, and in light of the
previous medium-term plan, sales were sluggish, partly
due to a delay in the market launch.
Still, the 3D packaging equipment market is seen as
having significant growth potential, and the Materials &
Equipment (M&E) strategy of generating synergies
through collaboration between the Material Business and
Equipment Business has contributed to creating unique
value for TOK. We thus plan to continue persistent invest-
ment in this area with the goal of developing it into a core
business for the TOK Group. Under the new medium-term
plan, we will work to expand earnings by moving forward
with further concentration within the Equipment Business
segment, narrowing our target fields to TSV equipment,
UV cure equipment and next-generation flexible display
manufacturing equipment, and focusing management
resources on (1) development and sales of new equip-
ment; (2) sales of components and related materials; and
(3) after-sales service (repair and remodeling). We are also
approaching customers about deploying applications for
TSV technology in fan-out processing for next-generation
smartphones, a market which is expected to grow.
Heading for Greater Capital Efficiency and Shareholder Value
26 TOKYO OHKA KOGYO CO., LTD.

Full Compliance with the Corporate Governance CodeThe TOK Group is striving to achieve its “overarching
aspiration” for the 80th anniversary of the company’s
founding, in the fiscal year ending March 31, 2021. We
have also begun engaging in activities toward the more
distant goal of becoming a 100-year company. We
believe that, in these efforts aimed at long-term growth,
it is essential that we enhance corporate governance
with the goal of ensuring efficiency through manage-
ment transparency, soundness and more rapid deci-
sion-making. The TOK Group has already implemented all
of the principles of the Corporate Governance Code, and
as of June 2016, independent officers represent 41.7%
of our Board of Directors, an increase of 5.3 points
compared to three years ago. We have also established
a regular meeting consisting solely of the independent
officers, with the addition of our standing statutory audi-
tor, and together they focus on their own efforts with
regard to the Corporate Governance Code, as they see
fit. At Board of Director’s meetings in preparation for
formulating the TOK Medium-Term Plan 2018, we had
multi-faceted, in-depth discussions, thanks to which I
myself was able to bring a deep sense of conviction and
purpose to the decision to carry out a record level of
capital investment. TOK will continue to work to
strengthen its corporate governance structure, and strive
to maximize corporate value.
We kindly request the ongoing support and under-
standing of all our stakeholders.
for mass production, is growing more complex each year.
This requires a solid financial base that allows for risk-
taking even with highly uncertain business investments,
and that protects other projects from being affected even
in the event an investment is not successful.
As a path to improving ROE, TOK will prioritize
growth of high quality operating income through busi-
ness portfolio reforms focused on high added value. At
the same time, also taking the enhancement of share-
holder returns into consideration will lead to greater
capital efficiency and
improved corporate
value. Under the
medium- term plan, we
will also focus on prior
investment, and as a
preliminary step, we
have set a target ROE of
7% in the fiscal year
ending March 31, 2019,
the final year of the plan.
Enhance Returns to Shareholders With Emphasis on DividendsTo date, TOK’s basic policy regarding dividends has been to
target a consolidated dividend payout ratio of over 30%.
However, in the hopes of clarifying our approach to enhanc-
ing shareholder returns, both in terms of profit recovery
and growth, we have raised our payout ratio guideline
beginning in the fiscal year ending March 31, 2017, changing
our policy to read “Considering the current level of divi-
dends, continuously distribute dividends with a consoli-
dated dividend payout ratio of over 40%.” With regard to
purchase of treasury stock, we will continue to implement
such purchases flexibly from a long-term perspective.
Dividends per share (¥)
Operating income(¥ billion)
7.8 10.0 13.2 12.4 7.7 15.0
* FY2016: Including a commemorative dividend of 4 yen for the 75th anniversary.
Annual dividend
Year-end dividend
Interim dividend
Consolidated dividend payout ratio
2013 2014 2015 2016* 2017 2019
20
44
52
6064 64
24 30 32 32
(Forecast)(FY)
(Target)
24
36.2%30.9% 30.5%
36.1%
52.1%
28 30 32 32
Over 40.0%
Enhancing Corporate Governance to Become a 100-Year Company
27Annual Report 2016
Grow
th Strategy
Message from the CFO
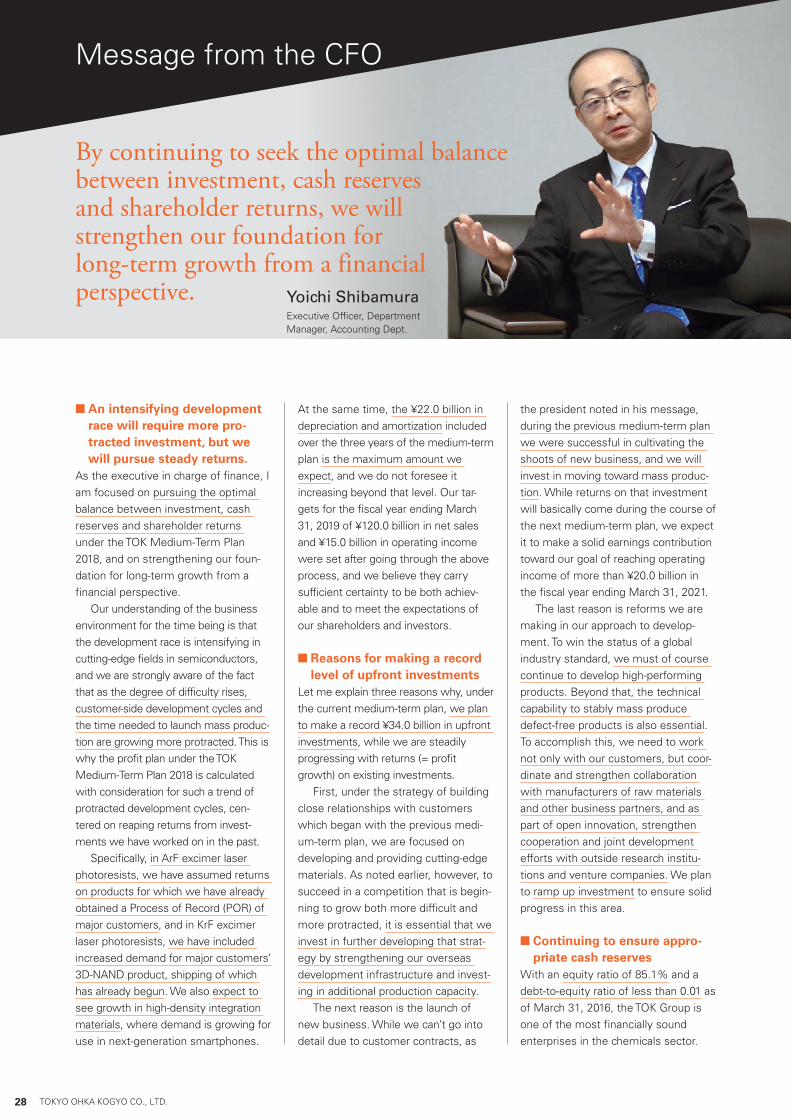
■ An intensifying development race will require more pro-tracted investment, but we will pursue steady returns.
As the executive in charge of finance, I am focused on pursuing the optimal balance between investment, cash reserves and shareholder returns under the TOK Medium-Term Plan 2018, and on strengthening our foun-dation for long-term growth from a financial perspective.
Our understanding of the business environment for the time being is that the development race is intensifying in cutting-edge fields in semiconductors, and we are strongly aware of the fact that as the degree of difficulty rises, customer-side development cycles and the time needed to launch mass produc-tion are growing more protracted. This is why the profit plan under the TOK Medium-Term Plan 2018 is calculated with consideration for such a trend of protracted development cycles, cen-tered on reaping returns from invest-ments we have worked on in the past.
Specifically, in ArF excimer laser photoresists, we have assumed returns on products for which we have already obtained a Process of Record (POR) of major customers, and in KrF excimer laser photoresists, we have included increased demand for major customers’ 3D-NAND product, shipping of which has already begun. We also expect to see growth in high- density integration materials, where demand is growing for use in next- generation smartphones.
At the same time, the ¥22.0 billion in depreciation and amortization included over the three years of the medium-term plan is the maximum amount we expect, and we do not foresee it increasing beyond that level. Our tar-gets for the fiscal year ending March 31, 2019 of ¥120.0 billion in net sales and ¥15.0 billion in operating income were set after going through the above process, and we believe they carry sufficient certainty to be both achiev-able and to meet the expectations of our shareholders and investors.
■ Reasons for making a record level of upfront investments
Let me explain three reasons why, under the current medium-term plan, we plan to make a record ¥34.0 billion in upfront investments, while we are steadily progressing with returns (= profit growth) on existing investments.
First, under the strategy of building close relationships with customers which began with the previous medi-um-term plan, we are focused on developing and providing cutting-edge materials. As noted earlier, however, to succeed in a competition that is begin-ning to grow both more difficult and more protracted, it is essential that we invest in further developing that strat-egy by strengthening our overseas development infrastructure and invest-ing in additional production capacity.
The next reason is the launch of new business. While we can’t go into detail due to customer contracts, as
the president noted in his message, during the previous medium-term plan we were successful in cultivating the shoots of new business, and we will invest in moving toward mass produc-tion. While returns on that investment will basically come during the course of the next medium-term plan, we expect it to make a solid earnings contribution toward our goal of reaching operating income of more than ¥20.0 billion in the fiscal year ending March 31, 2021.
The last reason is reforms we are making in our approach to develop-ment. To win the status of a global industry standard, we must of course continue to develop high-performing products. Beyond that, the technical capability to stably mass produce defect-free products is also essential. To accomplish this, we need to work not only with our customers, but coor-dinate and strengthen collaboration with manufacturers of raw materials and other business partners, and as part of open innovation, strengthen cooperation and joint development efforts with outside research institu-tions and venture companies. We plan to ramp up investment to ensure solid progress in this area.
■ Continuing to ensure appro-priate cash reserves
With an equity ratio of 85.1% and a debt-to-equity ratio of less than 0.01 as of March 31, 2016, the TOK Group is one of the most financially sound enterprises in the chemicals sector.
By continuing to seek the optimal balance between investment, cash reserves and shareholder returns, we will strengthen our foundation for long-term growth from a financial perspective. Yoichi Shibamura
Executive Officer, Department Manager, Accounting Dept.
28 TOKYO OHKA KOGYO CO., LTD.
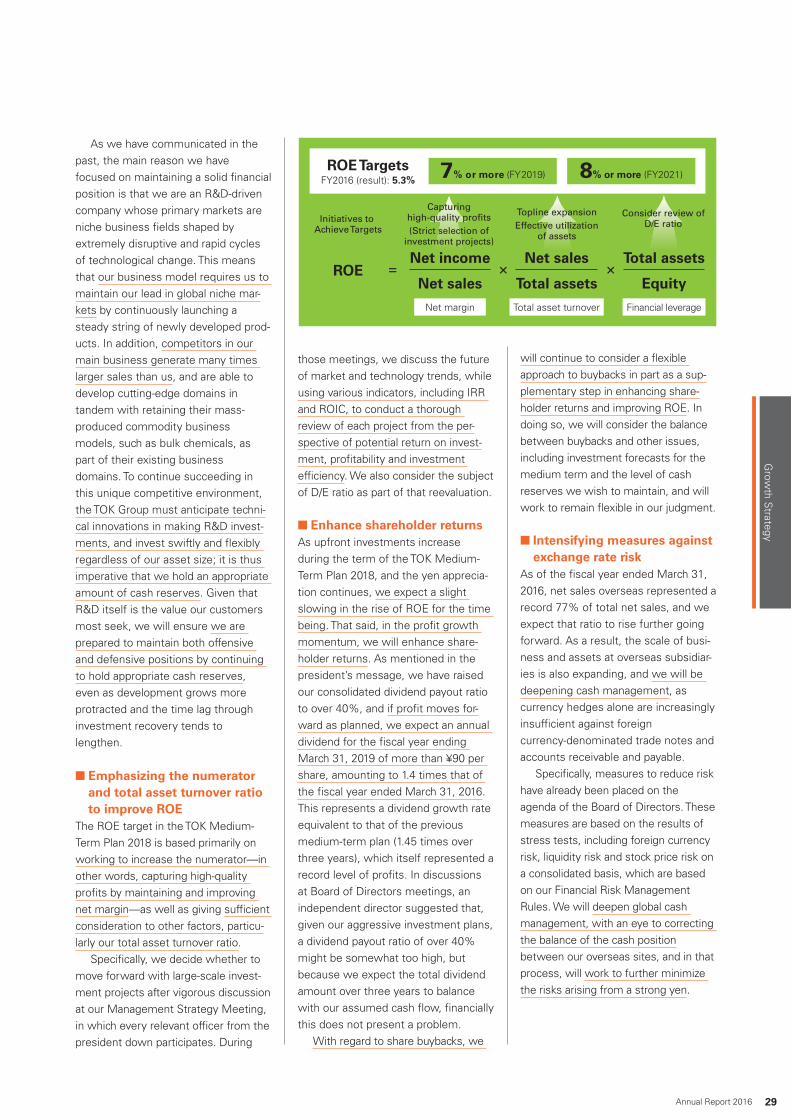
As we have communicated in the past, the main reason we have focused on maintaining a solid financial position is that we are an R&D-driven company whose primary markets are niche business fields shaped by extremely disruptive and rapid cycles of technological change. This means that our business model requires us to maintain our lead in global niche mar-kets by continuously launching a steady string of newly developed prod-ucts. In addition, competitors in our main business generate many times larger sales than us, and are able to develop cutting-edge domains in tandem with retaining their mass- produced commodity business models, such as bulk chemicals, as part of their existing business domains. To continue succeeding in this unique competitive environment, the TOK Group must anticipate techni-cal innovations in making R&D invest-ments, and invest swiftly and flexibly regardless of our asset size; it is thus imperative that we hold an appropriate amount of cash reserves. Given that R&D itself is the value our customers most seek, we will ensure we are prepared to maintain both offensive and defensive positions by continuing to hold appropriate cash reserves, even as development grows more protracted and the time lag through investment recovery tends to lengthen.
■ Emphasizing the numerator and total asset turnover ratio to improve ROE
The ROE target in the TOK Medium-Term Plan 2018 is based primarily on working to increase the numerator—in other words, capturing high-quality profits by maintaining and improving net margin—as well as giving sufficient consideration to other factors, particu-larly our total asset turnover ratio.
Specifically, we decide whether to move forward with large-scale invest-ment projects after vigorous discussion at our Management Strategy Meeting, in which every relevant officer from the president down participates. During
those meetings, we discuss the future of market and technology trends, while using various indicators, including IRR and ROIC, to conduct a thorough review of each project from the per-spective of potential return on invest-ment, profitability and investment efficiency. We also consider the subject of D/E ratio as part of that reevaluation.
■ Enhance shareholder returnsAs upfront investments increase during the term of the TOK Medium-Term Plan 2018, and the yen apprecia-tion continues, we expect a slight slowing in the rise of ROE for the time being. That said, in the profit growth momentum, we will enhance share-holder returns. As mentioned in the president’s message, we have raised our consolidated dividend payout ratio to over 40%, and if profit moves for-ward as planned, we expect an annual dividend for the fiscal year ending March 31, 2019 of more than ¥90 per share, amounting to 1.4 times that of the fiscal year ended March 31, 2016. This represents a dividend growth rate equivalent to that of the previous medium-term plan (1.45 times over three years), which itself represented a record level of profits. In discussions at Board of Directors meetings, an independent director suggested that, given our aggressive investment plans, a dividend payout ratio of over 40% might be somewhat too high, but because we expect the total dividend amount over three years to balance with our assumed cash flow, financially this does not present a problem.
With regard to share buybacks, we
will continue to consider a flexible approach to buybacks in part as a sup-plementary step in enhancing share-holder returns and improving ROE. In doing so, we will consider the balance between buybacks and other issues, including investment forecasts for the medium term and the level of cash reserves we wish to maintain, and will work to remain flexible in our judgment.
■ Intensifying measures against exchange rate risk
As of the fiscal year ended March 31, 2016, net sales overseas represented a record 77% of total net sales, and we expect that ratio to rise further going forward. As a result, the scale of busi-ness and assets at overseas subsidiar-ies is also expanding, and we will be deepening cash management, as currency hedges alone are increasingly insufficient against foreign currency-denominated trade notes and accounts receivable and payable.
Specifically, measures to reduce risk have already been placed on the agenda of the Board of Directors. These measures are based on the results of stress tests, including foreign currency risk, liquidity risk and stock price risk on a consolidated basis, which are based on our Financial Risk Management Rules. We will deepen global cash management, with an eye to correcting the balance of the cash position between our overseas sites, and in that process, will work to further minimize the risks arising from a strong yen.
ROE TargetsFY2016 (result): 5.3% 7% or more (FY2019) 8% or more (FY2021)
Initiatives to Achieve Targets
ROE =
Net margin
Net income
Net sales
Total asset turnover
Net sales
Total assets
Financial leverage
Total assets
Equity× ×
Capturing high-quality profits(Strict selection of
investment projects)
Topline expansionEffective utilization
of assets
Consider review of D/E ratio
29Annual Report 2016
Grow
th Strategy
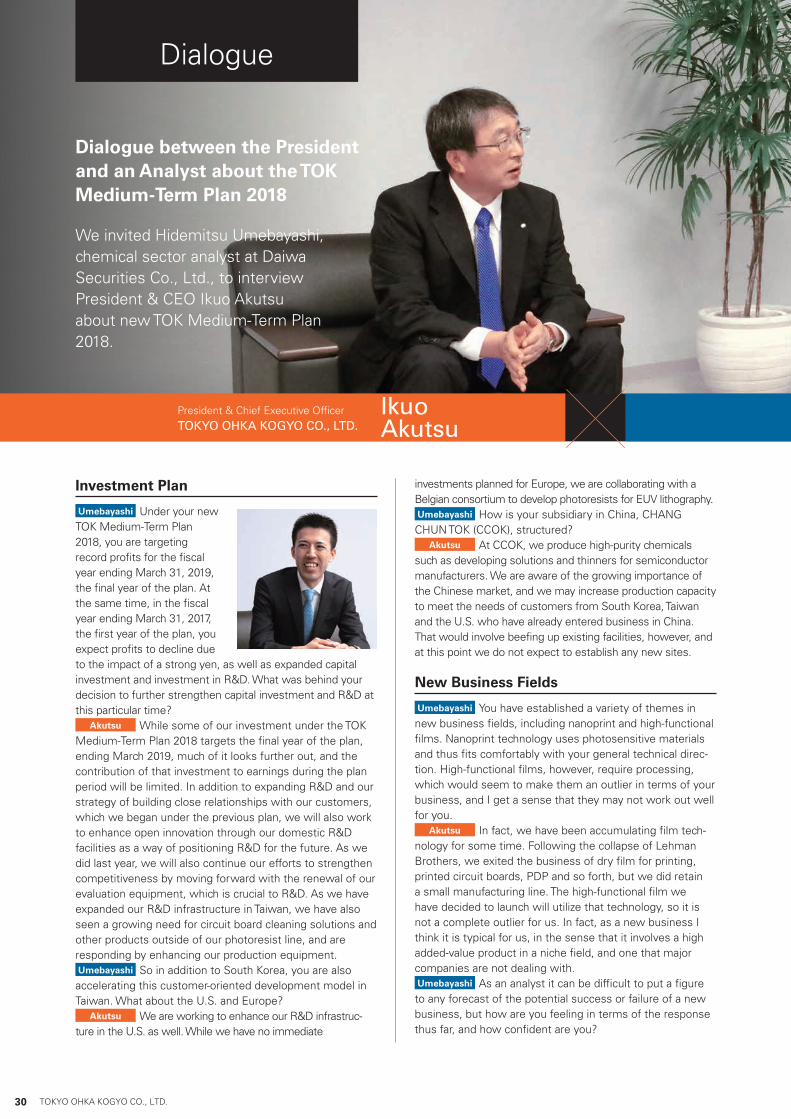
President & Chief Executive OfficerTOKYO OHKA KOGYO CO., LTD.
Ikuo Akutsu
Investment Plan
Umebayashi Under your new TOK Medium-Term Plan 2018, you are targeting record profits for the fiscal year ending March 31, 2019, the final year of the plan. At the same time, in the fiscal year ending March 31, 2017, the first year of the plan, you expect profits to decline due to the impact of a strong yen, as well as expanded capital investment and investment in R&D. What was behind your decision to further strengthen capital investment and R&D at this particular time?
Akutsu While some of our investment under the TOK Medium-Term Plan 2018 targets the final year of the plan, ending March 2019, much of it looks further out, and the contribution of that investment to earnings during the plan period will be limited. In addition to expanding R&D and our strategy of building close relationships with our customers, which we began under the previous plan, we will also work to enhance open innovation through our domestic R&D facilities as a way of positioning R&D for the future. As we did last year, we will also continue our efforts to strengthen competitiveness by moving forward with the renewal of our evaluation equipment, which is crucial to R&D. As we have expanded our R&D infrastructure in Taiwan, we have also seen a growing need for circuit board cleaning solutions and other products outside of our photoresist line, and are responding by enhancing our production equipment.Umebayashi So in addition to South Korea, you are also accelerating this customer-oriented development model in Taiwan. What about the U.S. and Europe?
Akutsu We are working to enhance our R&D infrastruc-ture in the U.S. as well. While we have no immediate
investments planned for Europe, we are collaborating with a Belgian consortium to develop photoresists for EUV lithography.Umebayashi How is your subsidiary in China, CHANG CHUN TOK (CCOK), structured?
Akutsu At CCOK, we produce high-purity chemicals such as developing solutions and thinners for semiconductor manufacturers. We are aware of the growing importance of the Chinese market, and we may increase production capacity to meet the needs of customers from South Korea, Taiwan and the U.S. who have already entered business in China. That would involve beefing up existing facilities, however, and at this point we do not expect to establish any new sites.
New Business Fields
Umebayashi You have established a variety of themes in new business fields, including nanoprint and high-functional films. Nanoprint technology uses photosensitive materials and thus fits comfortably with your general technical direc-tion. High-functional films, however, require processing, which would seem to make them an outlier in terms of your business, and I get a sense that they may not work out well for you.
Akutsu In fact, we have been accumulating film tech-nology for some time. Following the collapse of Lehman Brothers, we exited the business of dry film for printing, printed circuit boards, PDP and so forth, but we did retain a small manufacturing line. The high-functional film we have decided to launch will utilize that technology, so it is not a complete outlier for us. In fact, as a new business I think it is typical for us, in the sense that it involves a high added-value product in a niche field, and one that major companies are not dealing with.Umebayashi As an analyst it can be difficult to put a figure to any forecast of the potential success or failure of a new business, but how are you feeling in terms of the response thus far, and how confident are you?
We invited Hidemitsu Umebayashi, chemical sector analyst at Daiwa Securities Co., Ltd., to interview President & CEO Ikuo Akutsu about new TOK Medium-Term Plan 2018.
Dialogue between the President and an Analyst about the TOK Medium-Term Plan 2018
Dialogue
30 TOKYO OHKA KOGYO CO., LTD.

Hidemitsu Umebayashi
Senior Analyst, ChemicalsCorporate Research DivisionDaiwa Securities Co., Ltd.
Akutsu In high-functional film, we have reached the point of putting mass production facilities in place, so I think we have a suitable level of response. Frequently with new chemical materials, we find that once you establish the technology for one use, it can be extended to other uses. By expanding those applications we hope to push sales above our initial estimates for the market.Umebayashi Under your previous medium-term plan, new business did not really deliver results in terms of actual sales. What is different about the coming three years com-pared to the previous three years?
Akutsu In the previous three-year period, our numerical plan also incorporated factors such as the various seeds of new business we were sowing and our interactions with our customers. This time, the plan includes deals for spe-cific customers with mass production facilities already in place, so really, the expectations are completely different.Umebayashi If you really succeed in building new business to a scale of ¥5.0 billion over the next three years, the years beyond 2019 should be something to look forward to.
Flagship Product: ArF Excimer Laser Photoresists
Umebayashi In your mainstay ArF excimer laser photo-resists, you are aiming for a 30% share of the global market. Given your customers’ development stage, do you feel this is an achievable target?
Akutsu I think it is a target we must achieve. Development has already progressed for processes beyond 10nm, and we sense a solid response from some customers. At the same time, the fact that the timing of mass production continues to fluctuate is a risk factor. For various reasons, including customer intent, miniaturization—including com-mercialization of photoresists for EUV—is falling behind, and we believe there could be a two to three year delay in the generally accepted schedule.
Equipment Business
Umebayashi Given your results over the past three years, your target for the Equipment Business under the new medium-term plan seems aggressive. Your goal is for net sales of ¥10.0 billion, along with a substantial increase of about ¥2.0 billion in profit, significantly greater growth than in the Material Business. As an analyst, I feel there is some risk that you will miss these targets.
Akutsu Performance in the Equipment Business has been sluggish for the last several years, and investors have questioned the viability of the business to continue. Our primary proposition is to find a way out of the current situa-tion, and under the current medium-term plan, that effort will focus on three drivers: TSV equipment, UV curing machines, and flexible display manufacturing equipment. We have also seen a good response to the potential for extending applica-tions for TSV equipment to the fan-out market, and we expect to adopt it for use starting at the wafer level, then moving to the panel level by about 2020. Our Materials & Equipment (M&E) strategy also anticipates growth in TSV materials, including for fan-out applications, which is why we are targeting net sales of ¥10.0 billion for equipment and materials combined.
Vision for the Fiscal Year Ending March, 2021: ¥20.0 billion in Operating Income
Umebayashi In terms of your profit plan for the company as a whole, under the TOK Medium-Term Plan 2018, operating income will decrease significantly in the first year, growing by about ¥7.3 billion in the remaining two years, before reaching ¥15.0 billion in the fiscal year ending March, 2019. In addition, to achieve your vision for the fiscal year ending March 31, 2021 of ¥20.0 billion in operating income, you assume growth of about ¥5.0 billion over two years. Given the impression that you are moving ahead with large-scale investments targeting results for the fiscal year ending March 31, 2021, I can’t help but feel that in terms of profit growth, your goals are less than challenging. What do you think?
Akutsu The ¥20.0 billion target for operating income in the fiscal year ending March 31, 2021, is a figure that was set back in 2010, as part of our vision for the Company 10 years hence. I think that may be why it has diverged some-what from the numerical targets of the new medium-term plan, which reflects actual performance since then. In that sense, it may come across to analysts and investors as slightly conservative. Over the next three years, we hope to build a solid foundation for further growth.
ProfileJoined the Daiwa Institute of Research Ltd. in 1998, assuming his current post following a reorganization. Responsible for the Chemical Sector since 2011.
Hidemitsu Umebayashi
31Annual Report 2016
Grow
th Strategy

Review of Operations
Material Business Performance and Target (Millions of yen)
FY2012 FY2013 FY2014 FY2015FY2016 (result) FY2019 (target)
Change % Change* CAGR*
Net sales 66,645 67,697 72,866 84,611 87,280 +2,668 +3.2% 110,000 +22,719 +8.0%
Electronic functional materials
43,246 43,116 43,261 49,818 51,134 +1,315 +2.6% 68,000 +16,865 +10.0%
High purity chemicals 22,789 24,144 29,194 34,844 35,931 +1,086 +3.1% 37,000 +1,068 +1.0%
Other 609 435 410 (52) 214 +266 — 5,000 +4,785 2.9 times /year
Segment income 8,303 10,716 14,086 16,355 16,203 (152) (0.9%) 17,000 +796 +1.6%
Segment income margin 12.5% 15.8% 19.3% 19.3% 18.6% 15.5%
Segment assets 57,798 68,686 79,147 92,440 90,734
Depreciation 3,526 3,221 2,241 3,894 5,220
* Changes or CAGR in the numerical target for FY2019 are versus FY2016.
Manufacturing and sales of electronic functional materials and high purity chemicals
Material Business
32 TOKYO OHKA KOGYO CO., LTD.
TOK Advanced Materials Co., Ltd.
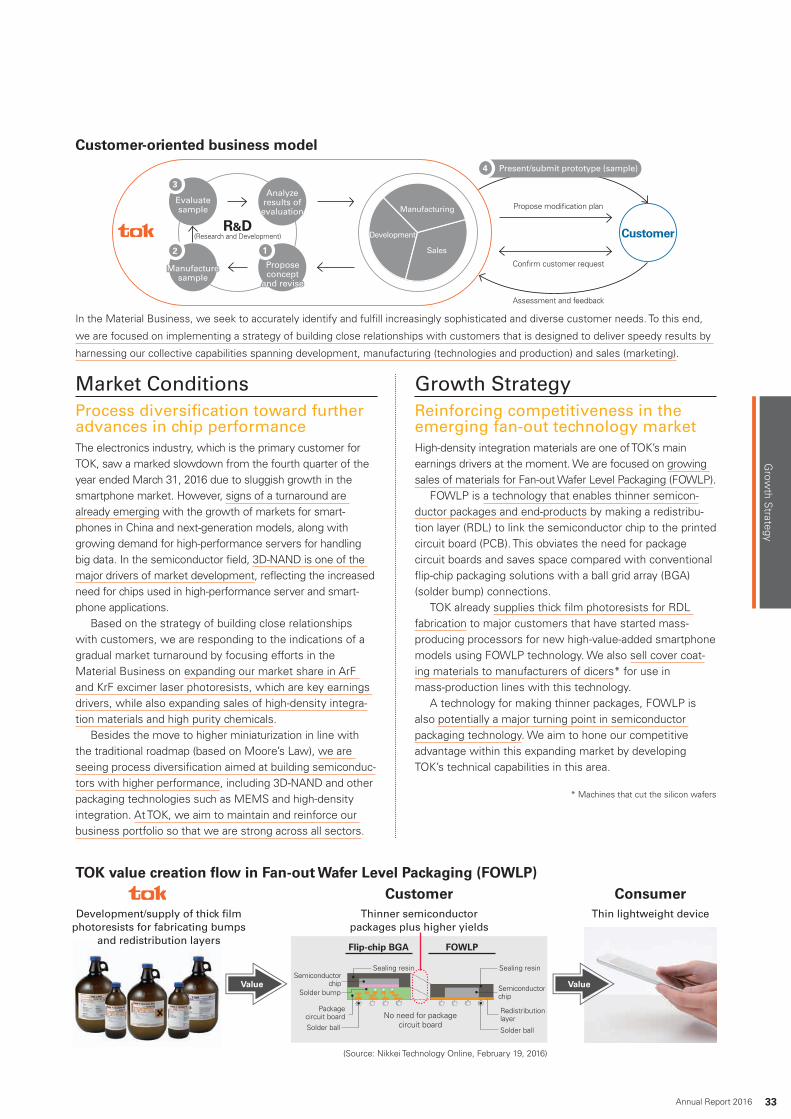
Solder ball
Solder bump
Redistribution layer
Solder ball
Packagecircuit board
Sealing resinSealing resin
Flip-chip BGA FOWLP
No need for package circuit board
Semiconductor chip
Semiconductor chip
Market ConditionsProcess diversification toward further advances in chip performanceThe electronics industry, which is the primary customer for TOK, saw a marked slowdown from the fourth quarter of the year ended March 31, 2016 due to sluggish growth in the smartphone market. However, signs of a turnaround are already emerging with the growth of markets for smart-phones in China and next-generation models, along with growing demand for high-performance servers for handling big data. In the semiconductor field, 3D-NAND is one of the major drivers of market development, reflecting the increased need for chips used in high-performance server and smart-phone applications.
Based on the strategy of building close relationships with customers, we are responding to the indications of a gradual market turnaround by focusing efforts in the Material Business on expanding our market share in ArF and KrF excimer laser photoresists, which are key earnings drivers, while also expanding sales of high-density integra-tion materials and high purity chemicals.
Besides the move to higher miniaturization in line with the traditional roadmap (based on Moore’s Law), we are seeing process diversification aimed at building semiconduc-tors with higher performance, including 3D-NAND and other packaging technologies such as MEMS and high-density integration. At TOK, we aim to maintain and reinforce our business portfolio so that we are strong across all sectors.
Growth StrategyReinforcing competitiveness in the emerging fan-out technology marketHigh-density integration materials are one of TOK’s main earnings drivers at the moment. We are focused on growing sales of materials for Fan-out Wafer Level Packaging (FOWLP).
FOWLP is a technology that enables thinner semicon-ductor packages and end-products by making a redistribu-tion layer (RDL) to link the semiconductor chip to the printed circuit board (PCB). This obviates the need for package circuit boards and saves space compared with conventional flip-chip packaging solutions with a ball grid array (BGA) (solder bump) connections.
TOK already supplies thick film photoresists for RDL fabrication to major customers that have started mass- producing processors for new high-value-added smartphone models using FOWLP technology. We also sell cover coat-ing materials to manufacturers of dicers* for use in mass-production lines with this technology.
A technology for making thinner packages, FOWLP is also potentially a major turning point in semiconductor packaging technology. We aim to hone our competitive advantage within this expanding market by developing TOK’s technical capabilities in this area.
* Machines that cut the silicon wafers
In the Material Business, we seek to accurately identify and fulfill increasingly sophisticated and diverse customer needs. To this end,
we are focused on implementing a strategy of building close relationships with customers that is designed to deliver speedy results by
harnessing our collective capabilities spanning development, manufacturing (technologies and production) and sales (marketing).
Manufacturing
Development
Sales
R&D(Research and Development)
Confirm customer request
Propose modification plan
Assessment and feedback
12
3
Evaluate sample
Analyze results of
evaluation
Propose concept
and revise
Manufacture sample
TOK value creation flow in Fan-out Wafer Level Packaging (FOWLP)
Customer-oriented business model
Customer Consumer
Value Value
4 Present/submit prototype (sample)
(Source: Nikkei Technology Online, February 19, 2016)
Customer
33Annual Report 2016
Grow
th Strategy
Development/supply of thick film photoresists for fabricating bumps
and redistribution layers
Thinner semiconductor packages plus higher yields
Thin lightweight device

S WSWOT Analysis of
the Material Business
O T
■ Multiple earnings drivers (ArF and KrF excimer laser photoresists, high-density integration materials, high purity chemicals)
■ Global structure of close relationships with customers (South Korea, Taiwan, North America, Japan)
■ Ability to develop microprocessing technologies (photosensitive materials, films, coatings)
■ High-purity chemicals technology/expertise, quality design capabilities
■ The emergence of single-firm-based roadmaps has diversified miniaturization. It also creates rising demand for new packaging technology
■ Technology prospects in the IoT field■ Growth of China’s semiconductor market
■ Fewer customers, with the same number of photo-resist manufacturers
■ Over-concentration of business domains in the electronics industry (lack of presence in growth sectors such as life sciences)
■ Resistance to price hikes based on industry busi-ness practices
■ Rising cost of development due to increasing technological difficulties
■ Fewer customers due to industry consolidation■ Increased investment outlays for inspection and
production equipment in connection with ultra-high purification
■ Higher costs of next-generation exposure equipment
Common strategy based on value creation using three vectorsOur common strategy for strengthening the earnings
drivers in the Material Business focuses on adding value
via the three vectors of “advancing” (ultra- miniaturization
and ultra-thick film for cutting-edge products), “honing”
(increasing the grade of ultra-high purification of existing
products) and “control” (integration of TOK’s global
network).
In “advancing” and “honing,” we must rapidly estab-
lish better mass-production technologies for higher
yields using an open innovation approach ( See Special
Feature on pages 44–47). In “control,” we are concen-
trating on “xECM” activities to reinforce cooperation and
synergies among TOK’s sites around the world.
xECM activities for reinforcement of business links“xECM” (Enhancement Chain Management) refers to
efforts for horizontal expansion of business reinforce-
ment by designating multiple “x” as themes.
For example, in Quality ECM (QECM), we share infor-
mation across the entire supply chain, including raw
materials suppliers, so all players thoroughly and mutually
understand customer requirements and we can realize
quality, cost, and production design demands quickly.
Under the TOK Medium-Term Plan 2018, we plan to
expand the “x” themes sequentially from quality, produc-
tion technology, and purchasing. This will help us to
accelerate the reinforcement of business links across the
TOK Group.
Earnings driverWorldwide Share of Immersion ArF Excimer Laser Photoresists and KrF Excimer Laser Photoresists
(2015 sales volume)
Production system geared to ensure the “highest quality”
KrF excimer laser photoresistsImmersion ArF excimer laser photoresists
(Source: Overview of Photo-Functional Material and Product Market 2016/Fuji Keizai)
Proposed improvements leverage manufacturing technology to increase production ef�ciency while maintaining high quality.
Product manufacturing
Inspection Quality assurance (QA)
Development
Sales
Collaboration with development, etc. enables upgrading products to increase customer satisfaction and continuously supplying high-quality products.
Inspection from structural analysis, measurement of physical properties and trace metals, etc. are conducted to maintain high product quality.
Identify exactly the “highest quality” required by customers through dialogue. Collaboration with manufacturing technology, plants, inspection, development and other internal functions ensures the products meet high QA standards demanded by customers.
Manufacturing technologies
Plants
Customer
Review of Operations
TOK21.2%
Company A23.8%
Company B23.2%
Company C18.5%
Company D7.9%
Company E4.0%
Others1.3%
TOK28.7%
Company A19.1%Company B
16.5%
Company C13.9%
Company D7.8%
Company E7.0%
Others7.0%
Strengths
Opportunities
Weaknesses
Threats
34 TOKYO OHKA KOGYO CO., LTD.
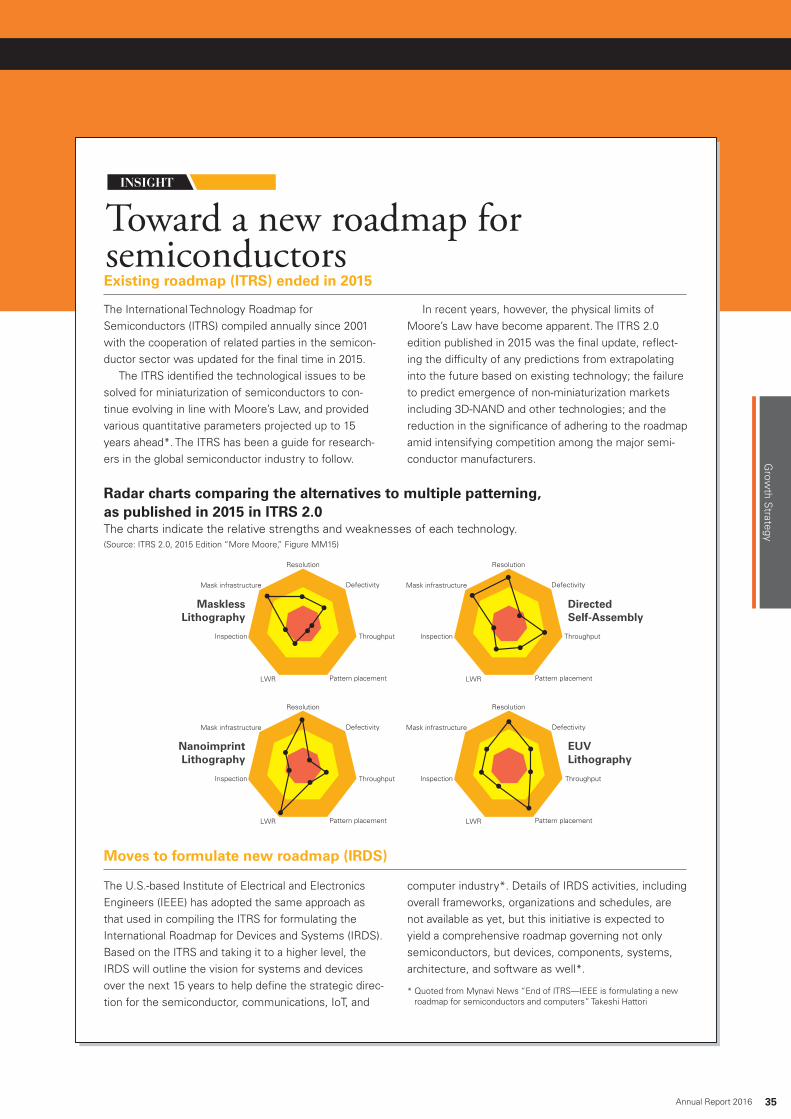
Radar charts comparing the alternatives to multiple patterning, as published in 2015 in ITRS 2.0
Toward a new roadmap for semiconductors
INSIGHT
Existing roadmap (ITRS) ended in 2015
Moves to formulate new roadmap (IRDS)
The International Technology Roadmap for Semiconductors (ITRS) compiled annually since 2001 with the cooperation of related parties in the semicon-ductor sector was updated for the final time in 2015.
The ITRS identified the technological issues to be solved for miniaturization of semiconductors to con-tinue evolving in line with Moore’s Law, and provided various quantitative parameters projected up to 15 years ahead*. The ITRS has been a guide for research-ers in the global semiconductor industry to follow.
In recent years, however, the physical limits of Moore’s Law have become apparent. The ITRS 2.0 edition published in 2015 was the final update, reflect-ing the difficulty of any predictions from extrapolating into the future based on existing technology; the failure to predict emergence of non-miniaturization markets including 3D-NAND and other technologies; and the reduction in the significance of adhering to the roadmap amid intensifying competition among the major semi-conductor manufacturers.
The U.S.-based Institute of Electrical and Electronics Engineers (IEEE) has adopted the same approach as that used in compiling the ITRS for formulating the International Roadmap for Devices and Systems (IRDS). Based on the ITRS and taking it to a higher level, the IRDS will outline the vision for systems and devices over the next 15 years to help define the strategic direc-tion for the semiconductor, communications, IoT, and
computer industry*. Details of IRDS activities, including overall frameworks, organizations and schedules, are not available as yet, but this initiative is expected to yield a comprehensive roadmap governing not only semiconductors, but devices, components, systems, architecture, and software as well*.
* Quoted from Mynavi News “End of ITRS—IEEE is formulating a new roadmap for semiconductors and computers” Takeshi Hattori
The charts indicate the relative strengths and weaknesses of each technology.(Source: ITRS 2.0, 2015 Edition “More Moore,” Figure MM15)
MasklessLithography
Defectivity
Throughput
Pattern placementLWR
Inspection
Mask infrastructure
Resolution
EUV Lithography
Directed Self-Assembly
NanoimprintLithography
Defectivity
Throughput
Pattern placementLWR
Inspection
Mask infrastructure
Resolution
Defectivity
Throughput
Pattern placementLWR
Inspection
Mask infrastructure
Resolution
Defectivity
Throughput
Pattern placementLWR
Inspection
Mask infrastructure
Resolution
35Annual Report 2016
Grow
th Strategy
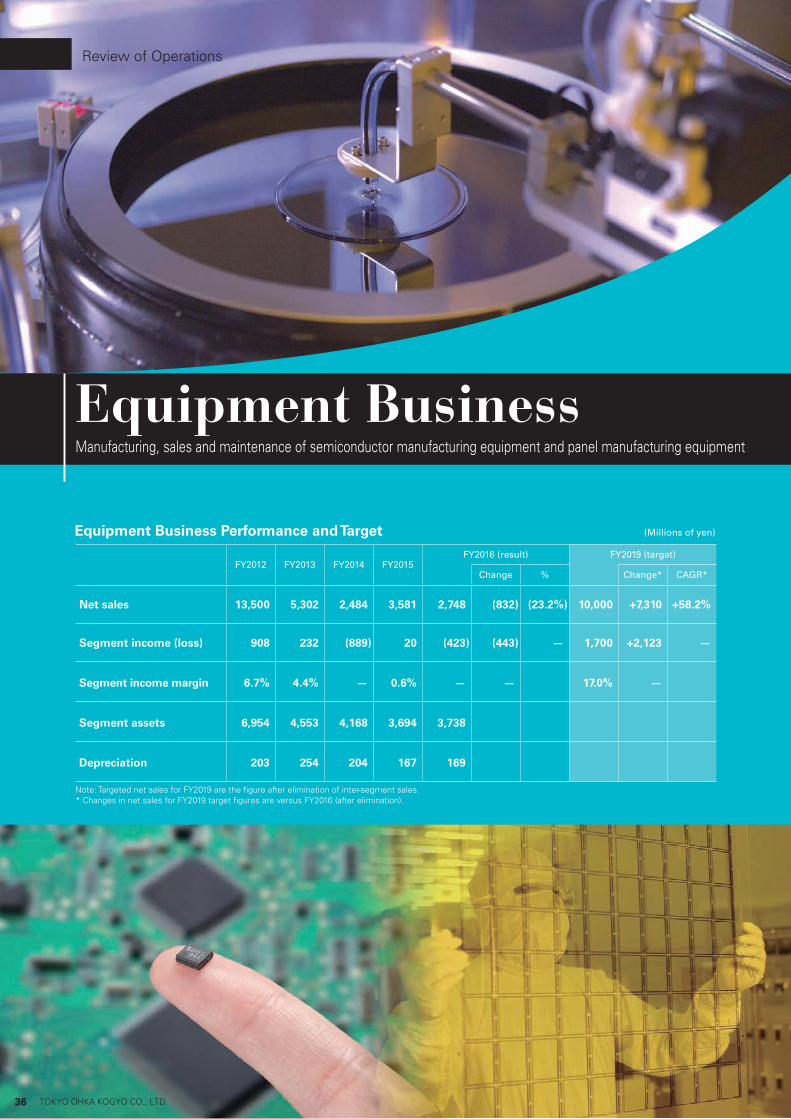
Review of Operations
Manufacturing, sales and maintenance of semiconductor manufacturing equipment and panel manufacturing equipment
Equipment Business
Note: Targeted net sales for FY2019 are the figure after elimination of inter-segment sales.* Changes in net sales for FY2019 target figures are versus FY2016 (after elimination).
Equipment Business Performance and Target (Millions of yen)
FY2012 FY2013 FY2014 FY2015FY2016 (result) FY2019 (target)
Change % Change* CAGR*
Net sales 13,500 5,302 2,484 3,581 2,748 (832) (23.2%) 10,000 +7,310 +58.2%
Segment income (loss) 908 232 (889) 20 (423) (443) — 1,700 +2,123 —
Segment income margin 6.7% 4.4% — 0.6% — — 17.0% —
Segment assets 6,954 4,553 4,168 3,694 3,738
Depreciation 203 254 204 167 169
36 TOKYO OHKA KOGYO CO., LTD.

We are driving forward our Materials & Equipment (M&E) strategy, which is designed to generate synergies by fostering close coordi-
nation between the Material Business and the Equipment Business in advanced technologies in the semiconductor and panel-related fields.
Outlook for the TSV market (Number of packages)
Strengthening Our Competitive Edge in Both the 2D and 3D Semiconductor Markets
Materials & Equipment (M&E) strategy
Market Conditions3D packaging market ramps upAs the miniaturization of semiconductors under the tradi-tional ITRS roadmap nears its physical limits, the 3D packag-ing market is beginning to expand. 3D-NAND technology, which increases the density per chip by vertically layering semiconductor chips, has already entered the growth phase, and the market for the through-silicon-via (TSV) pro-cess is gradually growing as well. TSV is a multilayering technology that layers thinned semiconductor wafers in 3D, using a through-silicon process to pass between the layers. It provides a number of benefits, including more compact, higher-density semiconductors with reduced power con-sumption, as well as higher signal transmission and pro-cessing speeds, and is one of the most highly anticipated areas of multilayering technology.
In addition to their applications in image sensors, cloud servers and high-end computer graphics, semiconductors using 3D packaging through TSV are also expected to find use in smartphones and tablet devices, where demands for reduction in size and weight are stringent.
Cost reduction measures implemented have started to chip away at the high cost structure that had impeded sales in the past. Therefore, TOK’s strategy of building close rela-tionships with customers will be fully brought to bear to expand sales in this field.
Growth StrategyFocusing resources on three equipment fieldsBecause TOK fixed on the 3D packaging and display manu-facturing fields from an early stage, and focused on R&D in those areas, we have accumulated a large number of tech-nology advantages. To fully exploit those advantages, the TOK Medium-Term Plan 2018 calls for resources to be con-centrated in three fields: TSV equipment, UV* curing machines, and next-generation flexible display manufactur-ing equipment.
In TSV equipment, we will focus on expanding sales of our Zero Newton wafer handling system, which offers sig-nificant streamlining of the carrier circuit board bonding/debonding process and high cost performance, to semicon-ductor manufacturers in Asia, Japan and the U.S., along with related process materials.
37Annual Report 2016
Grow
th Strategy
Zero Newton bonding machines TWM series
*Ultra Violet
Zero Newton debonding machines TWR series
Materials Equipment
Sales volume (Thousands of units)
2019 (forecast)2018 (forecast)2017 (forecast)2016 (forecast)2015 (estimate)2014 (result)2013 (result)
400,000
300,000
200,000
100,000
0 (Years)
(Source: Status and Outlook for Semiconductor Materials Market 2015/Fuji Keizai)
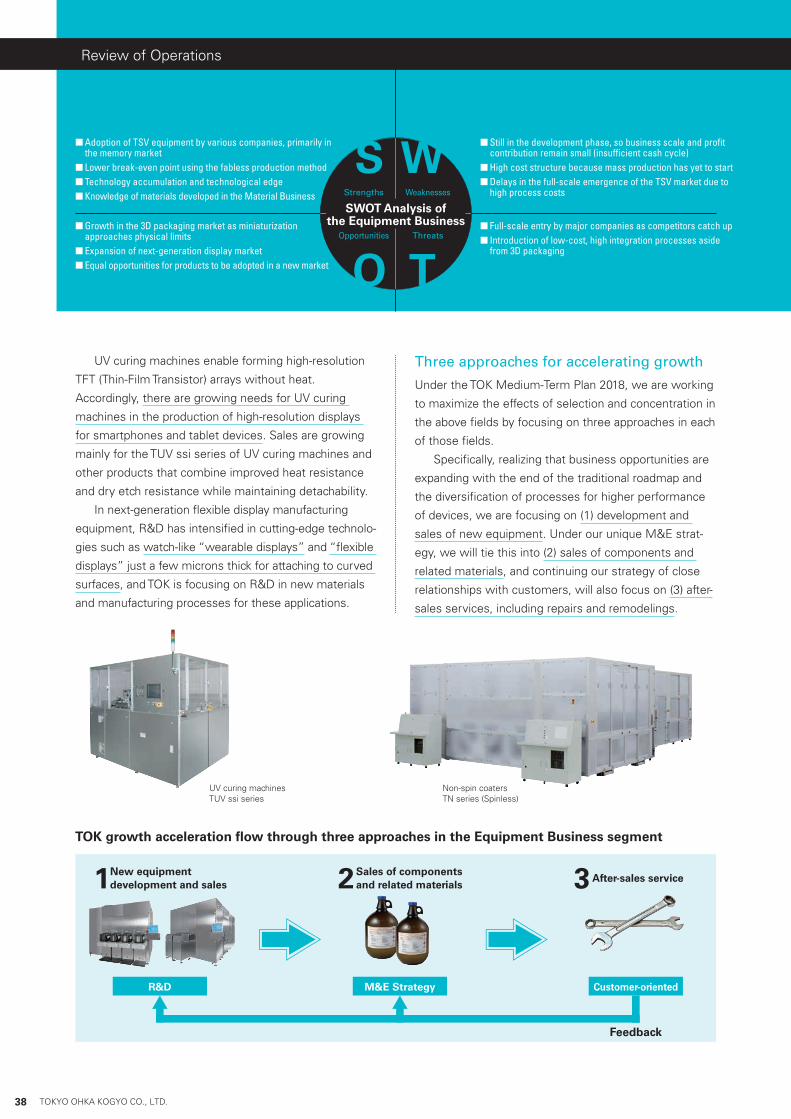
S WSWOT Analysis of
the Equipment Business
Strengths
Opportunities
Weaknesses
Threats
O T
■ Adoption of TSV equipment by various companies, primarily in the memory market ■ Lower break-even point using the fabless production method ■ Technology accumulation and technological edge ■ Knowledge of materials developed in the Material Business
■ Growth in the 3D packaging market as miniaturization approaches physical limits ■ Expansion of next-generation display market ■ Equal opportunities for products to be adopted in a new market
■ Still in the development phase, so business scale and profit contribution remain small (insufficient cash cycle) ■ High cost structure because mass production has yet to start ■ Delays in the full-scale emergence of the TSV market due to high process costs
■ Full-scale entry by major companies as competitors catch up ■ Introduction of low-cost, high integration processes aside from 3D packaging
TOK growth acceleration flow through three approaches in the Equipment Business segment
Review of Operations
UV curing machines enable forming high-resolution
TFT (Thin-Film Transistor) arrays without heat.
Accordingly, there are growing needs for UV curing
machines in the production of high-resolution displays
for smartphones and tablet devices. Sales are growing
mainly for the TUV ssi series of UV curing machines and
other products that combine improved heat resistance
and dry etch resistance while maintaining detachability.
In next-generation flexible display manufacturing
equipment, R&D has intensified in cutting-edge technolo-
gies such as watch-like “wearable displays” and “flexible
displays” just a few microns thick for attaching to curved
surfaces, and TOK is focusing on R&D in new materials
and manufacturing processes for these applications.
Three approaches for accelerating growth
Under the TOK Medium-Term Plan 2018, we are working
to maximize the effects of selection and concentration in
the above fields by focusing on three approaches in each
of those fields.
Specifically, realizing that business opportunities are
expanding with the end of the traditional roadmap and
the diversification of processes for higher performance
of devices, we are focusing on (1) development and
sales of new equipment. Under our unique M&E strat-
egy, we will tie this into (2) sales of components and
related materials, and continuing our strategy of close
relationships with customers, will also focus on (3) after-
sales services, including repairs and remodelings.
38 TOKYO OHKA KOGYO CO., LTD.
UV curing machinesTUV ssi series
Non-spin coatersTN series (Spinless)
Feedback
1 New equipment development and sales 2 Sales of components
and related materials 3 After-sales service
R&D M&E Strategy Customer-oriented

Bonding wire
Organic circuit board
Microbumps
TSV
Organic circuit board
Wide I/O structure using TSV
Structure of a layered memory chip using the traditional method
Structure of HBMs using TSV
Continually evolving TSV technologyINSIGHT
Wide I/O Memory for use in mobile devices
Wide I/O Memory is a semiconductor device that increases signal transmission bus width and provides the acceleration and low power consumption perfor-mance required by smartphones and tablet devices, as they increasingly handle video and graphics and offer higher definition screen resolution. As shown on the upper right, this type of memory is characterized by the use of TSV to pierce multi-layering memories and processors, and is expected to find significant demand for use in smartphones, tablets and other mobile devices. Semiconductor manufacturers across the globe are working to develop this technology.
(Source: Technical Reports (BUSICOM POST/ Gicho Business Communications, Inc.)
High Bandwidth Memory (HBM) for use in cloud servers
While Wide I/O Memory focuses on low power con-sumption for use in mobile devices and a layered structure that is literally “3D,” High Bandwidth Memory (HBM), another type that uses TSV technol-ogy, is compatible with a wide memory range for high-performance computers, and is characterized by layering that is closer to 2.5D than 3D.
This type of memory has now evolved into HBM2, which, compared to HBM, offers greater speed and lower power consumption, and also fea-tures an increased number of chip layers and the ability to easily expand capacity. Compared to HBM, with applications for computer graphics and cloud servers, HBM2, which offers advances in speed and lower power consumption, is also being considered for future use in mobile devices, similar to Wide I/O Memory.
Semiconductor devices using TSV technology, including sensors, high-end GPUs and CPUs, and servers, are now under mass-production. We have got orders for TSV equipment for 2.5D and sensors.
In the accelerating trend toward IoT, faster data processing is indispensable. It requires higher transmission speed for networks that govern the Internet in addition to improving the performance of servers, PCs and smartphones. Accordingly, demand for highly integrated and miniaturized semiconductors using TSV technology is increasing. TOK is working to expand shares in various applications using TSV.
Evolution to HBM2
TSV
Memory
ProcessorOrganic circuit board
39Annual Report 2016
Grow
th Strategy
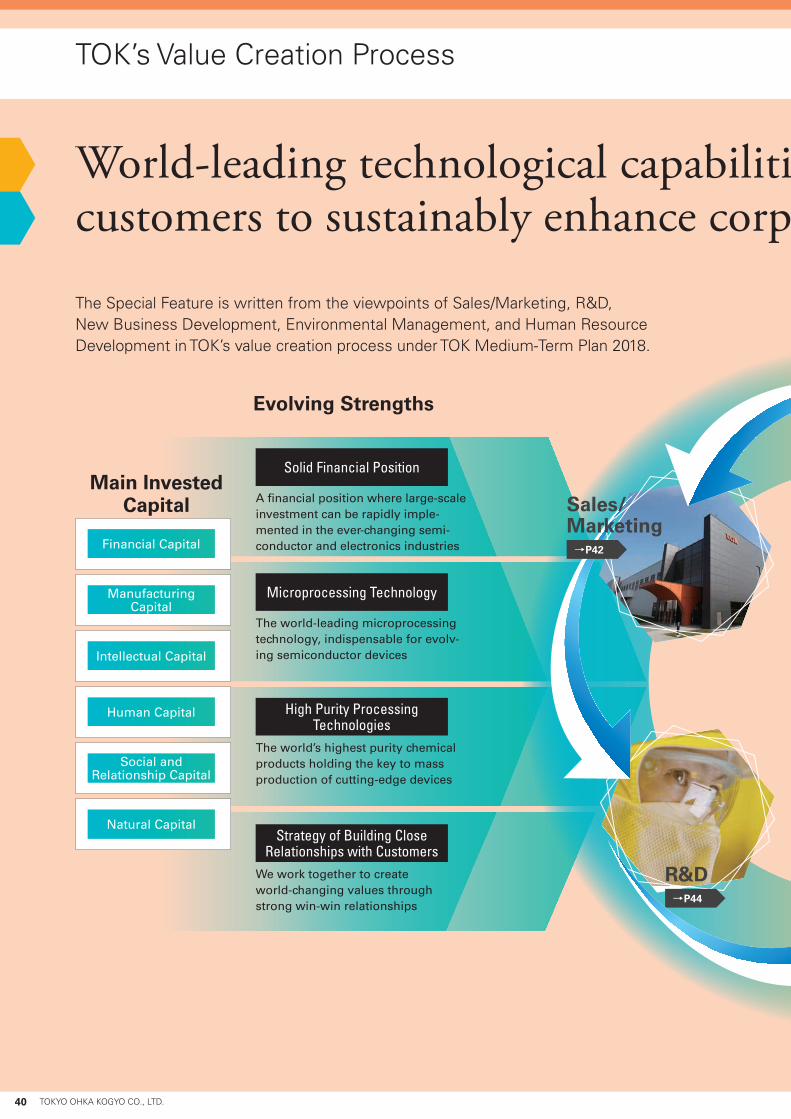
TOK’s Value Creation Process
Evolving Strengths
World-leading technological capabilities and close relationships with customers to sustainably enhance corporate value
Solid Financial Position
The Special Feature is written from the viewpoints of Sales/Marketing, R&D, New Business Development, Environmental Management, and Human Resource Development in TOK’s value creation process under TOK Medium-Term Plan 2018.
A financial position where large-scale investment can be rapidly imple-mented in the ever-changing semi-conductor and electronics industries
The world-leading microprocessing technology, indispensable for evolv-ing semiconductor devices
The world’s highest purity chemical products holding the key to mass production of cutting-edge devices
We work together to create world-changing values through strong win-win relationships
Microprocessing Technology
High Purity Processing Technologies
Strategy of Building Close Relationships with Customers
→P44
→P42
Enhance sustainable
corporate value
R&D
Sales/Marketing
Main Invested Capital
Financial Capital
Intellectual Capital
Social and Relationship Capital
Manufacturing Capital
Human Capital
Natural Capital
40 TOKYO OHKA KOGYO CO., LTD.
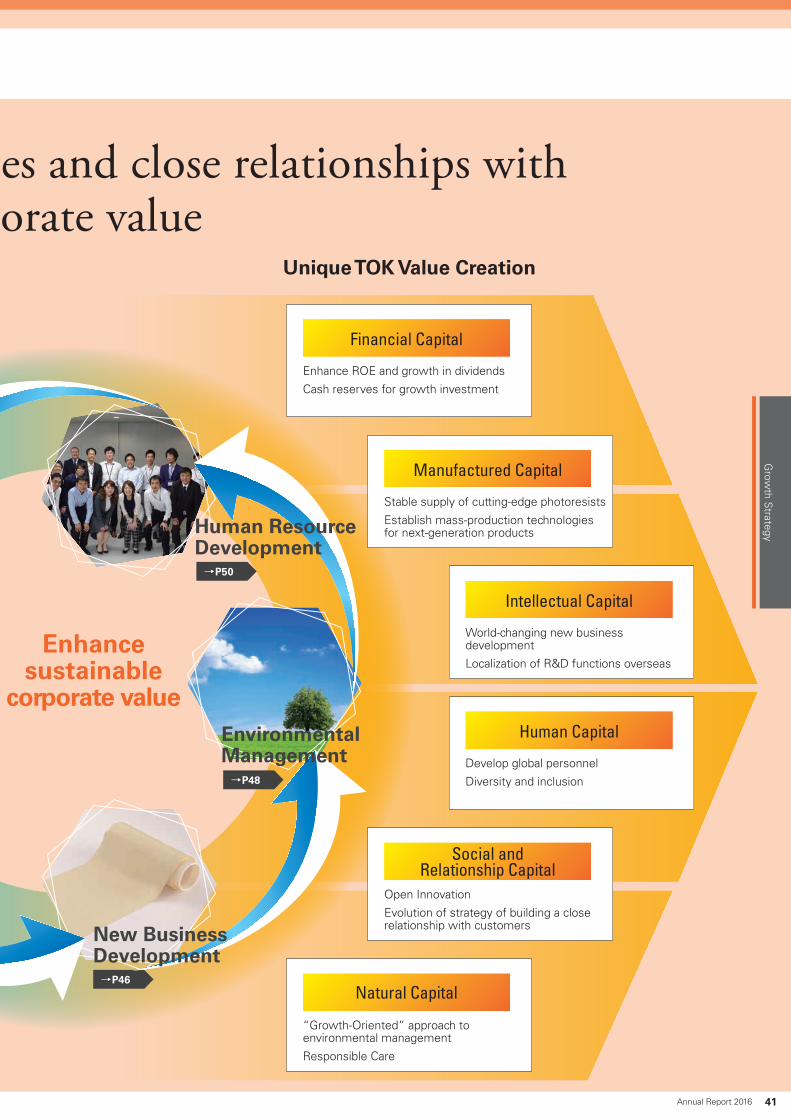
Unique TOK Value Creation
World-leading technological capabilities and close relationships with customers to sustainably enhance corporate value
Intellectual Capital
World-changing new business development
Localization of R&D functions overseas
Human Capital
Develop global personnel
Diversity and inclusion
Financial Capital
Enhance ROE and growth in dividends
Cash reserves for growth investment
Natural Capital
“Growth-Oriented” approach to environmental management
Responsible Care
→P50
→P46
Enhance sustainable
corporate value
Human Resource Development
New Business Development
Environmental Management→P48
Manufactured Capital
Stable supply of cutting-edge photoresists
Establish mass-production technologies for next-generation products
Social and Relationship Capital
Open Innovation
Evolution of strategy of building a close relationship with customers
41Annual Report 2016
Grow
th Strategy
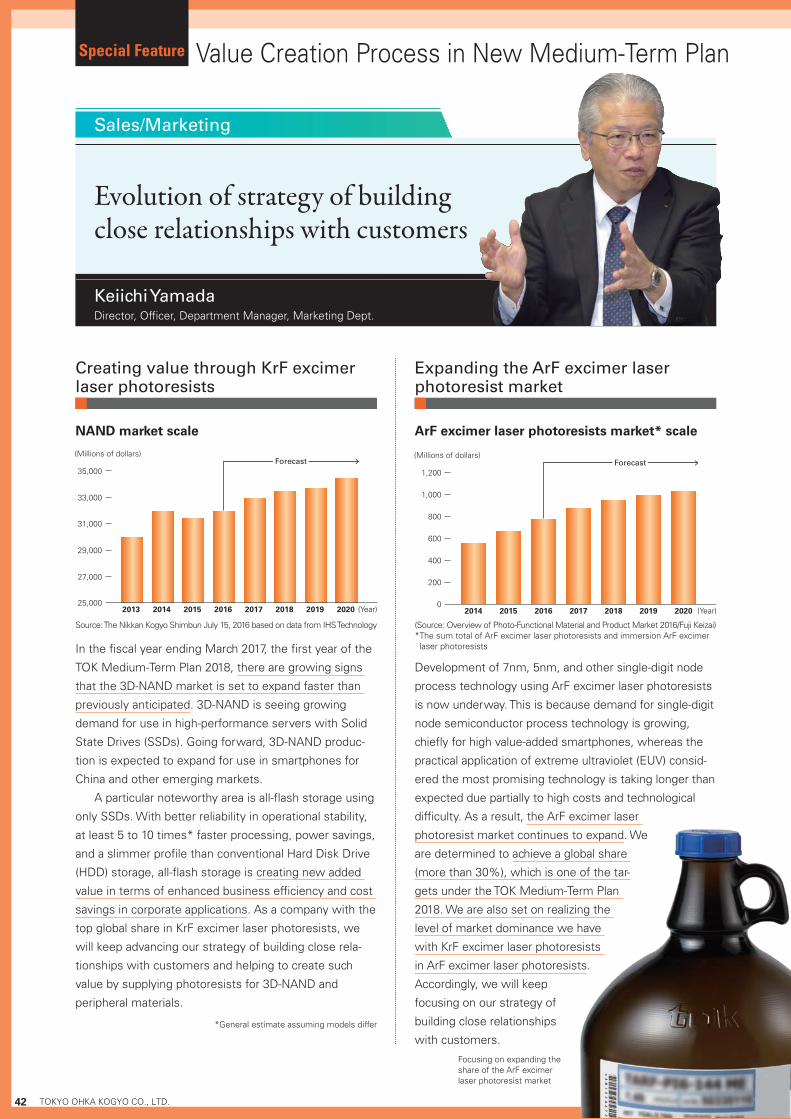
Creating value through KrF excimer laser photoresists
In the fiscal year ending March 2017, the first year of the
TOK Medium-Term Plan 2018, there are growing signs
that the 3D-NAND market is set to expand faster than
previously anticipated. 3D-NAND is seeing growing
demand for use in high-performance servers with Solid
State Drives (SSDs). Going forward, 3D-NAND produc-
tion is expected to expand for use in smartphones for
China and other emerging markets.
A particular noteworthy area is all-flash storage using
only SSDs. With better reliability in operational stability,
at least 5 to 10 times* faster processing, power savings,
and a slimmer profile than conventional Hard Disk Drive
(HDD) storage, all-flash storage is creating new added
value in terms of enhanced business efficiency and cost
savings in corporate applications. As a company with the
top global share in KrF excimer laser photoresists, we
will keep advancing our strategy of building close rela-
tionships with customers and helping to create such
value by supplying photoresists for 3D-NAND and
peripheral materials.
*General estimate assuming models differ
(Millions of dollars)
(Year)20202019201820172016201520142013
35,000
33,000
31,000
29,000
27,000
25,000
ForecastForecast
NAND market scale
Source: The Nikkan Kogyo Shimbun July 15, 2016 based on data from IHS Technology
Evolution of strategy of building close relationships with customers
Keiichi YamadaDirector, Officer, Department Manager, Marketing Dept.
Value Creation Process in New Medium-Term Plan
Sales/Marketing
Expanding the ArF excimer laser photoresist market
Development of 7nm, 5nm, and other single-digit node
process technology using ArF excimer laser photoresists
is now underway. This is because demand for single-digit
node semiconductor process technology is growing,
chiefly for high value-added smartphones, whereas the
practical application of extreme ultraviolet (EUV) consid-
ered the most promising technology is taking longer than
expected due partially to high costs and technological
difficulty. As a result, the ArF excimer laser
photoresist market continues to expand. We
are determined to achieve a global share
(more than 30%), which is one of the tar-
gets under the TOK Medium-Term Plan
2018. We are also set on realizing the
level of market dominance we have
with KrF excimer laser photoresists
in ArF excimer laser photoresists.
Accordingly, we will keep
focusing on our strategy of
building close relationships
with customers.
ArF excimer laser photoresists market* scale
2020201920182017201620152014
1,200
1,000
800
600
400
200
0
(Millions of dollars)
(Year)
ForecastForecast
(Source: Overview of Photo-Functional Material and Product Market 2016/Fuji Keizai)* The sum total of ArF excimer laser photoresists and immersion ArF excimer laser photoresists
Focusing on expanding the share of the ArF excimer laser photoresist market
42 TOKYO OHKA KOGYO CO., LTD.
Special Feature

A base for building close relationships with customers in Taiwan (TOK TAIWAN CO., LTD. Tongluo Plant)
Competition without a roadmap to escalate
Major semiconductor manufacturers are concentrating
on development at the cutting-edge miniaturization level
of 10nm and smaller. The level of technical difficulty
therein is growing quadratically and development costs
are rising in a similar fashion. And even when develop-
ment itself succeeds, tough mass-production technol-
ogy obstacles are hindering progress towards a real
changeover to the next generation. Updates to the
International Technology Roadmap for Semiconductors
(ITRS), which has served as a guideline for miniaturiza-
tion competition, have also ended with 5nm as the final
generation. While the search for the next roadmap has
begun, semiconductor manufacturers are accelerating
development based on their respective visions, and
competition without a roadmap is likely to escalate for
the foreseeable future. (→ See INSIGHT on page 35)
Uncovering business seeds ahead of customers
As the history of the electronics industry shows, there is
always a period of turmoil before technological break-
throughs give rise to new industry standards. Especially
since it is now such a period, we will evolve our strategy
to build close relationships with customers to pave a solid
path for growth via the next technological innovation.
As the first step therein, we will work harder to
uncover business seeds ahead of customers. For
instance, we grew sales of high purity chemicals by
about 1.5 times over the three years of our previous
medium-term plan. The spark for that growth did not
originate in customer requirements. Rather, it stemmed
from an in-house project aiming to make products
defect-free, which brought attention to the added value
created by increasing the purity of products. We then
tied that to customer proposals. In a business environ-
ment lacking a roadmap, it will also become increasingly
important to uncover business seeds from information
and insights gained by means other than contact with
customers. To that end, we set out in the TOK Medium-
Term Plan 2018 to build a value creation chain seam-
lessly linking parties such as business partners,
various research institutions, and venture com-
panies and evolve our strategy of building close
relationships with customers.
Domains peripheral to miniaturization are key
Another key for evolving our strategy of building close
relationships with customers is domains peripheral to
miniaturization. High-density integration materials (bump
photoresists for thick-film forming) developed for semicon-
ductor post-processes are used in areas peripheral to min-
iaturization. We are now seeing strong earnings growth for
such materials led by next-generation smartphone applica-
tions. By further bolstering our strengths in such areas
peripheral to miniaturization, we will build a business port-
folio that can seize earnings opportunities even in business
climates where there is poor visibility on market trends.
Global network evolution
A third key for advancing our strategy of building close rela-
tionships with customers is working to evolve our global
networks. In South Korea where we established TOK
Advanced Materials Co., Ltd. (TOKAM) in 2012 and in Taiwan
where we established the Tongluo Plant for TOK TAIWAN CO.,
LTD. (TTW) in 2014, our move to localize development is
already starting to contribute to performance. In other regions
as well, we will work faster to reinforce local functions. In the
United States, we shored up our development functions
focused on high purity chemicals in June 2016. Additionally,
we are enhancing our sales force in China, where significant
growth is expected in the semiconductor industry.
We are also monitoring Europe as one key area for the
future. While the region is small in terms of the production
and consumption markets, it often leads in cutting-edge
fields such as micro electro mechanical systems (MEMS)
and setting the direction for next-generation technologies.
Therefore, we are using the information gained at Tokyo
Ohka Kogyo Europe B.V. (the Netherlands) in develop-
ment in Asia and the United States to bring ties between
regions into full play. By picking up the pace of these
initiatives, we will pool knowledge within the Group to
deliver new value to customers globalizing their supply
chains. (→ See Global Network on page 80)
Bumps formed on an IC chip (solder balls)*IC chip photo is an image.
43Annual Report 2016
Grow
th Strategy
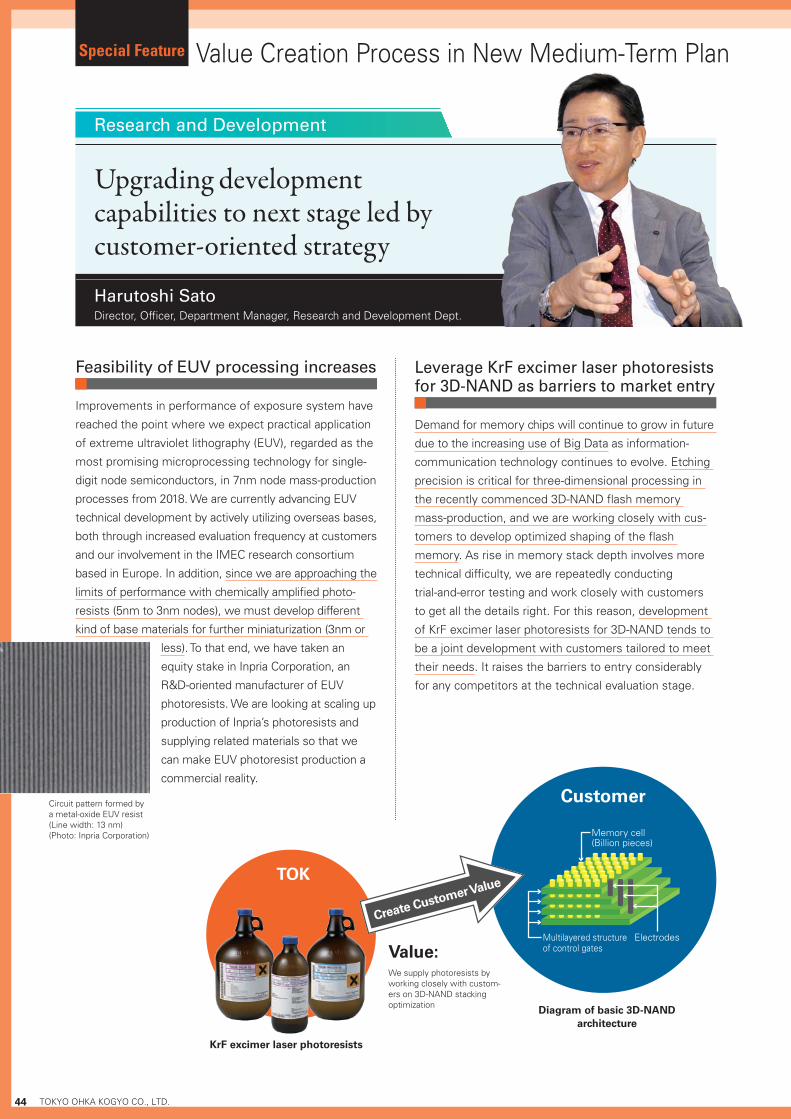
TOK
Value:We supply photoresists by working closely with custom-ers on 3D-NAND stacking optimization
Customer
Create Customer Value
KrF excimer laser photoresists
Diagram of basic 3D-NAND architecture
Harutoshi SatoDirector, Officer, Department Manager, Research and Development Dept.
Value Creation Process in New Medium-Term Plan
Research and Development
Upgrading development capabilities to next stage led by customer-oriented strategy
Feasibility of EUV processing increases
Improvements in performance of exposure system have
reached the point where we expect practical application
of extreme ultraviolet lithography (EUV), regarded as the
most promising microprocessing technology for single -
digit node semiconductors, in 7nm node mass-production
processes from 2018. We are currently advancing EUV
technical development by actively utilizing overseas bases,
both through increased evaluation frequency at customers
and our involvement in the IMEC research consortium
based in Europe. In addition, since we are approaching the
limits of performance with chemically amplified photo-
resists (5nm to 3nm nodes), we must develop different
kind of base materials for further miniaturization (3nm or
less). To that end, we have taken an
equity stake in Inpria Corporation, an
R&D-oriented manufacturer of EUV
photoresists. We are looking at scaling up
production of Inpria’s photoresists and
supplying related materials so that we
can make EUV photoresist production a
commercial reality.
Leverage KrF excimer laser photoresists for 3D-NAND as barriers to market entry
Demand for memory chips will continue to grow in future
due to the increasing use of Big Data as information-
communication technology continues to evolve. Etching
precision is critical for three-dimensional processing in
the recently commenced 3D-NAND flash memory
mass-production, and we are working closely with cus-
tomers to develop optimized shaping of the flash
memory. As rise in memory stack depth involves more
technical difficulty, we are repeatedly conducting
trial-and-error testing and work closely with customers
to get all the details right. For this reason, development
of KrF excimer laser photoresists for 3D-NAND tends to
be a joint development with customers tailored to meet
their needs. It raises the barriers to entry considerably
for any competitors at the technical evaluation stage.
Circuit pattern formed by a metal-oxide EUV resist (Line width: 13 nm) (Photo: Inpria Corporation)
44 TOKYO OHKA KOGYO CO., LTD.
Special Feature
Memory cell(Billion pieces)
ElectrodesMultilayered structure of control gates
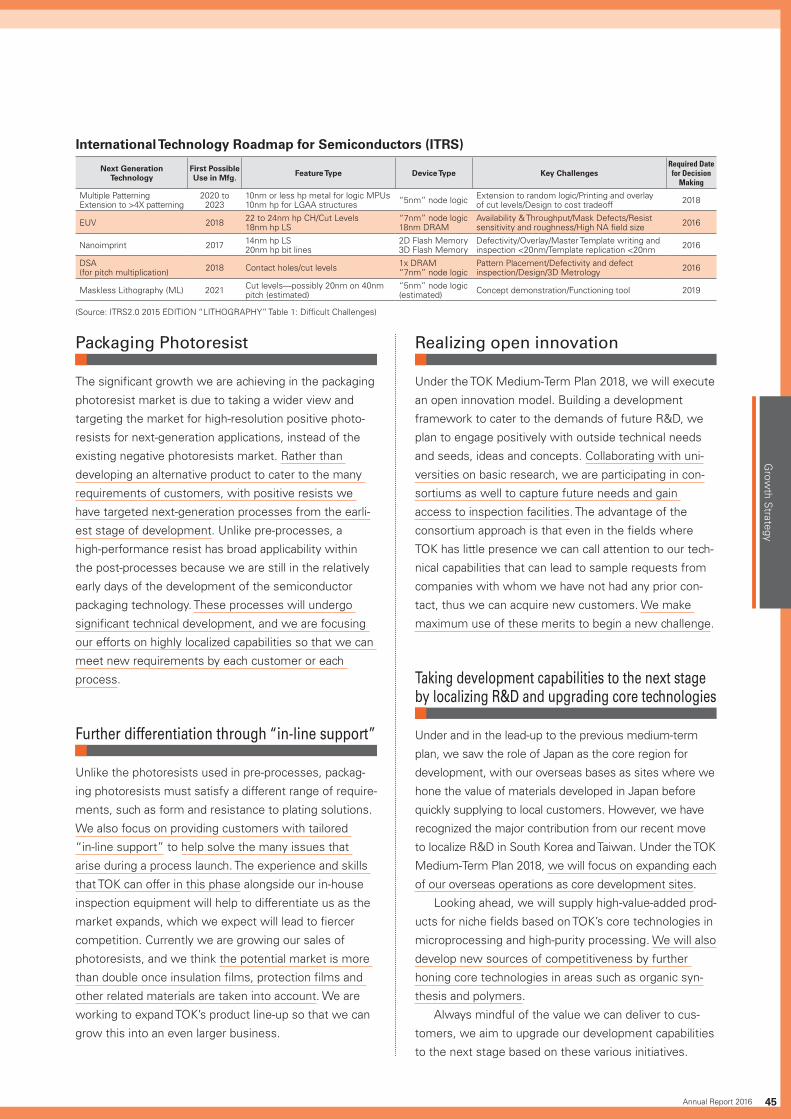
Next Generation Technology
First Possible Use in Mfg. Feature Type Device Type Key Challenges
Required Date for Decision
Making
Multiple Patterning Extension to >4X patterning
2020 to 2023
10nm or less hp metal for logic MPUs10nm hp for LGAA structures “5nm” node logic Extension to random logic/Printing and overlay
of cut levels/Design to cost tradeoff 2018
EUV 2018 22 to 24nm hp CH/Cut Levels18nm hp LS
“7nm” node logic18nm DRAM
Availability & Throughput/Mask Defects/Resist sensitivity and roughness/High NA field size 2016
Nanoimprint 2017 14nm hp LS20nm hp bit lines
2D Flash Memory3D Flash Memory
Defectivity/Overlay/Master Template writing and inspection <20nm/Template replication <20nm 2016
DSA (for pitch multiplication) 2018 Contact holes/cut levels 1x DRAM
“7nm” node logicPattern Placement/Defectivity and defect inspection/Design/3D Metrology 2016
Maskless Lithography (ML) 2021 Cut levels—possibly 20nm on 40nm pitch (estimated)
“5nm” node logic (estimated) Concept demonstration/Functioning tool 2019
International Technology Roadmap for Semiconductors (ITRS)
(Source: ITRS2.0 2015 EDITION “LITHOGRAPHY” Table 1: Difficult Challenges)
Packaging Photoresist
The significant growth we are achieving in the packaging
photoresist market is due to taking a wider view and
targeting the market for high-resolution positive photo-
resists for next-generation applications, instead of the
existing negative photoresists market. Rather than
developing an alternative product to cater to the many
requirements of customers, with positive resists we
have targeted next-generation processes from the earli-
est stage of development. Unlike pre-processes, a
high-performance resist has broad applicability within
the post-processes because we are still in the relatively
early days of the development of the semiconductor
packaging technology. These processes will undergo
significant technical development, and we are focusing
our efforts on highly localized capabilities so that we can
meet new requirements by each customer or each
process.
Further differentiation through “in-line support”
Unlike the photoresists used in pre-processes, packag-
ing photoresists must satisfy a different range of require-
ments, such as form and resistance to plating solutions.
We also focus on providing customers with tailored
“in-line support” to help solve the many issues that
arise during a process launch. The experience and skills
that TOK can offer in this phase alongside our in-house
inspection equipment will help to differentiate us as the
market expands, which we expect will lead to fiercer
competition. Currently we are growing our sales of
photoresists, and we think the potential market is more
than double once insulation films, protection films and
other related materials are taken into account. We are
working to expand TOK’s product line-up so that we can
grow this into an even larger business.
Realizing open innovation
Under the TOK Medium-Term Plan 2018, we will execute
an open innovation model. Building a development
framework to cater to the demands of future R&D, we
plan to engage positively with outside technical needs
and seeds, ideas and concepts. Collaborating with uni-
versities on basic research, we are participating in con-
sortiums as well to capture future needs and gain
access to inspection facilities. The advantage of the
consortium approach is that even in the fields where
TOK has little presence we can call attention to our tech-
nical capabilities that can lead to sample requests from
companies with whom we have not had any prior con-
tact, thus we can acquire new customers. We make
maximum use of these merits to begin a new challenge.
Taking development capabilities to the next stage by localizing R&D and upgrading core technologies
Under and in the lead-up to the previous medium-term
plan, we saw the role of Japan as the core region for
development, with our overseas bases as sites where we
hone the value of materials developed in Japan before
quickly supplying to local customers. However, we have
recognized the major contribution from our recent move
to localize R&D in South Korea and Taiwan. Under the TOK
Medium-Term Plan 2018, we will focus on expanding each
of our overseas operations as core development sites.
Looking ahead, we will supply high-value-added prod-
ucts for niche fields based on TOK’s core technologies in
microprocessing and high-purity processing. We will also
develop new sources of competitiveness by further
honing core technologies in areas such as organic syn-
thesis and polymers.
Always mindful of the value we can deliver to cus-
tomers, we aim to upgrade our development capabilities
to the next stage based on these various initiatives.
45Annual Report 2016
Grow
th Strategy
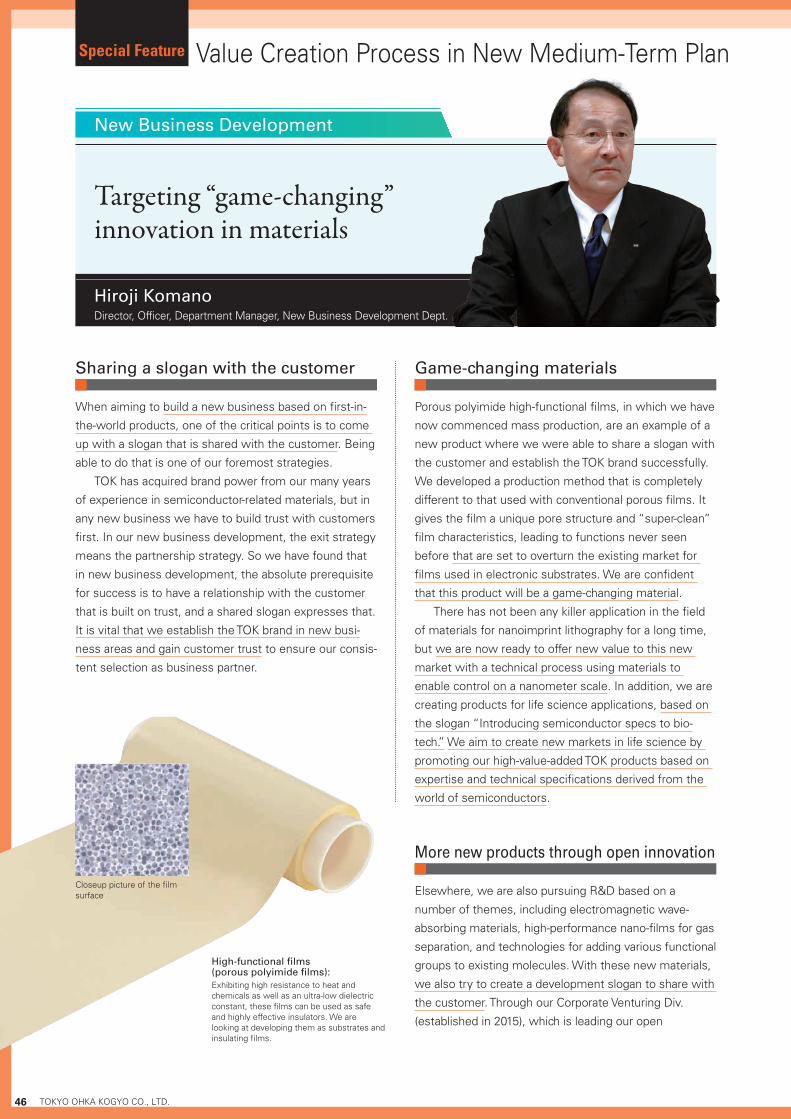
Sharing a slogan with the customer
When aiming to build a new business based on first-in-
the-world products, one of the critical points is to come
up with a slogan that is shared with the customer. Being
able to do that is one of our foremost strategies.
TOK has acquired brand power from our many years
of experience in semiconductor-related materials, but in
any new business we have to build trust with customers
first. In our new business development, the exit strategy
means the partnership strategy. So we have found that
in new business development, the absolute prerequisite
for success is to have a relationship with the customer
that is built on trust, and a shared slogan expresses that.
It is vital that we establish the TOK brand in new busi-
ness areas and gain customer trust to ensure our consis-
tent selection as business partner.
Game-changing materials
Porous polyimide high-functional films, in which we have
now commenced mass production, are an example of a
new product where we were able to share a slogan with
the customer and establish the TOK brand successfully.
We developed a production method that is completely
different to that used with conventional porous films. It
gives the film a unique pore structure and “super-clean”
film characteristics, leading to functions never seen
before that are set to overturn the existing market for
films used in electronic substrates. We are confident
that this product will be a game-changing material.
There has not been any killer application in the field
of materials for nanoimprint lithography for a long time,
but we are now ready to offer new value to this new
market with a technical process using materials to
enable control on a nanometer scale. In addition, we are
creating products for life science applications, based on
the slogan “Introducing semiconductor specs to bio-
tech.” We aim to create new markets in life science by
promoting our high-value-added TOK products based on
expertise and technical specifications derived from the
world of semiconductors.
More new products through open innovation
Elsewhere, we are also pursuing R&D based on a
number of themes, including electromagnetic wave-
absorbing materials, high-performance nano-films for gas
separation, and technologies for adding various functional
groups to existing molecules. With these new materials,
we also try to create a development slogan to share with
the customer. Through our Corporate Venturing Div.
(established in 2015), which is leading our open
High-functional films (porous polyimide films):Exhibiting high resistance to heat and chemicals as well as an ultra-low dielectric constant, these films can be used as safe and highly effective insulators. We are looking at developing them as substrates and insulating films.
Closeup picture of the film surface
Hiroji KomanoDirector, Officer, Department Manager, New Business Development Dept.
Value Creation Process in New Medium-Term Plan
New Business Development
Targeting “game-changing” innovation in materials
46 TOKYO OHKA KOGYO CO., LTD.
Special Feature

innovation drive, we have invested in Inpria Corporation,
a leading maker and developer of EUV photoresists. We
expect adoption of EUV for the next 7 to 5 nm genera-
tion of semiconductor miniaturization. TOK has also taken
an equity stake in a manufacturer of resins, and we are
looking to develop multiple ventures with technical and
financial assistance, notably in the manufacture of quan-
tum dots for next-generation displays.
Lack of roadmap creates business opportunities
The International Technology Roadmap for
Semiconductors (ITRS) has finished at 5nm, leaving
semiconductor manufacturers to plot the future of the
technology without any official guide. The lifeblood of the
semiconductor industry has always been the quest for
higher performance at lower cost, and this will not
change even if we cannot move to larger silicon wafers.
Fundamentally, making semiconductor chips smaller via
microprocessing technology is the only realistic option
for reducing costs. (→ See INSIGHT on page 35)
Semiconductors’ higher-performance is partially
achieved through post-process technological innovations
such as 3D and TSV structures, currently under
mass-production. However, we conclude from our cus-
tomers’ demand that further miniaturization of IC chips is
necessary to reduce costs. New processes and materi-
als need to be developed to realize necessary improve-
ments in yields. In turn, this will generate a range of new
business opportunities for TOK based on our core techni-
cal expertise in photoresists and other semiconductor-
related materials.
Nano-films, the thinnest films imaginable:High-functional materials of organic, inorganic and composite can be used to create the thinnest films imaginable, with potential applications in gas separa-tion, air filters, and other areas
Less than 100nm thick (less than 1/1,000th that of a strand of hair)
Creating a world nobody has ever seen
Microprocessing below 10nm has created issues in
semiconductor production processes that were not
anticipated. For instance, the formation method of the
insulation films is shifting from wet coating to a vacuum
process. Less than 10nm, however, the small target
dimension makes processes under vacuum impractica-
ble, and wet coating is still being applied in this sector.
Therefore, there is a need for next-generation coating
technologies that can achieve single nanometer control,
and this provides a business opportunity. Another chal-
lenge in this area is how to control the product quality to
keep contamination due to metallic impurities down to
the level of parts-per-quadrillion (ppq: 1ppq is one part
per thousand trillion).
Finding solutions for problems in areas nobody has
ever seen is not something we can hope to do on our
own. Our strategy must be based on a team that
includes manufacturers of materials, equipment, and
semiconductors to tackle these issues collectively. In a
world with no roadmap, our aim is to build up the nec-
essary technical expertise in new areas so TOK can be
selected as a valuable partner in these teams of solu-
tion providers.
Teamwork to overcome technical hurdles
Looking ahead, semiconductor usage is set to rise dra-
matically not only in high-performance chips, but also in
many IoT applications. We see the semiconductor
market continuing to expand steadily, and we are confi-
dent our core expertise in microprocessing, high-purity
chemicals and process solutions will still be required
across a wide range of industries. Manufacturing is in
the DNA of TOK, which has always sought to create
first-in-the-world products to dominate market niches
based on an internal culture of vigorous debate irrespec-
tive of role or years of service. We have inherited a heri-
tage of working together, doing something firstly to try
to change the world, and I think this is one of the major
strengths of R&D at TOK.
Maximizing these strengths and building strong part-
nerships with our customers, business partners, and
public institutions are the keys to success in new busi-
ness development. TOK will continue to thrive commer-
cially through such integrated capabilities.
47Annual Report 2016
Grow
th Strategy
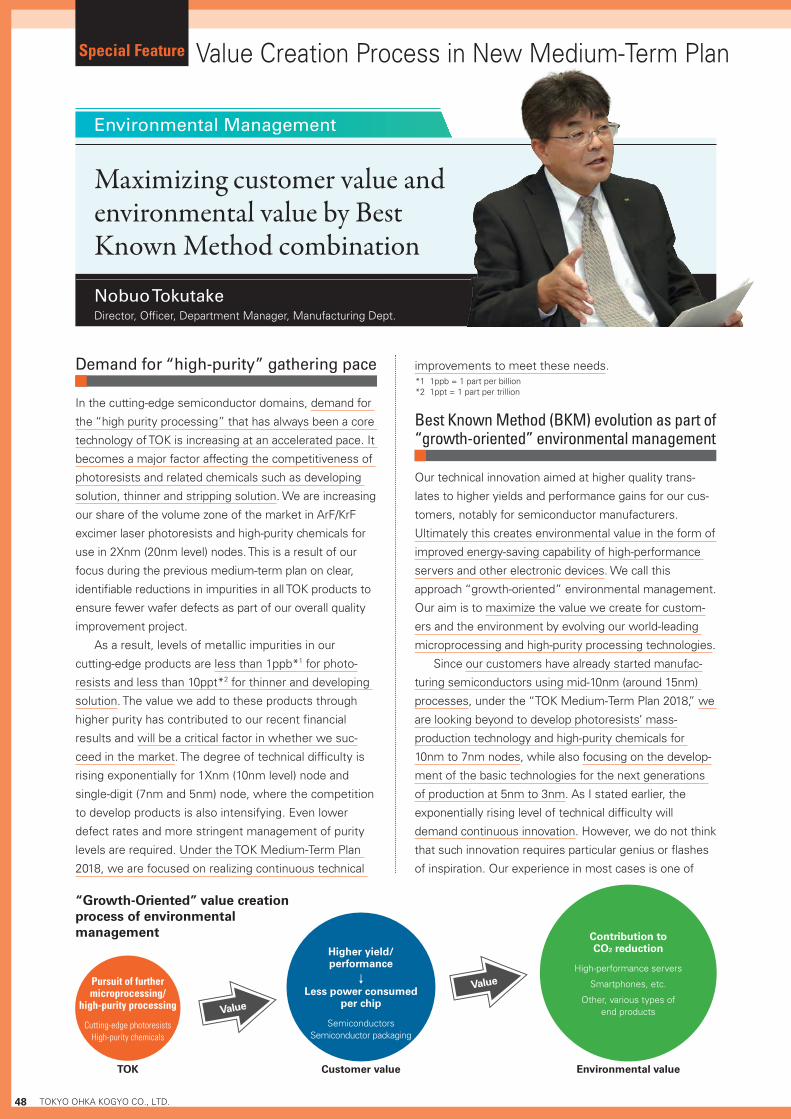
Demand for “high-purity” gathering pace
In the cutting-edge semiconductor domains, demand for
the “high purity processing” that has always been a core
technology of TOK is increasing at an accelerated pace. It
becomes a major factor affecting the competitiveness of
photoresists and related chemicals such as developing
solution, thinner and stripping solution. We are increasing
our share of the volume zone of the market in ArF/KrF
excimer laser photoresists and high-purity chemicals for
use in 2Xnm (20nm level) nodes. This is a result of our
focus during the previous medium-term plan on clear,
identifiable reductions in impurities in all TOK products to
ensure fewer wafer defects as part of our overall quality
improvement project.
As a result, levels of metallic impurities in our
cutting -edge products are less than 1ppb*1 for photo-
resists and less than 10ppt*2 for thinner and developing
solution. The value we add to these products through
higher purity has contributed to our recent financial
results and will be a critical factor in whether we suc-
ceed in the market. The degree of technical difficulty is
rising exponentially for 1Xnm (10nm level) node and
single-digit (7nm and 5nm) node, where the competition
to develop products is also intensifying. Even lower
defect rates and more stringent management of purity
levels are required. Under the TOK Medium-Term Plan
2018, we are focused on realizing continuous technical
improvements to meet these needs.
Best Known Method (BKM) evolution as part of “growth-oriented” environmental management
Our technical innovation aimed at higher quality trans-
lates to higher yields and performance gains for our cus-
tomers, notably for semiconductor manufacturers.
Ultimately this creates environmental value in the form of
improved energy-saving capability of high-performance
servers and other electronic devices. We call this
approach “growth-oriented” environmental management.
Our aim is to maximize the value we create for custom-
ers and the environment by evolving our world-leading
microprocessing and high-purity processing technologies.
Since our customers have already started manufac-
turing semiconductors using mid-10nm (around 15nm)
processes, under the “TOK Medium-Term Plan 2018,” we
are looking beyond to develop photoresists’ mass-
production technology and high-purity chemicals for
10nm to 7nm nodes, while also focusing on the develop-
ment of the basic technologies for the next generations
of production at 5nm to 3nm. As I stated earlier, the
exponentially rising level of technical difficulty will
demand continuous innovation. However, we do not think
that such innovation requires particular genius or flashes
of inspiration. Our experience in most cases is one of
*1 1ppb = 1 part per billion*2 1ppt = 1 part per trillion
Value
Value
TOK
Pursuit of further microprocessing/
high-purity processing
Cutting-edge photoresistsHigh-purity chemicals
Higher yield/performance
↓Less power consumed
per chip
SemiconductorsSemiconductor packaging
Contribution to CO2 reduction
High-performance servers
Smartphones, etc.
Other, various types of end products
“Growth-Oriented” value creation process of environmental management
Customer value Environmental value
Nobuo TokutakeDirector, Officer, Department Manager, Manufacturing Dept.
Value Creation Process in New Medium-Term Plan
Maximizing customer value and environmental value by Best Known Method combination
Environmental Management
48 TOKYO OHKA KOGYO CO., LTD.
Special Feature

new technologies being created from the simple combi-
nation or application of existing technologies from varied
fields. We will further evolve “growth-oriented” environ-
mental management by reinforcing collaboration with all
the business partners in our supply chain to create and
apply a new BKM, in addition to combining the most
suitable technologies we have cultivated in the 75 years
of TOK’s history of pursuing dominance in niche sectors.
Challenges in “TOK Medium-Term Plan 2018” (Year)
2015 2016 2017 2018 2019 2020 2021 2022
10nm Node
Evolution of photoresists and high-purity chemicals
Maximize customer/environmental values via BKM combination
7nm Node 5nm Node 3nm Node
Challenge 1: Establish mass-production technology for 10nm to 7nm nodes Challenge 2: Establish basic technology for 5nm to 3nm nodes
Target steady progress and evolution in the “defensive” approach to environmental management
At TOK, we view our sustainability initiatives to take the
environment into consideration in our development and
manufacturing processes for advanced photoresists and
high-purity chemicals as an important part of risk manage-
ment. We call this our “defensive” environmental manage-
ment approach. In practical terms, we put Responsible Care
at the heart of our activities in procurement, manufacturing,
transportation, and throughout the value chain. Using inte-
grated management, we are working to achieve steady
reductions over time in energy consumption, industrial
waste emissions, SOx emissions, and other indicators. In
particular, we have set 10-year reduction targets for energy
consumption. In the period to March 2020, we aim to
reduce our energy intensity* by 10% compared with FY
2010 levels (or by 1% each year).
To evolve our “defensive” approach to environmental
management, we provide the Safety Data Sheet (SDS)
system of information on environmental and safety
aspects of TOK products, collecting specialized informa-
tion on chemical substances and managing it for accu-
rate and prompt provision to customers and operators.
The SDS that we are currently issuing contains informa-
tion about safety measures such as chemical character-
istics, hazards, dangers, environmental impact, and
stability, along with reactivity and disposal methods of
products based on a real-time investigation of laws and
regulations inside and outside Japan. To comply with
GHS*, a world-wide standard, we provide SDS and
labels for all of our products for the domestic market.
When it comes to our exported products, we are also
sequentially moving ahead with providing SDS and
labels that correspond to the respective languages of
our export counterpart countries, as well as suited to the
timeframe for the entering into force of GHS in our
export counterpart countries.
Progress in “defensive” approach to environmental managementTotal energy consumption
0
(kL crude oil equivalent)
2010 2013 2014 2015 2016
14,89416,215
100 96 91 86 8314,82415,234
13,985
Base unit indexTotal energy consumption
(FY) 2012 2013 2014 2015 2016
9291
4,279
1,9181,918 2,0522,0521,4841,484 1,4901,490 1,4191,419
3,8943,289
3,838
9586
3,374
98
0
Volume of Industrial Waste(tons)
Base unit indexGeneral industrial wasteSpecially controlled industrial waste
(FY)2012 2013 2014 2015 2016
3.33.33.03.0
1.8
0
SOx emissions(tons)
(FY)
* Crude oil equivalent as a base unit
SDS system
CustomersTOK operators
SDS systemCreating SDS
Providing SDS
SDS(Safety Data Sheets)
Managing information on chemical substances
Managing records of SDS issues
Information on laws and ordinances related to chemical substancesProperties and handling methods for chemical substancesEnvironment and safety information for chemical substances
* GHS:Abbreviation for Globally Harmonized System of Classifying and Labeling of Chemicals. This is an initiative that categorizes chemicals by hazardousness according to certain standards and displays this in an easy to understand manner through the use of pictorial indications and other similar means. The results of this are reflected on the label and MSDS, and are put to good use for the preven-tion of disasters, and the protection of human health and the environment.
49Annual Report 2016
Grow
th Strategy

Strengthen human resource development as a foundation for value creation
A feature of the TOK’s business model with its strategy
of building close relationships with customers overseas
is that the ratio of overseas sales should continue to rise
going forward. Carrying on from the previous medium-
term plan, we have retained “develop global personnel”
as a company-wide strategy under “TOK Medium-Term
Plan 2018.” Personnel development from the perspective
of the entire TOK Group will maximize the value we
deliver and lead to the recruitment and promotion of
diverse personnel appropriate for overseas business.
(→ See Overseas Sales Ratio on page 68)
Level-based training program results and challenges
TOK’s overseas business involves rapid and accurate
response to local customers’ sophisticated and diverse
technological demands, as well as requiring the ability to
create our demand ourselves. Level-based training was
upgraded in the previous medium-term plan to strengthen
these capabilities by focusing on improving communica-
tion skills and training logical thinking ability to identify the
essence of problems. After approximately three years of
this initiative, we have fostered a sense of unity regarding
shared challenges among people from diverse depart-
ments across the organization and provided an opportunity
for individuals to understand the roles and responsibilities
of each department and consider their ideal roles.
Looking ahead, our tasks are to make sure each indi-
vidual participant elevates and consolidates the knowl-
edge that resulted from training into wisdom, and to
monitor their practical application of the wisdom. As the
director in charge, I will follow up thoroughly by clearly
providing opportunities for people to put their learning
into practice, and by clearly assigning authority and
responsibility while establishing an environment that
enables people to taking on the challenge of acting boldly.
TOK Global Practical Training for Selected Members
Under the previous medium-term plan, we started TOK
Global Practical Training for Selected Members, which
focuses on development of human resources who can
fulfill the three points listed below.
Under this program, from among employees who
have accumulated business experience overseas or have
been consistently undertaken self-development with a
Vision of TOK Global Practical Training for Selected Members
1. Self-reliant human resources who can display competence while shouldering risks by themselves in any business situation in Japan or abroad
2. Human resources who can work effectively and proactively pitch-in with a positive mindset, attitude, and ability to take action in an unknown world and a sometimes harsh environment
3. Human resources who have firm values and a strong presence without losing their identity of being a TOK employee
TOK Global Practical Training
Kunio MizukiDirector, Officer, Department Manager, General Affairs Dept.
Value Creation Process in New Medium-Term Plan
Link “diversity and inclusion” directly to competitive advantage
Human Resource Development
50 TOKYO OHKA KOGYO CO., LTD.TOKYO OHKA KOGYO CO., LTD.
Special Feature

desire to do business overseas, we select qualified
people based on the criteria of “Achieved excellent
results” “Have what it takes to proactively take on chal-
lenges on a global stage” and “Are capable of being
senior management in the future,” and conduct more
intensive training, including overseas training. We intro-
duced the “selection” method to foster a sense of
healthy competition among young employees and an
immediate result was a boost in morale among them.
Training has been completed by over 30 employees who
will carry TOK’s future in departments including develop-
ment, production, sales and marketing, legal affairs and
human resources. Each of these people is now fulfilling
an important role in developing TOK’s overseas business.
Similar to level-based training, we are aware that we
have a challenge to implement something to ensure that
after the training is completed participants are given an
appropriate opportunity to implement what they have
learned. We must also monitor how training results have
been utilized in actual work and then connect the find-
ings to improvements.
Establishing a competitive advantage through “diversity and inclusion”
To establish a competitive advantage on a global level or
succeed in new business requires more than merely think-
ing along existing lines or pursuing ideas of the same
quality or type. That is why we employ human resources
of diverse affiliations and specialized fields and strive to
maximize their different capabilities and potentials.
For example, we actively employ non-Japanese
people, provide equal opportunities to both genders in
recruitment and strive to create female-friendly work-
places. Under the previous medium-term plan these
efforts achieved a five percentage point increase in the
ratio of non-Japanese employed to 21% and a 42% ratio
of women among new graduates employed. In addition,
we have added a woman as an independent director on
the Board of Directors and are gradually increasing the
number of female managers. In these and other ways,
TOK’s diversity is deepening and steadily developing,
mainly in a quantitative aspect.
The meaning of diversity, meanwhile, is not just
diversity of gender, nationality or specialization; in its
essence, it is diversity of perspectives. Although recruit-
ment of non-Japanese and women will continue to be
prioritized as a key performance indicator going forward,
our first priority will be “inclusion,” which means
respecting and utilizing diverse opinions, feelings and
abilities, aiming to establish a competitive advantage on
a global level and succeed in new business.
Training for selected members from overseas subsidiaries
As one aspect of a system directly linking “diversity and
inclusion” to competitive advantage, the “TOK Medium-
Term Plan 2018” will newly incorporate the TOK Group
Core Human Resource Training Program for training
selected employees from overseas subsidiaries. The pro-
gram aims to increase the Group’s global cohesiveness,
develop core human resources to form the Group’s future
senior management, and maximize value provision through
exchanges between these diverse human resources.
Specifically, we will select employees from overseas
subsidiaries based on criteria such as “loyalty to the TOK
Group,” “achieved excellent results,” “desire for improve-
ment” and “character,” and through rigorous business
simulation training, enable them to master communica-
tion, thought process and response methods. The pro-
gram will enable participants to find what it takes to be
future global managers of the TOK Group and, through
exchanges among management candidates, build their
awareness and sense of belonging as an important
member of the Group, as well as provide an opportunity
to strengthen the mutual ties between Group companies.
Deepening diversity (TOK ADVANCED MATERIALS CO., LTD.)
51Annual Report 2016
Grow
th Strategy

What is your perspective on TOK’s strengths, corporate culture and so on?
A Company that Effectively Meshes Cooperation with its Employees and its DNA since Founding
I think the TOK Group’s strength really comes down to its
being an R&D-driven enterprise that continues to introduce
original technologies and products adapted to the changing
times. I sense that TOK’s founding philosophy of manufac-
turing—to create products that others cannot imitate, to be
original, to focus on high purity products, and to support
manufacturing with advanced technological capabilities—
continues to be passed down as part of TOK’s DNA.
At the same time, I get the impression that the TOK
Group values its employees highly. Since my appointment
last year, I have observed their operations at a total of six
sites, including in South Korea, Taiwan and in Japan, and
management’s policy of treating employees as the
Company’s most important asset seems to have permeated
throughout the entire organization. Regardless of which
site I visited, I sensed that everyone was working together
as a team, moving forward day to day toward a common
objective. This in no way suggests a culture of compla-
cency, rather an impression that, through the Level-Based
Training Programs and the TOK Global Practical Training for
Selected Members, the TOK Group has, in a good sense,
infused the organization with a merit-based culture. I think
TOK’s effectively meshing cooperation with its employees
and its DNA since founding has led to high quality value
creation. Although they are not visible to the naked eye, I
want the management resources that are essential to the
sustainable growth of TOK in the future to be passed on.
What is your assessment of the TOK Group’s corporate governance system?
Full Compliance, with Added Originality
While the TOK Group is a full-compliance company that
implements all of the principles of the Corporate
Governance Code, in doing so it has taken an original
approach that makes it easier to ensure maximum effec-
tiveness for the Company. To begin with, the composition
of its independent officers—consisting of a former busi-
ness executive, a CPA (myself) and three former execu-
tives from financial institutions—is unique. Mr. Kurimoto
has eight years of management experience as representa-
tive director of a listed company, and at Board of Director’s
meetings offers beneficial advice from the perspective of
someone who has actually run a company. Outside audi-
tors Mr. Shimbo, Mr. Yoneda and Mr. Saito also make
highly insightful statements that get at the heart of risk
management, based on knowledge they have gained
through their involvement in management at financial
institutions. A recent example is a lively series of
shareholder- oriented questions and suggestions that grew
out of a vote on a major investment deal, as the auditors
strove to verify that the investment was in line with corpo-
rate objectives, had gone through the appropriate pro-
cesses, and would ultimately lead to earnings growth. They
also make effective points about financial risks outside of
the business itself. I think this independent officer structure
has proven effective in providing a support function for the
Company’s technologically-oriented management team.
Based on Supplementary Principle 4.8.1 of the
Corporate Governance Code, TOK has established sepa-
rate meetings for its independent officers, but given the
Noriko SekiguchiOutside Director (Independent Officer)
Q1 Q2
Corporate Governance
In this section, we interviewed Noriko Sekiguchi,
an outside director of the TOK Group. Ms. Sekiguchi
shared her views on the Group’s corporate gover-
nance and sustainable growth and her own role in
the Group.
Interview with an Outside Director
52 TOKYO OHKA KOGYO CO., LTD.

need for support from someone in the Company familiar
with technology-related issues, the Company’s standing
statutory auditor also participates. At these meetings,
additional explanation is provided on topics from manage-
ment meetings that were not on the agenda of the Board
of Directors; any questions or opinions that come up are
then addressed as needed and where appropriate by the
standing statutory auditor. Subjects involving those ques-
tions and opinions are sometimes also taken up at the next
Board of Director’s meeting. Last year, the Board began
conducting self-assessments, but I think even if they begin
with third-party assessments at some point, these kinds of
original initiatives will likely be well-regarded.
What must TOK do to drive sustainable growth and continuously enhance its corporate value?
Based on a Long-Term Vision, Continuing to Refine the Balance Between Profit, Investment and Dividends
In 2010, the TOK Group set a management vision for
2020, 10 years hence. I think for the Company to achieve
sustainable growth, it is important to continue to estab-
lish this kind of long-term vision at each juncture.
In financial terms, ideally the Company should
ensure financial soundness and increase ROE by work-
ing to increase profits from each business, while invest-
ing funds generated from a review of strategic equity
holdings and changes in business portfolios in areas
expected to deliver higher profitability, and offering
shareholder returns. In that sense, investment in R&D is
an essential lifeline for the TOK Group as it works to
adapt to market conditions. On that basis, TOK’s sustain-
able growth and enhancement of corporate value
requires continued refinement of the balance between
profits, investment and dividends.
In the future, what corporate gover-nance issues does the TOK Group face, and what role do you hope to play?
Corporate Governance Is Never Truly “Complete”
If you think of corporate governance as a framework for
bringing discipline to business for the sake of sustain-
able growth and enhanced corporate value, I think it is
never truly “complete,” because as a company grows,
governance systems and processes require constant
reevaluation. In that sense, I think the issue for the TOK
Group in terms of governance is to look beyond last
year’s 75th anniversary, to build and manage the frame-
work needed to become a 100-year company.
I hope to ensure I fulfill my role as outside director by
reviewing whether corporate strategies offered by man-
agement are acceptable from the shareholders’ perspec-
tive, asking management to explain how those
strategies will be executed, and supervising manage-
ment while constantly considering whether or not man-
agement decisions are in line with corporate strategy.
Contributing to Reducing Risk in Anticipation of Becoming a 100-Year Company
TOK’s internal control system functions under the direct
supervision of the president, and at this point, I see no
cause for concern. That said, I also believe that with
overseas sales representing approx. 80% of net sales,
and an “aggressive” medium-term plan being rolled out
in the midst of fast-moving changes in market conditions
and technology trends, the TOK Group faces potential
business risks that could easily extend to its internal
controls. By working even more closely with the other
independent officers, and providing advice as an expert
in internal controls, which exemplify a “company’s
defenses,” to further enhance compliance, I hope to
contribute to efforts to reduce risk. I hope that by doing
so, I can help the TOK Group continue to specialize in
cutting-edge technology fields and move closer to
becoming a 100-year company.
Q3
Q4
53Annual Report 2016
Corporate G
overnance

TOK’s path to stronger corporate governance
Ratio of Outside Officers in the Board of DirectorsRatio of Outside Auditors among Corporate Auditors
Our goal is to further strengthen corporate governance and achieve sustained enhancement of corporate value into our first 100 years as a company and beyond.
June 2003
Executive officer system introduced to clearly separate management decision-making and supervisory functions from business execution
With the introduction of the executive officer system, the number of directors was also adjusted down-ward, from a maximum of 20 directors to a maximum of 10
June 2006Tenure of directors shortened from two years to one yearSelected one outside director for the first time
June 2012 Appointed the first non-Japanese officer
June 2013 Added one outside auditor, bringing the total to three
June 2015 Appointed a (female) outside director, bringing the total to two
(%)
(FY)2012 2013 2014 2015 2016
30.0
36.4 36.441.7 41.7
75%(three of four
corporate auditors)
Basic ConceptWe have a management vision of aiming to be a globally
trusted corporate group by inspiring customers with high
value-added products that have satisfying features, low
cost and superior quality, under our business principles
since our establishment (“Continue efforts to enhance
our technology,”“Raise the quality levels of our prod-
ucts,” “Contribute to society,” and “Create a frank and
open-minded business culture.”) We believe that realiz-
ing this will lead to benefits shared by shareholders and
all other stakeholders and will improve corporate value.
Realizing the management vision is the means to
maintain a sound and transparent management and to
enhance operational efficiency with speeding up of the
decision-making process as one of the most important
management issues.
Type of SystemAs a company with corporate auditors, TOK employs the
corporate auditor system. We are taking actions to
strengthen audits performed by the corporate auditors
with the greater authority endowed by the Companies
Act of Japan. In addition, TOK is taking advantage of the
benefits of reforms to its Board of Directors, establish-
ment of the executive officer system, and the election of
an independent outside director to fortify the manage-
ment decision-making and supervisory function and the
business execution function while clarifying responsibil-
ity for performing these functions. We are convinced
that these measures are the most effective means to
upgrade our corporate governance.
Corporate Governance
54 TOKYO OHKA KOGYO CO., LTD.

Representative Director
Departments
Corporate PlanningDept.
New BusinessDevelopment Dept.
General AffairsDept.
AccountingDept.
Internal Control AssessmentInternal Control Assessment
Election/DismissalElection/Dismissal
Election/DismissalElection/Dismissal Election/DismissalElection/Dismissal Election/DismissalElection/Dismissal
DirectionDirection
AdviceAdvice
CooperationCooperation ConferenceConference
MarketingDept.
Research andDevelopment Dept.
ManufacturingDept.
Process EquipmentManufacturing Dept.
AuditAudit
Internal AuditInternal Audit
ReportReport
AdviceAdvice
Internal Auditing Div.4
Legal Advisor6
Committee of Officers,Officers2
Board of Directors,Directors1Board of Auditors,
Auditors3 Accounting Auditor(Auditing Firm)5
8
Shareholders’ Meeting7
Election/Dismissal
Accounting Audit
Direction
Internal Control Audit
CooperationMonitoringDismissal
Diagram of Corporate Governance System (As of June 28, 2016)
Directors and Board of Directors Diagram ●❶To quickly respond to changes in the operating environ-
ment and clarify accountability for the directors concern-
ing operating results in each fiscal year, we have
shortened the tenure of the directors from two years to
one year since June 2006. To make the activities of the
directors more transparent and reinforce the corporate
governance system, there have been two independent
outside directors since June 2015.
In principle, the director system has a flat structure
with two levels: representative director and directors.
This creates a framework that allows the Board of
Directors to fulfill its primary responsibilities by effec-
tively reaching management decisions and supervising
the Company’s management.
As of June 28, 2016, we had eight directors, includ-
ing two outside directors. In principle, the Board of
Directors meets once a month on a regular basis and
holds extraordinary meetings as required. The meetings
are held to decide important matters of business execu-
tion, with the goal of supervising the business duties
executed by the representative director and directors.
The number of directors on the Board of Directors is
set to not exceed 10 directors in the Company’s Articles
of Incorporation. The articles also stipulate that resolu-
tions for the election of directors must be approved by a
non- cumulative majority vote at a General Meeting of
Shareholders with a third or more of the shareholders in
attendance.
Officers and Committee of Officers Diagram ●❷While taking steps to strengthen the Board of Directors’
functions in management decision making and supervision,
TOK has the Committee of Officers made up of officers to
reinforce its business execution capabilities. The committee
members include the chief executive officer, the chief oper-
ating officer, senior executive officers, executive officers
and officers. Those officers’ ranks derive from differences in
business responsibilities and other considerations.
As of June 28, 2016, we had 16 officers, including six
officers also serving as directors. In principle, the Committee
of Officers meets once a month on a regular basis and holds
extraordinary meetings as required. The meetings are held
to share instructions and orders resolved by the Board of
Directors and information among the officers, and with the
goal of deliberating and approving certain important deci-
sions that are not subject to a Board of Directors resolution.
Auditors and Board of Auditors Diagram ●❸As of June 28, 2016, we had four auditors, including three
outside auditors. In principle, the Board of Auditors meets
once a month on a regular basis and holds extraordinary
meetings as required. The meetings are held to receive
reports regarding important auditing matters from each
auditor, with the goal of deliberating and reaching resolu-
tions on those matters. The auditors attend the Board of
Directors, the Committee of Officers, and other important
meetings. Their duties are performed in accordance with
auditing standards (Corporate Auditor Auditing Regulations),
55Annual Report 2016
Corporate G
overnance
the auditing policy, the division of tasks, and other consider-
ations. In addition, the auditors check the performance of
directors by receiving reports from directors and other
corporate staff, and requesting an explanation if necessary.
For financial audits, the auditors receive reports from the
accounting auditor and use other means, including request-
ing an explanation if necessary, to verify the suitability of
financial accounting methods and the results of these
audits. Note that the corporate auditors (including standing
statutory and outside auditors) hold regular quarterly meet-
ings with the outside directors in an effort to share informa-
tion and opinions. To improve the effectiveness of corporate
audits, and to ensure smooth execution of audit duties, one
person is also assigned to assist the auditors.
Internal Auditing Division Diagram ●❹The Internal Auditing Division, under the direct control of the
president, comprises six full-time staff members. In addition
to internal audits, this division offers suggestions, proposals,
and advice for continuous improvement through evaluations
of the effectiveness of internal controls in financial reporting.
Accounting Auditor Diagram ●❺The accounting auditor conducts accounting audits of the
Company from an impartial and independent standpoint.
There were two certified public accountants who con-
ducted the accounting audit of the Company in the fiscal
year ended March 31, 2016: Yasuhiro Ohnaka and Masato
Shoji, both of whom are designated limited liability part-
ners and executive members of accounting auditor Deloitte
Touche Tohmatsu LLC. Moreover, there were six other
certified public accountants, two junior accountants, and
14 other people who assisted in conducting the Company’s
Internal Audit and Corporate Audit Diagram ●❽Cooperation between the auditors and accounting auditor
The auditors receive reports on the result of accounting
audits and other work from the accounting auditor (audit-
ing firm) four times a year. They also receive an explana-
tion of the auditing plan from the accounting auditor
(auditing firm) once a year. In addition, the auditors also
accompany the accounting auditor (auditing firm) to the
factory audits the accounting auditor conducts around
twice a year, as well as examine the auditing method of
the accounting auditor (auditing firm). Apart from this,
the auditors also exchange information and opinions with
the accounting auditor (auditing firm) as required.
Cooperation between the Auditors, Internal Auditing Division and Accounting Auditor
Corporate Governance
accounting audit. The details of the remuneration of the
Company’s certified public accountants (Deloitte Touche
Tohmatsu LLC) for conducting the accounting audit during
the fiscal year ended March 31, 2016 are as follows:
• Remuneration in relation to the services set forth in
Article 2, Paragraph 1 of the Certified Public
Accountants Act (Act No. 103 of 1948): ¥52 million
Legal Advisor, etc. Diagram ●❻The Company has concluded advisory contracts with a
number of law firms, and receives appropriate advice from
legal advisors in situations requiring legal assessment.
Efforts to Invigorate the General Meeting of Shareholders and Facilitate Smooth Exercise of Voting Rights Diagram ●❼
To facilitate the exercise of voting rights by shareholders,
we try to avoid holding our General Meeting of
Shareholders on days when most other Japanese compa-
nies hold their meetings. We also set a period for review-
ing the resolutions for approval by the meeting that is
longer than the number of days required by law, and send
our Notice of Convocation of the General Meeting of
Shareholders out early (21 days (three weeks) before the
day of the meeting). It is also published on our website
ahead of time, four weeks prior to being sent out.
To enable the shareholders in attendance to better
understand the proceedings of the General Meeting of
Shareholders, we use narrated video footage to report the
items up for resolution. In addition, we also upload the
Notice of Convocation, Notice of Resolution, and Results
of the Exercise of Voting Rights to the General Meeting of
Shareholders for disclosure on the Company website.
Relationship between internal audits, corporate audits,
accounting audits and the internal control department
The TOK Group’s internal control department comprises
divisions in charge of compliance and risk management
in addition to the Internal Auditing Division, which is in
charge of evaluating the effectiveness of internal control
as it pertains to internal audits and financial reporting.
The Internal Auditing Division, as a part of the inter-
nal control department, reports the results of internal
audits to the president, auditors and the relevant divi-
sions. In addition, it provides the relevant divisions with
suggestions, proposals and advice as required.
56 TOKYO OHKA KOGYO CO., LTD.
Election of Outside Directors and Outside Auditors
As for corporate audits, the auditors report the
results of their corporate audits of directors’ execution of
duties to the president and the accounting auditor (audit-
ing firm). In conducting internal control audits, the audi-
tors receive evaluation reports and other information
from the internal control department as necessary.
The accounting auditor (auditing firm) reports the
results of its accounting audits to the President and
auditors. It also holds discussions with the internal con-
trol department to help them with internal control audits.
The Company has eight directors, of whom two are outside directors, as well as four auditors, of whom
three are outside auditors.
The Company has established the following criteria and policies regarding independence in the election
of outside directors and outside auditors.
Independence Standards for Outside Officers
Independent outside officers under this criteria are defined as those who fulfill the legal requirements of an outside officer, and to whom any one of the following does not apply.
a. A person who executes the business of the Company or its consolidated subsidiaries (the “Group”), or who did so for a period of 10 years before being appointed.
b. A person/entity for which the Group is a major client (Note 1), or who executes the business of such a person/entity.
c. A major customer of the Group (Note 2) or a person who executes the business of such customer.
d. A major lender of the Group (Note 3) or a person who executes the business of such lender.
e. A person who, apart from receiving officer compensation from the Group, belongs to a consulting, accounting, or legal firm (corporate entity, cooperative, or other such group) receiving large amounts of cash or other assets (Note 4) from the Group.
f. A person to whom the above b. through e. applied in the previous three years.
g. A person who in the past three years has received donations from the Group averaging more than ¥3.0 million per year.
h. Major shareholders of the Group (Note 5) or a person who executes the business of such shareholder.
i. A person who executes the business of a company with a mutual relationship between outside officers.(Note 6)
j. A person whose spouse or a relative within the second degree of kinship come under any one of above items a. through i.
k. A person who has served a total of more than eight years as an outside officer.
l. Regardless of the above provisions, a person for whom it is deemed likely that conflicts of interest will arise with the Company.
Notes 1. A person/entity for which the Group is a major client, means a supplier that provides the Group with products or services, the amount of which transactions averaged more than ¥10.0 million per year over the past three years and represented more than 2% of the supplier’s consolidated annual revenue in the most recent fiscal year.
2. A major customer of the Group means a customer to which the Group provides products and services, the amount of which transactions averaged more than ¥10.0 million per year over the past three years and represented more than 2% of the Group’s consolidated annual revenue in the most recent fiscal year.
3. A major lender of the Group means a financial institution which has lent an amount equivalent to more than 2% of the Group’s consolidated total assets.
4. A large sum of cash or other assets, means assets that averaged more than ¥10.0 million per year over the past three years, and which in the most recent fiscal year had an economic value in excess of 2% of said consultant or accounting or legal expert’s consolidated annual revenue. (In the event the beneficiary of said assets is a corporation, association or other organization, then assets that averaged more than ¥10.0 million per year over the past three years, and which in the most recent fiscal year had an economic value in excess of 2% of said organization’s consolidated annual revenue.
5. Major shareholder, means a shareholder with a ratio of voting rights of more than 10%.
6. A mutual relationship between outside officers means a relationship in which a person who executes the business of the Group is also an outside officer at another company, and in which a person who executes the business of said outside company is also an outside officer of the Company.
Reasons for the Election of Outside DirectorsName (Election date) Reasons for election
Hiroshi Kurimoto(June 2014)
Kurimoto was elected on the expectation that he would supervise TOK’s management from an objective and neutral point of view, based on his abundant experience and considerable insight as a business executive of a listed company, and contribute to strength-ening corporate governance by advising the Company on management in general.
Noriko Sekiguchi(June 2015)
Sekiguchi was elected to contribute to corporate governance and TOK’s management from an objective and neutral point of view, based on her professional expertise in accounting and abundant hands-on business experience with several companies as a certified public accountant, and her thorough understanding of internal control, including from her experience as a member of external committees investigating fraudulent accounting at numerous listed companies, and advise the Company on management in general.
57Annual Report 2016
Corporate G
overnance

The Main Activities of Outside Directors and Outside AuditorsName Attendance record and activities at Board of Directors and Auditors meetings
Hiroshi Kurimoto(Outside Director)
Kurimoto attended 14 of the 15 Board of Directors meetings (attendance rate 93%) held during the fiscal year ended March 2016. He voiced timely opinions as required when discussing resolutions, based on his broad experience and abundant expertise as a busi-ness executive.
Noriko Sekiguchi(Outside Director)
Since she was elected on June 25, 2015, Sekiguchi attended all 12 of the 12 remaining Board of Directors meetings (attendance rate 100%) held during the fiscal year ended March 2016. She voiced timely opinions as required when discussing resolutions, based on her professional expertise in accounting and abundant hands-on business experience with several companies as a certified public accountant.
Seiichi Shimbo(Outside Auditor)
Shimbo attended 14 of the 15 Board of Directors meetings (attendance rate 93%) and all 16 of the 16 Board of Auditors meetings (attendance rate 100%) held during the fiscal year ended March 2016. He voiced and raised timely opinions and questions as required at the meetings, based on his broad experience including at a financial institution, and his abundant expertise as a business executive.
Katsumi Yoneda(Outside Auditor)
Yoneda attended all 15 of the 15 Board of Directors meetings (attendance rate 100%) and all 16 of the 16 Board of Auditors meetings (attendance rate 100%) held during the fiscal year ended March 2016. He voiced and raised timely opinions and questions as required at the meetings, based on his broad experience including at a financial institution, and his abundant expertise as a business executive.
Hiroshi Saito(Outside Auditor)
Since he was elected on June 25, 2015, Saito attended all 12 of the remaining 12 Board of Directors meetings (attendance rate 100%) and all 11 of the 11 remaining Board of Auditors meetings (attendance rate 100%) held during the fiscal year ended March 2016. He voiced and raised timely opinions and questions as required at the meetings, based on his abundant experience and considerable insight as a business executive including at financial institutions.
Reasons for the Election of Outside AuditorsName (Election date) Reasons for election
Seiichi Shimbo(June 2013)
Shimbo was elected on the expectation he would contribute to auditing TOK’s management from an objective and neutral point of view, based on his abundant experience and considerable insight as a business executive including at financial institutions. No conflicts of interest in terms of personal, capital, business or other relationships exist between Shimbo and TOK. Shimbo was once a business executive with Tokio Marine & Nichido Fire Insurance Co., Ltd., which owns stock in TOK and conducts insurance trans-actions with the Company under routine and standard business conditions. However, these capital and business relationships were deemed not to affect Shimbo’s independence as an outside auditor of TOK.
Katsumi Yoneda(June 2013)
Yoneda was elected on the expectation he would contribute to auditing TOK’s management from an objective and neutral point of view, based on his abundant experience and considerable insight as a business executive including at financial institutions. No conflicts of interest in terms of personal, capital, business or other relationships exist between Yoneda and TOK. Yoneda was once a business executive with Meiji Yasuda Life Insurance Company, which owns stock in TOK and conducts insurance transactions with the Company under routine and standard business conditions. However, these capital and business relationships were deemed not to affect Yoneda’s independence as an outside auditor of TOK.
Hiroshi Saito(June 2015)
Saito was elected on the expectation he would contribute to auditing TOK’s management from an objective and neutral point of view, based on his abundant experience and considerable insight as a business executive including at financial institutions. No conflicts of interest in terms of personal, capital, business or other relationships exist between Saito and TOK. Saito was once a business executive with Mitsubishi UFJ Trust and Banking Corporation, which owns stock in TOK and conducts cash deposit, stock administration agent and other transactions with the Company under routine and standard business conditions. However, these capital and business relationships were deemed not to affect Saito’s independence as an outside auditor of TOK. In addition, Saito was also once a business executive with Mitsubishi UFJ Financial Group, Inc. stock in which TOK owns, however this capital rela-tionship was deemed not to affect Saito’s independence as an outside auditor of TOK.
The Main Agenda of Board of Director Meetings in the Fiscal Year Ended March 2016
R&D investment and capital investment plan under the new medium-term plan
Progress, investment plan for new business
Establishment of ROE target levels
Level for raising the dividend payout ratio
Exchange rate risk hedge (against the strong yen)
Remuneration of Directors and AuditorsTOK’s guidelines for remunerating its directors and auditors
are as follows. The guidelines focus mainly on complying
with laws and regulations and maintaining sound manage-
ment, while seeking also to set remuneration at a level
that satisfies the expectations of shareholders and other
stakeholders by increasing earnings and corporate value.
Directors’ Remuneration
Company directors’ remuneration consists of basic
remuneration in the form of a fixed salary, perfor-
mance-related bonuses for each fiscal year, and
medium- to long-term performance-related stock options
(subscription warrants).
The fixed-salary remuneration is decided and paid
within the remuneration framework approved at the
General Meeting of Shareholders (of within ¥420 million
per year), based on specific standards established by the
Company’s Board of Directors.
Bonuses are set within the above-mentioned remu-
neration framework (of within ¥420 million per year). The
Board of Directors decides whether or not to pay
bonuses, and the amount of bonuses to be paid, after
taking into consideration the performance of the
Company and the individual director.
Stock options (subscription warrants) consist of regu-
lar stock options and stock compensation-type stock
options. Regular stock options are granted to directors
Corporate Governance
58 TOKYO OHKA KOGYO CO., LTD.

Position Total remuneration (Millions of yen)
Total of various types of remuneration (Millions of yen) Number of eligible personnelBasic remuneration Stock options Bonuses
Directors(Excluding outside directors) 181 144 20 16 7
Auditors (Excluding outside auditors) 22 22 — — 1
Outside directors and auditors 43 42 — 1 6
Remuneration Totals Paid to Directors and Auditors (Fiscal Year Ended March 2016)
within a separate compensation framework (of within
¥42 million per year) approved at the 82nd Ordinary
General Meeting of Shareholders held on June 27, 2012,
in addition to the above-mentioned remuneration frame-
work. The Board of Directors decides the number of
subscription warrants to be allocated to each director.
Stock compensation-type stock options were set as a
part of the above-mentioned remuneration framework
(of within ¥420 million per year) when revisions to TOK’s
remuneration system were approved by the 84th
Ordinary General Meeting of Shareholders held on June
26, 2014. Based on certain standards set forth by TOK,
the Board of Directors decides the amount of fixed
salary of each director to be replaced by stock compen-
sation-type stock options. This is done to bolster morale
and motivate each director to raise the corporate value
of TOK by contributing to an increase in earnings, and
thereby the stock price of TOK, over the long term.
Outside directors do not receive stock options (subscrip-
tion warrants) in consideration of their roles.
Auditors’ Remuneration
Auditors are responsible for supervising and auditing
business duties executed by the directors, in a position
that is independent of the Board of Directors. They
receive only a basic remuneration in the form of a basic
salary, which is decided on and paid out following dis-
cussions among the auditors, within a remuneration
framework (of within ¥72 million per year) approved by
the General Meeting of Shareholders.
Notes 1. The amounts for total remuneration and total of various types of remuneration for directors (excluding outside director) do not include the portion paid as salary for employee activities undertaken in parallel with director activities.
2. The amounts for total remuneration and total of various types of remuneration for directors (excluding outside director) and outside directors and auditors include payments to one director and one outside auditor who retired at the end of the 85th Ordinary General Meeting of Shareholders held on June 25, 2015 (“85th Ordinary General Meeting of Shareholders”).
TOK is an R&D-driven enterprise, distinctive for the goals set out
in its Management Principles of continuing efforts to enhance its
technology and raising the quality of its products. Ongoing capital
investment is essential to building a solid advantage in cutting-
edge semiconductor domains, which will form the foundation for
sustained growth, and to making concrete progress in reforming
their business portfolio through development of new business
domains. Large-scale investment will also be required to enhance
their development structure through close relationships with
customers in Japan, South Korea, Taiwan and the U.S. In doing so,
it will be extremely important that they implement detailed,
appropriate responses to various risks. Especially in the near
term, the direction of the semiconductor industry and the global
economy has become difficult to predict, and I hope to make full
use of the sense of risk I have acquired working in a financial
institution to advise TOK on how best to take positive risks.
With no end of corporate scandals and accounting fraud, moves
are underway to reform corporate governance, and I realize that the
role of auditor has become even more important. TOK was an early
mover in aggressive governance reform efforts, and in fact, the
meetings of its Board of Directors are notable for their constructive,
lively discussions, thanks in part to the company’s frank and open-
minded business culture and the leadership of the Board’s chair-
man. The proceedings are well-managed, with diligent consideration
given to important resolutions, and the Board of Directors can be
said to be fulfilling its function. Compared to three years ago, the
number of outside directors and auditors has increased by one, to
two directors, and the number of outside auditors has also been
increased from two to three auditors. Meetings are also held among
the non-executive officers, made up of the five outside directors
and one standing statutory auditor, where they engage in a frank
exchange of opinion. To help ensure the permanent continuation and
growth of TOK’s business, I also try to
conduct audits from the perspective of
an independent officer, bringing a mea-
sure of constructive skepticism. In this
way, I hope to maintain independence
and neutrality, while helping TOK to
strengthen and enhance its corporate
governance, respond to the expecta-
tions of all of its stakeholders, and
further improve corporate value.
Message from an Outside Auditor
Seiichi Shimbo
59Annual Report 2016
Corporate G
overnance

The Board of Directors has voted on a basic policy for build-ing an internal control system. The section presents excerpts from a summary of progress in using that internal control system to ensure proper operations, with a focus on compliance, risk management, business execution reporting and other Group internal control systems, information archiving and management system.(For further details on internal control, please see the Corporate Governance Report at http://www.tok.co.jp/ content/download/927/11053/file/gov_report.pdf. (in Japanese))
Compliance System• To encourage greater penetration of compliance aware-ness, the Group is focusing on the TOK Group Compliance Standards of Conduct, implementing awareness and edu-cational efforts at Group sites inside and outside Japan.
• The Group has revised its compliance regulations, increased the frequency with which its Compliance Committee meets, and provides a summary of the Committee’s activities to the Board of Directors.
• TOK is working to improve its group compliance system, including internal reporting at overseas subsidiaries and strengthened centralized management of Group internal compliance information.
Anti-takeover Measures• TOK has adopted anti-takeover measures. Please refer to our website for more information.
http://www.tok.co.jp/content/download/2637/40347/file/150521.pdf (in Japanese)
Risk Management System• Based on its contingency management regulations, the
Group’s Contingency Management Committee meets annually, and a summary of the Committee’s activities is provided to the Board of Directors.
• Based on its Business Continuity Plan (BCP), the Company runs simulated BCP drills that assume a large-scale earth-quake has struck Japan, as well as drills for setting up a disaster response headquarters.
• Based on its financial risk management regulations, the status of Group internal financial risk is reported to the Board of Directors, with annual policies for responding to that risk presented to and voted on by the Board.
Business Execution Reporting and Other Group Internal Control Systems• Based on its subsidiary management regulations, the
Company receives monthly business reports from its domes-tic and overseas subsidiaries, with a report on overseas subsidiaries presented to the Board of Directors annually.
• To ensure cohesion with its subsidiaries, the Company has launched a project to build a corporate management system to oversee the Group as a whole, with the goal of enhancing Group corporate value. As part of this project,
we are reviewing regulations regarding authority related to decision-making at overseas subsidiaries, as well as the approval process.
• Based on the basic policies regarding internal controls related to financial reporting, internal control assessments are conducted annually, the results of which are reported to the Internal Control Committee, with a summary pro-vided to the Board of Directors.
Retention and Management of Information• Based on the document organization and retention regula-
tions, retention periods have been established by type for minutes of the Board of Directors, approval forms and other important information related to decision-making, and such documents are appropriately retained and managed.
• The Group has formulated a set of basic regulations for information management, and based on those regulations, the Information Management Committee meets quarterly, with a summary of its activities provided to the Board of Directors.
Reinforce Information Management StructureIt would not be going too far to say that for TOK, which engages in R&D in cutting-edge semiconductor fields under its strategy of building close relationships with its custom-ers, a solid information management structure is the most important aspect of risk management. Positioning informa-tion management as one of its most important corporate governance issues, the Group is working to steadily imple-ment an information management scheme based on the Information Management Policies revised in 2013, and to continuously reinforce that scheme.
Information Management Audits by the Internal Auditing DivisionThe Internal Auditing Division, which is independent of the Information Management Committee, regularly audits com-pliance with rules and other matters, and reports the results to the president. If there are problems, improvement orders are issued to the audited divisions and the Information Management Committee. In this way the division works to continuously improve our information management system.
Internal Control System
President
Information Management Committee
Internal Auditing Division Departments, etc.
Information Management Structure
Secretariat of Information Management Committee
Corporate Governance
60 TOKYO OHKA KOGYO CO., LTD.

In the cutting-edge fields of R&D, information as a management resource has become increasingly important. By conducting activities with working groups for each important theme, TOK steadily implements the plan, do, check, act (PDCA) cycle.
PDCASeven Working Groups that Promote Information Management
1. Trade SecretsWe treat as trade secrets the import-ant information we manage, includ-ing that from customers, and legally protect this information. To prevent information leaks, we conducted interviews with our various depart-ments and based on this, we estab-lished specific management targets and methods, the understanding of which we are now promoting through education and training.
2. Training and Compliance with Rules
Promoting information management requires that all executives and employees recognize the importance of management and comply with the rules. To this end we conduct regular training on the importance of infor-mation management, management methods and other related matters in an effort to raise awareness of information management.
3. Human Resources RelatedIn connection with human resources, necessary rules are established and training conducted based on training programs for different ranks with related responsibilities, and employ-ees sign and submit pledges when they join and leave the company.
4. IT DevelopmentThe importance of IT in information management has continued to grow in recent years. Measures to prevent human error, malicious attacks and intentional information leaks from the inside need to be developed not only in Japan but at overseas sites as well. We are developing and implementing various necessary IT systems and conducting drills simulating targeted email attacks and other measures.
5. Physical Security Measures
We conduct a wide range of activi-ties that include implementing and developing various physical security measures for protecting confidential information, establishing common rules for this, supporting the creation of rules at each site based on these common rule and surveying opera-tions. Going forward, we plan to implement and reinforce measures at all sites under unified standards.
Information Management
61Annual Report 2016
Corporate G
overnanceIn TOK Advanced Materials Co., Ltd. (TOKAM), our strategic base in South Korea for building close relationships with customers, depositing recording equipment at the security gate is mandated.
Physical Security Measures
At domestic and overseas production bases, applying a blindfold sticker on mobile phone cameras is mandated.
6. Information Incidents*Based on the assumption that inci-dents occur involving a lost mobile phone or computer with important information, we set up measures to minimize the damage and impact, and identify the causes and prevent recurrence. We have reviewed the communication flow for when inci-dents occur along with correspond-ing measures and have revised procedures for their implementation.
7. Supplier Information Management Assessment
Suppliers including raw materials manufacturers play an important role in the supply chain process of devel-oping, manufacturing, and delivering products. The status of information management at each supplier is ascertained and suppliers are asked to cooperate in information manage-ment by making improvements if there are problems.* Information incidents are security
threats related to information manage-ment and system operations.

IR Activities/SR Activities
Complying with the Corporate Governance Code
Corporate Governance
TOK implements all of the principles set forth in the Corporate Governance Code established by the Tokyo Stock Exchange.
Complying with Various Principles of the Corporate Governance Code(Principle 1.4) Cross-shareholdings(1) Policies regarding cross-shareholdingsGiven that our business centers primarily on cutting-edge fields in the electronics market, and that we are expanding our busi-ness domains, we believe that maintaining and developing smooth relationships with our business partners is essential to achieving sustainable growth in the medium- to long-term. For that reason, we may at times acquire and own shares in the companies we do business with.
Our basic policy is that such acquisition and ownership will target shares of those business partners through which such ownership will enable us to strengthen relationships, thus leading to sustained enhancement in corporate value. At the same time, the Board of Directors regularly reviews these cross-holdings in terms of whether they are fulfilling their role and purpose, and determines whether to continue holding them or sell them off.(2) Criteria for exercising voting rightsIn exercising voting rights with regard to cross-shareholdings, we not only look at whether such exercise will contribute to improving the corporate value of the business partner in ques-tion, but also determine whether to approve such measures based on comprehensive consideration for maintaining our rights as a shareholder and of the objectives of the cross-shareholding.
(Principle 1.7) Related Party TransactionsWhen engaging in transactions with its officers, major share-holders and others (i.e., related party transactions), TOK consid-ers the rationality of pricing and other transaction terms as it would in third party transactions, to ensure that such transac-tions do not harm the common interests of the Company and its shareholders. At the same time, in compliance with legal provisions and our own internal regulations, particularly import-ant transactions are presented to the Board of Directors for their approval.
(Principle 3.1) Full Disclosure(1) Company objectives (e.g. business principles), business
strategies and business plans See page 8 “Management Principles”; pages 20–21 “Our Future”; pages 22–27 “Message from the President”
(2) Basic views and guidelines on corporate governance See page 54 “Basic Concept”
(3) Board policies and procedures in determining the remunera-tion of the senior management and directors
See page 58 “Remuneration of Directors and Auditors”(4) Board policies and procedures in the appointment of senior
management the nomination of director and auditor candidates
a. Policies and procedures in the appointment of senior man-agement and the nomination of director candidates
Once a year, the president prepares a draft used in determining senior management and director personnel issues (e.g. elec-tions and dismissals), based on consideration of the Group’s performance, the contribution of senior management and direc-tors to the medium-term plan and the previous fiscal year’s
Dialogue with Shareholders and InvestorsThe Director, Officer, Department Manager of General Affairs Dept. is responsible for managing and overseeing investor relations (IR), and through meetings on business results, meet-ings with institutional investors, company orientations for indi-vidual investors and a variety of other efforts, works to be proactive in achieving a constructive dialogue.
The Public Relations Division serves as the department responsible for TOK’s IR with regard to dialogue with share-holders and investors, and is primarily responsible for facilitating that dialogue, exchanging information with our accounting, sales, legal and other departments as needed and maintaining a coordinated collaboration. The department in charge of IR also works to provide the relevant officers with records of meetings with analysts, shareholders and investors, and to share information.
IR ActivitiesTOK conducts proactive IR activities, centered primarily on the Public Relations Division, in an effort to enhance our dialogue with shareholders and investors. Specifically, we hold events including biannual meetings on business results, company orientations for individual investors, as well as tours of our facilities. Our CSR reports, annual reports, business reports to shareholders, and Notice of The Convocation of The Ordinary General Meeting of Shareholders are all published on our web-site, part of our proactive effort to provide shareholders and investors with the information they need.
Records of opinions and requests from shareholders and investors that reach us through this dialogue are collected and regularly reported to the president and other management, and we work to ensure that information is understood and shared.
In accordance with our Compliance Standards of Conduct, TOK also makes an effort to provide its shareholders and inves-tors with consistent information, and to offer fair and timely disclosure. We have also established internal regulations regarding management of insider information, and strive to ensure those regulations are closely followed.
62 TOKYO OHKA KOGYO CO., LTD.

budget, and a self-assessment by the Board of Directors. Outside directors are briefed on this draft in advance, and pro-vide advice as required. The Board of Directors then decides on a resolution to the General Meeting of Shareholders based on said draft.b. Policies and procedures in the nomination of auditor candidatesIn nominating auditor candidates, the president will, (a) in the case of auditors nominated from within the Company, consider the knowledge, experience and capabilities gained by the indi-vidual through execution of their duties within the Company, and, (b) in the case of outside auditors, will consider their inde-pendence, objectivity, and the knowledge, experience and capabilities gained through execution of their duties outside the Company. The president will then prepare a draft proposal for the Board of Auditors. Upon the consent of the Board of Auditors, the Board of Directors then decides on a resolution to the General Meeting of Shareholders.(5) Explanations with respect to the individual appointments of
senior management and nominations of director and auditor candidates based on (4)
Refer to pages 57–58 “Reasons for the Election of Outside Directors” and “Reasons for the Election of Outside Auditors” for information on the reasons for election of outside directors and auditors. Reasons for the election of officers and all other directors and auditors are as noted in the Notice of the Convocation of the 86th Ordinary General Meeting of Shareholders.• Notice of The Convocation of The 86th Ordinary General
Meeting of Shareholders:http://www.tok.co.jp/eng/content/download/3102/49488/file/160530.pdf(Supplementary Principle 4.1.1)Based on the Board of Directors regulations, the Company’s Board of Directors decides on matters prescribed by laws and regulations, the Articles of Incorporation, and other matters concerning the execution of important business. Decision-making involving execution of business other than matters to be decided by the Board of Directors is delegated, as appropri-ate, to the Committee of Officers, the representative director, the directors and the officers, and those matters are clearly set forth in the Committee of Officers regulations and the Specific Authority by Position.
(Principle 4.9) Independence Standards and Qualification for Independent Directors
See page 57 “Independence Standards for Outside Officers”
(Supplementary Principle 4.11.1)(1) Policies for appointment of director candidates and approach
to composition of the Board of DirectorsInternal director candidates are chosen from among officers and others responsible for overall management, based on a compre-hensive consideration of numerous factors, including diverse, advanced skills, knowledge and actual performance. Outside director candidates are also evaluated for similar factors, with appointments focusing on those with extensive experience at listed companies and wide-ranging knowledge in management, or from among experts with a thorough understanding of legal affairs, finances, accounting, internal control systems and other areas. We also select those who can devote sufficient time and
effort as required by their duties, and who meet the standards for independence prescribed by TOK and the Tokyo Stock Exchange. With regard to the diversity and size of the Board of Directors, we strive for a balanced composition, with internal directors selected for their thorough understanding of areas including sales, development, and manufacturing, as well as whether they are newly appointed or reappointed, their experi-ence and past performance. We also ensure diversity by bring-ing in multiple outside directors of differing backgrounds, knowledge and expertise. Our policy is to maintain a Board of appropriate size that will contribute to quick, bold decision- making in a manner commensurate with our business.(2) Procedures for appointing director candidatesBased on the above policy, the president prepares a draft appointment of director candidates. Outside directors are briefed on this draft in advance and provide advice as required. The draft is then voted on by the Board of Directors and pre-sented as a resolution to the General Meeting of Shareholders.
(Supplementary Principle 4.11.2)Directors serving in other important positions
See pages 66–67 “Board of Directors/ Corporate Auditors and Officers”
(Supplementary Principle 4.11.3)Our directors and auditors conduct a self-assessment of (a) the composition of the Board of Directors; (b) the effectiveness of the Board of Directors; (c) information related to the Board of Directors; (d) the decision-making process; and (e) external communications. This offers an analysis and assessment of the effectiveness of the Board of Directors as a whole.
As a result, the composition of the Board of Directors offers an even distribution of inside directors with thorough under-standing of each field, and is well-balanced between experience and actual performance. The Board of Directors also maintains diversity by incorporating outside directors with differing back-grounds, knowledge and expertise. The size of the Board of Directors, the frequency with which it meets, the matters on which it deliberates and the time required for deliberation are all appropriate, and with the participation of outside auditors the proceedings are highly transparent, with rapid decision-making; in general, the Board of Directors is positively assessed. We are working to add further improvements to increase the effective-ness of the Board of Directors by preparing materials to enhance deliberations, improving the manner in which business execution and resolutions and reports are explained, and so forth.
(Supplementary Principle 4.14.2)TOK offers its outside officers opportunities to gain knowledge of the TOK Group’s business, structure, management strategy and financial condition, as well as opportunities to deepen their understanding of the TOK Group through participation in internal meetings and visits to our plants and so forth. Upon appoint-ment, inside officers are offered opportunities to learn their legal obligations and responsibilities as fiduciaries, as well as to recognize the attitudes and roles expected of them as officers, and to acquire the knowledge they need to appropriately exe-cute those obligations and roles.
(Principle 5.1) Policy for Constructive Dialogue with Shareholders
See page 62 “IR Activities/SR Activities”
63Annual Report 2016
Corporate G
overnance

Relationship with Society —Corporate Citizenship—
As a good corporate citizen with roots in local and regional communities, TOK cooperates with stakeholders other than shareholders and investors by making concerted efforts to contribute to society.
Tokyo Ohka Foundation for The Promotion of Science and Technology Celebrates its 30th AnniversaryEstablished in 1987 by our late founder Shigemasa Mukai, the Tokyo Ohka Foundation for The Promotion of Science and Technology (hereinafter, the “Tokyo Ohka Foundation”) was founded on the philosophy that the development of Japan, a nation with few natural resources, depends on the development of innovative technologies from advances in fundamental research, and the application of these technol-ogies in industry will lead to peace and prosperity for
humanity. For about 30 years, the Tokyo Ohka Foundation has continued to provide assistance for facilitating R&D in science and technology and researcher exchanges.
In fiscal 2017, the Tokyo Ohka Foundation provided grants totaling ¥29.4 million for 70 projects. Since its estab-lishment through fiscal 2017, it has provided a total of ¥579.65 million in funding for 910 projects.
Conversation about Promoting Science and TechnologyIn July 2016, Mr. Akira Fujishima, the president of the Tokyo University of Science and the Tokyo Ohka Foundation, interviewed TOK President & CEO Ikuo Akutsu about a variety of topics related to science and technology, and the interesting aspects of science, based on the headline themes “children are refined by their curiosity,” and “adults are refined by their failures.”Please visit our website to read the entire interview. (Japanese language only)
http://www.tok.co.jp/special-interview2016 (in Japanese)
Part 1Children are refined by their curiosity. (available on our website)
Part 2Adults are refined by their failures. (available on our website)
Right: Mr. Akira Fujishima (President of Tokyo University of Science and the Tokyo Ohka Foundation)
Left: President Ikuo Akutsu
History of the Tokyo Ohka FoundationYear History
1987
Established as the Tokyo Ohka Foundation for The Promotion of Science and Technology, and began to provide research grants, as well as grants for international exchanges and researcher exchanges
1990Created the Mukai Award to recognize excellent research that deserves attention for promoting science and technol-ogy, and began awarding prizes
2006
Created new grants for promoting science and educating youth about science as a fourth pillar of the grant business, as the younger generation will be key to the technological capabilities of Japan in the future, a nation built on technology
2011Changed registration to a public interest incorporated foundation following approval for the change from the prime minister
List of Mukai Award recipients (past six fiscal years) *Affiliation as of award reception date
FY 2012 2013 2014 2015 2016 2017
Recipient
Mr. Haruo Inoue Ms. Maki Kawai Mr. Yasuhiro Koike Ms. Reiko Kuroda Mr. Kazuhito Hashimoto Mr. Tetsuya Osaka
(Professor at Tokyo Metropolitan University)
(Executive Director at Riken)
(Professor at Keio University, Faculty of Science and Technology)
(Professor at Research Institute for Science & Technology, Tokyo University of Science)
(Professor at Department of Applied Chemistry, School of Engineering, University of Tokyo)
(Research Council Professor and Advisor of the Office of the President, Waseda University)
Result Photochemistry using visible light
Surface monomolecular spectroscopy
Basic research and function creation in photonics polymer
Advancement of solid chiral chemistry, development of new chiral spectrometer
Research related to energy and environmental science, based on electrochemical reactions
Transfer of technology from academia to industry via electrochemical nanotechnology
Contributing to Scientific and Technological Progress
Number and amount of grants given by the Tokyo Ohka Foundation(Cumulative total for the past six fiscal years)
579,650579,650550,250550,250521,990521,990
498,160498,160473,160473,160450,690450,690
910910
840840
778778720720
665665
619619
Cumulative amount of grants (¥ Thousand)Cumulative number of grants
201720162015201420132012 (FY)
Corporate Governance
64 TOKYO OHKA KOGYO CO., LTD.

Social Contribution Activities as a Good Corporate CitizenTOK makes concerted efforts to communicate with all stakeholders through dialogue and engagement with local communities in which it has a business presence, as well
as a variety of activities that contribute to society, such as volunteer activities and educational support.
Dialogue with Society
The Main Activities in Business Sites
1. Oregon Plant (U.S.) 5. Kumagaya PlantBeautification of areas around the plant / participation in local cleanup events
Beautification of areas around business sites
2. Sagami Operation Center, Shonan Operation Center 6. Gotemba PlantHolding of Noryosai (summer festival) / beautification of areas around business sites
Dragonfly watching at the plant’s biotope
3. Koriyama Plant 7. Aso PlantRed Cross blood donation campaigns Cleaning activities to protect a natural treasure
4. Utsunomiya Plant 8. Headquarters, Operation Centers and Plants
Traffic safety activities in areas around business sitesStudents from the neighborhood tour the workplace (business office and plant)
Employees, their families and local volunteers picked up garbage and cut weeds in nature conservation areas, and helped patch up the vegetation
1. Oregon Plant
Grass-roots environmental preservation activities, such as dragonfly watching, take place at the biotope, which was created for analysis and research into restoring local nature
6. Gotemba Plant
This venue serves to facilitate communication as many local residents and business partners gather every year to enjoy the refreshment booths and the Bon festival dance
Support is provided for educational activities that explain the business, products, and facilities (the headquarters is featured in the photograph)
8. Headquarters, Operation Centers and Plants
2. Sagami Operation Center, Shonan Operation Center
65Annual Report 2016
Corporate G
overnance

Board of Directors/Corporate Auditors and Officers
Ikuo AkutsuRepresentative Director, President & Chief Executive Officer
1982 Joined the Company2003 General Manager, Manufacturing Technology Div.2003 General Manager, Advanced Material Development Div. 22007 Chairman and President of TOK TAIWAN CO., LTD.2009 Officer; Dept. Manager, Corporate Planning Dept.2010 Director; Executive Officer; Dept. Manager, Corporate
Planning Dept.2011 Representative Director, President and Chief
Executive (to the present)
Kunio MizukiDirector, Officer Dept. Manager, General Affairs Dept.
1985 Joined the Company2005 General Manager, General Affairs Div.2009 Officer; Deputy Dept. Manager, Administration Dept.
and General Manager, General Affairs Div.2012 Officer; Dept. Manager, General Affairs Dept.2013 Director; Officer; Dept. Manager, General Affairs Dept.
(to the present)
Hiroshi KurimotoOutside Director (Executive Advisor, OILES CORPORATION)
1970 Joined OILES CORPORATION (“OILES”)1999 Director of OILES2003 Director; Managing Operating Officer of OILES2006 Representative Director, President and Chief
Operating Officer of OILES2011 Representative Director and Chairman of OILES2014 Director (Outside Director) of the Company (to the
present) Director and Senior Advisor of OILES
2015 Senior Advisor of OILES2016 Executive Advisor of OILES (to the present)
Noriko SekiguchiOutside Director (Representative of Sekiguchi CPA Office)
1986 Joined Manufacturers Hanover Bank (present JPMorgan Chase Bank, N.A.)1991 Joined Asahi-Shinwa Kaikeisha audit corporation (present KPMG AZSA LLC)1994 Registered as certified public accountant1998 Joined Japan Broadcasting Corporation2001 Joined Triumph International (Japan) Ltd.2002 Reregistered as certified public accountant2004 Joined Ernst & Young ShinNihon (present Ernst & Young ShinNihon LLC)2010 Representative of Sekiguchi CPA Office (to the present)2011 Contract Monitoring Committee Member of Japan International Cooperation Agency (“JICA”) (to the present)2011 External Assessment Committee Member of JICA (to the present)2012 Registered as certified tax accountant2015 Director (Outside Director) of the Company (to the present)
Nobuo TokutakeDirector, Officer Dept. Manager, Manufacturing Dept.
1984 Joined the Company2003 Chairman and President of TOK TAIWAN CO., LTD.2007 General Manager, Quality Assurance Div.2009 Senior General Manager, Production Control Div. and
General Manager, Quality Assurance Div.2013 Officer; Deputy Dept. Manager, Manufacturing Dept.2015 Director; Officer; Dept. Manager, Manufacturing Dept.
(to the present)
Keiichi YamadaDirector, Officer Dept. Manager, Marketing Dept.
1983 Joined Japan Synthetic Rubber Co., Ltd. (present JSR Corporation)
2001 General Manager, Kyushu Office of JSR Corporation2002 Business Director of Shipley Far East Ltd. (present
Rohm and Haas Electronic Materials K.K.)2004 General Manager Japan of Rohm and Haas Electronic
Materials K.K.2008 Senior Deputy General Manager, Electronic Material
Marketing Control Div. of the Company2012 Deputy Dept. Manager, Marketing Dept. of the Company2013 Officer; Deputy Dept. Manager, Marketing Dept. of the Company2016 Director; Officer; Dept. Manager, Marketing Dept.
(to the present)
Hiroji KomanoDirector, Officer Dept. Manager, New Business Development Dept.
1976 Joined the Company1997 General Manager, Advanced Material Development Div. 22000 General Manager, Advanced Material Development Div. 12004 Officer; Deputy Dept. Manager, Research and
Development Dept.2004 Officer; Deputy Dept. Manager, Research and
Development Dept. and General Manager, New Technology Development Section
2007 Officer (President and Director of TOKYO OHKA KOGYO AMERICA, INC.)
2011 Officer; Dept. Manager, New Business Development Dept.2012 Director; Officer; Dept. Manager, New Business
Development Dept. (to the present)
Harutoshi SatoDirector, Officer Dept. Manager, Research and Development Dept.
1984 Joined the Company2004 General Manager, Quality Assurance Div.2007 General Manager, Advanced Material Development Div. 22008 General Manager, Advanced Material Development Div. 12009 Officer; Deputy Dept. Manager, Research and
Development Dept. and General Manager, Advanced Material Development Div. 3
2011 Officer; Deputy Dept. Manager, Research and Development Dept. and General Manager, Advanced Material Development Div. 1
2012 Director; Officer; Dept. Manager, Research and Development Dept. (to the present)
Directors
Kunio Mizuki
Keiichi YamadaNoriko Sekiguchi
Hiroshi Kurimoto
Nobuo Tokutake
Hiroji KomanoIkuo AkutsuHarutoshi Sato
Corporate Governance
66 TOKYO OHKA KOGYO CO., LTD.
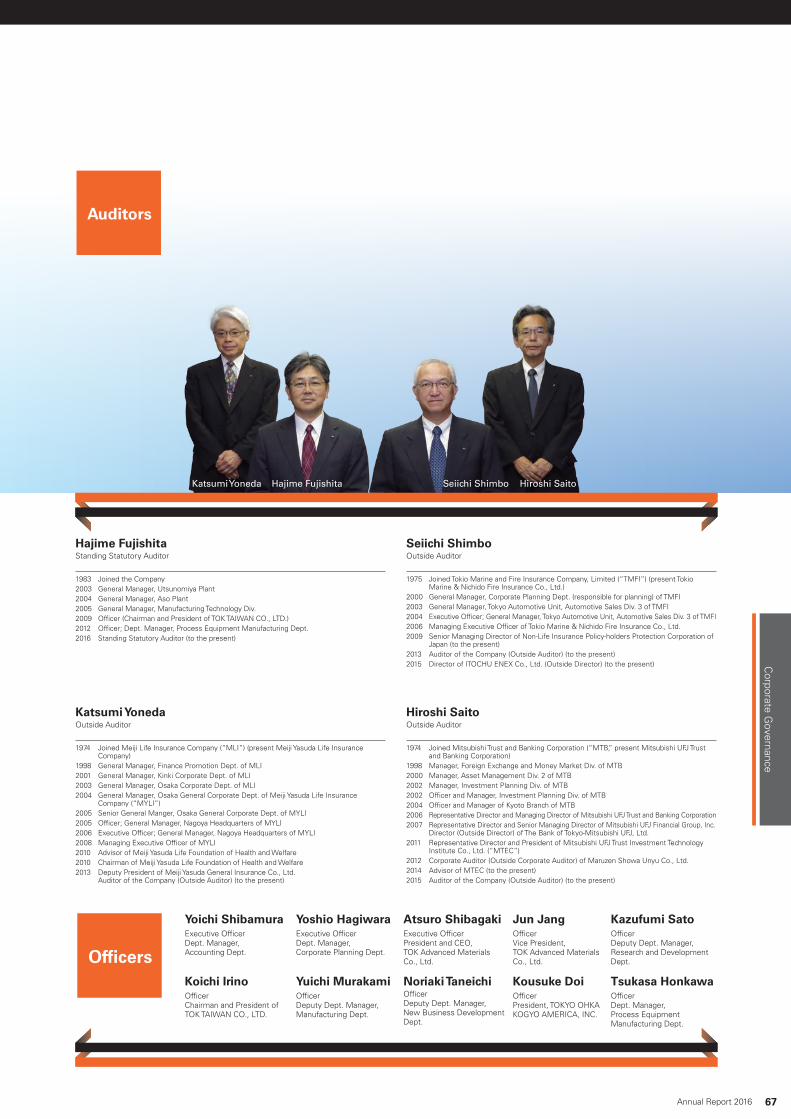
Hajime FujishitaStanding Statutory Auditor
1983 Joined the Company2003 General Manager, Utsunomiya Plant2004 General Manager, Aso Plant2005 General Manager, Manufacturing Technology Div.2009 Officer (Chairman and President of TOK TAIWAN CO., LTD.)2012 Officer; Dept. Manager, Process Equipment Manufacturing Dept.2016 Standing Statutory Auditor (to the present)
Katsumi YonedaOutside Auditor
1974 Joined Meiji Life Insurance Company (“MLI”) (present Meiji Yasuda Life Insurance Company)
1998 General Manager, Finance Promotion Dept. of MLI2001 General Manager, Kinki Corporate Dept. of MLI2003 General Manager, Osaka Corporate Dept. of MLI2004 General Manager, Osaka General Corporate Dept. of Meiji Yasuda Life Insurance
Company (“MYLI”)2005 Senior General Manger, Osaka General Corporate Dept. of MYLI2005 Officer; General Manager, Nagoya Headquarters of MYLI2006 Executive Officer; General Manager, Nagoya Headquarters of MYLI2008 Managing Executive Officer of MYLI2010 Advisor of Meiji Yasuda Life Foundation of Health and Welfare2010 Chairman of Meiji Yasuda Life Foundation of Health and Welfare2013 Deputy President of Meiji Yasuda General Insurance Co., Ltd.
Auditor of the Company (Outside Auditor) (to the present)
Hiroshi SaitoOutside Auditor
1974 Joined Mitsubishi Trust and Banking Corporation (“MTB,” present Mitsubishi UFJ Trust and Banking Corporation)
1998 Manager, Foreign Exchange and Money Market Div. of MTB2000 Manager, Asset Management Div. 2 of MTB2002 Manager, Investment Planning Div. of MTB2002 Officer and Manager, Investment Planning Div. of MTB2004 Officer and Manager of Kyoto Branch of MTB2006 Representative Director and Managing Director of Mitsubishi UFJ Trust and Banking Corporation2007 Representative Director and Senior Managing Director of Mitsubishi UFJ Financial Group, Inc.
Director (Outside Director) of The Bank of Tokyo-Mitsubishi UFJ, Ltd.2011 Representative Director and President of Mitsubishi UFJ Trust Investment Technology
Institute Co., Ltd. (“MTEC”)2012 Corporate Auditor (Outside Corporate Auditor) of Maruzen Showa Unyu Co., Ltd.2014 Advisor of MTEC (to the present)2015 Auditor of the Company (Outside Auditor) (to the present)
Seiichi ShimboOutside Auditor
1975 Joined Tokio Marine and Fire Insurance Company, Limited (“TMFI”) (present Tokio Marine & Nichido Fire Insurance Co., Ltd.)
2000 General Manager, Corporate Planning Dept. (responsible for planning) of TMFI2003 General Manager, Tokyo Automotive Unit, Automotive Sales Div. 3 of TMFI2004 Executive Officer; General Manager, Tokyo Automotive Unit, Automotive Sales Div. 3 of TMFI2006 Managing Executive Officer of Tokio Marine & Nichido Fire Insurance Co., Ltd.2009 Senior Managing Director of Non-Life Insurance Policy-holders Protection Corporation of
Japan (to the present)2013 Auditor of the Company (Outside Auditor) (to the present)2015 Director of ITOCHU ENEX Co., Ltd. (Outside Director) (to the present)
Katsumi Yoneda Hajime Fujishita Seiichi Shimbo Hiroshi Saito
Auditors
Officers
Yoichi ShibamuraExecutive Officer Dept. Manager, Accounting Dept.
Yoshio HagiwaraExecutive Officer Dept. Manager, Corporate Planning Dept.
Atsuro ShibagakiExecutive Officer President and CEO, TOK Advanced Materials Co., Ltd.
Jun JangOfficer Vice President, TOK Advanced Materials Co., Ltd.
Kazufumi SatoOfficer Deputy Dept. Manager, Research and Development Dept.
Koichi IrinoOfficer Chairman and President of TOK TAIWAN CO., LTD.
Yuichi MurakamiOfficer Deputy Dept. Manager, Manufacturing Dept.
Noriaki TaneichiOfficer Deputy Dept. Manager, New Business Development Dept.
Kousuke DoiOfficer President, TOKYO OHKA KOGYO AMERICA, INC.
Tsukasa HonkawaOfficer Dept. Manager, Process Equipment Manufacturing Dept.
67Annual Report 2016
Corporate G
overnance

68 TOKYO OHKA KOGYO CO., LTD.
—Historical 10-Year Performance and Analysis—
Net Sales and Operating Income: Long-Term Trend (Past 10 Years)Looking at TOK’s performance over the past 10 years, we first note that business structural reform sparked by the collapse of Lehman Brothers in 2008 has transformed our earnings structure so that sales growth is now tied directly to profit growth.
In the fiscal year ended March 31, 2007, brisk momentum in the Equipment Business mainly for the LCD panel market combined with expansion in the Material Business drove consolidated net sales past ¥100 billion for the first time.
In the fiscal year ended March 31, 2009, immediately following the collapse of Lehman Brothers, we recorded our first operating loss since going public. After that, we con-centrated on business structural reform and brought operat-ing income back into the black in the following fiscal year ended March 31, 2010. We kept revamping operations. Among other things, we streamlined domestic plants, divested an overseas subsidiary, and exited the printing material business. In the fiscal years ended March 31, 2011 and 2012, we became able to stably secure a certain level of profit.
From the fiscal year ended March 31, 2013, we shifted our focus to new business growth. We concentrated on strengthening and expanding cutting-edge materials for semiconductors, working even harder to strengthen close relationships with customers overseas, and dramatically reshaping our business portfolio.
As a result, we achieved record-high operating income in the fiscal year ended March 31, 2015. Along with accelerat-ing our growth strategy initiatives in pursuit of high-quality profits, we will also work in earnest to enhance capital efficiency as measured by indicators such as ROE.
In the fiscal year ended March 31, 2016, income declined as smartphone market growth slowed ( See page 70). Nevertheless, we are forging ahead towards record operat-ing income in the fiscal year ending March 31, 2019 under the “TOK Medium-Term Plan 2018” launched in the fiscal year ending March 31, 2017.
Overseas Sales Ratio: Long-Term Trend (Past 10 Years)With a focus on our strategy of close relationships with customers, we have worked to grow market share for core products and provide products that are in tune with chang-ing needs, especially with regard to overseas customers. As a result, overseas sales and the overseas sales ratio have stayed on an uptrend since the fiscal year ended March 31, 2010.
This has increased our exposure to fluctuation in foreign exchange rates, and we have taken steps to counter the risk of yen appreciation based on our financial risk management rules ( See Message from the CFO on page 29).
2016201520142013201220112010200920082007
89,96989,96988,08688,086
75,26975,26972,91972,91980,03780,03780,01680,016
70,64570,645
83,85083,850
102,482102,482101,955101,955
■ Net Sales (Millions of yen)
2016201520142013201220112010200920082007
12,43812,43813,25313,253
10,02510,025
7,8727,872
6,1026,1026,1236,123
364364
–1,367–1,367
8,4478,447
10,88410,884
■ Operating Income (Loss) (Millions of yen)
2016201520142013201220112010200920082007
77.077.075.675.671.571.569.269.2
66.166.161.961.9
58.158.161.361.3
58.258.258.858.8 69,25669,25666,60566,605
53,84153,84150,46450,464
52,90652,90649,47649,476
41,05741,057
51,35851,358
59,62459,62459,91159,911
■ Overseas Sales (Millions of yen)/Overseas Sales Ratio (%)
Overseas Sales Overseas Sales Ratio
(FY)
(FY)
(FY)
Financial Information

Financial Information/Corporate Inform
ation
69Annual Report 2016
Performance by Segment: Long-Term Trend (Past 10 Years)*Material BusinessIn the Material Business, reduced demand due to a global economic slump, as well as our exit from the printing material business contributed to a decline in sales levels from the fiscal year ended March 31, 2009. However, our focus on high added-value products and forging close relationships with customers helped the segment’s sales to enter a growth trend from the fiscal year ended March 31, 2014, achieving a record high in the fiscal year ended March 31, 2016.
Equipment BusinessIn the Equipment Business, process equipment for LCD panels drove sales to a record high in the fiscal year ended March 31, 2007. However, subsequent structural changes in the LCD panel market led to a downtrend in orders. While there are periods of sales expansion due to factors such as the timing of acceptance inspections and shipments, sales growth is stagnant largely because the 3D packaging market has been slower to gain traction than was anticipated.
* Intersegment sales or transfers have not been eliminated.
Financial Condition: Long-Term Trend (Past 10 Years)Total assets were on a downtrend through the fiscal year ended March 31, 2012, reflecting lackluster business activity. However, total assets returned to a growth trajectory from the fiscal year ended March 31, 2013 as earnings expanded.
The equity ratio has hovered around 85% since the fiscal year ended March 31, 2012. It is on an uptrend as a result of our strictly following a policy of maintaining a certain level of cash reserves since the 1990s, as well as a reduced increase in total assets from the fiscal year ended March 31, 2008 and subsequent curbs on growth in total assets.
Cash Flows: Long-Term Trend (Past 10 Years)Free cash flows were negative in the four fiscal years ended March 31, 2007, 2008, 2012, and 2014. These results were attributable to increases in expenditures for investing activi-ties such as payments into time deposits and long-term time deposits in three of the four fiscal years (the exception being the fiscal year ended March 31, 2007). There was not actually an issue with cash flows.
2016201520142013201220112010200920082007
–59–59–105–105–81–81–80–80–108–108–89–89–78–78–89–89–68–68–74–74
2,7482,7483,5813,581
2,4842,4845,3025,30213,50013,5008,6228,6225,6325,63211,35011,350
16,36316,36318,99118,991
87,28087,28084,61184,611
72,86672,86667,69767,69766,64566,645
71,48271,48265,09165,091
72,58972,589
86,18686,18683,03883,038
■ Net Sales by Business Segment (Millions of yen)
~ ~ ~ ~ ~ ~ ~ ~ ~ ~
Equipment Business Material Business Eliminations and Corporate
2016201520142013201220112010200920082007
11,90211,90213,57713,577
–2,110–2,110–4,385–4,385
–9,268–9,268
11,88111,881
–14,491–14,491
–10,197–10,197
–2,471–2,471
12,43812,438
–1,514–1,514 –1,844–1,844 –1,386–1,386–75–75
–18,523–18,523
15,35215,352
11,88211,882
–1,810–1,810–2,309–2,309–2,972–2,972 –2,917–2,917
2,5312,5313,9733,973
–3,990–3,990
–23,008–23,008
–15,822–15,822
14,83914,839
8,7448,74410,80210,802
–1,469–1,469
■ Cash Flows (Millions of yen)
Cash Flows from Operating Activities Cash Flows from Investing Activities Cash Flows from Financing Activities
2016201520142013201220112010200920082007
167,300167,300174,863174,863
155,859155,859145,664145,664
138,767138,767138,122138,122147,085147,085
84.084.0
166,610166,610159,633159,633
139,338139,338
79.979.977.377.3
85.185.184.384.3
87.587.5
85.985.985.185.1
79.579.5
83.783.7
■ Total Assets (Millions of yen)/Equity Ratio (%)
Total Assets Equity Ratio
(FY)
(As of March 31)
(FY)

70 TOKYO OHKA KOGYO CO., LTD.
Business EnvironmentIn the fiscal year ended March 31, 2016, the global econ-omy overall was marked by modest recovery. Although China’s economy declined gradually, economic recovery continued in places such as the U.S. and the Eurozone, even though tempered by weakness. Furthermore, the Japanese economy stayed on a recovery track, aided by various government policies amid ongoing improvement in employment and income conditions against a backdrop of strong corporate earnings.
The yen averaged ¥120.8 against the U.S. dollar and was generally weaker year on year for the first half of the fiscal year ended March 31, 2016. The yen continued to trend toward depreciation through the third quarter of the fiscal year, but shifted to appreciation from the fourth quarter. As a result, the average rate for the full fiscal year was ¥119.3 against the U.S. dollar, roughly ¥10 weaker against the U.S. dollar than in the previous fiscal year.
Net Sales and Operating IncomeIn the fiscal year ended March 31, 2016, consolidated net sales increased ¥1,882 million, or 2.1%, from the previous fiscal year to ¥89,969 million. Net sales in the first half increased ¥2,747 million, or 6.5%, to ¥44,805 million. Net sales in the second half decreased ¥865 million, or 1.9%, to ¥45,163 million.
In the electronics industry, the leading source of demand for our products, business was lackluster overall, with a drop in demand for PCs and tablet devices as well as a slowdown in smartphone market growth.
Cost of sales increased ¥1,557 million, or 2.8%, from the previous fiscal year to ¥56,659 million. The increase was driven mainly by increases in depreciation and amortization and costs for consumables, despite declines in materials costs, inventory disposal losses, and storage and transpor-tation costs, among others. The cost of sales ratio climbed 0.4 percentage points to 63.0%. As a result, gross profit
increased ¥324 million, or 1.0%, to ¥33,309 million.Selling, general and administrative (SG&A) expenses
increased ¥1,139 million, or 5.8%, from the previous fiscal year to ¥20,871 million, mainly due to an increase in patent royalty and depreciation and amortization, despite decreases in utilities costs (water, gas, and electricity) and consumables.
Operating income declined by ¥814 million, or 6.1%, from the previous fiscal year to ¥12,438 million, mainly due to the increase in SG&A expenses, despite the increase in gross profit.
Performance by Segment*Material Business SegmentSales in the Material Business increased by ¥2,668 million, or 3.2%, from the previous fiscal year to ¥87,280 million. Operating income decreased ¥152 million, or 0.9%, to ¥16,203 million, due to increases in expenses such as man-ufacturing expenses and SG&A expenses, despite an increase in sales of high value-added products and foreign exchange fluctuation gains.
■ Electronic Functional Materials DivisionIn the electronic functional materials division, sales increased ¥1,315 million, or 2.6%, to ¥51,134 million.
Sales of semiconductor photoresists were robust. We won new business in products for 3D memory, which is seen as a promising market for growth in terms of new applications for excimer laser photoresists. In addition, the South Korean subsidiary’s efforts to expand sales of locally developed products and other initiatives delivered solid results. There was also a contribution from major users fully deploying cutting-edge processes in mass production. On the other hand, sales of photoresists for LCDs substantially decreased year on year as products for high-definition dis-plays and general-purpose products were affected by changes in the demand environment and a drop in product
— FY2016 Results of Operations, Financial Position and FY2017 Performance Outlook—
20162015
87,28087,28084,61184,611
3,5813,581 2,7482,748
■ Net Sales by Segment Year-on-Year Comparison (Millions of yen)
Material Business Equipment Business
[Equipment Business]
–23.2%Delay in the market takeoff,
customers’ capital investment restraint, etc.
[Material Business]
+3.2%Expansion of semiconductor photoresist and high-density
integration materials, etc.
32´16/112111098765´15/4
113.03
115.08
118.34
121.85122.58
120.07
120.23
123.21123.25123.75
120.75119.58
■ Exchange Rate (Yen/U.S. dollars, Monthly average)
(FY)Source: Mitsubishi UFJ Research and Consulting Co., Ltd.
* Intersegment sales or transfers have not been eliminated.

Financial Information/Corporate Inform
ation
71Annual Report 2016
prices. However, sales of high-density integration materials grew sharply thanks to successful R&D and sales activities that precisely reflect user needs, and higher sales of photo-resists for semiconductor packages and photoresists for MEMS (microelectromechanical systems).
■ High Purity Chemicals DivisionSales in the high purity chemicals division increased ¥1,086 million, or 3.1%, from the previous fiscal year to ¥35,931 million.
Sales of photoresist chemicals used to manufacture semiconductors grew, buoyed by a rise in sales of high- quality products for cutting-edge processes—especially in Asia. In contrast, sales of photoresist-related chemicals used to manufacture LCDs fell, owing to sluggish sales in the domestic and Asian market.
Equipment Business Segment■ Process Equipment DivisionSales and orders of the Zero Newton TSV process system fell, owing mainly to the delay in the takeoff of the 3D pack-aging market and users’ capital expenditure curbs.
As a result, sales in the Equipment Business decreased ¥832 million or 23.2% year on year to ¥2,748 million. Operating loss expanded by ¥443 million from the previous fiscal year to a loss of ¥423 million.
Orders decreased ¥1,334 million, or 38.1%, from the previous fiscal year to ¥2,166 million. Orders in the first half totaled ¥1,210 million and in the second half ¥955 million. The year-end order backlog increased ¥67 million, or 6.3%, to ¥1,140 million.
Financial ConditionTotal assets as of March 31, 2016 decreased by ¥7,563 million from the previous fiscal year-end to ¥167,300 million.
Total current assets as of March 31, 2016 decreased ¥3,939 million from the previous fiscal year-end to ¥87,114 million. This primarily reflects declines of ¥3,090 million in
cash and cash equivalents, ¥1,500 million in trade notes and accounts, and ¥465 million in “other” under current assets, partially due to a decrease in short-term loans receivable, which outweighed a ¥1,444 million increase in inventories.
Non-current assets declined ¥3,623 million from the previous fiscal year-end to ¥80,185 million. This was mainly attributable to decreases of ¥2,017 million in net defined benefit assets, ¥1,119 million in investment securities due to sales and declining market value of investment securi-ties, and ¥1,458 million in property, plant and equipment reflecting depreciation, which outweighed an increase of ¥1,232 million in deferred tax assets.
Total liabilities decreased ¥2,834 million year on year to ¥20,029 million. Increases of ¥660 million in payables and ¥132 million in short-term loans payable were more than offset by decreases of ¥2,010 million in trade notes and accounts, ¥865 million in income taxes payable, and ¥411 million in long-term loans payable.
Total equity as of March 31, 2016 decreased ¥4,728 million from the previous fiscal year-end to ¥147,270 million. The decrease mainly reflects purchase of treasury stock of ¥6,269 million, cash dividends paid of ¥2,734 million, and remeasurements of defined benefit plans of ¥1,844 million, and a decrease in unrealized gain on available-for-sale secu-rities of ¥1,043 million, despite recording profit attributable to owners of the parent of ¥7,716 million.
As a result, the equity ratio stood at 85.1% at the end of the fiscal year.
Cash FlowsNet cash provided by operating activities during the fiscal year under review came to ¥11,902 million, a decrease of ¥1,675 million from the end of the previous fiscal year. The decrease reflected a decrease in trade notes and accounts payable, and income before income taxes, which was par-tially offset by a decrease in trade notes and accounts receivable, foreign exchange loss—net, and an increase in depreciation and amortization.
20162015
80,18580,185
87,11487,114
83,80983,809
91,05491,054
■ Total Assets Year-on-Year Comparison (Millions of yen)
Current Assets Non-Current Assets
[Non-current Assets]
–¥3,600 millionDecrease in net defined
benefit assets
Decrease in property, plant and equipment, etc.
[Current Assets]
–¥3,900 millionDecrease in cash and depositsDecrease in trade notes and
accounts receivable, etc.
20162015
¥16,400million
¥16,400million
¥16,200million
¥16,200million
■ Breakdown of Change in Material Business Segment Operating Income
Impact of sales increase
+¥1,500 million
Impact of exchange rate changes and discounted selling
prices
+¥500 million
Expenses increase
–¥2,200 million
–¥200 million(FY) (As of March 31)
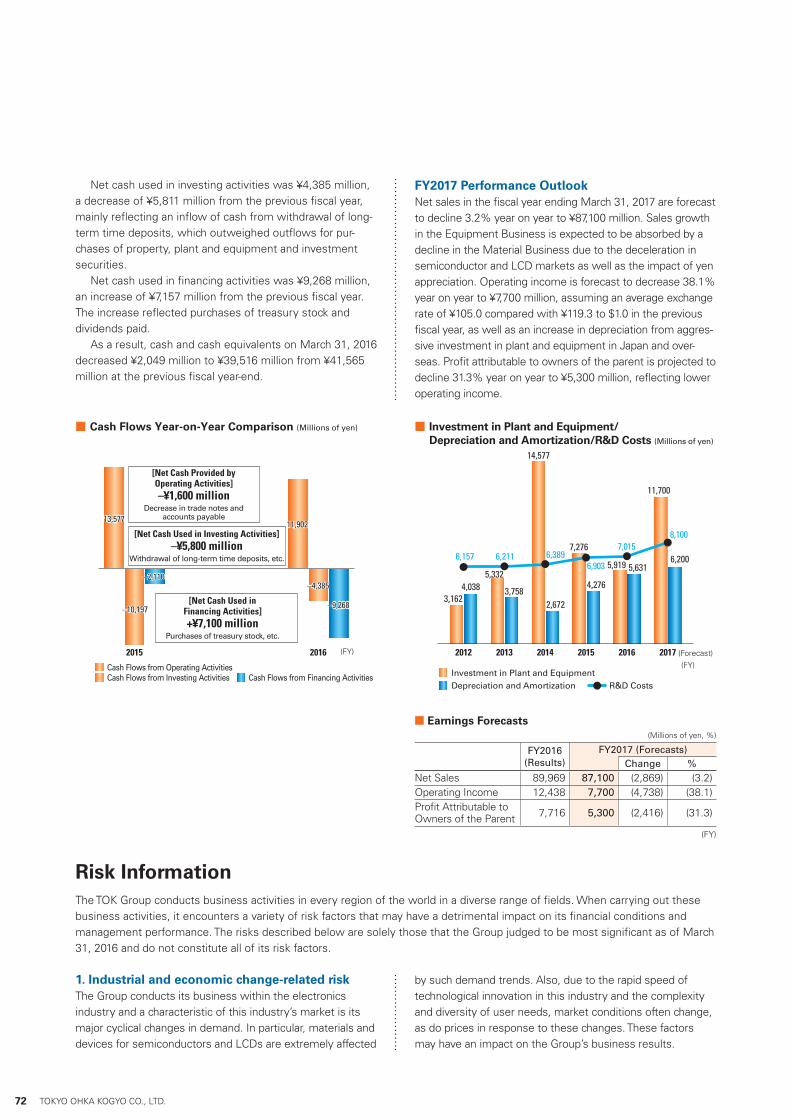
72 TOKYO OHKA KOGYO CO., LTD.
FY2017 Performance OutlookNet sales in the fiscal year ending March 31, 2017 are forecast to decline 3.2% year on year to ¥87,100 million. Sales growth in the Equipment Business is expected to be absorbed by a decline in the Material Business due to the deceleration in semiconductor and LCD markets as well as the impact of yen appreciation. Operating income is forecast to decrease 38.1% year on year to ¥7,700 million, assuming an average exchange rate of ¥105.0 compared with ¥119.3 to $1.0 in the previous fiscal year, as well as an increase in depreciation from aggres-sive investment in plant and equipment in Japan and over-seas. Profit attributable to owners of the parent is projected to decline 31.3% year on year to ¥5,300 million, reflecting lower operating income.
201720162015201420132012
3,1623,1624,0384,038
6,157 6,211 6,3896,903
7,0158,100
5,3325,332
3,7583,7582,6722,672
4,2764,276
5,9195,919 5,6315,631
7,2767,276
14,57714,577
11,70011,700
6,2006,200
■ Investment in Plant and Equipment/ Depreciation and Amortization/R&D Costs (Millions of yen)
Investment in Plant and EquipmentDepreciation and Amortization R&D Costs
(FY)(Forecast)
■ Earnings Forecasts(Millions of yen, %)
FY2016 (Results)
FY2017 (Forecasts)Change %
Net Sales 89,969 87,100 (2,869) (3.2)Operating Income 12,438 7,700 (4,738) (38.1)Profit Attributable to Owners of the Parent 7,716 5,300 (2,416) (31.3)
(FY)
Net cash used in investing activities was ¥4,385 million, a decrease of ¥5,811 million from the previous fiscal year, mainly reflecting an inflow of cash from withdrawal of long-term time deposits, which outweighed outflows for pur-chases of property, plant and equipment and investment securities.
Net cash used in financing activities was ¥9,268 million, an increase of ¥7,157 million from the previous fiscal year. The increase reflected purchases of treasury stock and dividends paid.
As a result, cash and cash equivalents on March 31, 2016 decreased ¥2,049 million to ¥39,516 million from ¥41,565 million at the previous fiscal year-end.
20162015
11,90211,902
–4,385–4,385
–9,268–9,268
13,57713,577
–10,197–10,197
–2,110–2,110
■ Cash Flows Year-on-Year Comparison (Millions of yen)
[Net Cash Used in Financing Activities]+¥7,100 million
Purchases of treasury stock, etc.
[Net Cash Used in Investing Activities]–¥5,800 million
Withdrawal of long-term time deposits, etc.
[Net Cash Provided by Operating Activities]–¥1,600 million
Decrease in trade notes and accounts payable
Cash Flows from Operating Activities Cash Flows from Investing Activities Cash Flows from Financing Activities
(FY)
Risk InformationThe TOK Group conducts business activities in every region of the world in a diverse range of fields. When carrying out these business activities, it encounters a variety of risk factors that may have a detrimental impact on its financial conditions and management performance. The risks described below are solely those that the Group judged to be most significant as of March 31, 2016 and do not constitute all of its risk factors.
1. Industrial and economic change-related riskThe Group conducts its business within the electronics industry and a characteristic of this industry’s market is its major cyclical changes in demand. In particular, materials and devices for semiconductors and LCDs are extremely affected
by such demand trends. Also, due to the rapid speed of technological innovation in this industry and the complexity and diversity of user needs, market conditions often change, as do prices in response to these changes. These factors may have an impact on the Group’s business results.

Financial Information/Corporate Inform
ation
73Annual Report 2016
2. Exchange rate fluctuation-related riskThe Group is focusing its energies into developing its busi-nesses in the markets of North America, Europe, and Asia, which are expected to expand in the future, and has produc-tion and sales bases in these regions. Some of the Group’s overseas transactions are yen-denominated, while for others it carries out risk hedging through forward exchange contracts. However, if exchange rate fluctuations are greater than fore-cast, this may have an impact on the Group’s business results.
3. Research and development-related riskIn order for the Group to maintain its competitiveness in the electronics industry, where technological innovation occurs at a rapid pace, it carries out R&D to provide products that precisely reflect user needs. However, realizing technologi-cal innovation and anticipating changes to user needs are not easy tasks and regardless of how much management resources it invests into R&D, due to unforeseeable reasons it may not produce the hoped-for results. This may have an impact on the Group’s business results.
4. Intellectual property-related riskIn carrying out its business activities, the Group has acquired a diverse portfolio of intellectual property, to which it grants licenses to third parties. Also, when it deems it necessary or useful to do so, it acquires licenses from third parties in order to use their intellectual property. If the Group is unable to safeguard and maintain its own intellec-tual property rights or acquire third party rights as antici-pated, it may become a party in a dispute or lawsuit relating to these rights. The costs incurred due to these events may have an impact on the Group’s business results.
5. Raw material procurement-related riskThe Group uses various raw materials in its production activities and it aims to stably procure these materials by maintaining a network of multiple suppliers. However, its production activities may be affected by a delay or suspension in the supply of raw materials due to problems at the manu-facturers of these materials. This may have an impact on the Group’s business results. In addition, an increase in the price of raw materials may have an impact on its business results.
6. Product liability-related riskWithin the process in which the Group supplies its products to customers who then use them, problems may occur that originate in a product defect. The Group has insurance to cover product liability compensation payments, but insurance may not be able to cover the entire amount that has to be paid. Therefore, if such a problem occurs it may have an impact on the Group’s business results.
7. Natural disaster and accident-related riskThe Group has established manufacturing plants both within Japan and overseas. In the event of a natural disaster, such as an earthquake, or an unforeseen accident, such as a fire or
an explosion, it may have to suspend its production activities and delay product shipments. The Group may also have to pay repair or replacement costs at the damaged plant. These events may have an impact on the Group’s business results.
8. Environment-related riskThe Group uses various types of chemical substance within its production activities and has strict rules to ensure they are handled safely. However, in the event of an accident involving the leakage of chemical substances, the Group’s reputation within society may be affected, it may have to pay costs as compensation or in order to carry out counter measures, and it may have to suspend production activities. These factors may have an impact on the Group’s business results.
In addition, the Group always observes the various environment-related laws and regulations in each country where it conducts its business activities. However, in the future these laws and regulations may be made stricter the Group may be forced to pay additional costs or limit its business activities. These factors may have an impact on the Group’s business results.
9. Legal riskWhen conducting its business activities throughout the world, the Group must acquire approval for business and investment activities and observe each government’s regulations relating to restrictions on imports and exports. In addition, it must observe laws and regulations relating to trade, monopolies, international taxation, the environment, and recycling. If there are major revisions to any of these laws and regulations, or if the Group fails to precisely understand their requirements, or if for any reason it is unable to observe them, then this may have an impact on the Group’s business results.
10. Overseas business activity-related riskThe Group carries out production and sales activities in North America and Asia and sales activities in Europe. However, in its overseas business activities it constantly faces the follow-ing types of risk; unexpected revisions to laws and regula-tions; a weakening of the industrial base; difficulties in securing the required personnel; and the possibility of terrorist attacks, conflicts, and natural disasters. If any of these risks occur, it may obstruct the Group’s overseas business activities and have an impact on its business results.
11. Information leakage riskThe Group possesses confidential business information and also information relating to various other companies and individuals. It implements thorough measures to ensure the security of all the information it handles, but if due to some unforeseeable event information leaks outside of the Group, this may damage its reputation within society and it may have to pay liability payments for the damage caused to a company or individual whose information was leaked. These factors may have an impact on the Group’s business results.
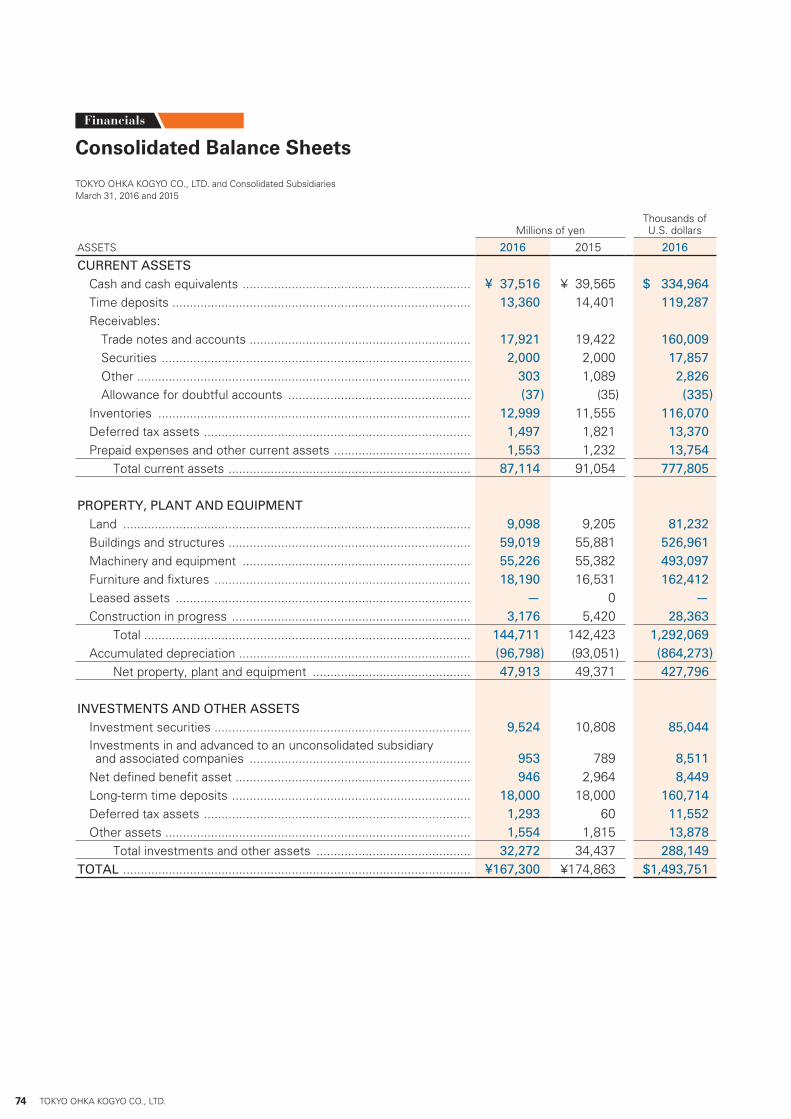
Financials
74 TOKYO OHKA KOGYO CO., LTD.
Consolidated Balance Sheets
TOKYO OHKA KOGYO CO., LTD. and Consolidated SubsidiariesMarch 31, 2016 and 2015
Millions of yenThousands of U.S. dollars
ASSETS 2016 2015 2016
CURRENT ASSETSCash and cash equivalents ................................................................. ¥ 37,516 ¥ 39,565 $ 334,964Time deposits ..................................................................................... 13,360 14,401 119,287Receivables:
Trade notes and accounts ............................................................... 17,921 19,422 160,009Securities ........................................................................................ 2,000 2,000 17,857Other ............................................................................................... 303 1,089 2,826Allowance for doubtful accounts .................................................... (37) (35) (335)
Inventories ......................................................................................... 12,999 11,555 116,070Deferred tax assets ............................................................................ 1,497 1,821 13,370Prepaid expenses and other current assets ....................................... 1,553 1,232 13,754
Total current assets ..................................................................... 87,114 91,054 777,805
PROPERTY, PLANT AND EQUIPMENTLand ................................................................................................... 9,098 9,205 81,232Buildings and structures ..................................................................... 59,019 55,881 526,961Machinery and equipment ................................................................. 55,226 55,382 493,097Furniture and fixtures ......................................................................... 18,190 16,531 162,412Leased assets .................................................................................... — 0 —Construction in progress .................................................................... 3,176 5,420 28,363
Total ............................................................................................. 144,711 142,423 1,292,069Accumulated depreciation .................................................................. (96,798) (93,051) (864,273)
Net property, plant and equipment ............................................. 47,913 49,371 427,796
INVESTMENTS AND OTHER ASSETSInvestment securities ......................................................................... 9,524 10,808 85,044Investments in and advanced to an unconsolidated subsidiary and associated companies ............................................................... 953 789 8,511Net defined benefit asset ................................................................... 946 2,964 8,449Long-term time deposits .................................................................... 18,000 18,000 160,714Deferred tax assets ............................................................................ 1,293 60 11,552Other assets ....................................................................................... 1,554 1,815 13,878
Total investments and other assets ............................................ 32,272 34,437 288,149TOTAL ................................................................................................... ¥167,300 ¥174,863 $1,493,751
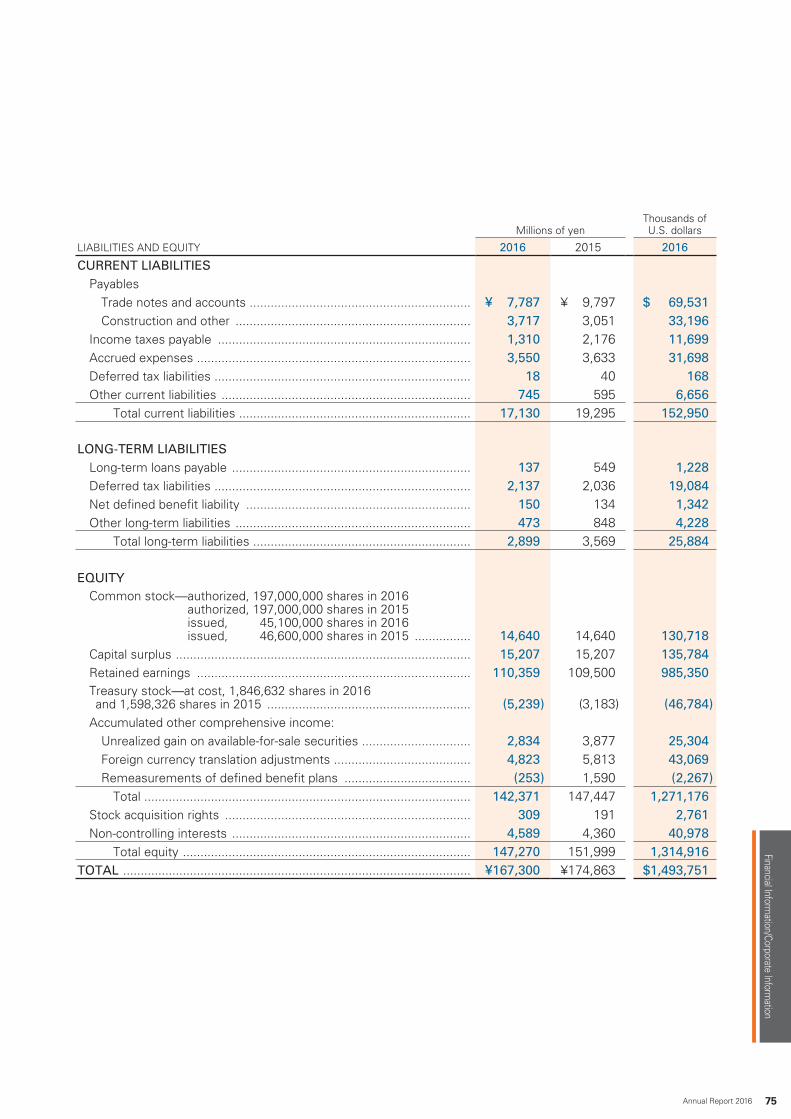
Financial Information/Corporate Inform
ation
75Annual Report 2016
Millions of yenThousands of U.S. dollars
LIABILITIES AND EQUITY 2016 2015 2016
CURRENT LIABILITIESPayables
Trade notes and accounts ............................................................... ¥ 7,787 ¥ 9,797 $ 69,531Construction and other ................................................................... 3,717 3,051 33,196
Income taxes payable ........................................................................ 1,310 2,176 11,699Accrued expenses .............................................................................. 3,550 3,633 31,698Deferred tax liabilities ......................................................................... 18 40 168Other current liabilities ....................................................................... 745 595 6,656
Total current liabilities .................................................................. 17,130 19,295 152,950
LONG-TERM LIABILITIESLong-term loans payable .................................................................... 137 549 1,228Deferred tax liabilities ......................................................................... 2,137 2,036 19,084Net defined benefit liability ................................................................ 150 134 1,342Other long-term liabilities ................................................................... 473 848 4,228
Total long-term liabilities .............................................................. 2,899 3,569 25,884
EQUITYCommon stock— authorized, 197,000,000 shares in 2016
authorized, 197,000,000 shares in 2015 issued, 45,100,000 shares in 2016 issued, 46,600,000 shares in 2015 ................ 14,640 14,640 130,718
Capital surplus .................................................................................... 15,207 15,207 135,784Retained earnings .............................................................................. 110,359 109,500 985,350Treasury stock—at cost, 1,846,632 shares in 2016 and 1,598,326 shares in 2015 .......................................................... (5,239) (3,183) (46,784)Accumulated other comprehensive income:
Unrealized gain on available-for-sale securities ............................... 2,834 3,877 25,304Foreign currency translation adjustments ....................................... 4,823 5,813 43,069Remeasurements of defined benefit plans .................................... (253) 1,590 (2,267)
Total ............................................................................................. 142,371 147,447 1,271,176Stock acquisition rights ...................................................................... 309 191 2,761Non-controlling interests .................................................................... 4,589 4,360 40,978
Total equity .................................................................................. 147,270 151,999 1,314,916TOTAL ................................................................................................... ¥167,300 ¥174,863 $1,493,751

Financials
76 TOKYO OHKA KOGYO CO., LTD.
Consolidated Statements of Income
TOKYO OHKA KOGYO CO., LTD. and Consolidated SubsidiariesYears Ended March 31, 2016 and 2015
Millions of yenThousands of U.S. dollars
2016 2015 2016NET SALES ............................................................................................ ¥89,969 ¥88,086 $803,296COST OF SALES ................................................................................... 56,659 55,101 505,890
Gross profit .................................................................................. 33,309 32,984 297,405SELLING, GENERAL AND ADMINISTRATIVE EXPENSES .................... 20,871 19,731 186,350
Operating income ........................................................................ 12,438 13,253 111,054OTHER INCOME (EXPENSES)
Interest and dividend income ............................................................. 287 229 2,569Foreign exchange (loss) gain—net ..................................................... (642) 1,459 (5,735)Gain (loss) on valuation of derivatives ................................................ 270 (460) 2,418Equity in earnings of an associate ...................................................... 219 101 1,961Loss related to a new factory ............................................................. — (496) —Operation preparation expense .......................................................... (339) — (3,033)Loss on impairment of long-lived assets ............................................ (752) (665) (6,722)Gain on revision of retirement benefit plan ........................................ — 622 —Other—net ......................................................................................... 296 258 2,647
Other (expenses) income—net ................................................... (660) 1,048 (5,895)INCOME BEFORE INCOME TAXES AND NON-CONTROLLING INTERESTS ... 11,777 14,301 105,159INCOME TAXES
Current ............................................................................................... 3,031 4,161 27,065Prior years .......................................................................................... 18 40 165Deferred ............................................................................................. 468 663 4,180
Total income taxes ...................................................................... 3,518 4,865 31,411NET INCOME BEFORE NON-CONTROLLING INTERESTS ............... 8,259 9,435 73,748NON-CONTROLLING INTERESTS IN NET INCOME .......................... 543 617 4,848PROFIT ATTRIBUTABLE TO OWNERS OF THE PARENT .................. ¥ 7,716 ¥ 8,818 $ 68,899
Yen U.S. dollars
PER SHARE OF COMMON STOCK 2016 2015 2016Basic profit ............................................................................................. ¥177.30 ¥196.61 $1.58Diluted profit .......................................................................................... 176.17 195.71 1.57Cash dividends applicable to the year ................................................... 64.00 60.00 0.57
Consolidated Statements of Comprehensive Income
TOKYO OHKA KOGYO CO., LTD. and Consolidated SubsidiariesYears Ended March 31, 2016 and 2015
Millions of yenThousands of U.S. dollars
2016 2015 2016NET INCOME BEFORE NON-CONTROLLING INTERESTS ............... ¥ 8,259 ¥ 9,435 $ 73,748OTHER COMPREHENSIVE INCOME
Unrealized (loss) gain on available-for-sale securities ......................... (1,043) 1,471 (9,314)Foreign currency translation adjustments .......................................... (1,127) 3,168 (10,068)Remeasurements of defined benefit plans ........................................ (1,844) 210 (16,468)Share of other comprehensive income in an associate ..................... (55) 72 (496)
Total other comprehensive income ............................................. (4,071) 4,921 (36,348)COMPREHENSIVE INCOME ................................................................ ¥ 4,188 ¥14,357 $ 37,400TOTAL COMPREHENSIVE INCOME ATTRIBUTABLE TO
Owners of the parent ......................................................................... ¥ 3,838 ¥13,377 $ 34,275Non-controlling interests .................................................................... 349 980 3,124

Financials
Financial Information/Corporate Inform
ation
77Annual Report 2016
Consolidated Statements of Changes in Equity
TOKYO OHKA KOGYO CO., LTD. and Consolidated SubsidiariesYears Ended March 31, 2016 and 2015
Thousands Millions of yenAccumulated other comprehensive
income (loss)Number of shares of
common stock outstanding
Common stock
Capital surplus
Retained earnings
Treasury stock
Unrealized (loss) gain on available-for-sale securities
Foreign currency
translation adjustments
Remea-surements of
defined benefit plans Total
Subscription rights to shares
Non-controlling interests
Total equity
BALANCE, APRIL 1, 2014 44,823 ¥14,640 ¥15,207 ¥103,162 ¥(3,280) ¥ 2,406 ¥2,936 ¥ 1,380 ¥136,453 ¥ 83 ¥3,425 ¥139,962 Cumulative effect
of changes in accounting policy 129 129 129
Restated balance 44,823 14,640 15,207 103,292 (3,280) 2,406 2,936 1,380 136,583 83 3,425 140,092 Profit attributable to
owners of the parent — — — 8,818 — — — — 8,818 — — 8,818 Cash dividends paid: Final for prior year,
¥28.0 per share — — — (1,260) — — — — (1,260) — — (1,260) Interim for current
year, ¥30.0 per share — — — (1,350) — — — — (1,350) — — (1,350) Purchase of
treasury stock (0) — — — (2) — — — (2) — — (2) Disposal of
treasury stock 51 — — — 99 — — — 99 — — 99 Retirement of
treasury stock — — — — — — — — — — — — Net change in the year — — — — — 1,471 2,877 210 4,558 108 934 5,601BALANCE, MARCH 31, 2015 44,873 14,640 15,207 109,500 (3,183) 3,877 5,813 1,590 147,447 191 4,360 151,999 Cumulative effect
of changes in accounting policy —
Restated balance 44,873 14,640 15,207 109,500 (3,183) 3,877 5,813 1,590 147,447 191 4,360 151,999 Profit attributable to
owners of the parent — — — 7,716 — — — — 7,716 — — 7,716 Cash dividends paid: Final for prior year,
¥30.0 per share — — — (1,350) — — — — (1,350) — — (1,350) Interim for current
year, ¥32.0 per share — — — (1,384) — — — — (1,384) — — (1,384) Purchase of
treasury stock (1,750) — — — (6,269) — — — (6,269) — — (6,269) Disposal of
treasury stock 45 — — (0) 89 — — — 88 — — 88 Retirement of
treasury stock — — — (4,123) 4,123 — — — — — — — Net change in the year — — — — — (1,043) (990) (1,844) (3,877) 118 229 (3,530)BALANCE, MARCH 31, 2016 43,169 ¥14,640 ¥15,207 ¥110,359 ¥(5,239) ¥ 2,834 ¥4,823 ¥ (253) ¥142,371 ¥309 ¥4,589 ¥147,270
Thousands of U.S. dollarsAccumulated other comprehensive
income (loss)
Common stock
Capital surplus
Retained earnings
Treasury stock
Unrealized (loss) gain on available-for-sale securities
Foreign currency
translation adjustments
Remea-surements of
defined benefit plans Total
Subscription rights to shares
Non-controlling interests
Total equity
BALANCE, MARCH 31, 2015 $130,718 $135,784 $977,686 $(28,424) $34,619 $51,909 $ 14,201 $1,316,495 $1,707 $38,931 $1,357,134 Cumulative effect
of changes in accounting policy —
Restated balance 130,718 135,784 977,686 (28,424) 34,619 51,909 14,201 1,316,495 1,707 38,931 1,357,134 Profit attributable to
owners of the parent — — 68,899 — — — — 68,899 — — 68,899 Cash dividends paid: Final for prior year,
$0.27 per share — — (12,054) — — — — (12,054) — — (12,054) Interim for current
year, $0.29 per share — — (12,358) — — — — (12,358) — — (12,358) Purchase of
treasury stock — — — (55,973) — — — (55,973) — — (55,973) Disposal of
treasury stock — — (5) 796 — — — 791 — — 791 Retirement of
treasury stock — — (36,817) 36,817 — — — — — — — Net change in the year — — — — (9,314) (8,840) (16,468) (34,624) 1,053 2,047 (31,522)BALANCE, MARCH 31, 2016 $130,718 $135,784 $985,350 $(46,784) $25,304 $43,069 $ (2,267) $1,271,176 $2,761 $40,978 $1,314,916
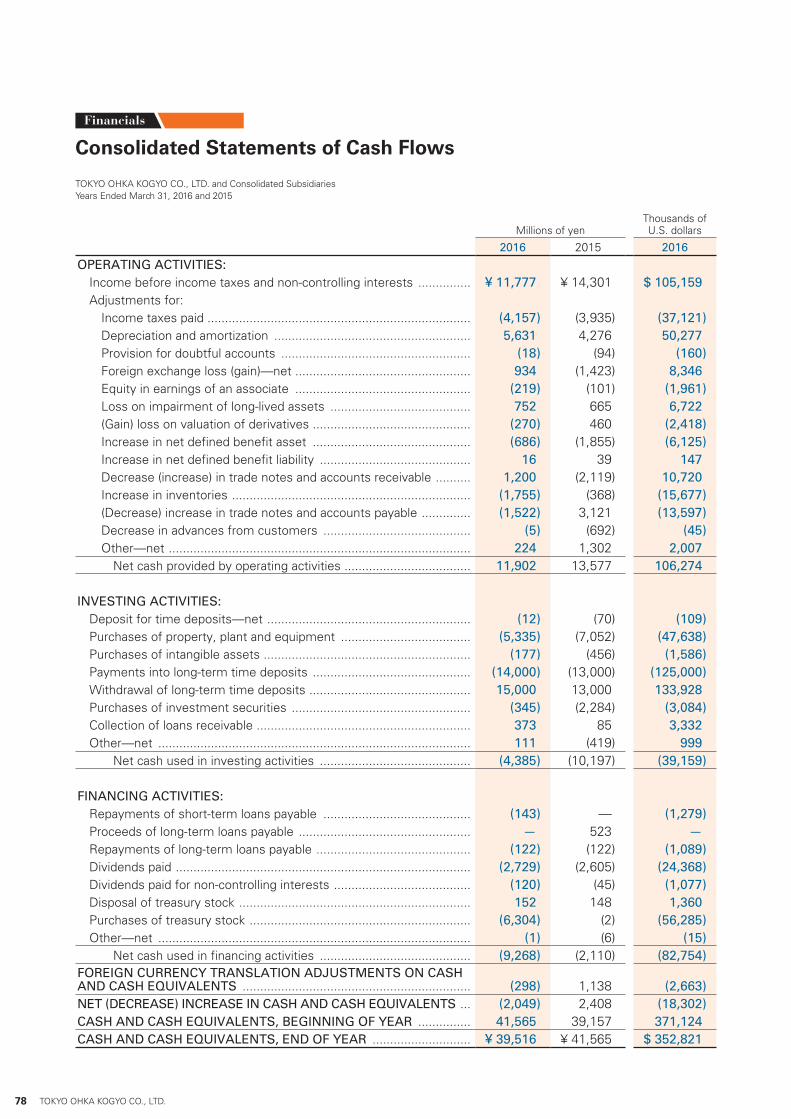
Financials
78 TOKYO OHKA KOGYO CO., LTD.
Consolidated Statements of Cash Flows
TOKYO OHKA KOGYO CO., LTD. and Consolidated SubsidiariesYears Ended March 31, 2016 and 2015
Millions of yenThousands of U.S. dollars
2016 2015 2016
OPERATING ACTIVITIES:Income before income taxes and non-controlling interests ............... ¥ 11,777 ¥ 14,301 $ 105,159Adjustments for:
Income taxes paid ........................................................................... (4,157) (3,935) (37,121)Depreciation and amortization ........................................................ 5,631 4,276 50,277Provision for doubtful accounts ...................................................... (18) (94) (160)Foreign exchange loss (gain)—net .................................................. 934 (1,423) 8,346Equity in earnings of an associate .................................................. (219) (101) (1,961)Loss on impairment of long-lived assets ........................................ 752 665 6,722(Gain) loss on valuation of derivatives ............................................. (270) 460 (2,418)Increase in net defined benefit asset ............................................. (686) (1,855) (6,125)Increase in net defined benefit liability ........................................... 16 39 147Decrease (increase) in trade notes and accounts receivable .......... 1,200 (2,119) 10,720Increase in inventories .................................................................... (1,755) (368) (15,677)(Decrease) increase in trade notes and accounts payable .............. (1,522) 3,121 (13,597)Decrease in advances from customers .......................................... (5) (692) (45)Other—net ...................................................................................... 224 1,302 2,007
Net cash provided by operating activities .................................... 11,902 13,577 106,274
INVESTING ACTIVITIES:Deposit for time deposits—net .......................................................... (12) (70) (109)Purchases of property, plant and equipment ..................................... (5,335) (7,052) (47,638)Purchases of intangible assets ........................................................... (177) (456) (1,586)Payments into long-term time deposits ............................................. (14,000) (13,000) (125,000)Withdrawal of long-term time deposits .............................................. 15,000 13,000 133,928Purchases of investment securities ................................................... (345) (2,284) (3,084)Collection of loans receivable ............................................................. 373 85 3,332Other—net ......................................................................................... 111 (419) 999
Net cash used in investing activities ........................................... (4,385) (10,197) (39,159)
FINANCING ACTIVITIES:Repayments of short-term loans payable .......................................... (143) — (1,279)Proceeds of long-term loans payable ................................................. — 523 —Repayments of long-term loans payable ............................................ (122) (122) (1,089)Dividends paid .................................................................................... (2,729) (2,605) (24,368)Dividends paid for non-controlling interests ....................................... (120) (45) (1,077)Disposal of treasury stock .................................................................. 152 148 1,360Purchases of treasury stock ............................................................... (6,304) (2) (56,285)Other—net ......................................................................................... (1) (6) (15)
Net cash used in financing activities ........................................... (9,268) (2,110) (82,754)FOREIGN CURRENCY TRANSLATION ADJUSTMENTS ON CASH AND CASH EQUIVALENTS ................................................................. (298) 1,138 (2,663)NET (DECREASE) INCREASE IN CASH AND CASH EQUIVALENTS ... (2,049) 2,408 (18,302)CASH AND CASH EQUIVALENTS, BEGINNING OF YEAR ............... 41,565 39,157 371,124CASH AND CASH EQUIVALENTS, END OF YEAR ............................ ¥ 39,516 ¥ 41,565 $ 352,821

Data
Corporate Information (As of March 31, 2016)
Corporate Information / Stock Information
Stock Information (As of March 31, 2016)
General Information Change of Stock Price and Turnover(Yen) (Thousands of shares)
32112111098
2015 2016
76540
3,000
6,000
9,000
12,000
15,000
0
1,000
2,000
3,000
4,000
5,000
NameNumber of
Shares Held(Thousands)
Ratio of Shareholding
(%)
BNYM TREATY DTT 15 2,373 5.49Meiji Yasuda Life Insurance Company 1,826 4.22Japan Trustee Services Bank, Ltd. (Trust Account) 1,776 4.11The Master Trust Bank of Japan, Ltd. (Trust Account) 1,739 4.02MLPFS CUSTODY ACCOUNT 1,494 3.45The Bank of Tokyo-Mitsubishi UFJ, Ltd. 1,207 2.79The Bank of Yokohama, Ltd. 1,026 2.37Tokyo Ohka Foundation for The Promotion of Science and Technology 984 2.28Mitsubishi UFJ Trust and Banking Corporation 953 2.21Mitsubishi UFJ Capital Co., Ltd. 860 1.99
Notes:1. The Company owns 1,846 thousand shares of treasury stock which is excluded from the
above Major shareholders.2. The ratio of shareholding is calculated based on the number of shares (43,253,368 shares)
obtained by subtracting the number of treasury stock from the total number of shares issued.
Classification of ShareholdersMajor Shareholders
JapaneseIndividualsand Others
7,46316.55%
ForeignCorporations
and Individuals14,78332.78%
JapaneseFinancial
Institutions13,94930.93%
OtherJapanese
Corporations7,947
17.62%
Financial Instruments Firms956
2.12%
Head office
Corporate Name TOKYO OHKA KOGYO CO., LTD.
Established October 25, 1940
Headquarters 150 Nakamaruko, Nakahara-ku, Kawasaki-shi, Kanagawa 211-0012, JAPAN
Number of Employees 1,564 (Consolidated)
Paid-In Capital ¥14,640,448,000
Web Site http://www.tok.co.jp/eng
Stock Listing Tokyo
Investor Relations Contact
Public Relations Division150 Nakamaruko, Nakahara-ku, Kawasaki-shi, Kanagawa 211-0012, JAPANTEL. +81-44-435-3000FAX. +81-44-435-3020
Total Number of Shares Authorized
197,000,000
Number of Shares Issued 45,100,000
Number of Shareholders 6,052
(Thousand shares)
Financial Information/Corporate Inform
ation
79Annual Report 2016
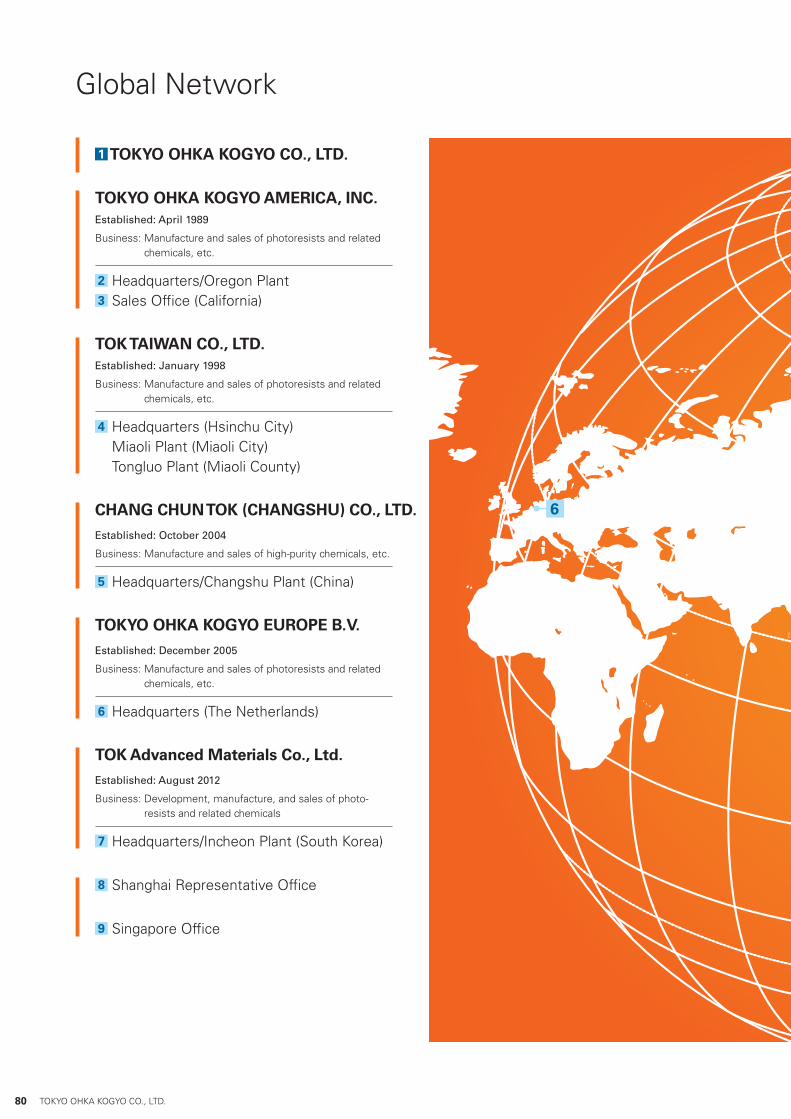
Global Network
1 TOKYO OHKA KOGYO CO., LTD.
TOKYO OHKA KOGYO AMERICA, INC.Established: April 1989
Business: Manufacture and sales of photoresists and related chemicals, etc.
2 Headquarters/Oregon Plant3 Sales Office (California)
TOK TAIWAN CO., LTD.Established: January 1998
Business: Manufacture and sales of photoresists and related chemicals, etc.
4 Headquarters (Hsinchu City) Miaoli Plant (Miaoli City) Tongluo Plant (Miaoli County)
CHANG CHUN TOK (CHANGSHU) CO., LTD.
Established: October 2004
Business: Manufacture and sales of high-purity chemicals, etc.
5 Headquarters/Changshu Plant (China)
TOKYO OHKA KOGYO EUROPE B.V.
Established: December 2005
Business: Manufacture and sales of photoresists and related chemicals, etc.
6 Headquarters (The Netherlands)
TOK Advanced Materials Co., Ltd.
Established: August 2012
Business: Development, manufacture, and sales of photo-resists and related chemicals
7 Headquarters/Incheon Plant (South Korea)
8 Shanghai Representative Office
9 Singapore Office
17
5
84
2
3
9
6
80 TOKYO OHKA KOGYO CO., LTD.

17
5
84
2
3
9
6
150 Nakamaruko, Nakahara-ku, Kawasaki-shi, Kanagawa 211-0012, JAPAN
http://www.tok.co.jp/eng
Related Documents