CH 4 cycling in the Ría de Vigo 1 The biogeochemical Cycling of Methane in Ria de Vigo, NW Spain: Sediment Processing and Sea-Air exchange. Vassilis Kitidis 1,* , Louise Tizzard 1 , Günther Uher 1 , Alan Judd 1 , Rob C. Upstill-Goddard 1 , Ian M. Head 2 , Neil D. Gray 2 , Gillian Taylor 2, † , Ruth Durán 3 , Raquel Diez 3 , Jorge Iglesias 3 and Soledad García-Gil 3 1 School of Marine Science & Technology, University of Newcastle, Newcastle upon Tyne, United Kingdom. 2 School of Civil Engineering and Geosciences, University of Newcastle, Newcastle upon Tyne, United Kingdom 3 Departamento de Xeociencias Mariñas e Ordenación do Territorio, Universidade de Vigo, Spain † now at: Department of Human Evolution, Max Planck Institute of Evolutionary Anthropology, Germany * Corresponding author ([email protected])

Welcome message from author
This document is posted to help you gain knowledge. Please leave a comment to let me know what you think about it! Share it to your friends and learn new things together.
Transcript
CH4 cycling in the Ría de Vigo
1
The biogeochemical Cycling of Methane in Ria de Vigo, NW Spain: Sediment
Processing and Sea-Air exchange.
Vassilis Kitidis1,*
, Louise Tizzard1, Günther Uher
1, Alan Judd
1, Rob C. Upstill-Goddard
1, Ian M.
Head2, Neil D. Gray
2, Gillian Taylor
2, †, Ruth Durán
3, Raquel Diez
3, Jorge Iglesias
3 and Soledad
García-Gil3
1 School of Marine Science & Technology, University of Newcastle, Newcastle upon
Tyne, United Kingdom. 2 School of Civil Engineering and Geosciences, University of Newcastle, Newcastle upon
Tyne, United Kingdom 3 Departamento de Xeociencias Mariñas e Ordenación do Territorio, Universidade de
Vigo, Spain † now at: Department of Human Evolution, Max Planck Institute of Evolutionary
Anthropology, Germany * Corresponding author ([email protected])

CH4 cycling in the Ría de Vigo
2
Abstract
Methane (CH4) concentrations were measured in the water column, in sediment porewaters,
and in atmospheric air, in the Ría de Vigo, NW Spain, during both the onset (April 2003) and at the
end of (September 2004) seasonal upwelling. In addition, CH4 concentration and stable isotopic
signatures (δ13
CH4) were measured in porewaters, and sediment methanogenesis and aerobic
oxidation of CH4 were determined in sediment incubations. Surface water column CH4 (2 m depth)
was in the range 3-180 nmol L-1
(110-8500 % saturation) and followed a generally landward
increase but with localised maxima in both the inner and middle Ría. These maxima were consistent
with CH4 inputs from underlying porewaters in which CH4 concentrations were up to 3 orders of
magnitude higher (maximum 350 μmol l-1
). Surface water CH4 concentrations were ~ three times
higher in September than in April, consistent with a significant benthic CH4 flux driven by
enhanced sediment methanogenesis following the summer productivity maximum. CH4 and δ13
CH4
in sediment porewaters and in incubated sediment slurries (20 oC) revealed significant sediment
CH4 oxidation, with an apparent isotopic fractionation factor (rc) ~ 1.004. Using turbulent diffusion
models of air-sea exchange we estimate an annual emission of atmospheric CH4 from the Ría de
Vigo of 18-44 × 106 g (1.1-2.7 × 10
6 mol). This estimate is approximately 1-2 orders of magnitude
lower than a previous estimate based on a bubble transport model.

CH4 cycling in the Ría de Vigo
3
Keywords
Methane;
Gas exchange
Sediment-water exchanges
Air-water exchanges
Gas fields
Gas seepages
Ría de Vigo
Spain

CH4 cycling in the Ría de Vigo
4
1. Introduction
Methane (CH4) is the next most important biogenic greenhouse gas after CO2; its current
atmospheric mixing ratio ~1.75 μatm (Dickinson and Cicerone, 1986; Wuebbles and Hayhoe, 2002)
is increasing at a variable rate that is not well understood but which reflects changing source and/or
sink strengths (Dlugokencky et al., 1994). The major sinks for CH4 are oxidation by hydroxyl
radical to CO and CO2 in the troposphere, and by O3 in the stratosphere. In contrast, CH4 sources
are more diverse and relatively poorly constrained. Wetlands are thought to be the dominant global
CH4 source, whereas the oceans are thought to be only a minor contributor (e.g. Bates et al., 1996).
However, recent work on coastal shelves and in estuaries indicates that these areas likely dominate
the marine CH4 cycle, prompting re-evaluations of the role of marine waters in the global budget
(e.g. Bange et al., 1994; Upstill-Goddard et al., 2000). CH4 in the marine environment is produced
via microbial methanogenesis in anaerobic environments, such as in sediments below the sulphate
reduction zone (Winfrey et al., 1981; Kelley, 2003; Middelburg et al., 2002), in the guts of
zooplankton and in faecal pellets (Marty, 1993; De Angelis and Lee, 1994), and in estuarine
turbidity maxima (Upstill-Goddard et al., 2000). Additionally, thermogenic sources may contribute
significantly to the marine CH4 budget, although they are poorly quantified (Judd et al., 1997;
Kvenvolden et al., 2001). CH4 in coastal marine systems is consumed by microbial oxidation in
sediments and in the water column (De Angelis and Scranton, 1993; Van Der Nat et al., 1997; Abril
and Iversen, 2002), and it is lost through sea-air exchange (Upstill-Goddard et al., 2000).
The stable isotopic signature of C in CH4 (δ13
CH4) can give insight into production and
consumption processes involved in CH4 biogeochemical cycling. Atmospheric CH4 has a δ13
CH4 of
-47 ‰ (Wuebbles and Hayhoe, 2002 and references therein) while both lighter (more negative
δ13
CH4) and heavier values have been reported from the marine environment reflecting
biogeochemical processing. Microbial methanogenesis can occur either via acetate fermentation or
CO2 reduction. The observed stable isotopic composition of biogenic CH4 reflects a balance
between the species composition of methanogens (Valentine et al., 2004), the supply of labile
CH4 cycling in the Ría de Vigo
5
organic carbon (Blair, 1998) and the isotopic signature of the substrate (Kotelnikova, 2002).
Methanogens preferentially utilise 12
C; hence the resulting CH4 is isotopically light, having a typical
δ13
CH4 of -60 ‰ to -97 ‰ (e.g. Popp et al., 1995; Boehme et al., 1996; Summons et al., 1998;
Tsunogai et al., 2002; Chan et al., 2005). By comparison δ13
CH4 from thermogenic sources is
typically -6 ‰ to -46 ‰ (e.g. Sassen and Macdonald, 1997; Sassen et al., 1999; Katz et al., 2002;
Tsunogai et al., 2005). Subsequent microbial oxidation of CH4 to CO2 gives rise to elevated δ13
C of
the residual CH4 in porewaters (Martens et al., 1999; Tsunogai et al., 2002) and in the water column
(Sansone et al., 1997; Cowen et al., 2002).
The Ría de Vigo (Figure 1) is one of four large, submarine, incised valleys running east to west
along the north-west Iberian Peninsula, an area subject to strong seasonal upwelling from late
March to early October (Doval et al., 1997). Shallow seismic data reveal extensive acoustic
turbidity in the Holocene fill-sediments, indicating shallow gas accumulations; acoustic water
column targets and seafloor pockmarks indicative of sediment gas escape via ebullition are
characteristic (Garcia-Garcia et al., 1999; Garcia-Gil et al., 2002; Garcia-Garcia et al., 2003;
Garcia-Gil, 2003). A microbial origin for the shallow gas, consistent with the high sediment organic
carbon content (up to 12 % by weight), has been confirmed by the identification of CH4 (Garcia-Gil,
2003); an alternative thermogenic origin for this gas is inconsistent with the underlying geology
which is metamorphic and igneous basement (Garcia-Garcia et al., 1999; Garcia-Garcia et al.,
2003). The organic rich gassy sediments are mainly constrained within the main channel (Figure 1).
It has been speculated that these sediments might ultimately be a significant local source of
atmospheric CH4: an estimate of CH4 ebullition fluxes based on the density of acoustic plumes and
pockmarks concluded that ~0.1-4.1 x 10⁹ g CH4 were emitted annually from the Ria de Vigo to the
atmosphere (Garcia-Gil et al., 2002).
Although both the underlying geology and the locations of major acoustic targets in Ría de
Vigo are well known from previous work, to date there has been no systematic study of its CH4
biogeochemistry and sea-to-air flux. We therefore made detailed biogeochemical measurements

CH4 cycling in the Ría de Vigo
6
during two seasons; at the onset (April) and at the end of (September), seasonal upwelling. Our
biogeochemical data include CH4 distributions in the water column, in sediment porewaters, and in
atmospheric air, stable isotopic signatures (δ13
CH4) in sediment porewaters, sediment
methanogenesis and potential aerobic oxidation of CH4 and sea-to-air CH4 fluxes determined using
a flux chamber and with gas exchange models.
CH4 cycling in the Ría de Vigo
7
2. Methods
2.1 Study area
The Ría de Vigo (NW Spain) is a large coastal embayment approximately 30 km in length and
11 km wide at its mouth. It has a surface area of 178 km2, a maximum water depth of 50 m (Figure
1), and a spring tidal range ~2.3 m. The Islas Cíes lie on a north-south running fault at the mouth of
the Ría and mark the geographic boundary with the Atlantic Ocean. The Ría de Vigo including San
Simón Bay in the innermost part is tectonically controlled. Major freshwater inputs to San Simón
Bay are via the Verdugo-Oitabén and Alvedosa rivers. The Ría de Vigo can be divided into three
parts (Figure 1): a) the inner Ría (San Simón Bay to Rande Strait), b) middle Ría (Rande Strait to
Cabo de Mar) and c) outer Ría (Cabo de Mar to Islas Cíes). Seasonal upwelling, driven by northerly
winds plays a central role in the hydrography and biogeochemistry of the Ría de Vigo.
The general residual circulation is of the typical two-layer estuarine type in the inner Ría, with
low salinity water outflow at the surface and near bottom high salinity Atlantic inflow modified by
lateral circulation in the middle and outer Ría (Prego and Fraga, 1992; López et al., 2001; Souto et
al., 2003). River discharge is highest in winter and affects largely the inner part of the Ría which
behaves like a typical estuary (Prego and Fraga, 1992). The middle and outer parts of the Ría are
influenced by seasonal upwelling which generally lasts between March and October; during this
period intermittent upwelling events are punctuated by upwelling-relaxation events (Doval et al.,
1998). Nutrient rich and O2-depleted (>150 μmol L-1
) Atlantic Ocean bottom waters enter the Ría
during the upwelling events leading to primary production-remineralisation cycles in the water
column (Doval et al., 1998). Upwelled waters provide the dominant nutrient supply to
photosynthesis along a comparatively small terrestrial nutrient flux via river runoff (Prego,
1993;1994). Chlorophyll a reaches a maximum >8 μg L-1
during summer and declines to <1 μg L-1
during winter (Nogueira et al., 1997; Doval et al., 1998). Although the inner Ría is net
heterotrophic year-round (Prego, 1993b), overall the entire Ría de Vigo is net autotrophic, with a
mean rate photosynthesis ~350 mg C m-2
d-1
; this results in net atmospheric CO2 drawdown (Prego,

CH4 cycling in the Ría de Vigo
8
1993b; Borges and Frankignoulle, 2002). The resulting mean sedimentation flux of organic carbon
is estimated at 140 mg C m-2
d-1
(Prego, 1993). The sedimentation rate of organic carbon peaks
during the summer and can reach 540 mg C m-2
d-1
during an upwelling event (Gago et al., 2003).
Seasonal upwelling therefore plays an important role in regulating primary and bacterial
productivity in the Ría de Vigo water column and in regulating the supply of organic matter to
sediments.
2.2 Sample collection
Two field campaigns were carried out: i) between the 25th
and 27th
of April 2003 and ii)
between the 9th
and 15th
of September 2004, to coincide with the onset and the end of seasonal
upwelling respectively. Sampling of the middle and outer Ría was from B/O Mytilus while a small
boat was used in the inner Ría (San Simón Bay). In total, 84 water column samples and three
sediment cores (2 subtidal and 1 intertidal) were collected. Sampling locations, logged using GPS,
are shown in Figure 1. Discrete water samples were collected from the B/O Mytilus flow through
system, which had its inlet in the vessel’s bow at 2 m depth, and from just below the water surface
in the case of the small boat. Subsurface samples were collected over the full water depth using a 12
V DC submersible pump and flexible nylon tubing. Prior to sampling the tubing was flushed with at
least three times its internal volume in order to preclude sample cross contamination. B/O Mytilus
flow through samples and pumped samples from 2m depth showed agreement to better than ± 7 %
for dissolved CH4.
On board B/O Mytilus, sea surface temperature (SST) and conductivity were measured with a
thermosalinograph (SBE21 SEACAT) inline with the flow through system, while hand held
instruments (Hanna Instruments, HI 147-00 and HI 8633) were used on the small boat.
Meteorological data (atmospheric pressure, wind speed and direction) were obtained from the B/O
Mytilus onboard meteorological package (Aanderra Instruments, sensors 3590, 2740, 2810 and
3455).

CH4 cycling in the Ría de Vigo
9
Headspace free water samples for CH4 analyses were collected in 100 mL gas tight glass
syringes fitted with gas tight, 3-way polycarbonate stopcocks. Samples were treated with 10 mmol
L-1
HgCl2 in order to arrest microbial activity (Upstill-Goddard et al., 1996; 2000) and stored in the
dark at 4 oC until analysis.
In April 2003 sediment cores were collected by gravity corer in the middle (core GC3; 42,262
ºN, 8,717 ºW) and outer (core GC1; 42,218 ºN 8,868 ºW) Ría (Figure 1). Water depth at both these
locations was ~40 m. Core GC3 was collected inside the gassy sediment fields and core GC1 was
collected from the edge of the outer gassy sediment fields. In September 2004 core SC1 (42,308 ºN,
8,621 ºW) (Figure 1) was collected from an intertidal area of San Simón Bay using a modified
suction corer (Méndez et al., 2003). In all cases core barrels were capped with rubber bungs and
transported to the University of Vigo for sectioning and analyses.
2.3 Upwelling Index
We obtained the monthly mean upwelling indices (UI) at 42.5 oN and 8.5
oW, available from
the US Pacific Fisheries Environmental Laboratory Live Access Server
(http://www.pfeg.noaa.gov/products/las.html). UI is computed from six-hourly pressure fields
prepared by the U.S. Navy Fleet Numerical Meteorological and Oceanographic Center on a global
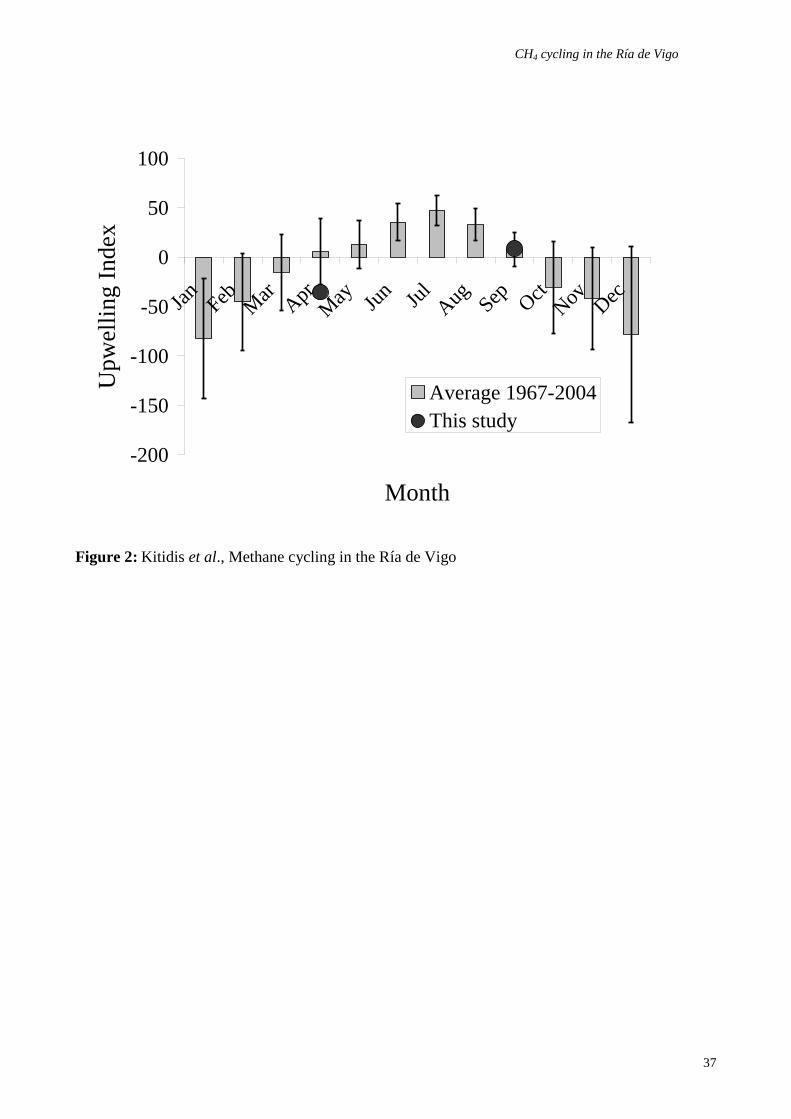
spherical 1° grid. UI values for April/May 2003 and September 2004 were -35.5 and 8.8
respectively. Negative values indicate downwelling conditions, while positive values indicate
upwelling. UI values for April/May 2003 and September 2004 were -35.5 (downwelling) and 8.8
(mild upwelling) respectively (Figure 2). These are within the range of climatological monthly UI
means for the period 1967 – present; these indicate that April 2003 and September 2004 were
transitional months at the onset, and at the end of, upwelling respectively.
2.4 CH4 analysis
Water column samples were analysed for CH4 within 12 hours of collection by in-syringe
headspace equilibration (Upstill-Goddard et al., 1990) using CH4-free N2, followed by flame
ionisation detection gas chromatography (Shimadzu GC8A with a Shimadzu CR6A integrator).

CH4 cycling in the Ría de Vigo
10
Samples were injected onto a 2 m long, 3 mm internal diameter stainless steel column packed with
Porapak-Q (Jones Chromatography; 80-100 mesh) via a 6-port valve fitted with a 1 cm3
sample
loop. The loop was flushed with sample to at least 3 times its internal volume prior to sample
injection. Chromatographic separation was at 60o C with ultra high purity (UHP) N2 carrier. The
detector temperature was 120o C (Upstill-Goddard et al., 1996). Retention characteristics and
analytical precision (better than 2 % standard deviation from the mean for 5 injections of a 1.9 ppm
standard) were similar to those given in Upstill-Goddard et al. (1996). The gas chromatograph was
calibrated daily using two secondary CH4 standards prepared by pressure dilution (Upstill-Goddard
et al., 1990) and intercalibrated against gravimetric primary standards (BOC gases Ltd.). In situ
CH4 concentrations and percent saturations relative to air were calculated using data from
Wiesenburg and Guinasso, 1979).
Ambient air samples were collected by gas-tight syringe in the field and injected directly into
the gas chromatograph as detailed above.
2.5 Sediment profiles
Core barrels were sectioned in a N2-filled glove box within 24 hours of collection. A positive
internal pressure was maintained in the glove box throughout, in order to prevent ingress of O2
during core sectioning. Core GC1 was sub sampled at 3, 21, 35 and 66 cm depth, core GC3 was sub
sampled at 10, 13, 26, 33, 48 and 66 cm depth and core SC1 was sub sampled at 1, 6, 11, 21, 31, 41,
51 and 72 cm depth. Sediment was sub sampled. At each depth approximately 2 mL of sediment
were transferred into to a pre weighed 10 mL glass bottle (Sigma-Aldrich, Z113972) with a cut
syringe and used to determine porosity by weight loss on drying overnight at 60 oC. A 5 mL plastic
syringe was used in order to minimise gas loss and the tip was cut to allow sediment sampling.
Porewater CH4 analysis was by headspace-equilibration of sediment-slurries (e.g. Abril and Iversen,
2002) following the procedure for water column samples. Each sediment slurry was created in the
glovebox in order to maintain anoxic conditions; 3 mL of Milli-Q water (Millipore Corp., model
Q185), were bubbled for ~30 minutes with O2-free N2 in order to remove O2 and added to ~2 mL
CH4 cycling in the Ría de Vigo
11
wet sediment (transferred with a cut syringe) in a pre weighed 10 mL glass bottle, which was then
sealed with a butyl rubber septum (Sigma-Aldrich, Z166065). Following headspace equilibration 1
mL of headspace was displaced with a gas tight syringe fitted with a luer needle pushed through the
rubber septum, by injecting Milli-Q water through a second needle. The headspace sample was then
diluted further with CH4-free N2 and injected onto the chromatographic column. Following analysis,
the residual sediment samples were dried and reweighed, and the porewater volume calculated by
adjusting for sample porosity. To determine the procedural blank 3 mL of Milli-Q were added to
replicate glass bottles without sediment and treated as above. A small, but detectable blank was
presumably due to residual CH4 dissolved in the Milli-Q water; the blank was <1 % of the lowest
CH4 concentration measured in sediment porewaters.
Sediment sub samples for microbial incubations (13 cm and 66 cm for GC3, and 10 cm and 66
cm for GC1) were stored in the dark at 4o C prior to the incubation experiments.
2.6 Stable isotopic analysis
During the headspace equilibration procedure additional subsamples were collected in He-
flushed, pre-evacuated 10 mL vacutainers (IsoChem, 116117EVAC) and stored for subsequent
stable isotopic analysis of δ13
CH4 at the University of Newcastle using a PDZ Europa Ltd, Trace
Gas II (TGII) preparation unit attached to a PDZ Europa Ltd 20/20 isotope ratio mass spectrometer.
Each gas sample was flushed from the 10 mL vacutainer with high purity helium (99.999% purity)
at 21 mL min-1
for 500 seconds via a Gilson 220 autosampler. The gas stream was passed through a
liquid N2 cryotrap in order to retain non-methane hydrocarbons. CO in the gas stream was then
oxidized to CO2 by passing it through ShutzeTM
reagent and subsequently removed as CO2 in a
CarbosorbTM
scrubber tube. Remaining CH4 in the gas stream was oxidised to CO2 in a combustion
furnace at 1000ºC over a Ni-Pt catalyst. The catalyst was regenerated with short O2 pulses (> 15
seconds) after each sample. Following combustion, water vapor was removed through a NafionTM
membrane and the CH4 derived CO2 was cryofocused by passing the sample stream through a series
of cryotraps before injection into the mass spectrometer. Cryofocusing was achieved by lowering a

CH4 cycling in the Ría de Vigo
12
1 m long coil of steel tubing (1/16 ″ o.d.) into liquid N2 for 500 seconds followed by immersing a
second coil into liquid N2 for a further 110 seconds. The isotopic signature of CH4 derived CO2 was
monitored at m/z = 44, 45 and 46 and its δ13
C value was compared with a laboratory CO2 standard
pre-calibarated against international standard IAEA-NBS22. The total run time was 20 minutes. All
isotope ratios expressed in standard δ notation are relative to V-PDB.
2.7 Sediment incubations
Sediment incubations designed to provide information on microbial methanogenesis and
potential aerobic CH4 oxidation (MO) commenced within 10 days of sample collection.
Approximately 2 mL of wet sediment from each depth were transferred into replicate pre weighed
10 mL glass bottles and capped with rubber septa in the glove box. For MO incubations 2 mL of
low nutrient seawater (0.2 μm filtered surface water from the South Atlantic Gyre, collected in
2000) were added to create a slurry. The slurries were briefly exposed to air (to allow O2 into the
headspace) and resealed before 100 L of 99 % CH4 (Sigma-Aldrich, 29,547-7) were injected
through the septa to give approximately 1 % CH4 (v./v.) in the headspace. Empty bottles (no
sediment) were treated as above and used to assess leakage during the experiments. For
methanogenesis determinations, ~2 mL of wet sediment were transferred to the bottles as above.
Controls were treated similarly except that 0.5 mL of a 1 mmol L-1
bromoethane sulphonic acid
(BES) solution were added in order to inhibit methanogenesis. CH4 concentration was monitored
during 10 day incubations at room temperature (~20 oC). Incubations of this nature are susceptible
to artefacts relating to prior sample storage, differences between ambient and incubation
temperatures, and substrate depletion. As such any quantitative derivations drawn from them, such
as rates of bacterial processes, should be viewed cautiously. We therefore choose to subsequently
discuss these data only qualitatively.
2.8 Sea-Air flux estimates
A 54 L floating chamber with a surface area 0.3 m2 was deployed by diver in the inner Ría
during September 2004 (Figure 1). The chamber was deployed at 10 a.m. (local time) at low tide

CH4 cycling in the Ría de Vigo
13
and the concentration of CH4 in the headspace was monitored hourly over a 9 hour period in order
to provide direct estimates of sea-to-air CH4 fluxes. The chamber was anchored to the sea floor with
enough slack to allow for tidal differences in water depth over the deployment period. The
headspace volume change over the course of the experiment was <2 % of the initial headspace
volume.
We additionally estimated sea-to-air CH4 fluxes (FSA) based on surface water concentrations
according to:
4CHkF wSA (1)
where kw is the gas transfer velocity and ΔCH4 is the sea-air concentration difference. Various
relationships relate kw to wind speed. The most commonly used such parameterisations are those of
Liss and Merlivat (1986) (equations 2 and 3) and Wanninkhof (1992) (equation 4):
66.0
60017.0
c
w
Suk , u < 3.6 m s
-1 (2)
5.0
60065.985.2
c
w
Suk , 3.6 m s
-1 < u ≤ 13 m s
-1 (3)
5.0
2
66031.0
c
w
Suk (4)
where u is the wind speed at 10 m (8.2 m s-1
and 3.3 m s-1
for April 2003 and September 2004
respectively) and Sc is the Schmidt number of CH4 (868 at 15 oC and 746 at 18
oC).
CH4 cycling in the Ría de Vigo
14
3. Results
3.1 Hydrography
During both April 2003 and September 2004 salinity ranged from <25 in the inner Ría to ~34-
35 in the outer Ría. During April 2003 sea surface temperature ranged from 15 oC in the outer Ría
to 16 oC in the inner Ría. Corresponding values during September 2004 were 18
oC and 21
oC.
Partial thermohaline stratification was more pronounced in the Ría de Vigo during April 2003
compared to September 2004 indicating contrasting hydrographic regimes (Figure 3). Low salinity
surface water was observed in all depth profiles from the outer and inner Ría during April 2003
(Figures 3b, 3h and 3e respectively). In contrast salinity profiles collected in September 2004
showed that the water column was well mixed with respect to salinity (Figures 3k, 3q and 3n).
Partial stratification in September 2004 was evidenced by warmer surface water in the outer and
middle Ría (Figures 3l and 3r respectively). The observed temperature and salinity distributions
were therefore consistent with upwelling during April 2003 and downwelling during September
2004. An alternative explanation may be increased freshwater runoff entering the inner Ría during
April 2003. Wind driven upwelling during this period may have enhanced outwelling of freshwater
from the inner Ría.
3.2 CH4 in the water column
Table 1 summarises mean CH4 concentrations and salinities in surface waters of the outer,
middle and inner Ría and near the mouth of the Verdugo-Oitabén River. Ría de Vigo surface water
was everywhere supersaturated in CH4 relative to atmospheric air; concentrations ranged from 3
nmol l-1
(101 % saturation) to 180 nmol L1.(8500 % saturation) (Figure 4). CH4 concentrations from
same surface water locations were on average 3–fold higher during September 2004 (490-8500 %
saturation) than in April 2003 (101-1850 %).
Surface concentrations generally increased landwards during both seasons (Figure 4) and
decreased with salinity (Figure 5). However dissolved CH4 was non-conservative over the salinity
ranges sampled in both field campaigns, indicating significant CH4 sources to the water column in

CH4 cycling in the Ría de Vigo
15
both the inner and middle Ría (Figure 5). During April 2003 dissolved CH4 was highest in the
Rande Strait (47 nmol L-1
) connecting the inner and middle Ría (Table 1 and Figure 4). In
September 2004 dissolved CH4 was highest near the mouth of the Verdugo-Oitabén River (180
nmol L-1
), which was not sampled during April 2003 (Figure 4).
Vertical profiles from April 2003 showed a marked increase in dissolved CH4 concentration
with depth in the inner Ría (Figure 3d: 37 nmol L-1
at the surface; 56 nmol L-1
at the bottom and
Figure 3g: 40 nmol L-1
at the surface; 65 nmol L-1
at the bottom), whereas in the outer Ría the
change in CH4 with depth was relatively slight (Figure 3a: 4 nmol L-1
at the surface; 5 nmol L-1
at
the bottom). Similar results were obtained in the outer Ría in September 2004 (Figure 3j: 5 nmol L-1
at the surface; 4 nmol L-1
at the bottom), while the middle Ría de Vigo depth profile showed a
decrease in CH4 concentration with depth (Figure 3p: 67 nmol L-1
at the surface; 43 nmol L-1
at the
bottom). Although the September 2004 depth profile of CH4 from the inner Ría showed the same
trend of increasing CH4 with depth as in April 2003, the September 2004 concentrations were
higher (Figure 3m: 95 nmol L-1
at the surface; 115 nmol L-1
at the bottom). Water column maxima
were observed in the vicinity of a) the halocline in the inner and outer Ría in April 2003 (Figures 3g
and 3a: 73 nmol L-1
and 6 nmol L-1
respectively) and b) the thermocline in the middle and outer Ría
in September 2004 (Figures 3p and 3j: 71 nmol L-1
and 10 nmol L1 respectively).
3.3 CH4 in sediments
In April 2003 porewater dissolved CH4 was ~ 7-37 μmol L-1
in the outer Ría (core GC1)
(Figure 6a) and 3-350 μmol L-1
in the middle Ría (Core GC3) (Figure 6b). There was an overall
increase in CH4 with depth in both cores. Most notably the CH4 concentration at 66 cm in ‘in gas
field’ core GC3 was an order of magnitude higher than in core GC1. In the intertidal core from the
inner Ría (Core SC1, September 2004) dissolved CH4 was in the range of 1-235 μmol L-1
and in
contrast to both the central and outer Ría during April 2003 distinct concentration maxima were
evident just below the surface and at 31 cm (Figure 6c)

CH4 cycling in the Ría de Vigo
16
Porewater CH4 was progressively 13
C depleted (isotopically lighter) with depth; δ13
CH4 was in
the range -44.7 ‰ V-PDB to -51.5 ‰ V-PDB for GC1 (Figure 6a) and -42.5 V-PDB to -55.0 ‰ V-
PDB for GC3 (Figure 6b). Methane oxidation (MO) was only observed in sediments from GC3,
while methanogenic activity was only observed in the uppermost cm of SC1. Figure 7 shows the
depletion of CH4 (99 % loss) in the headspace of vials containing sediment slurry from GC3
collected at 13 cm sediment depth within the 10 day incubation period. A decrease in CH4 was also
observed in the control and subsample collected at 66 cm sediment depth, but this was small by
comparison (~20 %) and was probably due to leakage of CH4 from the vials.
3.4 Sea-Air flux
The observed ubiquitous surface CH4 supersaturations imply that the Ría de Vigo is a strong
local source of atmospheric CH4. In the floating chamber (Figure 7) the CH4 flux estimated from the
change in headspace CH4 with time was 63 μmol CH4 m-2
d-1
. Sea-to-air CH4 fluxes determined
using the relationships of Liss and Merlivat (1986) and Wanninkhof (1992) are summarised in
Table 2 based on mean CH4 concentrations for the inner, middle and outer Ría listed in Table 1. The
flux of CH4 to the atmosphere increased landwards by 2 orders of magnitude and was generally of
the same order of magnitude during both field campaigns owing to the lower wind speed in
September 2004 despite the higher CH4 concentration (Table 2). The estimated sea-air flux for the
inner Ría for September 2004 was 47-84 μmol m-2
d-1
. This was in good agreement with the
measured sea-air flux (63 μmol m-2
d-1
) derived from the floating chamber data.

CH4 cycling in the Ría de Vigo
17
4. Discussion
4.1 Upwelling conditions
Stratification in the Ría de Vigo is mainly caused by salinity rather than temperature gradients
during the upwelling season (Alvarez-Salgado et al., 2000); saline Atlantic Ocean water
predominates in deeper waters, with a less saline layer influenced by terrestrial runoff near the
surface (López et al., 2001; Souto et al., 2003). Our observed temperature and salinity distributions
(Figure 3) were therefore consistent with upwelling during April 2003 and non-upwelling
conditions during September 2004, in contrast to the upwelling index (UI) values (Figure 2). The
disparity between these indications of upwelling (temperature-salinity distribution in the water
column versus UI) may be due to differences in the timescale over which they were examined. As
the UI represented monthly mean values it did not reflect acting over the shorter time-scales relating
to water column measurements of temperature and salinity. Given that the flushing time of the Ría
de Vigo is in the order of one week, it seems reasonable to assume a faster response time to
changing wind conditions for temperature and salinity than for UI. We therefore concluded that the
April 2003 and September 2004 field campaigns were carried out under upwelling and non-
upwelling conditions respectively.
4.2 Water column CH4
The observed concentrations (3-180 nmol L-1
) and non-conservative behaviour of CH4 in the
Ría de Vigo are consistent with conditions in other temperate estuarine systems that reflect both low
salinity CH4 input and its in situ production (Bange et al., 1998; Bussmann and Suess, 1998;
Sansone et al., 1999; Upstill-Goddard et al., 2000; Abril and Iversen, 2002; Middelburg et al.,
2002). The more saline surface and near bottom waters of the outer Ría in April 2003 were
relatively weakly supersaturated in CH4, consistent with vertical mixing of deeper water, low CH4
Atlantic inflow. By the time this input had reached the inner Ría however, it must have been
involved in significant mixing with additional CH4 sources, as evidenced by the strong vertical CH4
gradients observed. Such progressive landward enrichment of bottom water CH4 is consistent with a

CH4 cycling in the Ría de Vigo
18
sediment CH4 input. In contrast, during September 2004 deep water CH4 enrichment was only
observed in the inner Ría; there was generally little change with depth in water column CH4
concentration in the outer Ría, consistent with a well mixed water column evidenced by the salinity
profiles.
Unlike the deep water CH4 distributions, the water column maxima observed during both field
campaigns may be attributed to lateral advection or additional water column sources, such as
microbial methanogenesis in the anaerobic cores of particles in the halocline/pycnocline, as
observed in other nearshore basins (Sieburth and Donaghay, 1993) and in the open ocean (Scranton
and Brewer, 1977; Karl and Tilbrook, 1994). The spatio-temporal coincidence of the CH4 maxima
with the location of the halocline/thermocline (Figure 3) where biological activity and or
accumulation of particles would be expected to be high lend support to this hypothesis.
Unfortunately, there were no ancillary data to support either high particle abundance (e.g.
particulate organic carbon, transmissometer data) or biological activity (e.g. Chlorophyll a
concentration, microbial counts or incubations) and therefore the hypothesis of pelagic
methanogenesis must for now remain speculative.
4.3 Porewater CH4
Porewater CH4 concentrations (<0.35 mmol L-1
) in the Ria de Vigo are in general agreement
with those found previously in most other freshwater, estuarine and coastal locations (Adams et al.,
1982; Martens et al., 1998;1999; Abril and Iversen, 2002; Whiticar, 2002; Carini et al., 2003), but
are higher than those in some others of lower organic content (e.g. Abril and Iversen, 2002). The
observed CH4 concentration gradients reflect production at depth, consistent with the geophysical
evidence (Garcia-Garcia et al., 1999), and imply significant sediment-water exchange. The highest
porewater CH4 concentrations observed were insufficient for the formation of free gas (>5.1 mmol
L-1
), consistent with geophysical evidence that suggests free gas accumulation in the Ría de Vigo at
sediment depths ranging between 1.5-5 m (Garcia-Gil et al., 2002).
CH4 cycling in the Ría de Vigo
19
The highest CH4 concentration found at 66 cm sediment depth for core GC3 had a δ13
CH4
value of -55 ‰ consistent with a microbial origin (Cicerone and Oremland, 1988). The lack of any
observed methanogenic activity in the sediment slurry incubations from GC1 and GC3 during April
2003 (<66 cm depth) leads us to believe that these samples originated above the zone of active
methanogenesis, hence this zone must have been deeper than 66 cm below the sediment surface.
Although methanogenesis has often been observed in the uppermost 5-10 cm of freshwater and
estuarine sediments (Kerner, 1993; De Graaf et al., 1996; Bange et al., 1998; Avery and Martens,
1999; Hellings et al., 2000; Avery et al., 2003), in such situations low ambient salinity and hence
low sulphate may facilitate the establishment of methanogenic bacterial activity at such shallow
depths.
Although the porewater-water column CH4 concentration gradient implied significant fluxes
from the sediment to the overlying water, the CH4 profiles obtained in April 2003 showed apparent
removal of CH4 from the porewaters between 20 and 66 cm (Figures 6a and 6b). Hence the benthic
flux of CH4 is mediated by consumption within the sediment, most likely by aerobic and anaerobic
microbial oxidation. Aerobic oxidation of CH4 was observed during incubation of GC3 surface
sediment (13 cm), confirming the presence of a microbial sink for CH4 evidenced by the isotopic
data (Figure 6). Based on the relationship of Cowen et al. (2002), we calculated the kinetic
fractionation constant of CH4 oxidation rc:
1000
1000
Src (5)
where S is the slope of the regression of δ13
C-CH4 against log10 [CH4]. The fractionation
constant for both cores was 1.004, in agreement with previously reported fractionation constants
(1.004-1.012) from the Columbia River estuary and hydrothermal plumes (Sansone et al., 1999;
Cowen et al., 2002). Microbial oxidation of CH4 is therefore an effective barrier to the efflux of
CH4 from sediments to the overlying water of the Ría de Vigo. Similar removal of CH4 by
microbial oxidation has been found to eliminate the sediment – water efflux of CH4 at Eckernförde
CH4 cycling in the Ría de Vigo
20
Bay in the Baltic Sea and the Tommeliten cold seep in the North Sea (Martens et al., 1999;
Niemann et al., 2005). It is likely that aerobic oxidation at the sediment-water column boundary
further moderated the benthic flux of CH4.
4.4 Seasonal changes in water column CH4: a seasonal sediment source?
CH4 concentration in surface waters in September 2004 was on average 3-fold higher than in
April 2003 (Table 1). The April-September contrast in surface water CH4 is unlikely to be due to
increased water column methanogenesis in September 2004 as this would have resulted in more
pronounced subsurface maxima in depth profiles. Increased freshwater inputs are also unlikely to
have contributed to the observed differences in the central and outer parts of the Ria as evident from
the non-conservative, convex mixing behaviour with salinity which suggests significant inputs of
CH4 at these locations (Figure 4). It is conceivable that an increase in surface water CH4
concentration was attributable to increased residence time in the Ría de Vigo. Wind driven
upwelling reduces residence time by enforcing the residual, 2-layer circulation and thereby
enhancing outwelling from the Ría to the adjacent shelf. Thereby, we would expect higher CH4 in
the water column to coincide with non-upwelling conditions as was the case in September 2004. A
previous modelling study of residual flows in the Ría de Vigo found that the typical residence time
varied between 2.5-4.1 days for the middle and 2.8-5.5 days for the outer Ría respectively (Alvarez-
Salgado et al., 2000). Extremes of 1.4 and 11 days for the middle Ría and 1.7 and 130 days for the
outer Ría have been reported during high river discharge in winter and in the absence of wind in
autumn respectively (Alvarez-Salgado et al., 2000). However, such conditions were not
encountered during our study and therefore we considered only typical variability in residence time.
Under such conditions, increased residence time would therefore typically account for 40-50 % of
the observed increase in CH4. Finally, the observed differences may be due to enhanced
methanogenesis in sediments prior to sampling in September 2004.
Seasonal variation in surface water CH4, similar to that found in the present study, with higher
concentrations in the summer has been reported for the Baltic and Southern North Seas (Bange et

CH4 cycling in the Ría de Vigo
21
al., 1994; Bange et al., 1998). Bange et al. (1998) found that CH4 concentrations in surface waters
of the southern Baltic Sea in September were up to one order of magnitude higher than in April and
they interpreted this to reflect increased methanogenic activity in the underlying sediments during
the summer in response to elevated sediment temperatures and a seasonal input of relatively
undegraded particulate organic matter. The temperature dependence of methanogenesis in the Ria
de Vigo is unknown, however available data from freshwater and estuarine sediments (Bange et al.,
1998; Bange et al., 1998; Avery et al., 2003) indicate an increase in temperature from 15 oC to 18
oC between April and September to be consistent with a 20-40 % increase in methanogenesis.
Assuming that increased residence time and temperature enhanced methanogenesis may account for
an average of 45 % and 30 % of the observed increase in CH4 respectivelly, the remaining 25 %
must be due to enhanced methanogenesis from the summer input of labile organic carbon to
sediments. In the Ria de Vigo the majority of autochthonous carbon production during upwelling
(~68 % or ~0.5 g C m-2
d-1
) sinks as particulate organic carbon (Doval et al., 1997; Gago et al.,
2003), and presumably stimulates microbial activity at the sediment surface. Consistent with this,
methanogenesis and high porewater CH4 were observed in surface sediments (uppermost 1 cm)
from core SC1 in September 2004 but not in cores GC1 and GC3 collected during April 2003.
Hence we attributed the majority (>50 %) of the observed differences in CH4 to enhanced
methanogenesis in sediments of the Ría de Vigo during September 2004.
4.5 Sea-Air flux
The measured sea-to-air flux of CH4 from the floating chamber data agrees rather closely with
the calculated fluxes from the turbulent diffusion models for the inner Ría during September 2004.
This is an interesting result given that the use of floating chambers to calculate sea-to-air fluxes has
been criticised on the grounds that they modify wind and water induced turbulence. However for
the conditions we observed, i.e. the absence of breaking waves and low to moderate wind speeds
(<10 m s-1
), such errors are minimised (Kerner et al., 2003), although the chamber may have
interfered with the tidal current and induced additional sea surface turbulence since it was tethered
CH4 cycling in the Ría de Vigo
22
to the sea floor. Additional concerns relate to the accumulation of gas in the headspace; this can
reduce the water-air concentration gradient (ΔC) and thereby suppress the sea-to-air flux. To
minimise this problem floating chambers are usually deployed for much shorter periods than the
several hours used in our work (e.g. Borges et al., 2004). During our deployments ΔC, varied by
<10 %; hence we do not anticipate significant errors to have arisen in this way. Indeed, our rationale
for using long deployment times was that the resulting data would be more suited for comparison
with the results from the turbulent diffusion models, for which the appropriate timescales are hours
to days.
Our flux estimates provide a basis for estimating the annual emission of atmospheric CH4 from
the Ría de Vigo. Although our data do not provide full seasonal coverage they do suggest that wind-
driven upwelling largely controls the annual variability in water column CH4 concentrations
through enhancing sedimentary methanogenesis (see section 4.4). Given that our data span the onset
and the end of the upwelling period, they cover the period during which the highest fluxes are
expected; hence they allow a preliminary upper estimate of the annual CH4 flux from the Ría de
Vigo.
Assuming a mean area weighted flux for each of the inner, middle and outer Ría, the annual
efflux of atmospheric CH4 from the Ría de Vigo is 18-44 × 106 g (1.1-2.7 × 10
6 mol). This is ~2
orders of magnitude lower than a previous estimate of 0.1-4.1 x 10⁹ g a
-1 for CH4 ebullition fluxes
based on the density of acoustic plumes and pockmarks (Garcia-Gil et al., 2002), and is comparable
to the annual sea-air flux of CH4 from the Humber estuary (36 × 106 g a
-1) estimated by Upstill-
Goddard et al. (2000). The discrepancy between our estimate and that of Garcia-Gil et al., 2002) is
not surprising given that the turbulent diffusion models exclude bubble mediated sea-to-air CH4
fluxes. In shallow nearshore regions such as the Ria de Vigo bubble residence times in the water
column may be very short. Consequently, significant CH4 and CO2 may vent to the atmosphere in
rising bubble plumes but remain unaccounted for by conventional flux estimates that are based on
dissolved gas distributions alone. Interestingly however, the agreement between our flux chamber
CH4 cycling in the Ría de Vigo
23
and turbulent-diffusion estimates of CH4 exchange suggest that at least during the measurement
period, CH4 ebullition rates were relatively low at the chamber deployment site. The estimate of
Garcia-Gil et al. (2002), likely represents an upper limit for CH4 emission as it takes no account of
CH4 converted back into CO2 via aerobic and anaerobic microbial oxidation in sediments and the
water column. Further efforts to constrain the emission of CH4 from the Ría de Vigo to the
atmosphere should focus on seasonal and inter annual variability of both the dissolved and bubble
fluxes.

CH4 cycling in the Ría de Vigo
24
Acknowledgements
We would like to thank the captain and crew of the B/O Mytilus for their assistance with fieldwork
and Charles Belanger (Iso-Analytical Ltd.) for assistance with the stable isotope analysis. This work
was supported by the UK Natural Environment Research Council (grant NER/A/S/2001/01017) and
Ministerio de Ciencia y Tecnología of Spain (grant REN2003-03233/MAR).
CH4 cycling in the Ría de Vigo
25
References
Abril, G. and Iversen, N., 2002, Methane dynamics in a shallow non-tidal estuary (Randers
Fjord, Denmark), Marine Ecology-Progress Series, 230: 171-181
Adams, D. A., Matisoff, G. and Snodgrass, W. J., 1982, Flux of reduced chemical constituents
(Fe2+
, Mn2+
, NH4+ and CH4) and sediment oxygen-demand in Lake Erie, Hydrobiologia, 92: 405-
414
Alvarez-Salgado, X. A., Gago, J., Miguez, B. M., Gilcoto, M. and Perez, F. F., 2000, Surface
waters of the NW Iberian margin: Upwelling on the shelf versus outwelling of upwelled waters
from the Rias Baixas, Estuarine Coastal and Shelf Science, 51: 821-837
Avery, G. B. and Martens, C. S., 1999, Controls on the stable carbon isotopic composition of
biogenic methane produced in a tidal freshwater estuarine sediment, Geochimica Et Cosmochimica
Acta, 63: 1075-1082
Avery, G. B., Shannon, R. D., White, J. R., Martens, C. S. and Alperin, M. J., 2003, Controls
on methane production in a tidal freshwater estuary and a peatland: methane production via acetate
fermentation and CO2 reduction, Biogeochemistry, 62: 19-37
Bange, H. W., Bartell, U. H., Rapsomanikis, S. and Andreae, M. O., 1994, Methane in the
Baltic and North Seas and a Reassessment of the Marine Emissions of Methane, Global
Biogeochemical Cycles, 8: 465-480
Bange, H. W., Dahlke, S., Ramesh, R., Meyer-Reil, L.-A., Rapsomanikis, S. and Andreae, M.
O., 1998, Seasonal study of Methane and Nitrous Oxide in the coastal waters of the southern Baltic
Sea., Estuarine Coastal and Shelf Science, 47: 807-817
Bates, T. S., Kelly, K. C., Johnson, J. E. and Gammon, R. H., 1996, A reevaluation of the open
ocean source of methane to the atmosphere, Journal of Geophysical Research-Atmospheres, 101:
6953-6961

CH4 cycling in the Ría de Vigo
26
Boehme, S. E., Blair, N. E., Chanton, J. P. and Martens, C. S., 1996, A mass balance of C-13
and C-12 in an organic-rich methane-producing marine sediment, Geochimica Et Cosmochimica
Acta, 60: 3835-3848
Borges, A. V., Vanderborght, J. P., Schiettecatte, L. S., Gazeau, F., Ferron-Smith, S., Delille,
B. and Frankignoulle, M., 2004, Variability of the gas transfer velocity of CO2 in a macrotidal
estuary (the Scheldt), Estuaries, 27: 593-603
Bussmann, I. and Suess, E., 1998, Groundwater seepage in Eckernfoerde Bay (Western Baltic
Sea): Effect on methane and salinity distribution of the water column, Continental Shelf Research,
18: 1795-1806
Carini, S. A., Orcutt, B. N. and Joye, S. B., 2003, Interactions between Methane Oxidation and
Nitrification in Coastal Sediments, Geomicrobiology Journal, 20: 355-374
Chan, O. C., Claus, P., Casper, P., Ulrich, A., Lueders, T. and Conrad, R., 2005, Vertical
distribution of structure and function of the methanogenic archaeal community in Lake Dagow
sediment, Environmental Microbiology, 7: 1139-1149
Cicerone, R. J. and Oremland, R. S., 1988, Biogeochemical aspects of atmospheric methane.,
Global Biogeochemical Cycles, 2: 299-327
Cowen, J. P., Wen, X. Y. and Popp, B. N., 2002, Methane in aging hydrothermal plumes,
Geochimica Et Cosmochimica Acta, 66: 3563-3571
De Angelis, M. A. and Lee, C., 1994, Methane Production During Zooplankton Grazing on
Marine-Phytoplankton, Limnology and Oceanography, 39: 1298-1308
De Angelis, M. A. and Scranton, M. I., 1993, Fate of Methane in the Hudson River and
Estuary, Global Biogeochemical Cycles, 7: 509-523
De Graaf, W., Wellsbury, P., Parkes, R. J. and Cappenberg, T. E., 1996, Comparison of acetate
turnover in methanogenic and sulfate- reducing sediments by radiolabeling and stable isotope
labeling and by use of specific inhibitors: Evidence for isotopic exchange, Applied and
Environmental Microbiology, 62: 772-777
CH4 cycling in the Ría de Vigo
27
Dickinson, R. E. and Cicerone, R. J., 1986, Future global warming from atmospheric trace
gases, Nature, 319: 109-115
Dlugokencky, E. J., Masarie, K. A., Lang, P. M., Tans, P. P., Steele, L. P. and Nisbet, E. G.,
1994, A Dramatic Decrease in the Growth-Rate of Atmospheric Methane in the Northern-
Hemisphere During 1992 - Reply, Geophysical Research Letters, 21: 2447-2448
Doval, M. D., AlvarezSalgado, X. A. and Perez, F. F., 1997, Dissolved organic matter in a
temperate embayment affected by coastal upwelling, Marine Ecology-Progress Series, 157: 21-37
Doval, M. D., Nogueira, E. and Perez, F. F., 1998, Spatio-temporal variability of the
thermohaline and biogeochemical properties and dissolved organic carbon in a coastal embayment
affected by upwelling: the Ria de Vigo (NW Spain), Journal of Marine Systems, 14: 135-150
Gago, J., Alvarez-Salgado, X. A., Gilcoto, M. and Perez, F. F., 2003, Assessing the contrasting
fate of dissolved and suspended organic carbon in a coastal upwelling system ('Ria de Vigo', NW
Iberian Peninsula), Estuarine Coastal and Shelf Science, 56: 271-279
Garcia-Garcia, A., Garcia-Gil, S. and Vilas, F., 2003, Monitoring the Spanish gas fields in the
Ria de Vigo (1991- 2001), Geo-Marine Letters, 23: 200-206
Garcia-Garcia, A., Vilas, F. and Garcia-Gil, S., 1999, A seeping sea-floor in a Ria environment:
Ria de Vigo (NW Spain), Environmental Geology, 38: 296-300
Garcia-Gil, S., 2003, A natural laboratory for shallow gas: the Rias Baixas (NW Spain), Geo-
Marine Letters, 23: 215-229
Garcia-Gil, S., Vilas, F. and Garcia-Garcia, A., 2002, Shallow gas features in incised-valley
fills (Ria de Vigo, NW Spain): a case study, Continental Shelf Research, 22: 2303-2315
Hellings, L., Driessche, K. V. D., Bayens, W., Keppens, E. and Dehairs, F., 2000, Origin and
fate of dissolved inorganic carbon in interstitial waters of two freshwater intertidal areas: A case
study of the Scheldt Estuary, Belgium, Biogeochemistry, 51: 141-160

CH4 cycling in the Ría de Vigo
28
Judd, A., Davies, G., Wilson, J., Holmes, R., Baron, G. and Bryden, I., 1997, Contributions to
atmospheric methane by natural seepages on the UK continental shelf, Marine Geology, 137: 165-
189
Karl, D. M. and Tilbrook, B. D., 1994, Production and Transport of Methane in Oceanic
Particulate Organic-Matter, Nature, 368: 732-734
Katz, B. J., Narimanov, A. and Huseinzadeh, R., 2002, Significance of microbial processes in
gases of the South Caspian basin, Marine and Petroleum Geology, 19: 783-796
Kelley, C., 2003, Methane oxidation potential in the water column of two diverse coastal
marine sites, Biogeochemistry, 65: 105-120
Kerner, M., 1993, Coupling of Microbial Fermentation and Respiration Processes in an
Intertidal Mudflat of the Elbe Estuary, Limnology and Oceanography, 38: 314-330
Kotelnikova, S., 2002, Microbial production and oxidation of methane in deep subsurface,
Earth-Science Reviews, 58: 367-395
Kvenvolden, K. A., Lorenson, T. D. and Reeburgh, W. S., 2001, Attention Turns to Naturally
Occuring Methane Seepage, EOS Transactions American Geophysical Union, 82: 457
Liss, P. S. and Merlivat, L., 1986, Air-sea gas exchange rates: introduction and synthesis, in
Buat-Ménard, P. (ed.), The Role of Air-Sea Exchange in Geochemical Cycling, Reidel, Utrecht,
Netherlands, 113-129
López, S. T., Varela, R. A. and Delhez, E., 2001, Residual circulation and thermohaline
distribution of the Ria de Vigo: a 3-D hydrodynamical model, Scientia Marina, 65: 277-289
Martens, C. S., Albert, D. B. and Alperin, M. J., 1998, Biogeochemical processes controlling
methane in gassy coastal sedimentsÐPart 1. A model coupling organic matter ßux to gas
production, oxidation and transport, Continental Shelf Research, 18: 1741-1770
Martens, C. S., Albert, D. B. and Alperin, M. J., 1999, Stable isotope tracing of anaerobic
methane oxidation in the gassy sediments of Eckernfoerde Bay, German Baltic Sea, American
Journal of Science, 299: 589-610

CH4 cycling in the Ría de Vigo
29
Marty, D. G., 1993, Methanogenic Bacteria in Seawater, Limnology and Oceanography, 38:
452-456
Méndez, G., Pe´rez-Arlucea, M., Stouthammer, E. and Berensden, H., 2003, The TESS-1
suction corer: a new device to extract wet, uncompacted sediments., Journal of Sedimentology
Research, 73: 1078-1081
Middelburg, J. J., Nieuwenhuize, J., Iversen, N., Hogh, N., De Wilde, H., Helder, W., Seifert,
R. and Christof, O., 2002, Methane distribution in European tidal estuaries, Biogeochemistry, 59:
95-119
Niemann, H., Elvert, M., Hovland, M., Orcutt, B., Judd, A., Suck, I., Gutt, J., Joye, S., Damm,
E., Finster, K. and Boetius, A., 2005, Methane emission and consumption at a North Sea gas seep
(Tommeliten area). Biogeosciences Discussions, 2: S523-S526
Nogueira, E., Perez, F. F. and Rios, A. F., 1997, Seasonal patterns and long-term trends in an
estuarine upwelling ecosystem (Ria de Vigo, NW Spain), Estuarine Coastal and Shelf Science, 44:
285-300
Popp, B. N., Sansone, F. J., Rust, T. M. and Merritt, D. A., 1995, Determination of
Concentration and Carbon Isotopic Composition of Dissolved Methane in Sediments and Nearshore
Waters, Analytical Chemistry, 67: 405-411
Prego, R., 1993, Biogeochemical Pathways of Phosphate in a Galician Ria (North-Western
Iberian Peninsula), Estuarine Coastal and Shelf Science, 37: 437-451
Prego, R., 1993, General-Aspects of Carbon Biogeochemistry in the Ria of Vigo, Northwestern
Spain, Geochimica Et Cosmochimica Acta, 57: 2041-2052
Prego, R., 1994, Nitrogen Interchanges Generated by Biogeochemical Processes in a Galician
Ria, Marine Chemistry, 45: 167-176
Prego, R. and Fraga, F., 1992, A Simple-Model to Calculate the Residual Flows in a Spanish
Ria - Hydrographic Consequences in the Ria-De-Vigo, Estuarine Coastal and Shelf Science, 34:
603-615

CH4 cycling in the Ría de Vigo
30
Sansone, F. J., Holmes, M. E. and Popp, B. N., 1999, Methane stable isotopic ratios and
concentrations as indicators of methane dynamics in estuaries, Global Biogeochemical Cycles, 13:
463-473
Sansone, F. J., Popp, B. N. and Rust, T. M., 1997, Stable carbon isotopic analysis of low-level
methane in water and gas, Analytical Chemistry, 69: 40-44
Sassen, R., Joye, S., Sweet, S. T., DeFreitas, D. A., Milkov, A. V. and MacDonald, I. R., 1999,
Thermogenic gas hydrates and hydrocarbon gases in complex chemosynthetic communities, Gulf of
Mexico continental slope, Organic Geochemistry, 30: 485-497
Sassen, R. and MacDonald, I. R., 1997, Hydrocarbons of experimental and natural gas
hydrates, Gulf of Mexico continental slope, Organic Geochemistry, 26: 289-293
Scranton, M. I. and Brewer, P. G., 1977, Occurrence of Methane in near-Surface Waters of
Western Subtropical North-Atlantic, Deep-Sea Research, 24: 127-138
Sieburth, J. M. and Donaghay, P. L., 1993, Planktonic Methane Production and Oxidation
within the Algal Maximum of the Pycnocline - Seasonal Fine-Scale Observations in an Anoxic
Estuarine Basin, Marine Ecology-Progress Series, 100: 3-15
Souto, C., Gilcoto, M., Farina-Busto, L. and Perez, F. F., 2003, Modeling the residual
circulation of a coastal embayment affected by wind-driven upwelling: Circulation of the Ria de
Vigo (NW Spain), Journal of Geophysical Research-Oceans, 108: art. no.-3340
Summons, R. E., Franzmann, P. D. and Nichols, P. D., 1998, Carbon isotopic fractionation
associated with methylotrophic methanogenesis, Organic Geochemistry, 28: 465-475
Tsunogai, U., Nakagawa, F., Gamo, T. and Ishibashi, J., 2005, Stable isotopic compositions of
methane and carbon monoxide in the Suiyo hydrothermal plume, Izu-Bonin arc: Tracers for
microbial consumption/production, Earth and Planetary Science Letters, 237: 326-340
Tsunogai, U., Yoshida, N. and Gamo, T., 2002, Carbon isotopic evidence of methane oxidation
through sulfate reduction in sediment beneath cold seep vents on the seafloor at Nankai Trough,
Marine Geology, 187: 145-160
CH4 cycling in the Ría de Vigo
31
Upstill-Goddard, R. C., Barnes, J., Frost, T., Punshon, S. and Owens, N. J. P., 2000, Methane in
the southern North Sea: Low-salinity inputs, estuarine removal, and atmospheric flux, Global
Biogeochemical Cycles, 14: 1205-1217
Upstill-Goddard, R. C., Rees, A. P. and Owens, N. J. P., 1996, Simultaneous high-precision
measurements of methane and nitrous oxide in water and seawater by single phase equilibration gas
chromatography., Deep Sea Research I, 43: 1669-1682
Upstill-Goddard, R. C., Watson, A. J., Liss, P. S. and Lidicoat, M. I., 1990, Gas transfer
velocities in lakes measured with SF6, Tellus, 42: 364-377
Valentine, D. L., Chidthaisong, A., Rice, A., Reeburgh, W. S. and Tyler, S. C., 2004, Carbon
and hydrogen isotope fractionation by moderately thermophilic methanogens, Geochimica Et
Cosmochimica Acta, 68: 1571-1590
Van Der Nat, F. J. W. A., Brouwer, J. F. C. d., Middelburg, J. J. and Laanbroek, H. J., 1997,
Spatial distribution and inhibition by ammonium of methane oxidation in intertidal freshwater
marshes., Applied Environmental Microbiology, 63: 4734-4740
Wanninkhof, R. H., 1992, Relationship between wind speed and gas exchange over the ocean,
Journal of Geophysical Research, 97: 7373-7382
Whiticar, M. J., 2002, Diagenetic relationships of methanogenesis, nutrients, acoustic turbidity,
pockmarks and freshwater seepages in Eckernfoerde Bay, Marine Geology, 182: 29-53
Wiesenburg, D. A. and Guinasso, N. L., 1979, Equilibrium Solubilities of Methane, Carbon-
Monoxide, and Hydrogen in Water and Sea-Water, Journal of Chemical and Engineering Data, 24:
356-360
Winfrey, M. R., Marty, D. G., Bianchi, A. J. M. and Ward, D. M., 1981, Vertical-Distribution
of Sulfate Reduction, Methane Production, and Bacteria in Marine-Sediments, Geomicrobiology
Journal, 2: 341-362
Wuebbles, D. J. and Hayhoe, K., 2002, Atmospheric methane and global change, Earth-Science
Reviews, 57: 177-210

CH4 cycling in the Ría de Vigo
32

CH4 cycling in the Ría de Vigo
33
Table 1: Average CH4 concentration (nmol L-1
) ± standard deviation (number of samples in
parenthesis) and average salinity (in brackets) in in each of the outer, middle and inner parts of the
Ría de Vigo during April 2003 and September 2004 field campaigns.
Field Campaign Dissolved CH4 (nmol L-1
), respective salinity in brackets
outer middle inner Verdugo-
Oitabén
April 2003 11±10 (11), [33] 26±12 (15), [32] 39±5 (8), [28] no data
September 2004 34±28 (5), [35] 70±16 (5), [34] 112±39 (13), [31] 180 (1), [19]

CH4 cycling in the Ría de Vigo
34
Table 2: Estimated sea-air CH4 fluxes for the inner, middle and outer part of the Ría de Vigo based
on gas exchange models parameterised according to: a) Liss and Merlivat (1986) and b)
Wanninghoff (1992).
inner middle outer
Area (× 106 m
2) 24 46 108
April 2003
Dissolved CH4 (nmol L-1
) 39 26 11
Sea-Air flux (μmol m-2
d-1
) 84a – 167
b 53
a – 107
b 1
a - 3
b
September 2004
Dissolved CH4 (nmol L-1
) 112 70 34
Sea-Air flux (μmol m-2
d-1
) 47a – 89
b 8
a – 60
b 1
a – 10
b
CH4 cycling in the Ría de Vigo
35
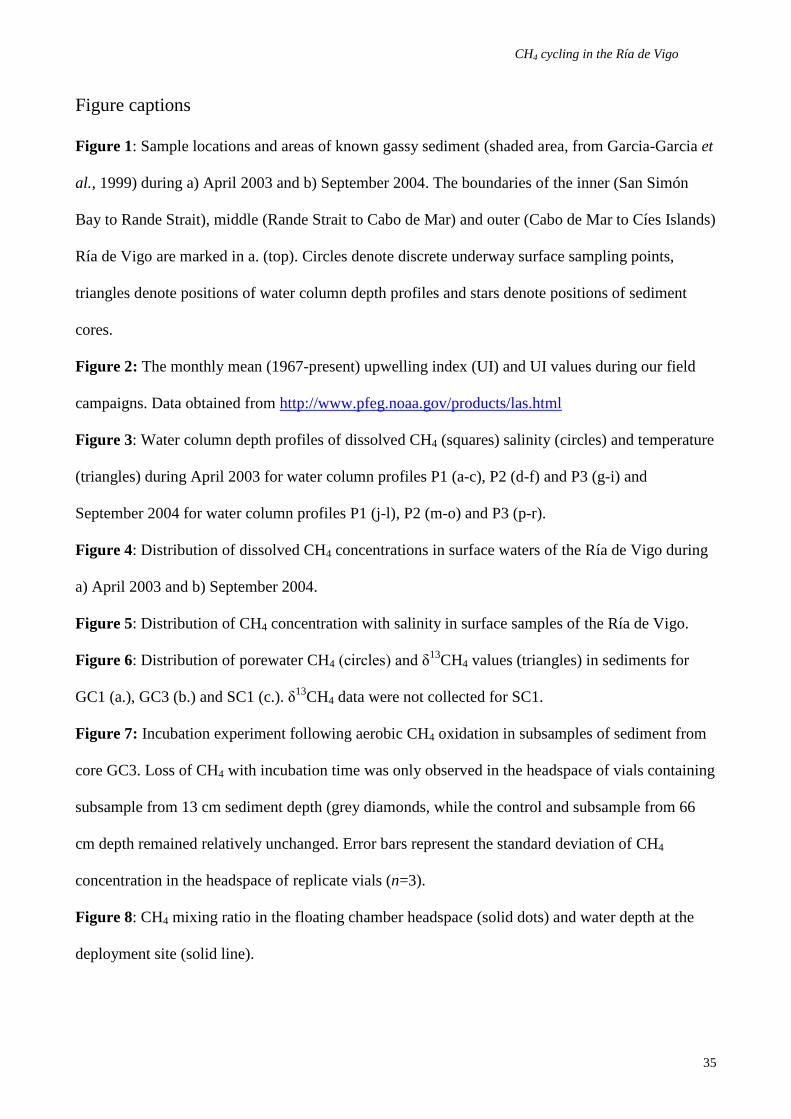
Figure captions
Figure 1: Sample locations and areas of known gassy sediment (shaded area, from Garcia-Garcia et
al., 1999) during a) April 2003 and b) September 2004. The boundaries of the inner (San Simón
Bay to Rande Strait), middle (Rande Strait to Cabo de Mar) and outer (Cabo de Mar to Cíes Islands)
Ría de Vigo are marked in a. (top). Circles denote discrete underway surface sampling points,
triangles denote positions of water column depth profiles and stars denote positions of sediment
cores.
Figure 2: The monthly mean (1967-present) upwelling index (UI) and UI values during our field
campaigns. Data obtained from http://www.pfeg.noaa.gov/products/las.html
Figure 3: Water column depth profiles of dissolved CH4 (squares) salinity (circles) and temperature
(triangles) during April 2003 for water column profiles P1 (a-c), P2 (d-f) and P3 (g-i) and
September 2004 for water column profiles P1 (j-l), P2 (m-o) and P3 (p-r).
Figure 4: Distribution of dissolved CH4 concentrations in surface waters of the Ría de Vigo during
a) April 2003 and b) September 2004.
Figure 5: Distribution of CH4 concentration with salinity in surface samples of the Ría de Vigo.
Figure 6: Distribution of porewater CH4 (circles) and δ13
CH4 values (triangles) in sediments for
GC1 (a.), GC3 (b.) and SC1 (c.). δ13
CH4 data were not collected for SC1.
Figure 7: Incubation experiment following aerobic CH4 oxidation in subsamples of sediment from
core GC3. Loss of CH4 with incubation time was only observed in the headspace of vials containing
subsample from 13 cm sediment depth (grey diamonds, while the control and subsample from 66
cm depth remained relatively unchanged. Error bars represent the standard deviation of CH4
concentration in the headspace of replicate vials (n=3).
Figure 8: CH4 mixing ratio in the floating chamber headspace (solid dots) and water depth at the
deployment site (solid line).

CH4 cycling in the Ría de Vigo
36
GC1
GC3
P1
P2
SC1
P1
P3
P2
P3
San Simón B.
C. de Mar
Cíes Is.
Rande St.
Figure 1: Kitidis et al., Methane cycling in the Ría de Vigo
CH4 cycling in the Ría de Vigo
37
-200
-150
-100
-50
0
50
100
Jan
FebM
arA
prM
ay Jun
Jul
Aug Sep O
ctN
ov Dec
Month
Up
wel
lin
g I
nd
ex
Average 1967-2004
This study
Figure 2: Kitidis et al., Methane cycling in the Ría de Vigo

CH4 cycling in the Ría de Vigo
38
Figure 3: Kitidis et al., Methane cycling in the Ría de Vigo

CH4 cycling in the Ría de Vigo
39
Figure 4: Kitidis et al., Methane cycling in the Ría de Vigo

CH4 cycling in the Ría de Vigo
40
0
50
100
150
200
250
18 22 26 30 34Salinity
CH
4 (
nm
ol
L-1
)
Sep-04
Apr-03
Figure 5: Kitidis et al., Methane cycling in the Ría de Vigo

CH4 cycling in the Ría de Vigo
41
Figure 6: Kitidis et al., Methane cycling in the Ría de Vigo

CH4 cycling in the Ría de Vigo
42
0
3
6
9
0 50 100 150 200 250
Incubation time (hours)
CH
4 i
n h
ead
spac
e (p
ptv
)
GC3-13 cm
control
GC3-66 cm
Figure 7: Kitidis et al., Methane cycling in the Ría de Vigo

CH4 cycling in the Ría de Vigo
43
0
2
4
6
8 12 16 20Time
CH
4 (
pp
m),
dep
th (
m)
Figure 8: Kitidis et al., Methane cycling in the Ría de Vigo
Related Documents


