The Bio/Diversity Project Manual University of Arizona Women in Science and Engineering Program Arizona-Sonora Desert Museum | National Park Service January 2017 This work was supported by the Agnese Nelms Haury Program in Environment and Social Justice.

Welcome message from author
This document is posted to help you gain knowledge. Please leave a comment to let me know what you think about it! Share it to your friends and learn new things together.
Transcript
The Bio/Diversity Project Manual
University of Arizona Women in Science and Engineering Program
Arizona-Sonora Desert Museum | National Park Service
January 2017
This work was supported by the Agnese Nelms Haury Program in Environment and Social Justice.

The Bio/Diversity Project is made possible by generous funding from the Agnese Nelms Haury
Program in Environment and Social Justice
Partner Organizations
The Bio/Diversity Project emerged as a collaborative endeavor by four Tucson, Arizona organizations dedicated to conservation and science education: the Arizona-Sonora Desert Museum, the Friends of Saguaro National Park, Saguaro National Park, and the University of Arizona Women in Science and Engineering Program. After a successful year of coordinating bioblitzes at local schools, the organizations decided that more sustained engagement with K-12 schools was necessary to attain the transformative effect that they had envisioned. With generous funding from the Agnese Nelms Haury Program in Environment and Social Justice, they came together to create the Bio/Diversity Project. The overarching goal of the Bio/Diversity Project is to create a K-16+ and into the workforce pipeline that is aimed at diversifying the environmental sciences and increasing the diversity of voices included in discussions of environmental problems and their solutions. Read more about the partner organizations below.
Arizona-Sonora Desert Museum
The Arizona-Sonora Desert Museum was founded in 1952 and is recognized throughout the world as a model institution for innovative presentation and interpretation of native plants and animals that are featured together in ecological exhibits. The Museum is regularly listed as one of the top ten zoological parks in the world due to its unique approach in interpreting the complete natural history of a single region (in our case this is the Sonoran Desert and adjacent ecosystems). This represents a significant achievement, as the Museum’s collections and size are smaller than many of its counterparts. Not a “museum” in the usual sense, it is an unparalleled composite of plant, animal, and geologic collections with the goal of making the Sonoran Desert accessible, understandable, and valued.
Today, this approach can be most easily understood by noting that the Museum’s living animal collection contains 4,892 specimens of 242 species. Plants number 56,445 specimens of 1,100 taxa; mineral and fossil collections include 16,853 specimens. The living collections also contain 110 to 120 species that are considered to be of conservation concern.
The Museum tries to find ways to enlarge its reach, whether this is in school and community education programs in urban and rural areas of Arizona, Sonora, and Baja, through publications, or through electronic communication. Today, the Museum's conservation and research programs are providing important information to help conserve the Sonoran Desert region, and the Desert Museum's Art Institute inspires conservation through art education and gallery exhibits. The Museum's publishing division, ASDM Press, has produced over 40 books and guides on the natural and cultural history of the Sonoran Desert region.
The Desert Museum is open 365 days per year and serves schools through field trips and live animal outreach programs. For more information about the Arizona-Sonora Desert Museum, visit https://www.desertmuseum.org/center/edu/
Friends of Saguaro National Park
Friends of Saguaro National Park (FOSNP) is a not-for-profit fundraising partner of the National Park Service that was created to help preserve, protect and enhance the fragile environment and unique cultural heritage of the Sonoran Desert at Saguaro National Park. Friends of Saguaro’s mission is to help protect natural and cultural resources, preserve native landscapes, promote environmental education, improve recreational trails, enhance visitor experiences, strengthen community partnerships, and build environmental stewardship for Saguaro National Park through philanthropy, education, volunteerism, and public awareness.
Since its founding in 1996, FOSNP has sought to establish collaborative partnerships within the Tucson community, develop a broad donor base, and provide both funding and volunteer support for some of the Park's most critical needs. For six straight years, the organization has been recognized by GreatNonprofits for its status as a "Top-Rated Nonprofit" during the annual "Green Choice" campaign, which is a distinction that is achieved by fewer than 1% of nonprofits nationwide.
By providing critical financial support and growing public awareness, Friends of Saguaro provides a vital link between Saguaro National Park and the Tucson community – and helps protect what Theodore Roosevelt described as "the most glorious heritage a people have ever received" – the lands and resources that have helped to define our vision and values as a nation.
For more information about Friends of Saguaro, visit http://www.friendsofsaguaro.org/
Saguaro National Park
Saguaro National Park was first established in 1933 for the purpose of protecting the giant saguaro cactus (Carnegia gigantean) and the associated Sonoran Desert and Sky Island ecological communities. Following several park expansions in subsequent decades, the National Park Service today works to preserve desert, mountain, and riparian habitats in the Tucson and Rincon Mountains, as well as the largest roadless Sky Island in North America – all of which encompasses a wide range of elevations that support extraordinary biodiversity. 78% of the Park's 91,327 acres are federally-designated wilderness – and the Park must preserve and protect its wilderness qualities while promoting understanding (and stewardship) of its natural and cultural resources through appropriate scientific research.
Saguaro National Park protects a superb example of the Sonoran Desert ecosystem, and features exceptional stands of saguaro cacti, fragile wildlife habitat, critical riparian areas, and the associated Sky Island mountain areas. The Park also preserves significant cultural resources, including national-register-listed or national-register-eligible archeological resources, places important to Native American cultural traditions, and historic structures. The Park provides exceptional opportunities for visitors to experience solitude and discover nature on their own, to educate people through close interaction with the environment, and to see the outstanding and diverse scenic features of this classic desert landscape.
Learn more by checking out the Park's website at http://www.nps.gov/sagu/
University of Arizona Women in Science and Engineering Program
The Women in Science and Engineering (WISE) Program was established at the University of Arizona in 1976 as part of the Women's Studies Department and the Southwest Institute for Research on Women. WISE aims to increase interest and diversity in the fields of social and natural science, technology, engineering, mathematics, and medicine by offering a variety of outreach programs and student engagement opportunities. In doing so, the program works to motivate students to enter careers in STEM fields and to support them along the way. It is the firm belief of WISE that greater diversity produces both better science and science that is better equipped to address some of the most pressing problems we face in the world today.
Since 2015, WISE has worked with organizations and schools throughout the Tucson metro area to increase interest and diversity in the environmental sciences. Our ability to grapple with some of the most pressing problems of the 21st century requires that we include a diversity of voices in discussions of environmental problems and the development of their solutions. Creating inclusive and diverse environmental science communities necessitates exposing youth to innovative, engaging environmental science programming and offering them support along their educational journeys. By providing programming along the K-16+ educational pipeline, WISE hopes to inspire the next generation of environmental scientists and change-makers.
For more information about the programs that are offered, visit the WISE website at http://wise.arizona.edu/
Table of Contents
Introduction
The Bio/Diversity Project.....................................................................................................................
The Importance of Diversity in the Environmental Sciences
Diversifying the Environmental Sciences.............................................................................................Why Are Our Parks So White?.............................................................................................................“Doing” Science Versus “Being” a Scientist: Examining 10/11-Year-Old Schoolchildren’s Constructions of Science Through the Lens of Identity.......................................................................Relevant: Beyond the Basics................................................................................................................Culturally Relevant Teaching in Science Classrooms: Addressing Academic Achievement, Cultural Competence, and Critical Consciousness...............................................................................3 Tips to Make Any Lesson More Culturally Responsive....................................................................
The Science and Policy of Biodiversity
Basics
Biodiversity: The Variety of Life that Sustains Our Own....................................................................Conservation of Biodiversity................................................................................................................2010 and Beyond: Rising to the Biodiversity Challenge......................................................................
Agriculture
Biodiversity...........................................................................................................................................Native American Gardening: The Three Sisters and More..................................................................
Climate Change
Causes and Consequences of Biodiversity Declines.............................................................................The Planet is Heating Up Faster Than Species Can Migrate................................................................
Policy Across Scales
[Local] Sonoran Desert Conservation Plan Pima County, Arizona......................................................[National] A History of the Endangered Species Act of 1973..............................................................[International] Sustaining Life on Earth: How the Convention on Biological Diversity Promotes Nature and Human Well-Being.............................................................................................................
Our Local Habitat: The Sonoran Desert
The Sonoran Desert: Background Information.....................................................................................Plant Ecology of the Sonoran Desert Region.......................................................................................Adaptations of Desert Amphibians & Reptiles.....................................................................................The Desert Adaptations of Birds & Mammals.....................................................................................
Culture and the Environment
Native Knowledge in the Sonoran Desert Region: People in the Sonoran Desert...............................Human Ecology of the Sonoran Desert................................................................................................

The Schoolyard Bioblitz
Background
National Geographic Bioblitz..............................................................................................................Measuring Biodiversity........................................................................................................................
Lesson Plan
The Schoolyard Bioblitz......................................................................................................................Identification Tools
Plant Identification Basics...................................................................................................................Resources for Learning and Teaching Plant Identification..................................................................A Pictorial Key to the Order of Adult Insects......................................................................................
Appendix
Vocabulary List....................................................................................................................................Breakdown of Science Standards in Arizona.......................................................................................

Introduction
The Bio/Diversity Project
Women, Latino/a, and Native American populations are systematically under-represented among those receiving university degrees in environmental science related fields and those entering the environmental science workforce. Increasing diversity in environmental science fields and careers is necessary for ensuring that the pressing environmental challenges we will face in the 21st century are understood and addressed in ways that benefit the most marginalized members of our society. The Bio/Diversity Project works to increase the diversity of voices included in discussions of environmental issues and the development of solutions to address them, by fostering the entry and success of under-represented populations in environmental science disciplines along a K-16+ educational pipeline and into the environmental science workforce.
A key component of this project is working with university-level students and local K-12 educators to expand environmental science programming at K-12 schools. This manual will serve as a guide for University of Arizona student interns and K-12 partner teachers, and will provide valuable information on the science of biodiversity, the importance of diversity in the sciences, the Sonoran Desert ecosystem, and the relationships between culture and environment that shape the biodiversity of local habitats.
Program Goals
• Increase K-12 student interest in and knowledge of environmental science topics, namelybiodiversity, and careers
• Increase K-12 student access to innovative, experiential environmental scienceeducational opportunities
• Increase positive science identity, motivation, and self-efficacy among K-12 studentparticipants
• Improve science communication skills among university student participants• Build positive relationships between partner organizations and K-12 schools and
teachers
Our Funding
This program is made possible by generous funding from the Agnese Nelms Haury Program in Environment and Social Justice. The Haury Program supports an array of programming to further research, education, and partnerships for socially just solutions to environmental problems.
The Importance of Diversity in the
Environmental Sciences
Diversifying the Environmental Sciences
Since the 1990s, policy makers, educators, and social activists have drawn attention to prevalent gender and racial disparities in STEM fields and careers. Women and members of certain racial and ethnic groups (e.g., Latino/as, African Americans, Native Americans) are systematically underrepresented among those receiving undergraduate and graduate degrees in STEM fields and those entering and persisting in the STEM workforce. While a variety of efforts have been made to encourage the entry and success of underrepresented groups in STEM fields, research by US News and Raytheon shows remarkably little progress was made in decreasing racial and gender disparities between the years 2000 and 2015. In some cases, we’ve actually seen a decline in the number of women and people of color in certain fields. For example, fewer African American men are in medical school today than there were in 1975 and the percentage of women pursuing computer science degrees has declined by nearly 20% since the early 1980s.
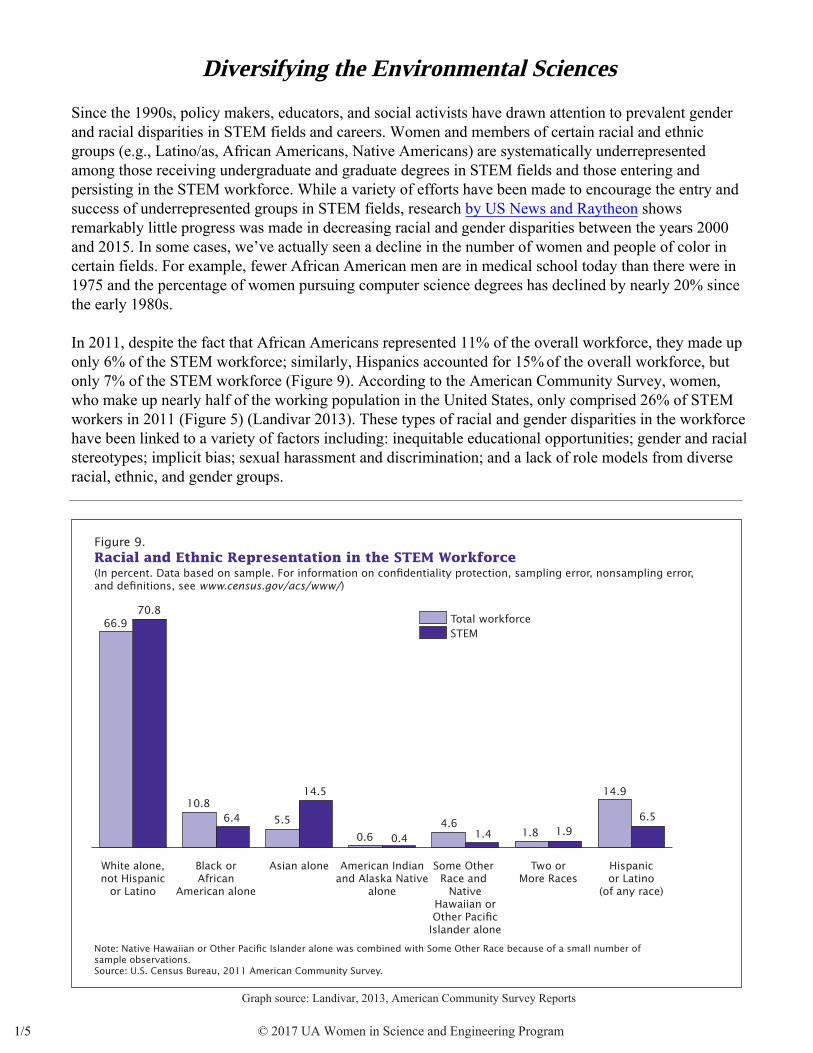
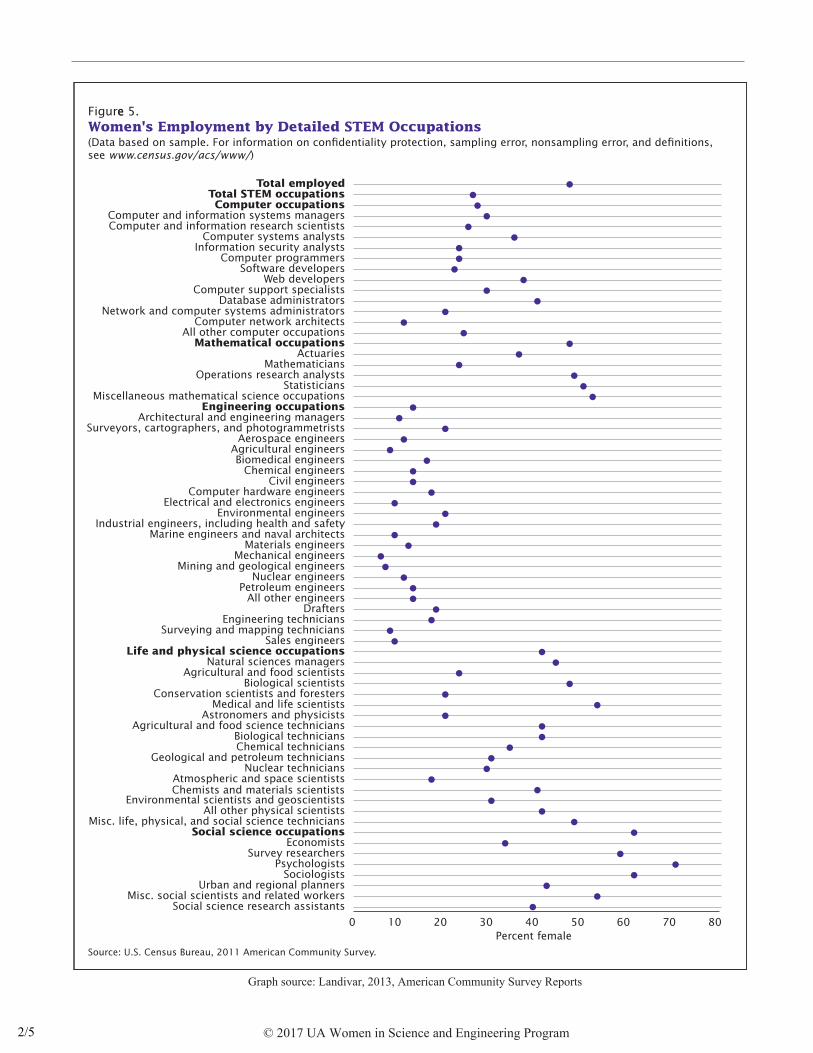
In 2011, despite the fact that African Americans represented 11% of the overall workforce, they made up only 6% of the STEM workforce; similarly, Hispanics accounted for 15% of the overall workforce, but only 7% of the STEM workforce (Figure 9). According to the American Community Survey, women, who make up nearly half of the working population in the United States, only comprised 26% of STEM workers in 2011 (Figure 5) (Landivar 2013). These types of racial and gender disparities in the workforce have been linked to a variety of factors including: inequitable educational opportunities; gender and racial stereotypes; implicit bias; sexual harassment and discrimination; and a lack of role models from diverse racial, ethnic, and gender groups.
Figure 9. Racial and Ethnic Representation in the STEM Workforce(In percent. Data based on sample. For information on con�dentiality protection, sampling error, nonsampling error, and de�nitions, see www.census.gov/acs/www/)
Note: Native Hawaiian or Other Paci�c Islander alone was combined with Some Other Race because of a small number of sample observations. Source: U.S. Census Bureau, 2011 American Community Survey.
Total workforceSTEM
Hispanicor Latino
(of any race)
Two orMore Races
Some Other Race and
NativeHawaiian orOther Paci�c
Islander alone
American Indianand Alaska Native
alone
Asian aloneBlack orAfrican
American alone
White alone,not Hispanic
or Latino
66.970.8
10.86.4 5.5
14.5
0.6 0.41.91.81.4
4.6
14.9
6.5
1/5
Graph source: Landivar, 2013, American Community Survey Reports
© 2017 UA Women in Science and Engineering Program
Source: U.S. Census Bureau, 2011 American Community Survey.
Percent female
Figure 5.e Women's Employment by Detailed STEM Occupations(Data based on sample. For information on con�dentiality protection, sampling error, nonsampling error, and de�nitions,see www.census.gov/acs/www/)
Total employedTotal STEM occupationsComputer occupations
Computer and information systems managersComputer and information research scientists
Computer systems analystsInformation security analysts
Computer programmersSoftware developers
Web developersComputer support specialists
Database administratorsNetwork and computer systems administrators
Computer network architectsAll other computer occupations
Mathematical occupationsActuaries
MathematiciansOperations research analysts
StatisticiansMiscellaneous mathematical science occupations
Engineering occupationsArchitectural and engineering managers
Surveyors, cartographers, and photogrammetristsAerospace engineers
Agricultural engineersBiomedical engineers
Chemical engineersCivil engineers
Computer hardware engineersElectrical and electronics engineers
Environmental engineersIndustrial engineers, including health and safety
Marine engineers and naval architectsMaterials engineers
Mechanical engineersMining and geological engineers
Nuclear engineersPetroleum engineers
All other engineersDrafters
Engineering techniciansSurveying and mapping technicians
Sales engineersLife and physical science occupations
Natural sciences managersAgricultural and food scientists
Biological scientistsConservation scientists and foresters
Medical and life scientistsAstronomers and physicists
Agricultural and food science techniciansBiological techniciansChemical technicians
Geological and petroleum techniciansNuclear technicians
Atmospheric and space scientistsChemists and materials scientists
Environmental scientists and geoscientistsAll other physical scientists
Misc. life, physical, and social science techniciansSocial science occupations
EconomistsSurvey researchers
PsychologistsSociologists
Urban and regional plannersMisc. social scientists and related workers
Social science research assistants
0 10 20 30 40 50 60 70 80
2/5
Graph source: Landivar, 2013, American Community Survey Reports
© 2017 UA Women in Science and Engineering Program
While discussions of diversifying STEM fields have become relatively common-place, some fields receive more attention than others. Engineering, computer science, physics, and mathematics, for example, have received sustained attention by governmental and non-governmental organizations alike. Environmental science, however, is often not explicitly named in discussions of STEM diversity, but data indicates that it currently lacks gender and racial/ethnic diversity.
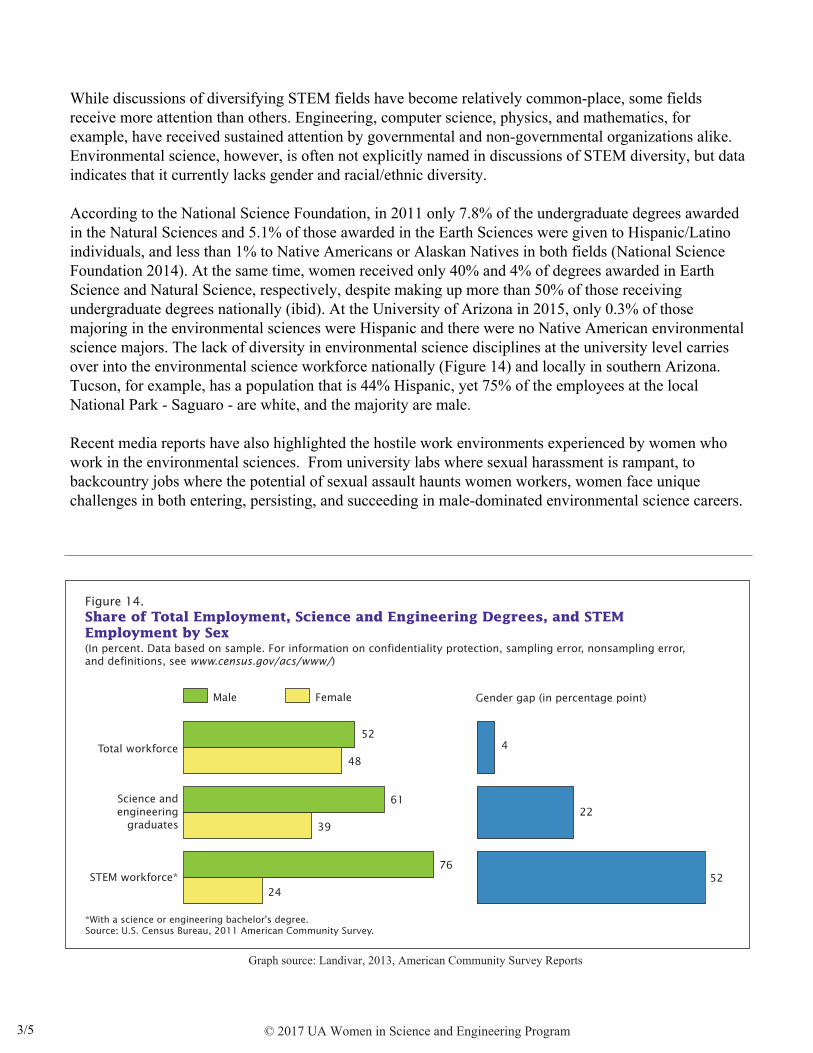
According to the National Science Foundation, in 2011 only 7.8% of the undergraduate degrees awarded in the Natural Sciences and 5.1% of those awarded in the Earth Sciences were given to Hispanic/Latino individuals, and less than 1% to Native Americans or Alaskan Natives in both fields (National Science Foundation 2014). At the same time, women received only 40% and 4% of degrees awarded in Earth Science and Natural Science, respectively, despite making up more than 50% of those receiving undergraduate degrees nationally (ibid). At the University of Arizona in 2015, only 0.3% of those majoring in the environmental sciences were Hispanic and there were no Native American environmental science majors. The lack of diversity in environmental science disciplines at the university level carries over into the environmental science workforce nationally (Figure 14) and locally in southern Arizona. Tucson, for example, has a population that is 44% Hispanic, yet 75% of the employees at the local National Park - Saguaro - are white, and the majority are male.
Recent media reports have also highlighted the hostile work environments experienced by women who work in the environmental sciences. From university labs where sexual harassment is rampant, to backcountry jobs where the potential of sexual assault haunts women workers, women face unique challenges in both entering, persisting, and succeeding in male-dominated environmental science careers.
Figure 14. Share of Total Employment, Science and Engineering Degrees, and STEM Employment by Sex(In percent. Data based on sample. For information on confidentiality protection, sampling error, nonsampling error, and definitions, see www.census.gov/acs/www/)
*With a science or engineering bachelor's degree.Source: U.S. Census Bureau, 2011 American Community Survey.
FemaleMale
STEM workforce*
Science andengineering
graduates
Total workforce
24
76
39
61
48
52
Gender gap (in percentage point)
52
22
4
3/5
Graph source: Landivar, 2013, American Community Survey Reports
© 2017 UA Women in Science and Engineering Program
Why Diversity?
While it is clear that the environmental sciences lack a gender and racial/ethnic diversity that is representative of the US population, this does not address the question of why we should work towards creating more diverse environmental science communities. So, why is diversity important? What benefits come from having a greater diversity in scientific communities in general, and also among those examining particular environmental issues?
There are a number of reasons why fostering more diverse scientific communities is desirable. The more diverse these communities are, the more innovative and capable they are of tackling challenging problems. Research on diversity in the sciences has illustrated that gender and racial/ethnic diversity within scientific communities is necessary for ensuring that the benefits of scientific pursuits are justly distributed across the population (Harding 2006). By including a diverse set of voices in discussions of environmental problems and their solutions it helps to ensure that the needs of the most marginalized members of society, who are often those most affected by environmental problems, are addressed. Fostering the entry and success of individuals from groups that are underrepresented in the environmental sciences is important in developing innovative solutions to environmental challenges and helping to ensure that these solutions are capable of improving the lives of all members of society. Moreover, a lack of diversity in the environmental sciences indicates that there is inequitable access to educational opportunities in the sciences for different gender and racial/ethnic groups.
Fostering Diversity: Science Identity, Motivation, and Self-Efficacy
Research shows that young people begin to identify or dis-identify with science and math as early as 10 years old. For many students there is a marked disconnect between enjoying science – ‘doing science’ – and identifying with science or identifying as a scientist – ‘being a scientist’ (Archer 2010). This disconnect is most pronounced among girls and students from racial and ethnic groups that are underrepresented in the sciences. As students come to understand themselves as gendered and racialized beings, their ability to identify with science and as scientists is linked to how their personal identities map onto their visions of what scientists look like. This means that fostering interest, success, and persistence in the sciences among underrepresented students requires challenging narrow notions of what a scientist looks like, or of who can be a scientist.
Providing students with positive STEM role models that are ethnically and gender-diverse is one way to counter these narrow understandings of science and scientists. Additionally, by linking scientific issues, methods, or processes to student interest, educators can help make science seem more relevant and important to students.
Due to systematic methodologies that exist in school systems though, certain challenges exist in integrating these methods into science classrooms. Traditional science textbooks and curriculum often implicitly take a Eurocentric and masculinist viewpoint – white and male individuals are overrepresented in examples of key scientific figures, and Western cultural beliefs and values (e.g., white, middle-class) dominate how scientific topics are framed and discussed. Furthermore, a deficit model often guides educational program development, where non-white and female students are seen as lacking – in resources, access to opportunities, and knowledge. While a number of structural factors create educational inequities that often manifest in gendered and racialized ways, this type of deficit model of education fails to acknowledge the unique and valuable knowledge, skills, and resources that marginalized students bring to the classroom.
4/5 © 2017 UA Women in Science and Engineering Program
Research on diversity and science education has identified a number of strategies that are effective at increasing student interest and success in STEM fields and careers. Providing students with diverse role models, offering interactive activities that make science fun and relatable, and offering opportunities for students to interact with scientists have all been shown to positively affect student interest and persistence in STEM fields. Moreover, providing opportunities for students to see the real-world relevance of scientific knowledge and processes has increased student interest in science, especially among students from groups that are traditionally underrepresented in these fields.
In response to the gender and racial/ethnic diversity issues in the environmental science workforce, the K-12 outreach component of the Bio/Diversity Project will strive to increase student access to hands-onenvironmental science educational opportunities and to foster the development of science identity,motivation, and self-efficacy in local students. University of Arizona student interns will be paired withK-12 teachers to develop culturally-relevant and place-based environmental science lessons that focuson the overarching theme of biodiversity. In order to provide K-12 students with diverse STEM rolemodels, special attention will be paid to recruiting UA student interns from groups that areunderrepresented in the environmental sciences.
5/5 © 2017 UA Women in Science and Engineering Program
1/4
http://nyti.ms/1IPKgal
SundayReview | OPINION
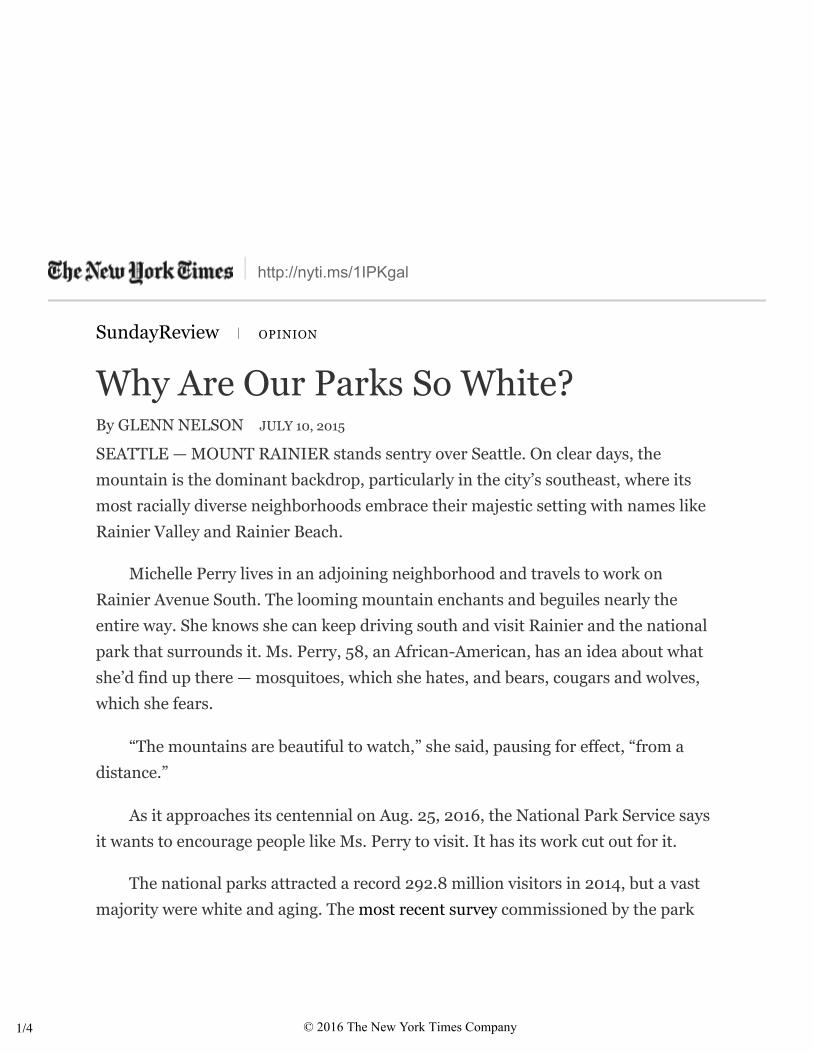
Why Are Our Parks So White?By GLENN NELSON JULY 10, 2015
SEATTLE — MOUNT RAINIER stands sentry over Seattle. On clear days, themountain is the dominant backdrop, particularly in the city’s southeast, where itsmost racially diverse neighborhoods embrace their majestic setting with names likeRainier Valley and Rainier Beach.
Michelle Perry lives in an adjoining neighborhood and travels to work onRainier Avenue South. The looming mountain enchants and beguiles nearly theentire way. She knows she can keep driving south and visit Rainier and the nationalpark that surrounds it. Ms. Perry, 58, an African-American, has an idea about whatshe’d find up there — mosquitoes, which she hates, and bears, cougars and wolves,which she fears.
“The mountains are beautiful to watch,” she said, pausing for effect, “from adistance.”
As it approaches its centennial on Aug. 25, 2016, the National Park Service saysit wants to encourage people like Ms. Perry to visit. It has its work cut out for it.
The national parks attracted a record 292.8 million visitors in 2014, but a vastmajority were white and aging. The most recent survey commissioned by the park
© 2016 The New York Times Company
2/4
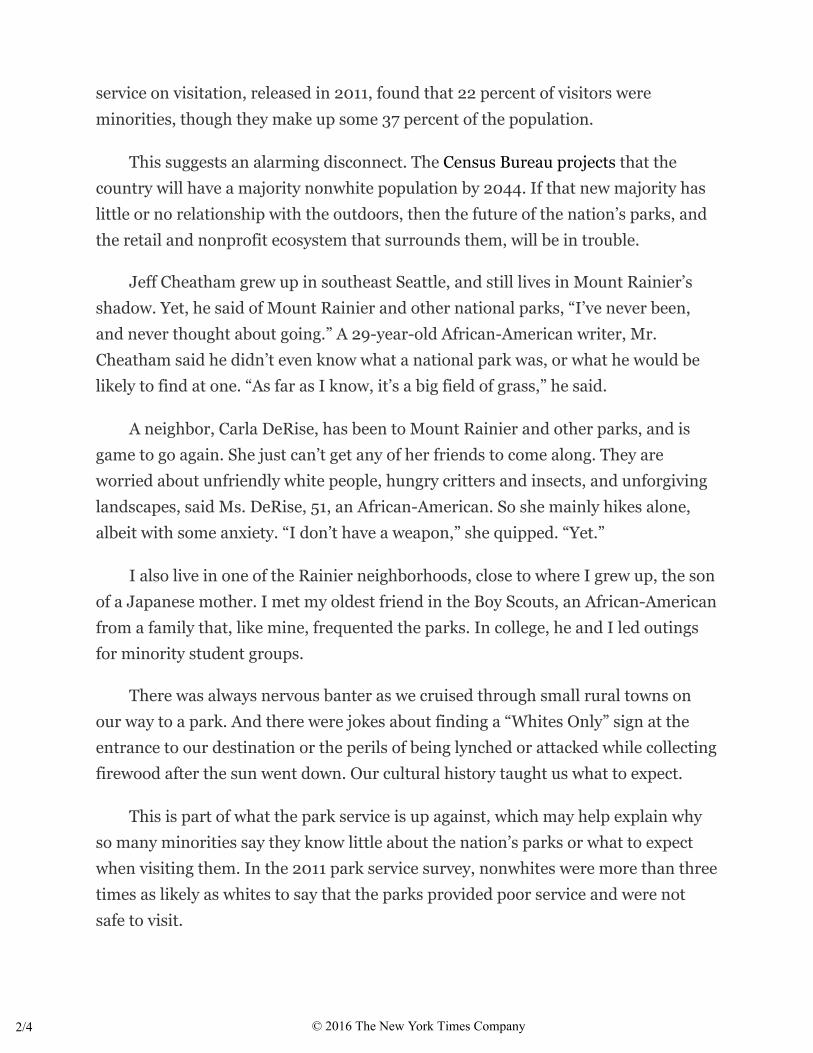
service on visitation, released in 2011, found that 22 percent of visitors wereminorities, though they make up some 37 percent of the population.
This suggests an alarming disconnect. The Census Bureau projects that thecountry will have a majority nonwhite population by 2044. If that new majority haslittle or no relationship with the outdoors, then the future of the nation’s parks, andthe retail and nonprofit ecosystem that surrounds them, will be in trouble.
Jeff Cheatham grew up in southeast Seattle, and still lives in Mount Rainier’sshadow. Yet, he said of Mount Rainier and other national parks, “I’ve never been,and never thought about going.” A 29-year-old African-American writer, Mr.Cheatham said he didn’t even know what a national park was, or what he would belikely to find at one. “As far as I know, it’s a big field of grass,” he said.
A neighbor, Carla DeRise, has been to Mount Rainier and other parks, and isgame to go again. She just can’t get any of her friends to come along. They areworried about unfriendly white people, hungry critters and insects, and unforgivinglandscapes, said Ms. DeRise, 51, an African-American. So she mainly hikes alone,albeit with some anxiety. “I don’t have a weapon,” she quipped. “Yet.”
I also live in one of the Rainier neighborhoods, close to where I grew up, the sonof a Japanese mother. I met my oldest friend in the Boy Scouts, an African-Americanfrom a family that, like mine, frequented the parks. In college, he and I led outingsfor minority student groups.
There was always nervous banter as we cruised through small rural towns onour way to a park. And there were jokes about finding a “Whites Only” sign at theentrance to our destination or the perils of being lynched or attacked while collectingfirewood after the sun went down. Our cultural history taught us what to expect.
This is part of what the park service is up against, which may help explain whyso many minorities say they know little about the nation’s parks or what to expectwhen visiting them. In the 2011 park service survey, nonwhites were more than threetimes as likely as whites to say that the parks provided poor service and were notsafe to visit.
© 2016 The New York Times Company
Why Are Our Parks So White? - The New York Times
3/4
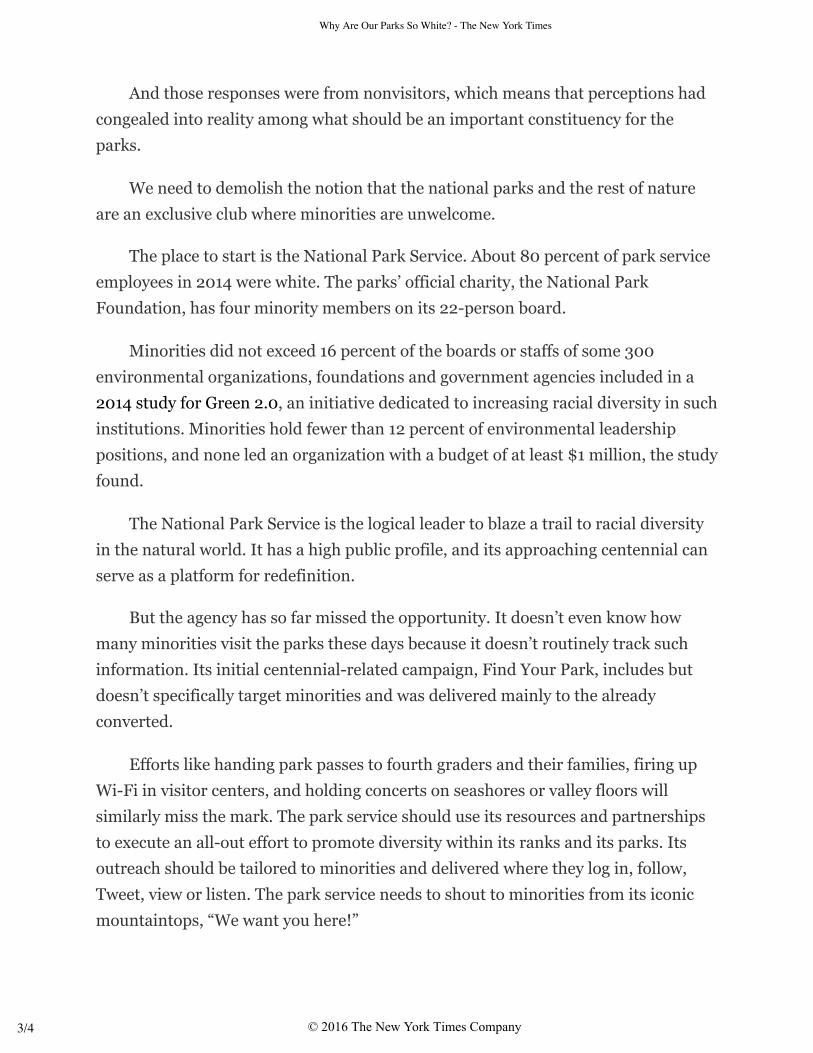
And those responses were from nonvisitors, which means that perceptions hadcongealed into reality among what should be an important constituency for theparks.
We need to demolish the notion that the national parks and the rest of natureare an exclusive club where minorities are unwelcome.
The place to start is the National Park Service. About 80 percent of park serviceemployees in 2014 were white. The parks’ official charity, the National ParkFoundation, has four minority members on its 22-person board.
Minorities did not exceed 16 percent of the boards or staffs of some 300environmental organizations, foundations and government agencies included in a2014 study for Green 2.0, an initiative dedicated to increasing racial diversity in suchinstitutions. Minorities hold fewer than 12 percent of environmental leadershippositions, and none led an organization with a budget of at least $1 million, the studyfound.
The National Park Service is the logical leader to blaze a trail to racial diversityin the natural world. It has a high public profile, and its approaching centennial canserve as a platform for redefinition.
But the agency has so far missed the opportunity. It doesn’t even know howmany minorities visit the parks these days because it doesn’t routinely track suchinformation. Its initial centennial-related campaign, Find Your Park, includes butdoesn’t specifically target minorities and was delivered mainly to the alreadyconverted.
Efforts like handing park passes to fourth graders and their families, firing upWi-Fi in visitor centers, and holding concerts on seashores or valley floors willsimilarly miss the mark. The park service should use its resources and partnershipsto execute an all-out effort to promote diversity within its ranks and its parks. Itsoutreach should be tailored to minorities and delivered where they log in, follow,Tweet, view or listen. The park service needs to shout to minorities from its iconicmountaintops, “We want you here!”
© 2016 The New York Times Company
Why Are Our Parks So White? - The New York Times
4/4
Such a campaign could include educational programs about the importance ofthe outdoors to a healthy lifestyle, transportation solutions for carless urbandwellers, and advice on easy and safe ways to enjoy the parks.
The national parks are every American’s vacation home. My wife and I haveimmigrant mothers who view ownership of the national parks as a grand perk oftheir naturalized citizenship. Such entitlement must be nurtured in underservedcommunities. As the world becomes more urbanized, it is increasingly essential topreserve the outdoors as a respite for everyone.
This notion begs for a ubiquitous marketing effort: “I am(hiking/camping/fishing) in my own backyard,” set in various parks and with peopleof different backgrounds.
We need to inspire people like Jordan Quiller, a 21-year-old African-Americanwho had never seen a mountain until he moved into one of the Rainier-monikeredSeattle neighborhoods at the end of last year. He’s never visited a national park, butwould like to.
Three national parks lie within a three-hour drive of Seattle. “It takes a littleplanning,” Mr. Quiller said. “I just haven’t gotten around to it.”
I hope the National Park Service and its partners are listening.
The founder of The Trail Posse, a website that encourages diversity in the outdoors.
Follow The New York Times Opinion section on Facebook and Twitter, and sign up for
the Opinion Today newsletter.
A version of this op-ed appears in print on July 12, 2015, on page SR4 of the New York edition with theheadline: Why Are Our Parks So White?.
© 2016 The New York Times Company
“Doing” Science Versus “Being”a Scientist: Examining10/11-Year-Old Schoolchildren’sConstructions of Science Throughthe Lens of Identity
LOUISE ARCHER, JENNIFER DEWITTDepartment of Education and Professional Studies, King’s College London,London SE1 9NH, United Kingdom
JONATHAN OSBORNEStanford University School of Education, Stanford, CA 94305, USA
JUSTIN DILLON, BEATRICE WILLIS, BILLY WONGDepartment of Education and Professional Studies, King’s College London,London SE1 9NH, United Kingdom
Received 16 October 2009; revised 16 February 2010; accepted 7 March 2010
DOI 10.1002/sce.20399Published online in Wiley InterScience (www.interscience.wiley.com).
ABSTRACT: The concern about students’ engagement with school science and the num-bers pursuing the further study of science is an international phenomenon and a matterof considerable concern among policy makers. Research has demonstrated that the ma-jority of young children have positive attitudes to science at age 10 but that this interestthen declines sharply and by age 14, their attitude and interest in the study of sciencehas been largely formed. This paper reports on data collected as part of a funded 5-yearlongitudinal study that seeks to determine how students’ interest in science and scientificcareers evolves. As an initial part of the study, six focus group discussions were undertakenwith schoolchildren, age 10–11, to explore their attitudes toward science and interest inscience, the findings of which are presented here. The children’s responses are analyzedthrough the lens of identity, drawing on a theoretical framework that views identity as anembodied and a performed construction that is both produced by individuals and shaped bytheir specific structural locations. This work offers new insights into the manner in whichstudents construct representations of science and scientists. C⃝ 2010 Wiley Periodicals, Inc.Sci Ed 1 – 23, 2010
Correspondence to: Louise Archer; e-mail: [email protected]
C⃝ 2010 Wiley Periodicals, Inc.
2 ARCHER ET AL.
INTRODUCTION
The issue of students’ engagement with science has been a topic of enduring interestin the science education community for the past three decades. Major reviews have beenconducted by Ormerod and Duckworth (1975), Gardner (1975), Schibeci (1984), andOsborne, Simon, and Collins (2003). Yet very little work has been conducted on whatviews young students hold about science—particularly not from a qualitative perspectivethat understands learning as tied to processes of identity construction (Holmes, 2000). Thiswork offers, therefore, new perspectives on an enduring issue for the field.
A considerable body of evidence now exists that, compared to other school subjects,science is failing to engage young people (Jenkins & Nelson, 2005; Lyons, 2006; Osborne& Collins, 2001; Sjøbeg & Schreiner, 2005). Yet, student interest in science at age 10 hasbeen shown to be high and with little gender difference (Murphy & Beggs, 2005)—althoughstark gender differences emerge as children get older. In the United Kingdom, research hasshown that the point of decline begins in the final year of elementary school (Murphy& Beggs, 2005). Indeed, Ormerod and Duckworth (1975) devote a whole chapter of theirreview on attitudes to science to the considerable body of work, which shows that interest inscience is a product of student experiences by age 11, drawing on work conducted as earlyas 1874. This has been confirmed more recently by the longitudinal analysis of NationalAssessment of Educational Progress (NAEP) data between 1988 and 2000 conducted byTai, Qi Liu, Maltese, and Fan (2006). Further recent evidence that children’s life-worldexperiences prior to 14 are the major determinant of any decision to pursue the study ofscience comes from a survey by the Office for Public Management (OPM) for the RoyalSociety (2006) of 1,141 science, engineering, and technology (SET) practitioners’ reasonsfor pursuing scientific careers. It found that just over a quarter of respondents (28%)first started thinking about a career in science, technology, engineering, and mathematics(STEM) before the age of 11 and a further third (35%) between the ages of 12 and 14.Likewise, a small-scale longitudinal study that followed 70 Swedish students from grade 7(age 12) to grade 11 (age 16) (Lindahl, 2007) found that their career aspirations and interestin science were largely formed by age 13. Lindahl concluded that engaging older childrenin science would become progressively harder.
Such data demonstrate the importance of the formation of career aspirations of youngpeople long before the point at which many make the choice about which subject topursue at high school and then college. Thus, we would contend that effort could beproductively expended by (a) understanding what are the formative influences on studentcareer aspirations between the ages of 10 and 14 and (b) attempting to foster and maximizethe interest of this cohort of young people, particularly girls, in STEM-related careers.
Our approach to exploring students’ engagement with science is grounded in notionsof identity—an understanding that sees the lack of interest in school science as a productof the mismatch between popular representations of science, the manner in which it istaught, and the aspirations, ideals, and developing identities of young adolescents. Indeedthere is a large body of work that would indicate that students’ sense of self-identity is amajor factor in how they respond to school subjects (Head, 1985; Schreiner & Sjøberg,2007) and research has drawn attention to the ways in which identities (and inequalities) ofgender, social class, and ethnicity can impact on students’ engagement with science (e.g.,Brickhouse & Potter, 2001; Calabrese Barton & Brickhouse, 2006; Carlone, 2004; Carlone& Johnson, 2007; Mickelson, 1990; Springate, Atkinson, Straw, Lamont, & Grayson, 2008).Our theoretical approach draws on feminist poststructuralist (e.g., Butler, 1990; Francis,2008), critical sociological (e.g., Bourdieu, 1990) and postcolonial (e.g., Bhabha, 1990;Hall, 1992) theorizations of identities and inequalities of gender, social class, and ethnicity.
Science Education
“DOING” SCIENCE VERSUS “BEING” A SCIENTIST 3
Drawing across these bodies of work, we understand identity (and hence, gendered, classed,and racialized identities) as both embodied and performed constructions that are bothproduced agentically by individuals and shaped by their specific structural locations (e.g.,Archer, 2003; Archer & Francis, 2007). Identities are understood, therefore, as discursivelyand contextually produced (i.e., produced through practices, relationships and interactionswithin specific sites and spaces)—and as profoundly relational. For instance, “masculinity”is necessarily produced in relation to “femininity” (and vice versa). That is, a sense of self isconstructed as much through a sense of what/who one is not, as much as through the sense ofwho/what one is (Said, 1978). Importantly, notions of identity are multifaceted and complex,being shaped in relation to intersecting axes such as gender, ethnicity, and social class,which can generate powerful notions of what is/not appropriate or normal for “people likeme”—which in turn can profoundly shape individuals’ educational choices and trajectories(Bourdieu & Passeron, 1977). Hence we suggest that children’s interest and engagementwith science will be shaped by their social structural locations and the specifically classedand racialized masculine/feminine identities that (are produced within such locations andthat) they see as desirable and constitutive of the self (for instance, the notion of “laddish”masculinity among working-class boys is employed later in the analyses).
This paper seeks to explore then how such research-informed approaches can helpto understand and address key challenges in enhancing participation, engagement, andachievement in science and mathematics, in particular to address differences linked tosocioeconomic status, gender, and ethnicity. In particular, the paper represents an attempt,at the start of our project, to set out potentially useful concepts to work with, and to mapkey avenues for exploration over the next 5 years.
Study Design and Sample
The data for this paper come from an ongoing 5-year longitudinal study (funded by theU.K. ESRC Special Initiative on Science and Mathematics Education) that aims to developan understanding of the processes underlying the formation of young people’s aspirationsand their engagement with science. Data for the larger project will consist of a quantitativesurvey (to be administered to approximately 9,000 students at age 10 and subsequently atages 12 and 14) and qualitative, longitudinal tracking of 60 pupils and their parents over4 years. To inform the design of the quantitative survey, six focus group discussions wereconducted with 42 students drawn from four schools in the London area. These schools(detailed further below) were purposively selected to provide a sample of boys and girlsfrom a range of backgrounds, representing a spread of socioeconomic status and ethnicdiversity. The fundamental aim of these group discussions was to gather data on the topicand participants’ perceptions and understandings. Thus, in selecting our sample, we soughtto recruit a selection of students from a range of backgrounds and types of school. Suchresearch seeks to develop a deeper understanding of its central focus exploring not only whatparticipants think but why they think it (Kitzinger, 1994). As such, the goal is not necessarilyto produce data that can be generalized to larger populations, but rather to explore the rangeof attitudes, values, and beliefs that are held, and the strength of feeling and reasonsunderpinning these views and beliefs. While previous research suggests that data saturationis achieved after three to four discussion groups, generalizing to a wider population mustalways be undertaken with caution (Vaughan, Schumm, & Sinagub, 1996) particularly aswe make no claim about the representative nature of our sample. Essentially, discussiongroups seek to expose what Schutz and Luckman (1973) have termed “intersubjectivity”—the collective description of everyday reality and its variation. The data emerging from such
Science Education
4 ARCHER ET AL.
work provide a valuable tool for representing the world as it is perceived by the group andtheir interpretation of experience.
Students were sampled from four schools. Potential participating schools were ap-proached from an existing list of school contacts held by the research team in relationto the criteria of attaining at least one affluent, independent school, at least one urbanmultiethnic school, and at least one small and one large state primary in the London area.The resultant participating schools were the four who agreed to our invitation. Consentforms were issued to parents’ of children in Year 6 at each school, and discussion groupswere conducted with the 42 students who returned consent forms. As detailed below, thesediscussions were conducted with single-sex groups in two schools, where numbers allowed,and as mixed-sex groups in the other two schools.
Pseudonyms have been assigned to the participating schools. “Inner City Elementary”(1 × girls group with two White Irish and four Bangladeshi girls, 1 × boys group, oneBlack African and five Bangladeshi boys) is a small urban elementary school situated inan area of high social deprivation with a large immigrant population (particularly fromBangladesh, Pakistan, and Africa). Most of the students attending the school are eligiblefor free school meals, and many do not speak English as their first language. “PrivateElementary” (1 × group seven boys, 1 × group seven girls; pupils all White apart fromone Asian boy) is a large selective, fee-paying school (admitting children from age 3–16).It is located in an affluent area of the city, and the majority of the children attending theschool are from White British backgrounds. “Roman Catholic Elementary” (1 × mixed-sex group, seven students from one White, one Arabic, one mixed-heritage, and four BlackAfrican backgrounds) is a large, popular (oversubscribed) school located in an inner cityarea of considerable deprivation. The main pupil groups are those from White British andBlack African backgrounds, and the majority of those attending are baptized Catholics. Itis a publicly funded faith school (receiving additional support from the Catholic Church).“Urban Elementary” (1 × mixed-sex group, all nine students in the group were members ofthe lunchtime science club, all from South Asian—specifically Bangladeshi and Pakistanibackgrounds) is a large innercity school in which almost all students come from minorityethnic backgrounds (the largest group being those of South Asian descent), and a veryhigh proportion speak English as an additional language. An above average proportion ofstudents are eligible for free school meals. All the pupils in the discussion groups werelargely representative of the ethnic and socioeconomic profile of their respective schoolpopulations.
For the purpose of the discussion groups, a set of questions was developed that formeda loose structure for exploring these young students’ views (discussion areas included: stu-dents’ views on science, scientists, and their school science classes; out-of-school interestsand leisure pursuits; aspirations for the future (and influences on aspirations). Studentswere assured of the confidentiality of the data, and each group lasted for approximately1 hour. The discussion groups were conducted by the second author (a White Americanwoman, denoted as “Int”/Interviewer in data extracts) and were digitally audio-recordedand transcribed. In line with the study’s conceptual approach outlined earlier (in whichidentities and the social world are understood as discursively constructed), data were ana-lyzed discursively using a Foucauldian analysis of discourse approach (Burman & Parker,1993). This approach involves looking for the resources and repertoires that are employedwithin participants’ talk and which are drawn on in (and are constitutive of) their iden-tity constructions. These are then analyzed as practices of power (and are interrogated tothe extent that they are both constitutive of and constituted by/within particular regimesof power). In this paper, this analytic process was undertaken by the lead author, whosearched the data iteratively to identify key themes and identity practices and performances
Science Education
“DOING” SCIENCE VERSUS “BEING” A SCIENTIST 5
by the young students. Transcripts were initially broadly coded according to each of themain discussion topic areas (e.g., “reasons students enjoy science at school,” “out of schoolinterests,” “views of scientists”) and the content of these was then subcoded thematically(iteratively testing out emergent themes across the data set to establish “strength” and preva-lence). These coded themes were then subjected to a more theoretically informed analysis(to identify practices of power and gendered, classed, and racialized discourses and identitypractices/resources) to unpick the constructive elements (and the wider discourses that areevoked) within respondents’ talk.
“DOING” VERSUS “BEING”
Our analysis of the role of identity within children’s constructions of science is brokendown into two major themes, namely “doing science” and “being a scientist.” These werenot specific questions within the interview protocol but were identified within the analysisof the data as two broad, common structuring discursive distinctions within the children’stalk. As will be argued later, the importance of this conceptual distinction is that it explainsthese young students’ ability to both reportedly enjoy science (most did) and to yet not wantto continue with science in their future careers—to “become” a scientist (most did not). Ouranalyses thus highlight a key dilemma, namely that children can report enjoying science(e.g., they may find it fun, exciting, important, and interesting), but they may still choose notto study it at higher level. As we shall argue, these two areas were comprehensively infusedwith issues of identity and were circumscribed by social class, ethnicity, and gender, suchthat some options, even at this age, are beginning to be ruled out as not only undesirablebut even “unthinkable,” whereas other possibilities are understood as desirable only undercertain conditions.
“DOING SCIENCE”: SAFETY VERSUS DANGER
Under our major theme of “Doing Science,” our data largely echoed what is known fromthe existing literature, namely that student interest in science at age 10 tends to be relativelyhigh with little gender difference (Murphy & Beggs, 2005; Pell & Jarvis, 2001). Most of thechildren who took part in the discussion groups reported enjoying science at school. Thisenjoyment was predominantly framed in terms of the practical mastery of “doing” science,namely the “hands-on” elements of practicals and experiments, a preference that has alsobeen noted in other work (e.g., Solomon, 1980; Osborne & Collins, 2001). We found acrossthe discussion groups that the children’s attachment to this form of “doing” science wasframed within a discourse that we have termed “danger vs. safety,” in which “real” scienceis constructed as “dangerous” (and exciting) and is placed in tension with school science(particularly elementary school science) due to the latter’s concern with “safety.”
Boys and girls both associated science with explosions and bangs, as one girl put it,“pouring liquids to make, like, an explosion.”
Int: . . . So if you had to explain what science is to somebody who’d never heard of ithow would you explain it?
Boy: Bangs.Int: Bangs?Boy: Just to say it could hurt your ears.Boy: It’s interesting and you won’t know what’s going to happen next.
(Inner City Elementary, boys)
Science Education
6 ARCHER ET AL.
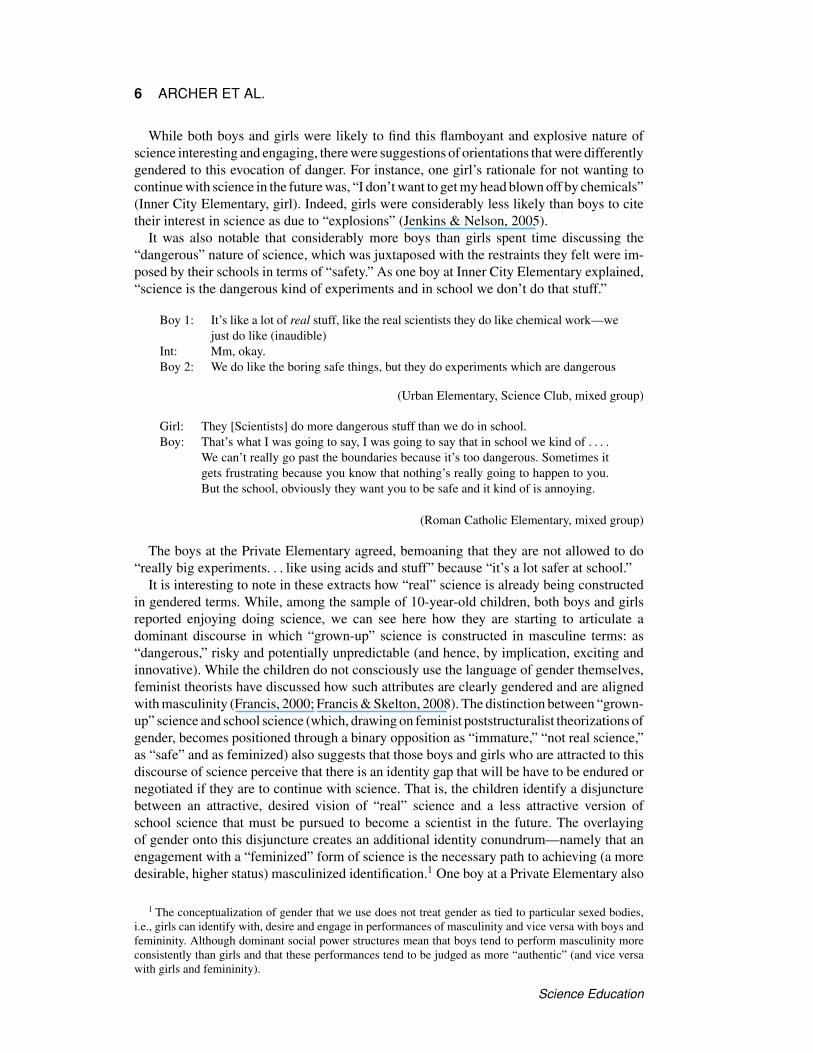
While both boys and girls were likely to find this flamboyant and explosive nature ofscience interesting and engaging, there were suggestions of orientations that were differentlygendered to this evocation of danger. For instance, one girl’s rationale for not wanting tocontinue with science in the future was, “I don’t want to get my head blown off by chemicals”(Inner City Elementary, girl). Indeed, girls were considerably less likely than boys to citetheir interest in science as due to “explosions” (Jenkins & Nelson, 2005).
It was also notable that considerably more boys than girls spent time discussing the“dangerous” nature of science, which was juxtaposed with the restraints they felt were im-posed by their schools in terms of “safety.” As one boy at Inner City Elementary explained,“science is the dangerous kind of experiments and in school we don’t do that stuff.”
Boy 1: It’s like a lot of real stuff, like the real scientists they do like chemical work—wejust do like (inaudible)
Int: Mm, okay.Boy 2: We do like the boring safe things, but they do experiments which are dangerous
(Urban Elementary, Science Club, mixed group)
Girl: They [Scientists] do more dangerous stuff than we do in school.Boy: That’s what I was going to say, I was going to say that in school we kind of . . . .
We can’t really go past the boundaries because it’s too dangerous. Sometimes itgets frustrating because you know that nothing’s really going to happen to you.But the school, obviously they want you to be safe and it kind of is annoying.
(Roman Catholic Elementary, mixed group)
The boys at the Private Elementary agreed, bemoaning that they are not allowed to do“really big experiments. . . like using acids and stuff” because “it’s a lot safer at school.”
It is interesting to note in these extracts how “real” science is already being constructedin gendered terms. While, among the sample of 10-year-old children, both boys and girlsreported enjoying doing science, we can see here how they are starting to articulate adominant discourse in which “grown-up” science is constructed in masculine terms: as“dangerous,” risky and potentially unpredictable (and hence, by implication, exciting andinnovative). While the children do not consciously use the language of gender themselves,feminist theorists have discussed how such attributes are clearly gendered and are alignedwith masculinity (Francis, 2000; Francis & Skelton, 2008). The distinction between “grown-up” science and school science (which, drawing on feminist poststructuralist theorizations ofgender, becomes positioned through a binary opposition as “immature,” “not real science,”as “safe” and as feminized) also suggests that those boys and girls who are attracted to thisdiscourse of science perceive that there is an identity gap that will be have to be endured ornegotiated if they are to continue with science. That is, the children identify a disjuncturebetween an attractive, desired vision of “real” science and a less attractive version ofschool science that must be pursued to become a scientist in the future. The overlayingof gender onto this disjuncture creates an additional identity conundrum—namely that anengagement with a “feminized” form of science is the necessary path to achieving (a moredesirable, higher status) masculinized identification.1 One boy at a Private Elementary also
1 The conceptualization of gender that we use does not treat gender as tied to particular sexed bodies,i.e., girls can identify with, desire and engage in performances of masculinity and vice versa with boys andfemininity. Although dominant social power structures mean that boys tend to perform masculinity moreconsistently than girls and that these performances tend to be judged as more “authentic” (and vice versawith girls and femininity).
Science Education
“DOING” SCIENCE VERSUS “BEING” A SCIENTIST 7
provided some indication of the identity work that he undertook to try to navigate thisdisjuncture, adding the justification that “well, if you think about it all good scientists haveto start off at this stage.” It seems, therefore, that while these young children may not havecomprehensive or detailed knowledge of what a future career in science might entail, theyare tacitly learning from an early age that it is associated with masculinity.
As illustrated above, many boys positioned their elementary schools as spaces in whichscience is infantilized and “made safe” (see Skelton, 2001, on the dominant feminization ofelementary schools). The “safe” elementary school was juxtaposed against the fantasy ofsecondary2 schools as placed where more desirable and “real” (“dangerous”) science mighttake place. A number of children, especially boys, talked about their keen anticipationof secondary school as allowing them to (literally) “play with fire, like Bunsen burners”(Inner City Elementary, boys), “when we get to secondary school we might be able touse fire” (Roman Catholic Elementary, mixed group; see also Urban Elementary, ScienceClub, mixed)—an expectation often fulfilled and well captured by the eponymous article ofDelamont, Beynon, and Atkinson (1988): “In the beginning was the Bunsen Burner.” Thefrisson of danger associated with secondary school science generated a sense of excitementand anticipation (“in secondary school it’s more dangerous,” “it’s better because they trustyou with more dangerous chemicals, stuff like that”; “dangerous stuff like explosions,mixing acids together, seeing what different chemicals do to each other”).
It appears from these initial data that the boys have constructed a close (anticipated)alignment between popular masculine identities and secondary school science. While insome ways this is encouraging (because these students are imagining that they will becomeyet further engaged with science at secondary school), it also introduces the risk that theywill be disappointed if the science they are presented with at secondary school fails tolive up to their fantasy of danger. Indeed, evidence suggests that while secondary schoolscience may initially contain some of these exciting elements, it quickly becomes moretheoretical, demanding more writing than practical work (Osborne & Collins, 2001). Giventhe dominant popular equation of writing with “feminized” forms of learning (Skelton &Francis, 2008), it might be reasonable to assume that these boys’ disillusionment with thedemise of the practical/spectacular nature of science will be even more pronounced.
One possible policy response might be to suggest that secondary school science bereformed in ways that would emphasize and play up its “dangerous” potential. This echoeswider educational policy initiatives in the United Kingdom, United States, and Australiathat have arisen from the debate about boys’ underachievement, in which attempts havebeen made to increase boys’ engagement and attainment in particular areas (especiallythose that are “feminized,” such as English/literacy) by making them more “masculine,”and hence attractive to boys (e.g., schemes that use football to increase the appeal ofliteracy). Such approaches have attracted considerable feminist critique for playing intogender binaries, for reinforcing dominant (hegemonic) forms of masculinity and for havingnegative implications for not only girls but also “other” boys (not all boys identify withdominant forms of masculinity). Moreover, as we discuss further later, the conceptual binarythat we have identified within the children’s talk between “doing science” and “being ascientist” would suggest that enjoyment of (and indeed, competency in) school science doesnot straightforwardly translate into the sense that one wants to (or could) “be” a scientist.In other words, increasing a pupil’s enjoyment of “doing” science will not necessarilytranslate into their uptake of a science identity.
2 Secondary schools in the United Kingdom take children from ages 11–16 or 11–18. There arecomparatively fewer middle schools.
Science Education
8 ARCHER ET AL.
Doing Science Outside School: “Being Naughty” or “Being Good”?
As we have so far discussed, most of the schoolchildren we interviewed felt that thescience they practiced in school bore little or no relation to the science practiced in the“real” (grown-up) world. Indeed, criticisms of the gap between school science and “real”science are not new—and calls continue to be made to increase the “real-world” relevance ofscience to better engage young people (e.g., Calabrese Barton, Ermer, Burkett, & Osborne,2003).
In the discussion groups, we asked the children whether they ever practiced scienceoutside of school and found that many talked about performing their own “experiments”at home. This might be seen as a heartening endorsement that not only are these childreninterested in science in school but they are incorporating this interest into their leisuretime. However, we also identified some distinctly classed and gendered patterns withinthese accounts of “doing science at home,” which might help explain some of the different,distinctive patterns of engagement with science that emerge in older samples of students.That is, the different ways in which these 10-year-old children engage with science in theirleisure time may be indicative of some of the processes that feed into their differentiallikelihood to attain well and continue with science in the future. We have identified adistinction between those students who described their out-of-school science activities asinformal and as part of having fun and being mischievous (being “naughty”) and thosestudents who practiced science in a more formalized way, relating to recognized schoolscience curricula, and whose activities we would interpret as feeding into the larger projectof working on developing/enhancing their “good pupil” identities (being “good”). Thefollowing extracts exemplify the responses of those who talked about doing science out ofschool as something fun and “naughty”—the children are talking about what they like todo in their leisure time and if they ever do any science at home:
Boy: like at home going out and getting Coke, and then getting salt, going to my enemy’shouse, and then I put salt in the bottle, then like shake it up and it will fizz up, andthen I will knock on the door, they’ll open it, I open it—and that’s it!
(Inner City Elementary, boys)
Boy 1: I fill up a balloon and like blow it up on people.Int: How is that science?Boy 2: Because we can see how the H2O blows up and . . .Int: Oh so it’s a water balloon?Boy 1: . . . and causes an explosion and all that.Boy 3: H2O is water.Girl 1: I’ve got this set and it’s called (inaudible) and you do experiments with it.Int: Okay, uhuh.Girl 1: And like you like stick all the different (inaudible) the little powder bits in like a
balloon and then it all blows out (inaudible)Int: Oh cool yeah.Girl 2: I use my “Grow my own Crystals” kit.Int: You use your what?Girl 2: Grow your own crystals.Int: Oh yeah, yeah. What about you?Boy 4: Um, sometimes I get some balloons when I’m bored, and like rub it on my jumper
or rub it somewhere, and stick it on my head.
(Roman Catholic Elementary, mixed group)
Science Education
“DOING” SCIENCE VERSUS “BEING” A SCIENTIST 9
There were numerous accounts across the groups (mostly, though not exclusively, voicedby boys) where students talked excitedly about practicing science in terms of creating“explosions.” As one boy from Inner City Elementary put it, “Science can be really fun, ifyou’re being naughty.” Indeed, putting Mentos (chewable mint sweets) into Coca Cola tomake it fizz and explode was mentioned as a popular pastime among many of the boys wetalked to (and indeed one of the girls at Roman Catholic Elementary). These activities clearlyengaged the children and form part of the spectacular and “risky” vision of science thatthey were attracted to, as discussed earlier. As also illustrated in the above extract, the twogirls mentioned more formalized engagements (e.g., the crystal growing set) than boys. Thegendered aspect of this “naughty” engagement with science can be read as part of the youngboys’ performances of “laddish” masculinity, a contemporary form of popular masculinity.“Laddish” masculinities are the subject of considerable interest and interrogation within thegender and education literature and have been identified as an international phenomenon(Francis, 1999; Jackson, 2002). While laddishness is usually discussed with reference toolder samples of boys and young men, it has also been noted as an important identitypractice/discourse within elementary pupils (Renold, 2005; Skelton, 2001)—albeit in amore immature form than its adult manifestation. “Laddishness” derives from the notionof the “lad”—a young man who performs a gender-traditional (or monoglossic, Francis,2000) masculinity, who engages in hedonistic practices (such as drinking, womanizing),is confident, “cheeky,” “cocky,” mischievous and entertaining (enjoys “having a laugh,”“back chatting” teachers). The identity of the lad is oppositional to that of the studious“geek” or “nerd”—the lad is not studious or conscientious, he engages in public displays of“not working” and keeps any effort or school work strictly “under cover” (Frosh, Phoenix,& Pattman, 2001). As the literature suggests, laddish identities are not homogeneous(boys may perform some aspects but not others; laddish identities are not constant orconsistent) nor are they solely restricted to boys (see Jackson & Tinkler, 2007, on therise of the “ladette”). However, in the United Kingdom they do constitute a popular andpervasive discursive reference point and resource within many boys’ (and girls’) identityconstructions.
While the children cited above do not embody the excesses of laddish identity, theiryouthful exuberance for the “naughty” and fun side of their informal engagement withscience does point to the allure of such identities. Their talk suggests again (as in thepreceding section), that for some boys, the most popular, fun, and accessible aspects ofscience are those aligned with hegemonic masculinity. Moreover, the nascent laddishnesshinted at within the children’s accounts (albeit framed here as being mischievous) wouldsuggest that this popular engagement with science through hegemonic masculinity will notnecessarily translate into later formal academic engagement with science. This is becauseladdish performances of masculinity tend to be predicated on a distaste for schoolwork,which becomes more trenchant with age. Thus, our point is that, while these children’saccounts of a joyful engagement in out-of-school science can indeed be valued in their ownright, this form of engagement may not necessarily extend to a continued formal educationalengagement with science.
In contrast, some children (but particularly—though not exclusively—those from more“middle-class” backgrounds) talked about more formalized engagements with science out-side of school—a discourse that we have characterized as “being good.” These childrendescribed reading reference books, owning microscopes, and playing with science sets(such as the experiment set and the “grow your own crystals” set mentioned by the girls inthe preceding discussion extract and the magnet set commented on later). One boy (at InnerCity Elementary) described helping his uncle who worked in a laboratory. These children
Science Education
10 ARCHER ET AL.
also talked about trying to replicate experiments conducted at school when at home. Forinstance, a boy at Inner City Elementary talked about how he had dissected a flower at homeand a boy at Roman Catholic Elementary explained “when we were in Year 5 someonementioned salt water and see how long it would dissolve or something, so I went home andtried it.” The joy of learning about and practicing science was clearly something they tookpleasure doing in their time at home:
Boy: Well I look up books for experiments and sometimes look stuff up about theozone layer etc. So it’s much more different from school than I learn at home.But it’s also quite fun.
(Private Elementary, boys)
Boy 1: I’ve got a magnet set at home.Int: Mm, okay yeah?Boy 2: I’ve got a magnifying tele- . . . it’s a microscope that you connect to the computer,
and you can see everything like snowdrops.
(Urban Elementary, Science club, mixed group)
While these children also describe their out-of-school science activities as fun, there isa discernibly different feel to the form of their engagement, as compared to the “naughty”explosions outlined earlier. These children’s engagement with science at home reflects agreater use of “cold” (formal, official) knowledge (Ball & Vincent, 1998), such as referencebooks and educational sets. This access to and comfort with cold knowledge has been foundto be more common among the middle classes (Ball & Vincent, 1998). These activities,such as consulting reference books, replicating experiments taught at school, workingwith adults, using microscopes and educational sets, and so on, are more structured andcloser in content and form to the formal learning that takes place within schools. As such,we would hypothesize that such practices are more likely to translate into cultural andeducational capital (Bourdieu, 1986, 1990). That is, they contain a clearer potential tofacilitate the children’s attainment and progress in school science and to nurture and feedinto the children’s self-identifications (and indeed their teachers’ assessments of them)as “good students.” Indeed, we might even read these instinctive engagements with out-of-school science in light of sociological theorizations of classed parenting and childcarepractices, which have been linked to the production of classed patterns of educationaladvantage and disadvantage. Working-class family practices tend to be associated withthe “accomplishment of natural growth” (Lareau, 2007), in which children’s developmentis not the subject of excessive intervention (to which we might map on those children’sinstinctive and unstructured engagements, epitomized by the “Mentos in Coke” explosions,which tended to be conducted by children playing among themselves, rather than underadult supervision or tutelage). In contrast, middle-class families have been associated withmore interventionist and structured approaches, a “concerted cultivation” (Lareau, 2007) oftheir children, often through an orchestrated program of educational “enrichment” activities(Vincent & Ball, 2007) that aim to develop a range of skills, interests, and capabilities withinthe child—which in turn help foster “success.” In this respect, we might read the “beingnaughty”/“being good” distinction in informal science practices as another field in whichdistinctions are germinating with regard to later patterns of achievement and engagementwith science (see also Gladwell, 2008, regarding the significant advancements noted after
Science Education
“DOING” SCIENCE VERSUS “BEING” A SCIENTIST 11
the summer vacation period for middle-class U.S. students compared to their working-classpeers).3
As the following extract from the girls at Private Elementary illustrates, middle-classparents are more likely to utilize their cultural capital to generate opportunities for struc-tured learning at home, such as buying books, science sets, and resources and seekingadditional information from schools to enable them to support their children to do “proper”experiments at home.
Girl 1: And when my parents went to parents evening they managed to get a web sitewhere you can like make sherbet and make (inaudible) and dissolve things, andit’s really interesting doing that.
Girl 2: Well I think it’s good cos we can, because we like made lava lamps . . . well onesthat only work once. It was really funny cos they’re quite easy to make. But shejust showed us how to make it and how it worked with olive oil and stuff.
Int: Oh wow.Girl 2: And then it’s really easy to make at home.
(Private Elementary, girls)
One of the girls also talked about how “I experiment with lots of little things at home.”She described a science book she owned that she was working through at home (because“I can do science but I can’t do it perfectly”), which enabled her to “make experiments athome, like how to make putty.”
It was notable that it was only in the private (fee-paying) school that pupils mentionedexplicit parental involvement in this way. This may indicate one of the many potential“small acts” and everyday practices that, over time and in sum, can help to foster higherlevels of achievement and engagement with science among particular social groups.
Indeed, the potential importance of out-of-school interests and activities has been flaggedelsewhere (Kelly, 1981; Ormerod & Duckworth, 1975; Woolnough, 1994). Mendick,Moreau, and Epstein (2009) conducted a survey with 560 Year 10 pupils from threecomprehensives and 100 second year mathematics undergraduates in two universities andfound that 40 Year 10 students rating themselves as “very good” at mathematics displayeda different and distinctive relationship to mathematics within popular culture. That is, theywere “much more likely to play tetris and chess and to do sudokus and cryptic crosswordsthan other students” and were “most likely to carry on with maths” when it became optionalat age 16. Indeed, it was notable that among our sample that the few children who embraceda potential future identity as a scientist linked this identity to their interests and activitiesat home (as opposed, for instance, to their interests or achievement at school):
Boy 1: I want to be um an inventor or . . .Boy 2: Scientist.Boy 1: . . . yeah scientist . . . or possibly an archaeologist.Int: Ah, and why do you think you might want to be those things?Boy 1: Because mostly at home I make inventions and stuff.
(Private Elementary, boys)
3 The other distinctions at work within the students’ constructions of their out-of-school science activitiesis the focus of forthcoming work, in which we explore the higher propensity for South Asian students inour questionnaire sample to undertake science activities at home.
Science Education
12 ARCHER ET AL.
“BEING A SCIENTIST”: THE SCIENTIST AS OTHER
We have so far explained that while the majority of 10-year-olds we talked with enjoyed“doing” science, the seeds of later distinctions and patterns of attainment and uptake ofscience are already becoming evident. In this section, we explore the limits of this boundaryof “doing science” and the problematics of its translation into “being a scientist” (i.e., thetaking up of a science identity). We will suggest that the main issue at stake here is thepotential to construct and inhabit an intelligible science identity—one that is valued in andfor itself, that is congruent with other aspects of a person’s identity, and that is also (seento be) judged by others as being of worth.
Underlying our understanding of the reasons why an enjoyment of “doing” sciencemay not translate into wanting to “be” a scientist is the argument that this disjunctureis particularly likely to occur where science, as an identity discourse, is experienced asclashing with popular hegemonic forms of masculinity and femininity. Given that the latterare often intensely held identities, evoking strong emotional attachments, and experienced asprofoundly personal identity constructions, it is unsurprising that they effectively “trump”the viability of a science identity. For instance, a boy in Roman Catholic Elementaryschool agreed that he found science “fun” but could not countenance becoming a scientistbecause, for him, it is “football and wrestling always”—an expression of the evident allureof hegemonic masculinity. Indeed, football and wrestling do not even have to achieve thestatus of being distinctive career goals—their mere possibility is sufficient: “I don’t want tobe a wrestler—its just something that I like, that I might want to be a wrestler. I might not.”Girls also voiced highly gendered discourses in which they resisted the idea of becominga scientist because “I don’t want to touch too many dead things” and “I wouldn’t like tosee people like, their things and everything.. yeah and I’m not really into these sciencelike skulls and ears and stuff” (Inner City Elementary girls). While a substantive literaturealready exists pertaining to the gendered construction of children’s aspirations and subjectchoices (Francis, 2000; Kelly, 1981; Lightbody & Durndell, 1996; Whitehead, 1996), wesuggest that to understand the doing/being disjuncture further it is useful to look in moredepth at the content of the children’s constructions of scientific identities and the waysin which these are not only gendered but are also inflected by social class and “race”/ethnicity.
Science as “Hard”//“Brainy”
Science was overwhelmingly constructed as a “hard” (difficult) subject that required anddemands application. However, the hard or difficult nature of science was something thatmany of the students reported as attractive. For instance, the boys at Inner City Elementarycomplained of their frustration with a teacher’s attempt to make science “simple,” arguingthat this rendered science less interesting.
Boy 1: She [teacher] knows a lot but it’s boring.Int: Ah, the way she’s teaching it?Boy 2: She doesn’t put emotions in it.Boy 3: She tries to make it simple but she makes it so simple that she tells us all the stuff
you already know.Boy 2: Exactly.Boy 1: It’s not interesting.Boy 3: We like it when it’s so complicated we try to think it out with our brains, but she’s
always like “I’m making it simple. If I do any simpler it would be cheating” andI’m like “We don’t want to cheat, so make it harder.” We want to test our brains.
Science Education
“DOING” SCIENCE VERSUS “BEING” A SCIENTIST 13
As the last comment above illustrates, these boys enjoyed the challenge of science asa “complicated” subject that requires students to use their “brains.” Indeed, the terms“brain” and “brainy” were highly prevalent across all the children’s transcripts (e.g., “itgets your brain going,” Inner City Elementary boy), which we would interpret as reflectingthe status associated with subjects such as science, that are closely aligned with notions ofintellectual rigor. This link (between the “braininess” of a subject and its social status) wasmade explicitly by the girls in the Private Elementary, who answered the question of whatmakes science fun saying “when we learn like the really brainy things, like the things youdon’t learn if you’re in a state school.” These constructions are gendered and classed (beingread as middle class and as masculine; see Harding, 1986) and hence are more likely to“fit” with middle-class students’ everyday notions of desirable masculinity and femininity,being especially appealing for middle-class boys. As one boy at the independent elementaryschool explained, what he liked about science was “when you learn stuff that you can likesound cool with.”
Children imagined that the science they would encounter in secondary school would beeven harder and that this would be “a good thing” because it would require them to “useour brains more.”
Boy 1: But we’ve got to use our brains more. There are going to be a lot more harderquestions and harder experiments to do
Int: Uh huh. Do you think that’s a good thing? A bad thing? Neither one?Boy 1: I think it’s a good thing
(Roman Catholic Elementary, mixed group)
Although the notion of science as “testing your brain” was seen as attractive, one boysuggested that it can make your brain “kind of tired” with the risk that “you just getconfused.”
The discourse of “science as hard” has been noted within other studies as a prevalentpopular discourse, reproduced by students and teachers alike (see Carlone, 2004). However,while studies, such as Carlone’s, with older students have drawn out how this discourseof “science as hard” collapses into a discourse of “scientist as naturally clever/intelligent,”this link was not immediately evident within these children’s accounts. While “being ascientist” was in some instances linked with being intelligent (“I think their [scientists”]intelligence makes them good at their job”), the “brainy-ness” of science was configured ina complex relationship with effort and ability. These younger students argued that one neednot be naturally “clever” to be good at science, even though it is a “brainy” subject. Rather,they felt that interest, application, effort, and “concentration” were more important (forinstance, the Science Club children suggested ways of improving in science: “Just dependsif you like it or not and whether you concentrate,” “Try and keep an open mind,” and “Don’tlearn about just like certain subjects and topics, learn about all different topics”).
This sentiment (that one does not have to be “clever” to be good at science) wasechoed across the discussion groups. While it is encouraging that these 10-year-oldshad not reached the point of closing off science as the preserve of the “clever,” theirdiscourse also contained contradictory elements, which point to how the dominant adultdiscourse (of science as for the “clever,” that has been found by numerous other studies)might come to be solidified among older students and adults. We suggest that this is en-capsulated in their parallel discourse of science as “natural interest,” to which we nowturn.
Science Education
14 ARCHER ET AL.
Science as “Natural Interest”//Natural Ability
When asked what makes someone good at science, students across the groups over-whelmingly drew on a discourse of “natural interest” (“you have to be interested in alltypes of science”), arguing that the possession of this “natural interest” (liking and enjoy-ing science) provides the motivation to pay attention, remember facts, and to do well inscience classes. It also provides the impetus to engage in more, additional, learning aboutscience.
Int: Do you have to be really clever to be good at science?Boy: Sometimes when you’re like doing something, you can hear like interesting facts,
or like really good stuff about science . . . you can remember it and then, cos youheard that, you could get interested in science. And then you would study . . . youwould want to know more about science, so you look for more facts and moreother stuff about science. And then you eventually . . . you become really good atscience
(Inner City Elementary, boys)
Girl: The most important thing a science person must have is they like science—that’sthe most important thing. And if they like science, they have everything to dowith science
Int: yeah?Girl: They’ve just got to be able to enjoy themselves and not like say everything’s hard,
they’ve just got to try and enjoy it
(Inner City Elementary, girls)
This theme, of liking science and possessing a natural interest in it, at first appearsmeritocratic: as long as a student is interested and motivated, they can do well at science.However, there were also suggestions that the discourse might, over time, slip into anessentialized, embodied manifestation—that is, the notion that there is a “science person”—the individual who is naturally interested in science and who has a science “mind”.
Int: What would you tell them if they wanted to be good at science? How would theydo that?
Boy 1: They should learn. They should study on the weekends or after school. Do extralessons maybe or tell the teacher you don’t understand and they will help you.
Girl: Yeah, try experiments, do experiments that they haven’t done before.Boy 1: And share it with the class.Boy 2: I think that you shouldn’t like be that eager to learn science to be very, very good,
I think you should just do science like normally in life, and have fun with it andnaturally you will graduate in your brain, your mind will go on . . . it will increasein science.
(Roman Catholic Elementary, mixed group)
The last remark in the above extract hints at this notion: one should not be too “eager”;rather science should be undertaken “like normally. . . have fun with it” and this will“naturally” increase both competence and interest in science. The emphasis on “naturalness”contains echoes of popular discourses in which science and mathematics are associated withparticular sorts of people, the science person (Carlone, 2004) or the mathematics person
Science Education
“DOING” SCIENCE VERSUS “BEING” A SCIENTIST 15
(Mendick, 2006) who has a natural (innate?) ability and interest in science or mathematicsand thus does not find it a chore or have to try too hard to learn about science or mathematics.The notion of there being a “science person” was also reinforced by several discussiongroups’ references to other children in their schools or year groups who were known to be“good at science” or interested in science. Several groups of students mentioned in passing(there was no direct question on the topic) these other children who were known as being“science people.” For example, the children at Roman Catholic Elementary talked abouta boy in their class who was known for wanting to become a scientist (“that guy lovesscience”). The private school girls also described a known “science person”:
Int: And do you any of you all want to be scientists when you grow up?Girl 1: I think that this boy in our class named [name], I think he wants to be a scientist.Girl 2: He’s really complicated.Girl 1: Mr [name], he gave us a shortcut for this answer, and he [boy] goes for the most
complex scientific proper maths ways, and so does his brother.
This was not unique—other groups also made reference to peers who were “known” asinterested in pursing science, suggesting that science is already operating here as a markedidentity. This is irrespective of the claim that the children also made that anyone can doscience if they want. Here the “real,” authentic science identity is distinctly embodied byparticular individuals (notably “complicated” and “complex” individuals—see next sectionon “the boffin”), suggesting that while anyone can “do” science, only a few will really “be”scientists and that the identities of these children are popularly “known” from an early age.
The discourse of “natural interest” links closely with the idea of there being a “scienceperson”—someone who is naturally interested in science and who has a “science mind.”The research of Mendick et al. (2009) with children and young people highlighted popularconstructions of a “maths person” who has a “maths mind.” While at one level this construc-tion might seem innocuous, it operates as a powerful embodied discourse that constructs arigid division, akin to the distinction between “science people” and “nonscience people.”While the children in our study do not subscribe (yet?) to such distinctions, their instinctiveuse of a discourse of “natural interest” might be interpreted as signaling how their currentsimultaneous construction (of “anyone can do science if they try”) may become eclipsed inlater years by the discourses of “science as natural interest” and “the science person.”
Mendick et al. (2009) argue that the power of the construction of the “maths person” ispredicated upon its association with notions of “natural ability.” This obviously sits in anuneasy relationship with a discourse of excellence as achieved through effort, although asMendick et al. note, the two are often voiced together:
There is a complex relationship between natural ability and hard work, with most peoplesupporting both the idea that you can get better at maths through hard work and the ideathat some people are naturally more able to do maths than others.
In other words, they argue that there is a recurrent contradiction between the notions ofnatural ability and improving through effort and “a recurrent opposition between being ahard worker and being naturally able” (Mendick et al., 2009).
The discourse of “science as natural interest” also links in with dominant construc-tions of educational achievement as configured through natural ability (Walkerdine, 1988,1989, 1990; Skelton & Francis, 2008). As a wealth of research has demonstrated, withindominant educational and popular discourse the identity of the “ideal pupil” is popularlyconstructed as epitomized by “effortless brilliance” (which is configured as male), which
Science Education
16 ARCHER ET AL.
is located oppositionally to “diligent” and “plodding” achievement (which is configured asfemale); e.g., see Francis and Skelton (2005). The prevalence of this binary has been notedinternationally as characterizing many teachers’ talk. It has also been noted within scienceclassrooms: for instance, boys in the physics classroom studied by Carlone (2004) in theUnited States, and in the U.K. classrooms studied by Warrington and Younger (2000), weredescribed by their teachers as possessing a greater “natural ability” in science. In contrast,girls were constructed as diligent and hard working but lacking the flair and effortlessbrilliance of their male counterparts. The researchers noted that all these perceptions wereirrespective of actual achievement (i.e., not all “brilliant” boys were achieving highly andeven the highest achieving girls were described as owing their attainment to “hard work”).Against this powerful discursive backdrop, it is perhaps not surprising that many girls andyoung women come to see their identities as inconsistent with dominant constructions ofthe “real” or authentic scientist, whose identity is associated with “raw” (Carlone, 2004),“natural” talent, interest, and ability.
Indeed, Mendick (2006) details the considerable identity work undertaken by studentsin a Further Mathematics (an advanced-level upper mathematics) class to avoid identifyingas being “good at maths.” She found that students tended to attribute their success inmathematics to their “doing” (diligence, working hard) as opposed to being attributableto “being” good at mathematics. This was particularly the case for girls. Mendick arguesthat being “good at maths” is “a position that few men and even fewer women can occupycomfortably . . . they persist in constructing the mathematician as something you are or arenot ‘naturally’ ” (p. 216)
Scientist as Boffin
Closely related to the preceding themes of “science as hard” and “science as naturalinterest,” we identified the construction of “scientist as boffin.” “Boffin” is a colloquialterm used in the United Kingdom, Australia, New Zealand, and South Africa, similar to theAmerican notion of an “egghead”:
Boffins are “scientists, engineers, and other people who are stereotypically seen as engagedin technical or scientific research.” The word “boffin” (or “boff”—often as an insult) canalso be used to refer to any particularly clever person. The closest American equivalent is“Egghead.” (Wikipedia, http://en.wikipedia.org/wiki/Boffin)
In U.K. schools, the term “boffin”/”boff” is used generically (it is not just restricted toscience) to denote (and often ridicule) high achieving students who are associated withnotions of “cleverness” (Francis, 2009). The science boffin is embodied by the popular andfamiliar stereotypical representation of the brilliant but eccentric scientist, epitomized byhis “wild” hair and distinctly marked in racial, age, gender, and class terms as White, old,male, and middle class. In our research, Einstein was most often evoked to capture thisrepresentation.
Boy 1: When I hear science I usually think of this man with a big moustache and likebald here [points to own head] and like with hair all around his head, and then
Boy 2: Robert EinsteinBoy 1: Yeah, Robert Einstein. And he’s got a flask in his hand and he has this green
liquid and he pours it into another bottle another flask that has red liquid and thenall of a sudden— caboom!
Science Education
“DOING” SCIENCE VERSUS “BEING” A SCIENTIST 17
Boy 2: ChemicalsGirl 1: Like explosions like you know when you like [inaudible]Int: You mix things up, yeahBoy 3: He’s wearing glassesGirl 2: Like goggles
(Roman Catholic Elementary, mixed)
Int: What makes someone good at science?Boy 1: When they know a lot.Int: When they know a lot? What about you, what were you going to say?Boy 2: I was going to say the same.Int: When they know a lot?Boy 3: When they have big moustaches and they’re a scientist.
The notion of the scientist as a brilliant (if eccentric) genius has also been noted inpopular stereotypes of mathematicians (Epstein, Mendick, & Moreau, 2010), who observedhow often, within young people’s views, there is a conflation between being good atmathematics; masculinity; high intelligence; and middle/upper classsness. Moreau et al. (inpress) also found that 14/15-year-old school students differentiated between stereotypicalrepresentations of mathematicians (who are short-haired geniuses) and scientists, who havelong, wild hair (“scientists have crazy hair”). Unsurprisingly, this image was not seen as anattractive or desirable identity by many students, especially not girls who wanted to look“beautiful” instead:
I wouldn’t want to be a scientist because I don’t want to find these like dead bodies andbones and . . . ugh! And then I wouldn’t like to have big grey frizzy hair . . . because allscientists seem to have these caps on like bald heads and they have like [inaudible] and Idon’t want to look like that, I want to look beautiful. (Girl, Inner City Elementary)
Such findings chime with other studies, in which elementary and secondary school girlsreport enjoying science but cannot imagine themselves as scientists (e.g., Baker & Leary,1995; Jenkins & Nelson, 2005).
We would hypothesize that the dominant popular association of “boffin”/egghead iden-tity with science will be undesirable (and require negotiation) for any girls who are in-vested in the construction of conventional (heterosexual, gender-traditional) femininities,but racialized and classed discourses of femininity would suggest that this may be es-pecially undesirable or problematic for particular groups of girls whose identities (e.g.,as non-White and/or working class) are not typically associated with “boffin” identity.For instance, research demonstrates how popular working-class (especially White workingclass) discourses of femininity may not sit easily with notions of academic achievement (ascompared, for instance, to middle-class discourses around the “blue-stocking”) and howsome of these constructions draw particularly heavily on certain embodied practices around“glamor” (Archer, Halsall, & Hollingworth, 2007; Skeggs, 1997) and sexuality (Renold,2005). This is not to say that middle-class girls do not experience tensions in balancing a“desirable” femininity with academic achievement (cf. Reay, 2001; Renold, 2005), but thatthey have comparatively more discursive resources available to them to navigate this iden-tity dilemma, given the popularly perceived congruence between academic achievementand middle-class femininity. For many working-class girls, a science identity may seem un-intelligible (Butler, 1990) and completely incompatible with the versions of femininity thatthey recognize as culturally desirable and acceptable. In other words, to imagine oneself
Science Education
18 ARCHER ET AL.
into a space of being, young people need to be able to “take up a science identity that canbe recognized and accessed by others” (Calabrese Barton & Brickhouse, 2006, p. 224).
The interplay between discourses of femininity, sexuality, achievement, and scienceconstitutes a space for analysis that we hope to pursue further as our study develops. Ourconceptual starting point is that if high achievement and “effortless brilliance” tend to beconstructed as masculine, then high-achieving girls are required to engage in a form ofidentity work that involves the negotiation of an acceptable form of femininity (see Francis,Skelton, & Read, 2009, in the context of high-achieving students in the United Kingdom).In the case of science, this is heightened further, due to dominant constructions of scienceas a masculine field. The ability for girls to navigate a successful (achieving) scienceidentity will be overlaid further by social class and ethnic identities—being potentiallyslightly more congruent for middle-class girls (for whom dominant notions of “acceptable”academic femininity tend to be linked with the suppression of sexuality, Renold, 2005;Renold & Allan, 2006; Skelton & Francis, 2008). Ethnic identities will provide yet anothercrucial layer, or lens, for analysis. While Whiteness may be aligned more closely with theimage of “the scientist” in popular discourse (and hence may be a potentially congruentidentity discourse), evidence suggests that the perceived “respectability” and acceptabilityof a science identity may be constructed differently among ethnic collectivities (e.g., seeArcher & Francis, 2007, in the case of the British Chinese). The interplay between race,class, and gender may mean that some families and collectivities may recognize and espouseversions of acceptable or respectable femininity which (for girls or young women at least)may render science as a more acceptable identity (for instance, due to its “status” and theassociated discursive repression of sexuality).
Despite the potentially positive associations that might be expected to follow from beingidentified as highly intelligent by virtue of taking up a science identity, as Epstein et al.(2010) highlight in relation to mathematics, boffin identities reside dangerously close to“geek” (or nerd) identities—a stigmatized social/learner identity that many children seek toavoid. We would suggest that the children’s constructions of the scientist as boffin indicatethat, as they get older, a science identity will come to operate as a pariah identity (Francis,2009) within the classroom—only a few students will be willing to “risk” or embracethe identity due to the negative weight that it carries in popular identity terms. Its boffinassociations and incongruence with popular/desirable forms of contemporary masculinityand femininity (especially working-class configurations) make it a potentially risky identity,being closely associated with markers of an “uncool” identity.
Francis et al. (2009) argue that if high-achieving pupils are to also be popular (and resistbeing positioned by their peers as boffins) they have to mobilize certain embodied capitals(notably physical attractiveness and fashion and or style) and conform to performances ofdominant (conventional) gender identities (e.g., being sporty for boys and being “girly” andcoquettish for girls). Brickhouse and Potter (2001) describe the case of Ruby, an AfricanAmerican girl in their longitudinal U.S. study who had to engage in sustained identity nego-tiations to balance her achievement and participation in a competitive computing programwith an acceptable femininity. Ruby attempted to achieve this by balancing her “mascu-line” performances of achievement (and achievement in a traditionally male sphere) withher performances of hyperfemininity (e.g., doing modeling and cheerleading). This was noteasy, as detailed by her “struggle to construct a livable identity in a competitive computingprogram in which she desires computing competence but does not desire other aspects ofthe central image of the computing program” (Brickhouse & Potter, 2001, p. 971). Thus, itseems likely that if an adolescent student is to embrace a science identity he or she musteither inhabit the position of pariah (the socially derided “geek”) or possess the requisiteembodied capitals to also convincingly perform dominant heteromasculinity/femininity.
Science Education
“DOING” SCIENCE VERSUS “BEING” A SCIENTIST 19
The Defense of Science as Masculine: (“Fashion and ScienceDon’t Mix”)
Drawing on the data from this study, we have argued thus far that taking up a scienceidentity may be undesirable for many groups of young people but may become particularlyproblematic for girls (especially working-class girls) as they progress through compulsory(and by extension, we imagine, postcompulsory) education. In this final section, we wish tohighlight how, in the case of girls’ scientific identities, boys do not play a silent or passiverole in this process. This is reflective of how discourses are not external, objective structures(that exist “out there” in society) but are active—they are constantly taken up, resisted orembraced, and reworked. The exclusion of girls from a high-status (albeit contradictorilyconfigured) identity and field such as science is part of the patriarchal dividend—a stateof affairs from which boys or men may benefit more generally. In this respect, it was notsurprising that we found evidence of some boys making their own active investments inreproducing and policing the boundary of science (arguing that it is or should be a malepreserve). This is encapsulated in the following extract, in which a group of boys suggestthat girls are not “naturally” into science because “fashion and science don’t mix.” The boysargued that boys are better at science, explaining that the scientists they know are all men(“cos my uncle’s a scientist and he’s a boy”; Newton, Einstein, and Edison were also cited).One of the boys also suggested that girls “have no confidence” in science, and this was dueto their preoccupation with “their nails chipping when they’re doing the experiments.”
Boy I: don’t think girls would make good scientists or like you know inventors and that,because they aren’t usually interested in science mostly. If a girl is yeah, theywould become famous like . . . there might be a girl that invented something– isthere?
Int: Mm.Boy 2: Yeah yeah. They mostly care about fashion. If they put everything into it, but
most girls these days care about fashion and their trousers (inaudible)Int: Couldn’t [girls] care about fashion and science?Boy 2: No they wouldn’t, because fashion and science don’t mix.Boy 3: Your nails could get chipped.Boy 1: I can add to that. Yeah, if they like . . . in science . . . cos most scientists wear
glasses and girls these days care about fashion, and glasses aren’t in fashion.
(Inner City Elementary, boys)
The above comments were made by an all-male discussion group, and it was notable thatnone of the mixed-sex groups produced such accounts, presumably because the presenceof girls would potentially have led to such views being challenged. But the above canalso be read as part of these boys’ everyday performances of “doing boy.” This sort of“cartoon sexism” is not uncommon in all boy groups (e.g., see Archer 2002, 2003) andoften tells us more about the ways in which boys discursively “jockey for position” withone another (e.g., by articulating controversial or socially “risky” views, or by adoptingextreme or hegemonic viewpoints) than about their substantive views on gender equality.What is interesting here, however, is that science is recognized and deployed as a powerfulresource for negotiating gendered subject positions. The boys all “know” that science ispopularly configured as masculine and as high status and is hence something that, as boys,they would have a vested interest in claiming (as “for boys”). They recognize the waysin which science is popularly positioned as antithetical to femininity, and they are ableto draw on dominant stereotypes around femininity to question its viability as an identity
Science Education
20 ARCHER ET AL.
discourse for “real” girls (it is rendered acceptable only for unfashionable girls who do not“care” about their appearance, i.e., challenging conventional notions of popular or desirablefemininity as compatible with science). This exchange thus alerts us to the issue that if, aseducators, we wish to attract more girls into science then we will need to focus our attentionas much on popular or dominant constructions and performances of masculinity (and theways in which boys may defend and claim science—and hence challenge and resist suchinterventions) as we might femininity.
CONCLUSION
In this paper, we have identified and discussed a key dilemma for science education,namely that children can report enjoying science (e.g., they may find it fun, exciting,important, and interesting) but they may still see it as “not for me” and choose not to studyit at a higher level (Jenkins & Nelson, 2005). We conducted our analysis of children’sdiscussion group talk through the lens of identity, noting how constructions of science andidentity are circumscribed by social class, ethnicity, and gender. We detailed how, even at thisyoung age when children are mostly enthusiastic about science, some aspects of a ”scienceidentity” are beginning to be ruled out as not only undesirable but even “unthinkable,” andother aspects are understood as possible or desirable only under certain identity conditions.In other words, beneath the broad brush general enthusiasm for science expressed bythese children (independent of gender, ethnicity, and social class), we can excavate thegermination of (gender, ethnic, class) distinctions that will come to be solidified in lateryears. Our analytical distinction between “doing” and “being” provided an entry point tounderstanding and explaining this disjuncture.
The children’s discursive demarcation between school science (as “safe”) and “real” oradult science (as “dangerous”) highlights a real dilemma for educators: reworking schoolscience in a way that would be more attractive to hegemonic masculinity (assuming thisis even possible) might increase the interest and engagement of some boys but would beundesirable in that it would alienate girls and other boys and, given the inherent tensionsbetween “laddishness” and schooling, may well be unsuccessful even with its target group.The disjuncture we have identified between “doing” and “being” would also lead us toquestion the utility of such an approach. Indeed, Osborne and Dillon (2008) have argued,for instance, that what is required is a new vision of science education, not only of what weknow and how we know, but also what kinds of careers science affords—both in science andfrom science—and why these careers are personally fulfilling, worthwhile, and rewarding.
We also suggested that subtle differences between children’s nature of engagement without-of-school science also contain indicators of future distinctions (particularly classeddistinctions) in terms of patterns of achievement and engagement in science. This suggeststhat a focus on reforming school science alone may not be sufficient if we are to broadenits appeal.
Finally, we would suggest that the content of the “being a scientist” construction (interms of science as hard/brainy; science as natural interest; scientist as boffin) have enabledus to tease out the complex interplay of discourses of gender, sexuality, ethnicity, andsocial class within children’s everyday constructions of science. Our analyses lead usto identify a conundrum in that, in its present form, science appears to be constructedas “too feminized” for (many) boys and “too masculine” for (many) girls. This appearsto constitute an impossible position—can science ever appeal to all constituencies as aviable identity? This may point to the need to work with multiple visions of science—aposition that in itself suggests a need to disrupt dominant discourses around science and
Science Education
“DOING” SCIENCE VERSUS “BEING” A SCIENTIST 21
the identity of the scientist. It also impels us to consider how we might bridge the gapbetween children and young people’s everyday identities (those that are experienced asdesirable, authentic, and conveying status within their daily fields of interaction) and theidentities and messages conveyed by school and “real” science. Our analyses suggest thatintelligible gender identity performances within one field (e.g., home, peer culture) may beincompatible with others (e.g., science). In particular, a science identity as it is popularlyconfigured appears unintelligible for some children and young people due to its dominantgendered, raced, and classed configuration.
Our analyses contribute to understanding the complex identity processes that may under-lie the deep-seated, often trenchant, resistance that many interventions, designed to increaseengagement and uptake of science among young people, have encountered. While many ofthese interventions have been carefully and thoughtfully designed by a range of appropriateexperts and practitioners, evaluative evidence indicates that even the “best” interventionsmay still be resisted by pupils and/or enjoyed by those involved but make little or nodifference to pupils continuing with science (e.g., see Carlone, 2004; Solomon, 1997). It isfrom this platform that we hope to be able to move forward to identifying how we mightbe able to interrupt dominant identity patterns of (dis)identification in relation to science inthe future.
REFERENCES
Archer, L. (2002). Change, culture and tradition: British Muslim pupils talk about Muslim girls’ post-16 “choices.”Race, Ethnicity and Education, 5(4), 359 – 376.
Archer, L. (2003). Race, masculinity and schooling: Muslim boys and education. Maidenhead, England: OpenUniversity Press.
Archer, L., & Francis, B. (2007). Understanding minority ethnic achievement. London: Routledge.Archer, L., Halsall, A., & Hollingworth, S. (2007). Inner-city femininities and education: “Race,” class, gender
and schooling in young women’s lives. Gender and Education, 19(5), 549 – 568.Baker, D., & Leary, R. (1995). Letting girls speak out about science. Journal of Research in Science Teaching,
32(1), 3 – 27.Ball, S. J., & Vincent, C. (1998). “I heard it on the grapevine”: ”Hot” knowledge and school choice. British Journal
of Sociology of Education, 19(3), 377 – 400.Bhabha, H. (1990). Nation and narration. London: Routledge.Bourdieu, P. (1986). Distinction. London: Routledge and Kegan Paul.Bourdieu, P. (1990). The logic of practice. Cambridge, England: Polity Press.Bourdieu, P., & Passeron, J.-C. (1977). Reproduction in education, society and culture. Beverly Hills, CA: Sage.Brickhouse, N. W., & Potter, J. T. (2001). Young women’s scientific identity formation in an urban context. Journal
of Research in Science Teaching, 38(8), 965 – 980.Burman, E., & Parker, I. (Eds.). (1993). Discourse analytic research: Repertoires and readings of texts in action.
London: Routledge.Butler, J. (1990). Gender trouble: Feminism and the subversion of identity. London: Routlege.Calabrese Barton, A., & Brickhouse, N. W. (2006). Engaging girls in science. In C. Skelton, B. Francis, & C.
Smulyan (Eds.), The SAGE handbook of gender and education (pp. 221 – 235). London: Sage.Calabrese Barton, A., Ermer, J. L., Burkett, T. A., & Osborne, J. (2003). Teaching science for social justice. New
York: Teachers College Press.Carlone, H. B. (2004). The cultural production of science in reform-based physics: Girls’ access, participation,
and resistance. Journal of Research in Science Teaching, 41(4), 392 – 414.Carlone, H., & Johnson, A. (2007). Understanding the science experiences of successful women of color: Science
identity as an analytic lens. Journal of Research in Science Teaching, 44 (8), 1187 – 1218.Delamont, S., Beynon, J., & Atkinson, P. (1988). In the beginning was the Bunsen: The foundations of secondary
school science. Qualitative Studies in Education, 1(4), 315 – 328.Epstein, D., Mendick, H., & Moreau, M.-P. (2010). Imagining the mathematician: Young people talking about
popular representations of maths. Discourse: Studies in the Cultural Politics of Education, 31(1), 45 – 60.Francis, B. (1999). Lads, lasses and (new) labour: 14 – 16-year-old students’ responses to the “laddish behaviour
and boys” underachievement’ debate. British Journal of Sociology of Education, 20(3), 355 – 371.
Science Education
22 ARCHER ET AL.
Francis, B. (2000). The gendered subject: Students’ subject preferences and discussions of gender and subjectability. Oxford Review of Education, 26(1), 35 – 48.
Francis, B. (2008). Engendering debate: How to formulate a political account of the divide between genetic bodiesand discursive gender? Journal of Gender Studies, 17(3), 211 – 223.
Francis, B. (2009). The role of the boffin as abject other in gendered performances of school achievement.Sociological Review, 57(4), 645 – 669.
Francis, B., & Skelton, C. (2005). Reassessing gender and achievement: Questioning contemporary key debates.London: Routledge.
Francis, B., & Skelton, C. (2008). The self-made self: Analysing the potential contribution to the field of genderand education of theories that disembed selfhood. Discourse: Studies in the Cultural Politics of Education,29(3), 311 – 323.
Francis, B., Skelton, C., & Read, B. (2009). The simultaneous production of educational achievement andpopularity: How do some pupils accomplish it? British Educational Research Journal, 36(2), 1469 – 3518.
Frosh, S., Phoenix, A., & Pattman, R. (2001). Young masculinities: Understanding boys in contemporary society(p. 304). Basingstoke, England: Palgrave MacMillan.
Gardner, P., L. (1975). Attitudes to science: A review. Studies in Science Education, 2, 1 – 41.Gladwell, M. (2008). Outliers: The secret of success. London: Penguin.Hall, S. (1992). New ethnicities. In J. Donald & A. Rattansi (Eds.), Race, culture and difference (pp. 252 – 259).
London: Sage Publications Ltd.Harding, S. (1986). The science question in feminism. Ithaca, NY: Cornell University Press.Head, J. (1985). The personal response to science. Cambridge, England: Cambridge University Press.Holmes, L. (2000). Reframing learning: Performance, identity and practice. Paper presented at Critical Contribu-
tions to Managing and Learning: Second Connecting Learning and Critique Conference. Lancaster, England:Lancaster University.
Jackson, C. (2002). “Laddishness” as a self-worth protection strategy. Gender and Education, 14(1), 37 – 51.Jackson, C., & Tinkler, P. (2007). “Ladettes” and “modern girls”: “Troublesome” young femininities. Sociological
Review, 55(2), 251 – 272.Jenkins, E., & Nelson, N. W. (2005). Important but not for me: Students’ attitudes toward secondary school
science in England. Research in Science & Technological Education, 23(1), 41 – 57.Kelly, A. (Ed.). (1981). The missing half: Girls and science education. Manchester, England: Manchester
University Press.Kitzinger, J. (1994). The methodology of focus groups: The importance of interaction between research partici-
pants. Sociology of Health & Illness, 16(1), 103 – 121.Lareau, A. (2007). Race, class, and the transmission of advantage. In L. Weis (Ed.), The way class works: Readings
on school, family, and the economy. New York: Routledge.Lightbody, P., & Durndell, A. (1996). Gendered career choice: Is sex-stereotyping the cause or the consequence?
Educational Studies, 22(2), 133 – 146.Lindahl, B. (2007). A longitudinal study of student’s attitudes towards science and choice of career.Paper presented
at the 80th NARST International Conference,New Orleans, LA.Lyons, T. (2006). Different countries, same science classes: Students’ experience of school science classes in their
own words. International Journal of Science Education, 28(6), 591 – 613.Mendick, H. (2006). Masculinities in mathematics. Buckingham, England: Open University Press.Mendick, H., Moreau, M.-P., & Epstein, D. (2009). Special cases: Neoliberalism, choice and mathematics educa-
tion. In L. Black, H. Mendick, & Y. Solomon (Eds.), Mathematical relationships: Identities and participation.New York: Routledge.
Mickelson, R. A. (1990). The attitude-achievement paradox among Black adolescents. Sociology of Education,63, 44 – 61.
Moreau, M.-P., Mendick, H., & Epstein, D. (Forthcoming). Constructions of mathematicians in popular cultureand learners’ narratives: A study of mathematical and non-mathematical subjectivities. Cambridge Journal ofEducation.
Murphy, C., & Beggs, J. (2005). Primary science in the UK: A scoping study. Final Report to the Wellcome Trust.London: Wellcome Trust.
OPM, for the Royal Society. (2006). Taking a leading role—Scientists survey. London: The Royal Society.Ormerod, M. B., & Duckworth, D. (1975). Pupils’ attitudes to science. Slough, England: NFER.Osborne, J., & Collins, S. (2001). Pupils’ views of the role and value of the science curriculum: A focus-group
study. International Journal of Science Education, 23(5), 441 – 467.Osborne, J., & Dillon, J. (2008). Science education in Europe: Critical reflections. London: Nuffield Foundation.Osborne, J., Simon, S., & Collins, S. (2003). Attitudes towards science: A review of the literature and its
implications. International Journal of Science Education, 25(9), 1049 – 1079.
Science Education
“DOING” SCIENCE VERSUS “BEING” A SCIENTIST 23
Pell, T., & Jarvis, T. (2001). Developing attitude to science scales for use with children of ages from five to elevenyears. International Journal of Science Education, 23(8), 847 – 862.
Reay, D. (2001). Finding or losing yourself?: Working-class relationships to education. Journal of EducationPolicy, 16(4), 333 – 346.
Renold, E. (2005). Girls, boys and junior sexualities. London: Routledge Falmer.Renold, E., & Allan, A. (2006). Bright and beautiful: High achieving girls, ambivalent feminities and the fem-
inization of success in the primary school. Discourse: Studies in the Cultural Politics of Education, 27(4),457 – 473.
Said, E. W. (1978). Orientalism. London: Routledge and Kegan Paul.Schibeci, R. A. (1984). Attitudes to science: An update. Studies in Science Education, 11, 26 – 59.Schreiner, C., & Sjøberg, S. (2007). Science education and youth’s identity construction—Two incompatible
projects? In D. Corrigan, J. Dillon, & R. Gunstone (Eds.), The re-emergence of values in the science curriculum(pp. 231 – 247). Rotterdam, The Netherlands: SensePublishers.
Schutz, A., & Luckman, T. (1973). Structures of the life world. Portsmouth, NH: Heineman.Sjøbeg, S., & Schreiner, C. (2005). How do learners in different cultures relate to science and technology? Results
and perspectives from the project ROSE. Asia Pacific Forum on Science Learning and Teaching, 6(2), 1 – 16.Skeggs, B. (1997). Formations of class & gender: Becoming respectable. Thousand Oaks, CA: Sage.Skelton, C. (2001). Schooling the boys: Masculinities and primary education (educating boys, learning gender).
Buckingham, England: Open University Press.Solomon, J. (1980). Teaching children in the laboratory. London: Routledge.Solomon, J. (1997). Girls’ science education: Choice, solidarity and culture. International Journal of Science
Education, 19(4), 407 – 417.Springate, I., Atkinson, M., Straw, S., Lamont, E., & Grayson, H. (2008). Narrowing the gap in outcomes: Early
years (0 – 5 Years). Slough, England: NFER.Tai, R. H., Qi Liu, C., Maltese, A. V., & Fan, X. (2006). Planning early for careers in science. Science, 312,
1143 – 1145.Vaughn, S., Schumm, J. S., & Sinagub, J. M. (1996). Focus group interviews in education and psychology.
Thousand Oaks, CA: Sage.Vincent, C., & Ball, S. J. (2007). “Making up” the middle-class child: Families, activities and class dispositions.
Sociology, 41(6), 1061 – 1077.Walkerdine, V. (1988). The mastery of reason. London: Routledge & Kegan Paul.Walkerdine, V. (1989). Counting girls out. London: Virago.Walkerdine, V. (1990). Schoolgirl fictions. London: Verso Books.Warrington, M., & Younger, M. (2000). The other side of the gender gap. Gender & Education, 12, 493 – 507.Warrington, M., Younger, M., & Williams, J. (2000). Student attitudes, image and the gender gap. British
Educational Research Journal, 26(3), 393 – 407.Whitehead, J. M. (1996). Sex stereotypes, gender identity and subject choice at a level. Educational Research,
38(2), 147 – 160.Woolnough, B. (1994). Effective science teaching. Buckingham, England: Open University Press.
Science EducationAll in-text references underlined in blue are linked to publications on ResearchGate, letting you access and read them immediately.
Relevant: Beyond the Basics
Author: Jacqueline Jordan Irvine
Blogs and Articles: Cultural Competence
Number 36: Fall 2009
Monica Edwards was frustrated.
As a teacher in an urban elementary school, Edwards faced a class that was largely African American and Latino: she was neither. She often felt that she wasn’t effectively reaching them, and she was beginning to get discouraged. (Monica Edwards isn’t her real name. She’s a real teacher who told me her story privately.)
After hearing a colleague briefly mention her success in using culturally relevant instructional strategies, Edwards decided to try her hand at the same. She bought a commercial CD called Multiplication Rap, which promised to teach mathematics based on repetition and rhyme, hand-clapping and a hip-hop musical style. She was sure the CD would appeal to her students’ interest in the rap music genre.
In the classroom, however, things didn’t go quite as planned. Students focused on the music itself, paying little attention to the math objectives. Several were unimpressed with the CD, and commented on the poor audio quality and amateurish lyrics. Except for the musical debate, nothing much happened. The failure rate on Edwards’ weekly exam did not change.
Sadly, Edwards’ experience is not uncommon. Many teachers have a cursory understanding of culturally relevant pedagogy, and a desire to see it succeed in their classrooms. The problem is that in many cases, teachers have only a cursory understanding, and their efforts to bridge the cultural gap often fall short.
“Culturally relevant pedagogy” is a term that describes effective teaching in culturally diverse classrooms. It can be a daunting idea to understand and implement. Yet even when people do not know the term, they tend to appreciate culturally relevant pedagogy when they see it.
Think of the film Stand and Deliver, in which Edward James Olmos, as teacher Jaime Escalante, teaches his students about negative numbers using the example of digging and filling holes in the sand on the California beach. He tells his mostly Latino class that the Mayan civilization independently invented the concept of zero. When the students begin to catch on, the audience is inspired by this moment of epiphany.
Most people understand intuitively that this type of teaching engages and motivates students. Teachers want to be a Jaime Escalante for their own students — and they leap at the chance to try new techniques or tools designed to bridge a cultural gap.
©2016 Southern Poverty Law Center 1/5
Often, these well-meaning educators assume that culturally relevant pedagogy means simply acknowledging ethnic holidays, including popular culture in the curriculum or adopting colloquial speech. And many are afraid to take it farther than that. Why? Largely because they believe the following myths:
• Only teachers of color can be culturally relevant.
• Culturally relevant pedagogy is not appropriate for white students.
• Caring teachers of diverse students have no classroom management skills.
• The purpose of culturally relevant pedagogy is to help diverse students “feel good” aboutthemselves.
• Culturally relevant teachers attend to learning styles by addressing African American male students’need for kinesthetic activities or by allowing Asian American students to work alone.
These myths and misperceptions often result in awkward classroom moments, ineffective instructional practices and counterproductive teacher-student and teacher-parent relationships.
Let’s tackle the biggest myth first. Culturally relevant teaching may indeed boost the self-esteem of your students, but that’s not the main reason you should adopt it. You should take a culturally relevant approach because it will maximize student learning.
A culturally relevant pedagogy builds on the premise that learning may differ across cultures and teachers can enhance students’ success by acquiring knowledge of their cultural backgrounds and translating this knowledge into instructional practice.
Culturally relevant pedagogy has theoretical roots in the notion that learning is a socially mediated process and related to students’ cultural experiences. Culture is an important survival strategy that is passed down from one generation to another through the processes of enculturalization and socialization, a type of roadmap that guides and shapes behavior. If new information is not relevant to those frameworks of culture and cognition, people will never remember it. If the information is relevant, they will never forget it.
The March To the Mailbox
Let me give you an example to show how culturally relevant pedagogy works, and why it works for all students.
A teacher in a low-income school once told me about her struggle with that age-old task: teaching students to write a business letter. Her textbook offered what sounded like some pretty good advice for making this task relevant to students. Bring a toy catalog to class, it said, and let students write letters placing an order for a Game Boy or other item.
The teacher tried to picture this working with her students. Most of them couldn’t afford a Game Boy. And who orders catalog items with a business letter these days? She decided that this exercise, so seemingly good in theory, would seem completely pointless to her students.
So she found another, more appropriate task. She told her students they were going to write letters to the mayor, asking for changes that would make life better in their neighborhood. She told students not to rely solely on their own perspectives: they should go into the community and ask relatives, neighbors and
©2016 Southern Poverty Law Center 2/5
church leaders about the problems in the community. The students did their research — learning about their community and strengthening their bonds with family — and wrote their letters. The teacher held a “march to the mailbox,” mailing their letters with great ceremony. And not long afterward, the mayor was on the phone with the principal, asking when he could visit the class and address their concerns in person.
The cultural norms and behaviors of schools are based on a very specific set of mainstream assumptions. When there is a cultural mismatch or cultural incompatibility between students and their school, certain negative outcomes might occur, such as miscommunication; confrontations among the student, the teacher, and the home; hostility; alienation; diminished self-esteem; and possibly school failure.
In the case above, someone assumed that all students had the means to envision themselves ordering a Game Boy. Perhaps just as important, it assumed that young people are interested only in acquiring toys — that they had no interests or lives outside of getting and spending. The teacher’s solution to this problem was truly culturally relevant because it drew on the students’ resources and experiences. It worked extremely well for this group of students, who got to see their own knowledge, and that of their community, honored in the classroom. But clearly it would have worked well even in other communities.
What could Monica Edwards have done differently? Culturally relevant teaching requires the teacher to possess a thorough knowledge of the content and employ multiple representations of knowledge that use students’ lived experiences to connect new knowledge to home, community, and global settings.
What do we mean multiple representations? Teachers need to find pertinent examples in students’ experience; they need to compare and contrast new concepts with concepts students already know; they need to bridge the gap between the known (students’ personal cultural knowledge) and the unknown (materials and concepts to be mastered).
In one of my texts, Culturally Responsive Lesson Planning, my colleagues and I present culturally relevant and transformative lesson units in four subject areas that are aligned with content area standards. Examples include:
• teaching weather and other scientific concepts by first helping students to understand theconnections between their culture and weather as portrayed in myths, folklore, and familysayings;
• teaching social studies by helping students in urban communities to analyze and report votingpatterns in their neighborhood and execute a voter education project.
There is a widespread myth that teachers who care about a culturally relevant classroom are not the ones who care about rigor. In reality, culturally relevant pedagogy is perfectly aligned with high standards in the content areas. Just look at the standards of the National Council for Teaching of Mathematics. The first of NCTM’s principles and standards is the Equity Principle, which states: “Excellence in mathematics education requires equity — high expectations and strong support for all students.”
Culturally relevant teaching isn’t about lowering those “high expectations.” It’s about providing strong supports by approaching effective instruction through a cultural lens. I believe that many diverse students fail in schools not because their teachers don’t know their content, but because their teachers haven’t made the connections between the content and their students’ existing mental schemes, prior knowledge and cultural perspectives. In helping learners make sense of new concepts and ideas, culturally relevant teachers create learning opportunities in which students’ voices emerge and knowledge and meaning are constructed from the students’ perspectives.
©2016 Southern Poverty Law Center 3/5
Monica Edwards, the teacher in the opening of this story, is a good teacher. She wanted her students to learn, and she correctly identified the student/school cultural gap as a possible reason for their lack of learning gains. She and her colleagues deserve support in the form of professional development that helps them achieve their goals. Not superficial, one-day teacher workshops on diversity or multiculturalism: these often do more to maintain stereotypes and biases about culturally diverse students and their families than to change them. Not a focus on international festivals and once-a-year programs honoring Black History Month or Cinco de Mayo. Teachers need to be encouraged to question the curriculum and the pedagogy.
Educated Guesses
Culturally relevant teachers form caring relationships with their students.
I remember an incident that occurred while I was observing a preservice teacher at work in a mostly-black elementary school in the South. The topic was classification: students were supposed to show ability to sort out like and unlike objects and consonant sounds. When the teacher showed students a photograph of a wrinkly, cabbage-like vegetable, she expected them to identify it as kale. Students were stumped, though some guessed that it was collard greens. Later the teacher showed the students a picture of broccoli, which the students also could not identify. (Not everybody cooks broccoli. I grew up in Alabama, and I never saw broccoli on a plate until I was in college.) The teacher couldn’t hide her shock that the students didn’t recognize this vegetable: the students began to suspect that they were being lured into a game they couldn’t win. Soon the students were acting up, and the teacher, upset, was storming out of the room.
I searched my mind for something to do. I recalled hearing students talking, before class, about the cars they’d seen in the school parking lot that morning. I asked them if they could name the various types of cars they’d seen. As it turned out, they had quite an extensive knowledge of brands and makes of cars. We classified the information we collected, sorting the cars into vehicles driven by first-grade teachers, vehicles driven by second-grade teachers, and so on. We even did a little geography, with students using a map to point out where various cars came from. Students had some trouble finding Sweden, but they knew Volvos came from there. We talked about what a hypothesis was — an educated guess — and as homework, I asked them to look over their data about cars and make a hypothesis about the difference between principals and new teachers. The next day, many students hypothesized, based on the cars in the parking lot, that principals make more money than teachers.
You could say I got lucky in this situation. But if you have a true, caring relationship with your students, you don’t have to be lucky. You will know what their interests are, what information they relate to. Even in an abstract discipline like mathematics, relationships with students matter. When you’re talking about distances, it certainly helps to be able to say, “I heard you talking about your cousin Miguel. How far do you think you go to visit him?”
Culturally relevant teachers recognize that they do not instruct culturally homogenized, generic students in generic school settings. Teachers armed with a repertoire of generic teaching skills often find themselves ineffective and ill-prepared when faced with a classroom of culturally diverse students.
Teachers need to re-envision their roles in schools. Culturally relevant teachers are systemic reformers, members of caring communities, reflective practitioners and researchers, pedagogical content specialists and antiracist educators.
©2016 Southern Poverty Law Center 4/5
As systemic reformers, culturally relevant teachers must lead, not simply respond to, the call for whole school reform. Educating and mentoring peers is part of that. All teachers, not just novices, benefit from the expertise and guidance of master teachers who observe their classes and coach them on a regular basis. In addition, teachers need release time to observe master teachers in their classes and periods for conferencing and planning.
They also need to make time to reflect on their classroom experiences. Reflection enables teachers to examine the interplay of context and culture as well as their own behaviors, talents and preferences. Reflective teachers are inquirers who examine their actions, instructional goals, methods and materials in reference to their students’ cultural experiences and preferred learning environments. The culturally relevant teacher probes the school, community and home environments searching for insights into diverse students’ abilities, preferences and motivations. This type of reflection assists teachers in confronting their misunderstandings, prejudices and beliefs about race that impede the development of caring classroom climates, positive relationships with their students and families, and ultimately their students’ academic success.
Thinking of culturally relevant teachers as action researchers extends another important component of the reflection process. Action research is inquiry conducted by teachers for teachers for the purpose of higher student achievement. Action research requires teachers to identify an area of concern, develop a plan for improvement, implement the plan, observe its effects, and reflect on the procedures and consequences.
Finally, student achievement is not the only purpose of a culturally relevant pedagogy. Culturally relevant teachers must also assist students to change the society, not simply to exist or survive in it. For some teachers, this can be very challenging. When teachers promote justice they directly confront inequities in society such as racism, sexism and classism. Far too many teachers appear to be not only colorblind, but also unable or unwilling to see, hear or speak about instances of individual or institutional racism in their personal and professional lives.
©2016 Southern Poverty Law Center 5/5
Vol. 12, No. 2 International Journal of Multicultural Education 2010
1
Culturally Relevant Teaching in Science Classrooms:
Addressing Academic Achievement, Cultural Competence, and Critical Consciousness
Gloria Boutte University of South Carolina
U. S. A.
Charlease Kelly-JacksonClaflin University
U. S. A.
George Lee Johnson South Carolina State University
U. S. A.
This article provides classroom examples and commentaries for extending and deepening culturally relevant science teaching efforts in classrooms. It examines instructional efforts used by one of the authors with high school and university students. Together, the three authors rethink and reconsider several aspects against a culturally relevant pedagogical backdrop. The commentary points out considerations for focusing on student achievement, cultural competence, and critical and sociopolitical consciousness. The necessity and difficulty of centering culture, equity, and power relations are emphasized.
The Sociopolitical ContextCulturally Relevant Pedagogy (CRP)
Culturally Relevant Science InstructionCRP Example 1: Cell Analogies Collage
CRP Example 2: Extracting DNA ActivitiesCPR Example 3: Integumentary System Unit
Problematizing Science as “Factual” and Uncovering Scientific Racism Conclusion
NoteReferencesAppendix
The Sociopolitical Context
In light of challenges faced by the increasing racial and ethnic diversity among students in pre-K-12 schools in the U.S. and the accompanying decline in diversity among the population of teachers, culturally relevant teaching has become a promising and compelling educational and ethical consideration and
Vol. 12, No. 2 International Journal of Multicultural Education 2010
2
movement (McKinley, Jones, & Castagno, 2008). However, conversations regarding culturally relevant teaching typically occur in academic circles and have been sluggish in reaching practitioners. In our professional development sessions with practitioners, science and mathematics teachers frequently misperceive culturally relevant teaching to be appropriate for language arts, social studies, and fine arts, but not for the so-called “hard sciences.” Responding to the need to make culturally relevant science discourse accessible to practitioners, this article provides three examples of a science teacher‟s effortsand a commentary on how to go beyond superficial efforts and attain more authentic culturally relevant teaching.
During the last few decades, a considerable number of mathematics educators have addressed ethnomathematics and culturally relevant mathematics (e.g., Berry, 2008; Davis & Martin, 2008; Gutstein, Lipman, Hernandez, & de los Reyes, 1997; Joseph, 1987; Ladson-Billings, 1997; Lynn, 2006; Martin, 2007; Matthews, 2003; Rousseau & Tate, 2003; Tate, 1995). Likewise, there has been a shift from the notion that science education is value- and culture-free, and ethnoscience is also on the rise (Kahle, Meece, & Scantlebury, 2000; Lee & Buxton, 2008; Lee & Luykx, 2007; Luykx & Lee, 2007; Sadler, Amirshokoohi, Kazempour, & Allspaw, 2006; Roth & Tobin, 2007).
Based on our experiences and perusal of literature, there are few classroom models of culturally relevant science (and mathematics) teaching. The lack of translation of cultural aspects of science to the classroom may be explained in part by the low priority placed on science in schools (Wood & Lewthwaite, 2008). Despite academic science literature to the contrary, the narrow definition of science education as the teaching of “facts” is quite commonin schools, coupled with a general absence of instruction and curriculum regarding the ways in which culturally and linguistically diverse students‟knowledge and experiences relate to science disciplines (Emdin, 2010; Lee & Luykx, 2005). As is typical in the academy, there is much theoretical talk about culturally relevant pedagogy, but few explicit classroom examples which help teachers envision possibilities and gain insight on ways to deepen their understanding of the complexities involved in the process. As one science educator recently queried, so how does culturally relevant teaching look in anactual classroom?
In this article, we share three examples of initial ventures by one of the authors1 into using culturally relevant science teaching as a viable possibility for bridging the distances between school instruction and ways of knowing and realities within the homes and communities of culturally diverse students. We focus specifically on African American students, but the general tenets can be extrapolated for other cultural groups as well. As African American professors, we find that many educators do not tend to think of African American students in cultural terms (Ladson-Billings, 2000). However, we recognize African Americans as a distinct cultural group which shares collective experiences and lived realities that extend across socioeconomic and geographical boundaries (Boykin, 1994; King, 2005; Ladson-Billings, 1999, 2000). While African
Vol. 12, No. 2 International Journal of Multicultural Education 2010
3
Americans hold multiple identities and are not monolithic, we also share collective memories, history, and contemporary realities that cannot be overlooked or disregarded.
Drawing from Martin‟s (2007) framework, three types of knowledge/skills are needed to teach African American students effectively: 1) deep content knowledge; 2) strong pedagogical content knowledge; and 3) strong culturally relevant pedagogy. The first two are frequently discussed and are not the focus of this article. Sharing concrete examples of culturally relevant science teaching is both a strength and caveat of this article. On the one hand, sample classroom examples can illuminate the process for teachers and help translate theory into practice. On the other hand, readers may overlook the complexities of the process and reduce it to “recipes” or activities. Our intent is to suggest general tenets for the process of changing the structure, assumptions, and nature of science teaching. Like the examples presented, it is not unusual for practitioners to begin the process by adding multicultural information and contributions of famous people into the existing curriculum. This article provides insights and guidance for practitioners who wish to deepen their efforts in using a culturally relevant pedagogical framework. We conclude that without centering issues of power, equity, and culture, efforts will remain superficial and will not likely address the intended long-term goals of reducing structural inequities in school and society (Castagno, 2009).
Culturally Relevant Pedagogy (CRP)
Culturally relevant pedagogy “empowers students intellectually, socially, emotionally, and politically by using cultural referents to impart knowledge, skills, and attitudes” (Ladson-Billings, 1994, p. 18). Teachers who practice culturally relevant teaching use cultural knowledge, prior experiences, frames of reference, and performance styles of culturally and linguistically diverse (CLD) students to make learning encounters more relevant to and effective for them (Bonner, 2009; Gay, 2000). Culturally relevant teaching focuses on: 1) academic excellence that is not based on cultural deficit models of school failure; 2) cultural competence which locates excellence within the context of the students‟ community and cultural identities; and 3) critical consciousness which challenges inequitable school and societal structures (Ladson-Billings, 2002). While many erroneously think that the main focus of culturally relevant teaching is solely on affirmation of CLD students, it should be stressed that academic achievement is a central goal of culturally relevant teaching. Unquestioningly, as students become culturally competent, their cultures are indeed affirmed (as is currently the norm for White students in most schools). However, culturally relevant teaching must result in student learning. Unlike most classrooms, culturally relevant classrooms do not devalue the cultural knowledge and worldviews of students of color. Students‟ learning is placed in a relevant context whilestudents also become more proficient at understanding their cultures. The critical consciousness/sociopolitical dimension of culturally relevant pedagogy offers a
Vol. 12, No. 2 International Journal of Multicultural Education 2010
4
critique to the notion that content knowledge and content pedagogical knowledge are neutral and “objective.” The cultural fingerprints of content knowledge andinstruction are made evident, critiqued, deconstructed, and reconstructed. Culturally relevant pedagogy (CRP) assumes that the way teachers teach profoundly impacts students‟ perceptions of the content of the curriculum (Ladson-Billings, 1994). Culturally relevant pedagogy can be eloquently summarized by Ellison (2008),
[I]f you can show me how I can cling to that which is real to me, whileteaching me a way into the larger society, then I will not only drop mydefenses and my hostility, but I will sing your praises and help you tomake the desert bear fruit [no pagination].
Culturally contextualized instruction holds the most promise for the academic success not only for students of color but for White students as well (Pritchy-Smith, 1998). In order to develop exemplary abilities in any content area, teachers must be able to link instruction to what is already familiar to their students. This may require teachers to engage in micro-ethnographies of sorts to develop an in-depth understanding of children‟s communities, families, leisure activities, and worldviews. Culturally relevant teaching includes not only learning about the lives of CLD students, but learning from them as well. Information learned about and from students can be used to transform classrooms into culturally relevant contexts.
Culturally Relevant Science Instruction
Culturally relevant teaching is congruent with the national science education standards (National Science Teachers Association, 2003) definition of scientific inquiry: "the diverse ways in which scientists study the natural world and propose explanations based on the evidence derived from their work” (National Research Council, 2000, p. 23). However, a key distinction between scientific inquiry and culturally relevant science is the degree of emphasis on sociopolitical and critical analyses. In the examples that we share, we explicitly make the point that conventional instruction, curriculum, and assessment will need to be rethought and reframed in culturally relevant classrooms.
Colombian ethnolinguist, Mario Edgar Hoyos, distinguishes between curriculum and curricula (M. E. Hoyos, personal communication, September 24, 2007). He defines curriculum as the “typical Eurocentric course of study and content that is thinly disguised as universal and classic. It is a universalistic, one-size-fits-all model” that is typically used in classrooms. Contrastingly, curricula are described as powerful and multiple possibilities, adaptations, modifications, and deconstructions of the former which allow for a broader, comprehensive, and more varied version of the former curriculum. In the case of the author‟s (CKJ) classroom, centering African and African American culture moves the narrowly defined curriculum to the status of curricula which is more inclusive. Like other scholars studying culturally relevant science (McKinley, Jones, & Castagno,
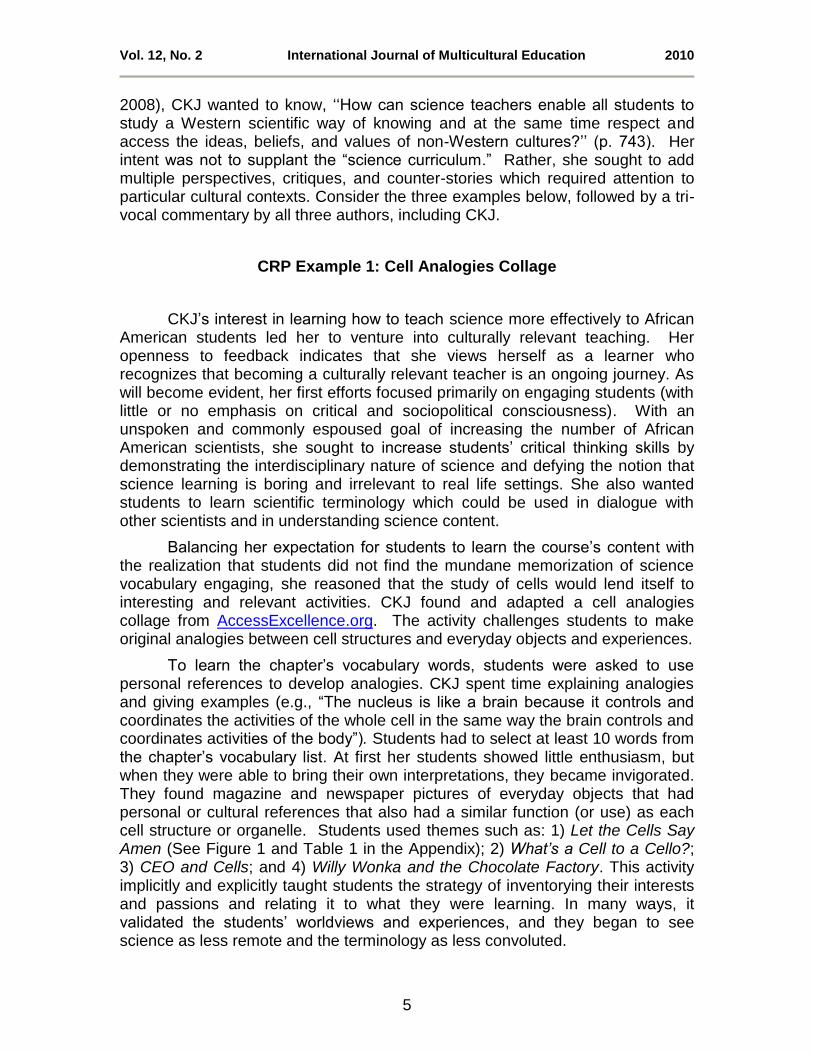
Vol. 12, No. 2 International Journal of Multicultural Education 2010
5
2008), CKJ wanted to know, „„How can science teachers enable all students tostudy a Western scientific way of knowing and at the same time respect and access the ideas, beliefs, and values of non-Western cultures?‟‟ (p. 743). Her intent was not to supplant the “science curriculum.” Rather, she sought to add multiple perspectives, critiques, and counter-stories which required attention to particular cultural contexts. Consider the three examples below, followed by a tri-vocal commentary by all three authors, including CKJ.
CRP Example 1: Cell Analogies Collage
CKJ‟s interest in learning how to teach science more effectively to African American students led her to venture into culturally relevant teaching. Her openness to feedback indicates that she views herself as a learner who recognizes that becoming a culturally relevant teacher is an ongoing journey. As will become evident, her first efforts focused primarily on engaging students (with little or no emphasis on critical and sociopolitical consciousness). With an unspoken and commonly espoused goal of increasing the number of African American scientists, she sought to increase students‟ critical thinking skills by demonstrating the interdisciplinary nature of science and defying the notion that science learning is boring and irrelevant to real life settings. She also wanted students to learn scientific terminology which could be used in dialogue with other scientists and in understanding science content.
Balancing her expectation for students to learn the course‟s content with the realization that students did not find the mundane memorization of science vocabulary engaging, she reasoned that the study of cells would lend itself to interesting and relevant activities. CKJ found and adapted a cell analogies collage from AccessExcellence.org. The activity challenges students to make original analogies between cell structures and everyday objects and experiences.
To learn the chapter‟s vocabulary words, students were asked to use personal references to develop analogies. CKJ spent time explaining analogies and giving examples (e.g., “The nucleus is like a brain because it controls andcoordinates the activities of the whole cell in the same way the brain controls and coordinates activities of the body”). Students had to select at least 10 words from the chapter‟s vocabulary list. At first her students showed little enthusiasm, but when they were able to bring their own interpretations, they became invigorated. They found magazine and newspaper pictures of everyday objects that had personal or cultural references that also had a similar function (or use) as each cell structure or organelle. Students used themes such as: 1) Let the Cells SayAmen (See Figure 1 and Table 1 in the Appendix); 2) What’s a Cell to a Cello?; 3) CEO and Cells; and 4) Willy Wonka and the Chocolate Factory. This activityimplicitly and explicitly taught students the strategy of inventorying their interestsand passions and relating it to what they were learning. In many ways, itvalidated the students‟ worldviews and experiences, and they began to seescience as less remote and the terminology as less convoluted.
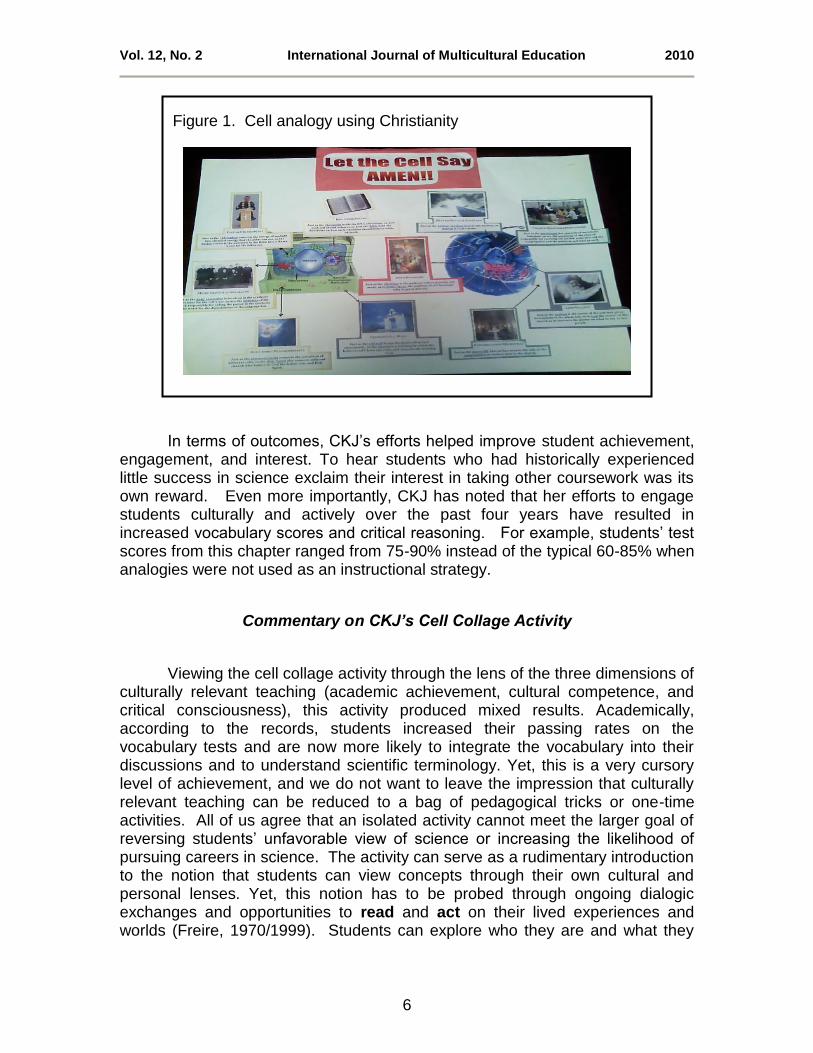
Vol. 12, No. 2 International Journal of Multicultural Education 2010
6
In terms of outcomes, CKJ‟s efforts helped improve student achievement, engagement, and interest. To hear students who had historically experienced little success in science exclaim their interest in taking other coursework was its own reward. Even more importantly, CKJ has noted that her efforts to engage students culturally and actively over the past four years have resulted in increased vocabulary scores and critical reasoning. For example, students‟ testscores from this chapter ranged from 75-90% instead of the typical 60-85% when analogies were not used as an instructional strategy.
Commentary on CKJ’s Cell Collage Activity
Viewing the cell collage activity through the lens of the three dimensions of culturally relevant teaching (academic achievement, cultural competence, and critical consciousness), this activity produced mixed results. Academically, according to the records, students increased their passing rates on the vocabulary tests and are now more likely to integrate the vocabulary into their discussions and to understand scientific terminology. Yet, this is a very cursory level of achievement, and we do not want to leave the impression that culturally relevant teaching can be reduced to a bag of pedagogical tricks or one-time activities. All of us agree that an isolated activity cannot meet the larger goal of reversing students‟ unfavorable view of science or increasing the likelihood ofpursuing careers in science. The activity can serve as a rudimentary introduction to the notion that students can view concepts through their own cultural and personal lenses. Yet, this notion has to be probed through ongoing dialogic exchanges and opportunities to read and act on their lived experiences and worlds (Freire, 1970/1999). Students can explore who they are and what they
Figure 1. Cell analogy using Christianity
Vol. 12, No. 2 International Journal of Multicultural Education 2010
7
already know and how this applies to science in their personal spaces. Importantly, they will need opportunities to examine whose ideologies, knowledge, and worldviews are represented in the content and standards and whose are not. We will discuss this later after examining all three activities. While CKJ does a series of interesting and engaging activities in her classroom, they are loosely connected and would benefit from a cohesive, culturally relevant pedagogical framework which extends beyond definitions of academic achievement that are narrowly defined by mastery of the chapter‟s vocabulary.
So what about increasing the students‟ cultural competence? Many African American students have had little or no exposure to information regarding scientists in the African diaspora. Whenever possible, CKJ provides powerful counter-narratives by using scientists of color (and females) so that students understand that science is not the purview of White men and also learn of strong science legacies among people of the African disapora. A caveat is that cultural information presented should not be fragmented, presented on the periphery of the unit, or glossed over (Boutte, 1999). A good place to start is to explore scientific funds of knowledge in students‟ own communities and spaces.
Discussion on cells can include the work of scientists like Dr. Ernest Just (Black Inventor, 2010; Hayden, 1970) whose work has not been amplified in most science books. Dr. Just sought to understand the world of the cell and sought to find "truth" using scientific methods and inquiry, challenging the theories of leading biologists of the 19th and 20th centuries. His scholarship contributed to scientific understanding of the process of artificial parthenogenesis and the physiology of cell development.
Culturally relevant pedagogy should not be narrowly defined as teaching only within the classroom setting, but should keep larger global perspectives and relevance to real world events as important considerations. Students who are faced with daily inequities are likely to identify Dr. Just‟s experiences with racismand prejudice which ultimately led him to leave the United States and study in Europe in 1930. Comparisons and contrasts between various eras can also be discussed.
Dialogue regarding the different epistemological stances and the idea of “truth” can be critically explored. Doing so will require CKJ and other science educators to suspend the typical covering of topics to the uncovering of multiple perspectives. Yet, given the realities of classrooms, educators often fear that dialogues of interrelated issues not included in the standards will detract from student learning. In CKJ‟s case, we can see that this was not the case and the academic outcomes of students were increased. More importantly, students actually liked CKJ‟s classes and enjoyed learning about science.
As CKJ continues to develop her culturally relevant pedagogical skills, she can begin to help students increase their sense of agency as scientists. This can lead to inquiry efforts which address ethnoscientific problems in their communities and in the world, such as investigating the relationship of zinc levels and prostate cancer in African American males. CKJ may also consider using
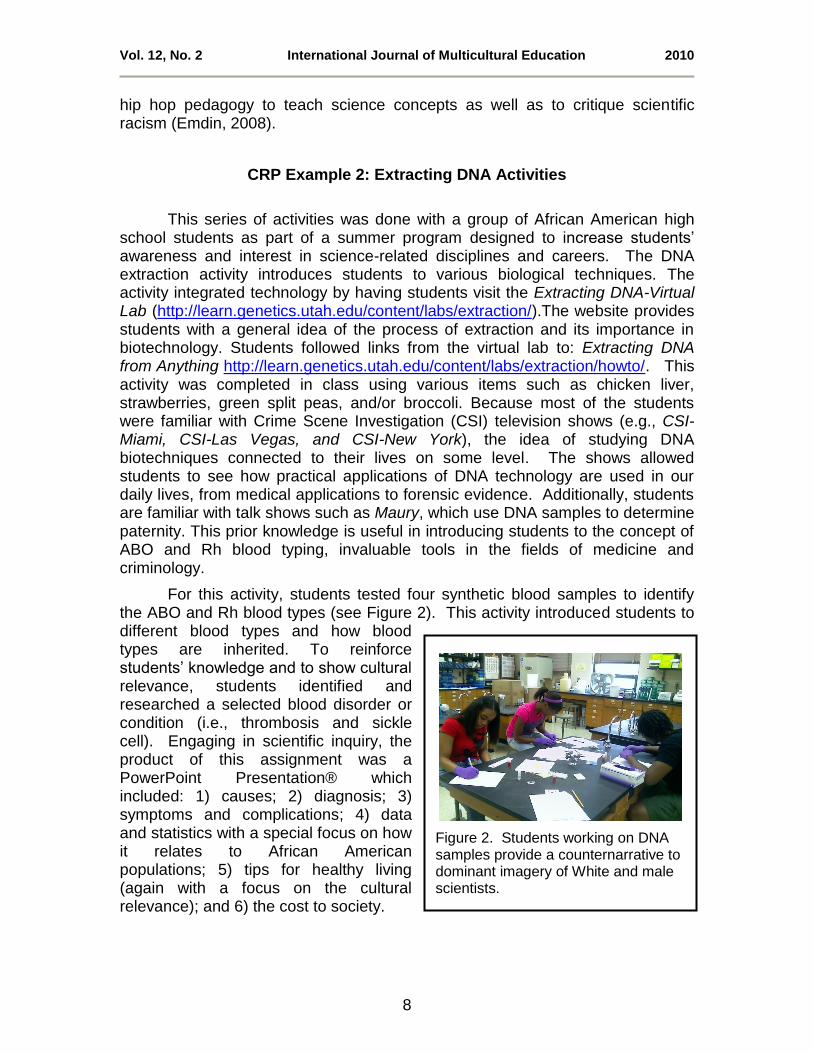
Vol. 12, No. 2 International Journal of Multicultural Education 2010
8
Figure 2. Students working on DNA samples provide a counternarrative to dominant imagery of White and male scientists.
hip hop pedagogy to teach science concepts as well as to critique scientific racism (Emdin, 2008).
CRP Example 2: Extracting DNA Activities
This series of activities was done with a group of African American high school students as part of a summer program designed to increase students‟awareness and interest in science-related disciplines and careers. The DNA extraction activity introduces students to various biological techniques. The activity integrated technology by having students visit the Extracting DNA-VirtualLab (http://learn.genetics.utah.edu/content/labs/extraction/).The website provides students with a general idea of the process of extraction and its importance in biotechnology. Students followed links from the virtual lab to: Extracting DNAfrom Anything http://learn.genetics.utah.edu/content/labs/extraction/howto/. This activity was completed in class using various items such as chicken liver, strawberries, green split peas, and/or broccoli. Because most of the students were familiar with Crime Scene Investigation (CSI) television shows (e.g., CSI-Miami, CSI-Las Vegas, and CSI-New York), the idea of studying DNA biotechniques connected to their lives on some level. The shows allowed students to see how practical applications of DNA technology are used in our daily lives, from medical applications to forensic evidence. Additionally, students are familiar with talk shows such as Maury, which use DNA samples to determine paternity. This prior knowledge is useful in introducing students to the concept of ABO and Rh blood typing, invaluable tools in the fields of medicine and criminology.
For this activity, students tested four synthetic blood samples to identify the ABO and Rh blood types (see Figure 2). This activity introduced students to different blood types and how blood types are inherited. To reinforce students‟ knowledge and to show cultural relevance, students identified and researched a selected blood disorder or condition (i.e., thrombosis and sickle cell). Engaging in scientific inquiry, the product of this assignment was a PowerPoint Presentation® which included: 1) causes; 2) diagnosis; 3) symptoms and complications; 4) data and statistics with a special focus on how it relates to African American populations; 5) tips for healthy living (again with a focus on the cultural relevance); and 6) the cost to society.
Vol. 12, No. 2 International Journal of Multicultural Education 2010
9
Commentary on DNA Activities
Typical for initial ventures into culturally relevant teaching, an underlying subtext of the activity is for students to have “fun” and to be actively engaged. Some aspects of all three dimensions of CRP are evident but can be prodded.
This unit yields itself to the possibility of investigating genealogy studies that are being conducted by The National Geographic (2010) researchers and others who collect mitochondrial DNA and/or Y chromosomes. This can lead to very complex dialogues of genetics and history (e.g., how African Americans genealogies were affected by the trans-Atlantic slave trade and related ethical issues). Opening up such possibilities could lead young scientists (students) to pursue efforts which may be useful one day in providing African Americans with more information about their African lineage which was systematically destroyed during the slave trade.
A critique of Nobel Prize winner James Watson‟s scientific work in light of his recent racist statements about Africans and Blacks being intellectually inferior (Boston Globe, 2007) could also be reexamined regarding the role that his beliefs may have played in research questions and conclusions. A dialogue on the topic helps make “scientists” less remote and also allows for examination of the relationship to research, questions posed, methods used, and biases. Seeing science as a human and cultural construction is key.
Charles Drew‟s (Black Inventor, 2010; Lonesome & Huggins, 1990; Love & Franklin, 1997; Whitehurst, 2001) discoveries relating to the preservation of blood could serve as a counternarrative to discussing only White scientists. By separating the liquid red blood cells from the near solid plasma and freezing the two separately, Drew found that blood could be preserved and reconstituted at a later date. His system for the storing of blood plasma (blood bank) revolutionized the medical profession. He also established the American Red Cross blood bank, of which he was the first director, and he organized the world's first blood bank drive, nicknamed "Blood for Britain.”
Sociopolitically, students can discuss the controversy surrounding Dr. Drew‟s death. While driving to a science convention, he fell asleep and was seriously injured in rural North Carolina. In 1950, in the South, Dr. Drew was not admitted to an “all-White” hospital. Students can research the details of hisdeath to determine the role that racism played. Some sources indicate that Dr. Drew needed a transfusion and was denied one; others disagree and said that he was not admitted to the White hospital, but was admitted to a “mixed-race”medical facility (Black Inventor/Drew, 2010). Dialogue, inquiry, and critical analyses on this topic position students as teachers/learners, which is the hallmark of culturally relevant science teaching. It also connects science to other disciplines such as history in this case and can propel students to take reflective action to address global problems in their communities and in society.
Vol. 12, No. 2 International Journal of Multicultural Education 2010
10
CPR Example 3: Integumentary System Unit
CKJ was able to see numerous possibilities for making the study of the integumentary system accessible to her university freshmen biology students. Given the sociopolitical nature of skin color, studying the integumentary system lends itself to a discussion of melanin (different levels of melanin by racial groups, skin tones, and benefits).
Since science is conceived as a socially and culturally constructed discipline, the inclusion of non-Western, indigenous, or other racial/ethnic traditions of knowing is important in culturally relevant science classrooms (Lee & Buxton, 2008). For example, CKJ‟s discussion of skin and hair led to the discussion of Madame C. J. Walker‟s (2010) development of Black hair products as well as the politics of Black hair. Chemical names of specific hair dressings, the impact that chemicals have on hair, as well as the safety and potential dangers of inadequate testing can be included. Even in racially integrated classes, through scientific inquiry students can examine their own personal hair/skin care products including testing, marketing, and ingredients for different types of skin and hair. While African American students can certainly serve as experts and informants on Black hair, educators will also need to spend some time studying Black hair in order to present information in a culturally informed manner.
It is important to note that in culturally relevant classrooms, conventional methods and assessments may be used when appropriate. For example, CKJ consulted the following website, and students tackled mini and mega quizzes on the topic: http://www.zoology.ubc.ca/~biomania/tutorial/skin/outline.htm. In this example, not only did this unit allow students to understand the basics of the integumentary system as one of our body‟s systems, but they were able to connect the concepts to their daily living experiences and worldviews as well.
Many students were excited to learn more about Madame C. J. Walker (Altman, 1997) and realized that she played a role in their learning about science and science ethics. Most of the students surmised that Ms. Walker tested her products either on herself or family and friends and understood that her products were not tested to the extent products are tested today. The healthy discourse students had about product testing was refreshing, especially as they discussed their homemade hair/skin care products. In the end, students had a better understanding about skin and hair and the ethics and safety of product testing. They also were able to see how culture is related to modern day science, which was the underlining goal of the unit.
Vol. 12, No. 2 International Journal of Multicultural Education 2010
11
Commentary on Integumentary System
As in the first two activities, CKJ uses the textbook curriculum as the main source of ideas so that she can address the course‟s objectives. Yet, as she thinks about Hoya‟s conception of curricula, she understands that the unit can be revisioned based on students‟ interests. At some point, CKJ may allow students to peruse the syllabus and textbook to determine particular areas of interest that they can engage in in-depth study. Small group inquiries into subjects may help students start to transform the view of science as a pre-set and non-dynamic subject. Allowing them to engage in “scientific processes” (notnecessarily standard processes) will be an important part of capturing students‟ voices and promoting critical consciousness. Here students can learn that many worldviews can and do co-exist. That is, they can come to understand that the textbook is one of many ways of knowing and that theirs may be another epistemology. Hence, they can become proficient in the “mandated” way of knowing alongside their cultural ideas, beliefs, and values (McKinley, Jones, & Castagno, 2008). From a critical point of view, contradictions between various epistemologies do not have to be reconciled. The following section suggests sample topics that may stimulate provocative dialogue and research by students and teachers. The topics are difficult and educators should be willing to position themselves as learners since addressing many of the issues will require consulting several sources and a willingness to accept non-resolution as a possibility for future study.
Problematizing Science as “Factual” and Uncovering Scientific Racism
Probably the most difficult and surprising revelation for teachers and teacher educators who do this culturally relevant pedagogical (CRP) work is that they have to move beyond the typical neutral, apolitical stance in science and actively address oppression. This dimension is more than many teachers bargain for or are ready to address. Yet, without doing so, hegemonic principles and Eurocentric knowledge and ways of knowing are unintentionally privileged and reinforced.
In culturally relevant science classrooms, the assumption is that science involves inquiring into one‟s own world. Hence, science content is not decontextualized from students‟ and teachers‟ everyday experiences. Overall, CKJ‟s activities and engagements sought to tap into students‟ interests; however, a key part of culturally relevant pedagogy (CRP) is addressing power relations. Because science, like other subjects, is cultural (Lee & Buxton, 2008), inevitably the way that we think about science in the United States reinforces existing power relations in society. That is, Western and European knowledge is privileged in textbooks and classrooms (Barton, Ermer, Burkett, & Osborne, 2003; Davis & Martin, 2008; Ryan, 2008). This CRP framework lends itself to
Vol. 12, No. 2 International Journal of Multicultural Education 2010
12
potentially interesting discussions and inquiries in classrooms regarding why the worldviews of some groups are marginalized and devalued. It gives educators a chance to reexamine science content and to problematize the widespread Eurocentric bias in the production and evaluation of scientific knowledge (Davis & Martin, 2008; Gould, 1981; Joseph, 1987). Difficult sociopolitical concepts like scientific racism can be explored, and students and teachers can begin to uncover inaccurate and incomplete information in the science literature.
“Scientific racism can be defined as the use of scientific methods to support and validate racist beliefs about African Americans and other groups‟[sic] based on the existence and significance of racial categories that form a hierarchy of races that support political and ideological positions of white supremacy” (Davis & Martin, 2008, p. 14).
Many students of color recognize the existence of scientific racism even if it is not overtly named by them. This tacit and/or cultural knowledge may manifest itself as resistance to science as is currently taught (Boutte, 2002; Kohl, 2007). Notwithstanding, science educators will need preparation for leading discussions on scientific racism and other sociopolitical realties. Admittedly, this dimension of culturally relevant teaching is typically not addressed because of educators‟ discomfort and/or little preparation. CRP is openly political whereas conventional teaching is not. Helping educators see the political nature of conventional teaching which privileges Eurocentric culture and positivist epistemologies is a formidable task.
To illustrate the Eurocentric nature of science, consider the typical “linear” steps for the “scientific method” as a framework for investigating the natural world. “Within this tradition, Jean Lamark is credited with discovering a theory of evolution, Watson and Crick discovered the structure of the DNA molecule, and Boyle discovered gas laws” (Barba, 1995, p. 56).
The step-driven scientific method is presented as a single way of investigating the world rather than as open to multifaceted possibilities (Boutte, 1999). According to this line of reasoning, if a scientist or group of people does not follow the step formula, the results are typically not considered “scientific.”Yet, for thousands of years, Native Americans of the Southwestern United States, South America, and Central America have cultivated corn. Each year the biggest and best ears of corn were saved by the harvesters and used as seeds the following year. The tradition of sowing only genetically superior seeds resulted in the improvement of corn from stubby little weeds into the current version of well-formed ears of corn (Barba, 1995).
In this example, Native Americans followed a scientific process (identified the problem, collected information about which ears of corn were the best, formed the hypothesis that planting the biggest seeds would result in an improved plant, conducted experiments in plant growth for thousands of years, and passed on the findings orally to their children). However, Native Americans are not viewed as the founders of genetics research because they did not keep written records of their research or present findings for peer review in the
Vol. 12, No. 2 International Journal of Multicultural Education 2010
13
“scientific” community. Credit for the discovery of genetics research is given to Gregor Mendel in many science textbooks. Sociopolitically, culturally relevant teaching would question whether Mendel alone discovered genetics research and would explore evidence of others who had previously discovered this. A Eurocentric view of science which insists on keeping copious notes, writing reports and the like, dismisses and overlooks the research of generations of Native Americans (Barba, 1995). Here it becomes obvious that science is not “objective,” “neutral,” or “factual.” Like all disciplines, it represents the worldviewsof the writers of the (science) texts. Why would a Native American or other student of color find this version of science credible, especially when Eurocentric worldviews dominate the texts and discounts other versions?
Current science content which is dominated by discoveries attributed to White males also omits contributions from women whose work was frequently claimed by White male colleagues or husbands (Barba, 1995; Ryan, 2008). There are numerous other examples beyond the scope of this article: Onesimus, an African American slave who shared information from Africa with his master about the smallpox vaccine; Maria Aimee Lullin‟s discoveries regarding honeybees published under her husband‟s name, Francois Huber; Rosalind Franklin‟s contribution to the discovery of Deoxyribonucleic Acid (DNA) being credited to the works of only Watson and Crick; countless unrecorded instances which demonstrate how scientific contributions of women and people of color were deliberately omitted from “scientific” records and false information conveyed to generations of students. Dialogue on such topics reframes science from being static to dynamic and intimates that as more accurate and complete information is uncovered the knowledge base in science should reflect these changes (Kuhn, 1996). Additionally, students can start to look for examples of science in their everyday occurrences.
Traditionally, science content has focused on “received” knowledge whichis dominated by Eurocentric thought. Hence, the focus has too often been on giving the right answer versus problem solving and problem posing (Freire, 1970/1999). Culturally relevant pedagogy acknowledges that the history of science and science teaching has been oversimplified. Hence, it seeks to explore science from various ages and civilizations throughout human history.
Given the backdrop of “traditional” approaches, culturally relevant science aims to include voices and worldviews that have been silenced and excluded from the curriculum (Barton, Ermer, Burkett, & Osborne, 2003; Keane, 2008; Mckinley, Brayboy, & Castagno, 2008; Ryan, 2008). This does not mean negating or excluding information from Eurocentric or Western worldviews, but it does mean substantively including other worldviews as opposed to occasional or fragmented instances. Without culturally relevant science approaches, not only will a variety of worldviews be omitted, but existing hegemonic power structures will be reinforced (Ryan, 2008). From a critically conscious perspective, students will move beyond false binaries, dualistic and/or essentialist views which suggest that there is one way of knowing science (Fleer, 2008). Hence, when they come to understand that science is also about people‟s relationships to others and to
Vol. 12, No. 2 International Journal of Multicultural Education 2010
14
the phenomenal world, many perspectives (even contradictory or oppositional ones) can co-exist (Fleer, 2008; Keane, 2008). Conceptually, culturally relevant science defies the assertion that there is a singular or normative scientific worldview. It recognizes that there is a wide range of scientific skills and ways of knowing that people display in their lived experiences within diverse communities.
Pedagogically, Fleer (2008) recommends that teachers use a “double move” approach in which they have in mind the everyday practices, traditions, or concepts of their students as well as the Western scientific concept(s) that they want students to acquire. “Having both in mind (double move) allows teachers to be respectful and mindful of the practice traditions, whilst at the same time seeking pedagogical ways of giving more meaning to Western scientific concepts” (Fleer, 2008, p. 785).
It is particularly important for science educators to rethink their approaches for teaching science since many students consider it irrelevant to their lives (Barba, 1995; Boutte, 1999; Lee & Buxton, 2008). Additionally, females and students of color (with the exception of Asian Americans as a group) tend to do less well than White males in science (Boutte, 1999). While no cultural group is monolithic, the inclusion of culturally syntonic considerations for diverse learners is suggested. That is, attention should be given to see if the instruction, curriculum, and assessments are attuned to the students‟ cultural worldviews. Culturally syntonic examples can include making sure that the imagery in textbooks and classrooms reflect the students, the use of culturally familiar role models, or classroom activities which build on the communication strengths of the students: e.g., oral tradition for African American students (Barba, 1995; Lee & Luykx, 2005).
Conclusion
It is commendable that educators like CKJ have the presence of mind and commitment to believe that high achievement is possible for African American students. The expectation that educators will be able to transform their classrooms overnight is unreasonable and unfeasible. It is important to recognize the hugeness and complexity of what educators on the frontline are up against: the status quo which has built-in reinforcements to protect itself. So we applaud CKJ‟s efforts while acknowledging that she must delve deeper and be vigilant about addressing issues of equity, power, and culture. Currently, she is focusing narrowly on individual activities which primarily emanate from the textbook.
Since culturally relevant teaching is a bridge to mainstream and other ways of knowing, not all activities/lessons included in classes are expected to focus only on students‟ respective cultural groups. Understanding students and developing strong relationships and respect is foundational to the process (Bonner, 2009). We have tried to capture a deep sense of centering culture, politics, and achievement in classrooms for culturally and linguistically diverse
Vol. 12, No. 2 International Journal of Multicultural Education 2010
15
students. One goal is to find ways to normalize high achievement for African American students so that they will realize and regain their historical legacies of achieving. To do so requires becoming familiar with the context, students, and their cultures. Often additional reading will be necessary, as well as deconstructing, reconstructing, and reframing science teaching to African American and other culturally and linguistically diverse students. Educators will need to engage in an ongoing process of countering pervasive and long-held disbeliefs that African American students are scientifically brilliant and capable. While our focus has been on African American students (whom we do not consider to be monolithic, by the way), the same process is required for other cultural groups. Educators will need to be well-versed in the academic literature and ethnographic information about the centrality of culture in teaching and learning. Attention will need to be given to the educational, social, and political implications of our role as educators in privileging the work and worldviews of White male scientists in classroom instruction and curriculum.
In the process, educators may need to reposition themselves as teachers and learners (Freire, 1970/1999) and view students as a source of information, letting them research topics. Community members and others are also sources of wisdom (Boutte & Hill, 2006). Collaboration with other science educators will likely make the process more interesting and insightful as well as less threatening. Like scientific inquiry, the process of culturally relevant teaching is a dynamic and ongoing process. Educators will need to remain open to refining and transforming their thinking. Culturally relevant teaching is a continuous quest, not a destination. It is hoped that teachers engage in culturally relevant pedagogy not solely to reduce the “achievement gap” or as a trend, but becauseit is an ethical and educational imperative that all students be effectively taught in light of pervasive and persistent educational trends.
Note
1. We will refer to the author by her initials (CKJ) throughout the article.
References
Altman, S. (1997). The encyclopedia of African American heritage. New York: Facts on File.
Barba, R. H. (1995). Science in the multicultural classroom: A guide to teachingand learning. Boston: Allyn & Bacon.
Barton, A. C., Ermer, M. L., Burkett, T. A., & Osborne, M. D. (2003). Teachingscience for social justice. New York: Teachers College Press.
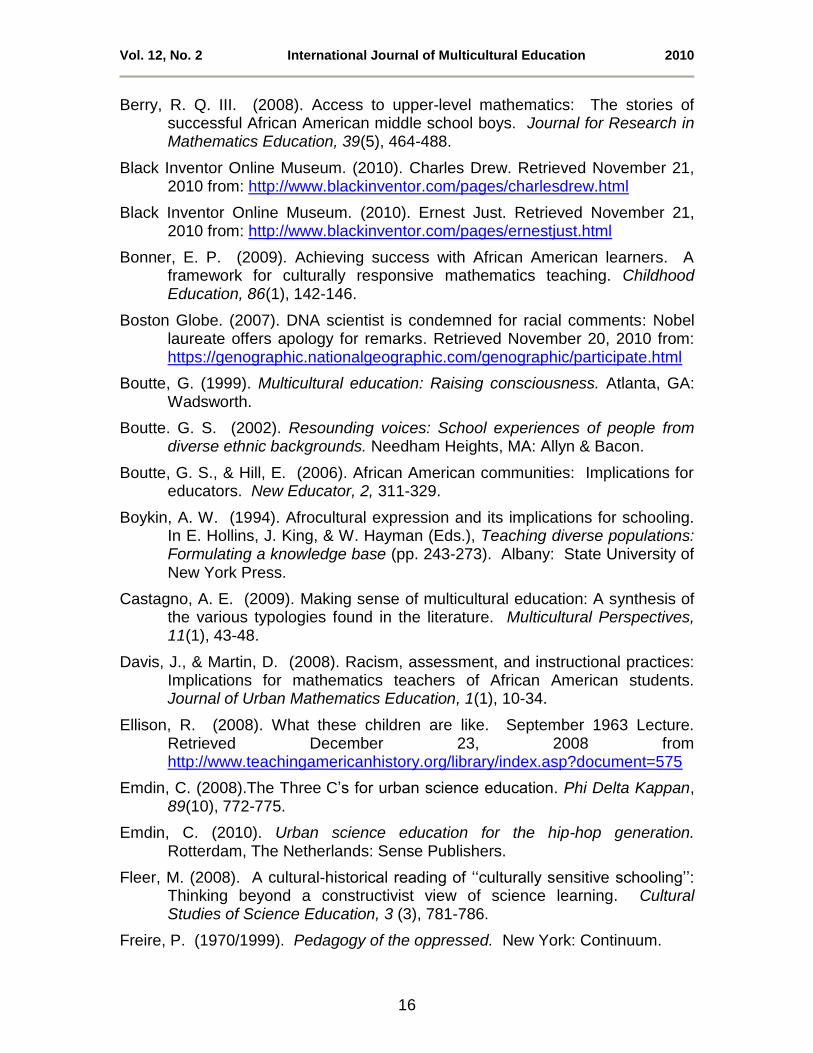
Vol. 12, No. 2 International Journal of Multicultural Education 2010
16
Berry, R. Q. III. (2008). Access to upper-level mathematics: The stories of successful African American middle school boys. Journal for Research inMathematics Education, 39(5), 464-488.
Black Inventor Online Museum. (2010). Charles Drew. Retrieved November 21, 2010 from: http://www.blackinventor.com/pages/charlesdrew.html
Black Inventor Online Museum. (2010). Ernest Just. Retrieved November 21, 2010 from: http://www.blackinventor.com/pages/ernestjust.html
Bonner, E. P. (2009). Achieving success with African American learners. A framework for culturally responsive mathematics teaching. ChildhoodEducation, 86(1), 142-146.
Boston Globe. (2007). DNA scientist is condemned for racial comments: Nobel laureate offers apology for remarks. Retrieved November 20, 2010 from: https://genographic.nationalgeographic.com/genographic/participate.html
Boutte, G. (1999). Multicultural education: Raising consciousness. Atlanta, GA: Wadsworth.
Boutte. G. S. (2002). Resounding voices: School experiences of people fromdiverse ethnic backgrounds. Needham Heights, MA: Allyn & Bacon.
Boutte, G. S., & Hill, E. (2006). African American communities: Implications for educators. New Educator, 2, 311-329.
Boykin, A. W. (1994). Afrocultural expression and its implications for schooling. In E. Hollins, J. King, & W. Hayman (Eds.), Teaching diverse populations:Formulating a knowledge base (pp. 243-273). Albany: State University of New York Press.
Castagno, A. E. (2009). Making sense of multicultural education: A synthesis of the various typologies found in the literature. Multicultural Perspectives,11(1), 43-48.
Davis, J., & Martin, D. (2008). Racism, assessment, and instructional practices: Implications for mathematics teachers of African American students. Journal of Urban Mathematics Education, 1(1), 10-34.
Ellison, R. (2008). What these children are like. September 1963 Lecture. Retrieved December 23, 2008 from http://www.teachingamericanhistory.org/library/index.asp?document=575
Emdin, C. (2008).The Three C‟s for urban science education. Phi Delta Kappan, 89(10), 772-775.
Emdin, C. (2010). Urban science education for the hip-hop generation. Rotterdam, The Netherlands: Sense Publishers.
Fleer, M. (2008). A cultural-historical reading of „„culturally sensitive schooling‟‟:Thinking beyond a constructivist view of science learning. CulturalStudies of Science Education, 3 (3), 781-786.
Freire, P. (1970/1999). Pedagogy of the oppressed. New York: Continuum.
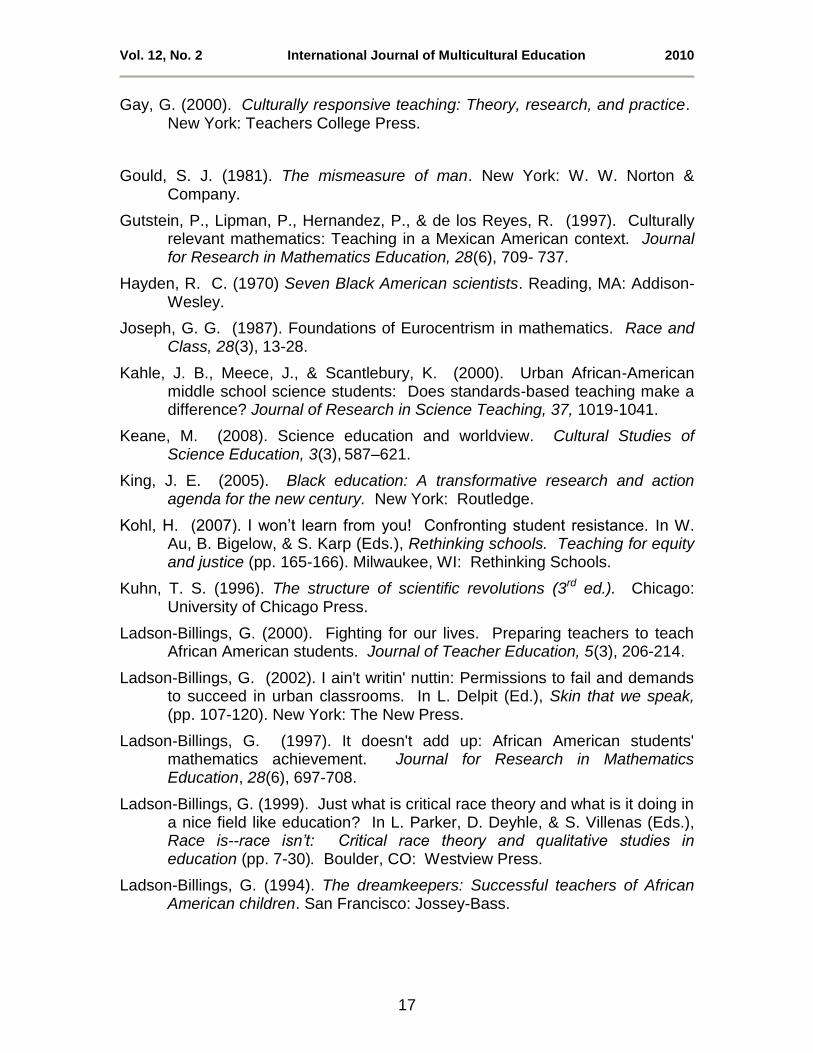
Vol. 12, No. 2 International Journal of Multicultural Education 2010
17
Gay, G. (2000). Culturally responsive teaching: Theory, research, and practice. New York: Teachers College Press.
Gould, S. J. (1981). The mismeasure of man. New York: W. W. Norton & Company.
Gutstein, P., Lipman, P., Hernandez, P., & de los Reyes, R. (1997). Culturally relevant mathematics: Teaching in a Mexican American context. Journalfor Research in Mathematics Education, 28(6), 709- 737.
Hayden, R. C. (1970) Seven Black American scientists. Reading, MA: Addison-Wesley.
Joseph, G. G. (1987). Foundations of Eurocentrism in mathematics. Race andClass, 28(3), 13-28.
Kahle, J. B., Meece, J., & Scantlebury, K. (2000). Urban African-American middle school science students: Does standards-based teaching make a difference? Journal of Research in Science Teaching, 37, 1019-1041.
Keane, M. (2008). Science education and worldview. Cultural Studies ofScience Education, 3(3), 587–621.
King, J. E. (2005). Black education: A transformative research and actionagenda for the new century. New York: Routledge.
Kohl, H. (2007). I won‟t learn from you! Confronting student resistance. In W. Au, B. Bigelow, & S. Karp (Eds.), Rethinking schools. Teaching for equityand justice (pp. 165-166). Milwaukee, WI: Rethinking Schools.
Kuhn, T. S. (1996). The structure of scientific revolutions (3rd ed.). Chicago: University of Chicago Press.
Ladson-Billings, G. (2000). Fighting for our lives. Preparing teachers to teach African American students. Journal of Teacher Education, 5(3), 206-214.
Ladson-Billings, G. (2002). I ain't writin' nuttin: Permissions to fail and demands to succeed in urban classrooms. In L. Delpit (Ed.), Skin that we speak,(pp. 107-120). New York: The New Press.
Ladson-Billings, G. (1997). It doesn't add up: African American students' mathematics achievement. Journal for Research in MathematicsEducation, 28(6), 697-708.
Ladson-Billings, G. (1999). Just what is critical race theory and what is it doing in a nice field like education? In L. Parker, D. Deyhle, & S. Villenas (Eds.), Race is--race isn’t: Critical race theory and qualitative studies in education (pp. 7-30). Boulder, CO: Westview Press.
Ladson-Billings, G. (1994). The dreamkeepers: Successful teachers of AfricanAmerican children. San Francisco: Jossey-Bass.
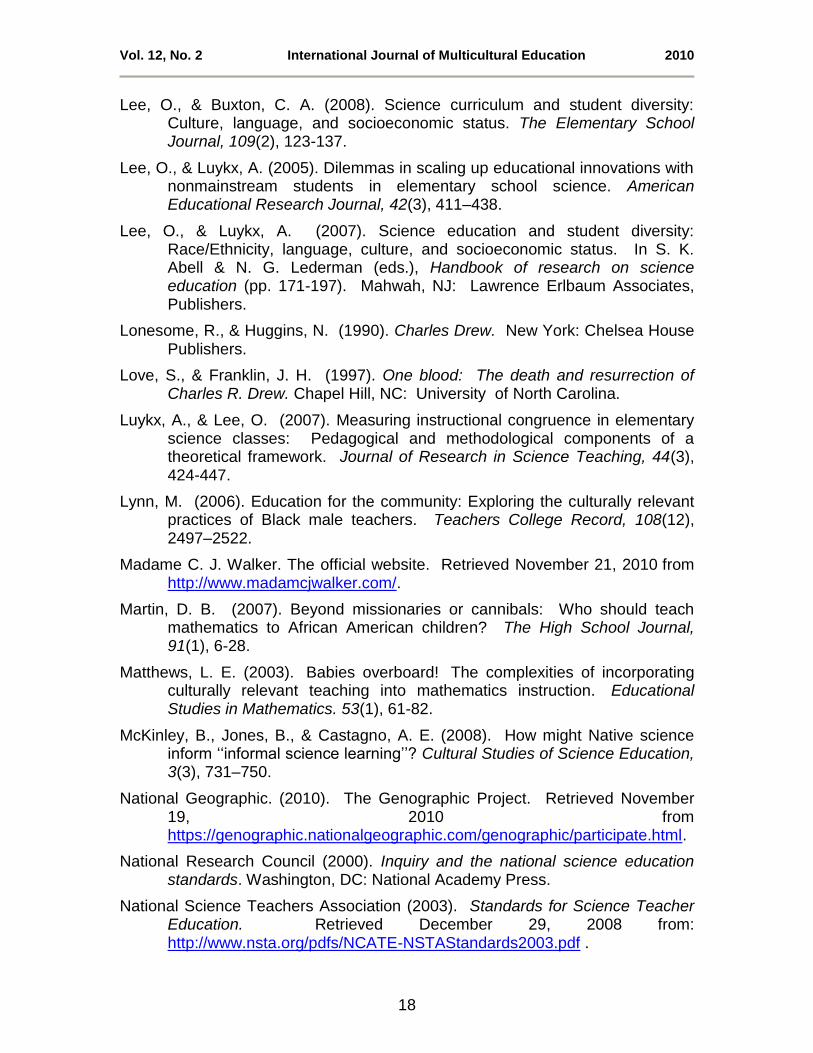
Vol. 12, No. 2 International Journal of Multicultural Education 2010
18
Lee, O., & Buxton, C. A. (2008). Science curriculum and student diversity: Culture, language, and socioeconomic status. The Elementary SchoolJournal, 109(2), 123-137.
Lee, O., & Luykx, A. (2005). Dilemmas in scaling up educational innovations with nonmainstream students in elementary school science. AmericanEducational Research Journal, 42(3), 411–438.
Lee, O., & Luykx, A. (2007). Science education and student diversity: Race/Ethnicity, language, culture, and socioeconomic status. In S. K. Abell & N. G. Lederman (eds.), Handbook of research on scienceeducation (pp. 171-197). Mahwah, NJ: Lawrence Erlbaum Associates, Publishers.
Lonesome, R., & Huggins, N. (1990). Charles Drew. New York: Chelsea House Publishers.
Love, S., & Franklin, J. H. (1997). One blood: The death and resurrection ofCharles R. Drew. Chapel Hill, NC: University of North Carolina.
Luykx, A., & Lee, O. (2007). Measuring instructional congruence in elementary science classes: Pedagogical and methodological components of a theoretical framework. Journal of Research in Science Teaching, 44(3), 424-447.
Lynn, M. (2006). Education for the community: Exploring the culturally relevant practices of Black male teachers. Teachers College Record, 108(12), 2497–2522.
Madame C. J. Walker. The official website. Retrieved November 21, 2010 from http://www.madamcjwalker.com/.
Martin, D. B. (2007). Beyond missionaries or cannibals: Who should teach mathematics to African American children? The High School Journal,91(1), 6-28.
Matthews, L. E. (2003). Babies overboard! The complexities of incorporating culturally relevant teaching into mathematics instruction. EducationalStudies in Mathematics. 53(1), 61-82.
McKinley, B., Jones, B., & Castagno, A. E. (2008). How might Native science inform „„informal science learning‟‟? Cultural Studies of Science Education, 3(3), 731–750.
National Geographic. (2010). The Genographic Project. Retrieved November 19, 2010 from https://genographic.nationalgeographic.com/genographic/participate.html.
National Research Council (2000). Inquiry and the national science educationstandards. Washington, DC: National Academy Press.
National Science Teachers Association (2003). Standards for Science TeacherEducation. Retrieved December 29, 2008 from: http://www.nsta.org/pdfs/NCATE-NSTAStandards2003.pdf .
Vol. 12, No. 2 International Journal of Multicultural Education 2010
19
Pritchy Smith, G. (1998). Common sense about uncommon knowledge: Theknowledge bases for diversity. Washington, DC: AACTE.
Roth, W-M., & Tobin, K. (Eds). (2007). Science, learning, and identity:Sociocultural and cultural-historical perspectives. Rotterdam, TheNetherlands: Sense Publishing.
Rousseau, C., & Tate, W. F. (2003). No time like the present: Reflecting onequity in school mathematics. Theory into Practice, 42(3), 210-216.
Ryan, A. (2008). Indigenous knowledge in the science curriculum: Avoiding neo-colonialism. Cultural Studies of Science Education, 3(3), 663–702.
Sadler, T. D., Amirshokoohi, A., Kazempour, M., & Allspaw, K. M. (2006).Socioscience and ethics in science classrooms: Teacher perspectives andstrategies. Journal of Research in Science Teaching, 43(4), 353-376.
Tate, W. F. (1995). Returning to the root: A culturally relevant approach tomathematics pedagogy. Theory into Practice, 34(3) 166-173.
Whitehurst, S. (2001). Dr. Charles Drew, Medical pioneer. Makato, MN: Child‟sWorld.
Wood, A., & Lewthwaite, B. (2008). Māori science education in Aotearoa NewZealand. Cultural Studies of Science Education, 3(3), 625-662.
Vol. 12, No. 2 International Journal of Multicultural Education 2010
20
Appendix
Table 1. “Let The Cell Say Amen”: A student project for the Cell AnalogiesCollage assignment that used Christianity analogies
1. Chloroplast=Pastor: the chloroplast converts energy of sunlight intochemical energy that the plant can use as the pastor converts thenutrients in the Bible into a Rama word for the followers
2. Chromatin=Bible: the chromatin holds the DNA (directions on how eachcell should behave) as the Bible holds the directions on how eachChristian should behave while on earth
3. Nucleus=God: the nucleus is the center of the cell that gives instructionsto the whole cell as God is the center of the church as he instructs thepastor on what to say to his people
4. Cell Wall=Church: the cell wall keeps the plant cell intact structurally asthe church is a building where the believers of Christ can come andstructurally worship God.
5. Microvilli=Congregation: the microvilli add surface area to the cell as thecongregation adds surface area to the church.
6. Golgi Apparatus=Ministers: the golgi apparatus is involved in the synthesisof proteins for the cell's use as ministers of the church are responsible foraiding the pastor in the synthesis of the word for the digestion/use of thecongregation.
7. Plasmodesmata=Holy Spirit: the plasmodesmata connects the cytoplasmof different cells as the Holy Spirit connect different churches who believein God, the father, son, and Holy Spirit
8. Ribosome=Jesus: the ribosome is the pathway where proteins are madeas Jesus Christ is the pathway that Christians take to get to heaven
9. Nuclear Envelope=Heaven: the nuclear envelope houses the nucleus asheaven is God‟s home
10. Peroxisome=Church Ministries: the peroxisome has specialized metabolicfunctions, as the ministries of the church are responsible for carrying outcertain tasks that aid the congregation and the pastor in spiritual growth.
Copyright of International Journal of Multicultural Education is the property of International Journal of
Multicultural Education (IJME) and its content may not be copied or emailed to multiple sites or posted to a
listserv without the copyright holder's express written permission. However, users may print, download, or
email articles for individual use.
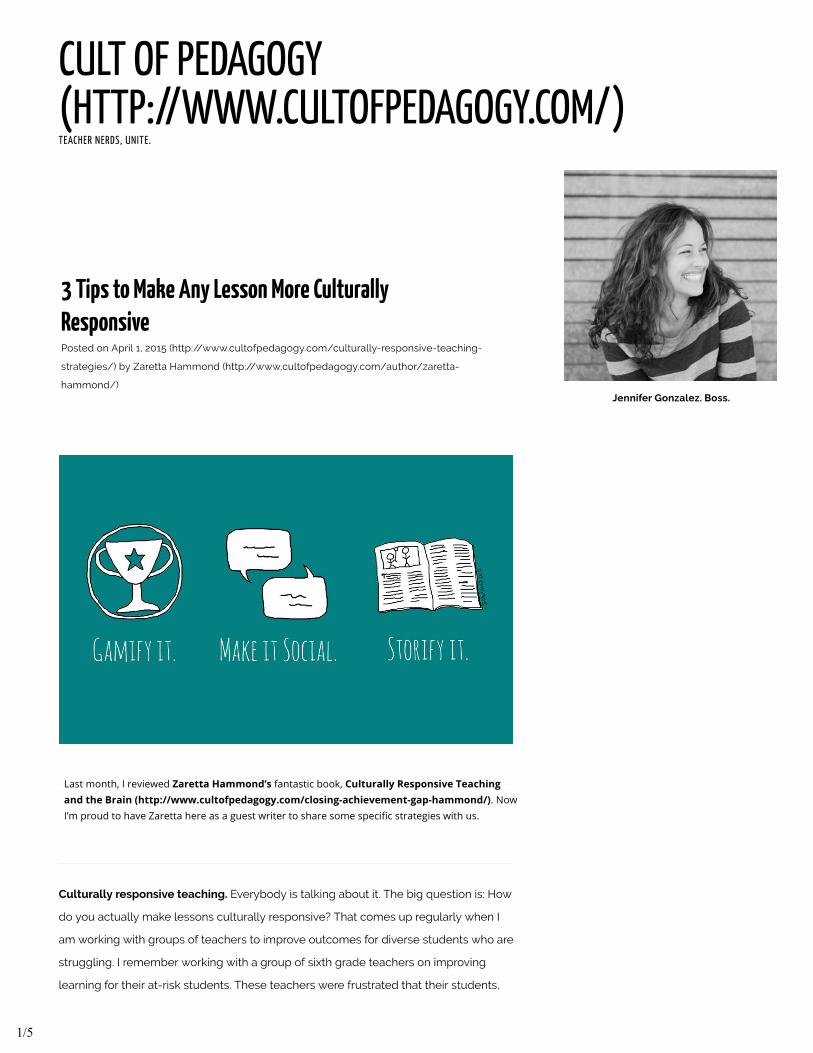
Last month, I reviewed Zaretta Hammond’s fantastic book, Culturally Responsive Teachingand the Brain (http://www.cultofpedagogy.com/closing-achievement-gap-hammond/). NowI’m proud to have Zaretta here as a guest writer to share some specific strategies with us.
1/5
95 percent of them students of color and English language learners, were not applying
themselves to learning.
I suggested that we explore making lessons more culturally relevant in order to
accelerate student learning. I remember the reaction of Janice, the science teacher. "I
am not going to be rappin' about the periodic table," she said defiantly as she crossed
her arms and sat back in her chair.
I couldn't blame her. Google "culturally responsive teaching" and you can find a dozen
videos of well-meaning teachers leading some call-and-response chant about
exponents or rapping about the Boston Tea Party while students sit back and giggle.
That's because we usually talk about culturally responsive teaching only as an
engagement strategy designed to motivate at-risk students to take learning seriously.
Or we try to find a race-based connection to the content to make it "relevant" to
minority students.
What IS culturally responsive teaching?
One of the biggest misconceptions about culturally responsive teaching is thinking
you have to tie the lesson's content to African American or Latino students' racial
background. The common belief is if you mention Africa, Mexico, or famous black and
brown high achievers, it will spark students' attention. Then they will be motivated to
participate.
In reality, culturally responsive teaching is less about using racial pride as a motivator
and more about mimicking students' cultural learning styles and tools. These are the
strategies their moms, dads, grandmas, and other community folks use to teach them
life skills and basic concepts long before they come to school and during out-of
school time.
Culturally responsive teaching leverages the brain's memory systems and information
processing structures. Why? Many diverse students come from oral cultural traditions.
This means their primary ways of knowledge transfer and meaning-making are oral
and active. It's a common cultural tradition that cuts across racial groups: African
American, Latino, Southeast Asian, and Pacific Islander communities all have strong
oral cultures. Each of these cultural groups uses the brain's memory systems for
turning inert information into useable knowledge. They use memory strategies to
make learning sticky, like connecting what needs to be remembered to a rhythm or
music (that's why we still know the ABC song) or by reciting it in fun ways like a poem,
riddle, or Limerick.
I asked Janice what area of learning she wanted to help her kids improve. She said
science vocabulary; they weren't learning the weekly words and it was getting in the
way of their understanding of key concepts. She was frustrated and at the end of her
rope. I asked how she was teaching it. She used the typical approach: On Monday, she
2/5
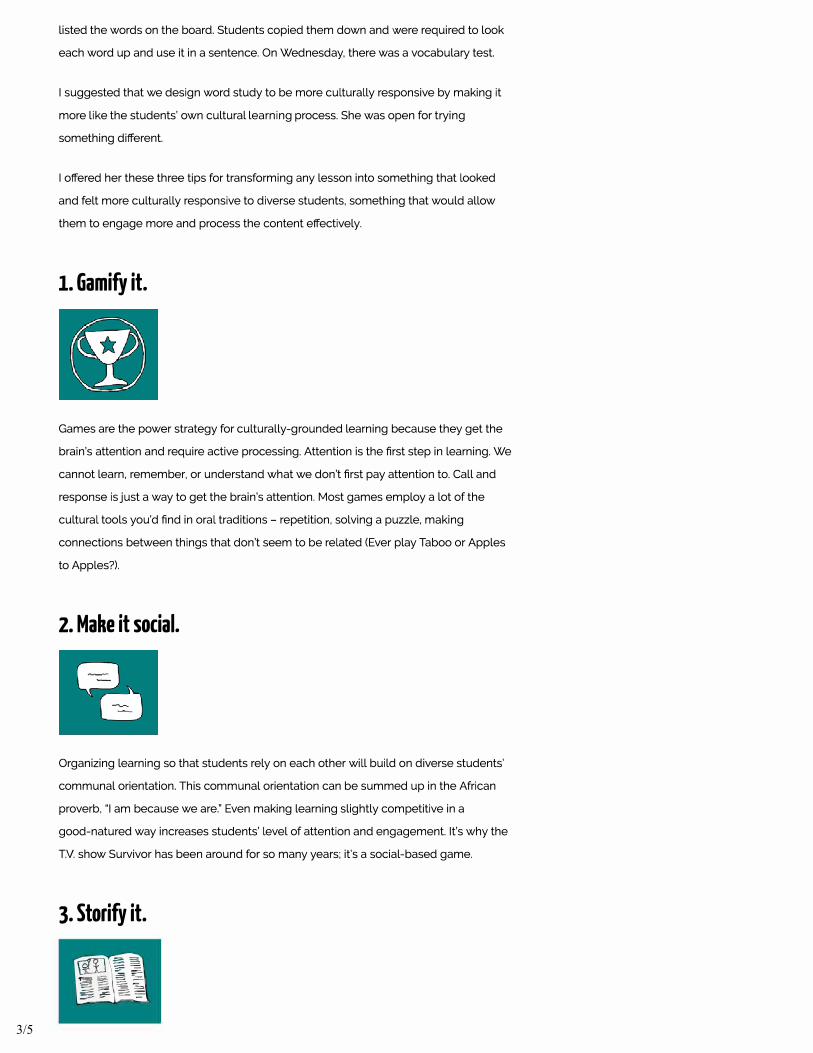
listed the words on the board. Students copied them down and were required to look
each word up and use it in a sentence. On Wednesday. there was a vocabulary test.
I suggested that we design word study to be more culturally responsive by making it
more like the students' own cultural learning process. She was open for trying
something different.
I offered her these three tips for transforming any lesson into something that looked
and felt more culturally responsive to diverse students, something that would allow
them to engage more and process the content effectively.
1. 6amify it.
Games are the power strategy for culturally-grounded learning because they get the
brain's attention and require active processing. Attention is the first step in learning. We
cannot learn, remember, or understand what we don't first pay attention to. Call and
response is just a way to get the brain's attention. Most games employ a lot of the
cultural tools you'd find in oral traditions - repetition, solving a puzzle, making
connections between things that don't seem to be related (Ever play Taboo or Apples
to Apples?).
2. Make it social.
Organizing learning so that students rely on each other will build on diverse students'
communal orientation. This communal orientation can be summed up in the African
proverb, "I am because we are." Even making learning slightly competitive in a
good-natured way increases students' level of attention and engagement. It's why the
T.V. show Survivor has been around for so many years: it's a social-based game.
3. Storify it.
Ill 3/5
The brain is wired to remember stories and to use the story structure to make sense of
the world. That's why every culture has creation stories. In oral traditions, stories play a
bigger role in teaching lessons about manners, morality, or simply what plants to eat
or not eat in the wilderness because it's the way content is remembered. Diverse
students (and all students, really) learn content more effectively if they can create a
coherent narrative about the topic or process presented. That's the brain's way of
weaving it all together. (Bonus: It also offers a great way to check for understanding
and correct misconceptions.)
So Janice took her weekly list of science vocabulary and created a variety of sorting
and matching games for students. She built a set of simple card games based on Go
Fish or Old Maid. In addition she created some team games. Each week students had
different active ways to learn the vocabulary. For 10-15 minutes a couple of times
during the week, students got to play these learning games rather than look up words
in a dictionary. She gave them instructions for making the games at home if they
wanted to.
Instead of the traditional weekly vocab test, she asked them to "storify" their
understanding of key concept words Like metamorphosis, using vocabulary from past
weeks.
When I checked in with the group a few weeks later, she was the first one to share. She
said student engagement was like night and day. Now all students were participating.
She said she knew they were learning the vocabulary at a deeper level because they
were actually using the new science terms during discussions and in their writing with
no prompting from her.
The big A-ha's for the group that day were that (1) Culturally responsive teaching
doesn't have to be some performance the teacher does to entertain students and (2) It
doesn't have to mention race or reference culture at all. Instead, what makes a practice
culturally responsive is that it mimics students' own cultural learning tools. They all
realized that these practices are helpful for all students, not targeted at minority
students.
The real trick is to use these strategies regularly as part of your instructional routine
rather than doing them randomly every now and then. Consistency is the key.
4/5

(!' (!�. (t) �t. �·
"'·
:,·r,,R•:::,:,,k:··;
&THE BRAIN
Zarella Hammond
Learn more about how to improve
diverse students' information processing skills and actually grow
their brains in Zaretta Hammond's book, Culturally Responsive
Teaching and The Brain: Promoting Authentic Engagement
and Rigor Among Culturally and Linguistically Diverse
Students
5/5

The Science and Policy of Biodiversity
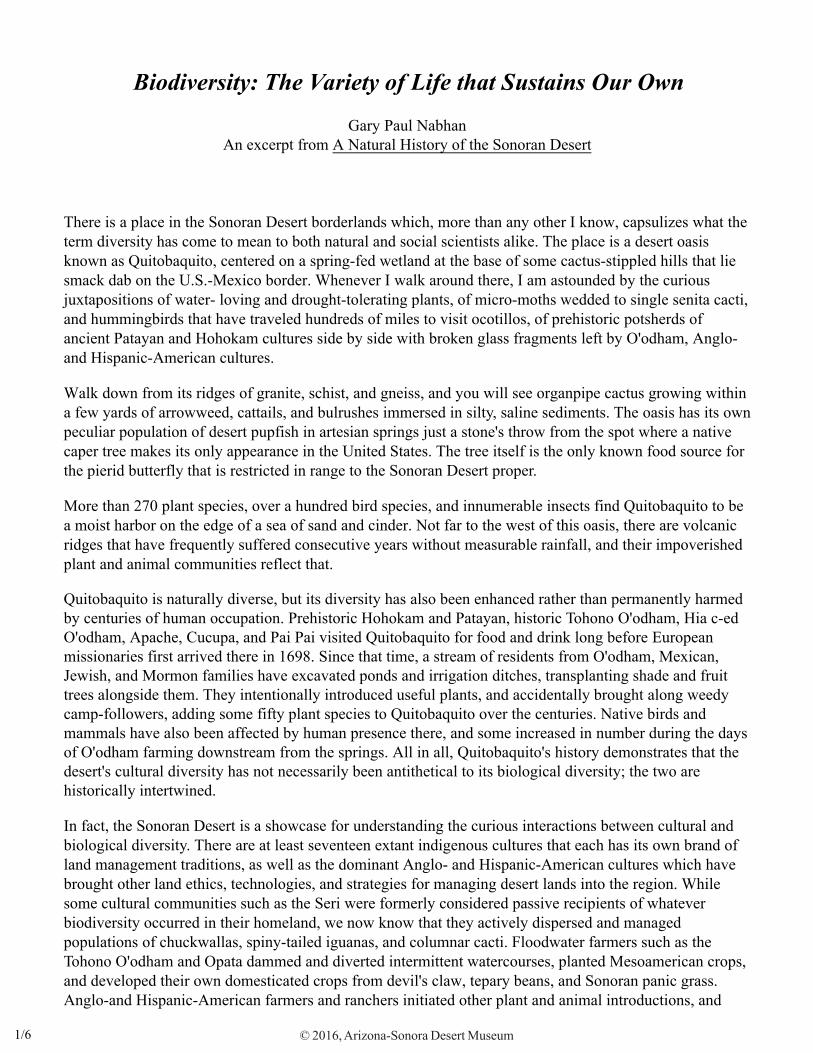
Biodiversity: The Variety of Life that Sustains Our Own
Gary Paul NabhanAn excerpt from A Natural History of the Sonoran Desert
There is a place in the Sonoran Desert borderlands which, more than any other I know, capsulizes what the term diversity has come to mean to both natural and social scientists alike. The place is a desert oasis known as Quitobaquito, centered on a spring-fed wetland at the base of some cactus-stippled hills that lie smack dab on the U.S.-Mexico border. Whenever I walk around there, I am astounded by the curious juxtapositions of water- loving and drought-tolerating plants, of micro-moths wedded to single senita cacti, and hummingbirds that have traveled hundreds of miles to visit ocotillos, of prehistoric potsherds of ancient Patayan and Hohokam cultures side by side with broken glass fragments left by O'odham, Anglo- and Hispanic-American cultures.
Walk down from its ridges of granite, schist, and gneiss, and you will see organpipe cactus growing within a few yards of arrowweed, cattails, and bulrushes immersed in silty, saline sediments. The oasis has its own peculiar population of desert pupfish in artesian springs just a stone's throw from the spot where a native caper tree makes its only appearance in the United States. The tree itself is the only known food source for the pierid butterfly that is restricted in range to the Sonoran Desert proper.
More than 270 plant species, over a hundred bird species, and innumerable insects find Quitobaquito to be a moist harbor on the edge of a sea of sand and cinder. Not far to the west of this oasis, there are volcanic ridges that have frequently suffered consecutive years without measurable rainfall, and their impoverished plant and animal communities reflect that.
Quitobaquito is naturally diverse, but its diversity has also been enhanced rather than permanently harmed by centuries of human occupation. Prehistoric Hohokam and Patayan, historic Tohono O'odham, Hia c-ed O'odham, Apache, Cucupa, and Pai Pai visited Quitobaquito for food and drink long before European missionaries first arrived there in 1698. Since that time, a stream of residents from O'odham, Mexican, Jewish, and Mormon families have excavated ponds and irrigation ditches, transplanting shade and fruit trees alongside them. They intentionally introduced useful plants, and accidentally brought along weedy camp-followers, adding some fifty plant species to Quitobaquito over the centuries. Native birds and mammals have also been affected by human presence there, and some increased in number during the days of O'odham farming downstream from the springs. All in all, Quitobaquito's history demonstrates that the desert's cultural diversity has not necessarily been antithetical to its biological diversity; the two are historically intertwined.
In fact, the Sonoran Desert is a showcase for understanding the curious interactions between cultural and biological diversity. There are at least seventeen extant indigenous cultures that each has its own brand of land management traditions, as well as the dominant Anglo- and Hispanic-American cultures which have brought other land ethics, technologies, and strategies for managing desert lands into the region. While some cultural communities such as the Seri were formerly considered passive recipients of whatever biodiversity occurred in their homeland, we now know that they actively dispersed and managed populations of chuckwallas, spiny-tailed iguanas, and columnar cacti. Floodwater farmers such as the Tohono O'odham and Opata dammed and diverted intermittent watercourses, planted Mesoamerican crops, and developed their own domesticated crops from devil's claw, tepary beans, and Sonoran panic grass. Anglo-and Hispanic-American farmers and ranchers initiated other plant and animal introductions, and
© 2016, Arizona-Sonora Desert Museum 1/6
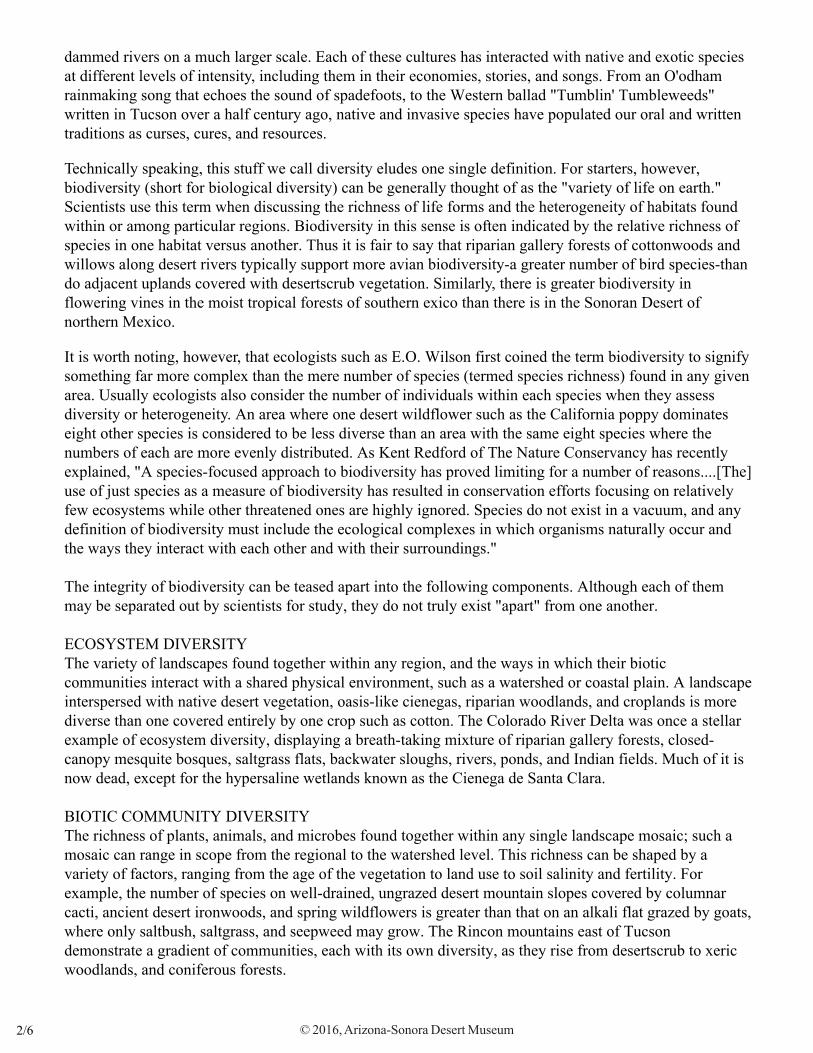
dammed rivers on a much larger scale. Each of these cultures has interacted with native and exotic species at different levels of intensity, including them in their economies, stories, and songs. From an O'odham rainmaking song that echoes the sound of spadefoots, to the Western ballad "Tumblin' Tumbleweeds" written in Tucson over a half century ago, native and invasive species have populated our oral and written traditions as curses, cures, and resources.
Technically speaking, this stuff we call diversity eludes one single definition. For starters, however, biodiversity (short for biological diversity) can be generally thought of as the "variety of life on earth." Scientists use this term when discussing the richness of life forms and the heterogeneity of habitats found within or among particular regions. Biodiversity in this sense is often indicated by the relative richness of species in one habitat versus another. Thus it is fair to say that riparian gallery forests of cottonwoods and willows along desert rivers typically support more avian biodiversity-a greater number of bird species-than do adjacent uplands covered with desertscrub vegetation. Similarly, there is greater biodiversity in flowering vines in the moist tropical forests of southern exico than there is in the Sonoran Desert of northern Mexico.
It is worth noting, however, that ecologists such as E.O. Wilson first coined the term biodiversity to signify something far more complex than the mere number of species (termed species richness) found in any given area. Usually ecologists also consider the number of individuals within each species when they assess diversity or heterogeneity. An area where one desert wildflower such as the California poppy dominates eight other species is considered to be less diverse than an area with the same eight species where the numbers of each are more evenly distributed. As Kent Redford of The Nature Conservancy has recently explained, "A species-focused approach to biodiversity has proved limiting for a number of reasons....[The] use of just species as a measure of biodiversity has resulted in conservation efforts focusing on relatively few ecosystems while other threatened ones are highly ignored. Species do not exist in a vacuum, and any definition of biodiversity must include the ecological complexes in which organisms naturally occur and the ways they interact with each other and with their surroundings."
The integrity of biodiversity can be teased apart into the following components. Although each of them may be separated out by scientists for study, they do not truly exist "apart" from one another.
ECOSYSTEM DIVERSITYThe variety of landscapes found together within any region, and the ways in which their biotic communities interact with a shared physical environment, such as a watershed or coastal plain. A landscape interspersed with native desert vegetation, oasis-like cienegas, riparian woodlands, and croplands is more diverse than one covered entirely by one crop such as cotton. The Colorado River Delta was once a stellar example of ecosystem diversity, displaying a breath-taking mixture of riparian gallery forests, closed-canopy mesquite bosques, saltgrass flats, backwater sloughs, rivers, ponds, and Indian fields. Much of it is now dead, except for the hypersaline wetlands known as the Cienega de Santa Clara.
BIOTIC COMMUNITY DIVERSITYThe richness of plants, animals, and microbes found together within any single landscape mosaic; such a mosaic can range in scope from the regional to the watershed level. This richness can be shaped by a variety of factors, ranging from the age of the vegetation to land use to soil salinity and fertility. For example, the number of species on well-drained, ungrazed desert mountain slopes covered by columnar cacti, ancient desert ironwoods, and spring wildflowers is greater than that on an alkali flat grazed by goats, where only saltbush, saltgrass, and seepweed may grow. The Rincon mountains east of Tucson demonstrate a gradient of communities, each with its own diversity, as they rise from desertscrub to xeric woodlands, and coniferous forests.
© 2016, Arizona-Sonora Desert Museum 2/6
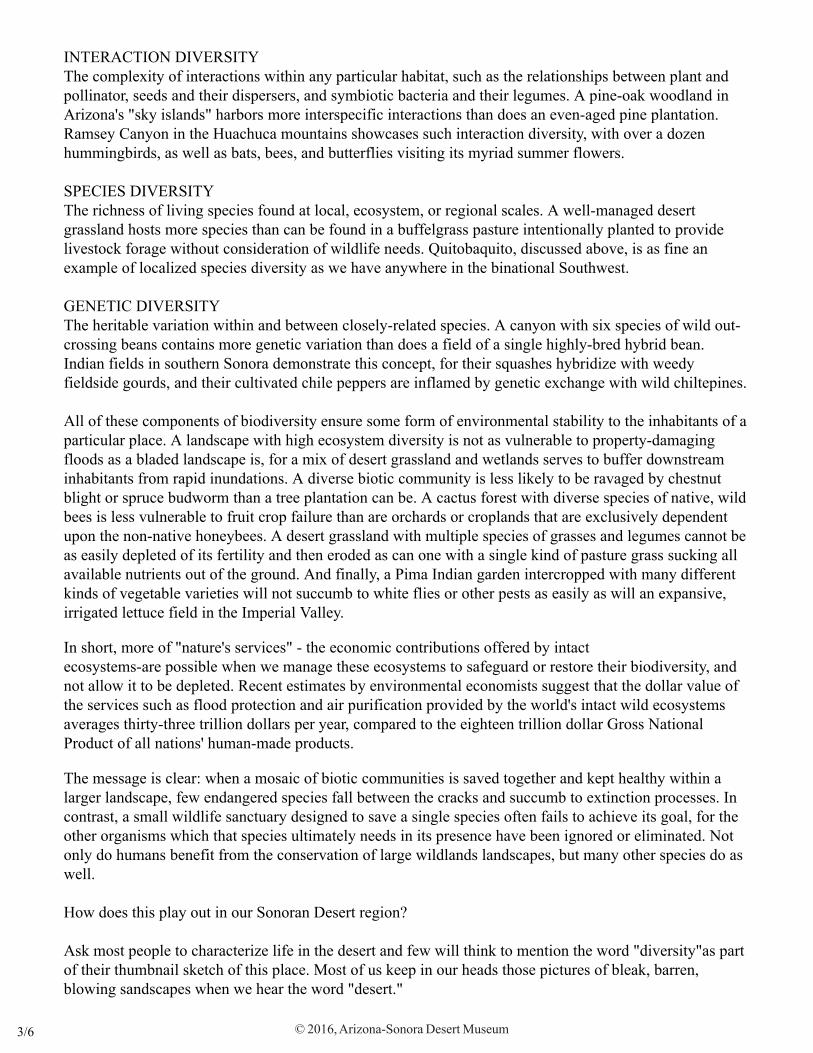
INTERACTION DIVERSITYThe complexity of interactions within any particular habitat, such as the relationships between plant and pollinator, seeds and their dispersers, and symbiotic bacteria and their legumes. A pine-oak woodland in Arizona's "sky islands" harbors more interspecific interactions than does an even-aged pine plantation. Ramsey Canyon in the Huachuca mountains showcases such interaction diversity, with over a dozen hummingbirds, as well as bats, bees, and butterflies visiting its myriad summer flowers.
SPECIES DIVERSITYThe richness of living species found at local, ecosystem, or regional scales. A well-managed desert grassland hosts more species than can be found in a buffelgrass pasture intentionally planted to provide livestock forage without consideration of wildlife needs. Quitobaquito, discussed above, is as fine an example of localized species diversity as we have anywhere in the binational Southwest.
GENETIC DIVERSITYThe heritable variation within and between closely-related species. A canyon with six species of wild out-crossing beans contains more genetic variation than does a field of a single highly-bred hybrid bean. Indian fields in southern Sonora demonstrate this concept, for their squashes hybridize with weedy fieldside gourds, and their cultivated chile peppers are inflamed by genetic exchange with wild chiltepines.
All of these components of biodiversity ensure some form of environmental stability to the inhabitants of a particular place. A landscape with high ecosystem diversity is not as vulnerable to property-damaging floods as a bladed landscape is, for a mix of desert grassland and wetlands serves to buffer downstream inhabitants from rapid inundations. A diverse biotic community is less likely to be ravaged by chestnut blight or spruce budworm than a tree plantation can be. A cactus forest with diverse species of native, wild bees is less vulnerable to fruit crop failure than are orchards or croplands that are exclusively dependent upon the non-native honeybees. A desert grassland with multiple species of grasses and legumes cannot be as easily depleted of its fertility and then eroded as can one with a single kind of pasture grass sucking all available nutrients out of the ground. And finally, a Pima Indian garden intercropped with many different kinds of vegetable varieties will not succumb to white flies or other pests as easily as will an expansive, irrigated lettuce field in the Imperial Valley.
In short, more of "nature's services" - the economic contributions offered by intactecosystems-are possible when we manage these ecosystems to safeguard or restore their biodiversity, and not allow it to be depleted. Recent estimates by environmental economists suggest that the dollar value of the services such as flood protection and air purification provided by the world's intact wild ecosystems averages thirty-three trillion dollars per year, compared to the eighteen trillion dollar Gross National Product of all nations' human-made products.
The message is clear: when a mosaic of biotic communities is saved together and kept healthy within a larger landscape, few endangered species fall between the cracks and succumb to extinction processes. In contrast, a small wildlife sanctuary designed to save a single species often fails to achieve its goal, for the other organisms which that species ultimately needs in its presence have been ignored or eliminated. Not only do humans benefit from the conservation of large wildlands landscapes, but many other species do as well.
How does this play out in our Sonoran Desert region?
Ask most people to characterize life in the desert and few will think to mention the word "diversity"as part of their thumbnail sketch of this place. Most of us keep in our heads those pictures of bleak, barren, blowing sandscapes when we hear the word "desert."
© 2016, Arizona-Sonora Desert Museum 3/6
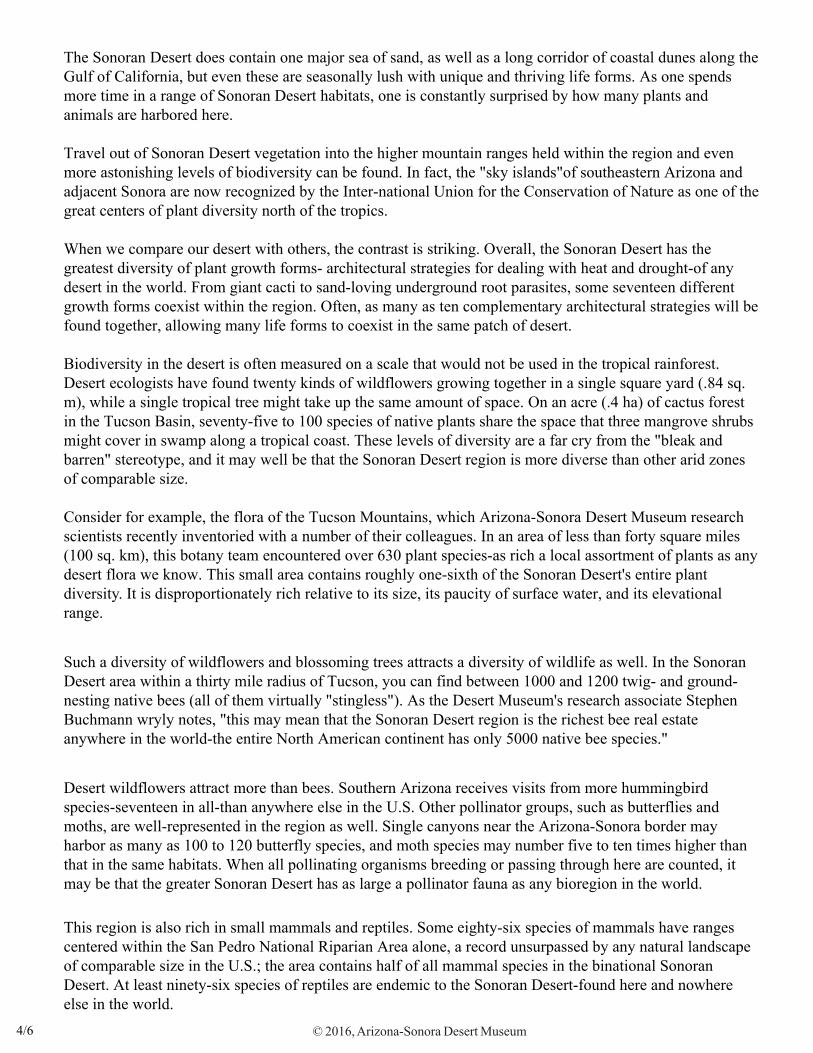
The Sonoran Desert does contain one major sea of sand, as well as a long corridor of coastal dunes along the Gulf of California, but even these are seasonally lush with unique and thriving life forms. As one spends more time in a range of Sonoran Desert habitats, one is constantly surprised by how many plants and animals are harbored here.
Travel out of Sonoran Desert vegetation into the higher mountain ranges held within the region and even more astonishing levels of biodiversity can be found. In fact, the "sky islands"of southeastern Arizona and adjacent Sonora are now recognized by the Inter-national Union for the Conservation of Nature as one of the great centers of plant diversity north of the tropics.
When we compare our desert with others, the contrast is striking. Overall, the Sonoran Desert has the greatest diversity of plant growth forms- architectural strategies for dealing with heat and drought-of any desert in the world. From giant cacti to sand-loving underground root parasites, some seventeen different growth forms coexist within the region. Often, as many as ten complementary architectural strategies will be found together, allowing many life forms to coexist in the same patch of desert.
Biodiversity in the desert is often measured on a scale that would not be used in the tropical rainforest. Desert ecologists have found twenty kinds of wildflowers growing together in a single square yard (.84 sq. m), while a single tropical tree might take up the same amount of space. On an acre (.4 ha) of cactus forest in the Tucson Basin, seventy-five to 100 species of native plants share the space that three mangrove shrubs might cover in swamp along a tropical coast. These levels of diversity are a far cry from the "bleak and barren" stereotype, and it may well be that the Sonoran Desert region is more diverse than other arid zones of comparable size.
Consider for example, the flora of the Tucson Mountains, which Arizona-Sonora Desert Museum research scientists recently inventoried with a number of their colleagues. In an area of less than forty square miles (100 sq. km), this botany team encountered over 630 plant species-as rich a local assortment of plants as any desert flora we know. This small area contains roughly one-sixth of the Sonoran Desert's entire plant diversity. It is disproportionately rich relative to its size, its paucity of surface water, and its elevational range.
Such a diversity of wildflowers and blossoming trees attracts a diversity of wildlife as well. In the Sonoran Desert area within a thirty mile radius of Tucson, you can find between 1000 and 1200 twig- and ground-nesting native bees (all of them virtually "stingless"). As the Desert Museum's research associate Stephen Buchmann wryly notes, "this may mean that the Sonoran Desert region is the richest bee real estate anywhere in the world-the entire North American continent has only 5000 native bee species."
Desert wildflowers attract more than bees. Southern Arizona receives visits from more hummingbird species-seventeen in all-than anywhere else in the U.S. Other pollinator groups, such as butterflies and moths, are well-represented in the region as well. Single canyons near the Arizona-Sonora border may harbor as many as 100 to 120 butterfly species, and moth species may number five to ten times higher than that in the same habitats. When all pollinating organisms breeding or passing through here are counted, it may be that the greater Sonoran Desert has as large a pollinator fauna as any bioregion in the world.
This region is also rich in small mammals and reptiles. Some eighty-six species of mammals have ranges centered within the San Pedro National Riparian Area alone, a record unsurpassed by any natural landscape of comparable size in the U.S.; the area contains half of all mammal species in the binational Sonoran Desert. At least ninety-six species of reptiles are endemic to the Sonoran Desert-found here and nowhere else in the world.
© 2016, Arizona-Sonora Desert Museum 4/6
Why is such diversity present in a land of little rain? For starters, our bimodal rainfall pattern brings out completely different suites of wild-flowers and their attendant insects at different times of the year. In addition, we benefit from a more gradual transition between tropical nature and desert nature than does the Chihuahuan Desert on the other side of the Sierra Madre-many tropically-derived life forms reach their northernmost limits in the Sonoran Desert due to its relatively frost-free climes. Of course, tropic rainforests are much more diverse in the total number of species they have throughout their biome, in part because of their ages and their high energy budgets. However, there may be more turnover in species from place to place in the Sonoran Desert than in some tropical vegetation types. That is to say, many desert plants and insects are "micro-areal" - occurring only within a 100 by 100 mile spots on the map. Particularly in Baja California, there are extremely high levels of endemism, including some 552 plants unique to the peninsula.
Nevertheless, it remains true that the highest levels of local diversity in this desert region occur where water accumulates. Some of the highest breeding bird densities recorded anywhere in the world come from riparian forests along the Verde and San Pedro river floodplains. More than 450 kinds of birds have historically nested or migrated along the Colorado, San Pedro, and Santa Cruz rivers. And yet, if riparian habitats were among our richest, what have we lost with the removal of cottonwoods from ninety percent of their former habitat in Arizona? Ornithologists cannot name a single Sonoran Desert bird that has gone extinct with riparian habitat loss, but many of the eighty species of birds dependent on these riparian forests have locally declined in abundance. A single desert riparian mammal-Merriam's mesquite mouse-is now extinct due to the loss of riparian habitat at the hand of groundwater pumping, arroyo cutting, and overgrazing. Mexican wolves and black bears that formerly frequented our river valleys are among those mammals no longer found in the Sonoran Desert proper.
Conservation International has estimated that as much as sixty percent of the entire Sonoran Desert surface is no longer covered with native vegetation but is dominated by the 380-some alien species introduced to the region by humans and their livestock. Alien plants such as buffelgrass now cover more than 1,400,000 acres of the region, at the expense of both native plants and animals. Tamarisk trees choke out native willow and cottonwood seedlings. Invasive weeds such as Johnson grass and Sahara mustard have taken over much of certain wildlife sanctuaries and parks in the desert, outcompeting rare native species. Other invasive species such as Africanized bees and cowbirds also compete with the native fauna. Biological invasions are now rated among the top ten threats to the integrity of Sonoran Desert ecosystems, whereas a half century ago they hardly concerned ecologists working in the region. These invaders somehow reach even the most remote stretches of the desert, to the point of being ubiquitous.
The wholesale replacement of natives by aliens is enough of a problem, but desert biodiversity has been even more profoundly affected by habitat fragmentation-the fracturing of large tracts of desert into pieces so small that they cannot sustain the interactions among plant, pollinator, and seed disperser. Such fragmentation does not necessarily lead to immediate extinctions, just declines-there is a time lag before a species' loss of interactions with others leads to complete reproductive failure. Fragmentation caused by urbanization is now considered the number-one threat to the biodiversity of the region and is not expected to diminish during our lifetimes. The population of Arizona's Maricopa County in the year 2025 is expected to be two and a half times what it was in 1995, and similar growth rates are anticipated along the entire desert coastline of the Sea of Cortez.
In a sense, humans are making the Sonoran Desert much more like the old (and erroneous) stereotype of a barren wasteland. As more than forty dams were constructed along rivers in this century, old-timers witnessed hundreds of miles of riparian corridors dry up. Groundwater overdraft has also impoverished desert and riparian vegetation, as farms and cities pump millions more acre-feet out of the ground than rainfall in the region can naturally recharge. The roots of plants are left high and dry above the water table.
© 2016, Arizona-Sonora Desert Museum 5/6
Most of the Sonoran Desert was not at all naturally barren, but our misunderstandings have impoverished one of the richest arid landscapes on the planet. That is why the Desert Museum has endorsed a long-term Conservation Mission Statement which begins with these words from ecologist D.M. Bowman:
"So what is biodiversity?...the variety of life on this planet is like an extra-ordinarily complex, unfinished, and incomplete manuscript with a hugely varied alphabet, an ever-expanding lexicon, and a poorly understood grammar....Ripping the manuscript to pieces because we want to use the paper makes little sense, especially if the manuscript says that 'to survive you shall not destroy what you do not understand'. Our mission as ecologists must be to interpret the meaning of biodiversity. The urgent need for this mission, and our current ecological ignorance, must be forcefully communicated to the public."
Instead of seeing future inhabitants rip out any more pages essential to the desert's story, the conservation organizations of the region have begun to work together to ensure that the most important corridors and secluded refugia for desert flora and fauna are identified and protected or restored. These critical areas - essential to the flow of diversity from source to sink, from headwaters to river mouth, and from tropical wintergrounds to summer nesting areas - must be kept from further fraying if the fabric of the Sonoran Desert is to remain intact. Scientists can prioritize such areas in terms of their value to biodiversity, but they will be safeguarded for future generations only if a broad spectrum of society is involved in endorsing their protection.
References
Austin, Mary. The Land of Little Rain. Albuquerque: University of New Mexico Press, 1974.
Bowman, D.M.S.J. "So What Is Biodiversity?" The Biodiversity Letter 1(1): 1 (1995).
Broyles, B. and R.S. Felger, eds. Dry Borders. Journal of the Southwest 39 (3-4): 303-860 (1998).
Buchmann, Stephen L. and Gary Paul Nabhan. Forgotten Pollinators. Washington D.C.: Island Press, 1996.
Daily, Gretchen C., ed. Nature's Services: Societal Dependence on Natural Ecosystems. Washington, D.C.: Island Press, 1997.
Felger, R.S, P.L. Warren, L.S. Anderson and G.P. Nabhan. "Vascular Plants of a Desert Oasis: Flora and Ethnobotany of Quitobaquito, Organ Pipe Cactus National onument, Arizona." Proceedings of the San Diego Society of Natural History 8: 1-39 (1992).
Nabhan, G.P. and A.R. Holdsworth. State of the Desert Biome: Uniqueness, Biodiversity, Threats, and Adequacy of Protection in the Sonoran Region. Tucson: The Wildlands Project, 1998. Redford, Kent. "Science and the Nature Conservancy." Nature Conservancy 44 (1): 14-15 (1994).
Rondeau, R., T.R. Van Devender, C.D. Bertelson, P. Jenkins, R.K. Wilson and . Dimmitt."Annotated Flora and vegetation of the Tucson Mountains, Pima County, Arizona." Desert Plants 12 (2): 1-47 (1996).
Villasenor, J.L. and T.S. Elias. "Analysis de Especies Endemicas para Identificar Areas de Proteccion en Baja California, Mexico." Conservacion de Plantas en Peligro de Extincion. E. Linares et al., eds. Mexico City: UNAM, 1995.
Wilson, Edward O. The Diversity of Life. Cambridge: Harvard University (Belnap) Press, 1992.
© 2016, Arizona-Sonora Desert Museum 6/6
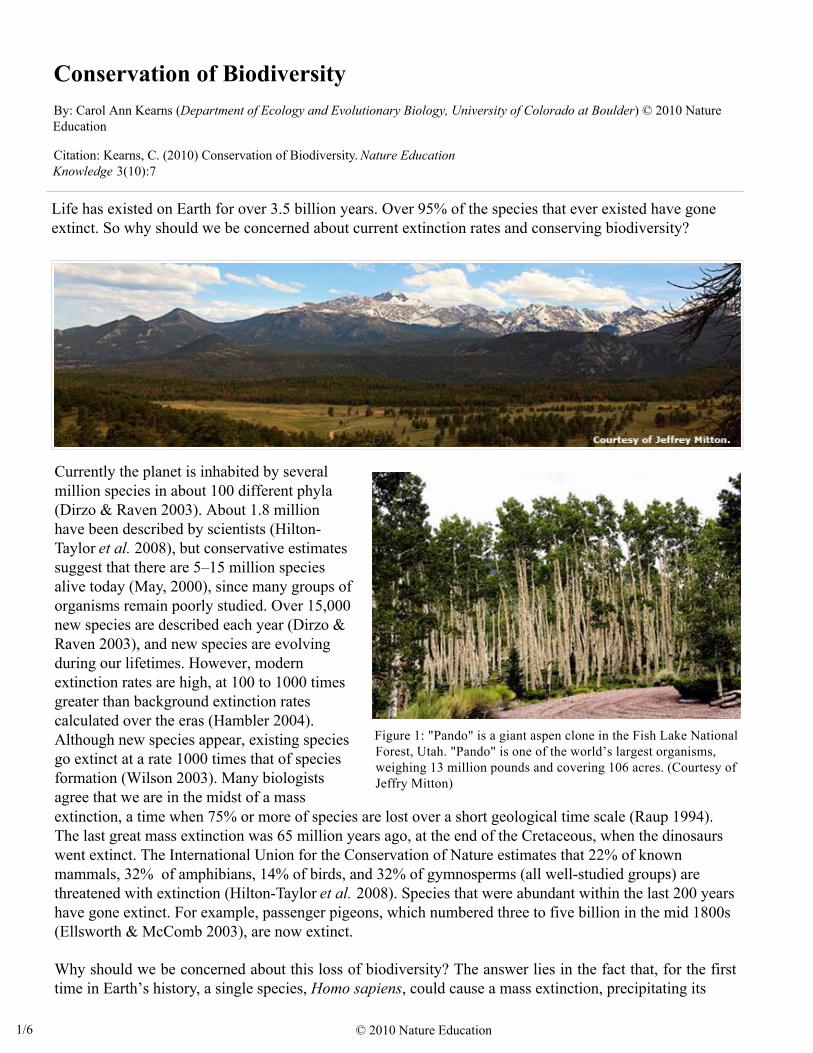
Life has existed on Earth for over 3.5 billion years. Over 95% of the species that ever existed have gone extinct. So why should we be concerned about current extinction rates and conserving biodiversity?
Currently the planet is inhabited by several million species in about 100 different phyla (Dirzo & Raven 2003). About 1.8 million have been described by scientists (Hilton-Taylor et al. 2008), but conservative estimates suggest that there are 5–15 million species alive today (May, 2000), since many groups of organisms remain poorly studied. Over 15,000 new species are described each year (Dirzo & Raven 2003), and new species are evolving during our lifetimes. However, modern extinction rates are high, at 100 to 1000 times greater than background extinction rates calculated over the eras (Hambler 2004). Although new species appear, existing species go extinct at a rate 1000 times that of species formation (Wilson 2003). Many biologists agree that we are in the midst of a mass
Figure 1: "Pando" is a giant aspen clone in the Fish Lake National Forest, Utah. "Pando" is one of the world’s largest organisms, weighing 13 million pounds and covering 106 acres. (Courtesy of Jeffry Mitton)
extinction, a time when 75% or more of species are lost over a short geological time scale (Raup 1994). The last great mass extinction was 65 million years ago, at the end of the Cretaceous, when the dinosaurs went extinct. The International Union for the Conservation of Nature estimates that 22% of known mammals, 32% of amphibians, 14% of birds, and 32% of gymnosperms (all well-studied groups) are threatened with extinction (Hilton-Taylor et al. 2008). Species that were abundant within the last 200 years have gone extinct. For example, passenger pigeons, which numbered three to five billion in the mid 1800s (Ellsworth & McComb 2003), are now extinct.
Why should we be concerned about this loss of biodiversity? The answer lies in the fact that, for the first time in Earth’s history, a single species, Homo sapiens, could cause a mass extinction, precipitating its
Conservation of BiodiversityBy: Carol Ann Kearns (Department of Ecology and Evolutionary Biology, University of Colorado at Boulder) © 2010 Nature Education
Citation: Kearns, C. (2010) Conservation of Biodiversity. Nature EducationKnowledge 3(10):7
© 2010 Nature Education 1/6
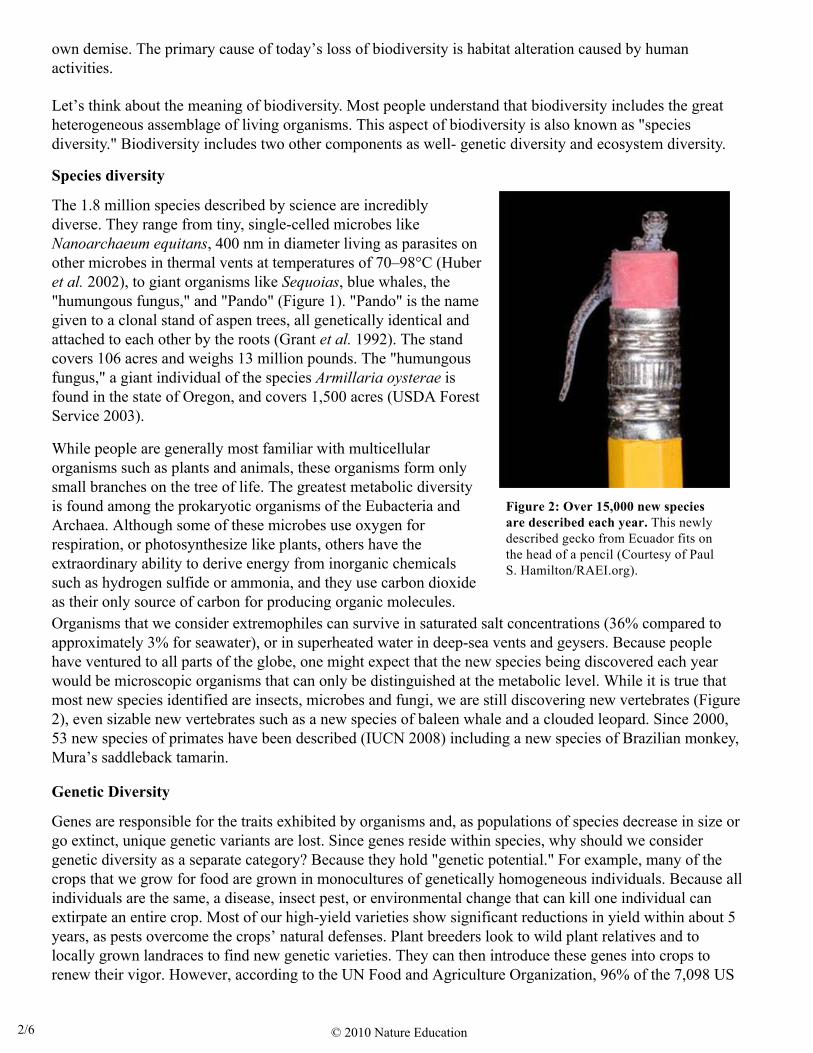
Figure 2: Over 15,000 new species are described each year. This newly described gecko from Ecuador fits on the head of a pencil (Courtesy of Paul S. Hamilton/RAEI.org).
own demise. The primary cause of today’s loss of biodiversity is habitat alteration caused by human activities.
Let’s think about the meaning of biodiversity. Most people understand that biodiversity includes the great heterogeneous assemblage of living organisms. This aspect of biodiversity is also known as "species diversity." Biodiversity includes two other components as well- genetic diversity and ecosystem diversity.
Species diversity
The 1.8 million species described by science are incredibly diverse. They range from tiny, single-celled microbes like Nanoarchaeum equitans, 400 nm in diameter living as parasites on other microbes in thermal vents at temperatures of 70–98°C (Huber et al. 2002), to giant organisms like Sequoias, blue whales, the "humungous fungus," and "Pando" (Figure 1). "Pando" is the name given to a clonal stand of aspen trees, all genetically identical and attached to each other by the roots (Grant et al. 1992). The stand covers 106 acres and weighs 13 million pounds. The "humungous fungus," a giant individual of the species Armillaria oysterae is found in the state of Oregon, and covers 1,500 acres (USDA Forest Service 2003).
While people are generally most familiar with multicellular organisms such as plants and animals, these organisms form only small branches on the tree of life. The greatest metabolic diversity is found among the prokaryotic organisms of the Eubacteria and Archaea. Although some of these microbes use oxygen for respiration, or photosynthesize like plants, others have the extraordinary ability to derive energy from inorganic chemicals such as hydrogen sulfide or ammonia, and they use carbon dioxide as their only source of carbon for producing organic molecules. Organisms that we consider extremophiles can survive in saturated salt concentrations (36% compared to approximately 3% for seawater), or in superheated water in deep-sea vents and geysers. Because people have ventured to all parts of the globe, one might expect that the new species being discovered each year would be microscopic organisms that can only be distinguished at the metabolic level. While it is true that most new species identified are insects, microbes and fungi, we are still discovering new vertebrates (Figure 2), even sizable new vertebrates such as a new species of baleen whale and a clouded leopard. Since 2000, 53 new species of primates have been described (IUCN 2008) including a new species of Brazilian monkey, Mura’s saddleback tamarin.
Genetic Diversity
Genes are responsible for the traits exhibited by organisms and, as populations of species decrease in size or go extinct, unique genetic variants are lost. Since genes reside within species, why should we consider genetic diversity as a separate category? Because they hold "genetic potential." For example, many of the crops that we grow for food are grown in monocultures of genetically homogeneous individuals. Because all individuals are the same, a disease, insect pest, or environmental change that can kill one individual can extirpate an entire crop. Most of our high-yield varieties show significant reductions in yield within about 5 years, as pests overcome the crops’ natural defenses. Plant breeders look to wild plant relatives and to locally grown landraces to find new genetic varieties. They can then introduce these genes into crops to renew their vigor. However, according to the UN Food and Agriculture Organization, 96% of the 7,098 US
© 2010 Nature Education 2/6
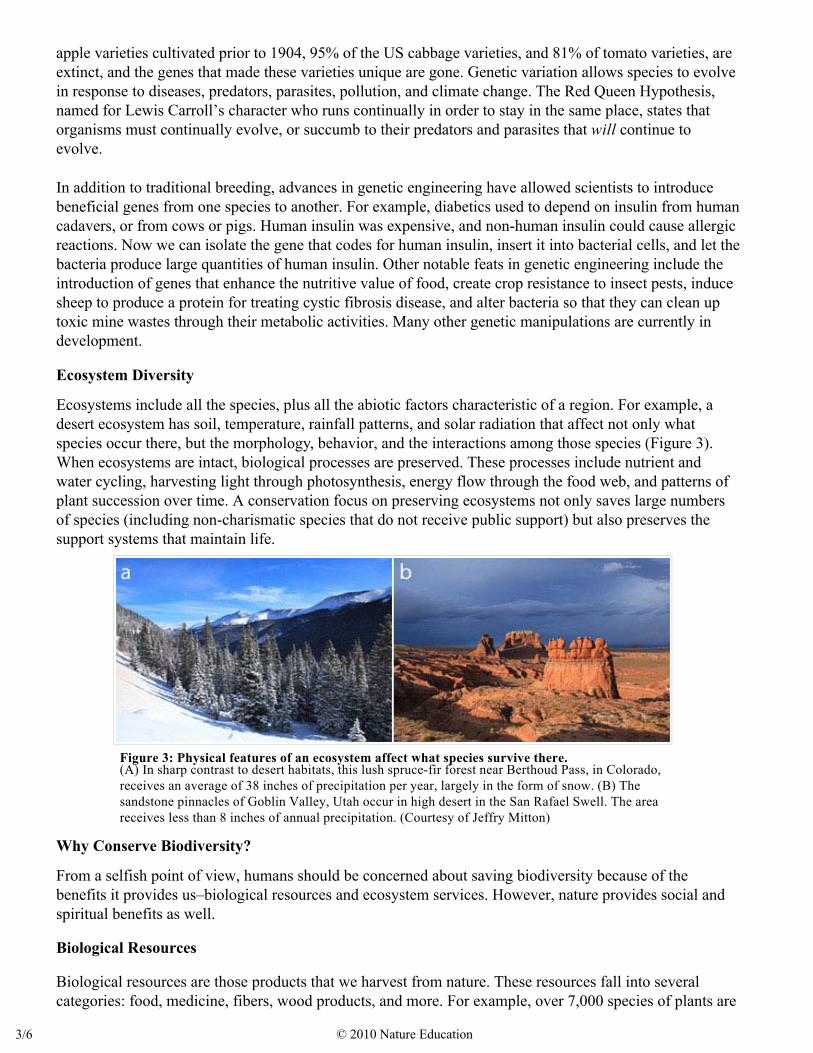
apple varieties cultivated prior to 1904, 95% of the US cabbage varieties, and 81% of tomato varieties, are extinct, and the genes that made these varieties unique are gone. Genetic variation allows species to evolve in response to diseases, predators, parasites, pollution, and climate change. The Red Queen Hypothesis, named for Lewis Carroll’s character who runs continually in order to stay in the same place, states that organisms must continually evolve, or succumb to their predators and parasites that will continue to evolve.
In addition to traditional breeding, advances in genetic engineering have allowed scientists to introduce beneficial genes from one species to another. For example, diabetics used to depend on insulin from human cadavers, or from cows or pigs. Human insulin was expensive, and non-human insulin could cause allergic reactions. Now we can isolate the gene that codes for human insulin, insert it into bacterial cells, and let the bacteria produce large quantities of human insulin. Other notable feats in genetic engineering include the introduction of genes that enhance the nutritive value of food, create crop resistance to insect pests, induce sheep to produce a protein for treating cystic fibrosis disease, and alter bacteria so that they can clean up toxic mine wastes through their metabolic activities. Many other genetic manipulations are currently in development.
Ecosystem Diversity
Ecosystems include all the species, plus all the abiotic factors characteristic of a region. For example, a desert ecosystem has soil, temperature, rainfall patterns, and solar radiation that affect not only what species occur there, but the morphology, behavior, and the interactions among those species (Figure 3). When ecosystems are intact, biological processes are preserved. These processes include nutrient and water cycling, harvesting light through photosynthesis, energy flow through the food web, and patterns of plant succession over time. A conservation focus on preserving ecosystems not only saves large numbers of species (including non-charismatic species that do not receive public support) but also preserves the support systems that maintain life.
Figure 3: Physical features of an ecosystem affect what species survive there.(A) In sharp contrast to desert habitats, this lush spruce-fir forest near Berthoud Pass, in Colorado,receives an average of 38 inches of precipitation per year, largely in the form of snow. (B) Thesandstone pinnacles of Goblin Valley, Utah occur in high desert in the San Rafael Swell. The areareceives less than 8 inches of annual precipitation. (Courtesy of Jeffry Mitton)
Why Conserve Biodiversity?
From a selfish point of view, humans should be concerned about saving biodiversity because of the benefits it provides us–biological resources and ecosystem services. However, nature provides social and spiritual benefits as well.
Biological Resources
Biological resources are those products that we harvest from nature. These resources fall into several categories: food, medicine, fibers, wood products, and more. For example, over 7,000 species of plants are
© 2010 Nature Education 3/6
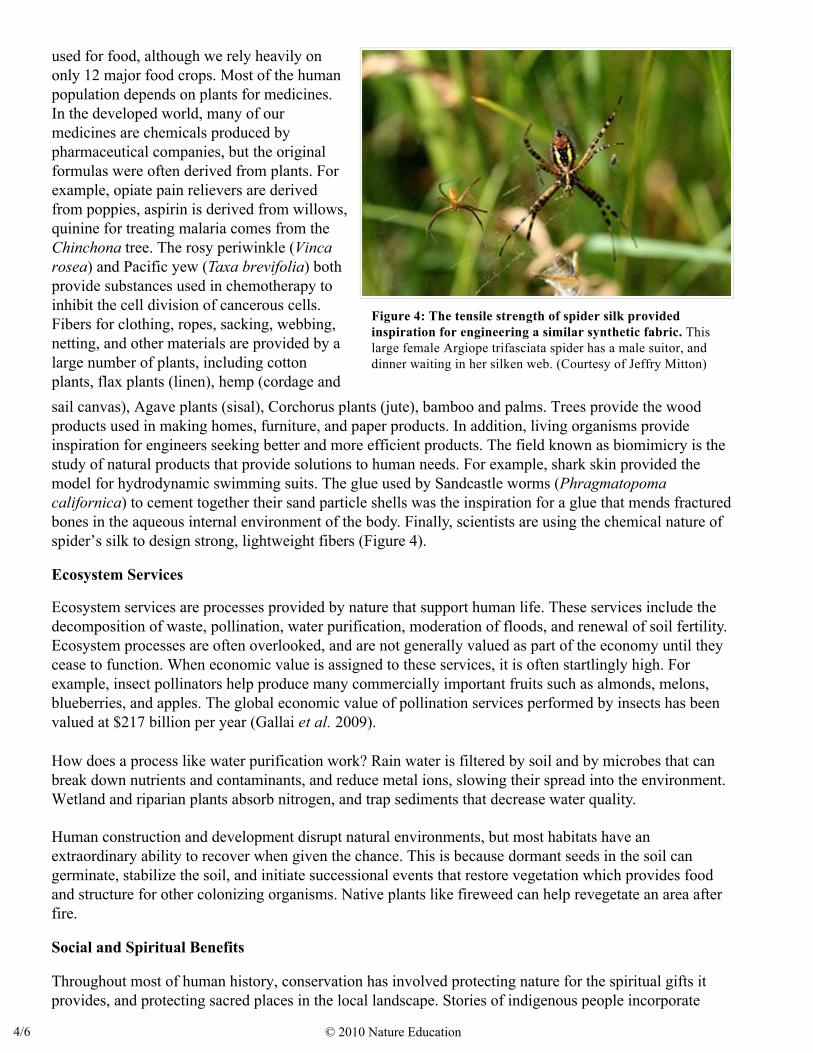
Figure 4: The tensile strength of spider silk provided inspiration for engineering a similar synthetic fabric. This large female Argiope trifasciata spider has a male suitor, and dinner waiting in her silken web. (Courtesy of Jeffry Mitton)
used for food, although we rely heavily on only 12 major food crops. Most of the human population depends on plants for medicines. In the developed world, many of our medicines are chemicals produced by pharmaceutical companies, but the original formulas were often derived from plants. For example, opiate pain relievers are derived from poppies, aspirin is derived from willows, quinine for treating malaria comes from the Chinchona tree. The rosy periwinkle (Vinca rosea) and Pacific yew (Taxa brevifolia) both provide substances used in chemotherapy to inhibit the cell division of cancerous cells. Fibers for clothing, ropes, sacking, webbing, netting, and other materials are provided by a large number of plants, including cotton plants, flax plants (linen), hemp (cordage and sail canvas), Agave plants (sisal), Corchorus plants (jute), bamboo and palms. Trees provide the wood products used in making homes, furniture, and paper products. In addition, living organisms provide inspiration for engineers seeking better and more efficient products. The field known as biomimicry is the study of natural products that provide solutions to human needs. For example, shark skin provided the model for hydrodynamic swimming suits. The glue used by Sandcastle worms (Phragmatopoma californica) to cement together their sand particle shells was the inspiration for a glue that mends fractured bones in the aqueous internal environment of the body. Finally, scientists are using the chemical nature of spider’s silk to design strong, lightweight fibers (Figure 4).
Ecosystem Services
Ecosystem services are processes provided by nature that support human life. These services include the decomposition of waste, pollination, water purification, moderation of floods, and renewal of soil fertility. Ecosystem processes are often overlooked, and are not generally valued as part of the economy until they cease to function. When economic value is assigned to these services, it is often startlingly high. For example, insect pollinators help produce many commercially important fruits such as almonds, melons, blueberries, and apples. The global economic value of pollination services performed by insects has been valued at $217 billion per year (Gallai et al. 2009).
How does a process like water purification work? Rain water is filtered by soil and by microbes that can break down nutrients and contaminants, and reduce metal ions, slowing their spread into the environment. Wetland and riparian plants absorb nitrogen, and trap sediments that decrease water quality.
Human construction and development disrupt natural environments, but most habitats have an extraordinary ability to recover when given the chance. This is because dormant seeds in the soil can germinate, stabilize the soil, and initiate successional events that restore vegetation which provides food and structure for other colonizing organisms. Native plants like fireweed can help revegetate an area after fire.
Social and Spiritual Benefits
Throughout most of human history, conservation has involved protecting nature for the spiritual gifts it provides, and protecting sacred places in the local landscape. Stories of indigenous people incorporate
© 2010 Nature Education 4/6
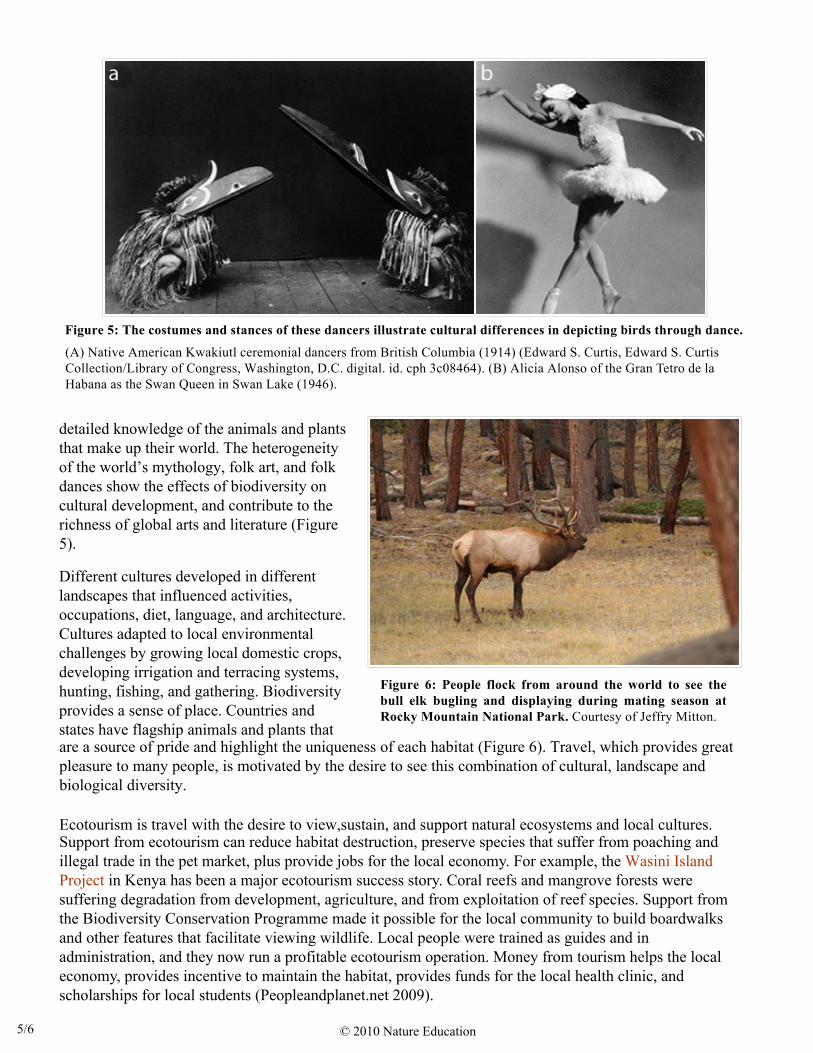
Figure 6: People flock from around the world to see thebull elk bugling and displaying during mating season atRocky Mountain National Park. Courtesy of Jeffry Mitton.
Figure 5: The costumes and stances of these dancers illustrate cultural differences in depicting birds through dance.
(A) Native American Kwakiutl ceremonial dancers from British Columbia (1914) (Edward S. Curtis, Edward S. CurtisCollection/Library of Congress, Washington, D.C. digital. id. cph 3c08464). (B) Alicia Alonso of the Gran Tetro de laHabana as the Swan Queen in Swan Lake (1946).
detailed knowledge of the animals and plants that make up their world. The heterogeneity of the world’s mythology, folk art, and folk dances show the effects of biodiversity on cultural development, and contribute to the richness of global arts and literature (Figure 5).
Different cultures developed in different landscapes that influenced activities, occupations, diet, language, and architecture. Cultures adapted to local environmental challenges by growing local domestic crops, developing irrigation and terracing systems, hunting, fishing, and gathering. Biodiversity provides a sense of place. Countries and states have flagship animals and plants that are a source of pride and highlight the uniqueness of each habitat (Figure 6). Travel, which provides great pleasure to many people, is motivated by the desire to see this combination of cultural, landscape and biological diversity.
Ecotourism is travel with the desire to view,sustain, and support natural ecosystems and local cultures. Support from ecotourism can reduce habitat destruction, preserve species that suffer from poaching and illegal trade in the pet market, plus provide jobs for the local economy. For example, the Wasini Island Project in Kenya has been a major ecotourism success story. Coral reefs and mangrove forests were suffering degradation from development, agriculture, and from exploitation of reef species. Support from the Biodiversity Conservation Programme made it possible for the local community to build boardwalks and other features that facilitate viewing wildlife. Local people were trained as guides and in administration, and they now run a profitable ecotourism operation. Money from tourism helps the local economy, provides incentive to maintain the habitat, provides funds for the local health clinic, and scholarships for local students (Peopleandplanet.net 2009).
© 2010 Nature Education 5/6
In recognition of the aesthetic value of nature, in 1892 the US Congress set aside the first national park "for the benefit and enjoyment of the people" (NPS 2010). Frederick Law Olmstead, who in the 1800s designed and managed park systems and urban parks such as Central Park in New York City, believed in the rejuvenating powers of nature. He felt that contemplating nature’s grandeur allowed man to put his life into perspective. In modern times, with increasing urbanization, people seek out local parks, open space and trails, and travel to national parks and wild places where they can enjoy nature. Birding, hiking, fishing, hunting, gardening, and other forms of recreation in nature are popular activities, and are economically important.
While modern arguments often focus on the anthropocentric value of biodiversity, nature writers such as Emerson, Thoreau, Leopold, Muir and many others emphasized the intrinsic values of biodiversity. As Henry David Thoreau said, "This curious world which we inhabit is more wonderful than it is convenient; more beautiful than it is useful; it is more to be admired and enjoyed than it is to be used" (1837).
References and Recommended Reading
Biomimicry Institute. Case Studies: Secrets of the sandcastle worm could yield a powerful medical adhesive (2009).
Dirzo, R. & Raven, P.H. Global State of Biodiversity and Loss. Annual Review Environment and Resources 28, 137-167 (2003).
Ellsworth, J.W. & McComb, B.C. Potential effects of passenger pigeon flocks on the structure and composition of presettlement forests of Eastern North America. Conservation Biology 17, 1548-1558 (2003).
Food and Agriculture Organization of the United Nations. The State of the World's Plant Genetic Resources for Food and Agriculture (1997).
Gallai, N., Sales, J. et al. Economic valuation of the vulnerability of world agriculture confronted with pollinator decline. Ecological Economics 68, 810-821 (2009).
Grant, M., Mitton, J. B. et al. Even larger organisms. Nature 360, 216 (1992).
Huber, H., Hohn M.J. et al. . Nature 417, 63-67 (2002).
Hilton-Taylor, C., Pollock, C.M. et al. State of the world's species. In Wildlife in a Changing World: An Analysis of the 2008 IUCN Red List of Threatened Species. eds. Vié, J., Hilton-Taylor, C. et al. Gland: International Union for Conservation of Nature, 2008.
IUCN. Extinction threat growing for mankind's closest relatives (2008).May, R.M. The dimensions of life on earth. In Nature and Human Society: The Quest for a Sustainable World. ed. Raven, P.H. (Washington: National Academy Press, 2000) 30-45.
National Park Service, Department of the Interior, USA. The National Park System: Caring for the American Legacy (2010).
Peopleandplanet.net. People and ecotourism. (2009)
Raup, D.M. The role of extinction in evolution. Proceedings National Academy Science USA 91, 6758-6763 (1994).
Thoreau, H.D. Henry David Thoreau Quotations, Biography (1817–1862), Walden, Journal, A Week on the Concord and Merrimack Rivers, Economy (1837), 2010.
USDA Forest Service. Humongous Fungus: A New Kind Of Individual. Science Daily (2003).
Wilson, E. O. Speciation and Biodiversity. American Instsitute of Biological Sciences (2002).
© 2010 Nature Education 6/6
2 0 1 0 A N D B E Y O N D
Ris ing to the b iod ivers i ty cha l lenge
©1986
Panda
symbolW
WF
World
Wide
FundFor
Nature
LPR_CBD_cover.qxd 8/4/08 13:34 Page FCA
ACKNOWLEDGEMENTS
Living Planet IndexThe authors are extremely grateful to the following individuals and organizations for sharing their data: RichardGregory and the European Bird Census Council for data from the Pan-European Common Bird Monitoringscheme; the Global Population Dynamics Database from the Centre for Population Biology, Imperial CollegeLondon; Derek Pomeroy, Betty Lutaaya and Herbert Tushabe for data from the National Biodiversity Database,Makerere University Institute of Environment and Natural Resources, Uganda; Kristin Thorsrud Teien and JorgenRanders, WWF-Norway; Pere Tomas-Vives, Christian Perennou, Driss Ezzine de Blas and Patrick Grillas, Tour duValat, Camargue, France; Parks Canada; David Henry, Kluane Ecological Monitoring Project; Lisa Wilkinson,Alberta Fish and Wildlife Division. Many thanks to Chris Hails and Gordon Shepherd, WWF International, for theirhelp and support on this project.
Ecological FootprintMuch of the background research for this report would not have been possible without the generous supportof The Skoll Foundation, The Roy A. Hunt Foundation, Flora Family Foundation, Mental Insight Foundation,The Dudley Foundation, Erlenmeyer Stiftung and a dedicated community of individual donors.
EDITOR
Jonathan Loh1,2
AUTHORS
Living Planet Index2
Ben CollenLouise McRaeGayle KothariRachel MellorOlivia DanielAnnemarie GreenwoodRajan AminSarah HolbrookJonathan E.M. Baillie
Ecological Footprint3
Steven GoldfingerJustin KitzesMathis WackernagelAudrey PellerRobert Williams
Building security for the future1
Rémy Kalter Rolf Hogan Gordon Shepherd
1. WWF InternationalAvenue du Mont-BlancCH-1196 GlandSwitzerlandwww.panda.org
2. Institute of ZoologyZoological Society of LondonRegent’s ParkLondon NW1 4RY, UKwww.zoo.cam.ac.uk/ioz
3. Global Footprint Network1050 Warfield AveOakland, CA 94610, USAwww.footprintnetwork.org
PHOTOS
Front cover (left to right): WWF-Canon/Michel Terrettaz; WWF-Canon/Homo ambiens/R. Isotti-A. Cambone;WWF-Canon/Sebastian Rich; WWF/Catherine Holloway;WWF-Canon/Roger Le Guen. Page 7 (left to right, top tobottom): WWF-Canon/Jason Rubens; WWF-Canon/Homo ambiens/R. Isotti-A. Cambone; WWF-Canon/Jo
Benn; WWF-Canon/Roger Le Guen; WWF-Canon/Michel Gunther; WWF/Catherine Holloway; WWF-Canon/Homoambiens/R. Isotti-A. Cambone; WWF-Canon/VladimirFilonov; WWF-Canon/Michel Terrettaz; WWF/ChineseAcademy of Science; WWF-Canon/Hal Whitehead;WWF/James W. Latourette.
Published in April 2008 byWWF–World Wide Fund ForNature (formerly World WildlifeFund), Gland, Switzerland.
Any reproduction in full or inpart of this publication mustmention the title and credit theabove-mentioned publisher asthe copyright owner.
© text and graphics: 2008 WWFAll rights reserved
ISBN: 978-2-88085-287-0
The material and the geographicaldesignations in this report do notimply the expression of any opinionwhatsoever on the part of WWFconcerning the legal status of anycountry, territory, or area, orconcerning the delimitation of itsfrontiers or boundaries.
A BANSON ProductionCambridge, UK
Printed in Switzerland by Ropress on Aconda Verd Silk FSC, 40%recycled fibre and 60% virgin woodfibre, at least 50% of which is certifiedin accordance with the rules of FSC,using vegetable-oil-based inks.
WWF(also known as World WildlifeFund in the USA and Canada) isone of the world’s largest andmost experienced independentconservation organizations, withalmost 5 million supporters and a global network active in over100 countries. WWF’s mission isto stop the degradation of theplanet’s natural environment andto build a future in which humanslive in harmony with nature.
ZOOLOGICAL SOCIETY OF LONDONFounded in 1826, the ZoologicalSociety of London (ZSL) is an international scientific,conservation and educationalcharity: its key role is theconservation of animals and theirhabitats. ZSL runs ZSL LondonZoo and ZSL Whipsnade Zoo,carries out scientific research in the Institute of Zoology and is actively involved in fieldconservation in over 30 countriesworldwide. www.zsl.org
GLOBAL FOOTPRINTNETWORKpromotes a sustainable economyby advancing the EcologicalFootprint, a tool that makessustainability measurable.Together with its partners, thenetwork coordinates research,develops methodologicalstandards, and provides decisionmakers with robust resourceaccounts to help the humaneconomy operate within theEarth’s ecological limits.
LPR_CBD_cover.qxd 15/4/08 13:29 Page IFCB
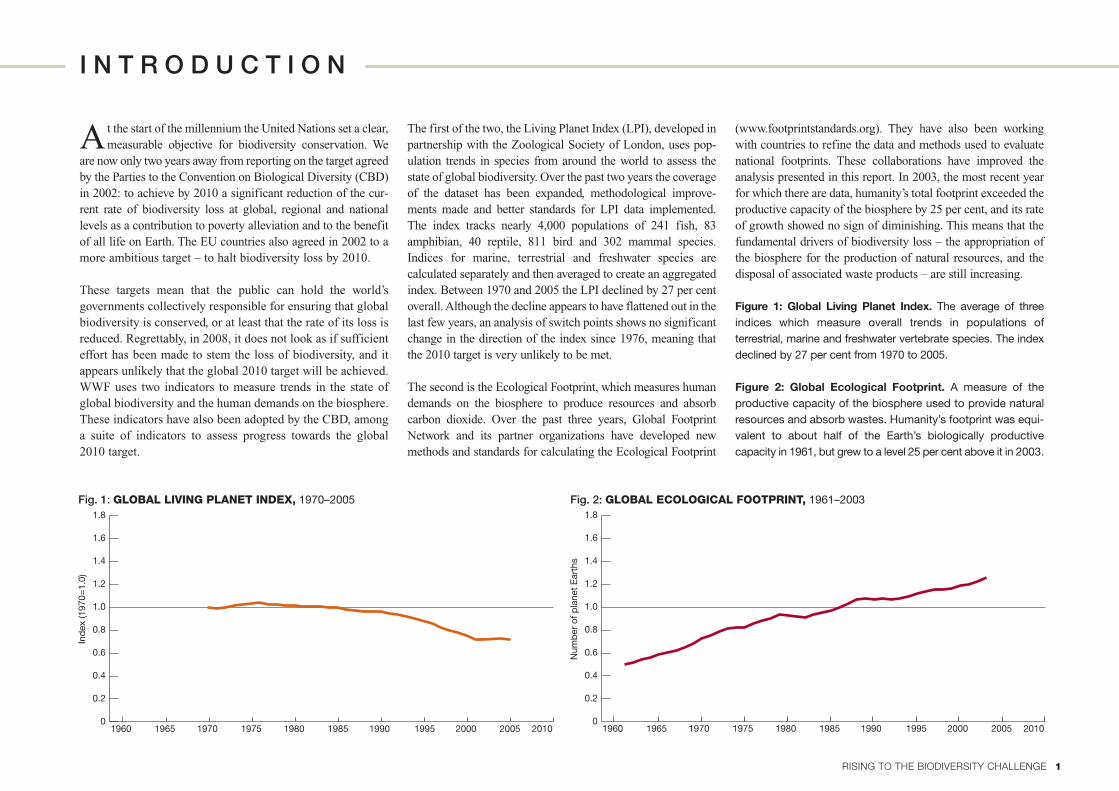
1960 1970 1980 1990 2000 20101965 1975 1985 1995 2005
Fig. 1: GLOBAL LIVING PLANET INDEX, 1970–2005
0.8
0.6
1.4
1.6
0
0.2
0.4
1.2
1.8
1.0
Ind
ex (1
970=
1.0)
1960 1970 1980 1990 2000 20101965 1975 1985 1995 2005
Fig. 2: GLOBAL ECOLOGICAL FOOTPRINT, 1961–2003
0.8
0.6
1.4
1.6
0
0.2
0.4
1.2
1.8
1.0
Num
ber
of p
lane
t E
arth
s
1RISING TO THE BIODIVERSITY CHALLENGE
I N T R O D U C T I O N
At the start of the millennium the United Nations set a clear,measurable objective for biodiversity conservation. We
are now only two years away from reporting on the target agreedby the Parties to the Convention on Biological Diversity (CBD)in 2002: to achieve by 2010 a significant reduction of the cur-rent rate of biodiversity loss at global, regional and nationallevels as a contribution to poverty alleviation and to the benefitof all life on Earth. The EU countries also agreed in 2002 to amore ambitious target – to halt biodiversity loss by 2010.
These targets mean that the public can hold the world’sgovernments collectively responsible for ensuring that globalbiodiversity is conserved, or at least that the rate of its loss isreduced. Regrettably, in 2008, it does not look as if sufficienteffort has been made to stem the loss of biodiversity, and itappears unlikely that the global 2010 target will be achieved.WWF uses two indicators to measure trends in the state ofglobal biodiversity and the human demands on the biosphere.These indicators have also been adopted by the CBD, amonga suite of indicators to assess progress towards the global2010 target.
The first of the two, the Living Planet Index (LPI), developed inpartnership with the Zoological Society of London, uses pop-ulation trends in species from around the world to assess thestate of global biodiversity. Over the past two years the coverageof the dataset has been expanded, methodological improve-ments made and better standards for LPI data implemented. The index tracks nearly 4,000 populations of 241 fish, 83amphibian, 40 reptile, 811 bird and 302 mammal species.Indices for marine, terrestrial and freshwater species arecalculated separately and then averaged to create an aggregatedindex. Between 1970 and 2005 the LPI declined by 27 per centoverall. Although the decline appears to have flattened out in thelast few years, an analysis of switch points shows no significantchange in the direction of the index since 1976, meaning thatthe 2010 target is very unlikely to be met.
The second is the Ecological Footprint, which measures humandemands on the biosphere to produce resources and absorbcarbon dioxide. Over the past three years, Global FootprintNetwork and its partner organizations have developed newmethods and standards for calculating the Ecological Footprint
(www.footprintstandards.org). They have also been workingwith countries to refine the data and methods used to evaluatenational footprints. These collaborations have improved theanalysis presented in this report. In 2003, the most recent yearfor which there are data, humanity’s total footprint exceeded theproductive capacity of the biosphere by 25 per cent, and its rateof growth showed no sign of diminishing. This means that thefundamental drivers of biodiversity loss – the appropriation ofthe biosphere for the production of natural resources, and thedisposal of associated waste products – are still increasing.
Figure 1: Global Living Planet Index. The average of threeindices which measure overall trends in populations ofterrestrial, marine and freshwater vertebrate species. The indexdeclined by 27 per cent from 1970 to 2005.
Figure 2: Global Ecological Footprint. A measure of theproductive capacity of the biosphere used to provide naturalresources and absorb wastes. Humanity’s footprint was equi-valent to about half of the Earth’s biologically productivecapacity in 1961, but grew to a level 25 per cent above it in 2003.
LPR_CBD_text.qxd 8/4/08 12:48 Page 1
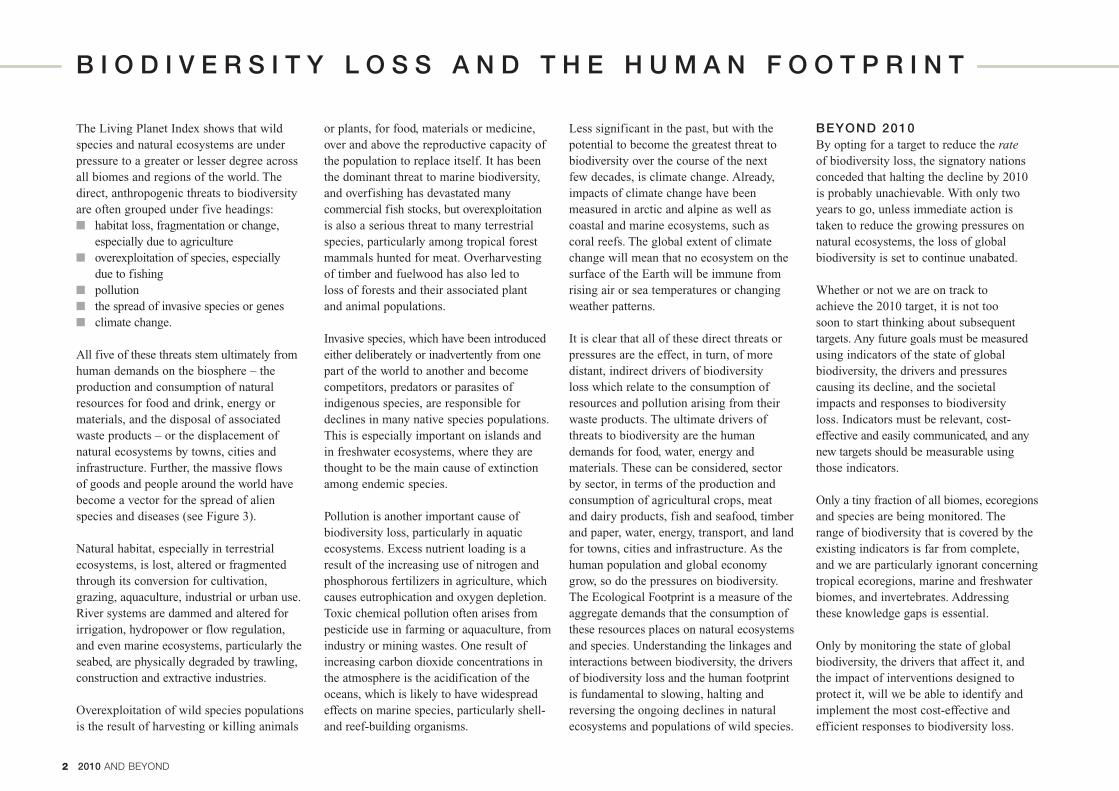
2 2010 AND BEYOND
Less significant in the past, but with thepotential to become the greatest threat tobiodiversity over the course of the next few decades, is climate change. Already,impacts of climate change have beenmeasured in arctic and alpine as well ascoastal and marine ecosystems, such ascoral reefs. The global extent of climatechange will mean that no ecosystem on thesurface of the Earth will be immune fromrising air or sea temperatures or changingweather patterns.
It is clear that all of these direct threats orpressures are the effect, in turn, of moredistant, indirect drivers of biodiversity loss which relate to the consumption ofresources and pollution arising from theirwaste products. The ultimate drivers ofthreats to biodiversity are the humandemands for food, water, energy andmaterials. These can be considered, sectorby sector, in terms of the production andconsumption of agricultural crops, meat and dairy products, fish and seafood, timberand paper, water, energy, transport, and landfor towns, cities and infrastructure. As thehuman population and global economygrow, so do the pressures on biodiversity.The Ecological Footprint is a measure of theaggregate demands that the consumption ofthese resources places on natural ecosystemsand species. Understanding the linkages andinteractions between biodiversity, the driversof biodiversity loss and the human footprintis fundamental to slowing, halting andreversing the ongoing declines in naturalecosystems and populations of wild species.
BEYOND 2010By opting for a target to reduce the rateof biodiversity loss, the signatory nationsconceded that halting the decline by 2010 is probably unachievable. With only twoyears to go, unless immediate action is taken to reduce the growing pressures onnatural ecosystems, the loss of globalbiodiversity is set to continue unabated.
Whether or not we are on track to achieve the 2010 target, it is not too soon to start thinking about subsequenttargets. Any future goals must be measuredusing indicators of the state of globalbiodiversity, the drivers and pressures causing its decline, and the societal impacts and responses to biodiversity loss. Indicators must be relevant, cost-effective and easily communicated, and anynew targets should be measurable usingthose indicators.
Only a tiny fraction of all biomes, ecoregionsand species are being monitored. The range of biodiversity that is covered by theexisting indicators is far from complete, and we are particularly ignorant concerningtropical ecoregions, marine and freshwaterbiomes, and invertebrates. Addressing these knowledge gaps is essential.
Only by monitoring the state of globalbiodiversity, the drivers that affect it, and the impact of interventions designed toprotect it, will we be able to identify andimplement the most cost-effective andefficient responses to biodiversity loss.
The Living Planet Index shows that wildspecies and natural ecosystems are underpressure to a greater or lesser degree acrossall biomes and regions of the world. Thedirect, anthropogenic threats to biodiversityare often grouped under five headings: ■ habitat loss, fragmentation or change,
especially due to agriculture■ overexploitation of species, especially
due to fishing■ pollution■ the spread of invasive species or genes■ climate change.
All five of these threats stem ultimately fromhuman demands on the biosphere – theproduction and consumption of naturalresources for food and drink, energy ormaterials, and the disposal of associatedwaste products – or the displacement ofnatural ecosystems by towns, cities andinfrastructure. Further, the massive flows of goods and people around the world havebecome a vector for the spread of alienspecies and diseases (see Figure 3).
Natural habitat, especially in terrestrialecosystems, is lost, altered or fragmentedthrough its conversion for cultivation,grazing, aquaculture, industrial or urban use.River systems are dammed and altered forirrigation, hydropower or flow regulation,and even marine ecosystems, particularly theseabed, are physically degraded by trawling,construction and extractive industries.
Overexploitation of wild species populationsis the result of harvesting or killing animals
or plants, for food, materials or medicine,over and above the reproductive capacity ofthe population to replace itself. It has beenthe dominant threat to marine biodiversity,and overfishing has devastated manycommercial fish stocks, but overexploitationis also a serious threat to many terrestrialspecies, particularly among tropical forestmammals hunted for meat. Overharvestingof timber and fuelwood has also led to loss of forests and their associated plant and animal populations.
Invasive species, which have been introducedeither deliberately or inadvertently from onepart of the world to another and becomecompetitors, predators or parasites ofindigenous species, are responsible fordeclines in many native species populations.This is especially important on islands and in freshwater ecosystems, where they arethought to be the main cause of extinctionamong endemic species.
Pollution is another important cause ofbiodiversity loss, particularly in aquaticecosystems. Excess nutrient loading is aresult of the increasing use of nitrogen andphosphorous fertilizers in agriculture, whichcauses eutrophication and oxygen depletion.Toxic chemical pollution often arises frompesticide use in farming or aquaculture, fromindustry or mining wastes. One result ofincreasing carbon dioxide concentrations inthe atmosphere is the acidification of theoceans, which is likely to have widespreadeffects on marine species, particularly shell-and reef-building organisms.
B I O D I V E R S I T Y L O S S A N D T H E H U M A N F O O T P R I N T
LPR_CBD_text.qxd 8/4/08 12:48 Page 2
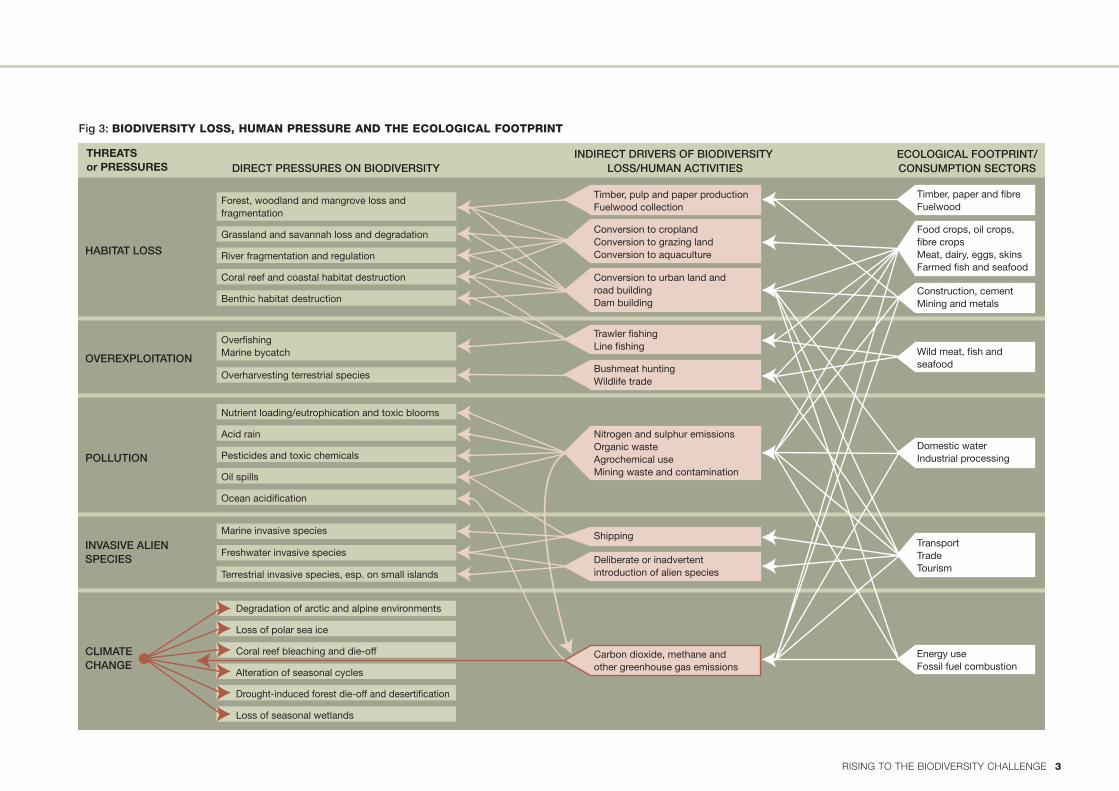
3RISING TO THE BIODIVERSITY CHALLENGE
HABITAT LOSS
OVEREXPLOITATION
POLLUTION
INVASIVE ALIEN SPECIES
CLIMATE CHANGE
Forest, woodland and mangrove loss and fragmentation
Grassland and savannah loss and degradation
River fragmentation and regulation
Coral reef and coastal habitat destruction
Benthic habitat destruction
OverfishingMarine bycatch
Overharvesting terrestrial species
Nutrient loading/eutrophication and toxic blooms
Acid rain
Pesticides and toxic chemicals
Oil spills
Ocean acidification
Degradation of arctic and alpine environments
Loss of polar sea ice
Coral reef bleaching and die-off
Alteration of seasonal cycles
Drought-induced forest die-off and desertification
Loss of seasonal wetlands
Conversion to croplandConversion to grazing landConversion to aquaculture
Timber, pulp and paper productionFuelwood collection
Trawler fishingLine fishing
Bushmeat huntingWildlife trade
Nitrogen and sulphur emissionsOrganic wasteAgrochemical useMining waste and contamination
Timber, paper and fibreFuelwood
Food crops, oil crops, fibre cropsMeat, dairy, eggs, skinsFarmed fish and seafood
Construction, cementMining and metals
Wild meat, fish andseafood
TransportTradeTourism
Domestic waterIndustrial processing
Energy useFossil fuel combustion
Marine invasive species
Freshwater invasive species
Terrestrial invasive species, esp. on small islands
THREATSor PRESSURES DIRECT PRESSURES ON BIODIVERSITY
INDIRECT DRIVERS OF BIODIVERSITY LOSS/HUMAN ACTIVITIES
ECOLOGICAL FOOTPRINT/CONSUMPTION SECTORS
Shipping
Deliberate or inadvertent introduction of alien species
Conversion to urban land and road buildingDam building
Carbon dioxide, methane and other greenhouse gas emissions
Fig 3: BIODIVERSITY LOSS, HUMAN PRESSURE AND THE ECOLOGICAL FOOTPRINT
LPR_CBD_text.qxd 8/4/08 12:48 Page 3
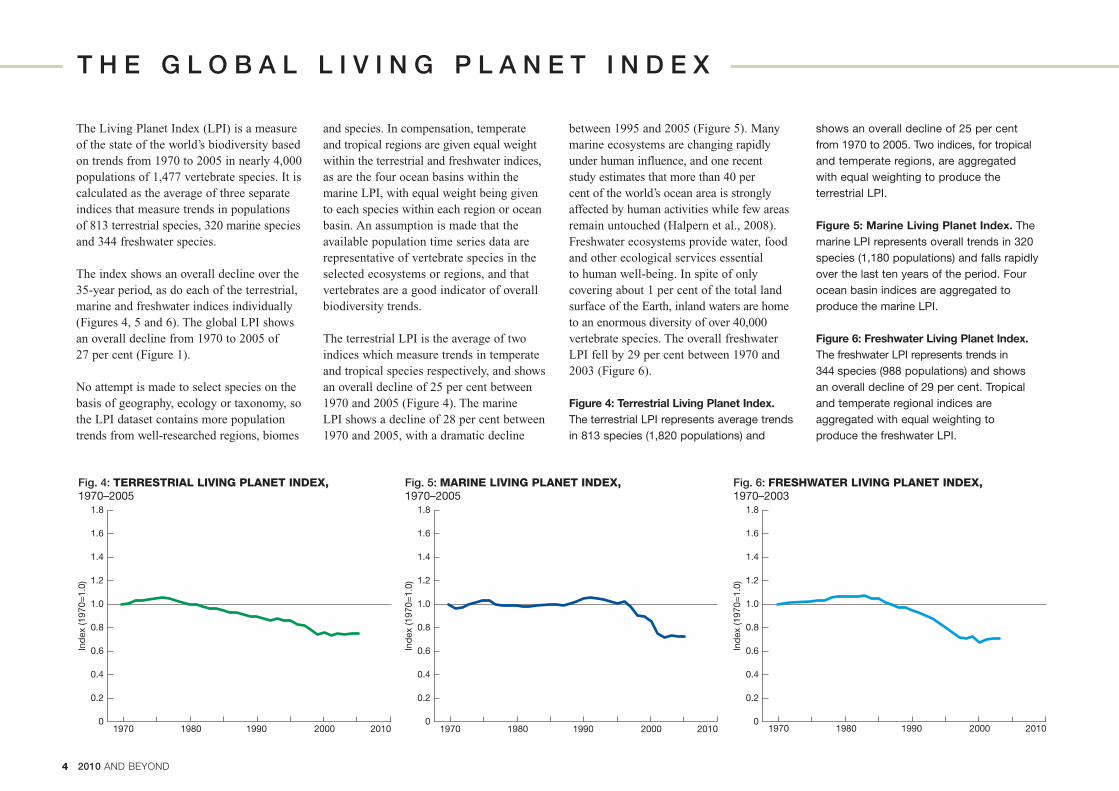
4 2010 AND BEYOND
between 1995 and 2005 (Figure 5). Manymarine ecosystems are changing rapidlyunder human influence, and one recent study estimates that more than 40 per cent of the world’s ocean area is stronglyaffected by human activities while few areasremain untouched (Halpern et al., 2008). Freshwater ecosystems provide water, foodand other ecological services essential to human well-being. In spite of onlycovering about 1 per cent of the total landsurface of the Earth, inland waters are hometo an enormous diversity of over 40,000vertebrate species. The overall freshwaterLPI fell by 29 per cent between 1970 and2003 (Figure 6).
Figure 4: Terrestrial Living Planet Index.The terrestrial LPI represents average trendsin 813 species (1,820 populations) and
shows an overall decline of 25 per cent from 1970 to 2005. Two indices, for tropicaland temperate regions, are aggregated with equal weighting to produce theterrestrial LPI.
Figure 5: Marine Living Planet Index. Themarine LPI represents overall trends in 320species (1,180 populations) and falls rapidlyover the last ten years of the period. Fourocean basin indices are aggregated toproduce the marine LPI.
Figure 6: Freshwater Living Planet Index.The freshwater LPI represents trends in 344 species (988 populations) and shows an overall decline of 29 per cent. Tropicaland temperate regional indices areaggregated with equal weighting to produce the freshwater LPI.
The Living Planet Index (LPI) is a measureof the state of the world’s biodiversity basedon trends from 1970 to 2005 in nearly 4,000populations of 1,477 vertebrate species. It iscalculated as the average of three separateindices that measure trends in populations of 813 terrestrial species, 320 marine speciesand 344 freshwater species.
The index shows an overall decline over the35-year period, as do each of the terrestrial,marine and freshwater indices individually(Figures 4, 5 and 6). The global LPI showsan overall decline from 1970 to 2005 of27 per cent (Figure 1).
No attempt is made to select species on thebasis of geography, ecology or taxonomy, sothe LPI dataset contains more populationtrends from well-researched regions, biomes
and species. In compensation, temperate and tropical regions are given equal weightwithin the terrestrial and freshwater indices,as are the four ocean basins within themarine LPI, with equal weight being given to each species within each region or oceanbasin. An assumption is made that theavailable population time series data arerepresentative of vertebrate species in theselected ecosystems or regions, and thatvertebrates are a good indicator of overallbiodiversity trends.
The terrestrial LPI is the average of twoindices which measure trends in temperateand tropical species respectively, and showsan overall decline of 25 per cent between1970 and 2005 (Figure 4). The marine LPI shows a decline of 28 per cent between1970 and 2005, with a dramatic decline
Fig. 5: MARINE LIVING PLANET INDEX,1970–2005
0.8
0.6
1.8
1.6
1.2
0
0.2
0.4
1.4
1.0
Ind
ex (1
970=
1.0)
1970 1980 1990 2000 2010
Fig. 6: FRESHWATER LIVING PLANET INDEX,1970–2003
0.8
0.6
1.8
1.6
1.2
0
0.2
0.4
1.4
1.0
Ind
ex (1
970=
1.0)
1970 1980 1990 2000 2010
Fig. 4: TERRESTRIAL LIVING PLANET INDEX,1970–2005
0.8
0.6
1.8
1.6
1.2
0
0.2
0.4
1.4
1.0
Ind
ex (1
970=
1.0)
1970 1980 1990 2000 2010
T H E G L O B A L L I V I N G P L A N E T I N D E X
LPR_CBD_text.qxd 8/4/08 12:48 Page 4
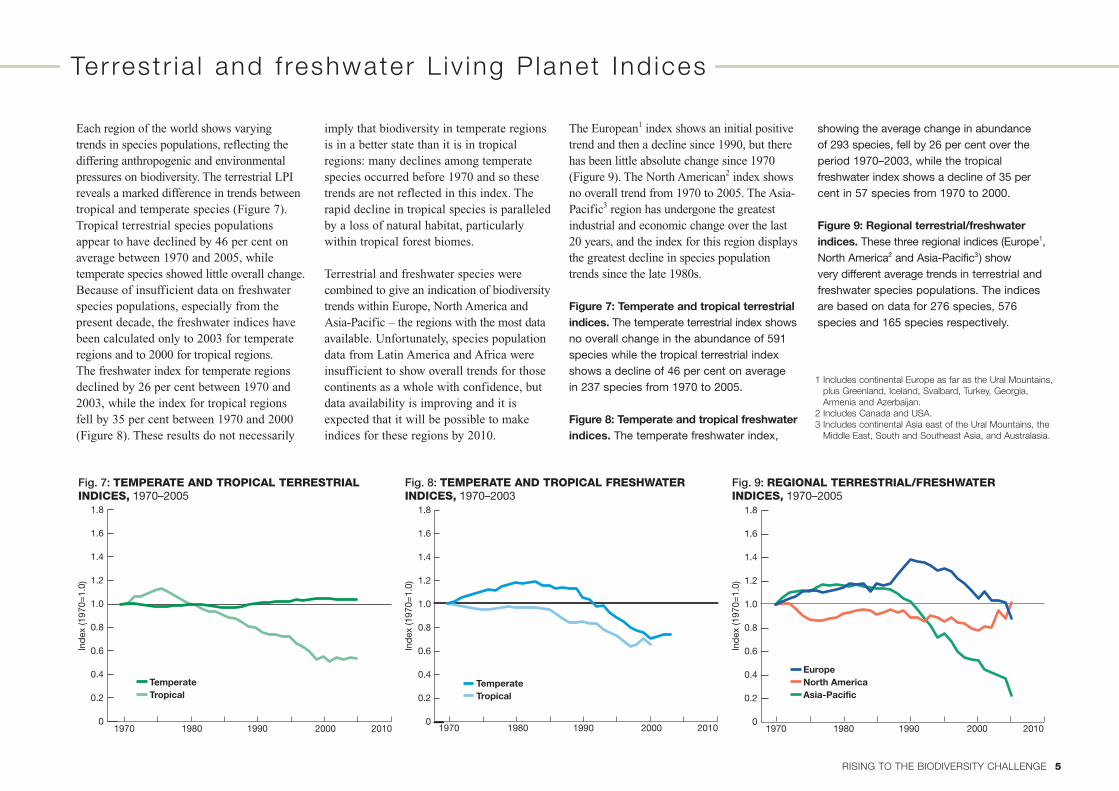
5RISING TO THE BIODIVERSITY CHALLENGE
The European1 index shows an initial positivetrend and then a decline since 1990, but therehas been little absolute change since 1970(Figure 9). The North American2 index showsno overall trend from 1970 to 2005. The Asia-Pacific3 region has undergone the greatestindustrial and economic change over the last20 years, and the index for this region displaysthe greatest decline in species populationtrends since the late 1980s.
Figure 7: Temperate and tropical terrestrialindices. The temperate terrestrial index showsno overall change in the abundance of 591species while the tropical terrestrial indexshows a decline of 46 per cent on average in 237 species from 1970 to 2005.
Figure 8: Temperate and tropical freshwaterindices. The temperate freshwater index,
showing the average change in abundance of 293 species, fell by 26 per cent over theperiod 1970–2003, while the tropicalfreshwater index shows a decline of 35 percent in 57 species from 1970 to 2000.
Figure 9: Regional terrestrial/freshwaterindices. These three regional indices (Europe1,North America2 and Asia-Pacific3) show very different average trends in terrestrial andfreshwater species populations. The indicesare based on data for 276 species, 576species and 165 species respectively.
Each region of the world shows varyingtrends in species populations, reflecting thediffering anthropogenic and environmentalpressures on biodiversity. The terrestrial LPIreveals a marked difference in trends betweentropical and temperate species (Figure 7).Tropical terrestrial species populationsappear to have declined by 46 per cent onaverage between 1970 and 2005, whiletemperate species showed little overall change.Because of insufficient data on freshwaterspecies populations, especially from thepresent decade, the freshwater indices havebeen calculated only to 2003 for temperateregions and to 2000 for tropical regions. The freshwater index for temperate regionsdeclined by 26 per cent between 1970 and2003, while the index for tropical regionsfell by 35 per cent between 1970 and 2000(Figure 8). These results do not necessarily
imply that biodiversity in temperate regionsis in a better state than it is in tropicalregions: many declines among temperatespecies occurred before 1970 and so thesetrends are not reflected in this index. Therapid decline in tropical species is paralleledby a loss of natural habitat, particularlywithin tropical forest biomes.
Terrestrial and freshwater species werecombined to give an indication of biodiversitytrends within Europe, North America andAsia-Pacific – the regions with the most dataavailable. Unfortunately, species populationdata from Latin America and Africa wereinsufficient to show overall trends for thosecontinents as a whole with confidence, butdata availability is improving and it isexpected that it will be possible to makeindices for these regions by 2010.
Fig. 8: TEMPERATE AND TROPICAL FRESHWATER INDICES, 1970–2003
Ind
ex (1
970=
1.0)
Temperate Tropical
1970 1980 1990 2000 20100
0.2
0.4
0.6
0.8
1.0
1.2
1.4
1.6
1.8
Fig. 9: REGIONAL TERRESTRIAL/FRESHWATER INDICES, 1970–2005
Ind
ex (1
970=
1.0)
Europe North America Asia-Pacific
1970 1980 1990 2000 20100
0.2
0.4
0.6
0.8
1.0
1.2
1.4
1.6
1.8
Fig. 7: TEMPERATE AND TROPICAL TERRESTRIAL INDICES, 1970–2005
0.8
0.6
1.8
1.6
1.2
0
0.2
0.4
1.4
1.0
Ind
ex (1
970=
1.0)
Temperate Tropical
1970 1980 1990 2000 2010
1 Includes continental Europe as far as the Ural Mountains,plus Greenland, Iceland, Svalbard, Turkey, Georgia,Armenia and Azerbaijan.
2 Includes Canada and USA.3 Includes continental Asia east of the Ural Mountains, the
Middle East, South and Southeast Asia, and Australasia.
Ter rest r ia l and f reshwater L iv ing P lanet Ind ices
LPR_CBD_text.qxd 8/4/08 12:48 Page 5
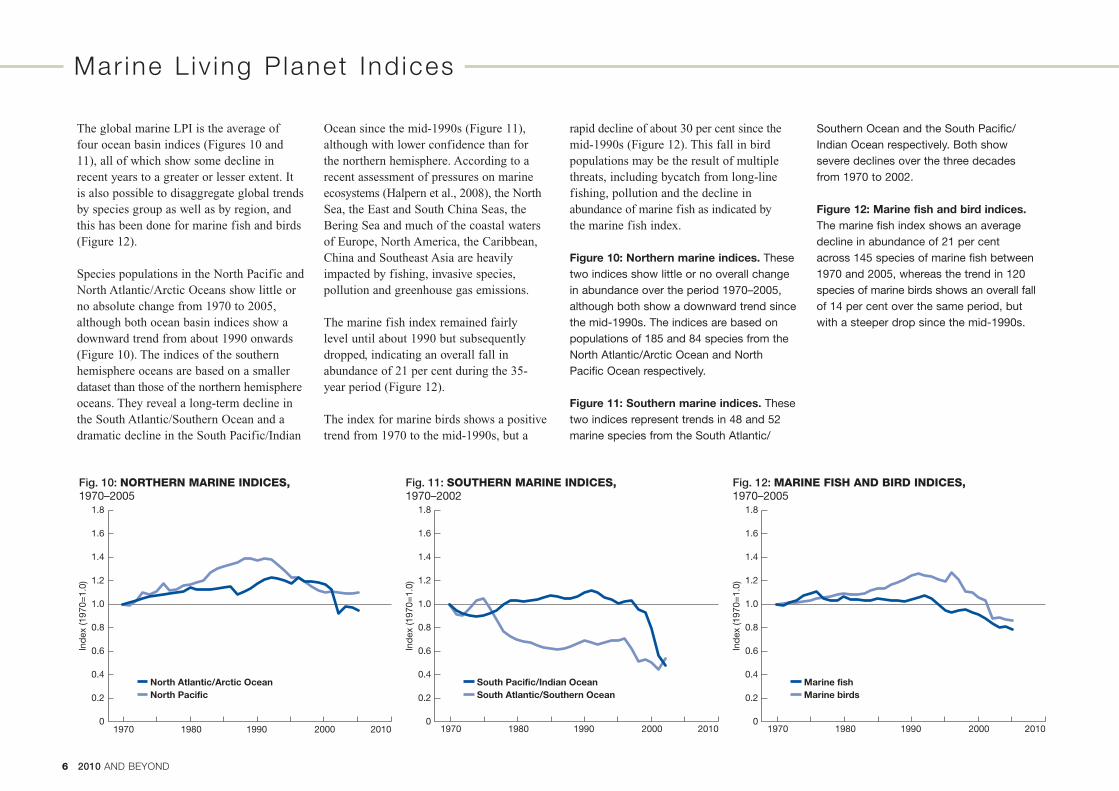
6 2010 AND BEYOND
rapid decline of about 30 per cent since themid-1990s (Figure 12). This fall in birdpopulations may be the result of multiplethreats, including bycatch from long-linefishing, pollution and the decline inabundance of marine fish as indicated by the marine fish index.
Figure 10: Northern marine indices. Thesetwo indices show little or no overall changein abundance over the period 1970–2005,although both show a downward trend sincethe mid-1990s. The indices are based onpopulations of 185 and 84 species from theNorth Atlantic/Arctic Ocean and NorthPacific Ocean respectively.
Figure 11: Southern marine indices. Thesetwo indices represent trends in 48 and 52marine species from the South Atlantic/
Southern Ocean and the South Pacific/Indian Ocean respectively. Both show severe declines over the three decades from 1970 to 2002.
Figure 12: Marine fish and bird indices.The marine fish index shows an averagedecline in abundance of 21 per cent across 145 species of marine fish between1970 and 2005, whereas the trend in 120species of marine birds shows an overall fallof 14 per cent over the same period, butwith a steeper drop since the mid-1990s.
The global marine LPI is the average of four ocean basin indices (Figures 10 and11), all of which show some decline inrecent years to a greater or lesser extent. Itis also possible to disaggregate global trendsby species group as well as by region, andthis has been done for marine fish and birds(Figure 12).
Species populations in the North Pacific andNorth Atlantic/Arctic Oceans show little orno absolute change from 1970 to 2005,although both ocean basin indices show adownward trend from about 1990 onwards(Figure 10). The indices of the southernhemisphere oceans are based on a smallerdataset than those of the northern hemisphereoceans. They reveal a long-term decline inthe South Atlantic/Southern Ocean and adramatic decline in the South Pacific/Indian
Ocean since the mid-1990s (Figure 11),although with lower confidence than for the northern hemisphere. According to arecent assessment of pressures on marineecosystems (Halpern et al., 2008), the NorthSea, the East and South China Seas, theBering Sea and much of the coastal watersof Europe, North America, the Caribbean,China and Southeast Asia are heavilyimpacted by fishing, invasive species,pollution and greenhouse gas emissions.
The marine fish index remained fairly level until about 1990 but subsequentlydropped, indicating an overall fall inabundance of 21 per cent during the 35-year period (Figure 12).
The index for marine birds shows a positivetrend from 1970 to the mid-1990s, but a
1970 1980 1990 2000 2010
Fig. 11: SOUTHERN MARINE INDICES, 1970–2002
0.8
0.6
1.8
1.6
1.2
0
0.2
0.4
1.4
1.0
Ind
ex (1
970=
1.0)
South Pacific/Indian Ocean South Atlantic/Southern Ocean
Fig. 12: MARINE FISH AND BIRD INDICES, 1970–2005
0.8
0.6
1.8
1.6
1.2
0
0.2
0.4
1.4
1.0
Ind
ex (1
970=
1.0)
Marine fish Marine birds
1970 1980 1990 2000 2010
Fig. 10: NORTHERN MARINE INDICES, 1970–2005
0.8
0.6
1.8
1.6
1.2
0
0.2
0.4
1.4
1.0
Ind
ex (1
970=
1.0)
North Atlantic/Arctic Ocean North Pacific
1970 1980 1990 2000 2010
Mar ine L iv ing P lanet Ind ices
LPR_CBD_text corrected.qxd 15/4/08 14:10 Page 6
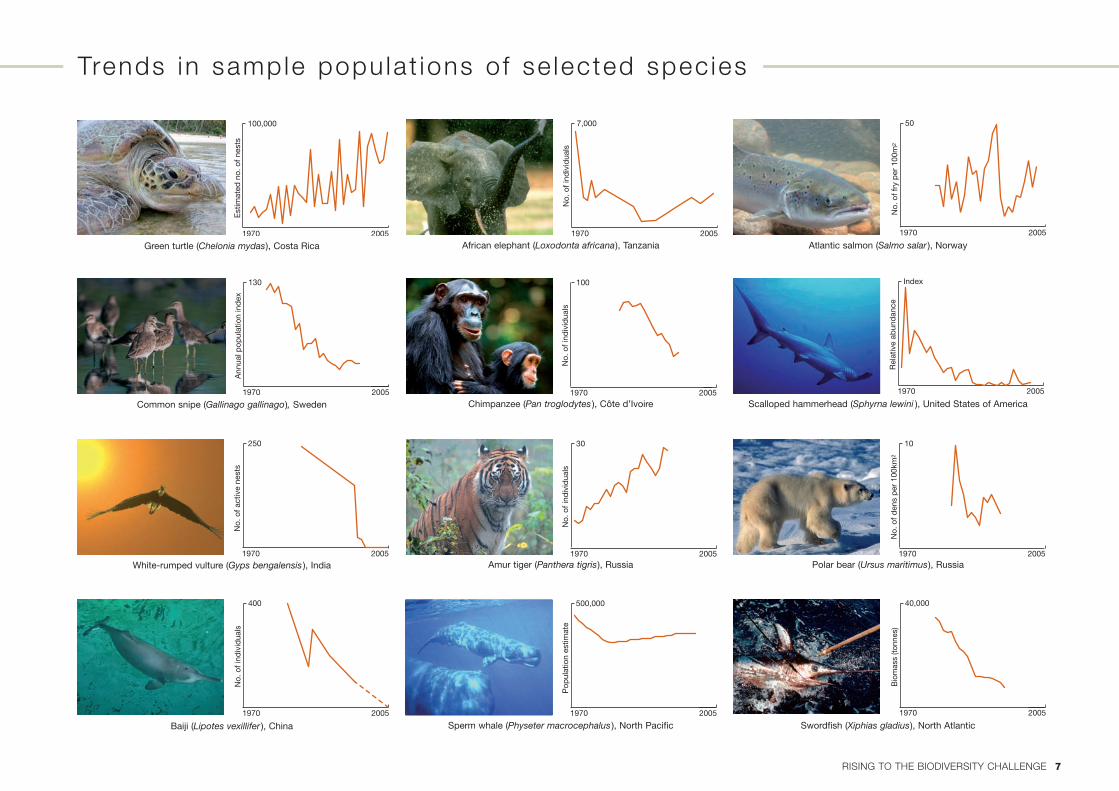
7RISING TO THE BIODIVERSITY CHALLENGE
Trends in sample popu la t ions o f se lected spec ies
1970 2005
100,000
Est
imat
ed n
o. o
f nes
ts
Green turtle (Chelonia mydas), Costa Rica
1970 2005
130
Ann
ual p
opul
atio
n in
dex
Common snipe (Gallinago gallinago), Sweden
1970 2005
250
No.
of a
ctiv
e ne
sts
White-rumped vulture (Gyps bengalensis ), India
1970 2005
400
No.
of i
ndiv
idua
ls
Baiji (Lipotes vexillifer ), China
1970 2005
7,000
No.
of i
ndiv
idua
ls
African elephant (Loxodonta africana), Tanzania
1970 2005
100
No.
of i
ndiv
idua
ls
Chimpanzee (Pan troglodytes ), Côte d’Ivoire
1970 2005
30
No.
of i
ndiv
idua
lsAmur tiger (Panthera tigris), Russia
1970 2005
500,000
Pop
ulat
ion
estim
ate
Sperm whale (Physeter macrocephalus ), North Pacific
1970 2005
50
No.
of f
ry p
er 1
00m
2
Atlantic salmon (Salmo salar ), Norway
1970 2005
Index
Rel
ativ
e ab
und
ance
Scalloped hammerhead (Sphyrna lewini ), United States of America
1970 2005
10
No.
of d
ens
per
100
km2
Polar bear (Ursus maritimus), Russia
1970 2005
40,000
Bio
mas
s (to
nnes
)
Swordfish (Xiphias gladius), North Atlantic
LPR_CBD_text corrected.qxd 15/4/08 13:15 Page 7
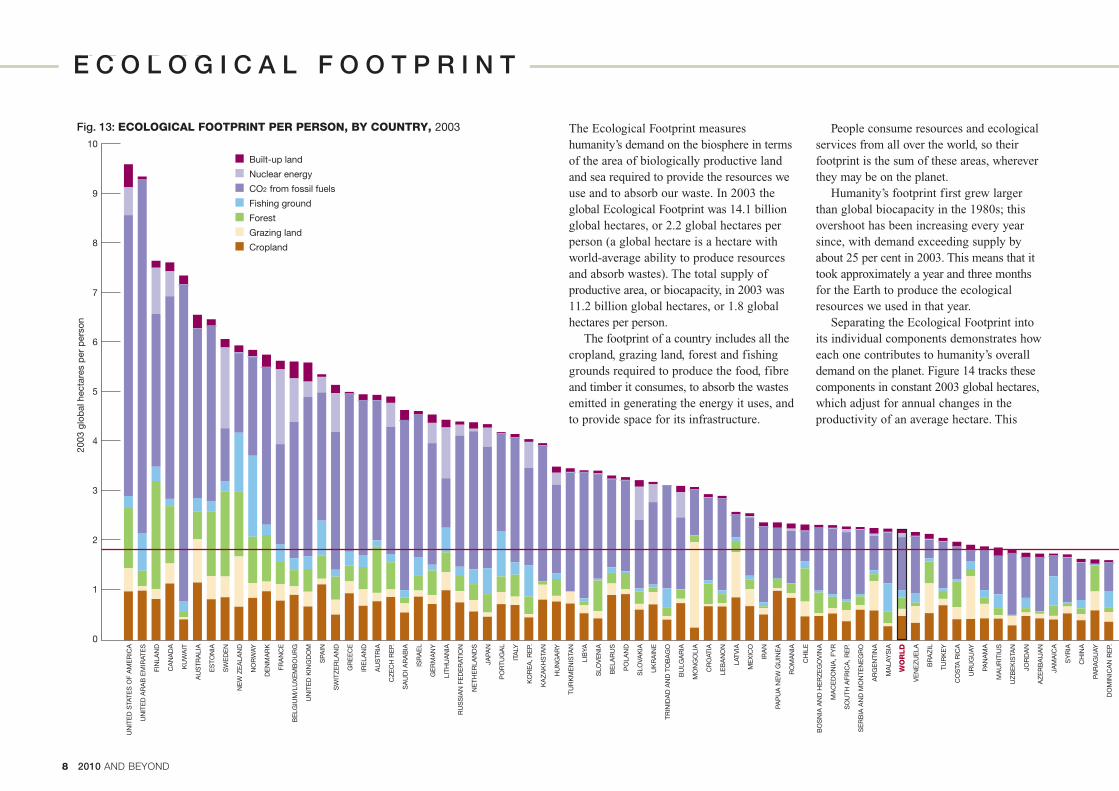
8 2010 AND BEYOND
H E A D E R
Fig. 13: ECOLOGICAL FOOTPRINT PER PERSON, BY COUNTRY, 2003 10
9
8
7
6
4
5
3
2
1
0
2003
glo
bal
hec
tare
s p
er p
erso
n
■ Built-up land
■ Nuclear energy
■ CO2 from fossil fuels
■ Fishing ground
■ Forest
■ Grazing land
■ Cropland
UN
ITE
D S
TATE
S O
F A
ME
RIC
A
UN
ITE
D A
RA
B E
MIR
ATE
S
FIN
LAN
D
CA
NA
DA
KU
WA
IT
AU
STR
ALI
A
ES
TON
IA
SW
ED
EN
NE
W Z
EA
LAN
D
NO
RW
AY
DE
NM
AR
K
FRA
NC
E
BE
LGIU
M/L
UX
EM
BO
UR
G
UN
ITE
D K
ING
DO
M
SPA
IN
SW
ITZ
ER
LAN
D
GR
EE
CE
IRE
LAN
D
AU
STR
IA
CZ
EC
H R
EP.
SA
UD
I AR
AB
IA
ISR
AE
L
GE
RM
AN
Y
LITH
UA
NIA
RU
SS
IAN
FE
DE
RAT
ION
NE
THE
RLA
ND
S
JAPA
N
PO
RTU
GA
L
ITA
LY
KO
RE
A, R
EP.
KA
ZA
KH
STA
N
HU
NG
AR
Y
TUR
KM
EN
ISTA
N
LIB
YA
SLO
VE
NIA
BE
LAR
US
PO
LAN
D
SLO
VAK
IA
UK
RA
INE
TRIN
IDA
D A
ND
TO
BA
GO
BU
LGA
RIA
MO
NG
OLI
A
CR
OAT
IA
LEB
AN
ON
LATV
IA
ME
XIC
O
IRA
N
PAP
UA
NE
W G
UIN
EA
RO
MA
NIA
CH
ILE
BO
SN
IA A
ND
HE
RZ
EG
OV
INA
MA
CE
DO
NIA
, FY
R
SO
UTH
AFR
ICA
, RE
P.
SE
RB
IA A
ND
MO
NTE
NE
GR
O
AR
GE
NTI
NA
MA
LAY
SIA
WO
RLD
VE
NE
ZU
ELA
BR
AZ
IL
TUR
KE
Y
CO
STA
RIC
A
UR
UG
UAY
PAN
AM
A
MA
UR
ITIU
S
UZ
BE
KIS
TAN
JOR
DA
N
AZ
ER
BA
IJA
N
JAM
AIC
A
SY
RIA
CH
INA
PAR
AG
UAY
DO
MIN
ICA
N R
EP.
ALG
ER
IA
The Ecological Footprint measureshumanity’s demand on the biosphere in termsof the area of biologically productive landand sea required to provide the resources weuse and to absorb our waste. In 2003 theglobal Ecological Footprint was 14.1 billionglobal hectares, or 2.2 global hectares perperson (a global hectare is a hectare withworld-average ability to produce resourcesand absorb wastes). The total supply ofproductive area, or biocapacity, in 2003 was11.2 billion global hectares, or 1.8 globalhectares per person.
The footprint of a country includes all thecropland, grazing land, forest and fishinggrounds required to produce the food, fibreand timber it consumes, to absorb the wastesemitted in generating the energy it uses, andto provide space for its infrastructure.
People consume resources and ecologicalservices from all over the world, so theirfootprint is the sum of these areas, whereverthey may be on the planet.
Humanity’s footprint first grew larger than global biocapacity in the 1980s; thisovershoot has been increasing every yearsince, with demand exceeding supply byabout 25 per cent in 2003. This means that ittook approximately a year and three monthsfor the Earth to produce the ecologicalresources we used in that year.
Separating the Ecological Footprint into its individual components demonstrates howeach one contributes to humanity’s overalldemand on the planet. Figure 14 tracks thesecomponents in constant 2003 global hectares,which adjust for annual changes in theproductivity of an average hectare. This
E C O L O G I C A L F O O T P R I N T
LPR_CBD_text.qxd 8/4/08 12:48 Page 8
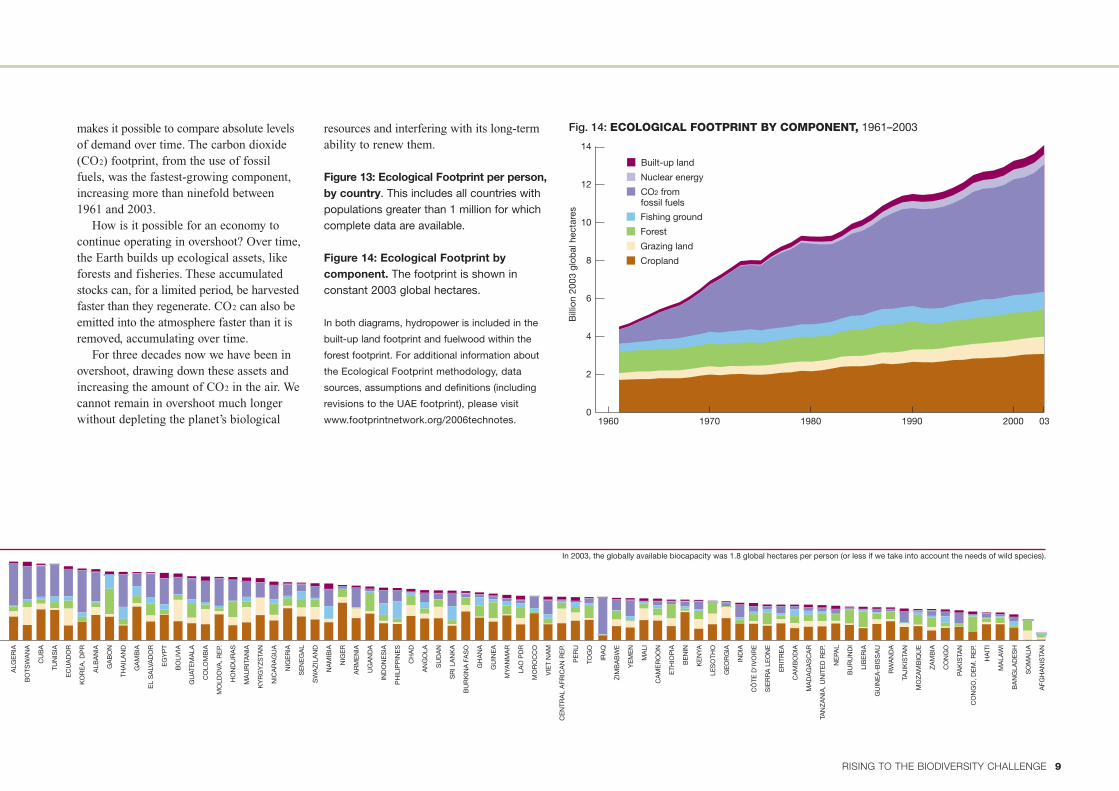
9RISING TO THE BIODIVERSITY CHALLENGE
In 2003, the globally available biocapacity was 1.8 global hectares per person (or less if we take into account the needs of wild species).
DO
MIN
ICA
NR
EP.
ALG
ER
IA
BO
TSW
AN
A
CU
BA
TUN
ISIA
EC
UA
DO
R
KO
RE
A, D
PR
ALB
AN
IA
GA
BO
N
THA
ILA
ND
GA
MB
IA
EL
SA
LVA
DO
R
EG
YP
T
BO
LIV
IA
GU
ATE
MA
LA
CO
LOM
BIA
MO
LDO
VA, R
EP.
HO
ND
UR
AS
MA
UR
ITA
NIA
KY
RG
YZ
STA
N
NIC
AR
AG
UA
NIG
ER
IA
SE
NE
GA
L
SW
AZ
ILA
ND
NA
MIB
IA
NIG
ER
AR
ME
NIA
UG
AN
DA
IND
ON
ES
IA
PH
ILIP
PIN
ES
CH
AD
AN
GO
LA
SU
DA
N
SR
I LA
NK
A
BU
RK
INA
FA
SO
GH
AN
A
GU
INE
A
MYA
NM
AR
LAO
PD
R
MO
RO
CC
O
VIE
T N
AM
CE
NTR
AL
AFR
ICA
N R
EP.
PE
RU
TOG
O
IRA
Q
ZIM
BA
BW
E
YE
ME
N
MA
LI
CA
ME
RO
ON
ETH
IOP
IA
BE
NIN
KE
NYA
LES
OTH
O
GE
OR
GIA
IND
IA
CÔ
TE D
'IVO
IRE
SIE
RR
A L
EO
NE
ER
ITR
EA
CA
MB
OD
IA
MA
DA
GA
SC
AR
TAN
ZA
NIA
, UN
ITE
D R
EP.
NE
PAL
BU
RU
ND
I
LIB
ER
IA
GU
INE
A-B
ISS
AU
RW
AN
DA
TAJI
KIS
TAN
MO
ZA
MB
IQU
E
ZA
MB
IA
CO
NG
O
PAK
ISTA
N
CO
NG
O, D
EM
. RE
P.
HA
ITI
MA
LAW
I
BA
NG
LAD
ES
H
SO
MA
LIA
AFG
HA
NIS
TAN
Fig. 14: ECOLOGICAL FOOTPRINT BY COMPONENT, 1961–2003
8
6
0
2
4
12
14
10
1960 1970 1980 1990 2000 03
Bill
ion
2003
glo
bal
hec
tare
s
■ Nuclear energy
■ CO2 fromfossil fuels
■ Built-up land
■ Fishing ground
■ Forest
■ Grazing land
■ Cropland
makes it possible to compare absolute levelsof demand over time. The carbon dioxide(CO2) footprint, from the use of fossil fuels, was the fastest-growing component,increasing more than ninefold between 1961 and 2003.
How is it possible for an economy tocontinue operating in overshoot? Over time,the Earth builds up ecological assets, likeforests and fisheries. These accumulatedstocks can, for a limited period, be harvestedfaster than they regenerate. CO2 can also beemitted into the atmosphere faster than it isremoved, accumulating over time.
For three decades now we have been inovershoot, drawing down these assets andincreasing the amount of CO2 in the air. Wecannot remain in overshoot much longerwithout depleting the planet’s biological
resources and interfering with its long-termability to renew them.
Figure 13: Ecological Footprint per person,by country. This includes all countries withpopulations greater than 1 million for whichcomplete data are available.
Figure 14: Ecological Footprint bycomponent. The footprint is shown inconstant 2003 global hectares.
In both diagrams, hydropower is included in the
built-up land footprint and fuelwood within the
forest footprint. For additional information about
the Ecological Footprint methodology, data
sources, assumptions and definitions (including
revisions to the UAE footprint), please visit
www.footprintnetwork.org/2006technotes.
LPR_CBD_text corrected.qxd 15/4/08 14:01 Page 9
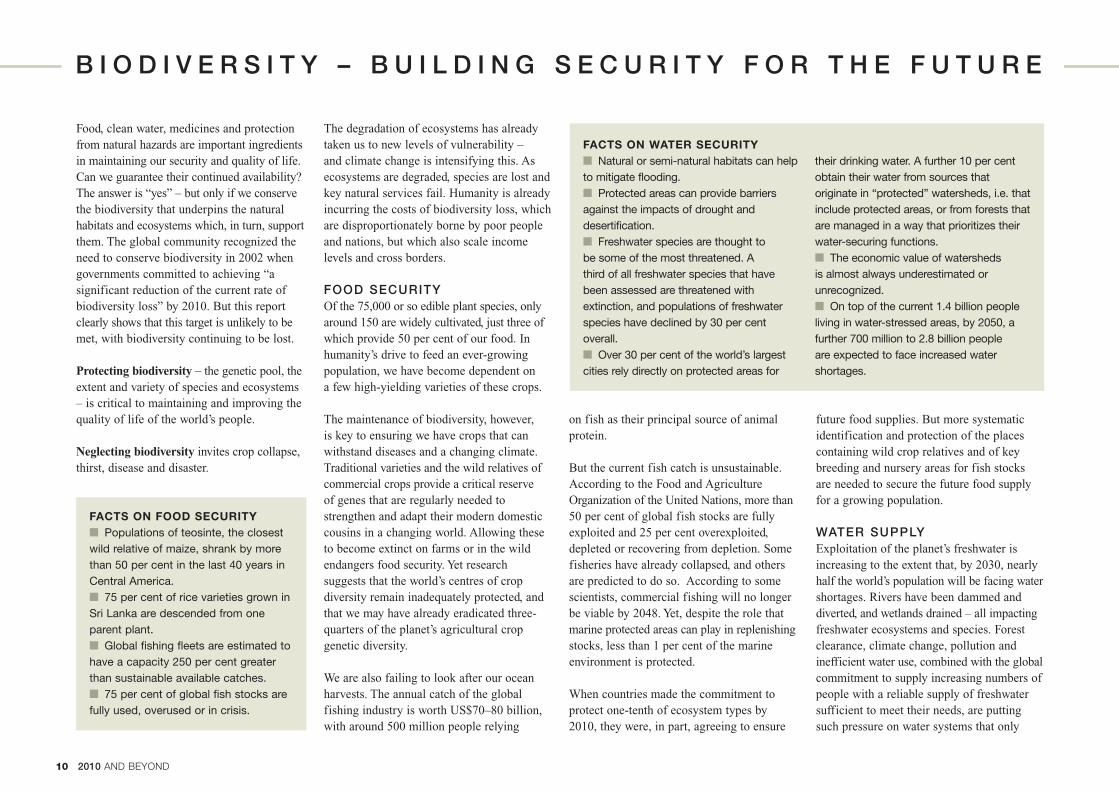
on fish as their principal source of animalprotein.
But the current fish catch is unsustainable.According to the Food and AgricultureOrganization of the United Nations, more than50 per cent of global fish stocks are fullyexploited and 25 per cent overexploited,depleted or recovering from depletion. Somefisheries have already collapsed, and others are predicted to do so. According to somescientists, commercial fishing will no longerbe viable by 2048. Yet, despite the role thatmarine protected areas can play in replenishingstocks, less than 1 per cent of the marineenvironment is protected.
When countries made the commitment toprotect one-tenth of ecosystem types by2010, they were, in part, agreeing to ensure
future food supplies. But more systematicidentification and protection of the placescontaining wild crop relatives and of keybreeding and nursery areas for fish stocks are needed to secure the future food supplyfor a growing population.
WATER SUPPLYExploitation of the planet’s freshwater isincreasing to the extent that, by 2030, nearlyhalf the world’s population will be facing watershortages. Rivers have been dammed anddiverted, and wetlands drained – all impactingfreshwater ecosystems and species. Forestclearance, climate change, pollution andinefficient water use, combined with the globalcommitment to supply increasing numbers ofpeople with a reliable supply of freshwatersufficient to meet their needs, are puttingsuch pressure on water systems that only
Food, clean water, medicines and protection from natural hazards are important ingredientsin maintaining our security and quality of life.Can we guarantee their continued availability?The answer is “yes” – but only if we conservethe biodiversity that underpins the naturalhabitats and ecosystems which, in turn, supportthem. The global community recognized theneed to conserve biodiversity in 2002 whengovernments committed to achieving “asignificant reduction of the current rate ofbiodiversity loss” by 2010. But this reportclearly shows that this target is unlikely to bemet, with biodiversity continuing to be lost.
Protecting biodiversity – the genetic pool, theextent and variety of species and ecosystems– is critical to maintaining and improving thequality of life of the world’s people.
Neglecting biodiversity invites crop collapse,thirst, disease and disaster.
The degradation of ecosystems has alreadytaken us to new levels of vulnerability – and climate change is intensifying this. Asecosystems are degraded, species are lost andkey natural services fail. Humanity is alreadyincurring the costs of biodiversity loss, whichare disproportionately borne by poor peopleand nations, but which also scale incomelevels and cross borders.
FOOD SECURITYOf the 75,000 or so edible plant species, onlyaround 150 are widely cultivated, just three ofwhich provide 50 per cent of our food. Inhumanity’s drive to feed an ever-growingpopulation, we have become dependent on a few high-yielding varieties of these crops.
The maintenance of biodiversity, however, is key to ensuring we have crops that canwithstand diseases and a changing climate.Traditional varieties and the wild relatives ofcommercial crops provide a critical reserve of genes that are regularly needed tostrengthen and adapt their modern domesticcousins in a changing world. Allowing theseto become extinct on farms or in the wildendangers food security. Yet researchsuggests that the world’s centres of cropdiversity remain inadequately protected, andthat we may have already eradicated three-quarters of the planet’s agricultural cropgenetic diversity.
We are also failing to look after our oceanharvests. The annual catch of the globalfishing industry is worth US$70–80 billion,with around 500 million people relying
10 2010 AND BEYOND
B I O D I V E R S I T Y – B U I L D I N G S E C U R I T Y F O R T H E F U T U R E
FACTS ON FOOD SECURITY■ Populations of teosinte, the closestwild relative of maize, shrank by morethan 50 per cent in the last 40 years inCentral America.■ 75 per cent of rice varieties grown inSri Lanka are descended from oneparent plant.■ Global fishing fleets are estimated tohave a capacity 250 per cent greaterthan sustainable available catches.■ 75 per cent of global fish stocks arefully used, overused or in crisis.
FACTS ON WATER SECURITY■ Natural or semi-natural habitats can helpto mitigate flooding.■ Protected areas can provide barriersagainst the impacts of drought anddesertification.■ Freshwater species are thought tobe some of the most threatened. Athird of all freshwater species that havebeen assessed are threatened withextinction, and populations of freshwaterspecies have declined by 30 per centoverall.■ Over 30 per cent of the world’s largestcities rely directly on protected areas for
their drinking water. A further 10 per centobtain their water from sources thatoriginate in “protected” watersheds, i.e. thatinclude protected areas, or from forests thatare managed in a way that prioritizes theirwater-securing functions.■ The economic value of watershedsis almost always underestimated orunrecognized.■ On top of the current 1.4 billion peopleliving in water-stressed areas, by 2050, afurther 700 million to 2.8 billion peopleare expected to face increased watershortages.
LPR_CBD_text.qxd 8/4/08 12:48 Page 10
The development of an international regimeunder the Convention on Biological Diversityfor the equitable sharing of benefits from theuse of genetic resources could benefit peoplein developing and developed countries alike.These benefits would provide a majorincentive for the conservation of biodiversityand traditional knowledge, while in the longerterm helping to ensure the health of all.
DISASTER MITIGATIONWith climate change likely to bring rising sea levels, stronger storms and unpredictablerainfall patterns, it is suggested that as manyas 150 million people could becomeenvironmental refugees by 2050. Inevitablysuch large movements of people are likely tolead to economic and political instability.
Protecting natural areas can lessen the impactof natural hazards, reducing the likelihoodthat they provoke disasters. Corals andmangrove forests, for example, can helpmitigate the effects of storms in coastal areas,while forests and wetlands play a key role inpreventing floods and landslides.
BUILDING SECURITYThe true protection of biodiversity can onlyhappen through cross-sectoral action. Fromministries of finance, health, agriculture andfood to leaders of business and industry,producers and consumers, all have a role toplay. Our efforts must be directed towardssustainability: of our food and water, ourmedicines, our economies and our existence.
RECOMMENDATIONS
WWF calls on governments to:
1. Develop joint biodiversity protectionimplementation plans between environment,agriculture, food, water, finance and healthministries in order to take urgent action toreduce the rate of biodiversity loss by 2010.
2. Urgently implement the Convention onBiological Diversity Programme of Work onProtected Areas prioritizing the protection ofareas that are important for food security,water supply, medicine and disastermitigation.
3. Implement incentive and financingmeasures that support the establishmentand maintenance of protected areas.
4. Accelerate the development and adoptionof an international regime on the equitablesharing of benefits from the utilization ofgenetic resources by 2010.
5. Take account of the true cost of ecosystemservices in national budgets and adopt nationalindicators that measure the state of biodiversityand pressures on natural ecosystems.
desalination plants seem, in some places, tobe guarantors of future supplies.
However, forests – a natural catchmentinfrastructure – are the most economicrehydration tool, yet currently are not theinstrument of choice for enough of our centresof population. Carefully located and managed,protected forest areas can act as naturalreservoirs, providing efficient water collection,natural filtration and aquifer replenishment.
HUMAN HEALTHAn estimated 80 per cent of people indeveloping countries rely on herbal remediesand medicines for their health care, with wildplants forming the primary ingredients. Tomaintain this natural pharmacy it is vital toboth protect and provide for the sustainableuse of these medicinal plants.
The pharmaceutical industry also relies onbiodiversity. In 2002–2003, four-fifths ofnew chemicals introduced globally as drugswere inspired by natural products. Butwithout systems and mechanisms that canconserve the diversity of life on Earth, howmany potential cures will be lost asbiodiversity is eroded?
11RISING TO THE BIODIVERSITY CHALLENGE
FACTS ON HEALTH■ As many as 50 per cent of prescriptiondrugs are based on a molecule that occursnaturally in a plant.■ Between 50,000 and 70,000 plantspecies are known to be used in traditionaland modern medicinal systems throughoutthe world.■ In China, 40 per cent of urban patientsand 90 per cent of rural patients rely ontraditional medicine.■ Only about 200 million people in Sub-Saharan Africa (less than 30 per cent ofthe population) have access to modernhealth care and pharmaceuticals. The
other 480 million rely on traditionalmedicines.■ In Sub-Saharan Africa, the ratio oftraditional healers to the population isapproximately 1:500, while the ratio ofmedical doctors to the population is1:40,000.■ Internationally, the trade in medicinalplants is estimated to be worth US$60billion per year.■ An estimated 323,000–470,000households (2.6 million people) areengaged in the collection of wildmedicinal plants for sale in Nepal.
FACTS ON DISASTER MITIGATION■ Centuries ago, restoration of forestsin the watershed above Malaga, Spain,ended the flooding that had been recordedat regular intervals over 500 years.■ In the Seychelles, wave energy hasdoubled as a result of sea-level rise, lossof coral reefs and changes to reef make-up. Models predict that wave energy will
double again in the next decade due tofurther reef damage.■ Philippines President Gloria Arroyoblamed indiscriminate logging, which hasleft the country with less than 6 per centof its original forest, for flash floods andlandslides that left over 1,600 people deador missing in 2004.
LPR_CBD_text.qxd 8/4/08 13:15 Page 11
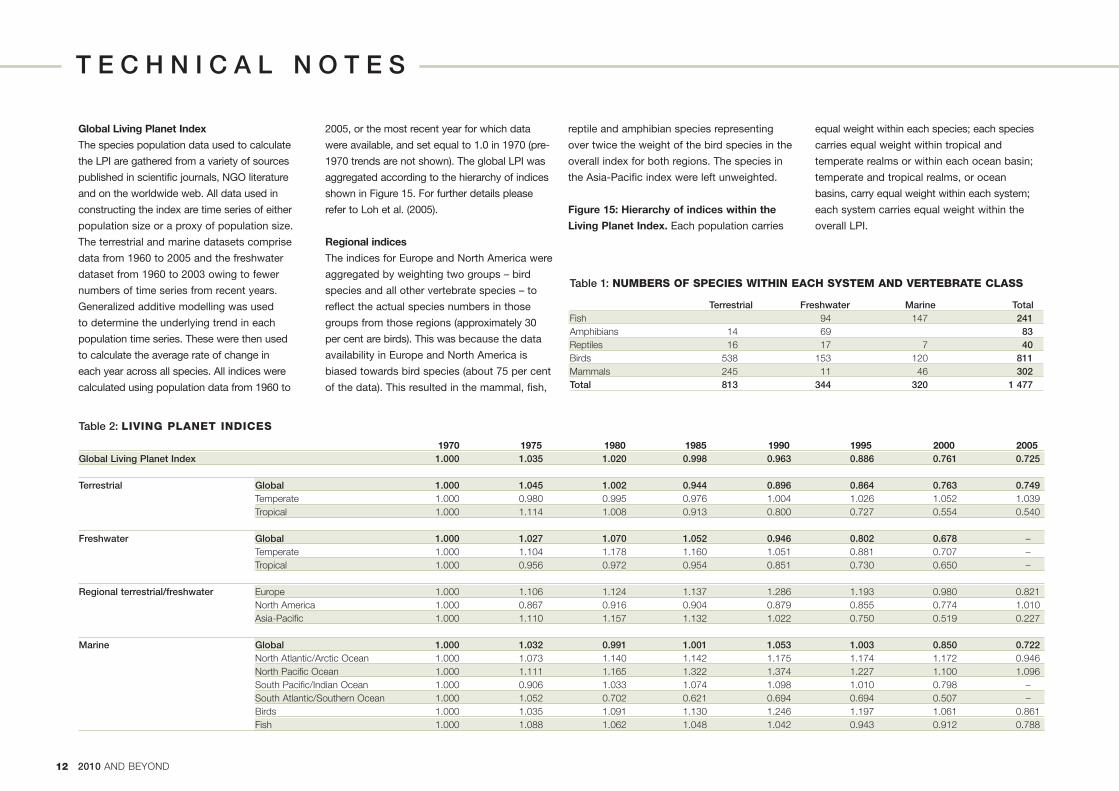
Global Living Planet Index
The species population data used to calculate
the LPI are gathered from a variety of sources
published in scientific journals, NGO literature
and on the worldwide web. All data used in
constructing the index are time series of either
population size or a proxy of population size.
The terrestrial and marine datasets comprise
data from 1960 to 2005 and the freshwater
dataset from 1960 to 2003 owing to fewer
numbers of time series from recent years.
Generalized additive modelling was used
to determine the underlying trend in each
population time series. These were then used
to calculate the average rate of change in
each year across all species. All indices were
calculated using population data from 1960 to
2005, or the most recent year for which data
were available, and set equal to 1.0 in 1970 (pre-
1970 trends are not shown). The global LPI was
aggregated according to the hierarchy of indices
shown in Figure 15. For further details please
refer to Loh et al. (2005).
Regional indices
The indices for Europe and North America were
aggregated by weighting two groups – bird
species and all other vertebrate species – to
reflect the actual species numbers in those
groups from those regions (approximately 30
per cent are birds). This was because the data
availability in Europe and North America is
biased towards bird species (about 75 per cent
of the data). This resulted in the mammal, fish,
2010 AND BEYOND12
T E C H N I C A L N O T E S
reptile and amphibian species representing
over twice the weight of the bird species in the
overall index for both regions. The species in
the Asia-Pacific index were left unweighted.
Figure 15: Hierarchy of indices within the
Living Planet Index. Each population carries
equal weight within each species; each species
carries equal weight within tropical and
temperate realms or within each ocean basin;
temperate and tropical realms, or ocean
basins, carry equal weight within each system;
each system carries equal weight within the
overall LPI.
Table 2: LIVING PLANET INDICES
1970 1975 1980 1985 1990 1995 2000 2005Global Living Planet Index 1.000 1.035 1.020 0.998 0.963 0.886 0.761 0.725
Terrestrial Global 1.000 1.045 1.002 0.944 0.896 0.864 0.763 0.749Temperate 1.000 0.980 0.995 0.976 1.004 1.026 1.052 1.039Tropical 1.000 1.114 1.008 0.913 0.800 0.727 0.554 0.540
Freshwater Global 1.000 1.027 1.070 1.052 0.946 0.802 0.678 –Temperate 1.000 1.104 1.178 1.160 1.051 0.881 0.707 –Tropical 1.000 0.956 0.972 0.954 0.851 0.730 0.650 –
Regional terrestrial/freshwater Europe 1.000 1.106 1.124 1.137 1.286 1.193 0.980 0.821North America 1.000 0.867 0.916 0.904 0.879 0.855 0.774 1.010Asia-Pacific 1.000 1.110 1.157 1.132 1.022 0.750 0.519 0.227
Marine Global 1.000 1.032 0.991 1.001 1.053 1.003 0.850 0.722North Atlantic/Arctic Ocean 1.000 1.073 1.140 1.142 1.175 1.174 1.172 0.946North Pacific Ocean 1.000 1.111 1.165 1.322 1.374 1.227 1.100 1.096South Pacific/Indian Ocean 1.000 0.906 1.033 1.074 1.098 1.010 0.798 –South Atlantic/Southern Ocean 1.000 1.052 0.702 0.621 0.694 0.694 0.507 –Birds 1.000 1.035 1.091 1.130 1.246 1.197 1.061 0.861Fish 1.000 1.088 1.062 1.048 1.042 0.943 0.912 0.788
Table 1: NUMBERS OF SPECIES WITHIN EACH SYSTEM AND VERTEBRATE CLASS
Terrestrial Freshwater Marine TotalFish 94 147 241Amphibians 14 69 83Reptiles 16 17 7 40Birds 538 153 120 811Mammals 245 11 46 302Total 813 344 320 1 477
LPR_CBD_text.qxd 8/4/08 12:48 Page 12
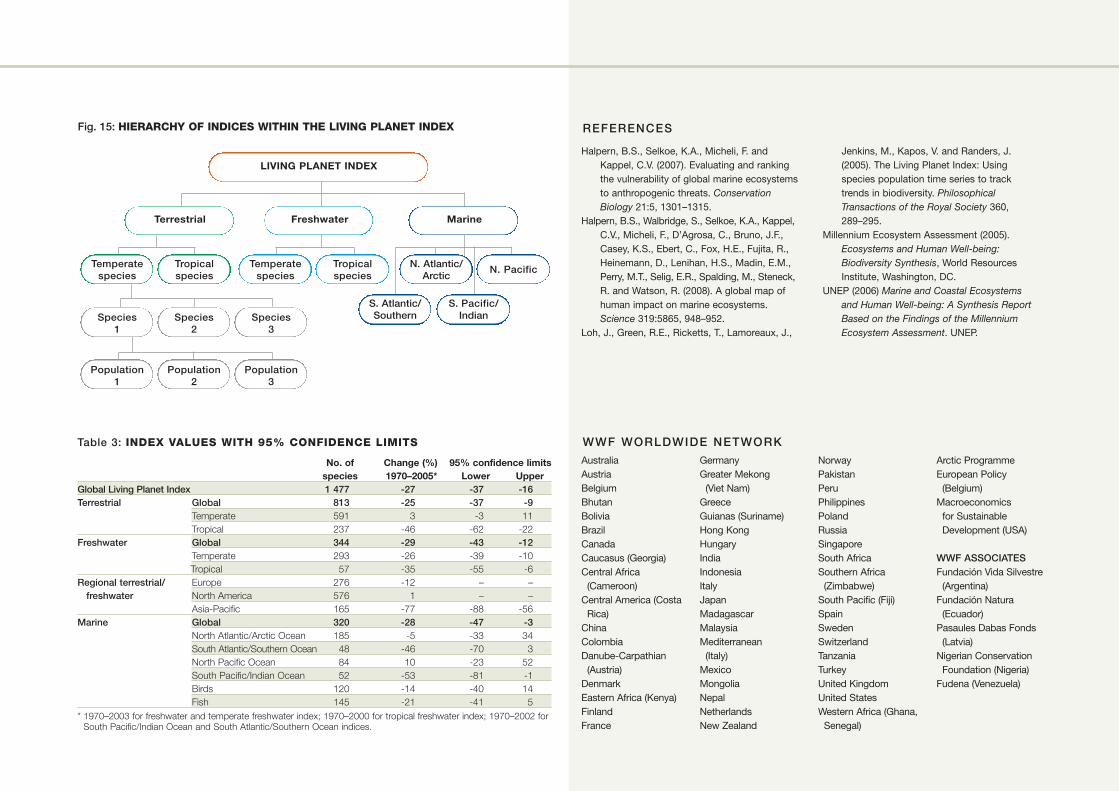
Table 3: INDEX VALUES WITH 95% CONFIDENCE LIMITS
No. of Change (%) 95% confidence limitsspecies 1970–2005* Lower Upper
Global Living Planet Index 1 477 -27 -37 -16Terrestrial Global 813 -25 -37 -9
Temperate 591 3 -3 11Tropical 237 -46 -62 -22
Freshwater Global 344 -29 -43 -12Temperate 293 -26 -39 -10Tropical 57 -35 -55 -6
Regional terrestrial/ Europe 276 -12 – –freshwater North America 576 1 – –
Asia-Pacific 165 -77 -88 -56Marine Global 320 -28 -47 -3
North Atlantic/Arctic Ocean 185 -5 -33 34South Atlantic/Southern Ocean 48 -46 -70 3North Pacific Ocean 84 10 -23 52South Pacific/Indian Ocean 52 -53 -81 -1Birds 120 -14 -40 14Fish 145 -21 -41 5
* 1970–2003 for freshwater and temperate freshwater index; 1970–2000 for tropical freshwater index; 1970–2002 forSouth Pacific/Indian Ocean and South Atlantic/Southern Ocean indices.
Halpern, B.S., Selkoe, K.A., Micheli, F. andKappel, C.V. (2007). Evaluating and rankingthe vulnerability of global marine ecosystemsto anthropogenic threats. ConservationBiology 21:5, 1301–1315.
Halpern, B.S., Walbridge, S., Selkoe, K.A., Kappel,C.V., Micheli, F., D’Agrosa, C., Bruno, J.F.,Casey, K.S., Ebert, C., Fox, H.E., Fujita, R.,Heinemann, D., Lenihan, H.S., Madin, E.M.,Perry, M.T., Selig, E.R., Spalding, M., Steneck,R. and Watson, R. (2008). A global map ofhuman impact on marine ecosystems.Science 319:5865, 948–952.
Loh, J., Green, R.E., Ricketts, T., Lamoreaux, J.,
Jenkins, M., Kapos, V. and Randers, J. (2005). The Living Planet Index: Using species population time series to track trends in biodiversity. PhilosophicalTransactions of the Royal Society 360,289–295.
Millennium Ecosystem Assessment (2005).Ecosystems and Human Well-being:Biodiversity Synthesis, World ResourcesInstitute, Washington, DC.
UNEP (2006) Marine and Coastal Ecosystems and Human Well-being: A Synthesis ReportBased on the Findings of the MillenniumEcosystem Assessment. UNEP.
AustraliaAustriaBelgiumBhutanBoliviaBrazilCanadaCaucasus (Georgia)Central Africa
(Cameroon)Central America (Costa
Rica)ChinaColombiaDanube-Carpathian
(Austria)DenmarkEastern Africa (Kenya)FinlandFrance
GermanyGreater Mekong
(Viet Nam)GreeceGuianas (Suriname)Hong KongHungaryIndiaIndonesiaItalyJapanMadagascarMalaysiaMediterranean
(Italy)MexicoMongoliaNepalNetherlandsNew Zealand
NorwayPakistanPeruPhilippinesPolandRussiaSingaporeSouth AfricaSouthern Africa
(Zimbabwe)South Pacific (Fiji)SpainSwedenSwitzerlandTanzaniaTurkeyUnited KingdomUnited StatesWestern Africa (Ghana,
Senegal)
Arctic ProgrammeEuropean Policy
(Belgium)Macroeconomics
for Sustainable Development (USA)
WWF ASSOCIATESFundación Vida Silvestre
(Argentina)Fundación Natura
(Ecuador)Pasaules Dabas Fonds
(Latvia)Nigerian Conservation
Foundation (Nigeria)Fudena (Venezuela)
WWF WORLDWIDE NETWORK
REFERENCES
Freshwater MarineTerrestrial
Tropicalspecies
Species 2
Species 3
Population 1
Population 2
Population 3
Temperatespecies
N. Atlantic/Arctic
N. Pacific
S. Atlantic/Southern
S. Pacific/Indian
LIVING PLANET INDEX
Fig. 15: HIERARCHY OF INDICES WITHIN THE LIVING PLANET INDEX
Temperatespecies
Species 1
Tropicalspecies
LPR_CBD_cover.qxd 15/4/08 13:30 Page IBCA

WWF’s mission is to stop the degradation of the planet’s natural environment and to build a future in which humans live in harmonywith nature, by: - conserving the world’s biological diversity- ensuring that the use of renewable natural resources is sustainable- promoting the reduction of pollution and wasteful consumption.
WWF InternationalAvenue du Mont-Blanc CH-1196 GlandSwitzerland Tel: +41 22 364 9111Fax: +41 22 364 8836
© 1986 P
anda symbol W
WF-W
orld Wide Fund For N
ature ®
“WW
F” and “living planet” are WW
FR
egistered Trademarks 04.08 (2M
)
LPR_CBD_cover.qxd 8/4/08 13:34 Page BCB
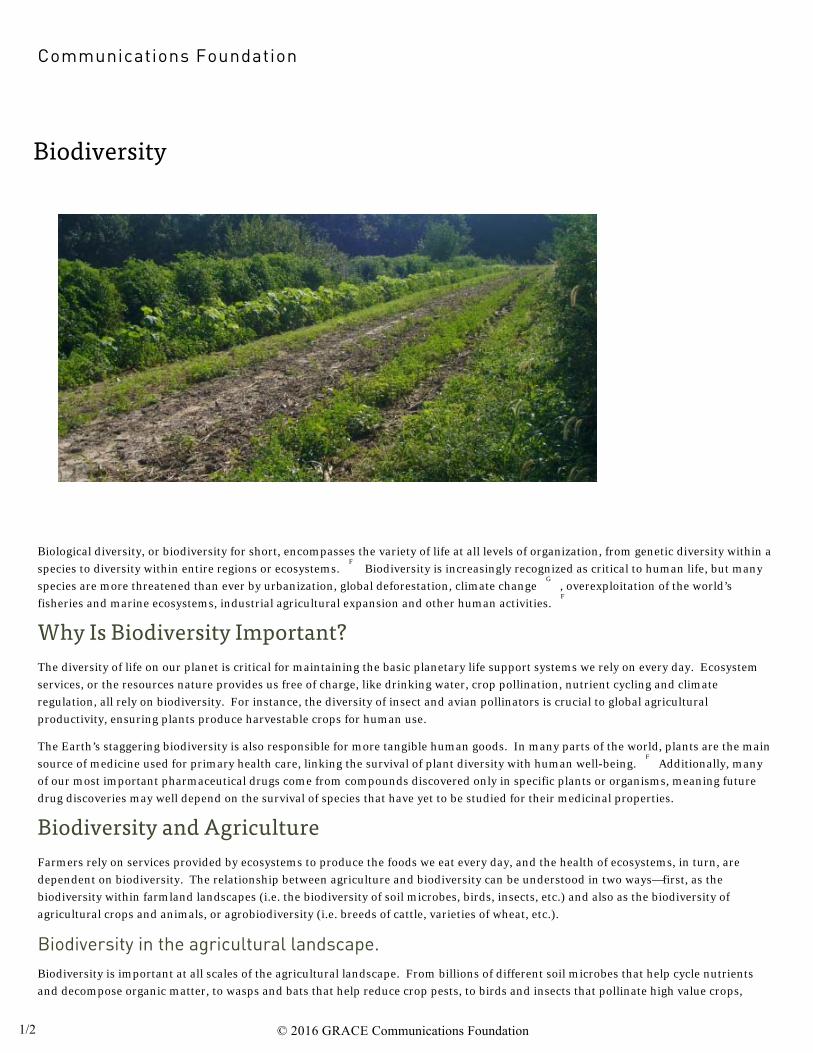
Biological diversity, or biodiversity for short, encompasses the variety of life at all levels of organization, from genetic diversity within a
species to diversity within entire regions or ecosystems. Biodiversity is increasingly recognized as critical to human life, but many
species are more threatened than ever by urbanization, global deforestation, climate change , overexploitation of the world’s
fisheries and marine ecosystems, industrial agricultural expansion and other human activities.
The diversity of life on our planet is critical for maintaining the basic planetary life support systems we rely on every day. Ecosystem
services, or the resources nature provides us free of charge, like drinking water, crop pollination, nutrient cycling and climate
regulation, all rely on biodiversity. For instance, the diversity of insect and avian pollinators is crucial to global agricultural
productivity, ensuring plants produce harvestable crops for human use.
The Earth’s staggering biodiversity is also responsible for more tangible human goods. In many parts of the world, plants are the main
source of medicine used for primary health care, linking the survival of plant diversity with human well-being. Additionally, many
of our most important pharmaceutical drugs come from compounds discovered only in specific plants or organisms, meaning future
drug discoveries may well depend on the survival of species that have yet to be studied for their medicinal properties.
Farmers rely on services provided by ecosystems to produce the foods we eat every day, and the health of ecosystems, in turn, are
dependent on biodiversity. The relationship between agriculture and biodiversity can be understood in two ways—first, as the
biodiversity within farmland landscapes (i.e. the biodiversity of soil microbes, birds, insects, etc.) and also as the biodiversity of
agricultural crops and animals, or agrobiodiversity (i.e. breeds of cattle, varieties of wheat, etc.).
Biodiversity is important at all scales of the agricultural landscape. From billions of different soil microbes that help cycle nutrients
and decompose organic matter, to wasps and bats that help reduce crop pests, to birds and insects that pollinate high value crops,
F
G
F
F
© 2016 GRACE Communications Foundation1/2
biodiversity helps farmers successfully grow food and maintain sustainable farm landscapes.
For example, although many of our most important crops are wind-pollinated and do not require pollinators, 39 of the leading 57
global crops benefit from natural pollinators, such as birds and insects. A striking example of our dependence on pollinator services
and the damage that can be inflicted on the agricultural economy without them can be seen in the decline of US honeybee populations
beginning in late 2006 which became known as Colony Collapse Disorder (CCD). Although scientific debate continues on the ultimate
causes of CCD, honeybee declines have served as an important wakeup call to protect both our managed and wild pollinator species.
But not only does the maintenance of biodiversity help ensure viable crop production, many organisms and species have come to rely
on particular agricultural landscapes for their very survival. As an example, farmland bird biodiversity in Europe has declined
dramatically in the past two decades as a result of the intensification and industrialization of Europe’s farmland and agriculture
practices. In sum, agriculture both supports, and is supported by, the maintenance of biodiversity.
Agrobiodiversity refers to biodiversity among planned agricultural crops or livestock, such as the genetic diversity of wheat varieties or
cattle breeds. Agrobiodiversity is the result of thousands of years of human intervention in selectively breeding traits in animals and
crops for particular agricultural advantages. A famous example of the diversity that can exist within one crop species is found in the
diversity of potatoes grown in the Andes of South America, where potatoes originated and some 4,000 known varieties, or landraces,
exist. This abundance of diversity is the result of farmers artificially selecting traits over generations for specific purposes, like
resistance to disease, tolerance to high altitudes or poor soils, etc. This diversity is important for food security—in the event that a
particular crop variety fails due to drought, flooding or a disease, another variety might survive to avoid food shortages. In stark
contrast to this model of agrobiodiversity, the Irish Potato Famine of the 1840s was the result of a fungus that completely destroyed the
Irish potato crop because only a few varieties of potatoes had been imported from the Andes to Europe, none of which were resistant to
the disease. Because of a lack of crop diversity and overreliance on one crop to feed many of its population, Ireland experienced
widespread famine and death.
Diminishing agrobiodiversity is not only a historical problem, however. The FAO has estimated that during the last century, 75 percent
of crop genetic diversity has been lost, a phenomenon referred to as genetic erosion. This loss of genetic diversity in plant crops and
animal breeds is dangerous because it makes our food supply more vulnerable to outbreaks of pests and disease. For instance, in the
1970s, a lack of genetic diversity in US corn varieties resulted in the loss of over 1 billion US dollars due to a lack of resistance to leaf
blight. Unfortunately, the situation has not improved today, as increasingly, industrial food production relies on fewer and fewer
crop varieties and animal breeds, further imperiling the security of our food system.
As mentioned earlier, industrial agriculture can reduce biodiversity by also diminishing biodiversity in the wider agricultural
landscape. Excessive manure, nutrient and pesticide runoff from industrial animal and plant agriculture can all negatively impact both
aquatic and terrestrial ecosystems and the biodiversity they support. Nutrient runoff can cause eutrophication of bodies of water
like rivers and streams, in some cases literally suffocating fish and other organisms, resulting in mass die-offs. Pesticide runoff has
been implicated in reducing biodiversity within agricultural landscapes both within terrestrial and aquatic landscapes, a famous
example being the near eradication of a number of US bird species from the use of the insecticide DDT during the second half of the
20th Century.
A major cause of farmland biodiversity declines in the last century is the simplification of the modern industrial agriculture landscape.
In previous centuries, farmland agroecosystems were diverse mixes of grazing land, crop land, orchards, wetlands and managed
forests, which could support a wide array of biological diversity. Today, however, most industrial agriculture landscapes plant crops
“fencerow to fencerow,” meaning the amount of harvestable land is maximized for the greatest profits, which has resulted in a
reduction of the diversity of agricultural landscapes, in turn reducing agroecosystem biodiversity.
F
F
F
F
F
F
F
G
F
F
© 2016 GRACE Communications Foundation2/2
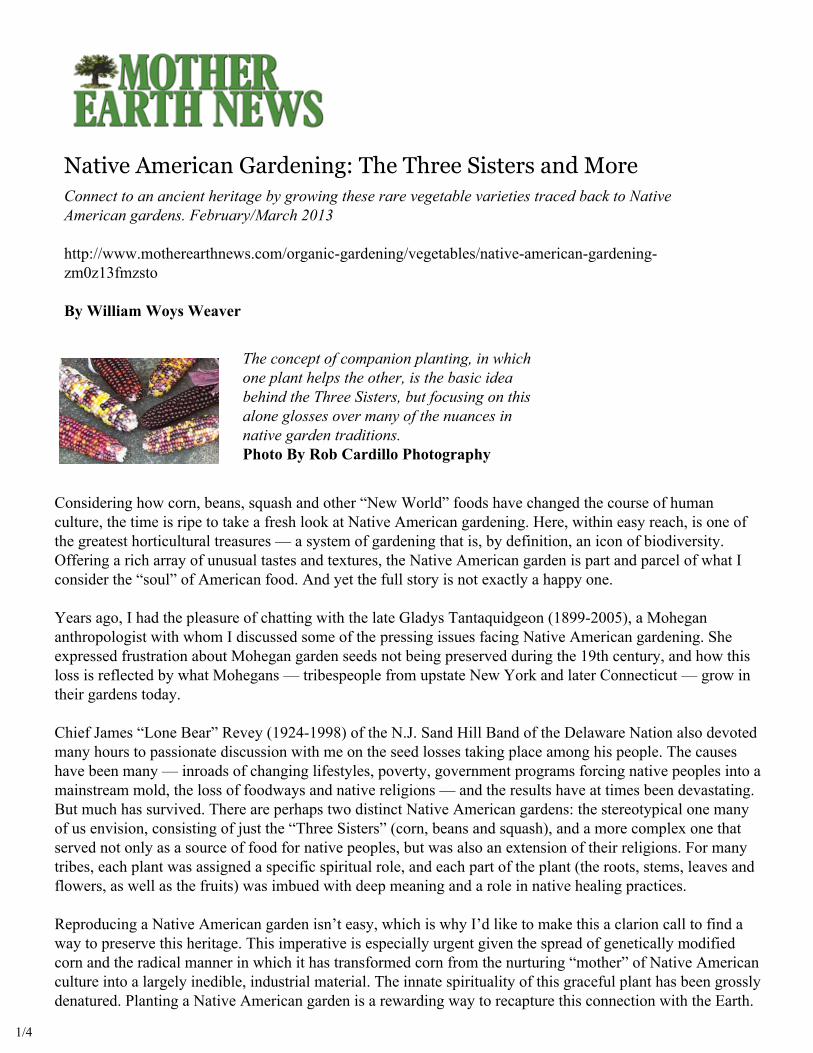
Connect to an ancient heritage by growing these rare vegetable varieties traced back to Native American gardens. February/March 2013
http://www.motherearthnews.com/organic-gardening/vegetables/native-american-gardening-zm0z13fmzsto
By William Woys Weaver
Considering how corn, beans, squash and other “New World” foods have changed the course of human culture, the time is ripe to take a fresh look at Native American gardening. Here, within easy reach, is one of the greatest horticultural treasures — a system of gardening that is, by definition, an icon of biodiversity. Offering a rich array of unusual tastes and textures, the Native American garden is part and parcel of what I consider the “soul” of American food. And yet the full story is not exactly a happy one.
Years ago, I had the pleasure of chatting with the late Gladys Tantaquidgeon (1899-2005), a Mohegan anthropologist with whom I discussed some of the pressing issues facing Native American gardening. She expressed frustration about Mohegan garden seeds not being preserved during the 19th century, and how this loss is reflected by what Mohegans — tribespeople from upstate New York and later Connecticut — grow in their gardens today.
Chief James “Lone Bear” Revey (1924-1998) of the N.J. Sand Hill Band of the Delaware Nation also devoted many hours to passionate discussion with me on the seed losses taking place among his people. The causes have been many — inroads of changing lifestyles, poverty, government programs forcing native peoples into a mainstream mold, the loss of foodways and native religions — and the results have at times been devastating.But much has survived. There are perhaps two distinct Native American gardens: the stereotypical one many of us envision, consisting of just the “Three Sisters” (corn, beans and squash), and a more complex one that served not only as a source of food for native peoples, but was also an extension of their religions. For many tribes, each plant was assigned a specific spiritual role, and each part of the plant (the roots, stems, leaves and flowers, as well as the fruits) was imbued with deep meaning and a role in native healing practices.
Reproducing a Native American garden isn’t easy, which is why I’d like to make this a clarion call to find a way to preserve this heritage. This imperative is especially urgent given the spread of genetically modified corn and the radical manner in which it has transformed corn from the nurturing “mother” of Native American culture into a largely inedible, industrial material. The innate spirituality of this graceful plant has been grossly denatured. Planting a Native American garden is a rewarding way to recapture this connection with the Earth.
The concept of companion planting, in which one plant helps the other, is the basic idea behind the Three Sisters, but focusing on this alone glosses over many of the nuances in native garden traditions.Photo By Rob Cardillo Photography
1/4
The Real Three Sisters Garden
The concept of companion planting, in which one plant helps the other, is the basic idea behind the Three Sisters, but focusing on this alone glosses over many of the nuances in native garden traditions. Growing plants to work together symbiotically — using hills of corn to serve as poles for beans, and interplanting this with squash to keep down invasive weeds — is as much about compatibility and harnessing nature to do part of the work as it is a study in what we take from nature and what we give back. Like strip mining, modern agribusiness is based on yields extracted from the land regardless of the environmental cost. The Native American garden, which was actually a form of small-scale farming, made the land richer — one reason why early settlers were eager to seize Native American fields.
Some of the earliest illustrations that have survived of Native American fields — depictions of patches of corn and squash from the 1580s — show no evidence of Three Sisters gardening. They do show a clear understanding of the separation of corn varieties so they tassel at different times and thus do not cross-pollinate. Some native peoples farmed with other mixes of plants. The Hopi introduced a fragrant wildflower into their gardens to attract pollinators. Other peoples intermingled their corn and beans with sunflowers, which make wonderful “poles” for beans that grow too tall to climb up cornstalks.
Native American gardens were fine-tuned to their local micro-climate, and this is a feature often overlooked by gardeners today. One seed does not fit all gardens. Native peoples maintained a wide selection of plants because they often moved around, so what may have worked well in North Carolina among the Cherokee may not have been successful on the Great Plains. The Pawnee of the Midwest, for example, maintained four sacred corn varieties, of which their white-flour corn, called “Mother Corn,” was the most highly venerated. If one failed, they had others they could rely on.
Native American Corn
Native corns are heartier and generally more drought-resistant and adaptable than modern-day industrial varieties. Choosing the right corn to grow in your region is important, especially because the corn more or less serves as the “framework” for a Native American garden. If you plan to save seed for next year, choose one variety of corn to grow at a time in a given area to prevent cross-pollination.
Pure strains of native corns are difficult to distinguish unless they’ve been carefully grown in isolation, such as those sold by Native Seeds/SEARCH, a nonprofit headquartered in Tucson, Ariz. Some Native American cultural museums sell seeds connected with their cultures, and Seed Savers Exchange in Decorah, Iowa, has many members who offer seeds in its annual yearbook that are believed to have come from Native American sources.
I have been growing native corns for many years and recently began large-scale grow-outs at Mill Hollow Farm near Edgemont, Pa. Two corns in particular — ‘Tutelo Strawberry’ (a short-eared flint) and ‘Delaware Indian Puhwem’ (flour corn) — have done extremely well, and seeds are available directly from the farm (see the chart key in Seed Varieties for Your Native American Garden (http://www.motherearthnews.com/organic-gardening/native-american-garden-zm0z13fmzsto.aspx)). In the future, I plan to offer some Seneca corns, particularly ‘Ha-Go-Wa’ (hominy corn) and ‘Blue Bear Dance,’ as well as ‘Tuscarora’ flour corn.
Native American Squash and Beans
Locating authentic Native American squash for your garden will prove extra challenging, because many of the squash varieties have been “improved” over the years by plant breeders looking for characteristics that
2/4
appeal to present-day cooks. ‘Early White Scallop’ and ‘Yellow Summer Crookneck’ are examples of this kind of improved plant stock. While both can be documented to the 18th century and earlier, they are somewhat different from the Native American originals. The old-style plants were vining rather than bush in habit, for example.
Aside from pattypan squash, finger squash and a few others, not many varieties of squash and pumpkins have survived from early Native American gardens, especially in the eastern part of the United States. I have been involved in a project in my own garden to recover Nanticoke “maycocks,” an old native name for summer squash eaten green. These squash probably represent a range of what native peoples were looking for in squash, as some are good for cooking fresh, some for drying, some for seed oil, and some for long-term storage.
There are a great many Native American beans, but few of them are preserved under their original Native American names. After quite a bit of research and some luck, I discovered that the meaty ‘Ohio Pole Bean’ — a favorite of mine — was actually an old variety grown by the Delaware, Potawatomi, Shawnee and Miami living in the vicinity of Ft. Wayne, Ind., in the 1790s. The ‘Amish Nuttle’ bean is another Native American variety that has come down to us under several non-native names. The chart in Seed Varieties for Your Native American Garden (http://www.motherearthnews.com/organic-gardening /native-american-garden-zm0z13fmzsto.aspx) has many more recommended varieties.
Planting Techniques
Planting your Native American garden is relatively easy after you have chosen a plot of ground and prepared it. The Native American garden was not like a European kitchen garden, but rather a small field, so if possible, you should think in terms of perhaps a quarter-acre. You’ll need that kind of space to produce enough corn for food and next year’s seed, because your corn should be planted in hills about 3 feet in diameter and spaced 4 feet apart in all directions. With four to six corn plants per hill, 30 or 40 hills will take up a lot of space, but you’ll also be able to plant several varieties of pole beans around the corn after the corn is about a foot tall. The beans’ role is to fix nitrogen in the soil, which is vital for successful corn production. You can grow several bean varieties without worrying about crosses as long as you plant one variety per hill of corn.
The best bean varieties for short corn (corn that grows about 6 feet tall), such as ‘Tutelo Strawberry,’ are the semi-pole or Native American bush beans that develop long runners — ‘Amish Nuttle’ or ‘Wild Pigeon’ are good examples. Taller corn can support beans with longer vines, but some pole beans are simply too aggressive for corn. Sunflowers are a good alternative here, and they can be planted at the cross section of the spaces between the corn hills. Squash with small leaves can be planted in between. Large, vigorous pumpkins were generally planted off by themselves, as they also like to climb and could pull down the corn. Around the edge of your little field is an ideal place to put Jerusalem artichokes — another Native American favorite. Other plants such as goosefoot and amaranth were allowed to come up among the squash, and these could be harvested both for greens and for seeds. As we keep adding biodiversity to the mix and begin valuing marginal plants as food rather than weeds, a new horticultural balance unfolds.
Native American gardens may be part of history, but the building blocks remain to bring this heritage into modern gardens in the form of flavorful, well-adapted varieties and growing techniques that reflect an understanding of each plant’s important role in the system as a whole.
3/4
Read more:
Discover rare vegetable varieties in Seed Varieties for Your Native American Garden(http://www.motherearthnews.com/organic-gardening/native-american-garden-zm0z13fmzsto.aspx), and learn about two seedsmen who did extensive work to preserve native corn varieties in Preserving Native American Seed Heritage (http://www.motherearthnews.com/organic-gardening/native-american-seed-zm0z13fmzsto.aspx).
Also, check out the joys and benefits of two carefully preserved varieties in The Origins and Journey of 'Carl's Glass Gems' Rainbow Corn (http://www.motherearthnews.com/homesteading-and-livestock/glass-gem-corn- seed-zwfz1212zrob.aspx) and Try Puhwem 'Mother Corn,' a Revered Native American Variety(http://www.motherearthnews.com/organic-gardening/puhwem-mother-corn-native-american-variety-zb0z1212zsto.aspx).
Food historian William Woys Weaver is the author of Heirloom Vegetable Gardening: A Master Gardener’s Guide to Planting, Seed Saving and Cultural History (https://www.motherearthnews.com /store/product/heirloom-vegetable-gardening-cd-rom).
4/4
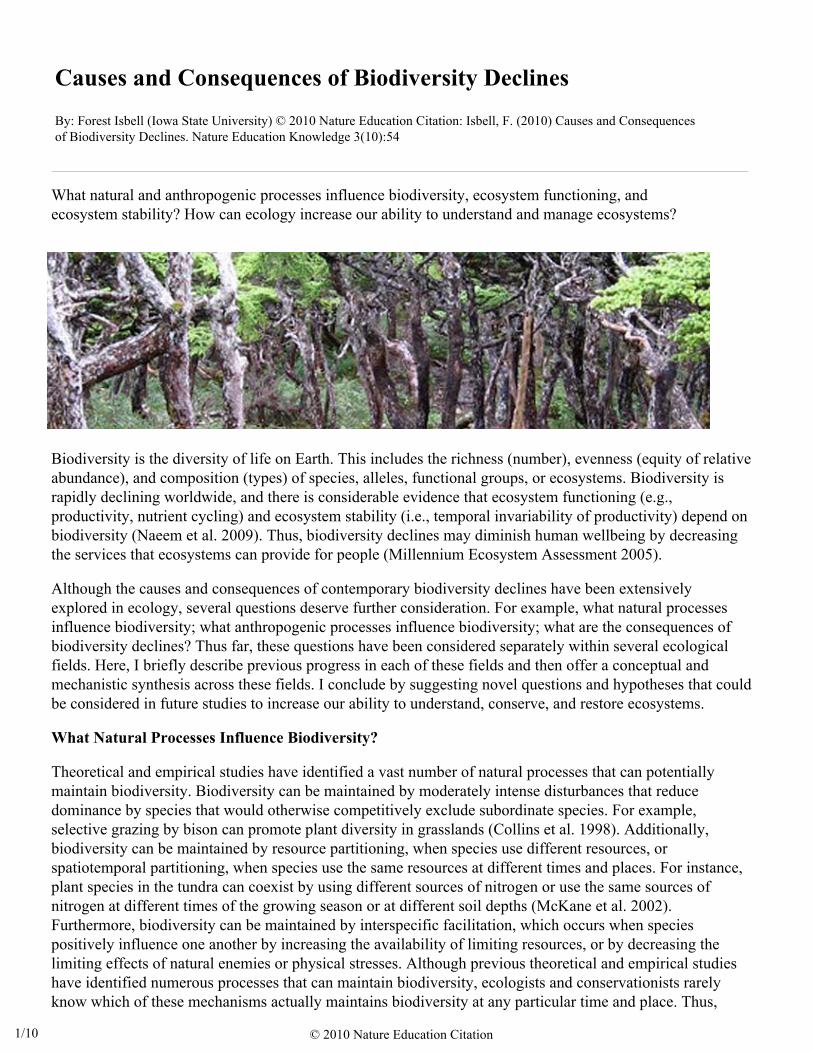
What natural and anthropogenic processes influence biodiversity, ecosystem functioning, and ecosystem stability? How can ecology increase our ability to understand and manage ecosystems?
Causes and Consequences of Biodiversity Declines By: Forest Isbell (Iowa State University) © 2010 Nature Education Citation: Isbell, F. (2010) Causes and Consequences of Biodiversity Declines. Nature Education Knowledge 3(10):54
Biodiversity is the diversity of life on Earth. This includes the richness (number), evenness (equity of relative abundance), and composition (types) of species, alleles, functional groups, or ecosystems. Biodiversity is rapidly declining worldwide, and there is considerable evidence that ecosystem functioning (e.g., productivity, nutrient cycling) and ecosystem stability (i.e., temporal invariability of productivity) depend on biodiversity (Naeem et al. 2009). Thus, biodiversity declines may diminish human wellbeing by decreasing the services that ecosystems can provide for people (Millennium Ecosystem Assessment 2005).
Although the causes and consequences of contemporary biodiversity declines have been extensively explored in ecology, several questions deserve further consideration. For example, what natural processes influence biodiversity; what anthropogenic processes influence biodiversity; what are the consequences of biodiversity declines? Thus far, these questions have been considered separately within several ecological fields. Here, I briefly describe previous progress in each of these fields and then offer a conceptual and mechanistic synthesis across these fields. I conclude by suggesting novel questions and hypotheses that could be considered in future studies to increase our ability to understand, conserve, and restore ecosystems.
What Natural Processes Influence Biodiversity?
Theoretical and empirical studies have identified a vast number of natural processes that can potentially maintain biodiversity. Biodiversity can be maintained by moderately intense disturbances that reduce dominance by species that would otherwise competitively exclude subordinate species. For example, selective grazing by bison can promote plant diversity in grasslands (Collins et al. 1998). Additionally, biodiversity can be maintained by resource partitioning, when species use different resources, or spatiotemporal partitioning, when species use the same resources at different times and places. For instance, plant species in the tundra can coexist by using different sources of nitrogen or use the same sources of nitrogen at different times of the growing season or at different soil depths (McKane et al. 2002). Furthermore, biodiversity can be maintained by interspecific facilitation, which occurs when species positively influence one another by increasing the availability of limiting resources, or by decreasing the limiting effects of natural enemies or physical stresses. Although previous theoretical and empirical studies have identified numerous processes that can maintain biodiversity, ecologists and conservationists rarely know which of these mechanisms actually maintains biodiversity at any particular time and place. Thus,
© 2010 Nature Education Citation1/10
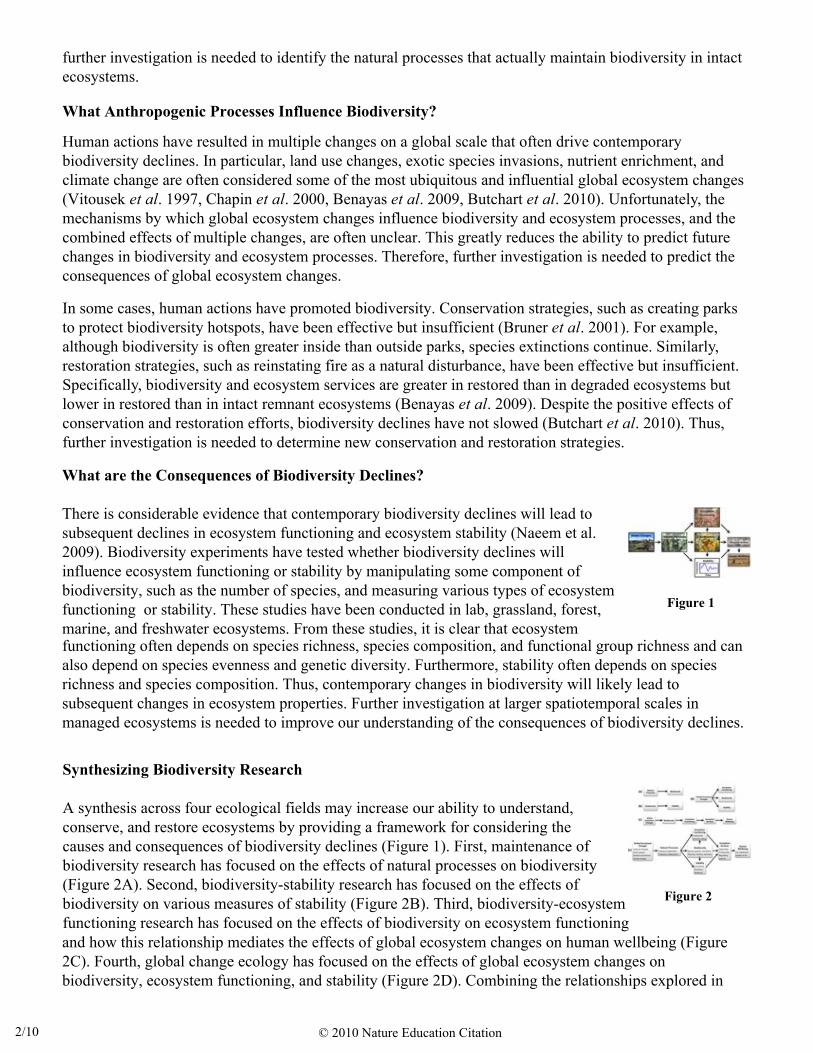
further investigation is needed to identify the natural processes that actually maintain biodiversity in intact ecosystems.
What Anthropogenic Processes Influence Biodiversity?
Human actions have resulted in multiple changes on a global scale that often drive contemporary biodiversity declines. In particular, land use changes, exotic species invasions, nutrient enrichment, and climate change are often considered some of the most ubiquitous and influential global ecosystem changes (Vitousek et al. 1997, Chapin et al. 2000, Benayas et al. 2009, Butchart et al. 2010). Unfortunately, the mechanisms by which global ecosystem changes influence biodiversity and ecosystem processes, and the combined effects of multiple changes, are often unclear. This greatly reduces the ability to predict future changes in biodiversity and ecosystem processes. Therefore, further investigation is needed to predict the consequences of global ecosystem changes.
In some cases, human actions have promoted biodiversity. Conservation strategies, such as creating parks to protect biodiversity hotspots, have been effective but insufficient (Bruner et al. 2001). For example, although biodiversity is often greater inside than outside parks, species extinctions continue. Similarly, restoration strategies, such as reinstating fire as a natural disturbance, have been effective but insufficient. Specifically, biodiversity and ecosystem services are greater in restored than in degraded ecosystems but lower in restored than in intact remnant ecosystems (Benayas et al. 2009). Despite the positive effects of conservation and restoration efforts, biodiversity declines have not slowed (Butchart et al. 2010). Thus, further investigation is needed to determine new conservation and restoration strategies.
© 2010 Nature Education Citation
Synthesizing Biodiversity Research
A synthesis across four ecological fields may increase our ability to understand,conserve, and restore ecosystems by providing a framework for considering thecauses and consequences of biodiversity declines (Figure 1). First, maintenance ofbiodiversity research has focused on the effects of natural processes on biodiversity(Figure 2A). Second, biodiversity-stability research has focused on the effects ofbiodiversity on various measures of stability (Figure 2B). Third, biodiversity-ecosystem functioning research has focused on the effects of biodiversity on ecosystem functioning
What are the Consequences of Biodiversity Declines?
There is considerable evidence that contemporary biodiversity declines will lead to subsequent declines in ecosystem functioning and ecosystem stability (Naeem et al. 2009). Biodiversity experiments have tested whether biodiversity declines will influence ecosystem functioning or stability by manipulating some component of biodiversity, such as the number of species, and measuring various types of ecosystem functioning or stability. These studies have been conducted in lab, grassland, forest, marine, and freshwater ecosystems. From these studies, it is clear that ecosystem functioning often depends on species richness, species composition, and functional group richness and can also depend on species evenness and genetic diversity. Furthermore, stability often depends on species richness and species composition. Thus, contemporary changes in biodiversity will likely lead to subsequent changes in ecosystem properties. Further investigation at larger spatiotemporal scales in managed ecosystems is needed to improve our understanding of the consequences of biodiversity declines.
and how this relationship mediates the effects of global ecosystem changes on human wellbeing (Figure 2C). Fourth, global change ecology has focused on the effects of global ecosystem changes on biodiversity, ecosystem functioning, and stability (Figure 2D). Combining the relationships explored in
Figure 1
Figure 2
2/10
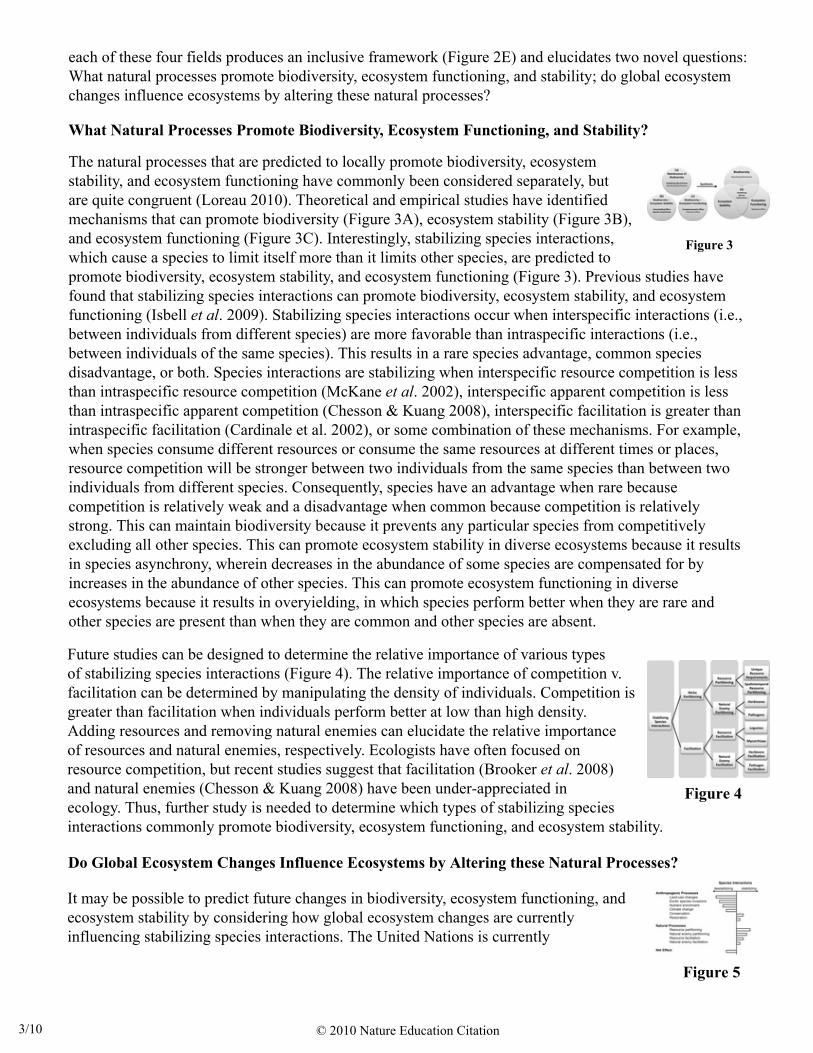
Figure 4
Figure 5
each of these four fields produces an inclusive framework (Figure 2E) and elucidates two novel questions: What natural processes promote biodiversity, ecosystem functioning, and stability; do global ecosystem changes influence ecosystems by altering these natural processes?
What Natural Processes Promote Biodiversity, Ecosystem Functioning, and Stability?
The natural processes that are predicted to locally promote biodiversity, ecosystemstability, and ecosystem functioning have commonly been considered separately, butare quite congruent (Loreau 2010). Theoretical and empirical studies have identifiedmechanisms that can promote biodiversity (Figure 3A), ecosystem stability (Figure 3B), and ecosystem functioning (Figure 3C). Interestingly, stabilizing species interactions,which cause a species to limit itself more than it limits other species, are predicted topromote biodiversity, ecosystem stability, and ecosystem functioning (Figure 3). Previous studies have found that stabilizing species interactions can promote biodiversity, ecosystem stability, and ecosystem functioning (Isbell et al. 2009). Stabilizing species interactions occur when interspecific interactions (i.e., between individuals from different species) are more favorable than intraspecific interactions (i.e., between individuals of the same species). This results in a rare species advantage, common species disadvantage, or both. Species interactions are stabilizing when interspecific resource competition is less than intraspecific resource competition (McKane et al. 2002), interspecific apparent competition is less than intraspecific apparent competition (Chesson & Kuang 2008), interspecific facilitation is greater than intraspecific facilitation (Cardinale et al. 2002), or some combination of these mechanisms. For example, when species consume different resources or consume the same resources at different times or places, resource competition will be stronger between two individuals from the same species than between two individuals from different species. Consequently, species have an advantage when rare because competition is relatively weak and a disadvantage when common because competition is relatively strong. This can maintain biodiversity because it prevents any particular species from competitively excluding all other species. This can promote ecosystem stability in diverse ecosystems because it results in species asynchrony, wherein decreases in the abundance of some species are compensated for by increases in the abundance of other species. This can promote ecosystem functioning in diverse ecosystems because it results in overyielding, in which species perform better when they are rare and other species are present than when they are common and other species are absent.
Future studies can be designed to determine the relative importance of various typesof stabilizing species interactions (Figure 4). The relative importance of competition v. facilitation can be determined by manipulating the density of individuals. Competition is greater than facilitation when individuals perform better at low than high density.Adding resources and removing natural enemies can elucidate the relative importanceof resources and natural enemies, respectively. Ecologists have often focused on resource competition, but recent studies suggest that facilitation (Brooker et al. 2008)and natural enemies (Chesson & Kuang 2008) have been under-appreciated inecology. Thus, further study is needed to determine which types of stabilizing species interactions commonly promote biodiversity, ecosystem functioning, and ecosystem stability.
Do Global Ecosystem Changes Influence Ecosystems by Altering these Natural Processes?
It may be possible to predict future changes in biodiversity, ecosystem functioning, and ecosystem stability by considering how global ecosystem changes are currently influencing stabilizing species interactions. The United Nations is currently
© 2010 Nature Education Citation
Figure 3
3/10
developing an Intergovernmental Science-Policy Platform on Biodiversity and Ecosystem Services (IPBES) to monitor biodiversity and ecosystem services worldwide (Marris 2010). The IPBES will be modeled after the Intergovernmental Panel on Climate Change (IPCC), and there is great potential for ecologists to borrow strategies that have been successfully employed by climatologists. For example, climatologists have modeled the effects of natural and anthropogenic processes on radiative forcing (i.e., the change in the difference between the amount of radiation entering and exiting Earth's atmosphere) to determine the causes and consequences of climate change (IPCC 2007). Radiative forcing is central to this discussion because it is influenced by both natural and anthropogenic processes and it influences many climate variables. Future ecological studies could take a similar approach to determine the causes and consequences of changes in biodiversity. Stabilizing species interactions are central to this discussion because they can be influenced by both natural and anthropogenic processes, and they can influence both biodiversity and ecosystem properties (Figure 1). I hypothesize that global ecosystem changes are currently destabilizing species interactions (Figure 5) and that this will lead to future declines in biodiversity, ecosystem functioning, and ecosystem stability. Collaborations among investigators considering one or more of the relationships in Figure 1 are becoming increasingly common (Naeem et al. 2009), and this will continue to be an active area of research.
References and Recommended Reading
Benayas, J. M. R. et al. Enhancement of biodiversity and ecosystem services by ecological restoration: A meta-analysis. Science 325, 1121–1124 (2009).
Brooker, R. W. et al. Facilitation in plant communities: The past, the present, and the future. Journal of Ecology 96, 18–34 (2008).
Bruner, A. G. et al. Effectiveness of parks in protecting tropical biodiversity. Science 291, 125–128 (2001).
Butchart, S. H. M. et al. Global biodiversity: Indicators of recent declines. Science 328, 1164–1168 (2010).
Cardinale, B. J., Palmer, M. A., & Collins, S. L. Species diversity enhances ecosystem functioning through interspecific facilitation. Nature 415, 426–429 (2002).
Chapin, F. S. et al. Consequences of changing biodiversity. Nature 405, 234–242 (2000).
Chesson, P. & Kuang, J. J. The interaction between predation and competition. Nature 456, 235–238 (2008).
Collins, S. L. et al. Modulation of diversity by grazing and mowing in native tallgrass prairie. Science 280, 745–747 (1998).
Intergovernmental Panel on Climate Change (IPCC). Climate Change 2007: Synthesis Report. Geneva, 2007.
Isbell, F. I., Polley, H. W., & Wilsey, B. J. Biodiversity, productivity, and the temporal stability of productivity: Patterns and processes. Ecology Letters 12, 443–451 (2009).
Loreau, M. From Populations to Ecosystems: Theoretical Foundations for a New Ecological Synthesis. Princeton, NJ: Princeton University Press, 2010.
© 2010 Nature Education Citation4/10

Marris, E. UN body will assess ecosystems and biodiversity. Nature 465, 859 (2010).
McKane, R. B. et al. Resource-based niches provide a basis for plant species diversity and dominance in arctic tundra. Nature 415, 68–71 (2002).
Millennium Ecosystem Assessment. Ecosystems and Human Well-being: Synthesis. Washington, DC: Island Press, 2005.
Naeem, S. et al. eds. Biodiversity, Ecosystem Functioning, and Human Wellbeing: An Ecological and Economic Perspective. Oxford, UK: Oxford University Press, 2009.
Vitousek, P. M. et al. Human domination of Earth's ecosystems. Science 277, 494–499 (1997).
© 2010 Nature Education Citation5/10
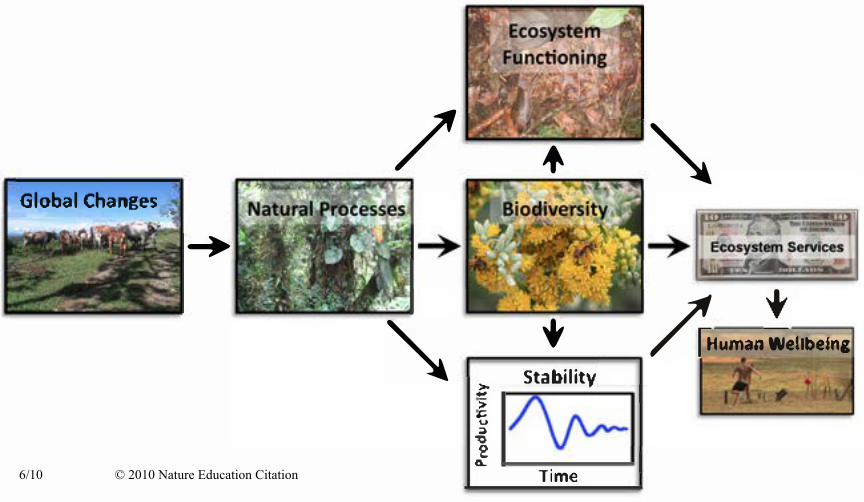
/' • �
Global Changes .•
�
A-Human !ellbelnc 't
� Stability > � ·;;.
,, u � .,,
e a. Time 6/10 © 2010 Nature Education Citation
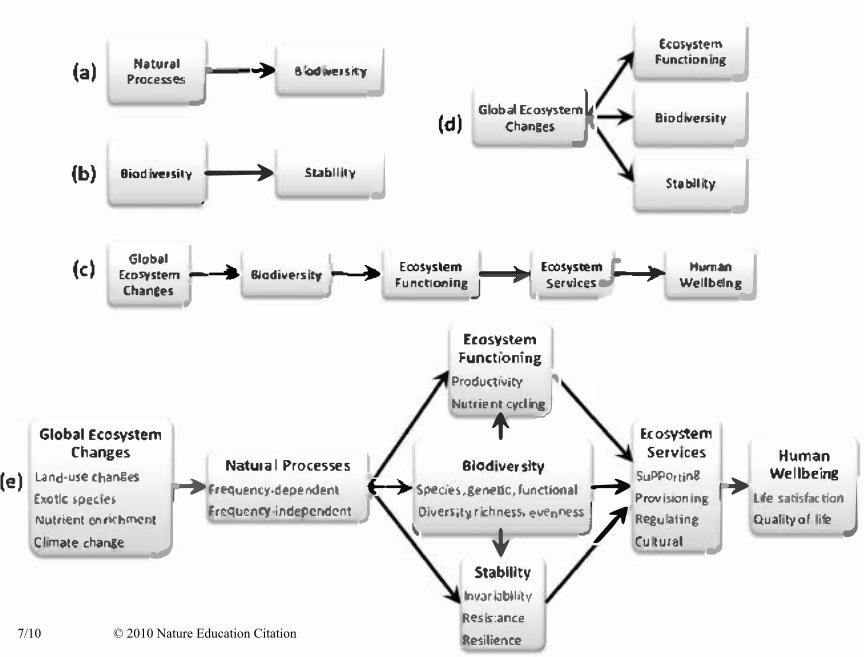
Biodiversity J Ecosystem
J (a)Natural
), Functioning
Proces.se.s J Global Ecosystem�
J(d) Chances j
Biodiversity
(b) Biodiversity�
Sbblllty J StabHlty J(c)
Global I I
Ecosystem J.---1)� . Biodiversityj
;--),•.Chances
Ecosystem � Ecosystem ,---1),� Functioning �l Services J
Human J Wellbein g
Ecosystem Functioning
Productivity
JNutrient cycling
Global Ecosystem L t Ecosystem
L Changes Services Human
(e) Land.use changes Natural Processes I Biodiver sity Supporting Wellbeing
Exotic species
JFr�ueney-dependent jt-�•Spec:ies, genedc , ful'lctional � Provisioning
J life satisfactionj
Nutrient cnrkhmcnt Frequency.independentl
Olverslty, richness, evennes; ? Regulating Quality of l ife Cl imate chal"'8e t Cultural
Stability
lnv3ri;JbilitvRe.sistanceResilk?nce7/10 © 2010 Nature Education Citation
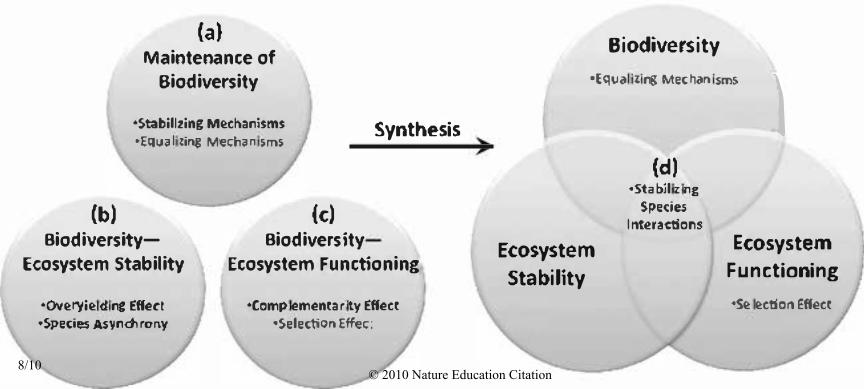
(a) Maintenance of
Biodiversity
•Stabilizing Mechanisms
•Equalizing MechanismsSynthesis
(b) Biodiversity
Ecosystem Stability
•Overyieldlng Effect•Species Asynchrony
(c) Biodivers ity
Ecosystem Functioning
•Complementarity Effect
•Selection Effect
Biodiversity
•Equaliting Mechanisms
\
Ecosystem Stability
(d} •Stabiliz.ing
Species
Interactions
Ecosystem Functioning
•Selectfon Effect
© 2010 Nature Education Citation8/10
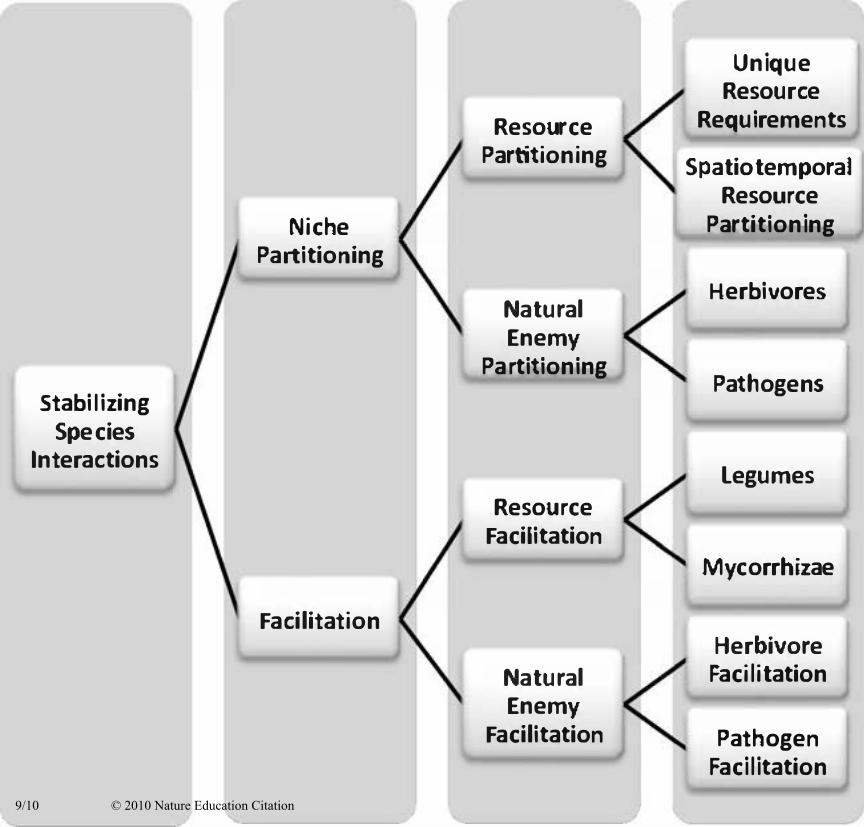
Unique Resource
Resource Requirements
Partitioning Spatiotemporal Resource
Niche Partitioning
Partitioning
Natural Herbivores
Enemy Partitioning
Pathogens Stabilizing
Species Interactions
Legumes
Resource Facilitation
Mycorrhizae
Facilitation Herbivore
Natural Facilitation
Enemy Facilitation Pathogen
Facilitation
© 2010 Nature Education Citation© 2010 Nature Education Citation
9/10 © 2010 Nature Education Citation
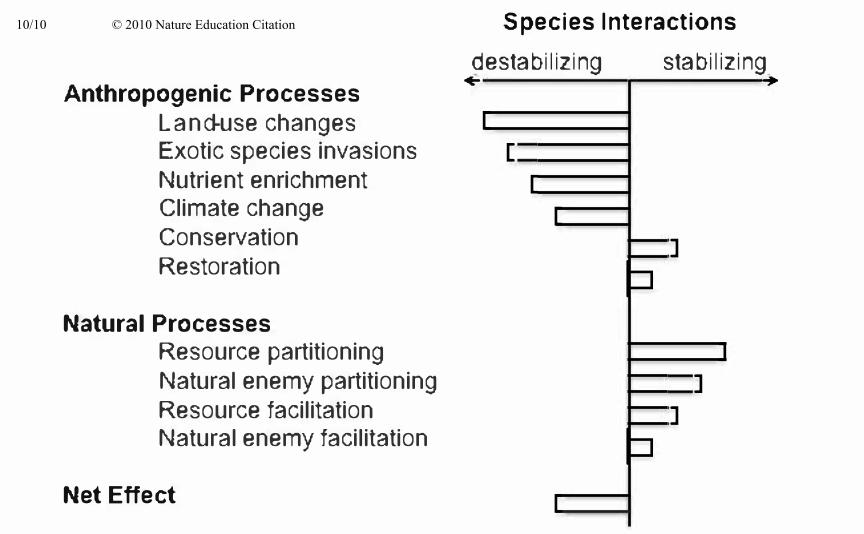
Anthropogenic Processes
Land-use changes Exotic species invasions
Nutrient enrichment Climate change
Conservation
Restoration
Natural Processes Resource partitioning
Natural enemy partitioning
Resource facilitation Natural enemy facilitation
Net Effect
Species Interactions
destabilizing stabilizing - ,
I
I
I
I
I
tJ
I
I
I
tJ
I
10/10 © 2010 Nature Education Citation
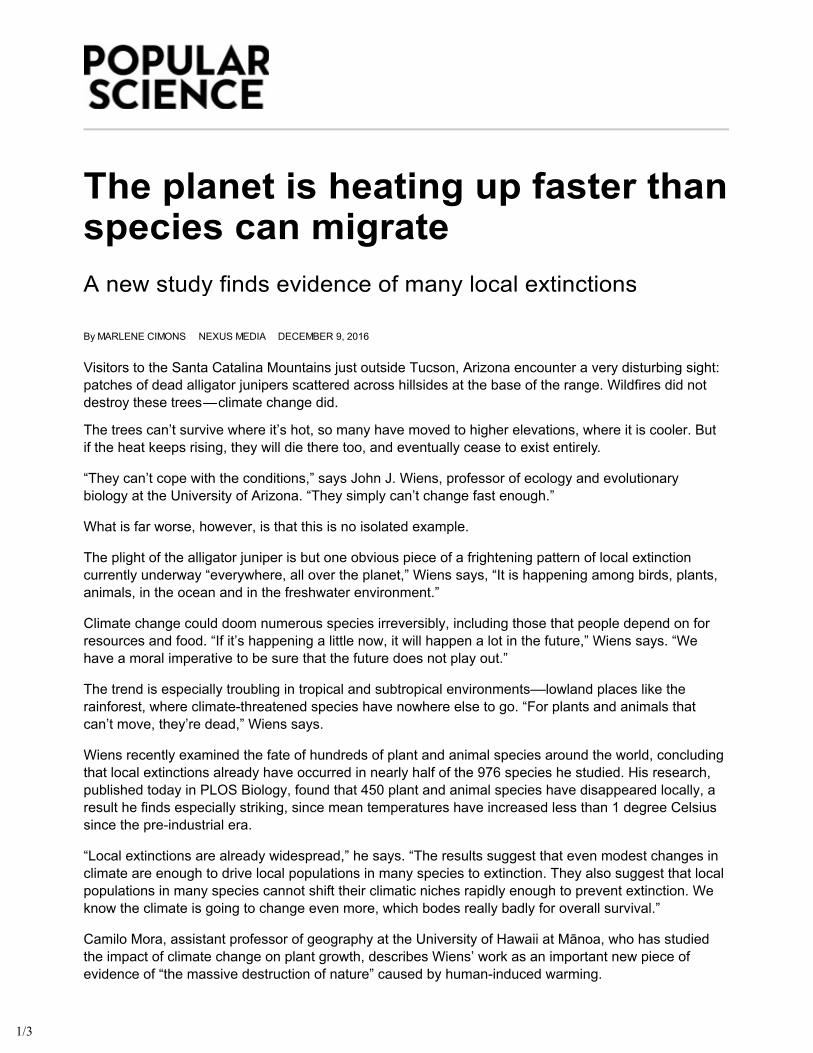
By MARLENE CIMONS NEXUS MEDIA DECEMBER 9, 2016
Visitors to the Santa Catalina Mountains just outside Tucson, Arizona encounter a very disturbing sight: patches of dead alligator junipers scattered across hillsides at the base of the range. Wildfires did not destroy these trees — climate change did.
The trees can’t survive where it’s hot, so many have moved to higher elevations, where it is cooler. But if the heat keeps rising, they will die there too, and eventually cease to exist entirely.
“They can’t cope with the conditions,” says John J. Wiens, professor of ecology and evolutionary biology at the University of Arizona. “They simply can’t change fast enough.”
What is far worse, however, is that this is no isolated example.
The plight of the alligator juniper is but one obvious piece of a frightening pattern of local extinction currently underway “everywhere, all over the planet,” Wiens says, “It is happening among birds, plants, animals, in the ocean and in the freshwater environment.”
Climate change could doom numerous species irreversibly, including those that people depend on for resources and food. “If it’s happening a little now, it will happen a lot in the future,” Wiens says. “We have a moral imperative to be sure that the future does not play out.”
The trend is especially troubling in tropical and subtropical environments––lowland places like the rainforest, where climate-threatened species have nowhere else to go. “For plants and animals that can’t move, they’re dead,” Wiens says.
Wiens recently examined the fate of hundreds of plant and animal species around the world, concluding that local extinctions already have occurred in nearly half of the 976 species he studied. His research, published today in PLOS Biology, found that 450 plant and animal species have disappeared locally, a result he finds especially striking, since mean temperatures have increased less than 1 degree Celsius since the pre-industrial era.
“Local extinctions are already widespread,” he says. “The results suggest that even modest changes in climate are enough to drive local populations in many species to extinction. They also suggest that local populations in many species cannot shift their climatic niches rapidly enough to prevent extinction. We know the climate is going to change even more, which bodes really badly for overall survival.”
Camilo Mora, assistant professor of geography at the University of Hawaii at Mānoa, who has studied the impact of climate change on plant growth, describes Wiens’ work as an important new piece of evidence of “the massive destruction of nature” caused by human-induced warming.
1/3
“The fingerprint of climate change on nature is demonstrated yet again,” says Mora, who was not involved in Wiens’ study. “This is not rocket science. Whenever you heat up a place, species are forced to deal with it. Climate change, compounded by other stressors, appears to be too much for species to take. Clearly, we are making it hard for species to endure us.”
Jeremy Kerr, a professor of biology at the University of Ottawa who has studied the effects of climate change on bumblebees, called these growing extinctions “dangerous [because] we rely on a lot of these species for ecosystem services we can’t really do without, like pollination."
“Some of the species that are disappearing serve critical functions,” he adds. “We all know about monarch butterflies, one of the most beautiful animals in the world. Climate change… is contributing to their decline. Other animals that are even more important for practical reasons are bumblebees, and we now know that climate change is part of the reason for their decline also. These losses chip away at the planet’s life support systems, which we need.”
David Inouye, a professor emeritus of biology at the University of Maryland who studies the impact of climate change on the environment, agrees.
“Scientists have predicted for a while now that we are entering the sixth major mass extinction event in the history of life on the planet,” he says. “Evidence for this is now accumulating…this study provides insights into the range shifts that can already be documented in both plants and animals in response to the changing climate, and how the dynamics of range shifts can lead to local, and eventually, global extinctions.”
In fact, Inouye says, he has seen similar trends in his own research. “In my work in the Rocky Mountains, we have observed several species of animals, from moose to mosquitoes, moving up in altitude, and plants disappearing from the lower part of their former ranges,” he says. “Bumblebees are also moving up in altitude. If plants and pollinators don’t move at the same rates, historic interactions will be disrupted, potentially leading to more examples of local extinctions.”
Even those species that try to move upward may not be able to do so, according to the new study. Human factors, such as agriculture, roads, and increasing urbanization may impede their ability to relocate by leaving them no other live-able habitats, the study says.
Moreover, “many species are already confined to islands, peninsulas and mountaintops where dispersal to higher latitudes or elevations may not be possible,” the study says, adding: “Even if dispersal is unimpeded by human or natural barriers, it may simply occur too slowly to allow species to remain within their climatic niche.”
If the heat doesn’t kill directly, it can encourage potentially dangerous interactions, Wiens says. Certain plants may become vulnerable to beetle attacks, for example, and amphibians are prone to the deadly chytrid fungus, whose growth is stimulated by heat.
“In Arizona, we no longer have any natural Tarahumara frog populations because of the fungus,” Wiens says. “Climate is the basic cause, but the proximate cause may be something else.’’
For his study, Wiens conducted a meta-analysis of dozens of existing studies demonstrating how species have shifted their geographic ranges over time in response to global warming. Using these “range-shift” studies, he found that local extinctions have occurred in the warmest parts of the ranges for nearly half of the plant and animal species studied.
His research also found that local extinctions varied by region, and were more than twice as likely to occur among tropical species compared to those in more temperate locations. This latter is important because most plant and animal species live in the tropics.
2/3

“If species live in a preserve in the topics, or in a place that has been deforested, it’s not really possible for them to move,” Wiens says. “They may be able to move up a mountain in Arizona, but that’s not going to work in a rainforest.”
“We are locked into a climate pattern, and things don’t seem to be able to adapt,” added Wiens.“This is only going to get worse if the climate warms further.”
Mora, of the University of Hawaii, agrees. “When places start failing to meet basic human needs for water… We will also very likely start seeing people moving as well,” he says. “Our planet is increasingly becoming unsuitable for many species, potentially even us.”
Marlene Cimons writes for Nexus Media, a syndicated newswire covering climate, energy, policy, art and culture.
Copyright © 2016 Popular Science. A Bonnier Corporation Company. All rights reserved. Reproduction in whole or inpart without permission is prohibited.
3/3
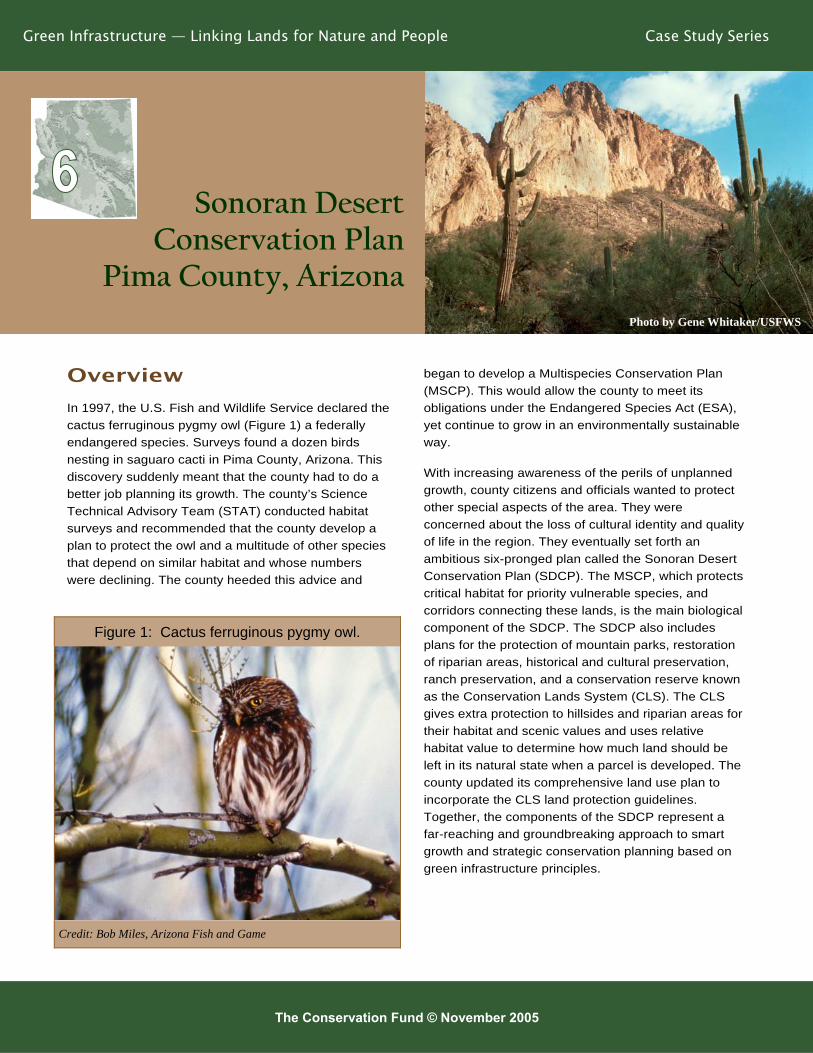
Green Infrastructure — Linking Lands for Nature and People Case Study Series
The Conservation Fund © November 2005
In 1997, the U.S. Fish and Wildlife Service declared the
cactus ferruginous pygmy owl (Figure 1) a federally
endangered species. Surveys found a dozen birds
nesting in saguaro cacti in Pima County, Arizona. This
discovery suddenly meant that the county had to do a
better job planning its growth. The county’s Science
Technical Advisory Team (STAT) conducted habitat
surveys and recommended that the county develop a
plan to protect the owl and a multitude of other species
that depend on similar habitat and whose numbers
were declining. The county heeded this advice and
began to develop a Multispecies Conservation Plan
(MSCP). This would allow the county to meet its
obligations under the Endangered Species Act (ESA),
yet continue to grow in an environmentally sustainable
way.
With increasing awareness of the perils of unplanned
growth, county citizens and officials wanted to protect
other special aspects of the area. They were
concerned about the loss of cultural identity and quality
of life in the region. They eventually set forth an
ambitious six-pronged plan called the Sonoran Desert
Conservation Plan (SDCP). The MSCP, which protects
critical habitat for priority vulnerable species, and
corridors connecting these lands, is the main biological
component of the SDCP. The SDCP also includes
plans for the protection of mountain parks, restoration
of riparian areas, historical and cultural preservation,
ranch preservation, and a conservation reserve known
as the Conservation Lands System (CLS). The CLS
gives extra protection to hillsides and riparian areas for
their habitat and scenic values and uses relative
habitat value to determine how much land should be
left in its natural state when a parcel is developed. The
county updated its comprehensive land use plan to
incorporate the CLS land protection guidelines.
Together, the components of the SDCP represent a
far-reaching and groundbreaking approach to smart
growth and strategic conservation planning based on
green infrastructure principles.
Overview
Sonoran Desert Conservation Plan
Pima County, Arizona Photo by Gene Whitaker/USFWS
Figure 1: Cactus ferruginous pygmy owl.
Credit: Bob Miles, Arizona Fish and Game
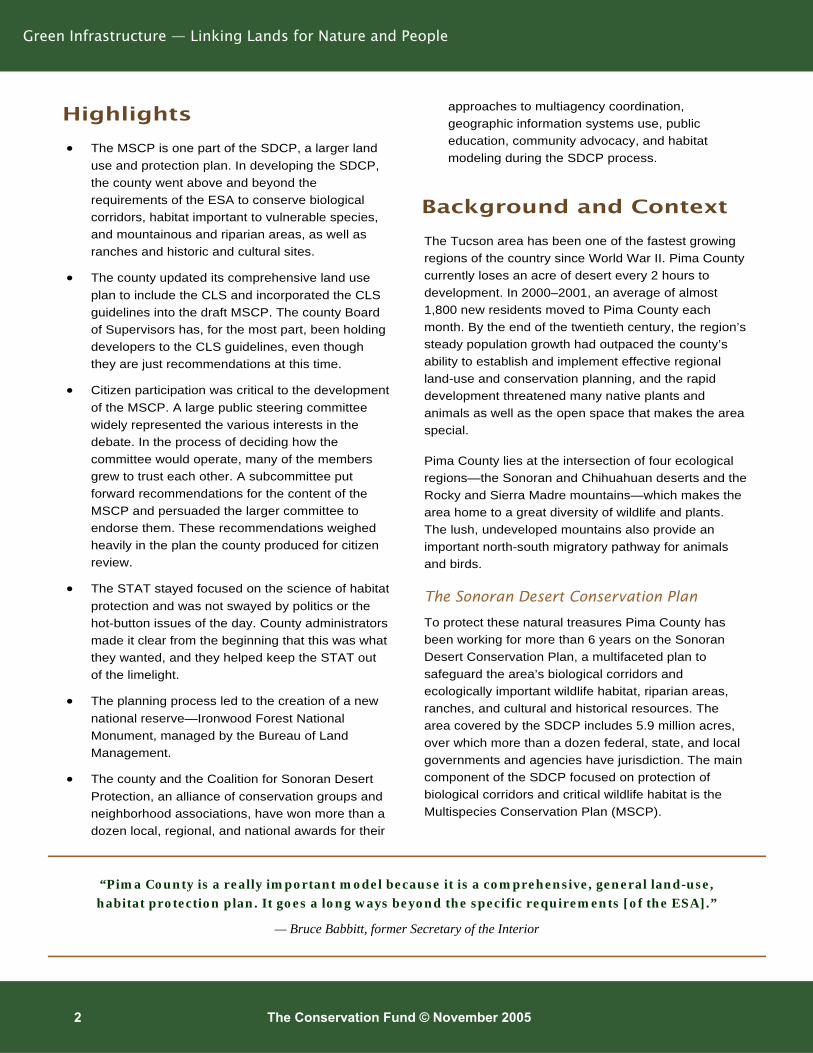
Green Infrastructure — Linking Lands for Nature and People
• The MSCP is one part of the SDCP, a larger land
use and protection plan. In developing the SDCP,
the county went above and beyond the
requirements of the ESA to conserve biological
corridors, habitat important to vulnerable species,
and mountainous and riparian areas, as well as
ranches and historic and cultural sites.
• The county updated its comprehensive land use
plan to include the CLS and incorporated the CLS
guidelines into the draft MSCP. The county Board
of Supervisors has, for the most part, been holding
developers to the CLS guidelines, even though
they are just recommendations at this time.
• Citizen participation was critical to the development
of the MSCP. A large public steering committee
widely represented the various interests in the
debate. In the process of deciding how the
committee would operate, many of the members
grew to trust each other. A subcommittee put
forward recommendations for the content of the
MSCP and persuaded the larger committee to
endorse them. These recommendations weighed
heavily in the plan the county produced for citizen
review.
• The STAT stayed focused on the science of habitat
protection and was not swayed by politics or the
hot-button issues of the day. County administrators
made it clear from the beginning that this was what
they wanted, and they helped keep the STAT out
of the limelight.
• The planning process led to the creation of a new
national reserve—Ironwood Forest National
Monument, managed by the Bureau of Land
Management.
• The county and the Coalition for Sonoran Desert
Protection, an alliance of conservation groups and
neighborhood associations, have won more than a
dozen local, regional, and national awards for their
approaches to multiagency coordination,
geographic information systems use, public
education, community advocacy, and habitat
modeling during the SDCP process.
The Tucson area has been one of the fastest growing
regions of the country since World War II. Pima County
currently loses an acre of desert every 2 hours to
development. In 2000–2001, an average of almost
1,800 new residents moved to Pima County each
month. By the end of the twentieth century, the region’s
steady population growth had outpaced the county’s
ability to establish and implement effective regional
land-use and conservation planning, and the rapid
development threatened many native plants and
animals as well as the open space that makes the area
special.
Pima County lies at the intersection of four ecological
regions—the Sonoran and Chihuahuan deserts and the
Rocky and Sierra Madre mountains—which makes the
area home to a great diversity of wildlife and plants.
The lush, undeveloped mountains also provide an
important north-south migratory pathway for animals
and birds.
The Sonoran Desert Conservation Plan
To protect these natural treasures Pima County has
been working for more than 6 years on the Sonoran
Desert Conservation Plan, a multifaceted plan to
safeguard the area’s biological corridors and
ecologically important wildlife habitat, riparian areas,
ranches, and cultural and historical resources. The
area covered by the SDCP includes 5.9 million acres,
over which more than a dozen federal, state, and local
governments and agencies have jurisdiction. The main
component of the SDCP focused on protection of
biological corridors and critical wildlife habitat is the
Multispecies Conservation Plan (MSCP).
The Conservation Fund © November 2005 2
Highlights
“Pima County is a really important model because it is a comprehensive, general land-use,
habitat protection plan. It goes a long ways beyond the specific requirements [of the ESA].”
— Bruce Babbitt, former Secretary of the Interior
Background and Context
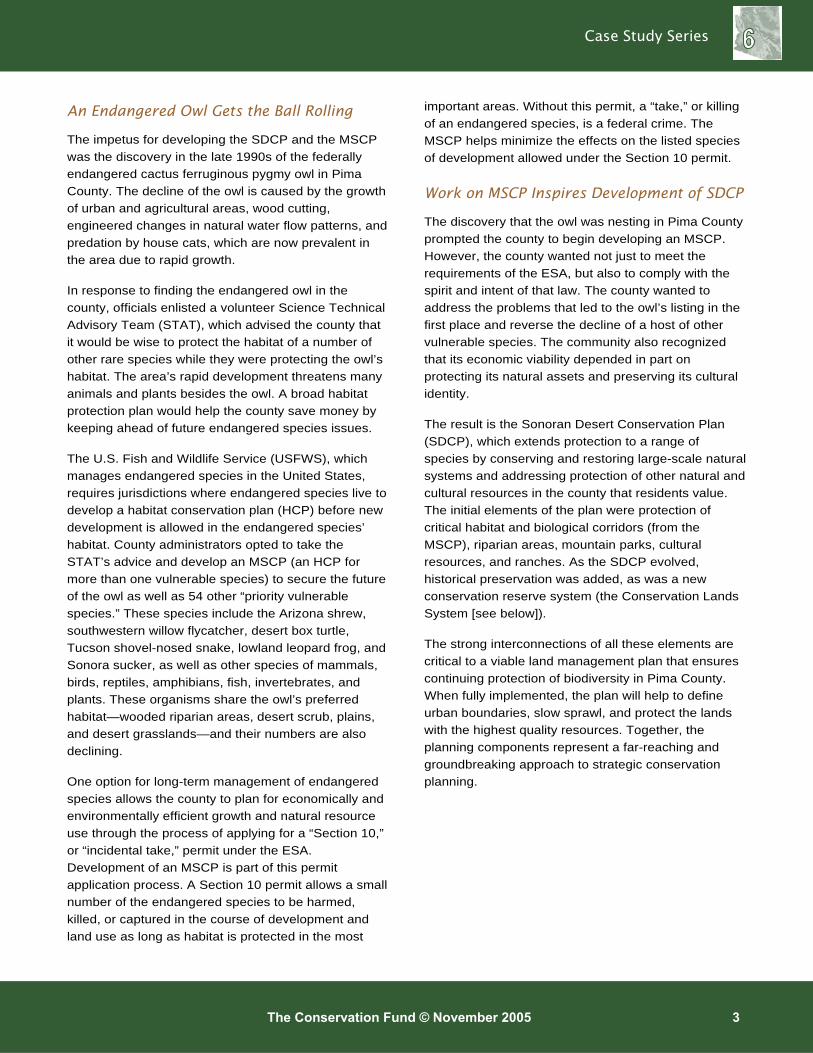
An Endangered Owl Gets the Ball Rolling
The impetus for developing the SDCP and the MSCP
was the discovery in the late 1990s of the federally
endangered cactus ferruginous pygmy owl in Pima
County. The decline of the owl is caused by the growth
of urban and agricultural areas, wood cutting,
engineered changes in natural water flow patterns, and
predation by house cats, which are now prevalent in
the area due to rapid growth.
In response to finding the endangered owl in the
county, officials enlisted a volunteer Science Technical
Advisory Team (STAT), which advised the county that
it would be wise to protect the habitat of a number of
other rare species while they were protecting the owl’s
habitat. The area’s rapid development threatens many
animals and plants besides the owl. A broad habitat
protection plan would help the county save money by
keeping ahead of future endangered species issues.
The U.S. Fish and Wildlife Service (USFWS), which
manages endangered species in the United States,
requires jurisdictions where endangered species live to
develop a habitat conservation plan (HCP) before new
development is allowed in the endangered species’
habitat. County administrators opted to take the
STAT’s advice and develop an MSCP (an HCP for
more than one vulnerable species) to secure the future
of the owl as well as 54 other “priority vulnerable
species.” These species include the Arizona shrew,
southwestern willow flycatcher, desert box turtle,
Tucson shovel-nosed snake, lowland leopard frog, and
Sonora sucker, as well as other species of mammals,
birds, reptiles, amphibians, fish, invertebrates, and
plants. These organisms share the owl’s preferred
habitat—wooded riparian areas, desert scrub, plains,
and desert grasslands—and their numbers are also
declining.
One option for long-term management of endangered
species allows the county to plan for economically and
environmentally efficient growth and natural resource
use through the process of applying for a “Section 10,”
or “incidental take,” permit under the ESA.
Development of an MSCP is part of this permit
application process. A Section 10 permit allows a small
number of the endangered species to be harmed,
killed, or captured in the course of development and
land use as long as habitat is protected in the most
important areas. Without this permit, a “take,” or killing
of an endangered species, is a federal crime. The
MSCP helps minimize the effects on the listed species
of development allowed under the Section 10 permit.
Work on MSCP Inspires Development of SDCP
The discovery that the owl was nesting in Pima County
prompted the county to begin developing an MSCP.
However, the county wanted not just to meet the
requirements of the ESA, but also to comply with the
spirit and intent of that law. The county wanted to
address the problems that led to the owl’s listing in the
first place and reverse the decline of a host of other
vulnerable species. The community also recognized
that its economic viability depended in part on
protecting its natural assets and preserving its cultural
identity.
The result is the Sonoran Desert Conservation Plan
(SDCP), which extends protection to a range of
species by conserving and restoring large-scale natural
systems and addressing protection of other natural and
cultural resources in the county that residents value.
The initial elements of the plan were protection of
critical habitat and biological corridors (from the
MSCP), riparian areas, mountain parks, cultural
resources, and ranches. As the SDCP evolved,
historical preservation was added, as was a new
conservation reserve system (the Conservation Lands
System [see below]).
The strong interconnections of all these elements are
critical to a viable land management plan that ensures
continuing protection of biodiversity in Pima County.
When fully implemented, the plan will help to define
urban boundaries, slow sprawl, and protect the lands
with the highest quality resources. Together, the
planning components represent a far-reaching and
groundbreaking approach to strategic conservation
planning.
The Conservation Fund © November 2005 3
Case Study Series
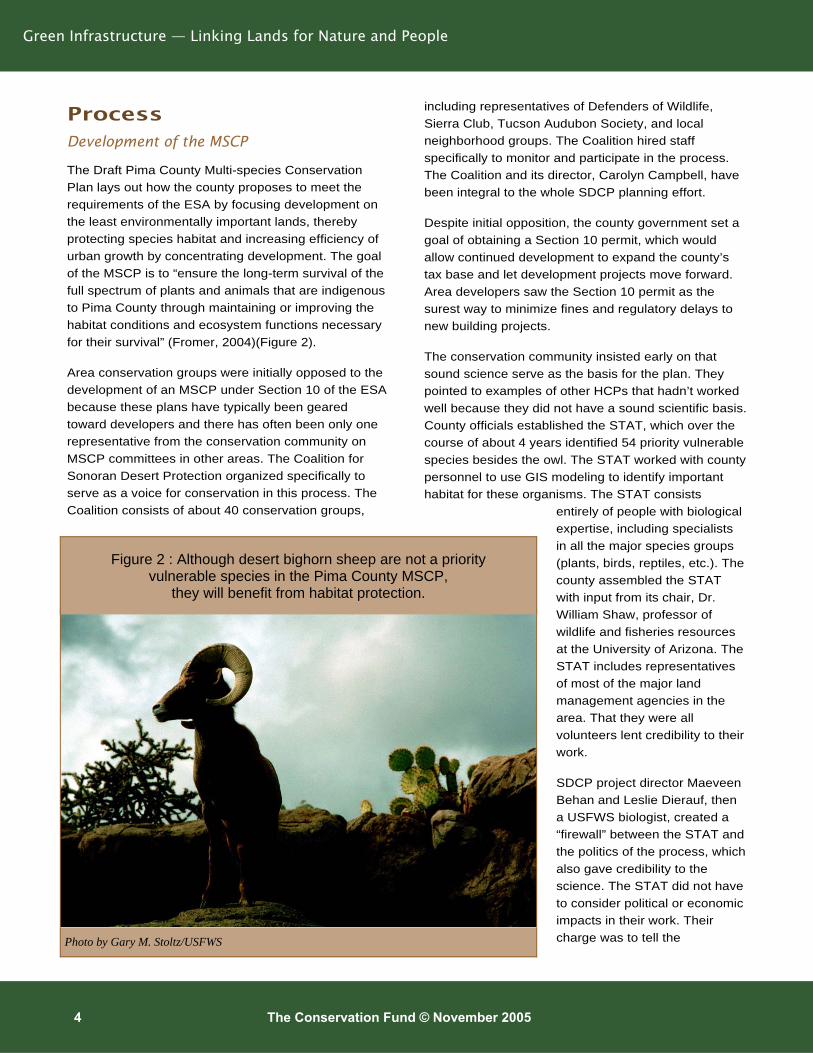
Development of the MSCP
The Draft Pima County Multi-species Conservation
Plan lays out how the county proposes to meet the
requirements of the ESA by focusing development on
the least environmentally important lands, thereby
protecting species habitat and increasing efficiency of
urban growth by concentrating development. The goal
of the MSCP is to “ensure the long-term survival of the
full spectrum of plants and animals that are indigenous
to Pima County through maintaining or improving the
habitat conditions and ecosystem functions necessary
for their survival” (Fromer, 2004)(Figure 2).
Area conservation groups were initially opposed to the
development of an MSCP under Section 10 of the ESA
because these plans have typically been geared
toward developers and there has often been only one
representative from the conservation community on
MSCP committees in other areas. The Coalition for
Sonoran Desert Protection organized specifically to
serve as a voice for conservation in this process. The
Coalition consists of about 40 conservation groups,
including representatives of Defenders of Wildlife,
Sierra Club, Tucson Audubon Society, and local
neighborhood groups. The Coalition hired staff
specifically to monitor and participate in the process.
The Coalition and its director, Carolyn Campbell, have
been integral to the whole SDCP planning effort.
Despite initial opposition, the county government set a
goal of obtaining a Section 10 permit, which would
allow continued development to expand the county’s
tax base and let development projects move forward.
Area developers saw the Section 10 permit as the
surest way to minimize fines and regulatory delays to
new building projects.
The conservation community insisted early on that
sound science serve as the basis for the plan. They
pointed to examples of other HCPs that hadn’t worked
well because they did not have a sound scientific basis.
County officials established the STAT, which over the
course of about 4 years identified 54 priority vulnerable
species besides the owl. The STAT worked with county
personnel to use GIS modeling to identify important
habitat for these organisms. The STAT consists
entirely of people with biological
expertise, including specialists
in all the major species groups
(plants, birds, reptiles, etc.). The
county assembled the STAT
with input from its chair, Dr.
William Shaw, professor of
wildlife and fisheries resources
at the University of Arizona. The
STAT includes representatives
of most of the major land
management agencies in the
area. That they were all
volunteers lent credibility to their
work.
SDCP project director Maeveen
Behan and Leslie Dierauf, then
a USFWS biologist, created a
“firewall” between the STAT and
the politics of the process, which
also gave credibility to the
science. The STAT did not have
to consider political or economic
impacts in their work. Their
charge was to tell the
Green Infrastructure — Linking Lands for Nature and People
The Conservation Fund © November 2005 4
Process
Figure 2 : Although desert bighorn sheep are not a priority vulnerable species in the Pima County MSCP,
they will benefit from habitat protection.
Photo by Gary M. Stoltz/USFWS
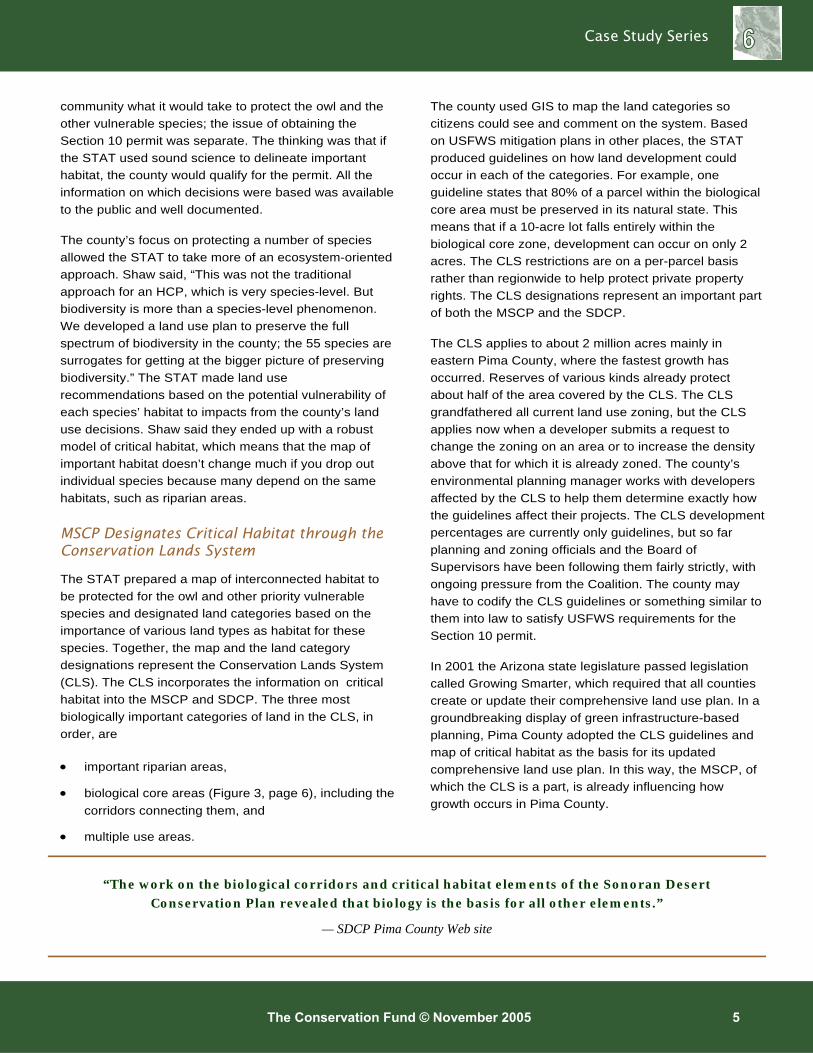
community what it would take to protect the owl and the
other vulnerable species; the issue of obtaining the
Section 10 permit was separate. The thinking was that if
the STAT used sound science to delineate important
habitat, the county would qualify for the permit. All the
information on which decisions were based was available
to the public and well documented.
The county’s focus on protecting a number of species
allowed the STAT to take more of an ecosystem-oriented
approach. Shaw said, “This was not the traditional
approach for an HCP, which is very species-level. But
biodiversity is more than a species-level phenomenon.
We developed a land use plan to preserve the full
spectrum of biodiversity in the county; the 55 species are
surrogates for getting at the bigger picture of preserving
biodiversity.” The STAT made land use
recommendations based on the potential vulnerability of
each species’ habitat to impacts from the county’s land
use decisions. Shaw said they ended up with a robust
model of critical habitat, which means that the map of
important habitat doesn’t change much if you drop out
individual species because many depend on the same
habitats, such as riparian areas.
MSCP Designates Critical Habitat through the Conservation Lands System
The STAT prepared a map of interconnected habitat to
be protected for the owl and other priority vulnerable
species and designated land categories based on the
importance of various land types as habitat for these
species. Together, the map and the land category
designations represent the Conservation Lands System
(CLS). The CLS incorporates the information on critical
habitat into the MSCP and SDCP. The three most
biologically important categories of land in the CLS, in
order, are
• important riparian areas,
• biological core areas (Figure 3, page 6), including the
corridors connecting them, and
• multiple use areas.
The county used GIS to map the land categories so
citizens could see and comment on the system. Based
on USFWS mitigation plans in other places, the STAT
produced guidelines on how land development could
occur in each of the categories. For example, one
guideline states that 80% of a parcel within the biological
core area must be preserved in its natural state. This
means that if a 10-acre lot falls entirely within the
biological core zone, development can occur on only 2
acres. The CLS restrictions are on a per-parcel basis
rather than regionwide to help protect private property
rights. The CLS designations represent an important part
of both the MSCP and the SDCP.
The CLS applies to about 2 million acres mainly in
eastern Pima County, where the fastest growth has
occurred. Reserves of various kinds already protect
about half of the area covered by the CLS. The CLS
grandfathered all current land use zoning, but the CLS
applies now when a developer submits a request to
change the zoning on an area or to increase the density
above that for which it is already zoned. The county’s
environmental planning manager works with developers
affected by the CLS to help them determine exactly how
the guidelines affect their projects. The CLS development
percentages are currently only guidelines, but so far
planning and zoning officials and the Board of
Supervisors have been following them fairly strictly, with
ongoing pressure from the Coalition. The county may
have to codify the CLS guidelines or something similar to
them into law to satisfy USFWS requirements for the
Section 10 permit.
In 2001 the Arizona state legislature passed legislation
called Growing Smarter, which required that all counties
create or update their comprehensive land use plan. In a
groundbreaking display of green infrastructure-based
planning, Pima County adopted the CLS guidelines and
map of critical habitat as the basis for its updated
comprehensive land use plan. In this way, the MSCP, of
which the CLS is a part, is already influencing how
growth occurs in Pima County.
The Conservation Fund © November 2005 5
“The work on the biological corridors and critical habitat elements of the Sonoran Desert
Conservation Plan revealed that biology is the basis for all other elements.”
— SDCP Pima County Web site
Case Study Series
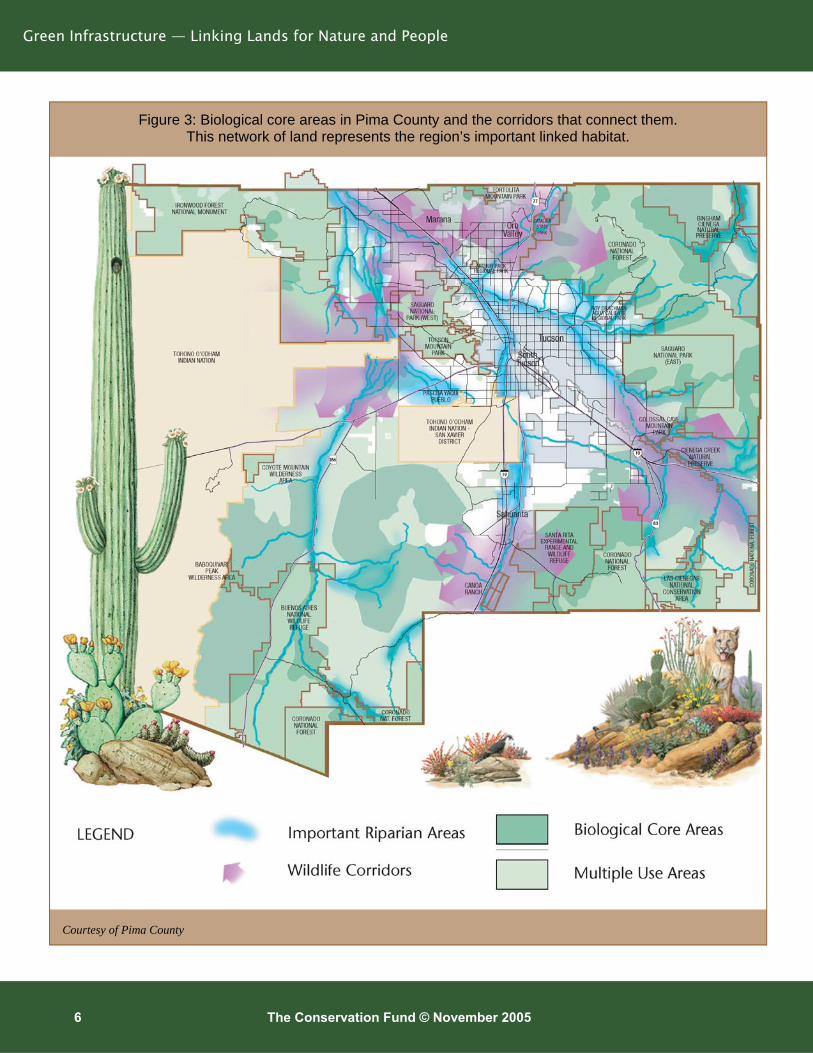
Green Infrastructure — Linking Lands for Nature and People
The Conservation Fund © November 2005 6
Courtesy of Pima County
Figure 3: Biological core areas in Pima County and the corridors that connect them. This network of land represents the region’s important linked habitat.
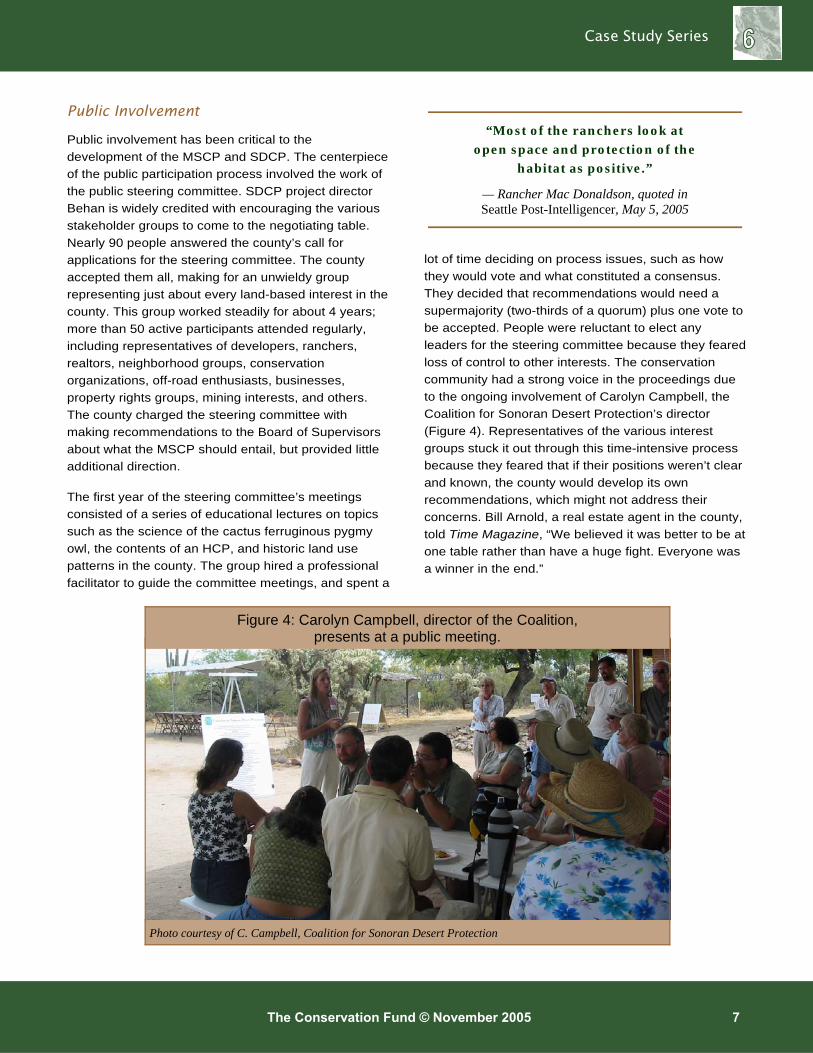
The Conservation Fund © November 2005 7
Public Involvement
Public involvement has been critical to the
development of the MSCP and SDCP. The centerpiece
of the public participation process involved the work of
the public steering committee. SDCP project director
Behan is widely credited with encouraging the various
stakeholder groups to come to the negotiating table.
Nearly 90 people answered the county’s call for
applications for the steering committee. The county
accepted them all, making for an unwieldy group
representing just about every land-based interest in the
county. This group worked steadily for about 4 years;
more than 50 active participants attended regularly,
including representatives of developers, ranchers,
realtors, neighborhood groups, conservation
organizations, off-road enthusiasts, businesses,
property rights groups, mining interests, and others.
The county charged the steering committee with
making recommendations to the Board of Supervisors
about what the MSCP should entail, but provided little
additional direction.
The first year of the steering committee’s meetings
consisted of a series of educational lectures on topics
such as the science of the cactus ferruginous pygmy
owl, the contents of an HCP, and historic land use
patterns in the county. The group hired a professional
facilitator to guide the committee meetings, and spent a
lot of time deciding on process issues, such as how
they would vote and what constituted a consensus.
They decided that recommendations would need a
supermajority (two-thirds of a quorum) plus one vote to
be accepted. People were reluctant to elect any
leaders for the steering committee because they feared
loss of control to other interests. The conservation
community had a strong voice in the proceedings due
to the ongoing involvement of Carolyn Campbell, the
Coalition for Sonoran Desert Protection’s director
(Figure 4). Representatives of the various interest
groups stuck it out through this time-intensive process
because they feared that if their positions weren’t clear
and known, the county would develop its own
recommendations, which might not address their
concerns. Bill Arnold, a real estate agent in the county,
told Time Magazine, “We believed it was better to be at
one table rather than have a huge fight. Everyone was
a winner in the end.”
Photo courtesy of C. Campbell, Coalition for Sonoran Desert Protection
Figure 4: Carolyn Campbell, director of the Coalition, presents at a public meeting.
“Most of the ranchers look at
open space and protection of the
habitat as positive.”
— Rancher Mac Donaldson, quoted in Seattle Post-Intelligencer, May 5, 2005
Case Study Series
In 2004 the Coalition published a report called
“Community Vision for the Sonoran Desert
Conservation Plan.” It outlines objectives that, in the
Coalition’s view, must be part of the MSCP for it to be
effective:
• specify conservation goals for each of the 55
priority vulnerable species based on its current
status and threats,
• protect the most important lands,
• improve and consolidate current land use
ordinances to ensure protection for the most
important lands and most threatened species and
habitats and to ease the permitting process for
development,
• manage and monitor conserved land, and
• provide dedicated funding for implementation.
Eventually a subcommittee of about a dozen
extraordinarily committed people, including Campbell,
emerged and met repeatedly to hammer out some
general recommendations, which they then convinced
others on the committee to accept. The steering
committee put forth a “Preferred Alternative” that
described preferred details of the MSCP, including
which methods should be used to protect land, which
areas should be protected, and how the plan should be
financed. The county accepted the steering
committee’s recommendation report, but the MSCP is
still a work in progress, and there is no guarantee that
the recommendations will make it into the final plan.
The county has continued to work with this smaller
citizens committee, the MSCP-Implementation
Agreement (MSCP-IA) Drafting Committee, to reach
consensus on some of the finer details of the plan,
such as how offsite mitigation might occur. It’s currently
uncertain whether the county will allow a developer to
build on, say, 100% of a parcel within the biological
core and instead purchase for conservation an area of
the same relative habitat value elsewhere. If this is an
option, the required rate of mitigation must be
established (the number of acres preserved for every
acre developed) and a process must be in place to
determine how the mitigation lands will be laid out so
that they form useful habitat for the priority vulnerable
species. These issues are currently being deliberated
by the MSCP-IA Drafting Committee.
All meetings of the public steering committee and
STAT are open to the public and include public
comment periods, and the county seeks comments on
various aspects of the process and the project’s
reports. The county estimates that there have been
more than 400 public meetings since the process
began. The county held open houses about once a
month at various area libraries and meeting halls, at
which scientists and county staff presented draft maps
and were available to answer related questions. The
county held additional public meetings in various
regions during the processes of updating the
comprehensive land use plan and deciding which lands
to include in a 2004 open space bond, which was
overwhelmingly approved by voters (see below for
more information on this bond issue).
As part of the public education process, Pima County
created Sonoran Desert Kids, which uses education,
recreation, communication, and action to engage
children in the issues and to educate them about the
SDCP. The Sonoran Desert Kids Web site (http://
www.co.pima.az.us/cmo/sdcp/kids) provides
information, games, and activities (Figure 5) to engage
children in conservation action.
Green Infrastructure — Linking Lands for Nature and People
The Conservation Fund © November 2005 8
Figure 5: A sample of children’s artwork created during an SDCP educational event.
Courtesy of Pima County

Current Status
The county released the first draft of the MSCP in
January 2004 and the second draft in February 2005.
The county has already begun implementing some of
its recommendations by holding developers to the CLS
guidelines, purchasing important habitat as funds
allow, and assisting with the designation of a new
national reserve—the Ironwood Forest National
Monument. In spring 2005, consultants were working
on the official documentation for submittal of the MSCP
and associated documents to the USFWS. Under the
STAT’s supervision, a consulting firm was developing
an environmental impact statement and preparing a
take permit analysis, which quantifies the incidental
take (incidental harm or killing of the species allowed in
the course of development as long as habitat is
protected in the most important habitat areas) of owls
and how to mitigate it, for submittal to the USFWS. The
public will have additional opportunities to comment on
these documents before they’re finalized by the end of
2005. The Pima County Board of Supervisors will
eventually vote to approve submittal of the final MSCP,
Section 10 permit application, and other associated
documents to the USFWS for review. The USFWS
estimates that it may be a year after submittal before
they reach a decision on the permit. The Coalition
looks forward to a pioneering agreement between the
parties, and has said, “when this visionary model plan
is completed, it will serve as a model for other
communities embarking on systematic habitat
conservation plans for protecting biologically important
and sensitive areas” (CSDP, 2003b) throughout the
West and the country.
Management/Stewardship
A plan for long-term management, monitoring, and
stewardship of owl populations and publicly acquired
lands is still being worked out by the STAT and its
consultants. The MSCP must provide for monitoring of
owl takes if the county is to receive its Section 10
permit.
Financing and Cost-Benefit Analysis Financing for Planning
When the planning process got off the ground, Bruce
Babbitt, of Arizona, was the U.S. Secretary of Interior.
He was interested in the process of planning on such a
large scale for the protection of so many different
organisms, and was impressed by the community’s
interest. He was instrumental in earmarking almost $1
million per year for 3 years to support the development
of the science behind the plan. These monies came
through Section 6 of the ESA for planning and paid
mainly for the work of environmental consulting
companies.
Financing for Implementation
Open Space Bonds
Pima County voters passed a 10-year bond dedicated
partially to open space in May 2004. The county
subsequently appointed a citizens’ committee to
oversee the use of bond funds. The citizens’ advisory
committee adopted a Nature Conservancy map
depicting recommendations for priority land purchases
to be funded by the bond ordinance. The total bond
issue was $175 million; of that, at least $112 million will
go toward habitat protection. This sum is about half of
what the conservation community hoped for. Some of
the remaining money is set aside specifically for
protection of land important for cultural resources or
flood control, but there may be some overlap of those
The Conservation Fund © November 2005 9
“If you create a better community in the end, doesn’t everybody win?”
— Developer Peter Backus, quoted in Audubon, May/June 2005
Case Study Series

Green Infrastructure — Linking Lands for Nature and People
categories with important habitat. So far the county has
acquired 20,000 acres for $45 million under the 2004
bond program. A previous open space bond in 1997
($36.3 million total) had a similar allocation of funding.
Exploring Alternatives
Implementation is estimated to cost $40 million to
$2 billion, depending which lands are protected. A
commonly cited number is $500 million over 5 years.
The highest land costs are northwest of the Tucson
metropolitan area. However, the county needs to
preserve important habitat land, not just the cheapest
land. The open space bond can not fund land
management and monitoring, and those costs are as
yet unquantified.
The Coalition for Sonoran Desert Protection partnered
with several other national, regional, and state
conservation organizations to form the Financing
Group, which researched the various open space and
HCP funding mechanisms existing in the Southwest
and made recommendations to the county. They found
that communities that are most successful in attaining
their conservation goals have (i) established multiple
funding sources, and (ii) gained from strong
partnerships between local government and concerned
citizens.
The Financing Group recommended that the county
• issue a general obligation bond. (The county did
this and voters approved it in 2004. A large part of
the bond went for open space preservation and
related concerns. [See above for more details.])
• impose a sales tax to take advantage of the area’s
tourism business, which thrives on open space.
• pursue private foundation funding sources.
• dedicate a percentage of general funds and
property taxes to open space protection.
The group also made the following recommendations
for state-based funding, among others:
• create a new state lottery game with proceeds
going to open space protection,
• increase travel and tourism taxes,
• adopt a state tax credit for people who donate
conservation easements,
• allocate state general funds for open space
purchases, operation, and preservation, and
• organize a state-sponsored pro-open space public
relations campaign.
The economic analysis report completed for the county
by a consultant lists state and federal grants, property
taxes, sales taxes, and mitigation fees as options to
consider as additional funding sources for plan
implementation. The report makes the following
recommendations, among others:
• build an endowment to stabilize the plan over the
long-term,
• set up a mitigation land bank,
• build in regular revenue adjustments to account for
inflation and increases in land values,
• be flexible with developers’ funding options, and
• develop a balance between taxes and fees so that
the benefits and costs are shared by all
beneficiaries.
The county has not yet proposed any other major
funding source for implementing the plan besides the
bond fund. County staff are pursuing Arizona
Department of Transportation ISTEA (Intermodal
Surface Transportation Efficiency Act Enhancements
Program) money for scenic vistas acquisitions and
matching grants under Section 6 of the ESA. With the
Section 10 permit in hand, the county will be eligible for
additional grant funding for land protection, but this will
not fulfill the entire need.
The Conservation Fund © November 2005 10
Costs vs. Benefits
County officials hired a consultant to complete an
economic impact analysis of potential costs and
benefits of obtaining the Section 10 permit. The analysis
showed that the county will realize important benefits by
implementing a plan with strong conservation
measures. Having the certainty of the permit will allow
for a more straightforward and cost-efficient
development process. The consultant predicts that this
will lead to more development in a shorter period of time
than if the county does not obtain the permit.
Without the Section 10 permit, the county would have to
stop all development in areas where the owl occurs or
require a separate MSCP for each new proposed
development in the owl’s habitat area. County officials
emphasize that the MSCP and the SDCP are not about
stopping development but about fostering responsible
growth while minimizing impacts to the landscapes that
make the area special. Having a countywide strategy
enables developers to plan further into the future
because there is less uncertainty about which land uses
will be permissible where. Failure to get approval for the
MSCP and the Section 10 permit may result in
continued, expensive lawsuits by developers and
conservation organizations.
The Coalition notes an economic shift in the county
away from removing resources from the land and
toward increased demand for unspoiled natural places
and experiences and the ecosystem benefits these
places provide. Coalition staff note that many benefits of
the SDCP are intangible and difficult to quantify and that
opponents of the plan don’t count these intangibles
when discussing the costs and benefits of the plan, so
the costs may sometimes appear to outweigh the
benefits. The Coalition argues that taking into account
intangible benefits such as cleaner water, less traffic
because of less sprawl, and the preservation of vistas
puts the balance clearly in favor of implementing the
plan. Research has established that scenic views and
access to open space and the recreational opportunities
it provides can be important factors when people decide
where to live. These factors positively affect housing
values, thereby generating more tax revenues.
Benefits
County officials realized the county would save money if
they could redirect growth to areas close to existing
infrastructure such as roads and sewer lines. They used
this advantage to sell the community on the idea of
applying for the Section 10 permit. Other benefits of the
MSCP and the SDCP include:
• protect native species and their habitats
• protect ranch lands, which provide important
habitat, a traditional way of life, and open space
• protect culturally and historically important sites
• provide recreational opportunities and preserve
aesthetic beauty
• save money in the long run by protecting native
species and their habitats before they’re at the brink
of extinction
• slow urban sprawl, thereby reducing traffic
congestion, commuting times, air pollution, and
other costs associated with sprawl
• increase property values by preserving views, open
space, clean water, recreational opportunities, and
protecting against flood damage
• protect jobs by creating a more diverse economy
and bringing more tourism dollars to the area
• improve efficiency of the economy by controlling
wasteful uses of natural resources
• improve citizens’ health by encouraging walking
and outdoor recreation and discouraging driving,
thereby lessening pollution
• promote social unity among neighborhoods and
communities as more people take advantage of
outdoor recreational opportunities.
The Conservation Fund © November 2005 11
“The health of Arizona’s economy increasingly depends on having a healthy environment.”
— Coalition for Sonoran Desert Protection
Case Study Series
Application of Green Infrastructure Principles
Principle 1: Protect green infrastructure before development.
The establishment of the CLS and its integration into
the county land use plan demonstrates Pima County’s
efforts to get out ahead of development, as does the
county’s decision to protect habitat not just for the
endangered cactus ferruginous pygmy owl but for 54
other priority vulnerable species (Figure 6) that share
similar habitats. This strategy recognizes that it’s less
expensive to protect species before they’re threatened
or endangered.
Principle 2: Engage a diverse group of stakeholders.
The county allowed all citizens who were interested in
sitting on the MSCP public steering committee to do
so. The group included representatives of virtually all
the interests in growth and development in the area.
The large size of the group proved unwieldy at first,
until the die-hard members of the group emerged. This
smaller group still meets to develop recommendations
on issues related to the MSCP and SDCP. Letting the
group develop its own strategy for tackling the issues
ensured representation of the various interests
throughout the process. People with diverse interests
gradually learned to trust each other and compromise.
The Coalition for Sonoran Desert Protection, which
served as a voice for conservation in the SDCP
process, represents a broad cross-section of local and
national environmental groups who learned to
collaborate to achieve a mutually agreeable goal. This
sector’s voice was stronger because the groups spoke
with one reasonable voice.
County administrators recruited experts from multiple
government agencies and in various fields for the
STAT. A citizen advisory committee oversees the open
space bond issue and another is researching options
for funding implementation of the SDCP. All meetings
of the public steering committee and the STAT are
open to the public and include public comment periods.
In addition the county has held dozens of public
meetings about various aspects of the SDCP and
MSCP process.
Principle 3: Linkage is key.
Recognizing the great biodiversity in their area, the
county chose to use the MSCP approach to protect
habitat for the cactus ferruginous pygmy owl as well as
for 54 other priority vulnerable species (Figure 7, page
13). Many of the species’ habitat requirements overlap.
Because riparian areas provide some of the most
important and rare habitat types, habitat protection can
go hand-in-hand with flood control projects. Leaving
riparian areas undeveloped is best for both habitat
protection and flood damage control, which may allow
bond issue funding to serve a dual purpose. The CLS
aims to protect important linked habitat on a regionwide
basis.
Principle 4: Work at different scales and across boundaries.
The SDCP is a countywide plan encompassing lands
managed by various entities for different objectives.
The SDCP set out from the beginning to accommodate
various land use goals, from habitat protection and
open space conservation to preserving ranches and
historic and cultural resources. Through the CLS, the
STAT identified the most important habitat areas and
designated appropriate levels of development for the
different categories of land.
Green Infrastructure — Linking Lands for Nature and People
The Conservation Fund © November 2005 12
Figure 6: Bell’s vireo, a priority vulnerable species in the Pima County MSCP.
Photo by Steve Maslowski/USFWS
Principle 5: Use sound science.
About 150 different experts commented on various
aspects of the STAT’s work, and models were refined
based on their input. Reed Noss, an early practitioner of
landscape-scale conservation planning, and Laura
Hood Watchman, director of habitat conservation
planning for Defenders of Wildlife, reviewed the broader
process to ensure that the methods used and the
assumptions made were valid. County administrators
staunchly protected the STAT from the political side of
the issues, a fact that Noss and Watchman praised. The
two reviewers also commended the county’s provision
of the STAT with adequate financial resources and staff
to get the job done. The reviewers described the SDCP
as “a credible, science-based process designed to
achieve clear and laudable goals for the long term
conservation of biodiversity in Pima County” (Noss and
Watchman, 2001). Noss said that the plan was in the
“top 10% in scientific credibility of more than 300 habitat
conservation plans that have won federal
approval” (Davis, 2001).
Principle 6: Fund up-front as a public investment.
Since 1997 the voters of Pima County have approved
two bonds, about $150 million of which are dedicated to
open space protection. The county and various citizens’
groups are studying additional options for funding
implementation of the SDCP in order to spread the
financing responsibility among local, state, and national
users of the area’s resources.
Principle 7: Green infrastructure benefits all.
Intense citizen participation provided a cornerstone of
the MSCP and SDCP development processes and
identified approaches acceptable to all parties. It is
impossible to stop growth, so it’s preferable to develop
a plan to ensure that it’s done in an environmentally
responsible manner. Pima County government will save
money by focusing growth in areas where roads,
sewers, and electric lines already exist. Developers
benefit from reduced regulatory review times, more
clearly defined requirements, and less uncertainty about
whether projects will be permitted. Citizens benefit
through reduced commuting times, cleaner air and
water, improved access to open space and its
associated recreational opportunities, and flood control.
Principle 8: Make green infrastructure the framework for conservation and development.
Pima County’s SDCP embodies this principle. The
habitat preservation needs of the region’s remaining
undeveloped land now come before development
needs. Incorporation of the CLS into the comprehensive
land use plan gives the CLS greater regulatory strength.
Through the SDCP, administrators have already
identified the top priority parcels for conservation so
they can move quickly to protect them when the parcels
and/or funding become available.
The Conservation Fund © November 2005 13
Figure 7: Swainson’s hawk, a priority vulnerable species in the
Pima County MSCP.
Photo by Karen & John Hollingsworth/USFWS
Case Study Series
“The old debate about whether growth is good or bad is irrelevant. We have been growing for 50 years
[in Tucson]. But we control where our growth occurs so it maximizes benefits and minimizes impacts.”
— Chuck Huckelberry, Pima County administrator, quoted in Time Magazine, March 28, 2005

Evaluation Unique, innovative, outstanding elements
• County administrators saw that the presence of the
owl in the county presented them with an
opportunity to encourage comprehensive land use
planning. They understood that this type of
planning could benefit the county in many ways.
• The integration of the CLS into the county land use
plan and the large scale and multiple facets of the
SDCP provide for a more comprehensive planning
approach than most areas have undertaken. This
should minimize conflicts between land use and
conservation measures.
• Tremendous public participation and volunteer
work enabled the effort to succeed. A
subcommittee of the steering committee worked
out the details of the committee’s
recommendations to the county and convinced the
others in their groups to support them. The result
was increased trust among the various interests,
rather than polarization, as so often happens with
land use planning. Carolyn Campbell said, “This
plan only sets a precedent if everyone’s holding
hands and agreeing to this.”
• The county shielded the STAT from political
pressures to favor one interest over another, and
as a result, the STAT findings were based strictly
on well documented science. Outside experts
provided specialized knowledge and peer review.
The STAT satisfied the concerns of most of the
mainstream environmental and development
groups.
Challenges
• The continuity of county leadership could become
a problem because the SDCP process has been
ongoing for several years. The sitting board of
supervisors is supportive, but that could change as
time passes.
• The 109th Congress may reauthorize the ESA and
in the process weaken the act’s protections. It is
unclear how reauthorization of the ESA ranks in
comparison to the slate of other issues on the
table. The act has been up for reauthorization for
more than 12 years. The owl could be down-listed
or de-listed, possibly because of healthy
populations across the U.S. border in Mexico.
• Some areas of the county—the city of Tucson and
the town of Marana—are working on their own
Section 10 permit applications. It’s unclear how
these will affect the county plan. Some developers
were trying to have their land annexed into Marana
so they would face less stringent building
requirements. Both Tucson and Marana are using
the county’s data and have many of the same
experts working with them. The CLS does not
cover the town of Marana. The town has recently
annexed a lot of state land, and the county has
requested that they apply the CLS requirements to
those lands.
• The MSCP and SCDP are long-term plans based
on the best currently available scientific data. But
no amount of scientific knowledge can completely
predict future events. This could mean that
circumstances may change and the intended
results may be unobtainable. For example, the “no
surprises” clause of the ESA says that developers
are not subject to further restrictions in the future
even if the plan isn’t working to save owls.
Developers favor the certainty this clause brings,
but their certainty comes at the expense of the
Green Infrastructure — Linking Lands for Nature and People
The Conservation Fund © November 2005 14
"The SDCP has taken conservation planning to the next level by integrating
ecosystems, economic growth, cultural resources, and development.
This is an excellent model of creative planning that shows growing communities
how to balance our built and natural environments."
— Bruce Knight, American Institute of Certified Planners

conservation community’s certainty that the species
will be protected.
• Developing an effective and efficient resource
management and associated monitoring plan
remains a challenge.
• Finding the financial resources to implement the
various parts of the SDCP, including the MSCP, is,
as always, an issue. Some of the proposed funding
mechanisms would require passage of state
legislation. If the plan will serve as a model for other
places facing ESA issues, the area might receive
additional federal implementation funding. It is
currently unclear how the management of protected
lands will be funded.
• Implementation funding must be in place before the
Section 10 permit is obtained, as mandated by the
ESA.
• Combining concerns about the continuity of county
leadership and financing for implementation, STAT
chair Bill Shaw said, “It’s still a plan; it’s not real.
How well it’s implemented is what’s important. I’m
quite confident that if we really stick to the land use
plan over the long-term we will actually conserve
the species.” But the pressures of growth and
politics will be great.
• The lack of detailed status and habitat information
about some species makes it challenging to
develop a plan that adequately protects them.
Lessons Learned
• It is essential early in the process to involve and
educate all stakeholders on the issues covered by
the plan, including elected and agency officials.
• The more public participation, the better. If people
aren’t given their say from the beginning and
allowed to feel ownership of the process and the
outcome, they may be unhappy with the end result.
The SDCP is a long-term plan, and the county
needs widespread buy-in because community
leadership will change.
• What happens between the beginning and the end
of the permit planning process is very important.
The conservation community wanted to see interim
conservation measures enacted during the planning
process, and they did—the CLS. This allowed the
community to get used to changes gradually and
built trust in county leaders.
• Elected officials should not just blindly follow the
pattern set by other places facing ESA issues.
Keeping the focus on planning and conserving
biodiversity rather than on getting the permit brings
a different perspective to the process and lends
greater credibility to the science.
• Having a separate environmental advocacy group
in addition to the STAT allowed the scientists to
stay out of the politics. The Coalition was the
environmental watchdog of both the Board of
Supervisors and the STAT. Because the STAT
members and the Coalition members had
previously been colleagues in the conservation
community, the Coalition members trusted them.
• It is essential to assemble a science committee with
excellent credentials and respect in the
conservation community.
• Everyone involved must document why each
decision is made and be very open and honest
about data and decisions and meetings.
• People must accept that there will never be enough
data and that you have to put together a model that
reflects the best expertise available.
What began as a plan for a specific species has
become increasingly inclusive and comprehensive over
time. The inclusiveness of the planning process has
resulted in a groundswell of support for the SDCP. The
SDCP and MSCP are not about whether Pima County
continues to grow; it is about where the county will
grow. By designing a plan for the urban environment
that will work within a natural and cultural resource
protection framework, Pima County is fostering an
environmental ethic that will protect the community’s
most valuable assets and contribute to a sustainable
economy for many years to come.
The Conservation Fund © November 2005 15
Case Study Series
Green Infrastructure — Linking Lands for Nature and People
References
Behan, M. and B. Changkakoti. 2001. Pima County
Comprehensive Plan. http://www.pimaxpress.com/
planning/default.htm
Coalition for Sonoran Desert Protection. 2004.
Comments on the Multi-Species Conservation Plan.
Submitted to Mr. Chuck Huckelberry, Pima County
Administrator.
Coalition for Sonoran Desert Protection. 2003a.
Community vision for the Sonoran Desert Conservation
Plan and Multi-Species Conservation Plan.
Coalition for Sonoran Desert Protection. 2003b. The
Sonoran Desert Conservation Plan. (all articles in the
series)
Coalition for Sonoran Desert Protection. 2002.
Protecting the Sonoran Desert: An exploration of open
space and HCP funding mechanisms with
recommendations for Pima County.
Coalition for Sonoran Desert Protection. n.d. Economic
benefits of protecting natural resources in the Sonoran
Desert: Summary of findings.
Davis, T. 2001. “Desert Conservation Plan ‘credible.’”
Arizona Daily Star. Oct. 27.
ESI Corp Study Team. 2003. Pima County economic
analysis Section 10 permit. Prepared for Pima County.
Fromer, P. 2004. Advance draft Pima County Multiple
Species Conservation Plan, Pima County, Arizona.
Prepared by Recon Consulting for Pima County.
http://www.pima.gov/cmo/sdcp/mscp/mscp.pdf
Fromer, P. and L. Jones Woods. 2005. Draft II Pima
County Multiple Species Conservation Plan, Pima
County, Arizona. Prepared by Recon Consulting for
Pima County.
http://www.pima.gov/cmo/sdcp/reports/d30/MSD2.pdf
Huckelberry, C. 2002. The Sonoran Desert
Conservation Plan. Endangered Species Bulletin.
XXVII, no. 2: 12-15.
Kloor, K. 2005. Score one for the desert. Audubon,
May-June.
Lerner, J.A. 2003. The Sonoran Desert Conservation
Plan, in: Integrating Land Use Planning & Biodiversity.
J.P. Cohn and J.A. Lerner. Defenders of Wildlife,
Washington, DC. pp. 15-16.
McCarthy, T. 2005. Living with the desert. Time
Magazine, March 28.
Noss, R. and L.H. Watchman. 2001. Report of
independent peer reviewers: Sonoran Desert
Conservation Plan. Submitted to Pima County.
Pima County. 1999. Determining vulnerable species
within Pima County, Arizona. Revised draft 11/19.
Section 1.3.3 Human Population Increase in Historic
Era. http://www.pima.gov/cmo/sdcp/sdcp2/reports/
scigis/vulsp/vsp01.htm
Pima County. n.d. An overview of the Sonoran Desert
Conservation Plan. http://www.co.pima.az.us/cmo/sdcp/
intro.html
Pima County. n.d. A vision for biological corridors and
critical habitats. http://www.co.pima.az.us/cmo/sdcp/
habitat.html
Pima County Planning and Zoning. n.d. Comprehensive
plan—regional plan policies: Natural resources.
http://www.pimaxpress.com/planning/
ComprehensivePlan/Natural.htm
Society of Environmental Journalists. 2005. SEJ
Tipsheet, Jan. 19. Special Endangered Species Act
outlook review. http://www.sej.org/pub/index1.htm
Stiffler, L. 2005. Lessons learned elsewhere put to good
use in Arizona. Seattle Post-Intelligencer, May 5.
http://seattlepi.nwsource.com/specials/
licensetokill/222656_tucson05.html
U.S. Fish and Wildlife Service. n. d. Consultation and
Habitat Conservation Planning around the Nation.
U.S. Fish and Wildlife Service. March 2005. Habitat
Conservation Plans.
U.S. Fish and Wildlife Service. n. d. “No Surprises”
questions and answers.
The Conservation Fund © November 2005 16

For More Information:
Carolyn Campbell
Director, Coalition for Sonoran Desert Protection
300 East University Boulevard, #120
Tucson, Arizona 85705
ph. (520) 388-9925
http://www.sonorandesert.org
Nicole Fyffe
Pima County Administrator’s Office
130 West Congress, 10th Floor
Tucson, AZ 85701
ph. (520) 740-8800
http://www.pima.gov/sdcp/
The Conservation Fund © November 2005 17
Case Study Series
About Green Infrastructure
Green infrastructure is a strategic approach to land and
water conservation that links lands for the benefit of
nature and people, helps identify conservation priorities,
and provides a planning framework for conservation and
development. Green infrastructure is different from
conventional approaches to conservation because it
looks at conservation values and actions in concert with
land development and growth management. Green
infrastructure projects bring public and private partners
together to work collaboratively toward a common land
conservation goal. They help move beyond jurisdictional
and political boundaries by providing a process for
identifying, protecting, and restoring interconnected
green space networks that conserve natural ecosystem
functions and provide associated benefits to human
populations. The green infrastructure approach appeals
to people concerned about biodiversity, habitat, and land
conservation as well as people interested in open space
and land use planning at the community, region, or
statewide scale. It also appeals to smart growth
advocates because of its potential to lessen impacts and
reduce the costs of built infrastructure.
About the Authors/Designer
This green infrastructure case study was prepared by
Mark Benedict, Joy Drohan, and Jo Gravely.
Mark Benedict is Senior Associate for Strategic
Conservation and Training at The Conservation Fund.
Dr. Benedict is a scientist with more than 25 years of
experience in natural resource planning and
management. He is considered a national expert on
green infrastructure and greenways, and has written
numerous documents and conducted many courses and
workshops on these topics.
Joy Drohan is a freelance environmental science writer/
editor. She is owner and manager of Eco-Write, LLC.
She writes about environmental topics for federal land
management agencies, colleges and universities, and
nonprofit conservation organizations.
Jo Gravely is a freelance photographer/designer for
nonprofits, writers, corporate clients, and others.
About The Conservation Fund
The Conservation Fund is a national, nonprofit land
conservation organization that forges partnerships to
protect America’s legacy of land and water resources.
Through land acquisition, community planning, and
leadership training, the Fund and its partners
demonstrate sustainable conservation solutions
emphasizing the integration of economic and
environmental goals. Since 1985, the Fund has
protected more than 4 million acres of open space,
wildlife habitat, and historic sites across America.
The Conservation Fund’s Green Infrastructure Program
was created in 1999 to build the capacity of land
conservation professionals and their partners to
undertake strategic conservation activities that are
proactive, systematic, well integrated, and applied at
multiple scales. The program is a cooperative effort of
the Fund and multiple public and private partners.
Program products include a national course, workshops
and conference sessions, publications, case studies,
demonstration projects, a Web site, and related
educational materials.
The Conservation Fund would like to thank the Surdna
Foundation and the USDA Forest Service for providing
support for this and other Green Infrastructure Program
products.
The Conservation Fund Partners in Land and Water Conservation
Green Infrastructure Case Study Series
This series of case studies highlights successful and
innovative green infrastructure projects from around the
country. The series was undertaken so that readers can
learn from and improve upon approaches tried by others.
We hope that thorough, well-documented examples will
allow readers to see the many possibilities and to adapt
successful practices to their unique situations and
challenges. Each case study addresses the same basic
pieces of the story: overview, highlights, background and
context, process, public education and participation,
results and products, management and stewardship,
financing, application of green infrastructure principles,
and evaluation. Eight principles of green infrastructure,
which are elements of most successful efforts, form the
core of the case studies. The series illustrates concrete,
real-life examples of how to assess and protect green
infrastructure, including details about how each step was
implemented.
1800 North Kent Street, Suite 1120 ● Arlington, VA 22209 ● phone: (703) 525 6300 ● fax: (703) 525 4610 ● www.conservationfund.org
Green Infrastructure — Linking Lands for Nature and People
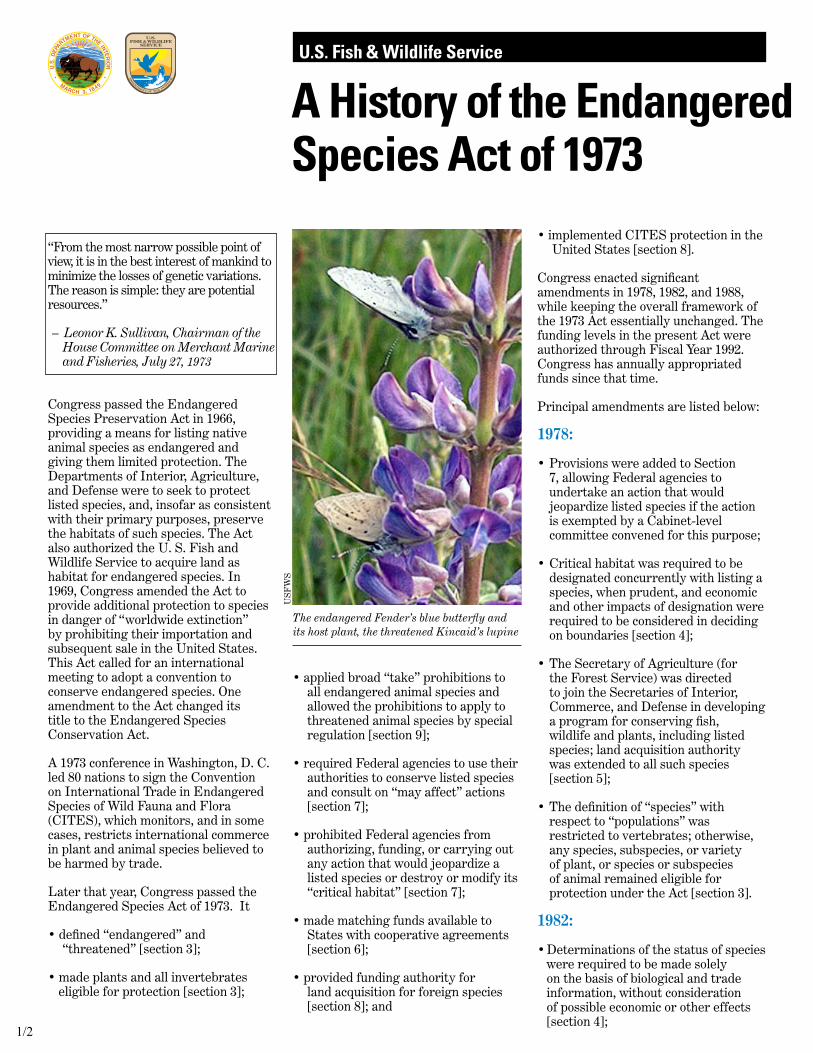
January 1998
U.S. Fish & Wildlife Service
A History of the Endangered Species Act of 1973
“From the most narrow possible point of view, it is in the best interest of mankind to minimize the losses of genetic variations. The reason is simple: they are potential resources.”
– Leonor K. Sullivan, Chairman of theHouse Committee on Merchant Marineand Fisheries, July 27, 1973
Congress passed the Endangered Species Preservation Act in 1966, providing a means for listing native animal species as endangered and giving them limited protection. The Departments of Interior, Agriculture, and Defense were to seek to protect listed species, and, insofar as consistent with their primary purposes, preserve the habitats of such species. The Act also authorized the U. S. Fish and Wildlife Service to acquire land as habitat for endangered species. In 1969, Congress amended the Act to provide additional protection to species in danger of “worldwide extinction” by prohibiting their importation and subsequent sale in the United States. This Act called for an international meeting to adopt a convention to conserve endangered species. One amendment to the Act changed its title to the Endangered Species Conservation Act.
A 1973 conference in Washington, D. C. led 80 nations to sign the Convention on International Trade in Endangered Species of Wild Fauna and Flora (CITES), which monitors, and in some cases, restricts international commerce in plant and animal species believed to be harmed by trade.
Later that year, Congress passed the Endangered Species Act of 1973. It
• defined “endangered” and“threatened” [section 3];
• made plants and all invertebrateseligible for protection [section 3];
• applied broad “take” prohibitions toall endangered animal species andallowed the prohibitions to apply tothreatened animal species by specialregulation [section 9];
• required Federal agencies to use theirauthorities to conserve listed speciesand consult on “may affect” actions[section 7];
• prohibited Federal agencies fromauthorizing, funding, or carrying outany action that would jeopardize alisted species or destroy or modify its“critical habitat” [section 7];
• made matching funds available toStates with cooperative agreements[section 6];
• provided funding authority forland acquisition for foreign species[section 8]; and
• implemented CITES protection in theUnited States [section 8].
Congress enacted significant amendments in 1978, 1982, and 1988, while keeping the overall framework of the 1973 Act essentially unchanged. The funding levels in the present Act were authorized through Fiscal Year 1992. Congress has annually appropriated funds since that time.
Principal amendments are listed below:
1978:
• Provisions were added to Section7, allowing Federal agencies toundertake an action that wouldjeopardize listed species if the actionis exempted by a Cabinet-levelcommittee convened for this purpose;
• Critical habitat was required to bedesignated concurrently with listing aspecies, when prudent, and economicand other impacts of designation wererequired to be considered in decidingon boundaries [section 4];
• The Secretary of Agriculture (forthe Forest Service) was directedto join the Secretaries of Interior,Commerce, and Defense in developinga program for conserving fish,wildlife and plants, including listedspecies; land acquisition authoritywas extended to all such species[section 5];
• The definition of “species” withrespect to “populations” wasrestricted to vertebrates; otherwise,any species, subspecies, or varietyof plant, or species or subspeciesof animal remained eligible forprotection under the Act [section 3].
1982:
• Determinations of the status of specieswere required to be made solelyon the basis of biological and tradeinformation, without considerationof possible economic or other effects[section 4];
USF
WS
The endangered Fender’s blue butterfly and its host plant, the threatened Kincaid’s lupine
1/2
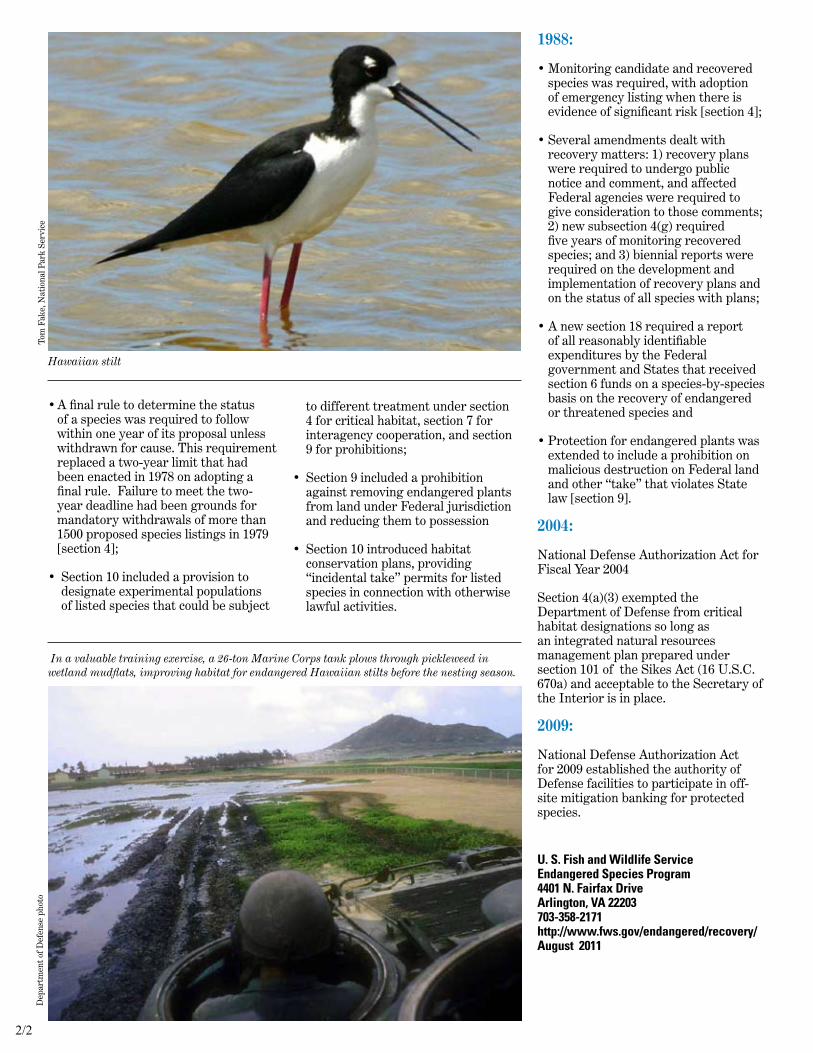
to different treatment under section 4 for critical habitat, section 7 for interagency cooperation, and section 9 for prohibitions;
• Section 9 included a prohibitionagainst removing endangered plantsfrom land under Federal jurisdictionand reducing them to possession
• Section 10 introduced habitatconservation plans, providing“incidental take” permits for listedspecies in connection with otherwiselawful activities.
• A final rule to determine the statusof a species was required to followwithin one year of its proposal unlesswithdrawn for cause. This requirementreplaced a two-year limit that hadbeen enacted in 1978 on adopting afinal rule. Failure to meet the two-year deadline had been grounds formandatory withdrawals of more than1500 proposed species listings in 1979[section 4];
• Section 10 included a provision todesignate experimental populationsof listed species that could be subject
U. S. Fish and Wildlife ServiceEndangered Species Program4401 N. Fairfax DriveArlington, VA 22203703-358-2171http://www.fws.gov/endangered/recovery/August 2011
1988:
• Monitoring candidate and recoveredspecies was required, with adoptionof emergency listing when there isevidence of significant risk [section 4];
• Several amendments dealt withrecovery matters: 1) recovery planswere required to undergo publicnotice and comment, and affectedFederal agencies were required togive consideration to those comments;2) new subsection 4(g) requiredfive years of monitoring recoveredspecies; and 3) biennial reports wererequired on the development andimplementation of recovery plans andon the status of all species with plans;
• A new section 18 required a reportof all reasonably identifiableexpenditures by the Federalgovernment and States that receivedsection 6 funds on a species-by-speciesbasis on the recovery of endangeredor threatened species and
• Protection for endangered plants wasextended to include a prohibition onmalicious destruction on Federal landand other “take” that violates Statelaw [section 9].
2004:
National Defense Authorization Act for Fiscal Year 2004
Section 4(a)(3) exempted the Department of Defense from critical habitat designations so long as an integrated natural resources management plan prepared under section 101 of the Sikes Act (16 U.S.C. 670a) and acceptable to the Secretary of the Interior is in place.
2009:
National Defense Authorization Act for 2009 established the authority of Defense facilities to participate in off-site mitigation banking for protected species.
Hawaiian stilt
Tom
Fak
e, N
atio
nal P
ark
Serv
ice
In a valuable training exercise, a 26-ton Marine Corps tank plows through pickleweed in wetland mudflats, improving habitat for endangered Hawaiian stilts before the nesting season.
Dep
artm
ent
of D
efen
se p
hoto
2/2
Sust
ain
ing
life
on
Ear
th How the Convention on Biological Diversity promotes
nature and human well-being
Secretariat of the Conventionon Biological Diversity

Secretariat of the Convention on Biological Diversity
Sustaining life on Earth
How the Convention on Biological Diversity promotes
nature and human well-being
April 2000
© Secretariat of the Convention on Biological Diversity, April 2000ISBN 92-807-1904-1
Illustrations by Jacques Goldstyn.Conception and design by CRI Communications
Published by the Secretariat of the Convention on Biological DiversityWith the support of the United Nations Environment Programme (UNEP) andthe financial support of the Governement of the United Kingdom
Reproduction of this publication for educational purpose or other non-commercial purposes is authorized without prior written permission from the copyright holder provided the source is fully acknowledged.
© Photographs UNEP and CGIAR.Digital imagery ® copyright 1999 PhotoDisc, Inc.
Table of contents
Foreword . . . . . . . . . . . . . . . . . . . . . . . . . . . . . . .i
Preface . . . . . . . . . . . . . . . . . . . . . . . . . . . . . . . .ii
Biodiversity – the web of life . . . . . . . . . . . . . . .2
We are changing life on earth . . . . . . . . . . . . . .3The value of biodiversityBiodiversity under threat
An agreement for action . . . . . . . . . . . . . . . . . .7A new philosophy
National action . . . . . . . . . . . . . . . . . . . . . . . . . .9SurveysConservation and sustainable useReporting
International action . . . . . . . . . . . . . . . . . . . . .13Thematic programmes and "cross-cutting" issuesSharing the benefits of genetic resourcesTraditional knowledgeFinancial and technical supportThe Biosafety Protocol
What are the next steps? . . . . . . . . . . . . . . . . .17Promoting the long termInformation, education and trainingWhat can I do about biodiversity?
Conclusion . . . . . . . . . . . . . . . . . . . . . . . . . . . .20
Preface
In a world of increasing globalization and environmental degradation, management of itsmost precious living resource, biological diversity, is one of the most important and criticalchallenges facing humankind today.
Biological diversity is the resource upon which families, communities, nations and futuregenerations depend. It is the link between organisms, binding each into an interdependentcommunity or ecosystem in which all living creatures have their place and role. It is thevery web of life.
Despite its importance, our heedless actions are eroding this resource at a perilous rate.The world is impoverished, even threatened, by this loss. Every gene, species andecosystem lost erodes the planet’s ability to cope with change. For the poorest in the worldthis flexibility is a matter of life and death. For all of humankind it diminishes the qualityof life.
A major cause of this erosion is that individuals, communities and nations take the resourcefor granted. There is an assumption, based on thousands of years of development, thatliving resources and biological diversity are limitless. Despite isolated instances of wherecommunities, even civilizations, have ignored this responsibility and suffered dramaticallyas a result, for most of us the idea that we might be reaching the limits of its endurance isbeyond our experience and comprehension. An important step to address our overuse ofthe biosphere lies in educating people. An education that empowers and enables people toseek collective ways to overcome current destructive trends is critical component of anysuccessful strategy for achieving a sustainable future.
The Convention represents an important part of the effort to address this issue. Yet fewpeople understand what is the term "biodiversity" actually means, let alone the goals andprocesses of the Convention. This is part due to the fact that we have not used languagethat is relevant or intelligible to the public: we have not explained ourselves clearlyenough. Given the important role that the public has in achieving the aims of theConvention this is a significant barrier to its implementation. I am confident this Guidewill make an important contribution addressing this barrier by explaining the somewhatarcane practices and terminology of this important endeavor in a simple and clear way.
On a more personal note, as people and the public have been at the centre of my efforts to build a better future I am especially pleased to have the chance to support this Guide.
Hamdallah ZedanExecutive SecretaryCBD
ii
Foreword
The natural environment provides the basic conditions without which humanity could not survive.
Life on the blue planet is contained within the biosphere, a thin and irregular envelope aroundthe Earth’s surface, just a few kilometres deep around the radius of the globe. Here, ecosystemspurify the air and the water that are the basis of life. They stabilise and moderate the Earth’sclimate. Soil fertility is renewed, nutrients are cycled and plants are pollinated.
Although scientists are now able to appreciate the complexity of this web of interactingnatural processes, we are still a very long way from understanding how they all fit together.What we do know is that if any part of the web suffers breaks down, the future of life on theplanet will be at risk.
Biological diversity – the variability of life on Earth – is the key to the ability of the biosphereto continue providing us with these ecological goods and services and thus is our species’ lifeassurance policy.
However, as a species we are degrading, and in some cases destroying, the ability of biologicaldiversity to continue performing these services. The 20th century saw a fourfold increase inhuman numbers and an eighteen-fold growth in world economic output. With these cameunsustainable patterns of consumption and the use of environmentally unsound technologies.There are now more than six billion of us and we are placing unprecedented strains on theplanet’s ability to cope. Worse, the fruits of this growth are extremely unequally divided.Whilst some enjoy better standards of living than at any time in history, nearly half the world’spopulation is unjustifiably poor, making do on less than $2 a day. Worse still, the poor sufferdisproportionately from the damage done to the environment.
In the 21st century, we will stand or fall on our ability to collectively eradicate poverty,guarantee human rights and ensure an environmentally sustainable future. Freedom from want,freedom from fear and sustaining our future are all part of the same equation.
The world community has recognised this. Over the last ten years the United Nations hasconvened a series of summit meetings and negotiations to adopt legal instruments andprogrammes for action on key issues: education, the rights of children, environment anddevelopment, human rights, population and development, social development, theadvancement of women, human settlements and food security. The legal and policyinstruments are, by and large, in place. What is needed now is to ensure that they areimplemented.
The Convention on Biological Diversity is one of these instruments. The Convention wasopened for signature at the United Nations Conference on Environment and Development inRio de Janeiro in June 1992. It came into force at the end of 1993 and has now been ratified bythe overwhelming majority of countries, for whom it is now a legally binding commitment toconserve biological diversity, to sustainably use its components and to share equitably thebenefits arising from the use of genetic resources.
This Guide provides an introduction to the Convention, the issues it addresses and the actionthat needs to be taken. Action by Governments alone will not be enough. We will reverse thetrends of environmental degradation and guarantee environmental sustainability for ourselvesand for future generations only when we all ensure that our actions and behaviour, individuallyand collectively, are sustainable.
I hope you will read this Guide with this in mind and urge you, your family and yourcommunity to take an active part in achieving the objectives of the Convention on Biological Diversity.
Klaus TöpferExecutive DirectorUNEP
[
]
i
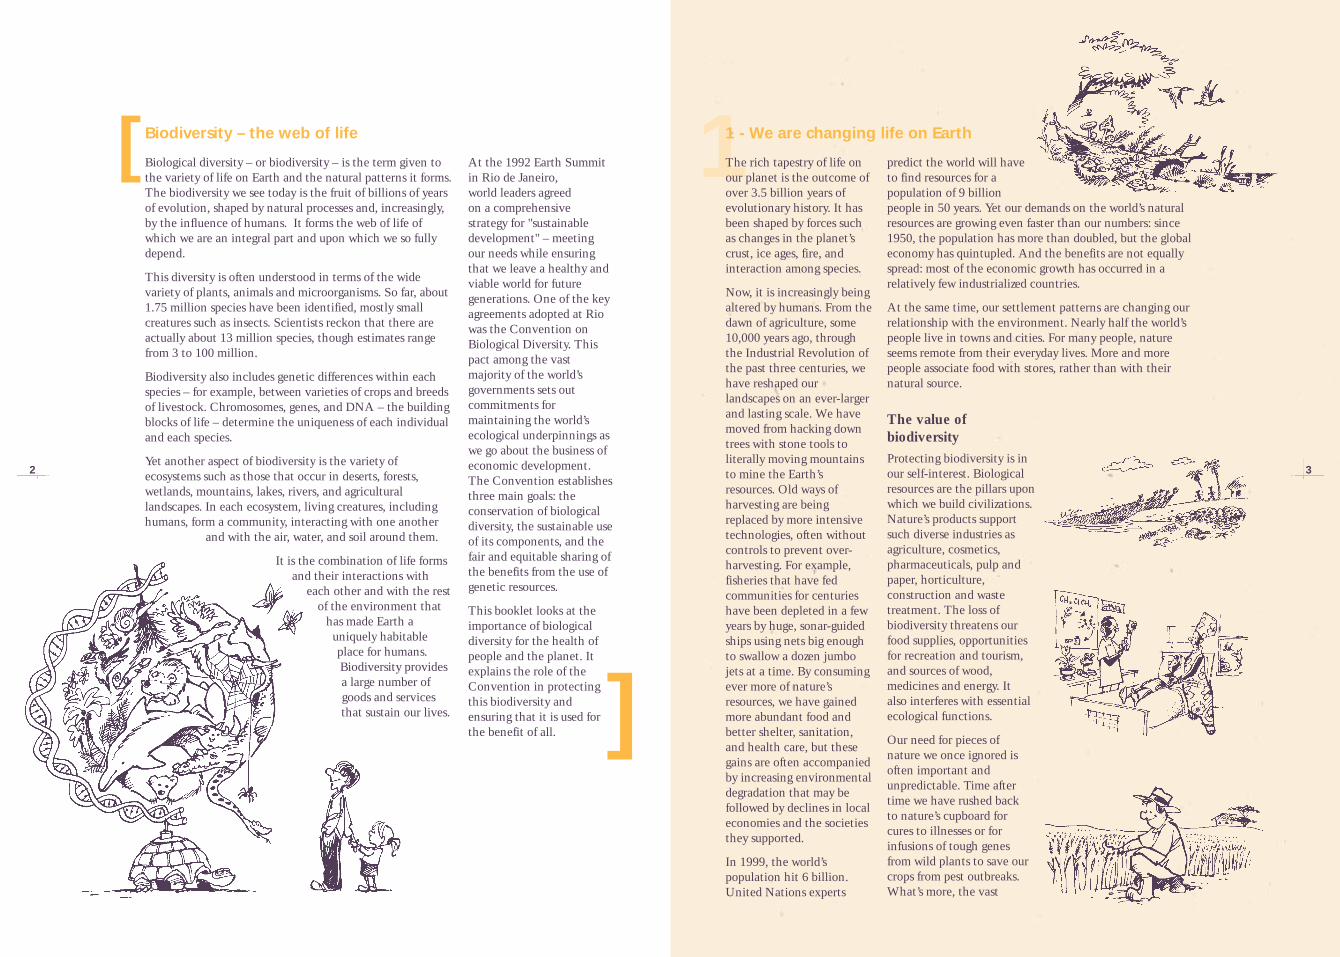
2
1[
]
1 - We are changing life on Earth
The rich tapestry of life onour planet is the outcome ofover 3.5 billion years ofevolutionary history. It hasbeen shaped by forces suchas changes in the planet’scrust, ice ages, fire, andinteraction among species.
Now, it is increasingly beingaltered by humans. From thedawn of agriculture, some10,000 years ago, throughthe Industrial Revolution ofthe past three centuries, wehave reshaped ourlandscapes on an ever-largerand lasting scale. We havemoved from hacking downtrees with stone tools toliterally moving mountainsto mine the Earth’sresources. Old ways ofharvesting are beingreplaced by more intensivetechnologies, often withoutcontrols to prevent over-harvesting. For example,fisheries that have fedcommunities for centurieshave been depleted in a fewyears by huge, sonar-guidedships using nets big enoughto swallow a dozen jumbojets at a time. By consumingever more of nature’sresources, we have gainedmore abundant food andbetter shelter, sanitation,and health care, but thesegains are often accompaniedby increasing environmentaldegradation that may befollowed by declines in localeconomies and the societiesthey supported.
In 1999, the world’spopulation hit 6 billion.United Nations experts
Biodiversity – the web of life
Biological diversity – or biodiversity – is the term given tothe variety of life on Earth and the natural patterns it forms.The biodiversity we see today is the fruit of billions of yearsof evolution, shaped by natural processes and, increasingly,by the influence of humans. It forms the web of life ofwhich we are an integral part and upon which we so fullydepend.
This diversity is often understood in terms of the widevariety of plants, animals and microorganisms. So far, about1.75 million species have been identified, mostly smallcreatures such as insects. Scientists reckon that there areactually about 13 million species, though estimates rangefrom 3 to 100 million.
Biodiversity also includes genetic differences within eachspecies – for example, between varieties of crops and breedsof livestock. Chromosomes, genes, and DNA – the buildingblocks of life – determine the uniqueness of each individualand each species.
Yet another aspect of biodiversity is the variety ofecosystems such as those that occur in deserts, forests,wetlands, mountains, lakes, rivers, and agriculturallandscapes. In each ecosystem, living creatures, includinghumans, form a community, interacting with one another
and with the air, water, and soil around them.
It is the combination of life formsand their interactions with
each other and with the restof the environment that
has made Earth auniquely habitableplace for humans.Biodiversity providesa large number ofgoods and servicesthat sustain our lives.
At the 1992 Earth Summitin Rio de Janeiro, world leaders agreed on a comprehensive strategy for "sustainabledevelopment" – meeting our needs while ensuringthat we leave a healthy andviable world for futuregenerations. One of the keyagreements adopted at Riowas the Convention onBiological Diversity. Thispact among the vastmajority of the world’sgovernments sets outcommitments formaintaining the world’secological underpinnings aswe go about the business ofeconomic development.The Convention establishesthree main goals: theconservation of biologicaldiversity, the sustainable useof its components, and thefair and equitable sharing ofthe benefits from the use ofgenetic resources.
This booklet looks at theimportance of biologicaldiversity for the health ofpeople and the planet. Itexplains the role of theConvention in protectingthis biodiversity andensuring that it is used forthe benefit of all.
predict the world will haveto find resources for apopulation of 9 billionpeople in 50 years. Yet our demands on the world’s naturalresources are growing even faster than our numbers: since1950, the population has more than doubled, but the globaleconomy has quintupled. And the benefits are not equallyspread: most of the economic growth has occurred in arelatively few industrialized countries.
At the same time, our settlement patterns are changing ourrelationship with the environment. Nearly half the world’speople live in towns and cities. For many people, natureseems remote from their everyday lives. More and morepeople associate food with stores, rather than with theirnatural source.
The value ofbiodiversityProtecting biodiversity is inour self-interest. Biologicalresources are the pillars uponwhich we build civilizations.Nature’s products supportsuch diverse industries asagriculture, cosmetics,pharmaceuticals, pulp andpaper, horticulture,construction and wastetreatment. The loss ofbiodiversity threatens ourfood supplies, opportunitiesfor recreation and tourism,and sources of wood,medicines and energy. It also interferes with essentialecological functions.
Our need for pieces ofnature we once ignored isoften important andunpredictable. Time aftertime we have rushed back to nature’s cupboard forcures to illnesses or forinfusions of tough genesfrom wild plants to save ourcrops from pest outbreaks.What’s more, the vast
3
4
And, about 30% of breeds ofthe main farm animalspecies are currently at highrisk of extinction.
While the loss of individualspecies catches ourattention, it is thefragmentation, degradation,and outright loss of forests,wetlands, coral reefs, andother ecosystems that posesthe gravest threat tobiological diversity. Forestsare home to much of theknown terrestrialbiodiversity, but about 45per cent of the Earth’soriginal forests are gone,cleared mostly during thepast century. Despite someregrowth, the world’s totalforests are still shrinkingrapidly, particularly in thetropics. Up to 10 per cent ofcoral reefs – among therichest ecosystems – havebeen destroyed, and onethird of the remainder facecollapse over the next 10 to20 years. Coastal mangroves,
a vital nursery habitat forcountless species, are alsovulnerable, with half already gone.
Global atmosphericchanges, such as ozonedepletion and climatechange, only add to thestress. A thinner ozone layerlets more ultraviolet-Bradiation reach the Earth’ssurface where it damagesliving tissue. Globalwarming is already changinghabitats and the distributionof species. Scientists warnthat even a one-degreeincrease in the averageglobal temperature, if itcomes rapidly, will pushmany species over the brink.Our food production systemscould also be seriouslydisrupted.
The loss of biodiversityoften reduces theproductivity of ecosystems,thereby shrinking nature’sbasket of goods and services,
"Goods and Services" provided by ecosystems include:• Provision of food, fuel and fibre• Provision of shelter and building materials• Purification of air and water• Detoxification and decomposition of wastes• Stabilization and moderation of the Earth's climate• Moderation of floods, droughts, temperature extremes and the forces of wind• Generation and renewal of soil fertility, including nutrient cycling• Pollination of plants, including many crops• Control of pests and diseases• Maintenance of genetic resources as key inputs to crop varieties and
livestock breeds, medicines, and other products• Cultural and aesthetic benefits• Ability to adapt to change
array of interactions among the various components of biodiversity makes the planethabitable for all species, including humans. Our personal health, and the health of oureconomy and human society, depends on the continuous supply of various ecologicalservices that would be extremely costly or impossible to replace. These natural services areso varied as to be almost infinite. For example, it would be impractical to replace, to anylarge extent, services such as pest control performed by various creatures feeding on oneanother, or pollination performed by insects and birds going about their everyday business.
Biodiversity under threatWhen most people think ofthe dangers besetting thenatural world, they think ofthe threat to other creatures.Declines in the numbers ofsuch charismatic animals aspandas, tigers, elephants,whales, and various speciesof birds, have drawn worldattention to the problem ofspecies at risk. Species havebeen disappearing at 50-100times the natural rate, andthis is predicted to risedramatically. Based oncurrent trends, an estimated34,000 plant and 5,200animal species – includingone in eight of the world’sbird species – faceextinction.
For thousands of years wehave been developing a vastarray of domesticated plantsand animals important forfood. But this treasurehouse is shrinking asmodern commercialagriculture focuses onrelatively few crop varieties.
[
5
6
from which we constantly draw. It destabilizes ecosystems,and weakens their ability to deal with natural disasters suchas floods, droughts, and hurricanes, and with human-causedstresses, such as pollution and climate change. Already, weare spending huge sums in response to flood and stormdamage exacerbated by deforestation; such damage isexpected to increase due to global warming.
The reduction in biodiversity also hurts us in other ways.Our cultural identity is deeply rooted in our biologicalenvironment. Plants and animals are symbols of our world,preserved in flags, sculptures, and other images that defineus and our societies. We draw inspiration just from looking at nature’s beauty and power.
While loss of species has always occurred as a naturalphenomenon, the pace of extinction has accelerateddramatically as a result of human activity. Ecosystems arebeing fragmented or eliminated, and innumerable speciesare in decline or already extinct. We are creating thegreatest extinction crisis since the natural disaster thatwiped out the dinosaurs 65 million years ago. Theseextinctions are irreversible and, given our dependence onfood crops, medicines and other biological resources, pose athreat to our own well-being. It is reckless if not downrightdangerous to keep chipping away at our life support system.It is unethical to drive other forms of life to extinction, andthereby deprive present and future generations of optionsfor their survival and development.
Can we save the world’s ecosystems, and with them thespecies we value and the other millions of species, some ofwhich may produce the foods and medicines of tomorrow?The answer will lie in our ability to bring our demands intoline with nature’s ability to produce what we need and tosafely absorb what we throw away. ]
2While concern for the environment is constant in history,heightened concern about environmental destruction andloss of species and ecosystems in the seventies led toconcerted action.
In 1972, the United Nations Conference on the HumanEnvironment (Stockholm) resolved to establish the UnitedNations Environment Programme (UNEP). Governmentssigned a number of regional and international agreements totackle specific issues, such as protecting wetlands andregulating the international trade in endangered species.These agreements, along with controls on toxic chemicalsand pollution, have helped to slow the tide of destructionbut have not reversed it. For example, an international ban and restrictions on the taking and selling of certainanimals and plants have helped to reduce over-harvestingand poaching.
In addition, many endangered species survive in zoos andbotanical gardens, and key ecosystems are preserved throughthe adoption of protective measures. However, these arestopgap actions. The long-term viability of species andecosystems depends on their being free to evolve in naturalconditions. This means that humans have to learn how touse biological resources in a way that minimizes theirdepletion. The challenge is to find economic policies thatmotivate conservation and sustainable use by creating
financial incentives for those who wouldotherwise over-use ordamage the resource.
In 1987, the WorldCommission onEnvironment andDevelopment (theBrundtland Commission)concluded that economicdevelopment must becomeless ecologically destructive.In its landmark report, OurCommon Future, it saidthat: "Humanity has theability to make developmentsustainable – to ensure thatit meets needs of the presentwithout compromising theability of future generationsto meet their own needs". Italso called for "a new era ofenvironmentally soundeconomic development".
2 – An agreement for action
7
8
33 - National action
The Convention onBiological Diversity, as aninternational treaty,identifies a commonproblem, sets overall goalsand policies and generalobligations, and organizestechnical and financialcooperation. However, theresponsibility for achievingits goals rests largely withthe countries themselves.
Private companies,landowners, fishermen, andfarmers take most of theactions that affectbiodiversity. Governmentsneed to provide the criticalrole of leadership,particularly by setting rulesthat guide the use of naturalresources, and by protectingbiodiversity where theyhave direct control over theland and water.
Under the Convention,governments undertake toconserve and sustainably usebiodiversity. They arerequired to develop nationalbiodiversity strategies andaction plans, and tointegrate these into broadernational plans for
environment and development. This is particularlyimportant for such sectors as forestry, agriculture, fisheries,energy, transportation and urban planning. Other treatycommitments include:
• Identifying and monitoring the important componentsof biological diversity that need to be conserved andused sustainably.
• Establishing protected areas to conserve biologicaldiversity while promoting environmentally sounddevelopment around these areas.
• Rehabilitating and restoring degraded ecosystemsand promoting the recovery of threatened speciesin collaboration with local residents.
• Respecting, preserving and maintaining traditionalknowledge of the sustainable use of biological diversitywith the involvement of indigenous peoples andlocal communities.
• Preventing the introduction of, controlling, anderadicating alien species that could threaten ecosystems,habitats or species.
• Controlling the risks posed by organismsmodified by biotechnology.
• Promoting public participation, particularly whenit comes to assessing the environmental impacts ofdevelopment projects that threaten biological diversity.
• Educating people and raising awareness about theimportance of biological diversity and the needto conserve it.
• Reporting on how each country is meeting itsbiodiversity goals.
Some of the many issues dealt with under the Convention include:• Measures and incentives for the conservation and
sustainable use of biological diversity.• Regulated access to genetic resources.• Access to and transfer of technology,
including biotechnology.• Technical and scientific cooperation.• Impact assessment.• Education and public awareness.• Provision of financial resources.• National reporting on efforts to implement
treaty commitments.
in international law. It recognizes – for the first time – thatthe conservation of biological diversity is "a commonconcern of humankind" and is an integral part of thedevelopment process. The agreement covers all ecosystems,species, and genetic resources. It links traditionalconservation efforts to the economic goal of usingbiological resources sustainably. It sets principles for the fairand equitable sharing of the benefits arising from the use ofgenetic resources, notably those destined for commercialuse. It also covers the rapidly expanding field ofbiotechnology, addressing technology development andtransfer, benefit-sharing and biosafety. Importantly, theConvention is legally binding; countries that join it areobliged to implement its provisions.
The Convention reminds decision-makers that naturalresources are not infinite and sets out a new philosophy forthe 21st century, that of sustainable use. While pastconservation efforts were aimed at protecting particularspecies and habitats, the Convention recognizes thatecosystems, species and genes must be used for the benefitof humans. However, this should be done in a way and at arate that does not lead to the long-term decline ofbiological diversity.
The Convention also offers decision-makers guidancebased on the precautionary principle that where there is a threat of significant reduction or loss of biologicaldiversity, lack of full scientific certainty should not beused as a reason for postponing measures to avoid orminimize such a threat.
The Convention acknowledges that substantial investmentsare required to conserve biological diversity. It argues,however, that conservation will bring us significantenvironmental, economic and social benefits in return.
A new philosophyIn 1992, the largest-evermeeting of world leaderstook place at the UnitedNations Conference onEnvironment andDevelopment in Rio deJaneiro, Brazil. An historicset of agreements was signedat the "Earth Summit",including two bindingagreements, the Conventionon Climate Change, whichtargets industrial and otheremissions of greenhousegases such as carbon dioxide,and the Convention onBiological Diversity, the firstglobal agreement on theconservation and sustainableuse of biological diversity.The biodiversity treatygained rapid and widespreadacceptance. Over 150governments signed thedocument at the Rioconference, and since thenmore than 175 countrieshave ratified the agreement.
The Convention has threemain goals:
• The conservationof biodiversity,
• Sustainable use of thecomponents of biodiversity,
and
• Sharing the benefitsarising from the commercialand other utilization ofgenetic resources in a fairand equitable way.
The Convention iscomprehensive in its goals,and deals with an issue sovital to humanity’s future,that it stands as a landmark
9
10
in the rice paddies, and thecrop itself – to improve theircrop management practices.This way they haveincreased their crop yields,while at the same timealmost eliminatinginsecticide use with positivebenefits in terms ofenvironmental and humanhealth. About 2 millionfarmers have benefited fromthis approach.
• In Tanzania, problemssurrounding the sustainableuse of Lake Manyara, a largefreshwater lake, arosefollowing increased usage inrecent decades. Theformation of the LakeManyara Biosphere Reserveto combine bothconservation of the Lakeand surrounding high valueforests with sustainable useof the wetlands area andlow-input agriculture hasbrought together key usersto set management goals.The Biosphere Reserve hasfostered studies for thesustainable management ofthe wetlands, includingmonitoring the groundwater and the chemistry ofthe escarpment water source.
• Clayoquot Sound on thewestern coast of VancouverIsland, Canada,encompasses forests andmarine and coastal systems.The establishment ofadaptive management toimplement the ecosystemapproach at the local levelis currently underdevelopment with theinvolvement of indigenouscommunities, with a view to
managers who maintain orincrease the area of forestwithin their properties.
• In different parts of theworld, farmers are raisingcrops within mixedecosystems. In Mexico, theyare growing "shade coffee,"putting coffee trees in amixed tropical forest ratherthan in monocultureplantations that reducebiodiversity. These farmersthen rely entirely on naturalpredators common to anintact ecosystem rather thanon chemical pesticides.
• Tourists, attracted in largenumbers by the spectacularbeauty of marine andcoastal diversity of theSoufrière area of St. Lucia,had a negative impact onthe age-old and thrivingfishing industry. In 1992,several institutions joinedwith fishers and othergroups with an interest inconservation andsustainable management ofthe resources and, together,established the SoufrièreMarine Management Area.Within this framework,problems are dealt with on aparticipatory basis with theinvolvement of allstakeholders.
• Through weekly "farmerfield schools," rice farmersin several Asian countrieshave developed theirunderstanding of thefunctioning of the tropicalrice ecosystem – includingthe interactions betweeninsect pests of rice, theirnatural enemies, fish farmed
SurveysOne of the first steps towards a successful nationalbiodiversity strategy is to conduct surveys to find out whatbiodiversity exists, its value and importance, and what isendangered. On the basis of these survey results,governments can set measurable targets for conservationand sustainable use. National strategies and programmesneed to be developed or adapted to meet these targets.
Conservation and sustainable useThe conservation of each country’s biological diversity canbe achieved in various ways. "In-situ" conservation – theprimary means of conservation – focuses on conservinggenes, species, and ecosystems in their natural surroundings,for example by establishing protected areas, rehabilitatingdegraded ecosystems, and adopting legislation to protectthreatened species. "Ex-situ" conservation uses zoos,botanical gardens and gene banks to conserve species.
Promoting the sustainable use of biodiversity will be ofgrowing importance for maintaining biodiversity in theyears and decades to come. Under the Convention, the"ecosystem approach to the conservation and sustainableuse of biodiversity" is being used as a framework for action,in which all the goods and services provided by thebiodiversity in ecosystems are considered. The Conventionis promoting activities to ensure that everyone benefits fromsuch goods and services in an equitable way.
There are many examples ofinitiatives to integrate theobjectives of conservationand sustainable use:
• In 1994, Uganda adopteda programme under whichprotected wildlife areasshared part of their tourismrevenues with local people.This approach is now beingused in several Africancountries.
• In recognition of theenvironmental services thatforests provide to the nation,Costa Rica’s 1996 ForestryLaw includes provisions tocompensate privatelandowners and forest
11
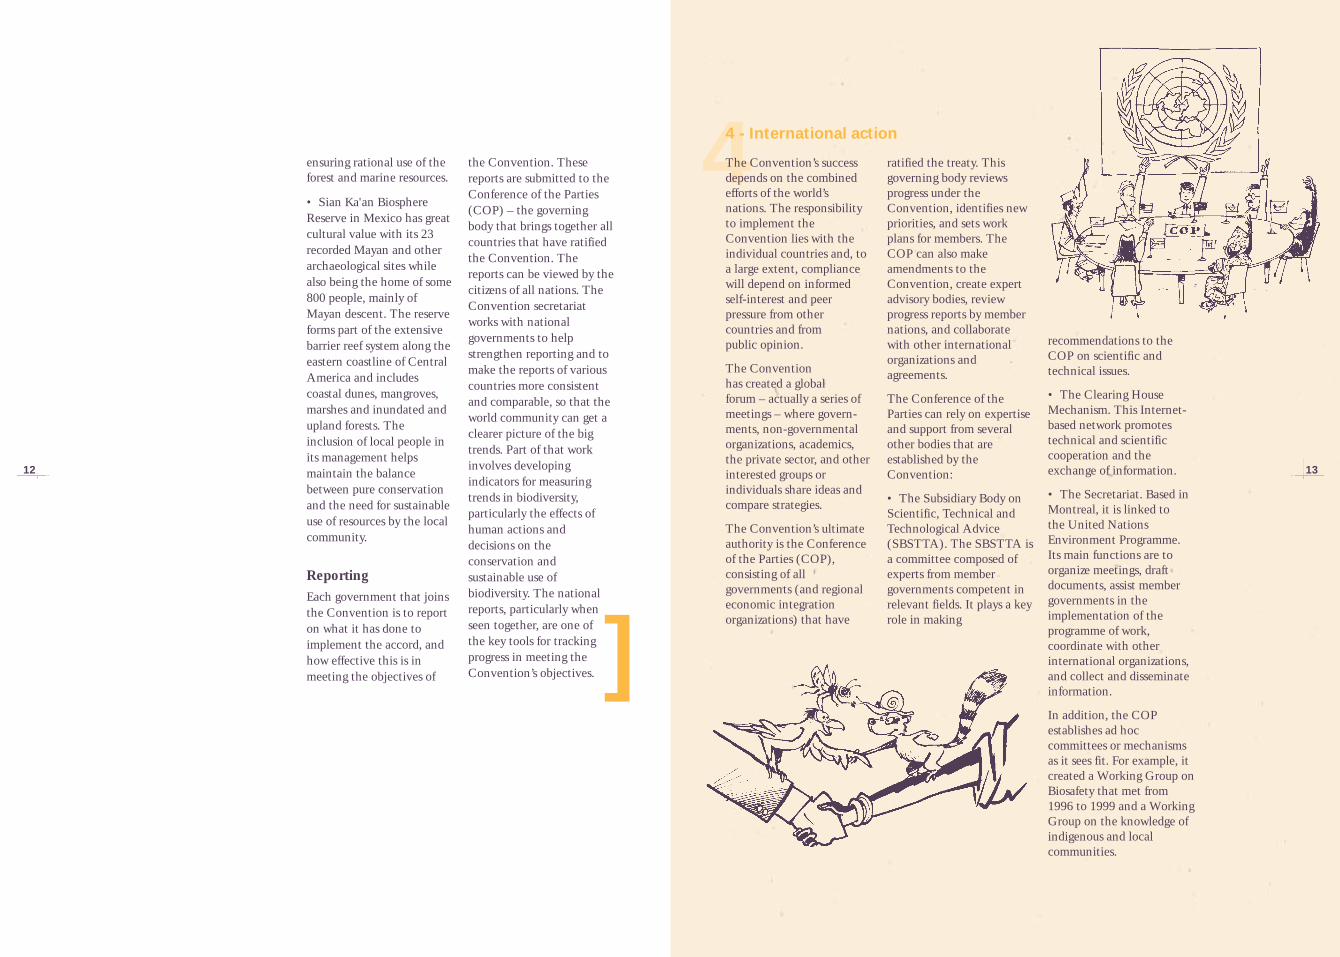
12
44 - International action
The Convention’s successdepends on the combinedefforts of the world’snations. The responsibilityto implement theConvention lies with theindividual countries and, toa large extent, compliancewill depend on informedself-interest and peerpressure from othercountries and from public opinion.
The Convention has created a global forum – actually a series ofmeetings – where govern-ments, non-governmentalorganizations, academics,the private sector, and otherinterested groups orindividuals share ideas andcompare strategies.
The Convention’s ultimateauthority is the Conferenceof the Parties (COP),consisting of allgovernments (and regionaleconomic integrationorganizations) that have
ratified the treaty. Thisgoverning body reviewsprogress under theConvention, identifies newpriorities, and sets workplans for members. TheCOP can also makeamendments to theConvention, create expertadvisory bodies, reviewprogress reports by membernations, and collaboratewith other internationalorganizations andagreements.
The Conference of theParties can rely on expertiseand support from severalother bodies that areestablished by theConvention:
• The Subsidiary Body onScientific, Technical andTechnological Advice(SBSTTA). The SBSTTA isa committee composed ofexperts from membergovernments competent inrelevant fields. It plays a keyrole in making
recommendations to theCOP on scientific andtechnical issues.
• The Clearing HouseMechanism. This Internet-based network promotestechnical and scientificcooperation and theexchange of information.
• The Secretariat. Based inMontreal, it is linked tothe United NationsEnvironment Programme.Its main functions are toorganize meetings, draftdocuments, assist membergovernments in theimplementation of theprogramme of work,coordinate with otherinternational organizations,and collect and disseminateinformation.
In addition, the COPestablishes ad hoccommittees or mechanismsas it sees fit. For example, itcreated a Working Group onBiosafety that met from1996 to 1999 and a WorkingGroup on the knowledge ofindigenous and localcommunities.
ensuring rational use of theforest and marine resources.
• Sian Ka'an BiosphereReserve in Mexico has greatcultural value with its 23recorded Mayan and otherarchaeological sites whilealso being the home of some800 people, mainly ofMayan descent. The reserveforms part of the extensivebarrier reef system along theeastern coastline of CentralAmerica and includescoastal dunes, mangroves,marshes and inundated andupland forests. Theinclusion of local people inits management helpsmaintain the balancebetween pure conservationand the need for sustainableuse of resources by the localcommunity.
ReportingEach government that joinsthe Convention is to reporton what it has done toimplement the accord, andhow effective this is inmeeting the objectives of ]
the Convention. Thesereports are submitted to theConference of the Parties(COP) – the governingbody that brings together allcountries that have ratifiedthe Convention. Thereports can be viewed by thecitizens of all nations. TheConvention secretariatworks with nationalgovernments to helpstrengthen reporting and tomake the reports of variouscountries more consistentand comparable, so that theworld community can get aclearer picture of the bigtrends. Part of that workinvolves developingindicators for measuringtrends in biodiversity,particularly the effects ofhuman actions anddecisions on theconservation andsustainable use ofbiodiversity. The nationalreports, particularly whenseen together, are one of the key tools for trackingprogress in meeting theConvention’s objectives.
13
14
Thematic programmes and "cross-cutting" issuesThe Convention’s members regularly share ideas on bestpractices and policies for the conservation and sustainableuse of biodiversity with an ecosystem approach. They lookat how to deal with biodiversity concerns duringdevelopment planning, how to promote transboundarycooperation, and how to involve indigenous peoples andlocal communities in ecosystem management. TheConference of the Parties has launched a number ofthematic programmes covering the biodiversity of inlandwaters, forests, marine and coastal areas, drylands, andagricultural lands. Cross-cutting issues are also addressed onmatters such as the control of alien invasive species,strengthening the capacity of member countries in taxonomy,and the development of indicators of biodiversity loss.
Sharing the benefits of genetic resources An important part of the biodiversity debate involves accessto and sharing of the benefits arising out of the commercialand other utilization of genetic material, such aspharmaceutical products. Most of the world’s biodiversity isfound in developing countries, which consider it a resourcefor fueling their economic and social development.Historically, plant genetic resources were collected forcommercial use outside their region of origin or as inputs inplant breeding. Foreign bioprospectors have searched fornatural substances to develop new commercial products,such drugs. Often, the products would be sold and protectedby patents or other intellectual property rights, without fairbenefits to the source countries.
The treaty recognizes national sovereignty over all geneticresources, and provides that access to valuable biologicalresources be carried out on "mutually agreed terms" andsubject to the "prior informed consent" of the country oforigin. When a microorganism, plant, or animal is used for
a commercial application, the country from whichit came has the right to benefit. Such benefits
can include cash, samples of what iscollected, the participation or training
of national researchers, the transferof biotechnology equipment andknow-how, and shares of any profitsfrom the use of the resources.
Work has begun to translate thisconcept into reality and there arealready examples of benefit-sharing
arrangements. At least a dozencountries have established
controls over access to theirgenetic resources, and anequal number of nations are developingsuch controls. Amongst the examples:
• In 1995, the Philippinesrequired bioprospectors toget "prior informed consent"from both the governmentand local peoples.
• Costa Rica’s NationalInstitute of Biodiversity(INBIO) signed a historicbioprospecting agreementwith a major drug companyto receive funds and share inbenefits from biologicalmaterials that arecommercialized.
• Countries of the AndeanPact (Colombia, Ecuador,Peru, Bolivia andVenezuela) have adoptedlaws and measures toregulate access to theirgenetic resources. The bio-prospector is required tomeet certain conditions,such as the submission ofduplicate samples of geneticresources collected to adesignated institution;including a nationalinstitution in the collectionof genetic resources; sharingexisting information;sharing research results withthe competent nationalauthority; assisting in thestrengthening ofinstitutional capacities; andsharing specific financial orrelated benefits.
Through the Convention,countries meet to developcommon policies on thesematters.
[
]
Financial and technical supportWhen the Convention wasadopted, developingcountries emphasized thattheir ability to take nationalactions to achieve globalbiodiversity benefits woulddepend on financial andtechnical assistance. Thus,bilateral and multilateralsupport for capacity buildingand for investing in projectsand programmes is essentialfor enabling developingcountries to meet theConvention’s objectives.
Convention-relatedactivities by developingcountries are eligible forsupport from the financialmechanism of the
Traditional knowledgeThe Convention alsorecognizes the close andtraditional dependence ofindigenous and localcommunities on biologicalresources and the need toensure that thesecommunities share in thebenefits arising from the useof their traditionalknowledge and practicesrelating to the conservationand sustainable use ofbiodiversity. Membergovernments haveundertaken "to respect,preserve and maintain" suchknowledge and practices, topromote their widerapplication with theapproval and involvementof the communitiesconcerned, and toencourage the equitablesharing of the benefitsderived from theirutilization.
Convention: the GlobalEnvironment Facility(GEF). GEF projects,supported by the UnitedNations EnvironmentProgramme (UNEP), theUnited NationsDevelopment Programme(UNDP) and the WorldBank, help forgeinternational cooperationand finance actions toaddress four critical threatsto the global environment:biodiversity loss, climatechange, depletion of theozone layer and degradationof international waters. Bythe end of 1999, the GEFhad contributed nearly $ 1 billion for biodiversityprojects in more than 120countries.
15
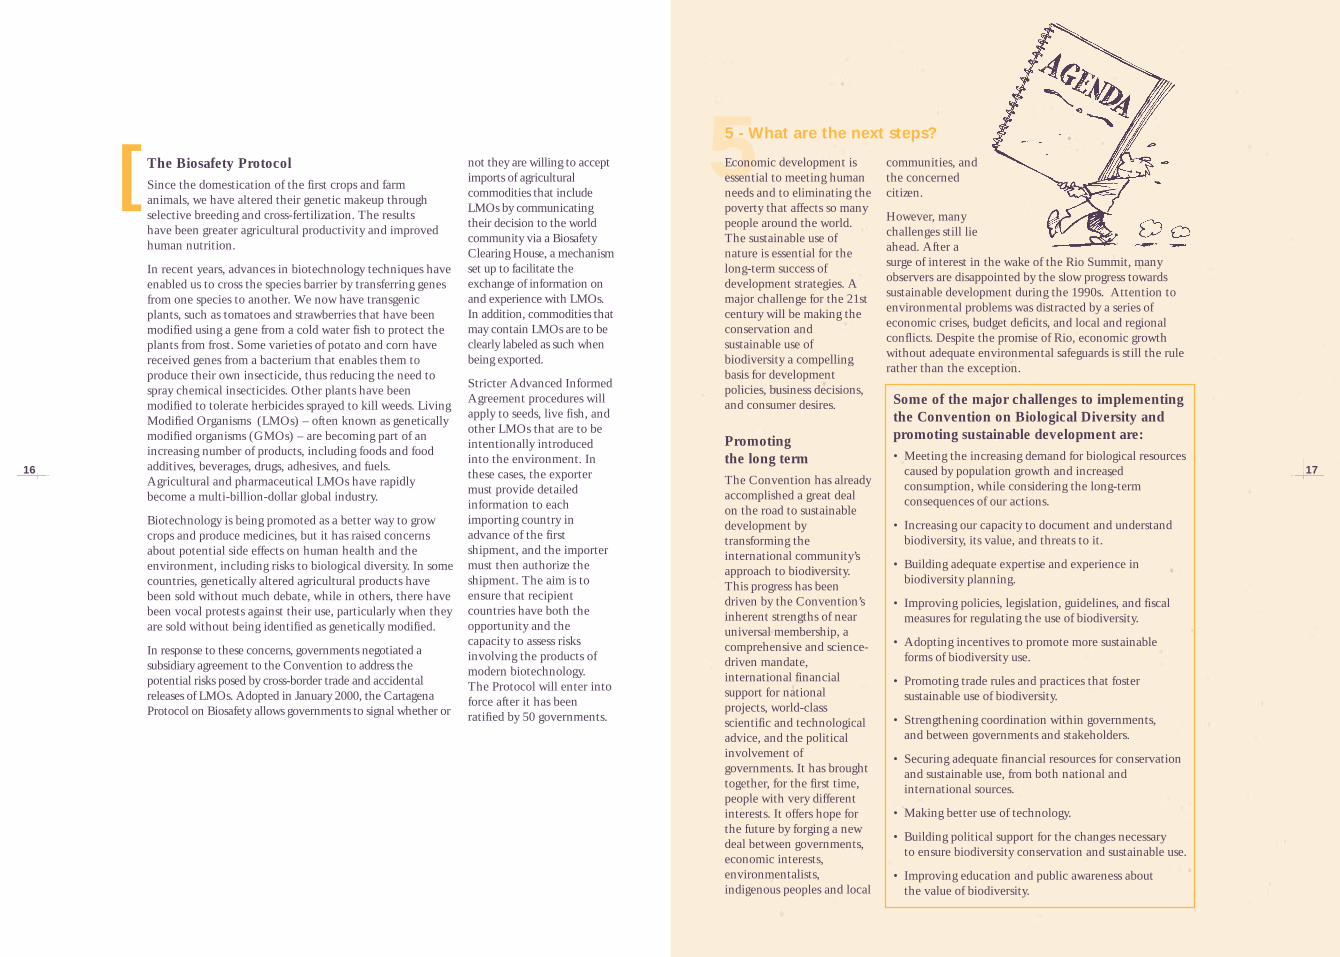
16
The Biosafety Protocol Since the domestication of the first crops and farm animals, we have altered their genetic makeup throughselective breeding and cross-fertilization. The results have been greater agricultural productivity and improvedhuman nutrition.
In recent years, advances in biotechnology techniques haveenabled us to cross the species barrier by transferring genesfrom one species to another. We now have transgenicplants, such as tomatoes and strawberries that have beenmodified using a gene from a cold water fish to protect theplants from frost. Some varieties of potato and corn havereceived genes from a bacterium that enables them toproduce their own insecticide, thus reducing the need tospray chemical insecticides. Other plants have beenmodified to tolerate herbicides sprayed to kill weeds. LivingModified Organisms (LMOs) – often known as geneticallymodified organisms (GMOs) – are becoming part of anincreasing number of products, including foods and foodadditives, beverages, drugs, adhesives, and fuels.Agricultural and pharmaceutical LMOs have rapidlybecome a multi-billion-dollar global industry.
Biotechnology is being promoted as a better way to growcrops and produce medicines, but it has raised concernsabout potential side effects on human health and theenvironment, including risks to biological diversity. In somecountries, genetically altered agricultural products havebeen sold without much debate, while in others, there havebeen vocal protests against their use, particularly when theyare sold without being identified as genetically modified.
In response to these concerns, governments negotiated asubsidiary agreement to the Convention to address thepotential risks posed by cross-border trade and accidentalreleases of LMOs. Adopted in January 2000, the CartagenaProtocol on Biosafety allows governments to signal whether or
[ not they are willing to acceptimports of agriculturalcommodities that includeLMOs by communicatingtheir decision to the worldcommunity via a BiosafetyClearing House, a mechanismset up to facilitate theexchange of information onand experience with LMOs.In addition, commodities thatmay contain LMOs are to beclearly labeled as such whenbeing exported.
Stricter Advanced InformedAgreement procedures willapply to seeds, live fish, andother LMOs that are to beintentionally introducedinto the environment. Inthese cases, the exportermust provide detailedinformation to eachimporting country inadvance of the firstshipment, and the importermust then authorize theshipment. The aim is toensure that recipientcountries have both theopportunity and thecapacity to assess risksinvolving the products ofmodern biotechnology. The Protocol will enter intoforce after it has beenratified by 50 governments.
55 - What are the next steps?
Some of the major challenges to implementingthe Convention on Biological Diversity andpromoting sustainable development are:• Meeting the increasing demand for biological resources
caused by population growth and increasedconsumption, while considering the long-termconsequences of our actions.
• Increasing our capacity to document and understandbiodiversity, its value, and threats to it.
• Building adequate expertise and experience inbiodiversity planning.
• Improving policies, legislation, guidelines, and fiscalmeasures for regulating the use of biodiversity.
• Adopting incentives to promote more sustainableforms of biodiversity use.
• Promoting trade rules and practices that fostersustainable use of biodiversity.
• Strengthening coordination within governments,and between governments and stakeholders.
• Securing adequate financial resources for conservationand sustainable use, from both national andinternational sources.
• Making better use of technology.
• Building political support for the changes necessaryto ensure biodiversity conservation and sustainable use.
• Improving education and public awareness aboutthe value of biodiversity.
Economic development isessential to meeting humanneeds and to eliminating thepoverty that affects so manypeople around the world.The sustainable use ofnature is essential for thelong-term success ofdevelopment strategies. Amajor challenge for the 21stcentury will be making theconservation andsustainable use ofbiodiversity a compellingbasis for developmentpolicies, business decisions,and consumer desires.
Promoting the long termThe Convention has alreadyaccomplished a great dealon the road to sustainabledevelopment bytransforming theinternational community’sapproach to biodiversity.This progress has beendriven by the Convention’sinherent strengths of nearuniversal membership, acomprehensive and science-driven mandate,international financialsupport for nationalprojects, world-classscientific and technologicaladvice, and the politicalinvolvement ofgovernments. It has broughttogether, for the first time,people with very differentinterests. It offers hope forthe future by forging a newdeal between governments,economic interests,environmentalists,indigenous peoples and local
communities, andthe concernedcitizen.
However, manychallenges still lieahead. After asurge of interest in the wake of the Rio Summit, manyobservers are disappointed by the slow progress towardssustainable development during the 1990s. Attention toenvironmental problems was distracted by a series ofeconomic crises, budget deficits, and local and regionalconflicts. Despite the promise of Rio, economic growthwithout adequate environmental safeguards is still the rulerather than the exception.
17
18
The Convention on Biological Diversity and its underlyingconcepts can be difficult to communicate to politicians andto the general public. Nearly a decade after the Conventionfirst acknowledged the lack of information and knowledgeregarding biological diversity, it remains an issue that fewpeople understand. There is little public discussion of howto make sustainable use of biodiversity part of economicdevelopment.
The greatest crunch in sustainable development decisions isthe short – versus the long-term time frame. Sadly, it oftenstill pays to exploit the environment now by harvesting asmuch as possible as fast as possible because economic rulesdo little to protect long-term interests.
Truly sustainable development requires countries to redefinetheir policies on land use, food, water, energy, employment,development, conservation, economics, and trade.Biodiversity protection and sustainable use requires theparticipation of ministries responsible for such areas asagriculture, forestry, fisheries, energy, tourism, trade andfinance.
The challenge facing governments, businesses, and citizensis to forge transition strategies leading to long-termsustainable development. It means negotiating trade-offseven as people are clamoring for more land and businessesare pressing for concessions to expand their harvests. Thelonger we wait, the fewer options we will have.
Information, education, and trainingThe transition to sustainable development requires a shift inpublic attitudes as to what is an acceptable use of nature.This can only happen if people have the right information,skills, and organizations for understanding and dealing withbiodiversity issues. Governments and the businesscommunity need to invest in staff and training, and theyneed to support organizations, including scientific bodies,that can deal with and advise on biodiversity issues.
We also need a long-term process of public education tobring about changes in behaviour and lifestyles, and toprepare societies for the changes needed for sustainability.Better biodiversity education would meet one of the goalsset out in the Convention.
What can I do aboutbiodiversity? While governments shouldplay a leadership role, othersectors of society need to beactively involved. After all,it is the choices and actionsof billions of individualsthat will determine whetheror not biodiversity isconserved and usedsustainably.
In an era when economics isa dominant force in worldaffairs, it is more importantthan ever to have businesswillingly involved inenvironmental protectionand the sustainable use ofnature. Some companieshave revenues far greaterthan those of entirecountries, and theirinfluence is immense.Fortunately, a growingnumber of companies havedecided to apply theprinciples of sustainabledevelopment to theiroperations. For example, a number of forestrycompanies – often under intense pressure from environmentalboycotts – have movedfrom clear-cutting to lessdestructive forms of timberharvesting. More and morecompanies have also foundways to make a profit whilereducing theirenvironmental impacts.They view sustainabledevelopment as ensuring
long-term profitability andincreased goodwill fromtheir business partners,employees, and consumers.
Local communities play akey role since they are thetrue "managers" of theecosystems in which theylive and, thus, have a majorimpact on them. Manyprojects have beensuccessfully developed inrecent years involving theparticipation of localcommunities in thesustainable management ofbiodiversity, often with thevaluable assistance of NGOsand intergovernmentalorganizations.
Finally, the ultimatedecision-maker forbiodiversity is the individualcitizen. The small choicesthat individuals make addup to a large impact becauseit is personal consumptionthat drives development,which in turn uses andpollutes nature. By carefullychoosing the products theybuy and the governmentpolicies that they support,the general public can beginto steer the world towardssustainable development.Governments, companies,and others have aresponsibility to lead andinform the public, butfinally it is individualchoices, made billions oftimes a day, that count the most. ]
19
20
Conclusion
Although still in its infancy, the Convention on BiologicalDiversity is already making itself felt. The philosophy ofsustainable development, the ecosystem approach, and theemphasis on building partnerships are all helping to shapeglobal action on biodiversity. The data and reports thatgovernments are gathering and sharing with each other areproviding a sound basis for understanding the challengesand collaborating on the solutions.
Much, much more needs to be done. The passage of theEarth’s biodiversity through the coming century will be itsmost severe test. With human population expected to risedramatically, particularly in developing countries, and theconsumer revolution set for exponential expansion – not tomention the worsening stresses of climate change, ozonedepletion, and hazardous chemicals – species andecosystems will face ever more serious threats. Unless wetake action now, children born today will live in animpoverished world.
The Convention offers a comprehensive, global strategy forpreventing such a tragedy. A richer future is possible. Ifgovernments and all sectors of society apply the conceptsembodied in the Convention and make the conservationand sustainable use of biological diversity a real priority, we can ensure a new and sustainable relationship between humanity and the natural world for the generations to come.
[
]For more information about the Convention, please contact:
Secretariat of the Convention on Biological Diversity World Trade Centre
393 St Jacques ouest, Suite 300 Montreal, Quebec Canada H2Y 1N9Phone: + 1 (514) 288 2220Fax: + 1 (514) 288 6588
E-mail: [email protected] site: www.biodiv.org
United Nations Environment ProgrammeDivision of Environmental Conventions/IUCInternational Environment House
15, chemin des Anémones1219 Châtelaine, SwitzerlandPhone : +41-22-917-8242/8196Fax : +41-22-717-9283
Email : [email protected] site : www.unep.ch/conventions
To obtain information on national reports submitted by governments under the Convention, contactyour national government’s focal point, usually with the ministry responsible for environment or naturalresources. National reports are also available electronically on the Convention’s web site atwww.biodiv.org.
Our Local Habitat: The Sonoran Desert
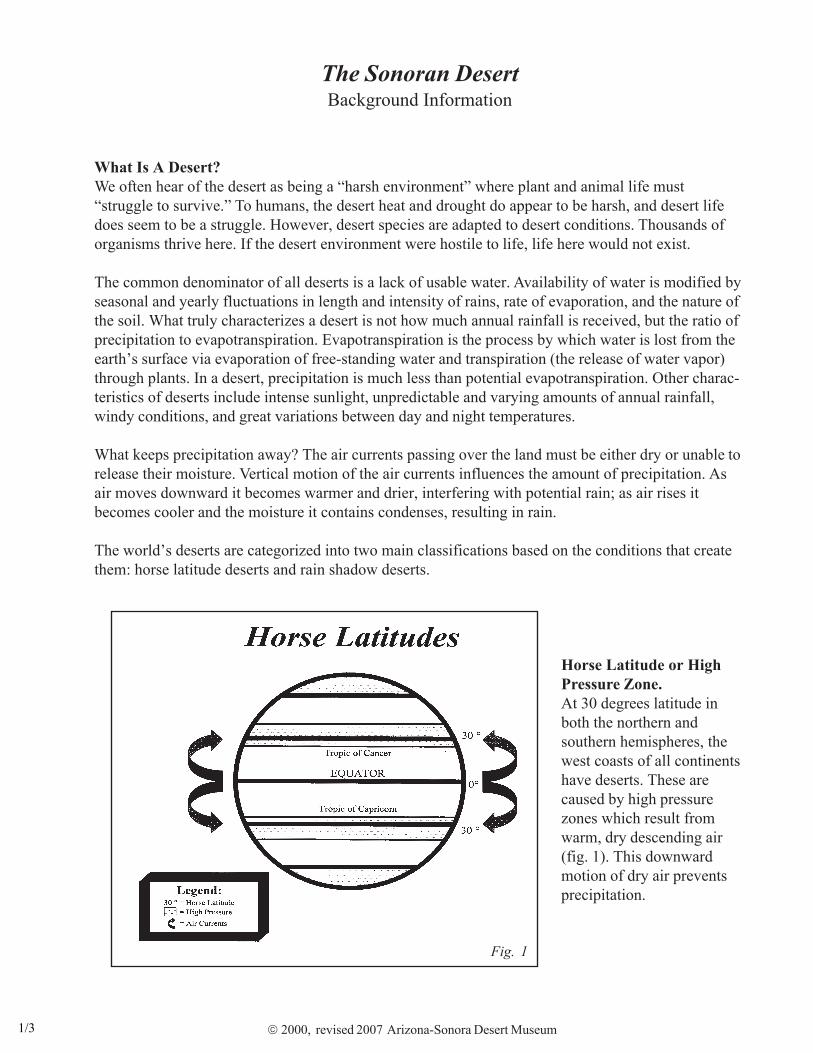
2000, revised 2007 Arizona-Sonora Desert Museum
The Sonoran DesertBackground Information
What Is A Desert?
We often hear of the desert as being a “harsh environment” where plant and animal life must
“struggle to survive.” To humans, the desert heat and drought do appear to be harsh, and desert life
does seem to be a struggle. However, desert species are adapted to desert conditions. Thousands of
organisms thrive here. If the desert environment were hostile to life, life here would not exist.
The common denominator of all deserts is a lack of usable water. Availability of water is modified by
seasonal and yearly fluctuations in length and intensity of rains, rate of evaporation, and the nature of
the soil. What truly characterizes a desert is not how much annual rainfall is received, but the ratio of
precipitation to evapotranspiration. Evapotranspiration is the process by which water is lost from the
earth’s surface via evaporation of free-standing water and transpiration (the release of water vapor)
through plants. In a desert, precipitation is much less than potential evapotranspiration. Other charac-
teristics of deserts include intense sunlight, unpredictable and varying amounts of annual rainfall,
windy conditions, and great variations between day and night temperatures.
What keeps precipitation away? The air currents passing over the land must be either dry or unable to
release their moisture. Vertical motion of the air currents influences the amount of precipitation. As
air moves downward it becomes warmer and drier, interfering with potential rain; as air rises it
becomes cooler and the moisture it contains condenses, resulting in rain.
The world’s deserts are categorized into two main classifications based on the conditions that create
them: horse latitude deserts and rain shadow deserts.
Horse Latitude or High
Pressure Zone.
At 30 degrees latitude in
both the northern and
southern hemispheres, the
west coasts of all continents
have deserts. These are
caused by high pressure
zones which result from
warm, dry descending air
(fig. 1). This downward
motion of dry air prevents
precipitation.
Fig. 1
1/3
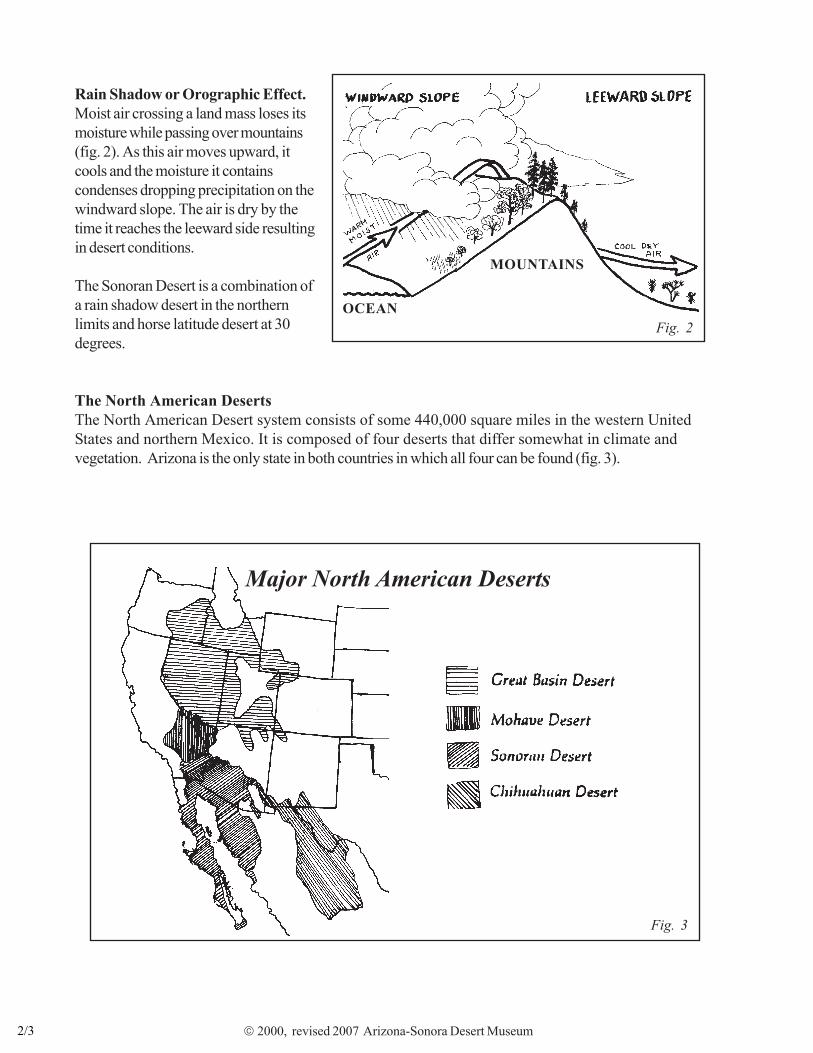
2000, revised 2007 Arizona-Sonora Desert Museum
Rain Shadow or Orographic Effect.
Moist air crossing a land mass loses its
moisture while passing over mountains
(fig. 2). As this air moves upward, it
cools and the moisture it contains
condenses dropping precipitation on the
windward slope. The air is dry by the
time it reaches the leeward side resulting
in desert conditions.
The Sonoran Desert is a combination of
a rain shadow desert in the northern
limits and horse latitude desert at 30
degrees.
The North American Deserts
The North American Desert system consists of some 440,000 square miles in the western United
States and northern Mexico. It is composed of four deserts that differ somewhat in climate and
vegetation. Arizona is the only state in both countries in which all four can be found (fig. 3).
Fig. 2
OCEAN
MOUNTAINS
Fig. 3
Major North American Deserts
2/3
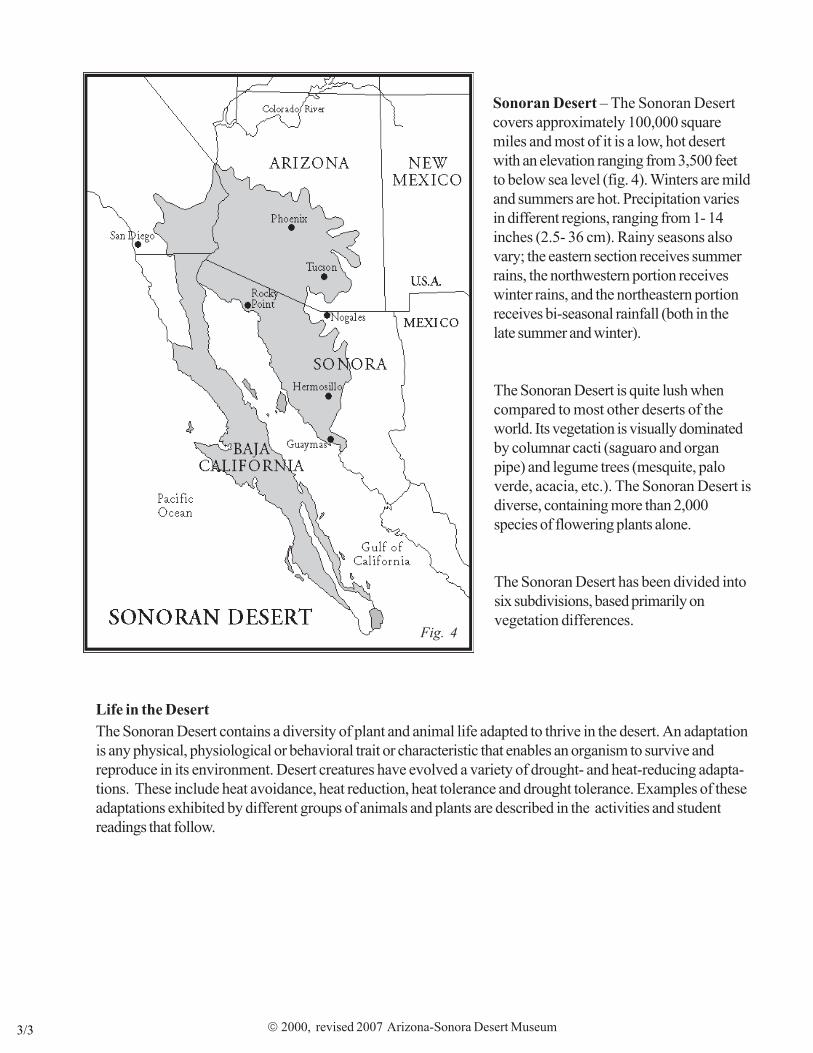
2000, revised 2007 Arizona-Sonora Desert Museum
Sonoran Desert – The Sonoran Desert
covers approximately 100,000 square
miles and most of it is a low, hot desert
with an elevation ranging from 3,500 feet
to below sea level (fig. 4). Winters are mild
and summers are hot. Precipitation varies
in different regions, ranging from 1- 14
inches (2.5- 36 cm). Rainy seasons also
vary; the eastern section receives summer
rains, the northwestern portion receives
winter rains, and the northeastern portion
receives bi-seasonal rainfall (both in the
late summer and winter).
The Sonoran Desert is quite lush when
compared to most other deserts of the
world. Its vegetation is visually dominated
by columnar cacti (saguaro and organ
pipe) and legume trees (mesquite, palo
verde, acacia, etc.). The Sonoran Desert is
diverse, containing more than 2,000
species of flowering plants alone.
The Sonoran Desert has been divided into
six subdivisions, based primarily on
vegetation differences.
Life in the DesertThe Sonoran Desert contains a diversity of plant and animal life adapted to thrive in the desert. An adaptation is any physical, physiological or behavioral trait or characteristic that enables an organism to survive and reproduce in its environment. Desert creatures have evolved a variety of drought- and heat-reducing adapta-tions. These include heat avoidance, heat reduction, heat tolerance and drought tolerance. Examples of these adaptations exhibited by different groups of animals and plants are described in the activities and student readings that follow.
Fig. 4
3/3
Plant Ecology of the Sonoran Desert Region
Mark A. DimmittAn excerpt from A Natural History of the Sonoran Desert
You could easily recognize a desert even if you were blind- folded. You would discover that you could walk fairly long distances without bumping into plants, and when you did the encounter would likely be painful. Even standing still you would have unmistakable clues about your location. You'd feel the arid atmosphere pulling moisture out of your body and experience a sensation of pressure on your skin from the intense sunlight. On really hot, dry days you could smell pungent, aromatic terpenes and oils exuded by the parched vegetation.
With the blindfold removed, you would see that most desert plants also look different from those in other habitats - they are often spiny, almost always tiny-leafed, and rarely "leaf green". Many have bold, sculptural growth forms characterized by swollen stems or starkly exposed stems unconcealed by foliage. At the other extreme is a unique desert growth form that landscape architect Iain Robertson calls "diaphanous plants". The stems and foliage of these plants are so fine-textured and sparse that the eye tends to look right through them.
These tactile, olfactory, and visual experiences offer clues to desert plants' adaptations to their rigorous environment. Before exploring these special characteristics, it is important that you understand something about plant structures, functions, and classification.
Basic Plant Anatomy and Classification
Many people mistakenly identify ocotillos, agaves, African euphorbias, and numerous other plants as cacti because of their succulent or spiny stems, when in fact these plants are not related to each other or to cacti. Frequently plants (and animals) are similar to each other in outward appearance because their ancestors have adapted to the same environmental challenges by evolving similar forms or structures. This similarity in response to environment, despite lack of common recent ancestors, is known as convergent evolution. The very similar outward appearance of some New World cacti and Old World succulent euphorbias is an excellent example.
Unlike overall form or vegetative structures, the sexual parts of plants (flowers and fruits) are reliable indicators of interrelationships and means of identification. Flowers must function successfully if a plant is to reproduce. Therefore the floral structures tend to remain more consistent within a species than do vegetative parts. Floral structures also form complex patterns that are more readily traceable as plants evolve. The parts of flowers and fruits are also easier to identify and describe than the vegetative organs (leaves, stems, and roots). Moreover, qualitative vegetative characters are hard to describe precisely even when the overall appearance (gestalt) is distinctive. For example, nearly every hiker knows poison ivy on sight. But try to describe the foliage so precisely that someone who has never seen the plant can distinguish it from skunkbush (Rhus trilobata). It's quite difficult to delineate the leaves' different shades of green, degrees of hairiness, and the scalloping of the margins, especially if you lack the minutely-detailed vocabulary of the botanist. For example, the terms pubescent, puberulent, lanate, villous, hirsute, hirsutulous, ciliate, tomentose, strigose, pilose, and hispid are just some of those used to describe different kinds and degrees of hairiness. Vegetative parts are also more plastic; that is, they vary greatly - even in the
© 2016 Arizona-Sonora Desert Museum 1/17
same individual - under environmental influences. The leaves of brittlebush grow much larger and greener in shade or during rainy periods than in sun or in drier conditions. (See photo on page 131; see also species account.)
The complex parts of flowers and fruits are arranged in distinctive patterns that can be characterized exactly. Petals, stamens, and other structures can be counted and their lengths and widths measured (and these are usually less variable than the dimensions of leaves). The point of attachment of the stamens to the petals (or other parts) can be described unambiguously. For example, a flower that has many (more than ten) petals and sepals that intergrade into one another, many stamens (usually hundreds), a two- to multi-lobed stigma, and an ovary enveloped in stem tissue may be unequivocally identified as belonging to a member of the cactus family. All 2000 species of cacti possess some variation of this basic pattern, and no other plant group does.
To recognize floral patterns you must be able to identify the parts of a flower. The drawing on page 131 shows the anatomy of a generalized flower.
Flower Anatomy, from Outside to Inside
In the game "Twenty Questions" players attempt to identify an unknown by asking the person who knows the answer a series of yes-or-no questions. If done well, twenty questions is sufficient to eliminate every other possibility in the world and leave the correct answer standing. Assume, for example, that the unknown thing is a dog. First question: "Is it a concept?" (No; therefore it's an object.) Second question: "Is it alive?" (Yes.) Third question: "Is it a plant?" (No). Fourth question: "Is it a vertebrate?" (Yes). Fifth question: "Is it an herbivore?" (No.) The enormous inventory of the universe has been narrowed to a very short list in only five questions.
Botanists identify plants (and zoologists, animals) unknown to them with a Twenty Questions-like procedure called a dichotomous key (or simply, key). A key is a nested series of dual choices that quickly narrows the possibilities to a single species. For example, the first pair of choices might ask you whether the flower has three petals versus four or five. Each of the two possible answers leads to another pair of choices, and so on, until you have identified your quarry out of 300,000 species of flowering plants. But before you can use such a key effectively, or before you can describe your unknown to someone who will identify it for you, you must know the parts of the flower and plant you are examining.
The sepals collectively make up the calyx. They enclose all other flower parts in the bud, usually completely concealing the rest of the flower until it opens. The petals collectively make up the corolla. Petals are frequently the visual advertising banner that attracts pollinators. Petals and sepals look similar in many flowers, such as in lilies and agaves. By definition the sepals are the parts on the outside; petals are typically concealed in the bud stage. When sepals and petalscan't be readily distinguished, they are called tepals.
The corolla and calyx make up the perianth. The perianth parts may be separate or fused together for part or all of their length. Often there is only one series of perianth parts. Of necessity these must be on the outside and therefore they are sepals, even if they are large and colorful.
© 2016 Arizona-Sonora Desert Museum 2/17
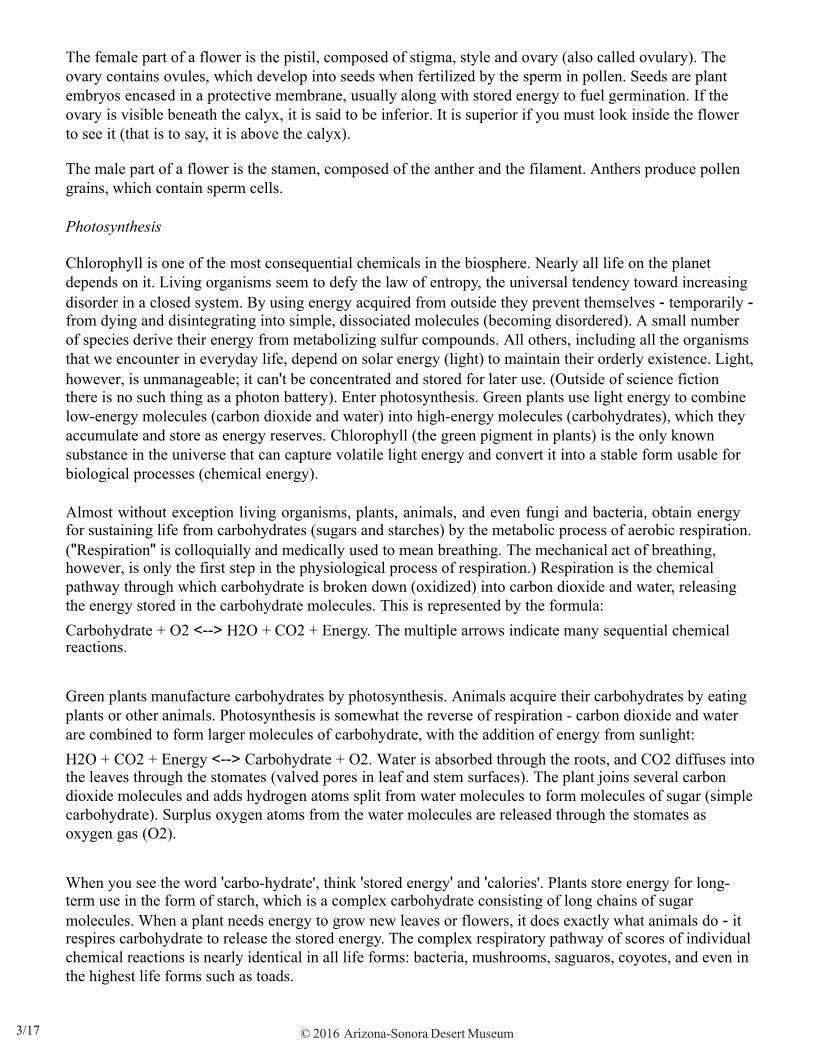
The female part of a flower is the pistil, composed of stigma, style and ovary (also called ovulary). The ovary contains ovules, which develop into seeds when fertilized by the sperm in pollen. Seeds are plant embryos encased in a protective membrane, usually along with stored energy to fuel germination. If the ovary is visible beneath the calyx, it is said to be inferior. It is superior if you must look inside the flower to see it (that is to say, it is above the calyx).
The male part of a flower is the stamen, composed of the anther and the filament. Anthers produce pollen grains, which contain sperm cells.
Photosynthesis
Chlorophyll is one of the most consequential chemicals in the biosphere. Nearly all life on the planet depends on it. Living organisms seem to defy the law of entropy, the universal tendency toward increasing disorder in a closed system. By using energy acquired from outside they prevent themselves - temporarily - from dying and disintegrating into simple, dissociated molecules (becoming disordered). A small number of species derive their energy from metabolizing sulfur compounds. All others, including all the organisms that we encounter in everyday life, depend on solar energy (light) to maintain their orderly existence. Light, however, is unmanageable; it can't be concentrated and stored for later use. (Outside of science fiction there is no such thing as a photon battery). Enter photosynthesis. Green plants use light energy to combine low-energy molecules (carbon dioxide and water) into high-energy molecules (carbohydrates), which they accumulate and store as energy reserves. Chlorophyll (the green pigment in plants) is the only known substance in the universe that can capture volatile light energy and convert it into a stable form usable for biological processes (chemical energy).
Almost without exception living organisms, plants, animals, and even fungi and bacteria, obtain energy for sustaining life from carbohydrates (sugars and starches) by the metabolic process of aerobic respiration. ("Respiration" is colloquially and medically used to mean breathing. The mechanical act of breathing, however, is only the first step in the physiological process of respiration.) Respiration is the chemical pathway through which carbohydrate is broken down (oxidized) into carbon dioxide and water, releasing the energy stored in the carbohydrate molecules. This is represented by the formula: Carbohydrate + O2 <--> H2O + CO2 + Energy. The multiple arrows indicate many sequential chemical reactions.
Green plants manufacture carbohydrates by photosynthesis. Animals acquire their carbohydrates by eating plants or other animals. Photosynthesis is somewhat the reverse of respiration - carbon dioxide and water are combined to form larger molecules of carbohydrate, with the addition of energy from sunlight: H2O + CO2 + Energy <--> Carbohydrate + O2. Water is absorbed through the roots, and CO2 diffuses into the leaves through the stomates (valved pores in leaf and stem surfaces). The plant joins several carbon dioxide molecules and adds hydrogen atoms split from water molecules to form molecules of sugar (simple carbohydrate). Surplus oxygen atoms from the water molecules are released through the stomates as oxygen gas (O2).
When you see the word 'carbo-hydrate', think 'stored energy' and 'calories'. Plants store energy for long-term use in the form of starch, which is a complex carbohydrate consisting of long chains of sugar molecules. When a plant needs energy to grow new leaves or flowers, it does exactly what animals do - it respires carbohydrate to release the stored energy. The complex respiratory pathway of scores of individual chemical reactions is nearly identical in all life forms: bacteria, mushrooms, saguaros, coyotes, and even in the highest life forms such as toads.
© 2016 Arizona-Sonora Desert Museum 3/17
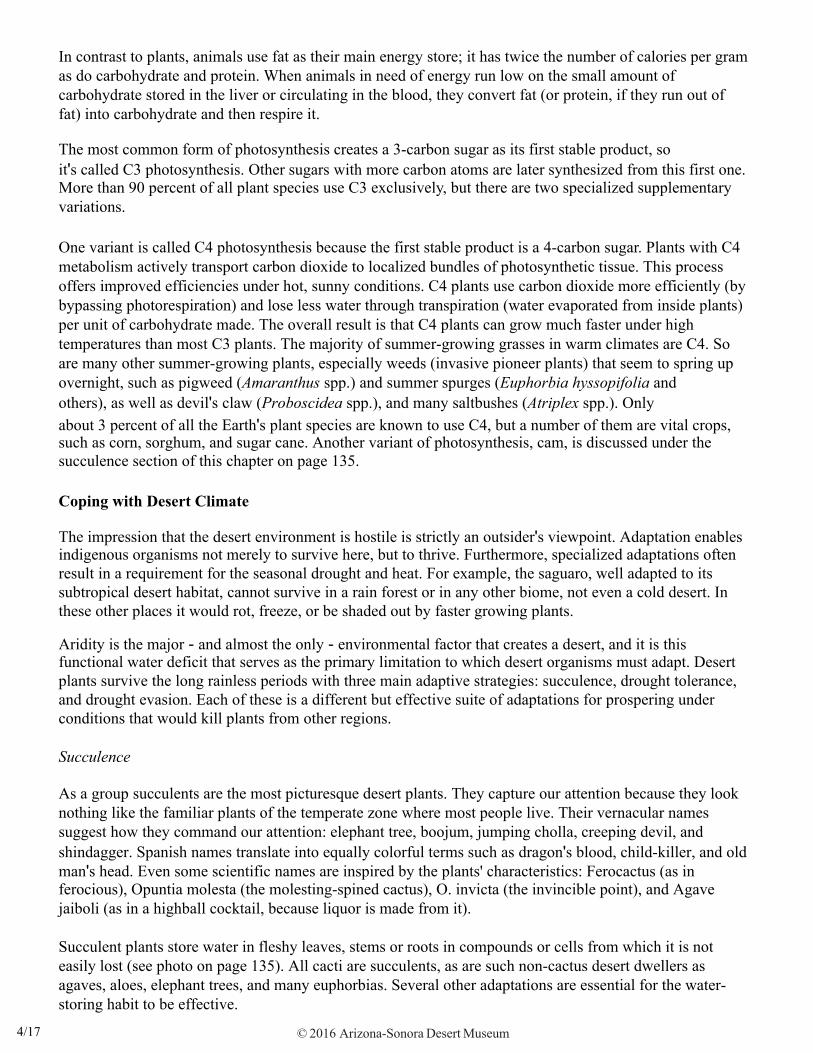
In contrast to plants, animals use fat as their main energy store; it has twice the number of calories per gram as do carbohydrate and protein. When animals in need of energy run low on the small amount of carbohydrate stored in the liver or circulating in the blood, they convert fat (or protein, if they run out of fat) into carbohydrate and then respire it.
The most common form of photosynthesis creates a 3-carbon sugar as its first stable product, soit's called C3 photosynthesis. Other sugars with more carbon atoms are later synthesized from this first one. More than 90 percent of all plant species use C3 exclusively, but there are two specialized supplementary variations.
One variant is called C4 photosynthesis because the first stable product is a 4-carbon sugar. Plants with C4 metabolism actively transport carbon dioxide to localized bundles of photosynthetic tissue. This process offers improved efficiencies under hot, sunny conditions. C4 plants use carbon dioxide more efficiently (by bypassing photorespiration) and lose less water through transpiration (water evaporated from inside plants) per unit of carbohydrate made. The overall result is that C4 plants can grow much faster under high temperatures than most C3 plants. The majority of summer-growing grasses in warm climates are C4. So are many other summer-growing plants, especially weeds (invasive pioneer plants) that seem to spring up overnight, such as pigweed (Amaranthus spp.) and summer spurges (Euphorbia hyssopifolia andothers), as well as devil's claw (Proboscidea spp.), and many saltbushes (Atriplex spp.). Onlyabout 3 percent of all the Earth's plant species are known to use C4, but a number of them are vital crops, such as corn, sorghum, and sugar cane. Another variant of photosynthesis, cam, is discussed under the succulence section of this chapter on page 135.
Coping with Desert Climate
The impression that the desert environment is hostile is strictly an outsider's viewpoint. Adaptation enables indigenous organisms not merely to survive here, but to thrive. Furthermore, specialized adaptations often result in a requirement for the seasonal drought and heat. For example, the saguaro, well adapted to its subtropical desert habitat, cannot survive in a rain forest or in any other biome, not even a cold desert. In these other places it would rot, freeze, or be shaded out by faster growing plants.
Aridity is the major - and almost the only - environmental factor that creates a desert, and it is this functional water deficit that serves as the primary limitation to which desert organisms must adapt. Desert plants survive the long rainless periods with three main adaptive strategies: succulence, drought tolerance, and drought evasion. Each of these is a different but effective suite of adaptations for prospering under conditions that would kill plants from other regions.
Succulence
As a group succulents are the most picturesque desert plants. They capture our attention because they look nothing like the familiar plants of the temperate zone where most people live. Their vernacular names suggest how they command our attention: elephant tree, boojum, jumping cholla, creeping devil, and shindagger. Spanish names translate into equally colorful terms such as dragon's blood, child-killer, and old man's head. Even some scientific names are inspired by the plants' characteristics: Ferocactus (as in ferocious), Opuntia molesta (the molesting-spined cactus), O. invicta (the invincible point), and Agave jaiboli (as in a highball cocktail, because liquor is made from it).
Succulent plants store water in fleshy leaves, stems or roots in compounds or cells from which it is not easily lost (see photo on page 135). All cacti are succulents, as are such non-cactus desert dwellers as agaves, aloes, elephant trees, and many euphorbias. Several other adaptations are essential for the water-storing habit to be effective.
© 2016 Arizona-Sonora Desert Museum 4/17
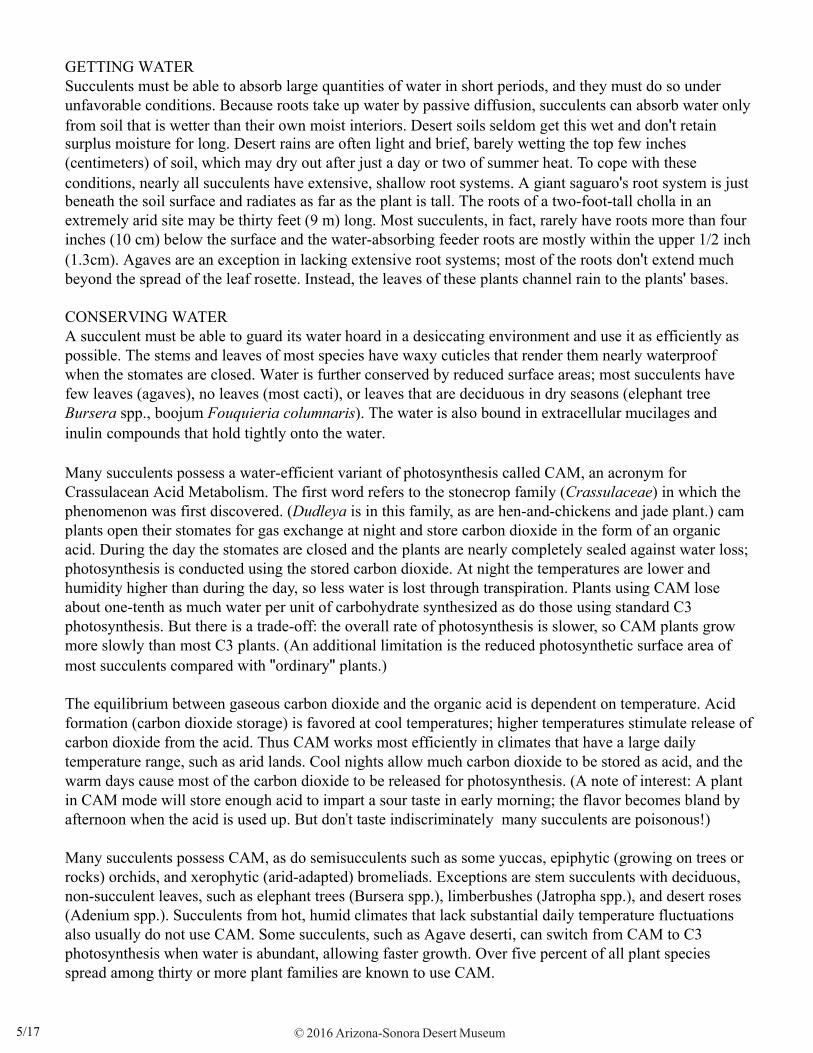
GETTING WATER Succulents must be able to absorb large quantities of water in short periods, and they must do so under unfavorable conditions. Because roots take up water by passive diffusion, succulents can absorb water only from soil that is wetter than their own moist interiors. Desert soils seldom get this wet and don't retain surplus moisture for long. Desert rains are often light and brief, barely wetting the top few inches (centimeters) of soil, which may dry out after just a day or two of summer heat. To cope with these conditions, nearly all succulents have extensive, shallow root systems. A giant saguaro's root system is just beneath the soil surface and radiates as far as the plant is tall. The roots of a two-foot-tall cholla in an extremely arid site may be thirty feet (9 m) long. Most succulents, in fact, rarely have roots more than four inches (10 cm) below the surface and the water-absorbing feeder roots are mostly within the upper 1/2 inch (1.3cm). Agaves are an exception in lacking extensive root systems; most of the roots don't extend much beyond the spread of the leaf rosette. Instead, the leaves of these plants channel rain to the plants' bases.
CONSERVING WATER A succulent must be able to guard its water hoard in a desiccating environment and use it as efficiently as possible. The stems and leaves of most species have waxy cuticles that render them nearly waterproof when the stomates are closed. Water is further conserved by reduced surface areas; most succulents have few leaves (agaves), no leaves (most cacti), or leaves that are deciduous in dry seasons (elephant tree Bursera spp., boojum Fouquieria columnaris). The water is also bound in extracellular mucilages and inulin compounds that hold tightly onto the water.
Many succulents possess a water-efficient variant of photosynthesis called CAM, an acronym for Crassulacean Acid Metabolism. The first word refers to the stonecrop family (Crassulaceae) in which the phenomenon was first discovered. (Dudleya is in this family, as are hen-and-chickens and jade plant.) cam plants open their stomates for gas exchange at night and store carbon dioxide in the form of an organic acid. During the day the stomates are closed and the plants are nearly completely sealed against water loss; photosynthesis is conducted using the stored carbon dioxide. At night the temperatures are lower and humidity higher than during the day, so less water is lost through transpiration. Plants using CAM lose about one-tenth as much water per unit of carbohydrate synthesized as do those using standard C3 photosynthesis. But there is a trade-off: the overall rate of photosynthesis is slower, so CAM plants grow more slowly than most C3 plants. (An additional limitation is the reduced photosynthetic surface area of most succulents compared with "ordinary" plants.)
The equilibrium between gaseous carbon dioxide and the organic acid is dependent on temperature. Acid formation (carbon dioxide storage) is favored at cool temperatures; higher temperatures stimulate release of carbon dioxide from the acid. Thus CAM works most efficiently in climates that have a large daily temperature range, such as arid lands. Cool nights allow much carbon dioxide to be stored as acid, and the warm days cause most of the carbon dioxide to be released for photosynthesis. (A note of interest: A plant in CAM mode will store enough acid to impart a sour taste in early morning; the flavor becomes bland by afternoon when the acid is used up. But don't taste indiscriminately many succulents are poisonous!)
Many succulents possess CAM, as do semisucculents such as some yuccas, epiphytic (growing on trees or rocks) orchids, and xerophytic (arid-adapted) bromeliads. Exceptions are stem succulents with deciduous, non-succulent leaves, such as elephant trees (Bursera spp.), limberbushes (Jatropha spp.), and desert roses (Adenium spp.). Succulents from hot, humid climates that lack substantial daily temperature fluctuations also usually do not use CAM. Some succulents, such as Agave deserti, can switch from CAM to C3 photosynthesis when water is abundant, allowing faster growth. Over five percent of all plant species spread among thirty or more plant families are known to use CAM.
© 2016 Arizona-Sonora Desert Museum 5/17
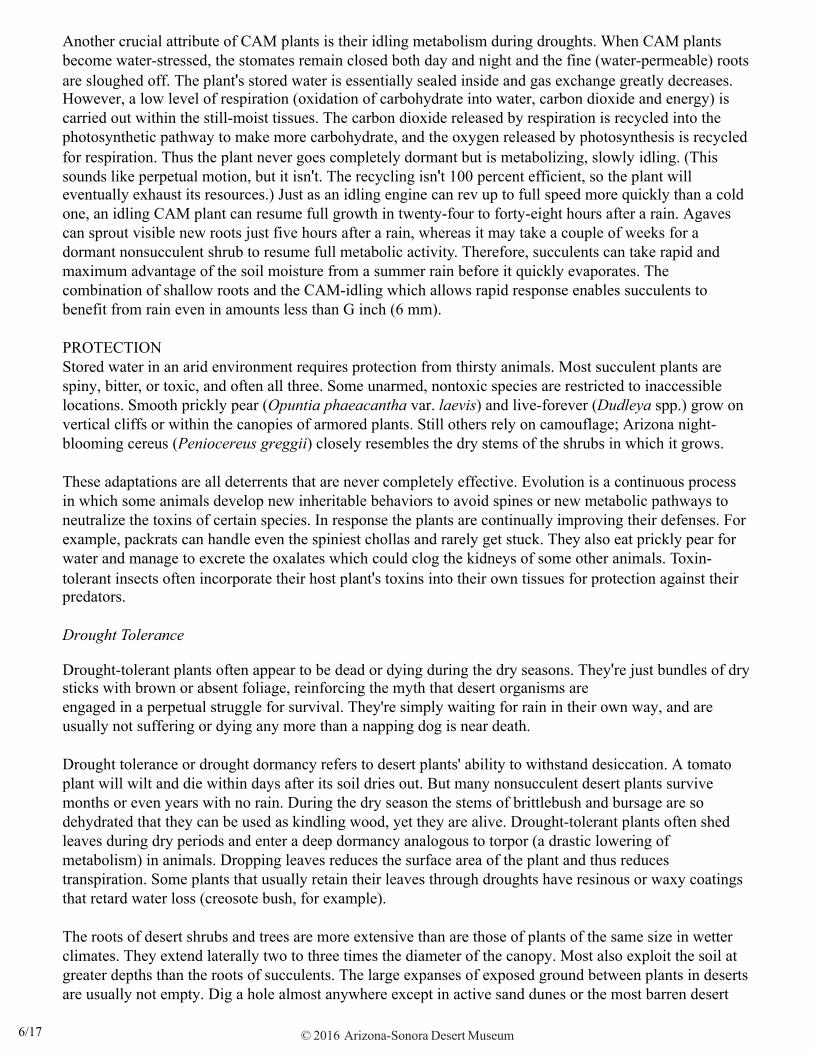
Another crucial attribute of CAM plants is their idling metabolism during droughts. When CAM plants become water-stressed, the stomates remain closed both day and night and the fine (water-permeable) roots are sloughed off. The plant's stored water is essentially sealed inside and gas exchange greatly decreases. However, a low level of respiration (oxidation of carbohydrate into water, carbon dioxide and energy) is carried out within the still-moist tissues. The carbon dioxide released by respiration is recycled into the photosynthetic pathway to make more carbohydrate, and the oxygen released by photosynthesis is recycled for respiration. Thus the plant never goes completely dormant but is metabolizing, slowly idling. (This sounds like perpetual motion, but it isn't. The recycling isn't 100 percent efficient, so the plant will eventually exhaust its resources.) Just as an idling engine can rev up to full speed more quickly than a cold one, an idling CAM plant can resume full growth in twenty-four to forty-eight hours after a rain. Agaves can sprout visible new roots just five hours after a rain, whereas it may take a couple of weeks for a dormant nonsucculent shrub to resume full metabolic activity. Therefore, succulents can take rapid and maximum advantage of the soil moisture from a summer rain before it quickly evaporates. The combination of shallow roots and the CAM-idling which allows rapid response enables succulents to benefit from rain even in amounts less than G inch (6 mm).
PROTECTION Stored water in an arid environment requires protection from thirsty animals. Most succulent plants are spiny, bitter, or toxic, and often all three. Some unarmed, nontoxic species are restricted to inaccessible locations. Smooth prickly pear (Opuntia phaeacantha var. laevis) and live-forever (Dudleya spp.) grow on vertical cliffs or within the canopies of armored plants. Still others rely on camouflage; Arizona night-blooming cereus (Peniocereus greggii) closely resembles the dry stems of the shrubs in which it grows.
These adaptations are all deterrents that are never completely effective. Evolution is a continuous process in which some animals develop new inheritable behaviors to avoid spines or new metabolic pathways to neutralize the toxins of certain species. In response the plants are continually improving their defenses. For example, packrats can handle even the spiniest chollas and rarely get stuck. They also eat prickly pear for water and manage to excrete the oxalates which could clog the kidneys of some other animals. Toxin-tolerant insects often incorporate their host plant's toxins into their own tissues for protection against their predators.
Drought Tolerance
Drought-tolerant plants often appear to be dead or dying during the dry seasons. They're just bundles of dry sticks with brown or absent foliage, reinforcing the myth that desert organisms areengaged in a perpetual struggle for survival. They're simply waiting for rain in their own way, and are usually not suffering or dying any more than a napping dog is near death.
Drought tolerance or drought dormancy refers to desert plants' ability to withstand desiccation. A tomato plant will wilt and die within days after its soil dries out. But many nonsucculent desert plants survive months or even years with no rain. During the dry season the stems of brittlebush and bursage are so dehydrated that they can be used as kindling wood, yet they are alive. Drought-tolerant plants often shed leaves during dry periods and enter a deep dormancy analogous to torpor (a drastic lowering of metabolism) in animals. Dropping leaves reduces the surface area of the plant and thus reduces transpiration. Some plants that usually retain their leaves through droughts have resinous or waxy coatings that retard water loss (creosote bush, for example).
The roots of desert shrubs and trees are more extensive than are those of plants of the same size in wetter climates. They extend laterally two to three times the diameter of the canopy. Most also exploit the soil at greater depths than the roots of succulents. The large expanses of exposed ground between plants in deserts are usually not empty. Dig a hole almost anywhere except in active sand dunes or the most barren desert
© 2016 Arizona-Sonora Desert Museum 6/17
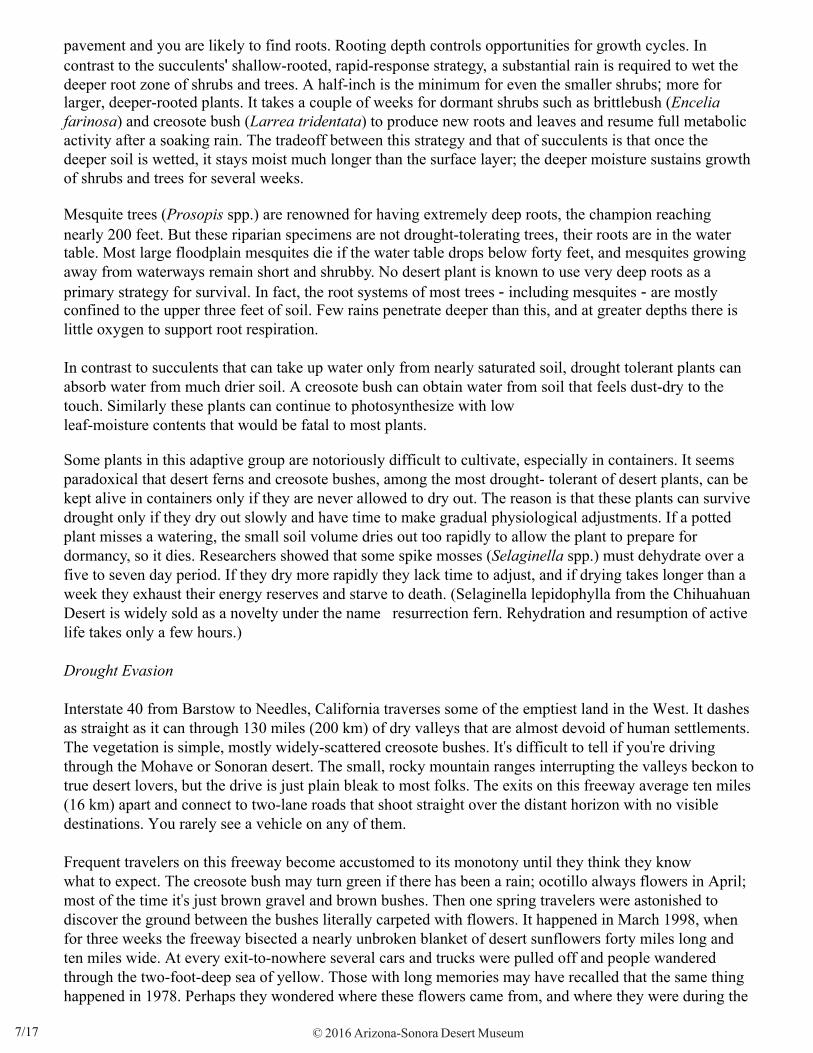
pavement and you are likely to find roots. Rooting depth controls opportunities for growth cycles. In contrast to the succulents' shallow-rooted, rapid-response strategy, a substantial rain is required to wet the deeper root zone of shrubs and trees. A half-inch is the minimum for even the smaller shrubs; more for larger, deeper-rooted plants. It takes a couple of weeks for dormant shrubs such as brittlebush (Encelia farinosa) and creosote bush (Larrea tridentata) to produce new roots and leaves and resume full metabolic activity after a soaking rain. The tradeoff between this strategy and that of succulents is that once the deeper soil is wetted, it stays moist much longer than the surface layer; the deeper moisture sustains growth of shrubs and trees for several weeks.
Mesquite trees (Prosopis spp.) are renowned for having extremely deep roots, the champion reaching nearly 200 feet. But these riparian specimens are not drought-tolerating trees, their roots are in the water table. Most large floodplain mesquites die if the water table drops below forty feet, and mesquites growing away from waterways remain short and shrubby. No desert plant is known to use very deep roots as a primary strategy for survival. In fact, the root systems of most trees - including mesquites - are mostly confined to the upper three feet of soil. Few rains penetrate deeper than this, and at greater depths there is little oxygen to support root respiration.
In contrast to succulents that can take up water only from nearly saturated soil, drought tolerant plants can absorb water from much drier soil. A creosote bush can obtain water from soil that feels dust-dry to the touch. Similarly these plants can continue to photosynthesize with lowleaf-moisture contents that would be fatal to most plants.
Some plants in this adaptive group are notoriously difficult to cultivate, especially in containers. It seems paradoxical that desert ferns and creosote bushes, among the most drought- tolerant of desert plants, can be kept alive in containers only if they are never allowed to dry out. The reason is that these plants can survive drought only if they dry out slowly and have time to make gradual physiological adjustments. If a potted plant misses a watering, the small soil volume dries out too rapidly to allow the plant to prepare for dormancy, so it dies. Researchers showed that some spike mosses (Selaginella spp.) must dehydrate over a five to seven day period. If they dry more rapidly they lack time to adjust, and if drying takes longer than a week they exhaust their energy reserves and starve to death. (Selaginella lepidophylla from the Chihuahuan Desert is widely sold as a novelty under the name resurrection fern. Rehydration and resumption of active life takes only a few hours.)
Drought Evasion
Interstate 40 from Barstow to Needles, California traverses some of the emptiest land in the West. It dashes as straight as it can through 130 miles (200 km) of dry valleys that are almost devoid of human settlements. The vegetation is simple, mostly widely-scattered creosote bushes. It's difficult to tell if you're driving through the Mohave or Sonoran desert. The small, rocky mountain ranges interrupting the valleys beckon to true desert lovers, but the drive is just plain bleak to most folks. The exits on this freeway average ten miles (16 km) apart and connect to two-lane roads that shoot straight over the distant horizon with no visible destinations. You rarely see a vehicle on any of them.
Frequent travelers on this freeway become accustomed to its monotony until they think they knowwhat to expect. The creosote bush may turn green if there has been a rain; ocotillo always flowers in April; most of the time it's just brown gravel and brown bushes. Then one spring travelers were astonished to discover the ground between the bushes literally carpeted with flowers. It happened in March 1998, when for three weeks the freeway bisected a nearly unbroken blanket of desert sunflowers forty miles long and ten miles wide. At every exit-to-nowhere several cars and trucks were pulled off and people wandered through the two-foot-deep sea of yellow. Those with long memories may have recalled that the same thing happened in 1978. Perhaps they wondered where these flowers came from, and where they were during the
© 2016 Arizona-Sonora Desert Museum 7/17
intervening twenty years. Those desert sunflowers (Geraea canescens) were annual wildflowers, plants that escape unfavorable conditions by "not existing" during such periods. Annuals complete their life cycles during brief wet seasons, then die after channeling all of their life energy into producing seeds. Seeds are dormant propagules with almost no metabolism and great resistance to environmental extremes. (A propagule is any part of a plant that can separate from the parent and grow into a new plant, for example, a seed, an agave aerial plantlet, a cholla joint.) Seeds wait out adverse environmental conditions, sometimes for decades, and will germinate and grow only when specific requirements are met.
Wildflower spectacles like the one described above are rare events. Mass germination and prolific growth depend on rains that are both earlier and more plentiful than normal. The dazzling displays featured in photographic journals and on postcards occur about once a decade in a given place. In the six decades between 1940 and 1998 there have been only four documented drop-everything-and-go-see-it displays in southern Arizona: 1941, 1978, 1979, and 1998. During that period only the displays of 1978 and 1998 were widespread throughout both the Sonoran and Mohave deserts.
Annuals in the Sonoran Desert can be divided into three groups, based on time of germination and flowering. Winter-spring species are by far the most numerous. The showy wildflowers that attract human attention will germinate only during a narrow window of opportunity in the fall or winter, after summer heat has waned and before winter cold arrives. In most of the Sonoran Desert this temperature window seems to occur between early October and early December for most species. During this window there must be a soaking rain of at least one inch (2.5 cm) to induce mass germination. This combination of requirements is survival insurance: an inch of rain in the mild weather of fall will provide enough soil moisture that the resulting seedlings will probably mature and produce seeds even if almost no more rain falls in that season. (Remember that one of the characteristics of deserts is low and undependable rainfall.) If the subsequent rainfall is sparse, the plants remain small and may produce only a single flower and a few seeds, but this is enough to ensure a future generation . There is still further insurance: even under the best conditions not all of the seeds in the soil will germinate; some remain dormant. For example, a percentage of any year's crop of desert lupine seeds will not germinate until they are ten years old. The mechanisms that regulate this delayed germination are not well understood.
The seedlings produce rosettes of leaves during the mild fall weather, grow more slowly through the winter (staying warm in the daytime by remaining flat against the ground), and bolt into flower in the spring. Since the plants are inconspicuous until they begin the spring bolt, many people mistakenly think that spring rains produce desert wildflower displays.
There is a smaller group of annual species that grow only in response to summer rains. Annual devil's claw (Proboscidea parviflora) and Arizona poppy (Kallstroemia grandiflora) are among the few showy ones.
A third group consists of a few opportunistic species which will germinate in response to rain at almost any season. Most of these lack showy flowers and are known only to botanists, but desert marigold (Baileya multiradiata) is a conspicuous exception; it is actually not an annual, but rather a short-lived perennial in most of its range. A few species of buckwheats (Eriogonum) germinate in fall or winter and flower the following summer.
The annual habit is a very successful strategy for warm-arid climates. There are no annual plants in the polar regions or the wet tropics. In the polar zones the growing season is too short to complete a life cycle. In both habitats the intense competition for suitable growing sites favors longevity. (Once you've got it, you should hang onto it.) Annuals become common only in communities that have dry seasons, where the perennials are widely spaced because they must command a large soil area to survive the drier years. In the occasional wetter years, both open space and moisture are available to be exploited by plants that can do so
© 2016 Arizona-Sonora Desert Museum 8/17
rapidly. The more arid the habitat, the greater the proportion of annual species in North America. (The percentage decreases in the extremely arid parts of the Saharan-Arabian region.) Half of the Sonoran Desert's flora is comprised of annual species. In the driest habitats, such as the sandy flats near Yuma, Arizona up to ninety percent of the plants are annuals.
Winter annuals provide most of the color for our famous wildflower shows. Woody perennials and succulents can be individually beautiful, but their adaptive strategies require them to be widely-spaced, so they usually don't create masses of color. A couple of exceptions are brittlebush when it occurs in pure stands, and exten sive woodlands of foothill palo verde (Cercidium microphyllum). The most common of the showy winter annuals that contribute to these displays in southern Arizona are Mexican gold poppy (Eschscholtzia mexicana), lupine (Lupinus sparsiflorus), and owl-clover (Castilleja exserta, formerly Orthocarpus purpurascens).
One of the contributing factors to the great number of annual species is niche separation. (Aniche is an organism's ecological role; for example, sand verbena is a butterfly-pollinated winter annual of sandy soils.) Most species have definite preferences for particular soil textures, and perhaps soil chemistry as well. For example, in the Pinacate region of northwestern Sonora there are places where gravels of volcanic cinder are dissected by drainage channels or wind deposits of fine silt. In wet years Nama demissum (purple mat) grows abundantly on the gravel and the related Nama hispidum (sand bells) on the silt. I have seen the two species within inches of each other where these soil types meet, but not one plant of either species could be found on the other soil. There are specialists in loose sand such as dune evening primrose (Oenothera deltoides) and sand verbena (Abronia villosa), and others are restricted to rocky soils, such as most caterpillar weeds (Phacelia spp.). This phenomenon of occupying different physical locations is spatial niche separation.
Another diversity-promoting phenomenon is temporal niche separation: the mix of species at the same location changes from year to year. Seeds of the various species have different germination requirements. The time of the season (which influences temperature) and quantity of the first germination-triggering rain determines which species will dominate, or even be present at all in that year. Of the three most common annuals of southern Arizona listed above, any one may occur in a nearly pure stand on a given hillside in different years, and occasionally all three are nearly equally abundant. This interpretation of the cause of these year-to-year variations is a hypothesis based on decades of empirical observation. Much more research is needed to discover the ecological requirements of most species of desert annuals. And of course the Sonoran Desert's two rainy seasons provide two major temporal niches. Summer and winter annuals almost never overlap.
The dramatic wildflower shows are only a small part of the ecological story of desert annuals. For each conspicuous species there are dozens of others that either have less colorful flowers ordon't grow in large numbers. Every time the desert has a wet fall or winter it will turn green with annuals, but it will not always be ablaze with other colors. One of the most common winter annuals is desert plantain (Plantago insularis). It usually grows only a few inches tall and bears spikes of tiny greenish flowers, but billions of plants cover many square miles in good years. The tiny seeds are covered with a soluble fiber which forms a sticky mucilage when wet by rain; this aids germination by retaining water around the seed and sticking it to the ground. A related species from India is the commercial source of psyllium fiber (Metamucil, for example). The buckwheat family (Polygonaceae) is well- represented. There are more than a score of skeleton weeds (Eriogonum spp.) and half as many spiny buckwheats (Chorizanthe spp.), most of which go unnoticed except by botanists (see species accounts). Fiddlenecks (Amsinckia spp., Boraginaceae) may grow in solid masses over many acres, but the tiny yellow flowers don't significantly modify the dominant green of the foliage. These more modest species produce more biomass than the showy wildflowers in most years, and thus form the foundation of a great food pyramid.
© 2016 Arizona-Sonora Desert Museum 9/17
Some perennials also evade drought much as annuals do, by having underground parts that send up stems, leaves, and flowers only during wet years. Coyote gourd (Cucurbita digitata) and perennial devil's claw (Proboscidea althaeifolia) have fleshy roots that remain dormant in dry years. Desert larkspur (Delphinium parryi) is a perennial that has woody rootstocks but also sprouts only in wetter years. Desert mariposa (Calochortus kennedyi) and desert lily (Hesperocallis undulata) have bulbs that may remain dormant for several years until a deep soaking rain awakens them.
Our desert wildflower displays are in jeopardy from invasive exotic plants. Species such as Russian thistle (Salsola tragus, also called S. kali), mustards (especially Brassica tournefortii), filaree (Erodium cicutarium), and Lehmann's lovegrass (Eragrostis lehmannii) are more aggressive than most of the native annuals and are crowding them out in many areas where they have become established. Some are still increasing their geographic ranges with every wet winter. Disturbed sites such as sand dunes, washes (naturally disturbed by wind and water, respectively), roadsides, and livestock-grazed lands are particularly vulnerable to invasion by these aliens.
Combined Drought Adaptations
These three basic drought-coping strategies - succulence, drought tolerance, and drought avoidance - are not exclusive categories. Ocotillo behaves as if it were a CAM-succulent, drought deciduous shrub, but it is neither CAM nor succulent (see details in the species accounts). The genus Portulaca contains species that are succulent annuals. The seeds may wait for a wet spell to germinate, but the resulting plants can tolerate a moderate drought. The semisucculent yuccas have some water storage capacity, but rely on deep roots to obtain most of their water. Mesquite trees are often phreatophytes (plants with their roots in the water table), but some species can also grow as stunted shrubs on drier sites where ground water is beyond their reach.
Adaptations to Other Desert Conditions
Water scarcity is the most important, but not the only, environmental challenge to desert organisms. The aridity allows the sun to shine unfiltered through the clear atmosphere continuously from sunrise to sunset. This intense solar radiation produces very high summer temperatures which are lethal to nonadapted plants. At night much of the accumulated heat radiates through the same clear atmosphere and the temperature drops dramatically. Daily fluctuations of 40°F (22°C) are not uncommon when the humidity is very low.
Microphylly (the trait of having small leaves) is primarily an adaptation to avoid overheating; it also reduces water loss. A broader surface has a deeper boundary layer of stagnant air at its surface, which impedes convective heat exchange. A leaf up to 1/2 inch (10 mm) across can stay below the lethal tissue temperature of about 115°F (46°C) on a calm day with its stomates closed. A larger leaf requires transpiration through open stomates for evaporative cooling. Since the hottest time of year is also the driest, water is not available for transpiration. Non- succulent large-leafed plants in the desert environment would overheat and be killed. Desert gardeners know that tomatoes will burn in full desert sun even if well watered; their leaves are just too big to stay cool. Desert plants that do have large leaves produce them only during the cool or rainy season or else live in shaded microhabitats. There are a few mysterious exceptions, such as jimson weed (Datura wrightii) and desert milkweed (Asclepias erosa). Perhaps their large tuberous roots provide enough water for transpiration even when the soil is dry.
Leaf or stem color, orientation, and self-shading are still more ways to adapt to intense light and heat. Desert foliage comes in many shades, but rarely in typical leaf-green. More often leaves are gray-green,
© 2016 Arizona-Sonora Desert Museum 10/17
blue-green, gray, or even white. The light color is usually due to a dense covering of trichomes (hairlike scales), but is sometimes from a waxy secretion on the leaf or stem surface. Lighter colors reflect more light (= heat) and thus remain cooler than dark green leaves. Brittlebush and white bursage leaves show no green through their trichomes during the dry season, while desert agave (Agave deserti) is light gray due to its thick, waxy cuticle. Other plants have leaves or stems with vertical orientations; two common examples are jojoba and prickly pear cactus. This orientation results in the photosynthetic surface facing the sun most directly in morning and late afternoon. Photosynthesis is more efficient during these cooler times of day.
Prickly pear pads will burn in summer if their flat surfaces face upward. Some cacti create their own shade with a dense armament of spines; teddy bear cholla (Opuntia bigelovii) is one of the most striking examples.
Pollination Ecology and Seed Dispersal of Desert Plants (this portion of the chapter is also available in Spanish: Ecología de la polinización y dispersión de las semillas de las plantas del desierto)
Flowers are very useful for identifying plants and providing aesthetic pleasure for humans, butthey have a more vital function - they are the sexual reproductive organs of plants. Many plants also have methods of asexual (vegetative) reproduction, which produces offspring that are genetically identical to the parent: root-sprouting (limberbush, palo verde, aspen), stolons and rhizomes (agaves, strawberries, many grasses), and aerial plantlets (some agaves, mother-of-millions, kalanchoe). All of the progeny of asexual reproduction are clones of their parent plants. (A clone is a group of organisms that are genetically identical; in the case of flowering plants each clone originates from a single seed.) Horticulturists have developed additional methods of plant cloning that are valuable in perpetuating superior varieties of plants: cutting, grafting, and tissue culture. The "Kadota" fig is a cultivar (contraction for cultivated variety) that has been propagated by cuttings for at least two millennia; it is described under a different name in the writings of Pliny the Younger.
In contrast, sexual reproduction combines half the genes from each of two parents, so sexually produced offspring are different from either of their parents and from one another. This variation is the raw material of natural selection which in turn results in evolution. A species that cannot reproduce sexually - there are quite a few among both plants and animals - is at greater risk of extinction if its environment changes, because it cannot adapt to new conditions.
Pollination is the transfer of pollen from an anther onto the stigma of a flower. The pollen then grows a tube that penetrates the style down to the ovary; sperm cells swim down the tube and fertilize the ova. Fertilized ova develop into seeds, which are the sexual propagules of flowering plants.
Outcrossing (pollination by pollen from another plant) is evolutionarily advantageous because the offspring are more variable than those from self-pollination. Variability increases plants' probability of surviving in an ever-changing environment. (But self-pollination is still sexual reproduction which results in different combinations of genes and therefore allows evolutionary change, as vegetative cloning does not.) Plants have many adaptations that increase the likelihood of outcrossing.
Because plants are rooted in the ground and can't get together to mate, they must employ an agent to transport pollen between plants. From this need widespread and complex kinds of mutualism (mutually beneficial interactions) have evolved between plants and animals. The pollen-transporting agent is frequently an insect or other flying animal. (Flying animals are more mobile than grounded species, and thus more likely to visit widely-separated plants.) In order to get pollinated, a flower must both make its
© 2016 Arizona-Sonora Desert Museum 11/17
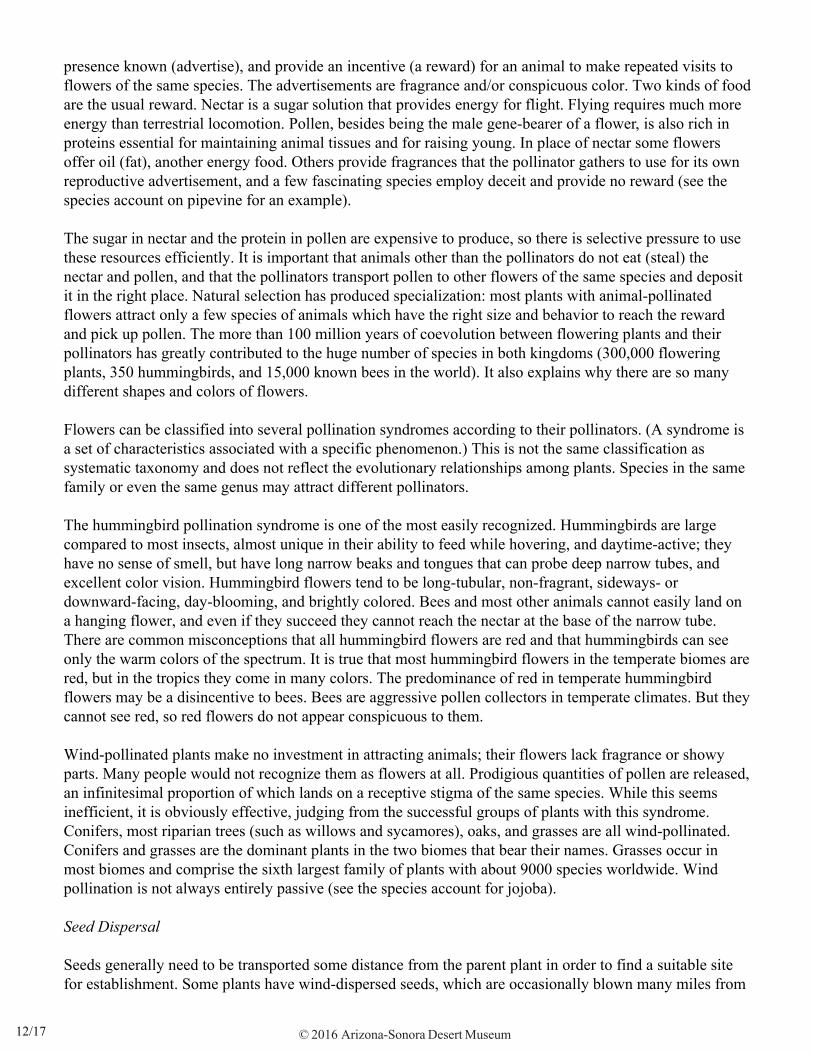
presence known (advertise), and provide an incentive (a reward) for an animal to make repeated visits to flowers of the same species. The advertisements are fragrance and/or conspicuous color. Two kinds of food are the usual reward. Nectar is a sugar solution that provides energy for flight. Flying requires much more energy than terrestrial locomotion. Pollen, besides being the male gene-bearer of a flower, is also rich in proteins essential for maintaining animal tissues and for raising young. In place of nectar some flowers offer oil (fat), another energy food. Others provide fragrances that the pollinator gathers to use for its own reproductive advertisement, and a few fascinating species employ deceit and provide no reward (see the species account on pipevine for an example).
The sugar in nectar and the protein in pollen are expensive to produce, so there is selective pressure to use these resources efficiently. It is important that animals other than the pollinators do not eat (steal) the nectar and pollen, and that the pollinators transport pollen to other flowers of the same species and deposit it in the right place. Natural selection has produced specialization: most plants with animal-pollinated flowers attract only a few species of animals which have the right size and behavior to reach the reward and pick up pollen. The more than 100 million years of coevolution between flowering plants and their pollinators has greatly contributed to the huge number of species in both kingdoms (300,000 flowering plants, 350 hummingbirds, and 15,000 known bees in the world). It also explains why there are so many different shapes and colors of flowers.
Flowers can be classified into several pollination syndromes according to their pollinators. (A syndrome is a set of characteristics associated with a specific phenomenon.) This is not the same classification as systematic taxonomy and does not reflect the evolutionary relationships among plants. Species in the same family or even the same genus may attract different pollinators.
The hummingbird pollination syndrome is one of the most easily recognized. Hummingbirds are large compared to most insects, almost unique in their ability to feed while hovering, and daytime-active; they have no sense of smell, but have long narrow beaks and tongues that can probe deep narrow tubes, and excellent color vision. Hummingbird flowers tend to be long-tubular, non-fragrant, sideways- or downward-facing, day-blooming, and brightly colored. Bees and most other animals cannot easily land on a hanging flower, and even if they succeed they cannot reach the nectar at the base of the narrow tube. There are common misconceptions that all hummingbird flowers are red and that hummingbirds can see only the warm colors of the spectrum. It is true that most hummingbird flowers in the temperate biomes are red, but in the tropics they come in many colors. The predominance of red in temperate hummingbird flowers may be a disincentive to bees. Bees are aggressive pollen collectors in temperate climates. But they cannot see red, so red flowers do not appear conspicuous to them.
Wind-pollinated plants make no investment in attracting animals; their flowers lack fragrance or showy parts. Many people would not recognize them as flowers at all. Prodigious quantities of pollen are released, an infinitesimal proportion of which lands on a receptive stigma of the same species. While this seems inefficient, it is obviously effective, judging from the successful groups of plants with this syndrome. Conifers, most riparian trees (such as willows and sycamores), oaks, and grasses are all wind-pollinated. Conifers and grasses are the dominant plants in the two biomes that bear their names. Grasses occur in most biomes and comprise the sixth largest family of plants with about 9000 species worldwide. Wind pollination is not always entirely passive (see the species account for jojoba).
Seed Dispersal
Seeds generally need to be transported some distance from the parent plant in order to find a suitable site for establishment. Some plants have wind-dispersed seeds, which are occasionally blown many miles from
© 2016 Arizona-Sonora Desert Museum 12/17
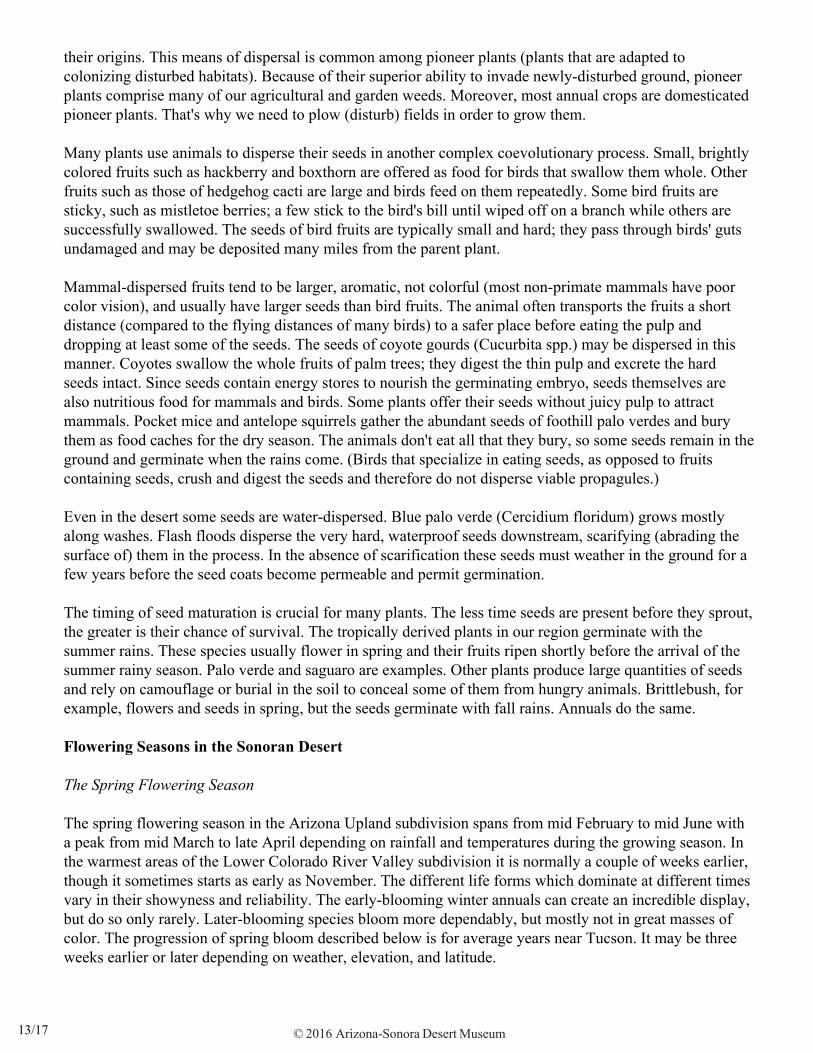
their origins. This means of dispersal is common among pioneer plants (plants that are adapted to colonizing disturbed habitats). Because of their superior ability to invade newly-disturbed ground, pioneer plants comprise many of our agricultural and garden weeds. Moreover, most annual crops are domesticated pioneer plants. That's why we need to plow (disturb) fields in order to grow them.
Many plants use animals to disperse their seeds in another complex coevolutionary process. Small, brightly colored fruits such as hackberry and boxthorn are offered as food for birds that swallow them whole. Other fruits such as those of hedgehog cacti are large and birds feed on them repeatedly. Some bird fruits are sticky, such as mistletoe berries; a few stick to the bird's bill until wiped off on a branch while others are successfully swallowed. The seeds of bird fruits are typically small and hard; they pass through birds' guts undamaged and may be deposited many miles from the parent plant.
Mammal-dispersed fruits tend to be larger, aromatic, not colorful (most non-primate mammals have poor color vision), and usually have larger seeds than bird fruits. The animal often transports the fruits a short distance (compared to the flying distances of many birds) to a safer place before eating the pulp and dropping at least some of the seeds. The seeds of coyote gourds (Cucurbita spp.) may be dispersed in this manner. Coyotes swallow the whole fruits of palm trees; they digest the thin pulp and excrete the hard seeds intact. Since seeds contain energy stores to nourish the germinating embryo, seeds themselves are also nutritious food for mammals and birds. Some plants offer their seeds without juicy pulp to attract mammals. Pocket mice and antelope squirrels gather the abundant seeds of foothill palo verdes and bury them as food caches for the dry season. The animals don't eat all that they bury, so some seeds remain in the ground and germinate when the rains come. (Birds that specialize in eating seeds, as opposed to fruits containing seeds, crush and digest the seeds and therefore do not disperse viable propagules.)
Even in the desert some seeds are water-dispersed. Blue palo verde (Cercidium floridum) grows mostly along washes. Flash floods disperse the very hard, waterproof seeds downstream, scarifying (abrading the surface of) them in the process. In the absence of scarification these seeds must weather in the ground for a few years before the seed coats become permeable and permit germination.
The timing of seed maturation is crucial for many plants. The less time seeds are present before they sprout, the greater is their chance of survival. The tropically derived plants in our region germinate with the summer rains. These species usually flower in spring and their fruits ripen shortly before the arrival of the summer rainy season. Palo verde and saguaro are examples. Other plants produce large quantities of seeds and rely on camouflage or burial in the soil to conceal some of them from hungry animals. Brittlebush, for example, flowers and seeds in spring, but the seeds germinate with fall rains. Annuals do the same.
Flowering Seasons in the Sonoran Desert
The Spring Flowering Season
The spring flowering season in the Arizona Upland subdivision spans from mid February to mid June with a peak from mid March to late April depending on rainfall and temperatures during the growing season. In the warmest areas of the Lower Colorado River Valley subdivision it is normally a couple of weeks earlier, though it sometimes starts as early as November. The different life forms which dominate at different times vary in their showyness and reliability. The early-blooming winter annuals can create an incredible display, but do so only rarely. Later-blooming species bloom more dependably, but mostly not in great masses of color. The progression of spring bloom described below is for average years near Tucson. It may be three weeks earlier or later depending on weather, elevation, and latitude.
© 2016 Arizona-Sonora Desert Museum 13/17
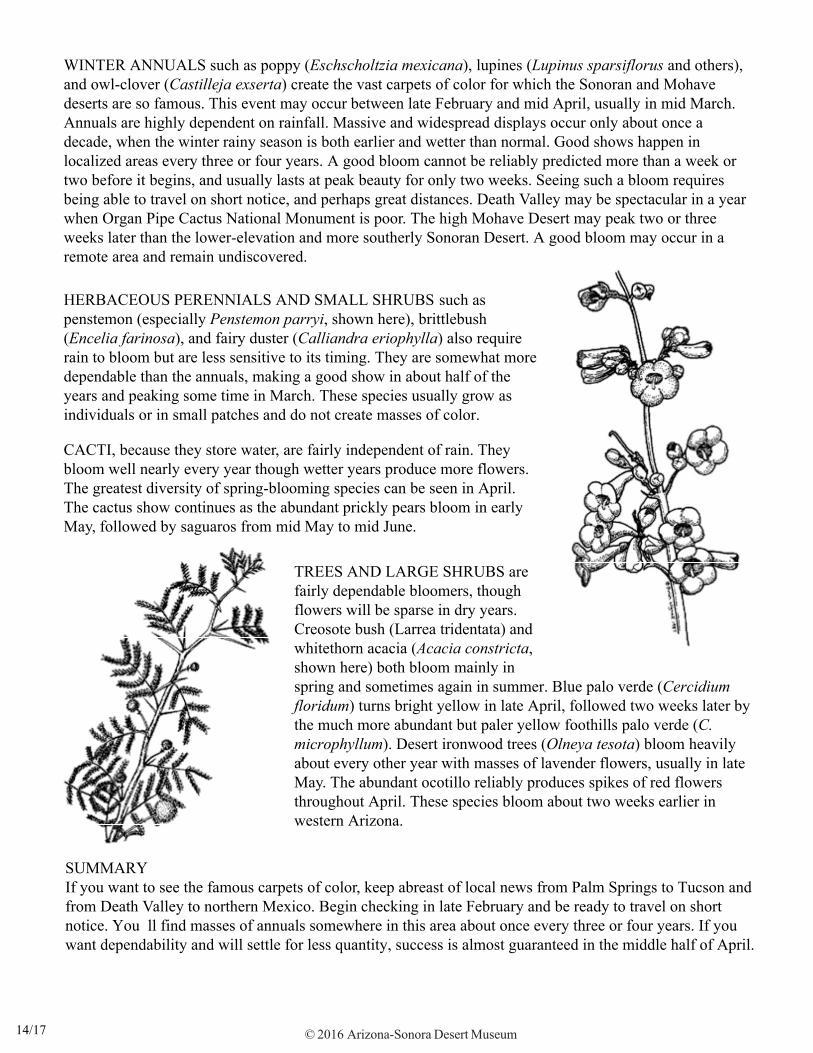
WINTER ANNUALS such as poppy (Eschscholtzia mexicana), lupines (Lupinus sparsiflorus and others), and owl-clover (Castilleja exserta) create the vast carpets of color for which the Sonoran and Mohave deserts are so famous. This event may occur between late February and mid April, usually in mid March. Annuals are highly dependent on rainfall. Massive and widespread displays occur only about once a decade, when the winter rainy season is both earlier and wetter than normal. Good shows happen in localized areas every three or four years. A good bloom cannot be reliably predicted more than a week or two before it begins, and usually lasts at peak beauty for only two weeks. Seeing such a bloom requires being able to travel on short notice, and perhaps great distances. Death Valley may be spectacular in a year when Organ Pipe Cactus National Monument is poor. The high Mohave Desert may peak two or three weeks later than the lower-elevation and more southerly Sonoran Desert. A good bloom may occur in a remote area and remain undiscovered.
HERBACEOUS PERENNIALS AND SMALL SHRUBS such as penstemon (especially Penstemon parryi, shown here), brittlebush (Encelia farinosa), and fairy duster (Calliandra eriophylla) also require rain to bloom but are less sensitive to its timing. They are somewhat more dependable than the annuals, making a good show in about half of the years and peaking some time in March. These species usually grow as individuals or in small patches and do not create masses of color.
CACTI, because they store water, are fairly independent of rain. They bloom well nearly every year though wetter years produce more flowers. The greatest diversity of spring-blooming species can be seen in April. The cactus show continues as the abundant prickly pears bloom in early May, followed by saguaros from mid May to mid June.
TREES AND LARGE SHRUBS are fairly dependable bloomers, though flowers will be sparse in dry years. Creosote bush (Larrea tridentata) andwhitethorn acacia (Acacia constricta,shown here) both bloom mainly in spring and sometimes again in summer. Blue palo verde (Cercidium floridum) turns bright yellow in late April, followed two weeks later by the much more abundant but paler yellow foothills palo verde (C. microphyllum). Desert ironwood trees (Olneya tesota) bloom heavily about every other year with masses of lavender flowers, usually in late May. The abundant ocotillo reliably produces spikes of red flowers throughout April. These species bloom about two weeks earlier in western Arizona.
SUMMARY If you want to see the famous carpets of color, keep abreast of local news from Palm Springs to Tucson and from Death Valley to northern Mexico. Begin checking in late February and be ready to travel on short notice. You ll find masses of annuals somewhere in this area about once every three or four years. If you want dependability and will settle for less quantity, success is almost guaranteed in the middle half of April.
© 2016 Arizona-Sonora Desert Museum 14/17
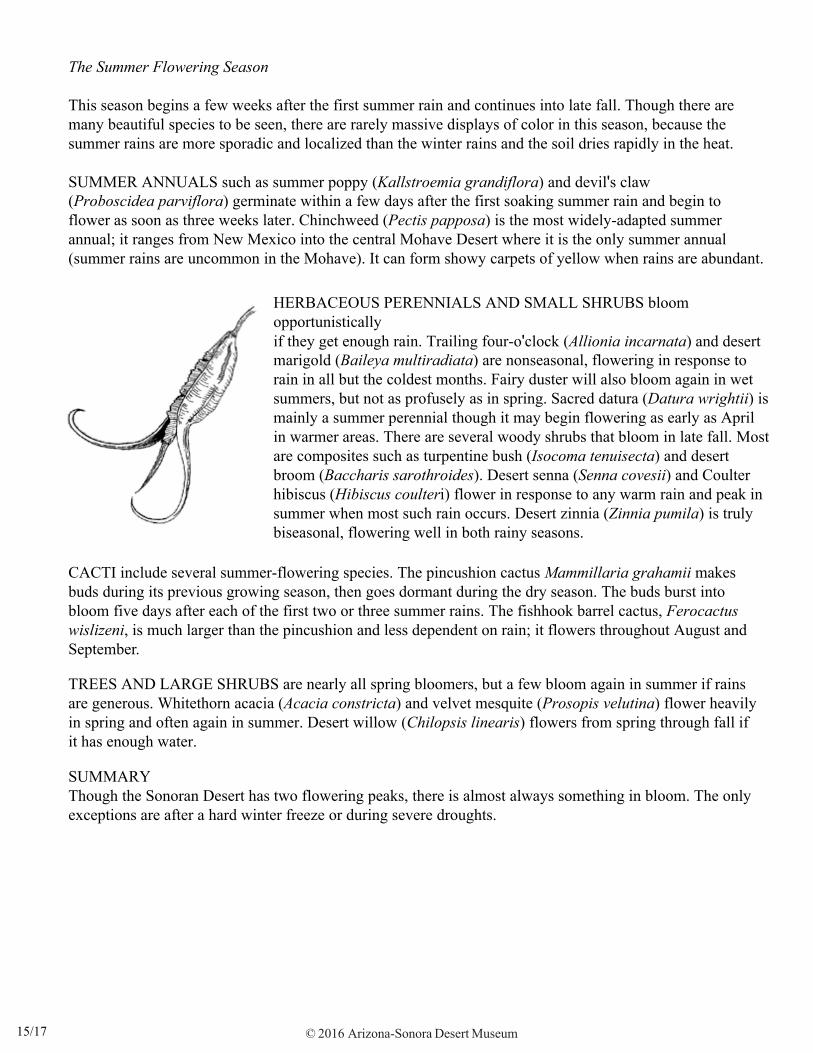
The Summer Flowering Season
This season begins a few weeks after the first summer rain and continues into late fall. Though there are many beautiful species to be seen, there are rarely massive displays of color in this season, because the summer rains are more sporadic and localized than the winter rains and the soil dries rapidly in the heat.
SUMMER ANNUALS such as summer poppy (Kallstroemia grandiflora) and devil's claw(Proboscidea parviflora) germinate within a few days after the first soaking summer rain and begin to flower as soon as three weeks later. Chinchweed (Pectis papposa) is the most widely-adapted summer annual; it ranges from New Mexico into the central Mohave Desert where it is the only summer annual (summer rains are uncommon in the Mohave). It can form showy carpets of yellow when rains are abundant.
HERBACEOUS PERENNIALS AND SMALL SHRUBS bloom opportunisticallyif they get enough rain. Trailing four-o'clock (Allionia incarnata) and desert marigold (Baileya multiradiata) are nonseasonal, flowering in response to rain in all but the coldest months. Fairy duster will also bloom again in wet summers, but not as profusely as in spring. Sacred datura (Datura wrightii) is mainly a summer perennial though it may begin flowering as early as April in warmer areas. There are several woody shrubs that bloom in late fall. Most are composites such as turpentine bush (Isocoma tenuisecta) and desert broom (Baccharis sarothroides). Desert senna (Senna covesii) and Coulter hibiscus (Hibiscus coulteri) flower in response to any warm rain and peak in summer when most such rain occurs. Desert zinnia (Zinnia pumila) is truly biseasonal, flowering well in both rainy seasons.
CACTI include several summer-flowering species. The pincushion cactus Mammillaria grahamii makes buds during its previous growing season, then goes dormant during the dry season. The buds burst into bloom five days after each of the first two or three summer rains. The fishhook barrel cactus, Ferocactus wislizeni, is much larger than the pincushion and less dependent on rain; it flowers throughout August and September.
TREES AND LARGE SHRUBS are nearly all spring bloomers, but a few bloom again in summer if rains are generous. Whitethorn acacia (Acacia constricta) and velvet mesquite (Prosopis velutina) flower heavily in spring and often again in summer. Desert willow (Chilopsis linearis) flowers from spring through fall if it has enough water.
SUMMARYThough the Sonoran Desert has two flowering peaks, there is almost always something in bloom. The only exceptions are after a hard winter freeze or during severe droughts.
© 2016 Arizona-Sonora Desert Museum 15/17
Predicting Wildflower Blooms
Desert annual wildflower blooms are nearly impossible to predict for two reasons. First, the necessary conditions are not precisely known. Second, many interacting variables affect the phenomenon. Here is what we do know:
• Spring-blooming annuals must germinate in the autumn. This is a crucial fact that most people don'tknow. The "critical window" is probably between late September and early December, but differswith different species. The controlling environmental factor is temperature.
• A triggering rain of at least one inch must occur during this autumn window, the earlier the betterafter summer heat has waned. Rains at other times will seldom trigger germination of the showy-flowered species.
• The triggering rain must be followed by regular rains totaling at least an inch per month throughMarch, a season total of at least five inches - seven or more are better
In short, a really good wildflower bloom requires both an unusually early and an unusually wet winter rainy season. The rains must also be well spaced. Spectacular, widespread shows occur about once in ten years in the Sonoran and Mohave deserts. Good or better displays occur in localized areas perhaps every three or four years; these may be in remote regions and go unnoticed.
However, even when all the above conditions are met, the bloom may be mediocre or poor. And occasionally a good bloom occurs when the above conditions appear not to have been met. The latter can happen when an unusually warm rain triggers germination in winter, but the short growing season usually precludes a really good show. Factors which are suspected of preventing a show include:
• a few weeks of warm, windy weather; the water stress triggers premature flowering;• a cold winter that retards growth of the seedlings;• high population levels of herbivores: rodents, rabbits, quail, or insects; and a wet preceding summer,
resulting in thick growth of summer vegetation, which in turn prevents germination of winterannuals.
When it does happen, the peak typically lasts only two weeks at a given location, sometime between late February and mid April. Most often it happens in early to mid March.
Furthermore, only certain areas ever have mass displays; soil type and vegetation cover are important factors. The rocky and densely-vegetated Tucson Mountains rarely if ever have massblooms, whereas Picacho Peak and the Tohono O'odham (Papago) Indian Reservation do fairly regularly.
The above information pertains only to annual wildflowers such as poppies, lupines, andowl-clover. Perennials are less fussy about the timing of rainfall. Thus a late but wet rainy season can still produce good blooms of penstemon, larkspur, brittlebush, and other perennials. Some plants such as palo verdes, ocotillo, and most cacti flower nearly every year regardless of rainfall. But it is the annuals alone that produce the desert's famous carpets of color.
© 2016 Arizona-Sonora Desert Museum 16/17
The Invisible Larder
I conducted a wildlife survey in the Lower Colorado River Valley in the 1970s. The site had received almost no biologically effective rainfall for three years. Creosote bushes were almost the only plants present; they were widely-spaced and had shed most of their leaves. Yet in the kilometer (6/10 mile) long by fifty meter (150 foot) wide transect I trapped one pocket mouse overnight, and in the morning observed a whiptail lizard, a rock wren, and two black-throated sparrows. These are all resident species; not transitory migrants. What were they living on?
A persistent, large soil seed bank is an extremely important resource in arid habitats. It provides an unseen (by humans) food source for desert animals as well as survival insurance for plant species. The greater density of seed-eating animals and the abundance of decomposing microbes in the moist soils of wetter regions greatly shortens the viability of seeds. In deserts, viable and nutritious seeds persist in large numbers through decades of drought. After a wet year there may be 200,000 seeds per square meter (square yard) of soil. Even after several dry years with little or no additional seed production there are still several thousand seeds per square meter, enough to sustain low populations of seed-eaters such as harvester ants, kangaroo rats, and sparrows. The whiptail was foraging for insects that fed on the seeds or plant detritus (partially decomposed organic matter) in the soil. As the statistician in the movie 'Jurassic Park' said, "Life will find a way".
Additional Readings
Bowers, Janice E. A full life in a small place and other essays from a desert garden. Tucson, University of Arizona Press, 1993.
Buchmann, Steven L. and Gary P. Nabhan. The Forgotten Pollinators. Washington, D.C.: Island Press, 1996.
Dykinga, Jack W. and Charles Bowden. The Sonoran Desert. NY: Harry N. Abrams, 1992.
Hanson, Roseann Beggy and Jonathan Hanson. Southern Arizona Nature Almanac. Boulder: Pruett Publishing Co, 1996.
Hartmann, William K. Desert Heart: Chronicles of the Sonoran Desert. Tucson: Fisher Books, 1989.
Imes, Rick. 1990. The practical botanist: An essential field guide to studying, classifying, and collecting plants. New York: Fireside Books/Simon and Schuster, 1990.
Larson, Gary. There's a Hair in My Dirt! A Worm's Story. New York: Harper-Collins, 1998.*
Nabhan, Gary P. Gathering the Desert. Tucson: University of Arizona Press, 1985.
The desert smells like rain. San Francisco: North Point Press, 1982.
Seuss, Dr. The Lorax. New York: Random House, 1971.*
* Though these two books are found in childrens literature, they convey the essence of ecology better thanany scientific treatise I have encountered.
© 2016 Arizona-Sonora Desert Museum 17/17
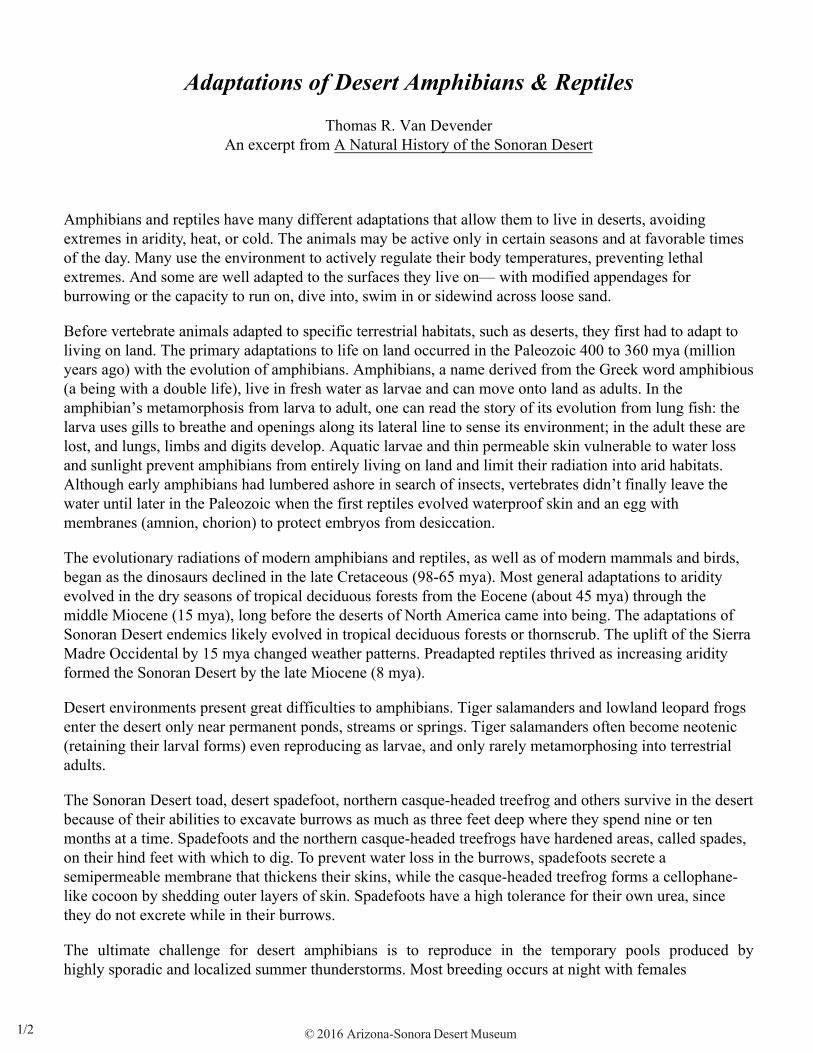
Adaptations of Desert Amphibians & Reptiles
Thomas R. Van DevenderAn excerpt from A Natural History of the Sonoran Desert
Amphibians and reptiles have many different adaptations that allow them to live in deserts, avoiding extremes in aridity, heat, or cold. The animals may be active only in certain seasons and at favorable times of the day. Many use the environment to actively regulate their body temperatures, preventing lethal extremes. And some are well adapted to the surfaces they live on— with modified appendages for burrowing or the capacity to run on, dive into, swim in or sidewind across loose sand.
Before vertebrate animals adapted to specific terrestrial habitats, such as deserts, they first had to adapt to living on land. The primary adaptations to life on land occurred in the Paleozoic 400 to 360 mya (million years ago) with the evolution of amphibians. Amphibians, a name derived from the Greek word amphibious (a being with a double life), live in fresh water as larvae and can move onto land as adults. In the amphibian’s metamorphosis from larva to adult, one can read the story of its evolution from lung fish: the larva uses gills to breathe and openings along its lateral line to sense its environment; in the adult these are lost, and lungs, limbs and digits develop. Aquatic larvae and thin permeable skin vulnerable to water loss and sunlight prevent amphibians from entirely living on land and limit their radiation into arid habitats. Although early amphibians had lumbered ashore in search of insects, vertebrates didn’t finally leave the water until later in the Paleozoic when the first reptiles evolved waterproof skin and an egg with membranes (amnion, chorion) to protect embryos from desiccation.
The evolutionary radiations of modern amphibians and reptiles, as well as of modern mammals and birds, began as the dinosaurs declined in the late Cretaceous (98-65 mya). Most general adaptations to aridity evolved in the dry seasons of tropical deciduous forests from the Eocene (about 45 mya) through the middle Miocene (15 mya), long before the deserts of North America came into being. The adaptations of Sonoran Desert endemics likely evolved in tropical deciduous forests or thornscrub. The uplift of the Sierra Madre Occidental by 15 mya changed weather patterns. Preadapted reptiles thrived as increasing aridity formed the Sonoran Desert by the late Miocene (8 mya).
Desert environments present great difficulties to amphibians. Tiger salamanders and lowland leopard frogs enter the desert only near permanent ponds, streams or springs. Tiger salamanders often become neotenic (retaining their larval forms) even reproducing as larvae, and only rarely metamorphosing into terrestrial adults.
The Sonoran Desert toad, desert spadefoot, northern casque-headed treefrog and others survive in the desert because of their abilities to excavate burrows as much as three feet deep where they spend nine or ten months at a time. Spadefoots and the northern casque-headed treefrogs have hardened areas, called spades, on their hind feet with which to dig. To prevent water loss in the burrows, spadefoots secrete a semipermeable membrane that thickens their skins, while the casque-headed treefrog forms a cellophane-like cocoon by shedding outer layers of skin. Spadefoots have a high tolerance for their own urea, since they do not excrete while in their burrows.
The ultimate challenge for desert amphibians is to reproduce in the temporary pools produced by highly sporadic and localized summer thunderstorms. Most breeding occurs at night with females
© 2016 Arizona-Sonora Desert Museum 1/2
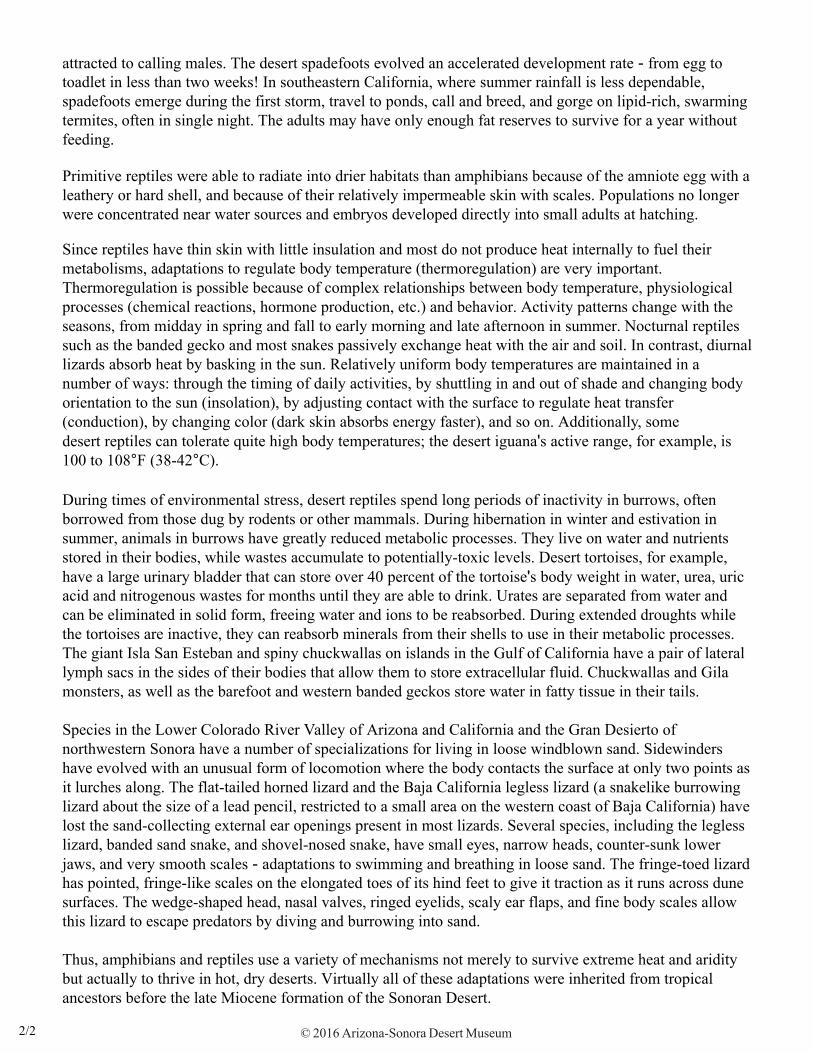
attracted to calling males. The desert spadefoots evolved an accelerated development rate - from egg to toadlet in less than two weeks! In southeastern California, where summer rainfall is less dependable, spadefoots emerge during the first storm, travel to ponds, call and breed, and gorge on lipid-rich, swarming termites, often in single night. The adults may have only enough fat reserves to survive for a year without feeding.
Primitive reptiles were able to radiate into drier habitats than amphibians because of the amniote egg with a leathery or hard shell, and because of their relatively impermeable skin with scales. Populations no longer were concentrated near water sources and embryos developed directly into small adults at hatching.
Since reptiles have thin skin with little insulation and most do not produce heat internally to fuel their metabolisms, adaptations to regulate body temperature (thermoregulation) are very important. Thermoregulation is possible because of complex relationships between body temperature, physiological processes (chemical reactions, hormone production, etc.) and behavior. Activity patterns change with the seasons, from midday in spring and fall to early morning and late afternoon in summer. Nocturnal reptiles such as the banded gecko and most snakes passively exchange heat with the air and soil. In contrast, diurnal lizards absorb heat by basking in the sun. Relatively uniform body temperatures are maintained in a number of ways: through the timing of daily activities, by shuttling in and out of shade and changing body orientation to the sun (insolation), by adjusting contact with the surface to regulate heat transfer (conduction), by changing color (dark skin absorbs energy faster), and so on. Additionally, somedesert reptiles can tolerate quite high body temperatures; the desert iguana's active range, for example, is 100 to 108°F (38-42°C).
During times of environmental stress, desert reptiles spend long periods of inactivity in burrows, often borrowed from those dug by rodents or other mammals. During hibernation in winter and estivation in summer, animals in burrows have greatly reduced metabolic processes. They live on water and nutrients stored in their bodies, while wastes accumulate to potentially-toxic levels. Desert tortoises, for example, have a large urinary bladder that can store over 40 percent of the tortoise's body weight in water, urea, uric acid and nitrogenous wastes for months until they are able to drink. Urates are separated from water and can be eliminated in solid form, freeing water and ions to be reabsorbed. During extended droughts while the tortoises are inactive, they can reabsorb minerals from their shells to use in their metabolic processes. The giant Isla San Esteban and spiny chuckwallas on islands in the Gulf of California have a pair of lateral lymph sacs in the sides of their bodies that allow them to store extracellular fluid. Chuckwallas and Gila monsters, as well as the barefoot and western banded geckos store water in fatty tissue in their tails.
Species in the Lower Colorado River Valley of Arizona and California and the Gran Desierto of northwestern Sonora have a number of specializations for living in loose windblown sand. Sidewinders have evolved with an unusual form of locomotion where the body contacts the surface at only two points as it lurches along. The flat-tailed horned lizard and the Baja California legless lizard (a snakelike burrowing lizard about the size of a lead pencil, restricted to a small area on the western coast of Baja California) have lost the sand-collecting external ear openings present in most lizards. Several species, including the legless lizard, banded sand snake, and shovel-nosed snake, have small eyes, narrow heads, counter-sunk lower jaws, and very smooth scales - adaptations to swimming and breathing in loose sand. The fringe-toed lizard has pointed, fringe-like scales on the elongated toes of its hind feet to give it traction as it runs across dune surfaces. The wedge-shaped head, nasal valves, ringed eyelids, scaly ear flaps, and fine body scales allow this lizard to escape predators by diving and burrowing into sand.
Thus, amphibians and reptiles use a variety of mechanisms not merely to survive extreme heat and aridity but actually to thrive in hot, dry deserts. Virtually all of these adaptations were inherited from tropical ancestors before the late Miocene formation of the Sonoran Desert.
© 2016 Arizona-Sonora Desert Museum 2/2
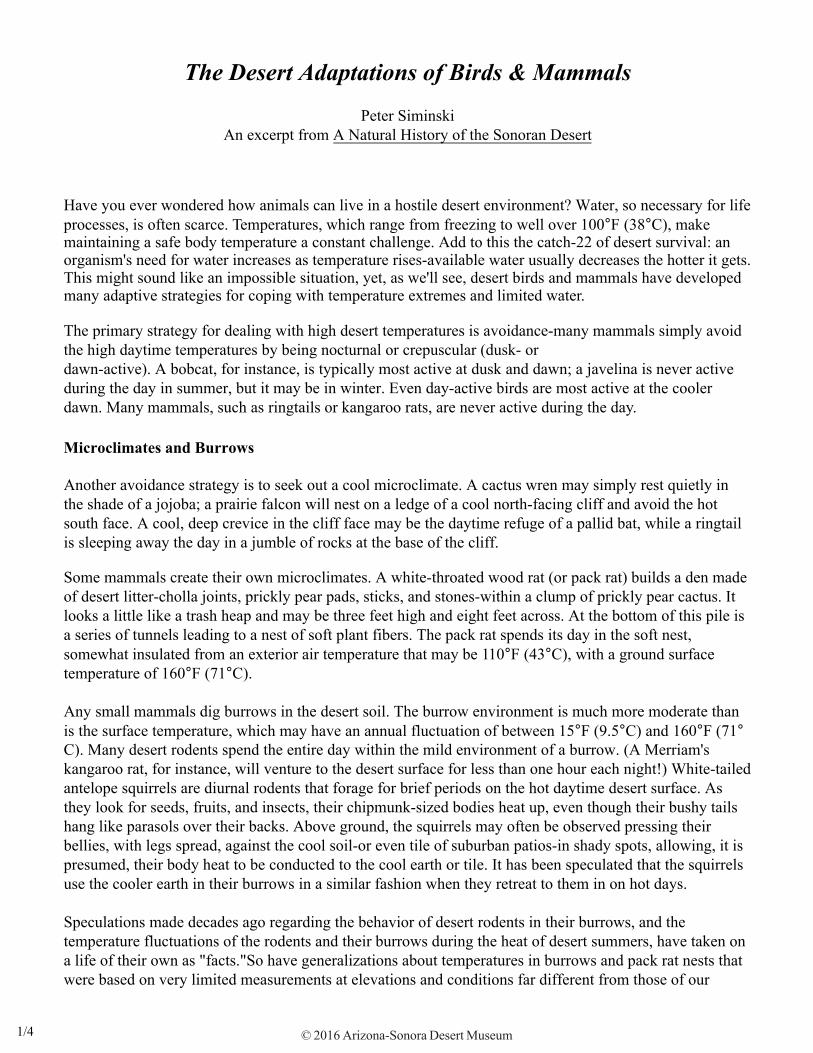
The Desert Adaptations of Birds & Mammals
Peter SiminskiAn excerpt from A Natural History of the Sonoran Desert
Have you ever wondered how animals can live in a hostile desert environment? Water, so necessary for life processes, is often scarce. Temperatures, which range from freezing to well over 100°F (38°C), make maintaining a safe body temperature a constant challenge. Add to this the catch-22 of desert survival: an organism's need for water increases as temperature rises-available water usually decreases the hotter it gets. This might sound like an impossible situation, yet, as we'll see, desert birds and mammals have developed many adaptive strategies for coping with temperature extremes and limited water.
The primary strategy for dealing with high desert temperatures is avoidance-many mammals simply avoid the high daytime temperatures by being nocturnal or crepuscular (dusk- ordawn-active). A bobcat, for instance, is typically most active at dusk and dawn; a javelina is never active during the day in summer, but it may be in winter. Even day-active birds are most active at the cooler dawn. Many mammals, such as ringtails or kangaroo rats, are never active during the day.
Microclimates and Burrows
Another avoidance strategy is to seek out a cool microclimate. A cactus wren may simply rest quietly in the shade of a jojoba; a prairie falcon will nest on a ledge of a cool north-facing cliff and avoid the hot south face. A cool, deep crevice in the cliff face may be the daytime refuge of a pallid bat, while a ringtail is sleeping away the day in a jumble of rocks at the base of the cliff.
Some mammals create their own microclimates. A white-throated wood rat (or pack rat) builds a den made of desert litter-cholla joints, prickly pear pads, sticks, and stones-within a clump of prickly pear cactus. It looks a little like a trash heap and may be three feet high and eight feet across. At the bottom of this pile is a series of tunnels leading to a nest of soft plant fibers. The pack rat spends its day in the soft nest, somewhat insulated from an exterior air temperature that may be 110°F (43°C), with a ground surface temperature of 160°F (71°C).
Any small mammals dig burrows in the desert soil. The burrow environment is much more moderate than is the surface temperature, which may have an annual fluctuation of between 15°F (9.5°C) and 160°F (71°C). Many desert rodents spend the entire day within the mild environment of a burrow. (A Merriam's kangaroo rat, for instance, will venture to the desert surface for less than one hour each night!) White-tailed antelope squirrels are diurnal rodents that forage for brief periods on the hot daytime desert surface. As they look for seeds, fruits, and insects, their chipmunk-sized bodies heat up, even though their bushy tails hang like parasols over their backs. Above ground, the squirrels may often be observed pressing their bellies, with legs spread, against the cool soil-or even tile of suburban patios-in shady spots, allowing, it is presumed, their body heat to be conducted to the cool earth or tile. It has been speculated that the squirrels use the cooler earth in their burrows in a similar fashion when they retreat to them in on hot days.
Speculations made decades ago regarding the behavior of desert rodents in their burrows, and the temperature fluctuations of the rodents and their burrows during the heat of desert summers, have taken on a life of their own as "facts."So have generalizations about temperatures in burrows and pack rat nests that were based on very limited measurements at elevations and conditions far different from those of our
© 2016 Arizona-Sonora Desert Museum 1/4
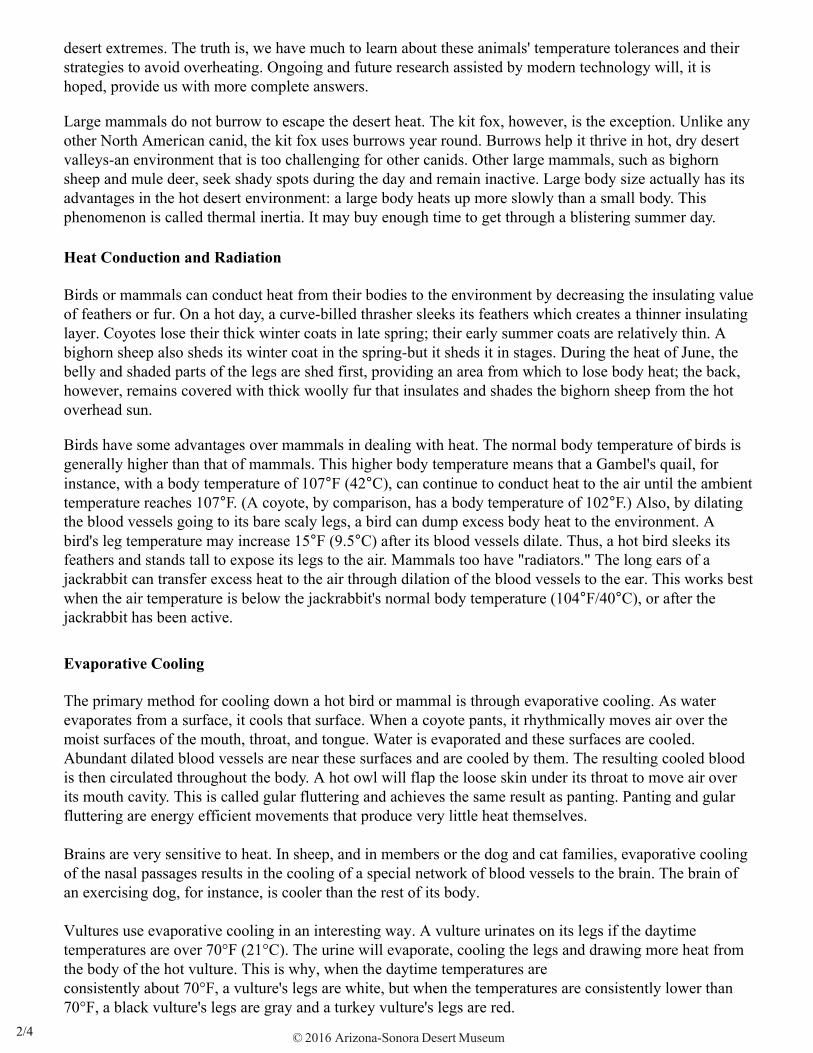
desert extremes. The truth is, we have much to learn about these animals' temperature tolerances and their strategies to avoid overheating. Ongoing and future research assisted by modern technology will, it is hoped, provide us with more complete answers.
Large mammals do not burrow to escape the desert heat. The kit fox, however, is the exception. Unlike any other North American canid, the kit fox uses burrows year round. Burrows help it thrive in hot, dry desert valleys-an environment that is too challenging for other canids. Other large mammals, such as bighorn sheep and mule deer, seek shady spots during the day and remain inactive. Large body size actually has its advantages in the hot desert environment: a large body heats up more slowly than a small body. This phenomenon is called thermal inertia. It may buy enough time to get through a blistering summer day.
Heat Conduction and Radiation
Birds or mammals can conduct heat from their bodies to the environment by decreasing the insulating value of feathers or fur. On a hot day, a curve-billed thrasher sleeks its feathers which creates a thinner insulating layer. Coyotes lose their thick winter coats in late spring; their early summer coats are relatively thin. A bighorn sheep also sheds its winter coat in the spring-but it sheds it in stages. During the heat of June, the belly and shaded parts of the legs are shed first, providing an area from which to lose body heat; the back, however, remains covered with thick woolly fur that insulates and shades the bighorn sheep from the hot overhead sun.
Birds have some advantages over mammals in dealing with heat. The normal body temperature of birds is generally higher than that of mammals. This higher body temperature means that a Gambel's quail, for instance, with a body temperature of 107°F (42°C), can continue to conduct heat to the air until the ambient temperature reaches 107°F. (A coyote, by comparison, has a body temperature of 102°F.) Also, by dilating the blood vessels going to its bare scaly legs, a bird can dump excess body heat to the environment. A bird's leg temperature may increase 15°F (9.5°C) after its blood vessels dilate. Thus, a hot bird sleeks its feathers and stands tall to expose its legs to the air. Mammals too have "radiators." The long ears of a jackrabbit can transfer excess heat to the air through dilation of the blood vessels to the ear. This works bestwhen the air temperature is below the jackrabbit's normal body temperature (104°F/40°C), or after the jackrabbit has been active.
Evaporative Cooling
The primary method for cooling down a hot bird or mammal is through evaporative cooling. As water evaporates from a surface, it cools that surface. When a coyote pants, it rhythmically moves air over the moist surfaces of the mouth, throat, and tongue. Water is evaporated and these surfaces are cooled. Abundant dilated blood vessels are near these surfaces and are cooled by them. The resulting cooled blood is then circulated throughout the body. A hot owl will flap the loose skin under its throat to move air over its mouth cavity. This is called gular fluttering and achieves the same result as panting. Panting and gular fluttering are energy efficient movements that produce very little heat themselves.
Brains are very sensitive to heat. In sheep, and in members or the dog and cat families, evaporative cooling of the nasal passages results in the cooling of a special network of blood vessels to the brain. The brain of an exercising dog, for instance, is cooler than the rest of its body.
Vultures use evaporative cooling in an interesting way. A vulture urinates on its legs if the daytimetemperatures are over 70°F (21°C). The urine will evaporate, cooling the legs and drawing more heat from the body of the hot vulture. This is why, when the daytime temperatures areconsistently about 70°F, a vulture's legs are white, but when the temperatures are consistently lower than 70°F, a black vulture's legs are gray and a turkey vulture's legs are red.
© 2016 Arizona-Sonora Desert Museum 2/4
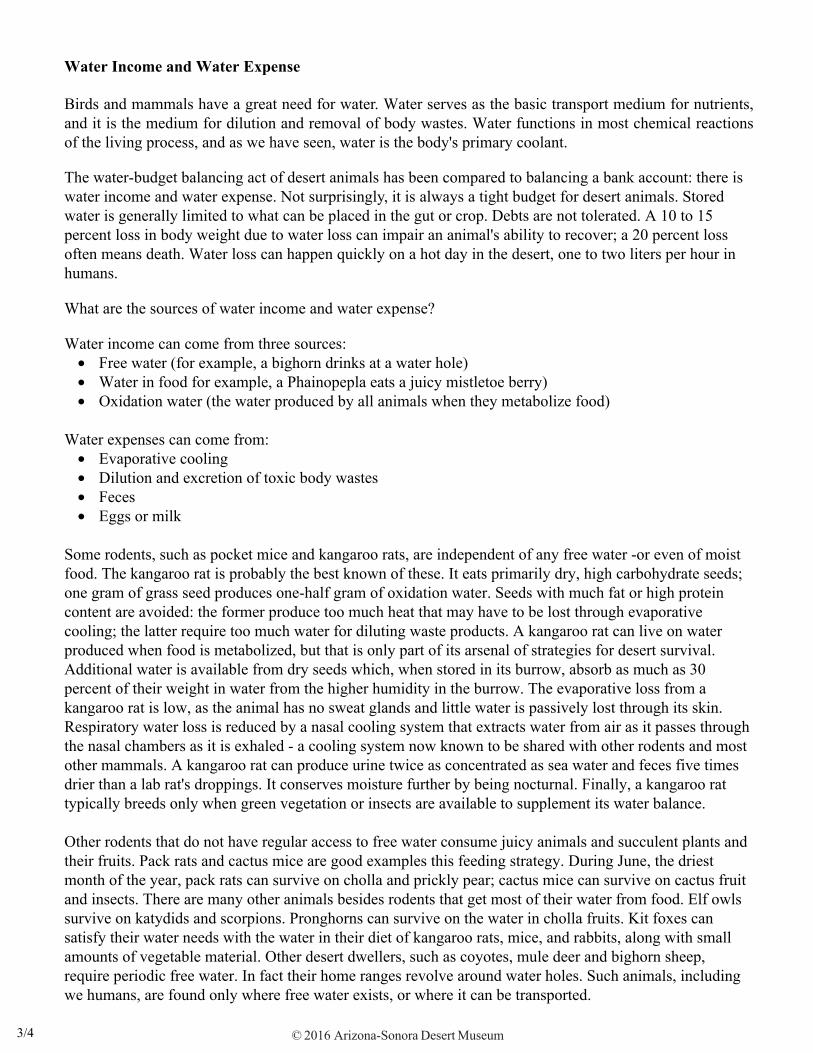
Water Income and Water Expense
Birds and mammals have a great need for water. Water serves as the basic transport medium for nutrients, and it is the medium for dilution and removal of body wastes. Water functions in most chemical reactions of the living process, and as we have seen, water is the body's primary coolant.
The water-budget balancing act of desert animals has been compared to balancing a bank account: there is water income and water expense. Not surprisingly, it is always a tight budget for desert animals. Stored water is generally limited to what can be placed in the gut or crop. Debts are not tolerated. A 10 to 15 percent loss in body weight due to water loss can impair an animal's ability to recover; a 20 percent loss often means death. Water loss can happen quickly on a hot day in the desert, one to two liters per hour in humans.
What are the sources of water income and water expense?
Water income can come from three sources:• Free water (for example, a bighorn drinks at a water hole)• Water in food for example, a Phainopepla eats a juicy mistletoe berry)• Oxidation water (the water produced by all animals when they metabolize food)
Water expenses can come from:• Evaporative cooling• Dilution and excretion of toxic body wastes• Feces• Eggs or milk
Some rodents, such as pocket mice and kangaroo rats, are independent of any free water -or even of moist food. The kangaroo rat is probably the best known of these. It eats primarily dry, high carbohydrate seeds; one gram of grass seed produces one-half gram of oxidation water. Seeds with much fat or high protein content are avoided: the former produce too much heat that may have to be lost through evaporative cooling; the latter require too much water for diluting waste products. A kangaroo rat can live on water produced when food is metabolized, but that is only part of its arsenal of strategies for desert survival. Additional water is available from dry seeds which, when stored in its burrow, absorb as much as 30 percent of their weight in water from the higher humidity in the burrow. The evaporative loss from a kangaroo rat is low, as the animal has no sweat glands and little water is passively lost through its skin. Respiratory water loss is reduced by a nasal cooling system that extracts water from air as it passes through the nasal chambers as it is exhaled - a cooling system now known to be shared with other rodents and most other mammals. A kangaroo rat can produce urine twice as concentrated as sea water and feces five times drier than a lab rat's droppings. It conserves moisture further by being nocturnal. Finally, a kangaroo rat typically breeds only when green vegetation or insects are available to supplement its water balance.
Other rodents that do not have regular access to free water consume juicy animals and succulent plants and their fruits. Pack rats and cactus mice are good examples this feeding strategy. During June, the driest month of the year, pack rats can survive on cholla and prickly pear; cactus mice can survive on cactus fruit and insects. There are many other animals besides rodents that get most of their water from food. Elf owls survive on katydids and scorpions. Pronghorns can survive on the water in cholla fruits. Kit foxes can satisfy their water needs with the water in their diet of kangaroo rats, mice, and rabbits, along with small amounts of vegetable material. Other desert dwellers, such as coyotes, mule deer and bighorn sheep, require periodic free water. In fact their home ranges revolve around water holes. Such animals, including we humans, are found only where free water exists, or where it can be transported.
© 2016 Arizona-Sonora Desert Museum 3/4
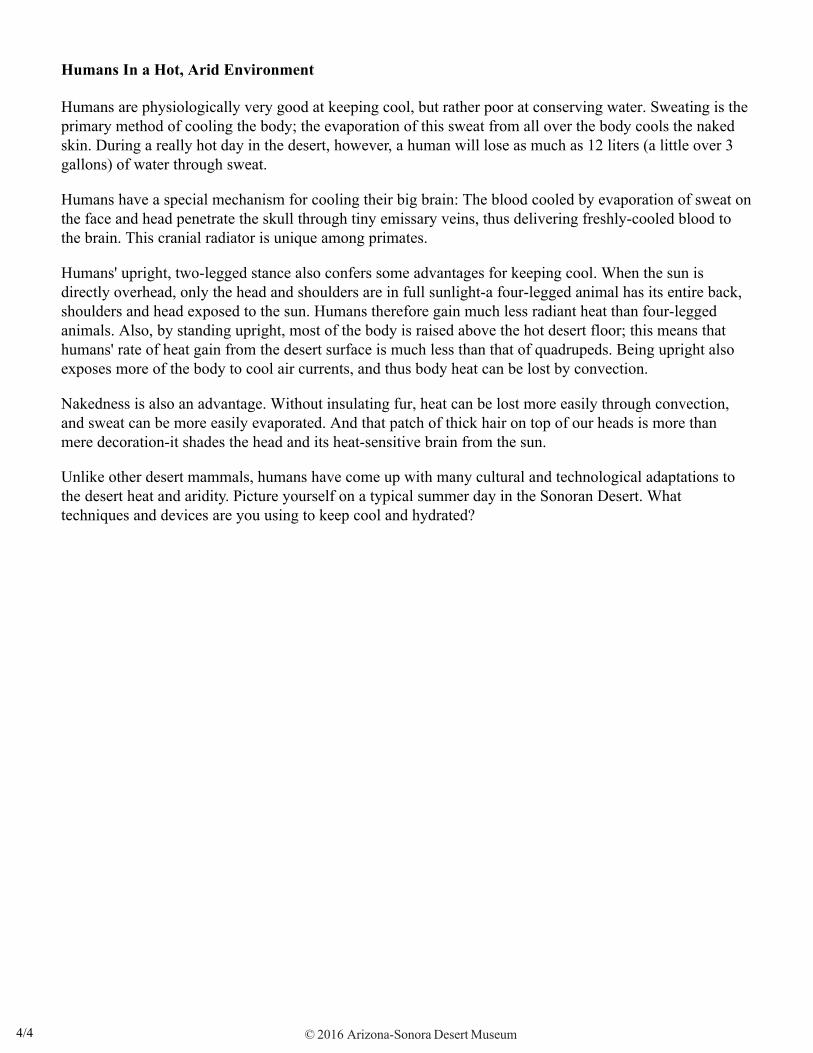
Humans In a Hot, Arid Environment
Humans are physiologically very good at keeping cool, but rather poor at conserving water. Sweating is the primary method of cooling the body; the evaporation of this sweat from all over the body cools the naked skin. During a really hot day in the desert, however, a human will lose as much as 12 liters (a little over 3 gallons) of water through sweat.
Humans have a special mechanism for cooling their big brain: The blood cooled by evaporation of sweat on the face and head penetrate the skull through tiny emissary veins, thus delivering freshly-cooled blood to the brain. This cranial radiator is unique among primates.
Humans' upright, two-legged stance also confers some advantages for keeping cool. When the sun is directly overhead, only the head and shoulders are in full sunlight-a four-legged animal has its entire back, shoulders and head exposed to the sun. Humans therefore gain much less radiant heat than four-legged animals. Also, by standing upright, most of the body is raised above the hot desert floor; this means that humans' rate of heat gain from the desert surface is much less than that of quadrupeds. Being upright also exposes more of the body to cool air currents, and thus body heat can be lost by convection.
Nakedness is also an advantage. Without insulating fur, heat can be lost more easily through convection, and sweat can be more easily evaporated. And that patch of thick hair on top of our heads is more than mere decoration-it shades the head and its heat-sensitive brain from the sun.
Unlike other desert mammals, humans have come up with many cultural and technological adaptations to the desert heat and aridity. Picture yourself on a typical summer day in the Sonoran Desert. What techniques and devices are you using to keep cool and hydrated?
© 2016 Arizona-Sonora Desert Museum 4/4

Culture and the Environment
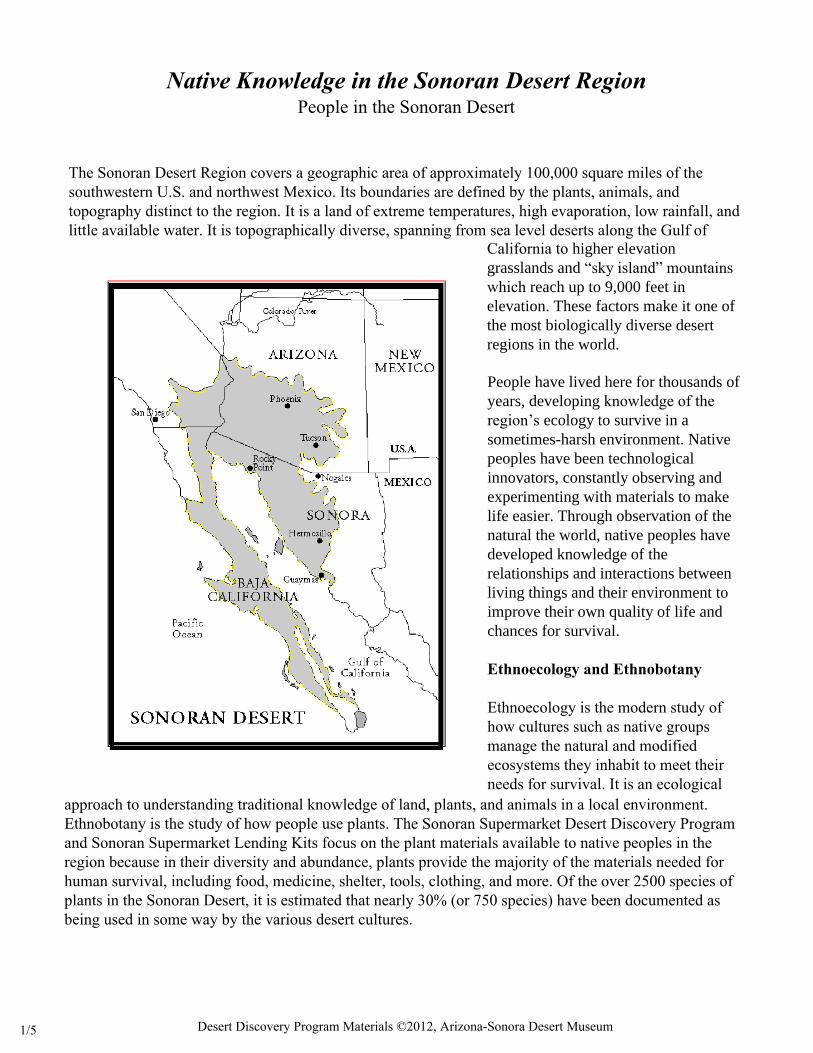
California to higher elevation
grasslands and “sky island” mountains
which reach up to 9,000 feet in
elevation. These factors make it one of
the most biologically diverse desert
regions in the world.
People have lived here for thousands of
years, developing knowledge of the
region’s ecology to survive in a
sometimes-harsh environment. Native
peoples have been technological
innovators, constantly observing and
experimenting with materials to make
life easier. Through observation of the
natural the world, native peoples have
developed knowledge of the
relationships and interactions between
living things and their environment to
improve their own quality of life and
chances for survival.
Ethnoecology and Ethnobotany
Ethnoecology is the modern study of how cultures such as native groups manage the natural and modified ecosystems they inhabit to meet their needs for survival. It is an ecological
Native Knowledge in the Sonoran Desert Region People in the Sonoran Desert
The Sonoran Desert Region covers a geographic area of approximately 100,000 square miles of the southwestern U.S. and northwest Mexico. Its boundaries are defined by the plants, animals, and topography distinct to the region. It is a land of extreme temperatures, high evaporation, low rainfall, and little available water. It is topographically diverse, spanning from sea level deserts along the Gulf of
approach to understanding traditional knowledge of land, plants, and animals in a local environment. Ethnobotany is the study of how people use plants. The Sonoran Supermarket Desert Discovery Program and Sonoran Supermarket Lending Kits focus on the plant materials available to native peoples in the region because in their diversity and abundance, plants provide the majority of the materials needed for human survival, including food, medicine, shelter, tools, clothing, and more. Of the over 2500 species of plants in the Sonoran Desert, it is estimated that nearly 30% (or 750 species) have been documented as being used in some way by the various desert cultures.
1/5 Desert Discovery Program Materials ©2012, Arizona-Sonora Desert Museum
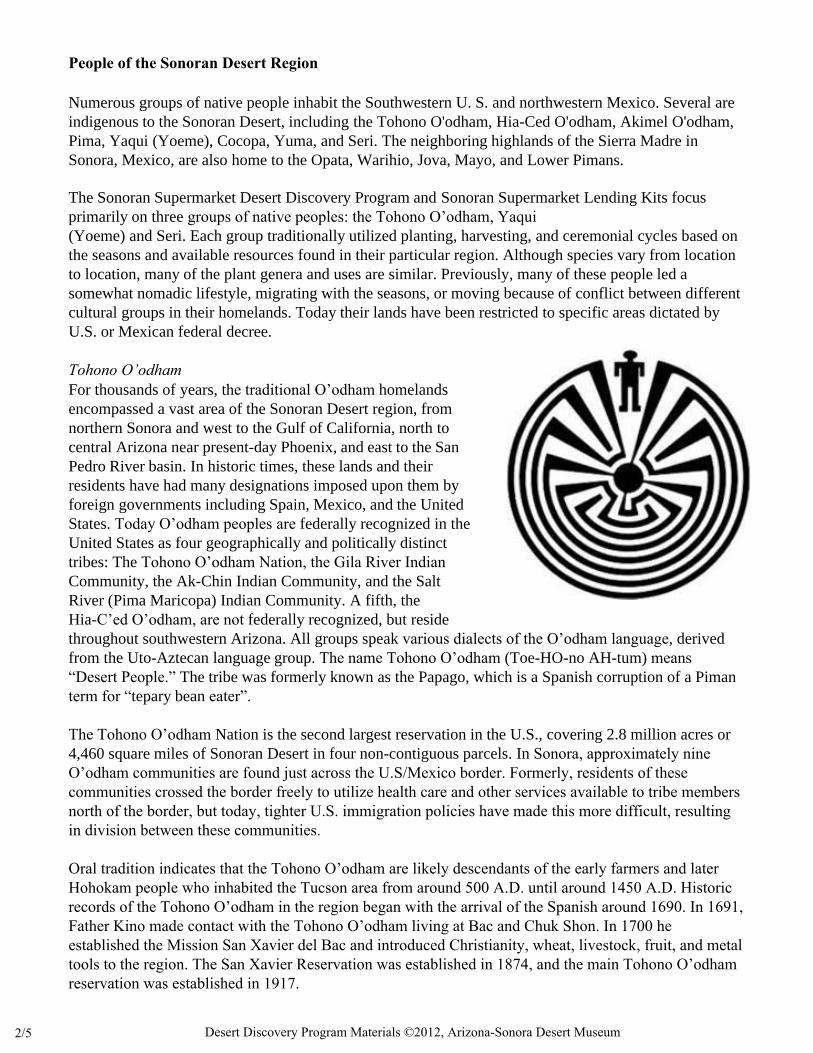
People of the Sonoran Desert Region
Numerous groups of native people inhabit the Southwestern U. S. and northwestern Mexico. Several are
indigenous to the Sonoran Desert, including the Tohono O'odham, Hia-Ced O'odham, Akimel O'odham,
Pima, Yaqui (Yoeme), Cocopa, Yuma, and Seri. The neighboring highlands of the Sierra Madre in
Sonora, Mexico, are also home to the Opata, Warihio, Jova, Mayo, and Lower Pimans.
The Sonoran Supermarket Desert Discovery Program and Sonoran Supermarket Lending Kits focus
primarily on three groups of native peoples: the Tohono O’odham, Yaqui
(Yoeme) and Seri. Each group traditionally utilized planting, harvesting, and ceremonial cycles based on
the seasons and available resources found in their particular region. Although species vary from location
to location, many of the plant genera and uses are similar. Previously, many of these people led a
somewhat nomadic lifestyle, migrating with the seasons, or moving because of conflict between different
cultural groups in their homelands. Today their lands have been restricted to specific areas dictated by
U.S. or Mexican federal decree.
Tohono O’odhamFor thousands of years, the traditional O’odham homelands
encompassed a vast area of the Sonoran Desert region, from
northern Sonora and west to the Gulf of California, north to
central Arizona near present-day Phoenix, and east to the San
Pedro River basin. In historic times, these lands and their
residents have had many designations imposed upon them by
foreign governments including Spain, Mexico, and the United
States. Today O’odham peoples are federally recognized in the
United States as four geographically and politically distinct
tribes: The Tohono O’odham Nation, the Gila River Indian
Community, the Ak-Chin Indian Community, and the Salt
River (Pima Maricopa) Indian Community. A fifth, the
Hia-C’ed O’odham, are not federally recognized, but reside
throughout southwestern Arizona. All groups speak various dialects of the O’odham language, derived
from the Uto-Aztecan language group. The name Tohono O’odham (Toe-HO-no AH-tum) means
“Desert People.” The tribe was formerly known as the Papago, which is a Spanish corruption of a Piman
term for “tepary bean eater”.
The Tohono O’odham Nation is the second largest reservation in the U.S., covering 2.8 million acres or
4,460 square miles of Sonoran Desert in four non-contiguous parcels. In Sonora, approximately nine O’odham communities are found just across the U.S/Mexico border. Formerly, residents of these communities crossed the border freely to utilize health care and other services available to tribe members north of the border, but today, tighter U.S. immigration policies have made this more difficult, resulting in division between these communities.
Oral tradition indicates that the Tohono O’odham are likely descendants of the early farmers and later Hohokam people who inhabited the Tucson area from around 500 A.D. until around 1450 A.D. Historic records of the Tohono O’odham in the region began with the arrival of the Spanish around 1690. In 1691, Father Kino made contact with the Tohono O’odham living at Bac and Chuk Shon. In 1700 he established the Mission San Xavier del Bac and introduced Christianity, wheat, livestock, fruit, and metal tools to the region. The San Xavier Reservation was established in 1874, and the main Tohono O’odham reservation was established in 1917.
2/5 Desert Discovery Program Materials ©2012, Arizona-Sonora Desert Museum
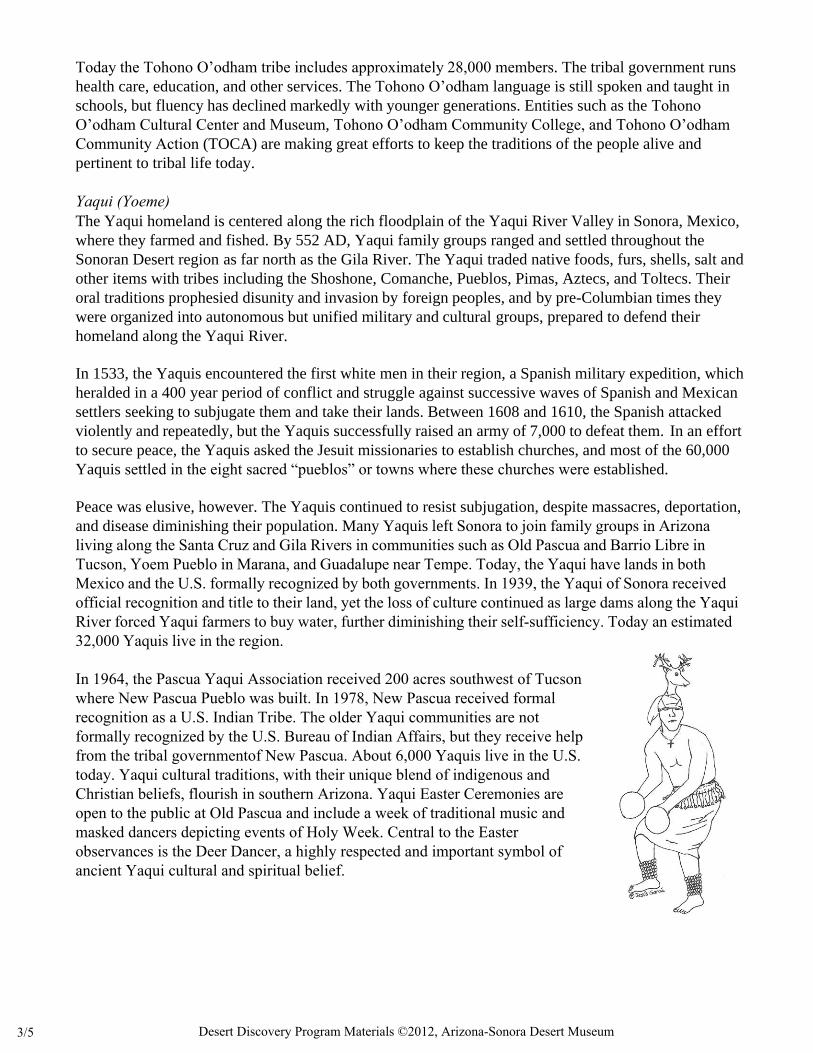
Today the Tohono O’odham tribe includes approximately 28,000 members. The tribal government runs
health care, education, and other services. The Tohono O’odham language is still spoken and taught in
schools, but fluency has declined markedly with younger generations. Entities such as the Tohono
O’odham Cultural Center and Museum, Tohono O’odham Community College, and Tohono O’odham
Community Action (TOCA) are making great efforts to keep the traditions of the people alive and
pertinent to tribal life today.
Yaqui (Yoeme) The Yaqui homeland is centered along the rich floodplain of the Yaqui River Valley in Sonora, Mexico,
where they farmed and fished. By 552 AD, Yaqui family groups ranged and settled throughout the
Sonoran Desert region as far north as the Gila River. The Yaqui traded native foods, furs, shells, salt and
other items with tribes including the Shoshone, Comanche, Pueblos, Pimas, Aztecs, and Toltecs. Their
oral traditions prophesied disunity and invasion by foreign peoples, and by pre-Columbian times they
were organized into autonomous but unified military and cultural groups, prepared to defend their
homeland along the Yaqui River.
In 1533, the Yaquis encountered the first white men in their region, a Spanish military expedition, which
heralded in a 400 year period of conflict and struggle against successive waves of Spanish and Mexican
settlers seeking to subjugate them and take their lands. Between 1608 and 1610, the Spanish attacked
violently and repeatedly, but the Yaquis successfully raised an army of 7,000 to defeat them. In an effort
to secure peace, the Yaquis asked the Jesuit missionaries to establish churches, and most of the 60,000
Yaquis settled in the eight sacred “pueblos” or towns where these churches were established.
Peace was elusive, however. The Yaquis continued to resist subjugation, despite massacres, deportation,
and disease diminishing their population. Many Yaquis left Sonora to join family groups in Arizona living along the Santa Cruz and Gila Rivers in communities such as Old Pascua and Barrio Libre in Tucson, Yoem Pueblo in Marana, and Guadalupe near Tempe. Today, the Yaqui have lands in both Mexico and the U.S. formally recognized by both governments. In 1939, the Yaqui of Sonora received official recognition and title to their land, yet the loss of culture continued as large dams along the Yaqui River forced Yaqui farmers to buy water, further diminishing their self-sufficiency. Today an estimated 32,000 Yaquis live in the region.
In 1964, the Pascua Yaqui Association received 200 acres southwest of Tucson where New Pascua Pueblo was built. In 1978, New Pascua received formal recognition as a U.S. Indian Tribe. The older Yaqui communities are not formally recognized by the U.S. Bureau of Indian Affairs, but they receive help from the tribal governmentof New Pascua. About 6,000 Yaquis live in the U.S. today. Yaqui cultural traditions, with their unique blend of indigenous and Christian beliefs, flourish in southern Arizona. Yaqui Easter Ceremonies are open to the public at Old Pascua and include a week of traditional music and masked dancers depicting events of Holy Week. Central to the Easter observances is the Deer Dancer, a highly respected and important symbol of ancient Yaqui cultural and spiritual belief.
3/5 Desert Discovery Program Materials ©2012, Arizona-Sonora Desert Museum
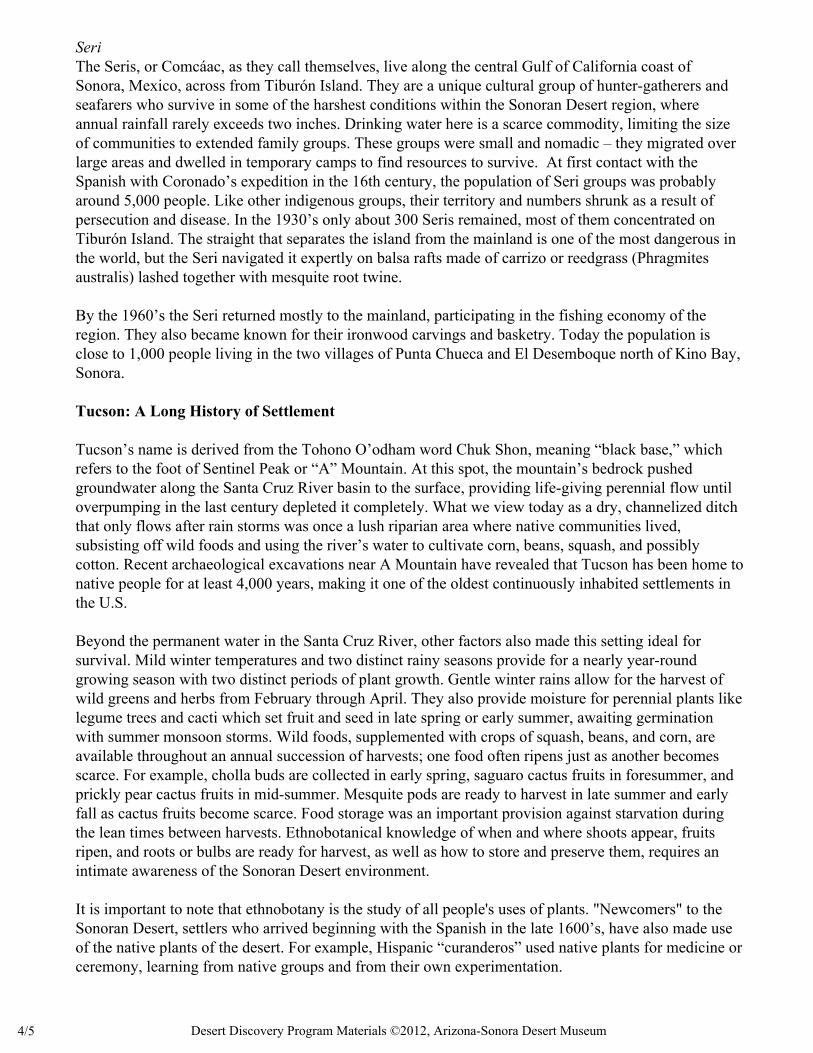
Seri The Seris, or Comcáac, as they call themselves, live along the central Gulf of California coast of Sonora, Mexico, across from Tiburón Island. They are a unique cultural group of hunter-gatherers and seafarers who survive in some of the harshest conditions within the Sonoran Desert region, where annual rainfall rarely exceeds two inches. Drinking water here is a scarce commodity, limiting the size of communities to extended family groups. These groups were small and nomadic – they migrated over large areas and dwelled in temporary camps to find resources to survive. At first contact with the Spanish with Coronado’s expedition in the 16th century, the population of Seri groups was probably around 5,000 people. Like other indigenous groups, their territory and numbers shrunk as a result of persecution and disease. In the 1930’s only about 300 Seris remained, most of them concentrated on Tiburón Island. The straight that separates the island from the mainland is one of the most dangerous in the world, but the Seri navigated it expertly on balsa rafts made of carrizo or reedgrass (Phragmites australis) lashed together with mesquite root twine.
By the 1960’s the Seri returned mostly to the mainland, participating in the fishing economy of the region. They also became known for their ironwood carvings and basketry. Today the population is close to 1,000 people living in the two villages of Punta Chueca and El Desemboque north of Kino Bay, Sonora.
Tucson: A Long History of Settlement
Tucson’s name is derived from the Tohono O’odham word Chuk Shon, meaning “black base,” which refers to the foot of Sentinel Peak or “A” Mountain. At this spot, the mountain’s bedrock pushed groundwater along the Santa Cruz River basin to the surface, providing life-giving perennial flow until overpumping in the last century depleted it completely. What we view today as a dry, channelized ditch that only flows after rain storms was once a lush riparian area where native communities lived, subsisting off wild foods and using the river’s water to cultivate corn, beans, squash, and possibly cotton. Recent archaeological excavations near A Mountain have revealed that Tucson has been home to native people for at least 4,000 years, making it one of the oldest continuously inhabited settlements in the U.S.
Beyond the permanent water in the Santa Cruz River, other factors also made this setting ideal for survival. Mild winter temperatures and two distinct rainy seasons provide for a nearly year-round growing season with two distinct periods of plant growth. Gentle winter rains allow for the harvest of wild greens and herbs from February through April. They also provide moisture for perennial plants like legume trees and cacti which set fruit and seed in late spring or early summer, awaiting germination with summer monsoon storms. Wild foods, supplemented with crops of squash, beans, and corn, are available throughout an annual succession of harvests; one food often ripens just as another becomes scarce. For example, cholla buds are collected in early spring, saguaro cactus fruits in foresummer, and prickly pear cactus fruits in mid-summer. Mesquite pods are ready to harvest in late summer and early fall as cactus fruits become scarce. Food storage was an important provision against starvation during the lean times between harvests. Ethnobotanical knowledge of when and where shoots appear, fruits ripen, and roots or bulbs are ready for harvest, as well as how to store and preserve them, requires an intimate awareness of the Sonoran Desert environment.
It is important to note that ethnobotany is the study of all people's uses of plants. "Newcomers" to the Sonoran Desert, settlers who arrived beginning with the Spanish in the late 1600’s, have also made use of the native plants of the desert. For example, Hispanic “curanderos” used native plants for medicine or ceremony, learning from native groups and from their own experimentation.
4/5 Desert Discovery Program Materials ©2012, Arizona-Sonora Desert Museum
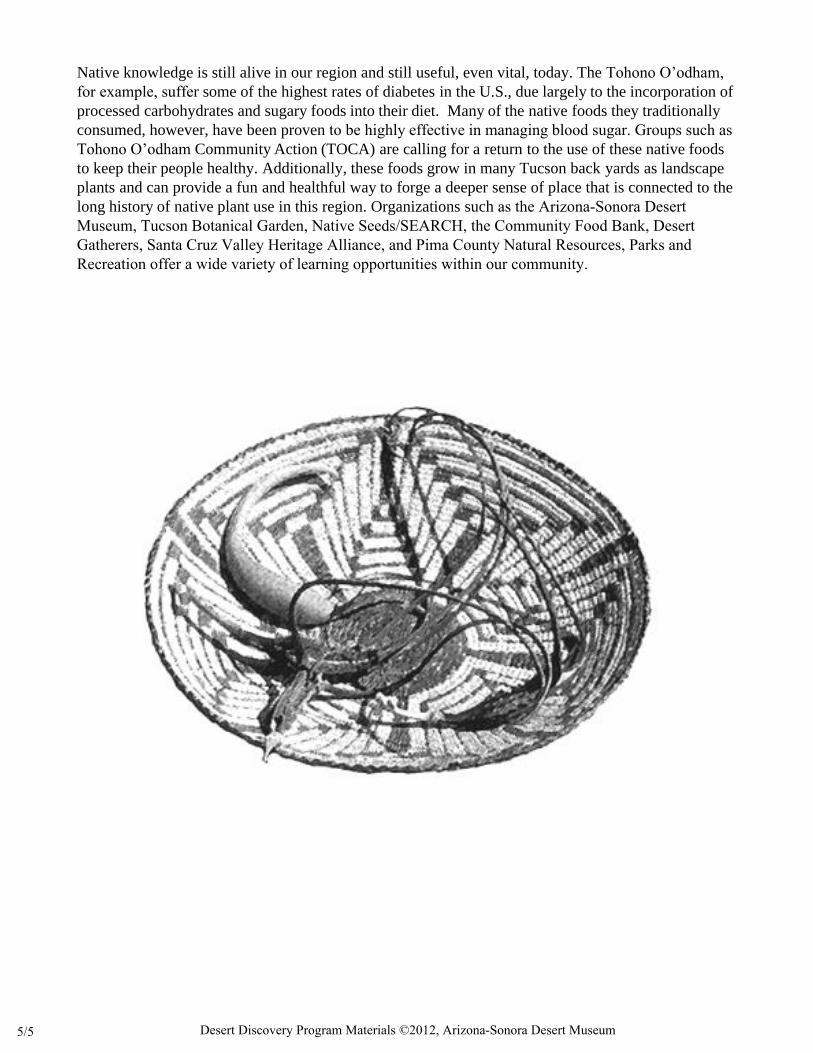
Native knowledge is still alive in our region and still useful, even vital, today. The Tohono O’odham,
for example, suffer some of the highest rates of diabetes in the U.S., due largely to the incorporation of
processed carbohydrates and sugary foods into their diet. Many of the native foods they traditionally
consumed, however, have been proven to be highly effective in managing blood sugar. Groups such as
Tohono O’odham Community Action (TOCA) are calling for a return to the use of these native foods
to keep their people healthy. Additionally, these foods grow in many Tucson back yards as landscape
plants and can provide a fun and healthful way to forge a deeper sense of place that is connected to the
long history of native plant use in this region. Organizations such as the Arizona-Sonora Desert Museum, Tucson Botanical Garden, Native Seeds/SEARCH, the Community Food Bank, Desert Gatherers, Santa Cruz Valley Heritage Alliance, and Pima County Natural Resources, Parks and Recreation offer a wide variety of learning opportunities within our community.
5/5 Desert Discovery Program Materials ©2012, Arizona-Sonora Desert Museum
Human Ecology of the Sonoran Desert
Thomas E. SheridanAn excerpt from A Natural History of the Sonoran Desert
In 1922, Aldo Leopold and his brother canoed through the delta of the Colorado River. They hunted quail and geese, watched bobcats swat mullet from driftwood logs, and dreamed of el tigre (jaguar), whose "personality pervaded the wilderness", even though they never saw any of the big cats. "For all we could tell, the Delta had lain forgotten since Hernando de Alarcón landed there in 1540," Leopold mused. "When we camped on the estuary which is said to have harbored his ships, we had not for weeks seen a man or a cow, an axe-cut or a fence" (Leopold 1949, 141). "On the map the Delta was bisected by the river," the famed conservationist goes on to say, "but in fact the river was nowhere and everywhere, for he could not decide which of a hundred green lagoons offered the most pleasant and least speedy path to the Gulf. So he traveled them all and so did we. He divided and rejoined, he twisted and turned, he meandered in awesome jungles, he all but ran in circles, he dallied with lovely groves, he got lost and was glad of it, and so were we. For the last word in procrastination, go travel with a river reluctant to lose his freedom in the sea."
By the time Leopold wrote those words in the 1940s, he knew he was writing an elegy, not a paean. The river mighty enough to support a jungle in the desert had already lost its freedom, not to the Gulf of California into which it emptied, but to California farmers and the City of Los Angeles. Beginning in the 1890s, Anglo-American promoters and government engineers strove to break the Colorado to the new Western order. Their first attempts nearly triggered a geological catastrophe, when floods in 1905 sent the Colorado roiling down a canal with no headgate and turned the Salton Sink into the Salton Sea. In 1936, however, a white wall of more than three million cubic yards of concrete rising 726 feet against black rock halted the river in its tracks. Erected to prevent floods and to provide hydroelectric power, Hoover Dam turned the Colorado into a tame ditch for the last 300 miles of its course to the sea. The Colorado and its tributaries, along with the other major rivers that brought water to the Sonoran Desert, such as the Yaqui and the Mayo, became ghosts of the past, victims of the twentieth century, carcasses of sand whose lifeblood had been diverted into cotton fields, copper mines, and vast, sprawling cities.
The Native Americans
Leopold foresaw the transformation and never revisited the delta. "I am told the green lagoons now raise cantaloupes. If so, they should not lack flavor," he wrote. "Man always kills the thing he loves, and so we the pioneers have killed our wilderness" (Leopold 1949, 148).
The passion of those words rang with recrimination. But they also reflected a deeply American romanticism as well. Leopold felt that he was witnessing the death of wilderness in the Southwest. Like most Anglo-American newcomers, however, he underestimated the impact that native peoples had already visited upon the Southwestern landscape. Much of the Sonoran Desert, after all, had been homeland to American Indians for at least 12,000 years. Their transformations were more subtle, and in most cases more benign, but human groups have shaped the flora and fauna of the Sonoran Desert, including the Colorado delta, for millenia.
Geoscientist Paul Martin believes that Paleoindians armed with stone-tipped spears overhunted the great Pleistocene mammals of North America and helped drive them to extinction. His Pleistocene overkill theory is controversial, but prehistoric Indian societies clearly had an impact upon local animal populations.
© 2016 Arizona-Sonora Desert Museum 1/12
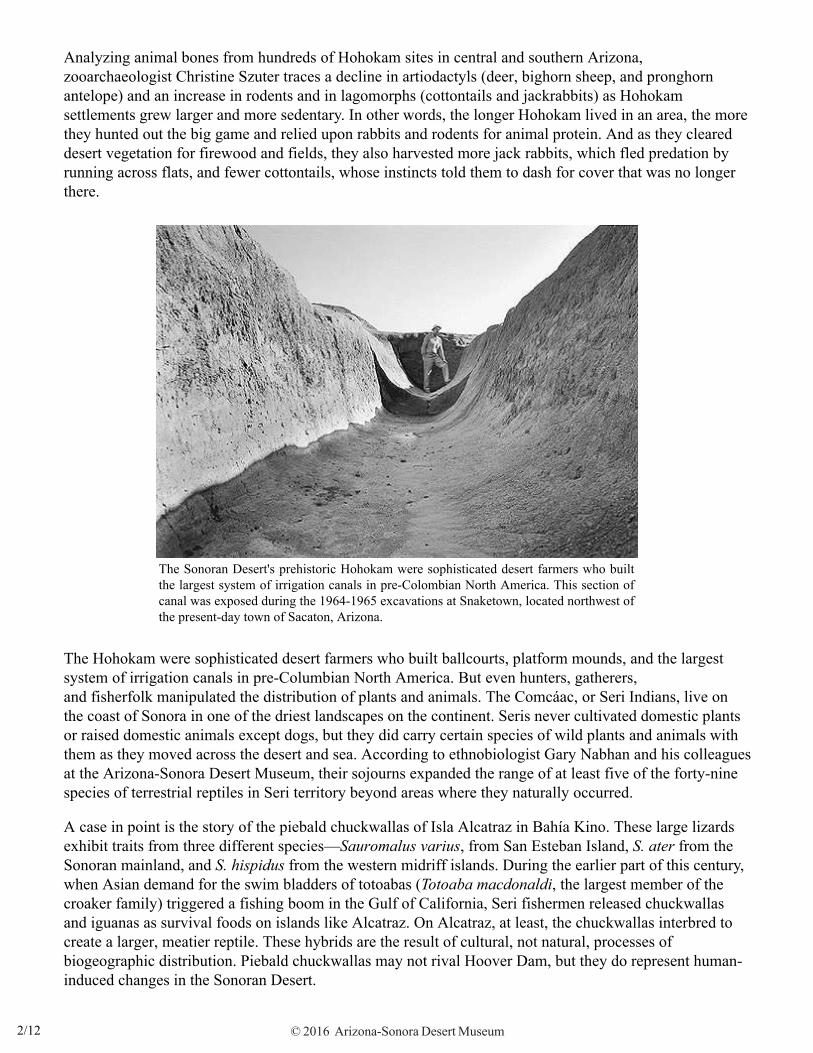
Analyzing animal bones from hundreds of Hohokam sites in central and southern Arizona, zooarchaeologist Christine Szuter traces a decline in artiodactyls (deer, bighorn sheep, and pronghorn antelope) and an increase in rodents and in lagomorphs (cottontails and jackrabbits) as Hohokam settlements grew larger and more sedentary. In other words, the longer Hohokam lived in an area, the more they hunted out the big game and relied upon rabbits and rodents for animal protein. And as they cleared desert vegetation for firewood and fields, they also harvested more jack rabbits, which fled predation by running across flats, and fewer cottontails, whose instincts told them to dash for cover that was no longer there.
The Hohokam were sophisticated desert farmers who built ballcourts, platform mounds, and the largest system of irrigation canals in pre-Columbian North America. But even hunters, gatherers,and fisherfolk manipulated the distribution of plants and animals. The Comcáac, or Seri Indians, live on the coast of Sonora in one of the driest landscapes on the continent. Seris never cultivated domestic plants or raised domestic animals except dogs, but they did carry certain species of wild plants and animals with them as they moved across the desert and sea. According to ethnobiologist Gary Nabhan and his colleagues at the Arizona-Sonora Desert Museum, their sojourns expanded the range of at least five of the forty-nine species of terrestrial reptiles in Seri territory beyond areas where they naturally occurred.
A case in point is the story of the piebald chuckwallas of Isla Alcatraz in Bahía Kino. These large lizards exhibit traits from three different species—Sauromalus varius, from San Esteban Island, S. ater from the Sonoran mainland, and S. hispidus from the western midriff islands. During the earlier part of this century, when Asian demand for the swim bladders of totoabas (Totoaba macdonaldi, the largest member of the croaker family) triggered a fishing boom in the Gulf of California, Seri fishermen released chuckwallas and iguanas as survival foods on islands like Alcatraz. On Alcatraz, at least, the chuckwallas interbred to create a larger, meatier reptile. These hybrids are the result of cultural, not natural, processes of biogeographic distribution. Piebald chuckwallas may not rival Hoover Dam, but they do represent human-induced changes in the Sonoran Desert.
The Sonoran Desert's prehistoric Hohokam were sophisticated desert farmers who built the largest system of irrigation canals in pre-Colombian North America. This section of canal was exposed during the 1964-1965 excavations at Snaketown, located northwest of the present-day town of Sacaton, Arizona.
© 2016 Arizona-Sonora Desert Museum 2/12
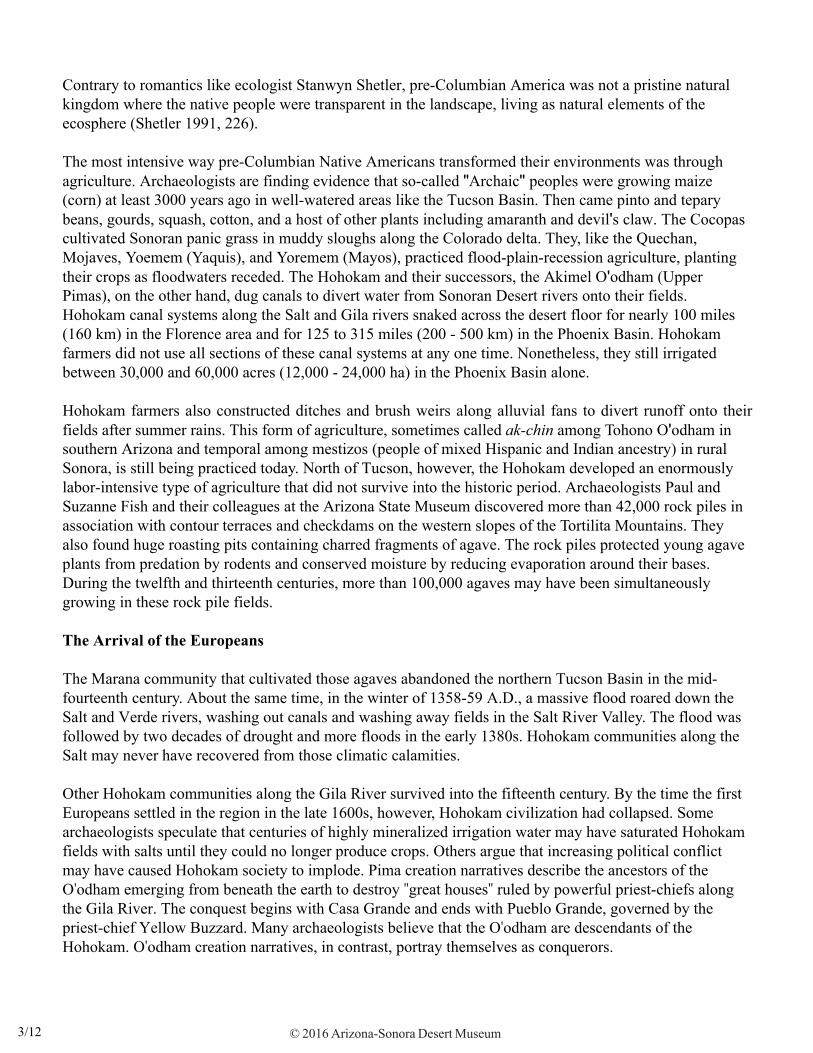
Contrary to romantics like ecologist Stanwyn Shetler, pre-Columbian America was not a pristine natural kingdom where the native people were transparent in the landscape, living as natural elements of the ecosphere (Shetler 1991, 226).
The most intensive way pre-Columbian Native Americans transformed their environments was through agriculture. Archaeologists are finding evidence that so-called "Archaic" peoples were growing maize (corn) at least 3000 years ago in well-watered areas like the Tucson Basin. Then came pinto and tepary beans, gourds, squash, cotton, and a host of other plants including amaranth and devil's claw. The Cocopas cultivated Sonoran panic grass in muddy sloughs along the Colorado delta. They, like the Quechan, Mojaves, Yoemem (Yaquis), and Yoremem (Mayos), practiced flood-plain-recession agriculture, planting their crops as floodwaters receded. The Hohokam and their successors, the Akimel O'odham (Upper Pimas), on the other hand, dug canals to divert water from Sonoran Desert rivers onto their fields. Hohokam canal systems along the Salt and Gila rivers snaked across the desert floor for nearly 100 miles (160 km) in the Florence area and for 125 to 315 miles (200 - 500 km) in the Phoenix Basin. Hohokam farmers did not use all sections of these canal systems at any one time. Nonetheless, they still irrigated between 30,000 and 60,000 acres (12,000 - 24,000 ha) in the Phoenix Basin alone.
Hohokam farmers also constructed ditches and brush weirs along alluvial fans to divert runoff onto their fields after summer rains. This form of agriculture, sometimes called ak-chin among Tohono O'odham in southern Arizona and temporal among mestizos (people of mixed Hispanic and Indian ancestry) in rural Sonora, is still being practiced today. North of Tucson, however, the Hohokam developed an enormously labor-intensive type of agriculture that did not survive into the historic period. Archaeologists Paul and Suzanne Fish and their colleagues at the Arizona State Museum discovered more than 42,000 rock piles in association with contour terraces and checkdams on the western slopes of the Tortilita Mountains. They also found huge roasting pits containing charred fragments of agave. The rock piles protected young agave plants from predation by rodents and conserved moisture by reducing evaporation around their bases. During the twelfth and thirteenth centuries, more than 100,000 agaves may have been simultaneously growing in these rock pile fields.
The Arrival of the Europeans
The Marana community that cultivated those agaves abandoned the northern Tucson Basin in the mid-fourteenth century. About the same time, in the winter of 1358-59 A.D., a massive flood roared down the Salt and Verde rivers, washing out canals and washing away fields in the Salt River Valley. The flood was followed by two decades of drought and more floods in the early 1380s. Hohokam communities along the Salt may never have recovered from those climatic calamities.
Other Hohokam communities along the Gila River survived into the fifteenth century. By the time the first Europeans settled in the region in the late 1600s, however, Hohokam civilization had collapsed. Some archaeologists speculate that centuries of highly mineralized irrigation water may have saturated Hohokam fields with salts until they could no longer produce crops. Others argue that increasing political conflict may have caused Hohokam society to implode. Pima creation narratives describe the ancestors of the O'odham emerging from beneath the earth to destroy "great houses" ruled by powerful priest-chiefs along the Gila River. The conquest begins with Casa Grande and ends with Pueblo Grande, governed by the priest-chief Yellow Buzzard. Many archaeologists believe that the O'odham are descendants of the Hohokam. O'odham creation narratives, in contrast, portray themselves as conquerors.
© 2016 Arizona-Sonora Desert Museum 3/12
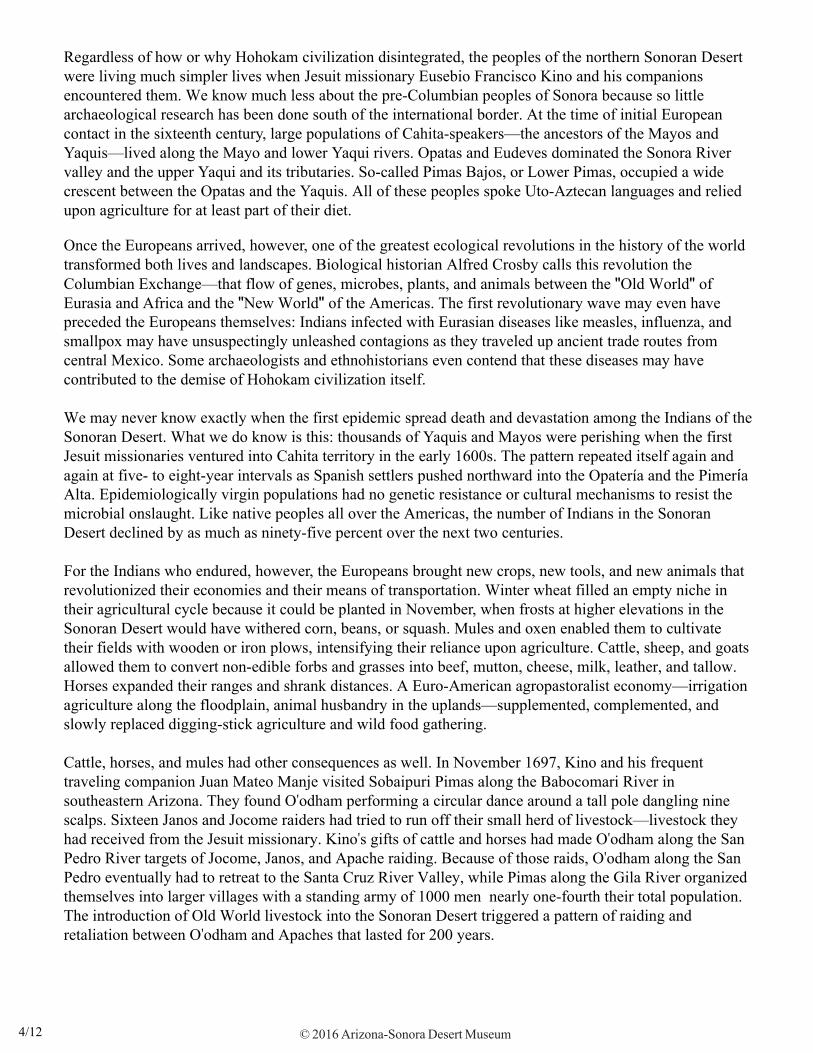
Regardless of how or why Hohokam civilization disintegrated, the peoples of the northern Sonoran Desert were living much simpler lives when Jesuit missionary Eusebio Francisco Kino and his companions encountered them. We know much less about the pre-Columbian peoples of Sonora because so little archaeological research has been done south of the international border. At the time of initial European contact in the sixteenth century, large populations of Cahita-speakers—the ancestors of the Mayos and Yaquis—lived along the Mayo and lower Yaqui rivers. Opatas and Eudeves dominated the Sonora River valley and the upper Yaqui and its tributaries. So-called Pimas Bajos, or Lower Pimas, occupied a wide crescent between the Opatas and the Yaquis. All of these peoples spoke Uto-Aztecan languages and relied upon agriculture for at least part of their diet.
Once the Europeans arrived, however, one of the greatest ecological revolutions in the history of the world transformed both lives and landscapes. Biological historian Alfred Crosby calls this revolution the Columbian Exchange—that flow of genes, microbes, plants, and animals between the "Old World" of Eurasia and Africa and the "New World" of the Americas. The first revolutionary wave may even have preceded the Europeans themselves: Indians infected with Eurasian diseases like measles, influenza, and smallpox may have unsuspectingly unleashed contagions as they traveled up ancient trade routes from central Mexico. Some archaeologists and ethnohistorians even contend that these diseases may have contributed to the demise of Hohokam civilization itself.
We may never know exactly when the first epidemic spread death and devastation among the Indians of the Sonoran Desert. What we do know is this: thousands of Yaquis and Mayos were perishing when the first Jesuit missionaries ventured into Cahita territory in the early 1600s. The pattern repeated itself again and again at five- to eight-year intervals as Spanish settlers pushed northward into the Opatería and the Pimería Alta. Epidemiologically virgin populations had no genetic resistance or cultural mechanisms to resist the microbial onslaught. Like native peoples all over the Americas, the number of Indians in the Sonoran Desert declined by as much as ninety-five percent over the next two centuries.
For the Indians who endured, however, the Europeans brought new crops, new tools, and new animals that revolutionized their economies and their means of transportation. Winter wheat filled an empty niche in their agricultural cycle because it could be planted in November, when frosts at higher elevations in the Sonoran Desert would have withered corn, beans, or squash. Mules and oxen enabled them to cultivate their fields with wooden or iron plows, intensifying their reliance upon agriculture. Cattle, sheep, and goats allowed them to convert non-edible forbs and grasses into beef, mutton, cheese, milk, leather, and tallow. Horses expanded their ranges and shrank distances. A Euro-American agropastoralist economy—irrigation agriculture along the floodplain, animal husbandry in the uplands—supplemented, complemented, and slowly replaced digging-stick agriculture and wild food gathering.
Cattle, horses, and mules had other consequences as well. In November 1697, Kino and his frequent traveling companion Juan Mateo Manje visited Sobaipuri Pimas along the Babocomari River in southeastern Arizona. They found O'odham performing a circular dance around a tall pole dangling nine scalps. Sixteen Janos and Jocome raiders had tried to run off their small herd of livestock—livestock they had received from the Jesuit missionary. Kino's gifts of cattle and horses had made O'odham along the San Pedro River targets of Jocome, Janos, and Apache raiding. Because of those raids, O'odham along the San Pedro eventually had to retreat to the Santa Cruz River Valley, while Pimas along the Gila River organized themselves into larger villages with a standing army of 1000 men nearly one-fourth their total population. The introduction of Old World livestock into the Sonoran Desert triggered a pattern of raiding andretaliation between O'odham and Apaches that lasted for 200 years.
© 2016 Arizona-Sonora Desert Museum 4/12
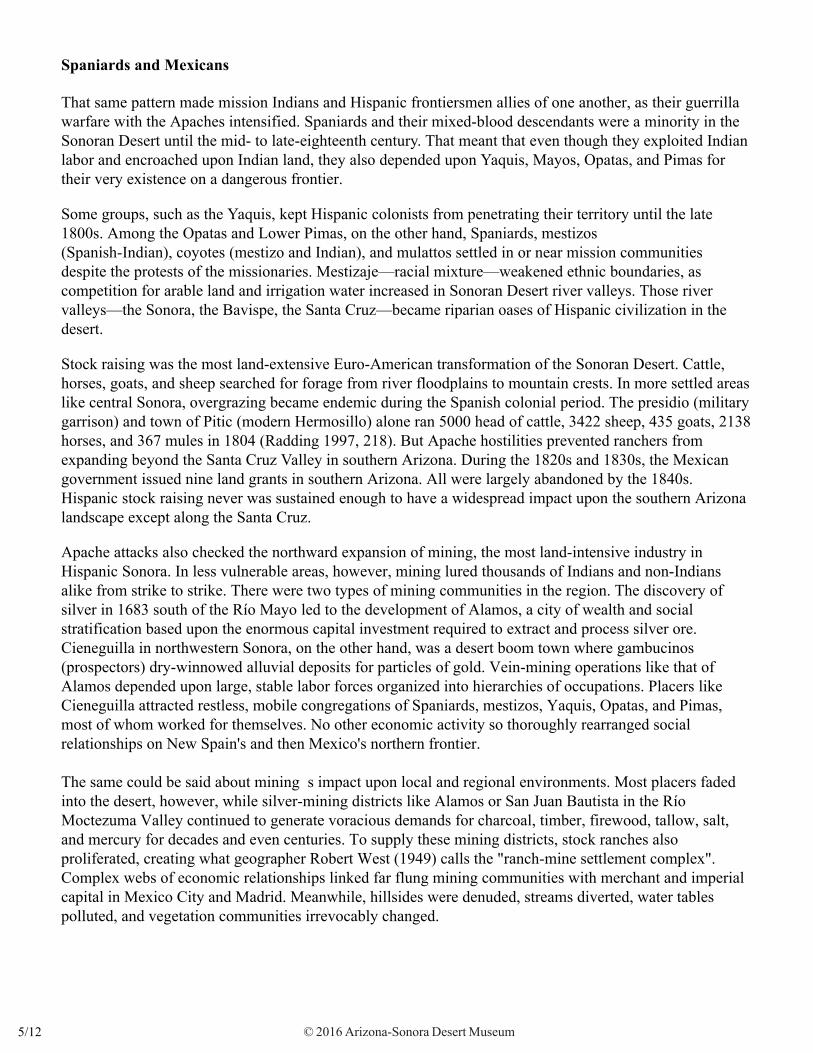
Spaniards and Mexicans
That same pattern made mission Indians and Hispanic frontiersmen allies of one another, as their guerrilla warfare with the Apaches intensified. Spaniards and their mixed-blood descendants were a minority in the Sonoran Desert until the mid- to late-eighteenth century. That meant that even though they exploited Indian labor and encroached upon Indian land, they also depended upon Yaquis, Mayos, Opatas, and Pimas for their very existence on a dangerous frontier.
Some groups, such as the Yaquis, kept Hispanic colonists from penetrating their territory until the late 1800s. Among the Opatas and Lower Pimas, on the other hand, Spaniards, mestizos(Spanish-Indian), coyotes (mestizo and Indian), and mulattos settled in or near mission communities despite the protests of the missionaries. Mestizaje—racial mixture—weakened ethnic boundaries, as competition for arable land and irrigation water increased in Sonoran Desert river valleys. Those river valleys—the Sonora, the Bavispe, the Santa Cruz—became riparian oases of Hispanic civilization in the desert.
Stock raising was the most land-extensive Euro-American transformation of the Sonoran Desert. Cattle, horses, goats, and sheep searched for forage from river floodplains to mountain crests. In more settled areas like central Sonora, overgrazing became endemic during the Spanish colonial period. The presidio (military garrison) and town of Pitic (modern Hermosillo) alone ran 5000 head of cattle, 3422 sheep, 435 goats, 2138 horses, and 367 mules in 1804 (Radding 1997, 218). But Apache hostilities prevented ranchers from expanding beyond the Santa Cruz Valley in southern Arizona. During the 1820s and 1830s, the Mexican government issued nine land grants in southern Arizona. All were largely abandoned by the 1840s. Hispanic stock raising never was sustained enough to have a widespread impact upon the southern Arizona landscape except along the Santa Cruz.
Apache attacks also checked the northward expansion of mining, the most land-intensive industry in Hispanic Sonora. In less vulnerable areas, however, mining lured thousands of Indians and non-Indians alike from strike to strike. There were two types of mining communities in the region. The discovery of silver in 1683 south of the Río Mayo led to the development of Alamos, a city of wealth and social stratification based upon the enormous capital investment required to extract and process silver ore. Cieneguilla in northwestern Sonora, on the other hand, was a desert boom town where gambucinos (prospectors) dry-winnowed alluvial deposits for particles of gold. Vein-mining operations like that of Alamos depended upon large, stable labor forces organized into hierarchies of occupations. Placers like Cieneguilla attracted restless, mobile congregations of Spaniards, mestizos, Yaquis, Opatas, and Pimas, most of whom worked for themselves. No other economic activity so thoroughly rearranged social relationships on New Spain's and then Mexico's northern frontier.
The same could be said about mining s impact upon local and regional environments. Most placers faded into the desert, however, while silver-mining districts like Alamos or San Juan Bautista in the Río Moctezuma Valley continued to generate voracious demands for charcoal, timber, firewood, tallow, salt, and mercury for decades and even centuries. To supply these mining districts, stock ranches also proliferated, creating what geographer Robert West (1949) calls the "ranch-mine settlement complex". Complex webs of economic relationships linked far flung mining communities with merchant and imperial capital in Mexico City and Madrid. Meanwhile, hillsides were denuded, streams diverted, water tables polluted, and vegetation communities irrevocably changed.
© 2016 Arizona-Sonora Desert Museum 5/12
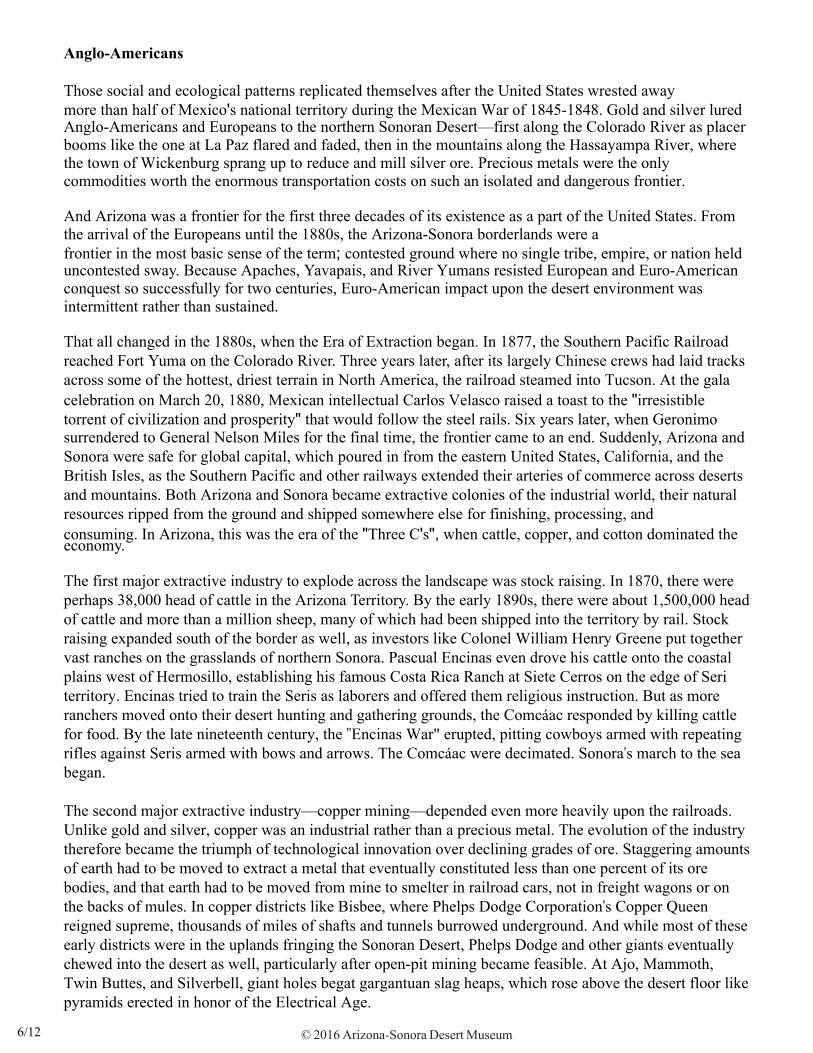
Anglo-Americans
Those social and ecological patterns replicated themselves after the United States wrested awaymore than half of Mexico's national territory during the Mexican War of 1845-1848. Gold and silver lured Anglo-Americans and Europeans to the northern Sonoran Desert—first along the Colorado River as placer booms like the one at La Paz flared and faded, then in the mountains along the Hassayampa River, where the town of Wickenburg sprang up to reduce and mill silver ore. Precious metals were the only commodities worth the enormous transportation costs on such an isolated and dangerous frontier.
And Arizona was a frontier for the first three decades of its existence as a part of the United States. From the arrival of the Europeans until the 1880s, the Arizona-Sonora borderlands were afrontier in the most basic sense of the term; contested ground where no single tribe, empire, or nation held uncontested sway. Because Apaches, Yavapais, and River Yumans resisted European and Euro-American conquest so successfully for two centuries, Euro-American impact upon the desert environment was intermittent rather than sustained.
That all changed in the 1880s, when the Era of Extraction began. In 1877, the Southern Pacific Railroad reached Fort Yuma on the Colorado River. Three years later, after its largely Chinese crews had laid tracks across some of the hottest, driest terrain in North America, the railroad steamed into Tucson. At the gala celebration on March 20, 1880, Mexican intellectual Carlos Velasco raised a toast to the "irresistible torrent of civilization and prosperity" that would follow the steel rails. Six years later, when Geronimo surrendered to General Nelson Miles for the final time, the frontier came to an end. Suddenly, Arizona and Sonora were safe for global capital, which poured in from the eastern United States, California, and the British Isles, as the Southern Pacific and other railways extended their arteries of commerce across deserts and mountains. Both Arizona and Sonora became extractive colonies of the industrial world, their natural resources ripped from the ground and shipped somewhere else for finishing, processing, andconsuming. In Arizona, this was the era of the "Three C's", when cattle, copper, and cotton dominated the economy.
The first major extractive industry to explode across the landscape was stock raising. In 1870, there were perhaps 38,000 head of cattle in the Arizona Territory. By the early 1890s, there were about 1,500,000 head of cattle and more than a million sheep, many of which had been shipped into the territory by rail. Stock raising expanded south of the border as well, as investors like Colonel William Henry Greene put together vast ranches on the grasslands of northern Sonora. Pascual Encinas even drove his cattle onto the coastal plains west of Hermosillo, establishing his famous Costa Rica Ranch at Siete Cerros on the edge of Seri territory. Encinas tried to train the Seris as laborers and offered them religious instruction. But as more ranchers moved onto their desert hunting and gathering grounds, the Comcáac responded by killing cattle for food. By the late nineteenth century, the "Encinas War" erupted, pitting cowboys armed with repeating rifles against Seris armed with bows and arrows. The Comcáac were decimated. Sonora's march to the sea began.
The second major extractive industry—copper mining—depended even more heavily upon the railroads. Unlike gold and silver, copper was an industrial rather than a precious metal. The evolution of the industry therefore became the triumph of technological innovation over declining grades of ore. Staggering amounts of earth had to be moved to extract a metal that eventually constituted less than one percent of its ore bodies, and that earth had to be moved from mine to smelter in railroad cars, not in freight wagons or on the backs of mules. In copper districts like Bisbee, where Phelps Dodge Corporation's Copper Queen reigned supreme, thousands of miles of shafts and tunnels burrowed underground. And while most of these early districts were in the uplands fringing the Sonoran Desert, Phelps Dodge and other giants eventually chewed into the desert as well, particularly after open-pit mining became feasible. At Ajo, Mammoth, Twin Buttes, and Silverbell, giant holes begat gargantuan slag heaps, which rose above the desert floor like pyramids erected in honor of the Electrical Age.
© 2016 Arizona-Sonora Desert Museum 6/12
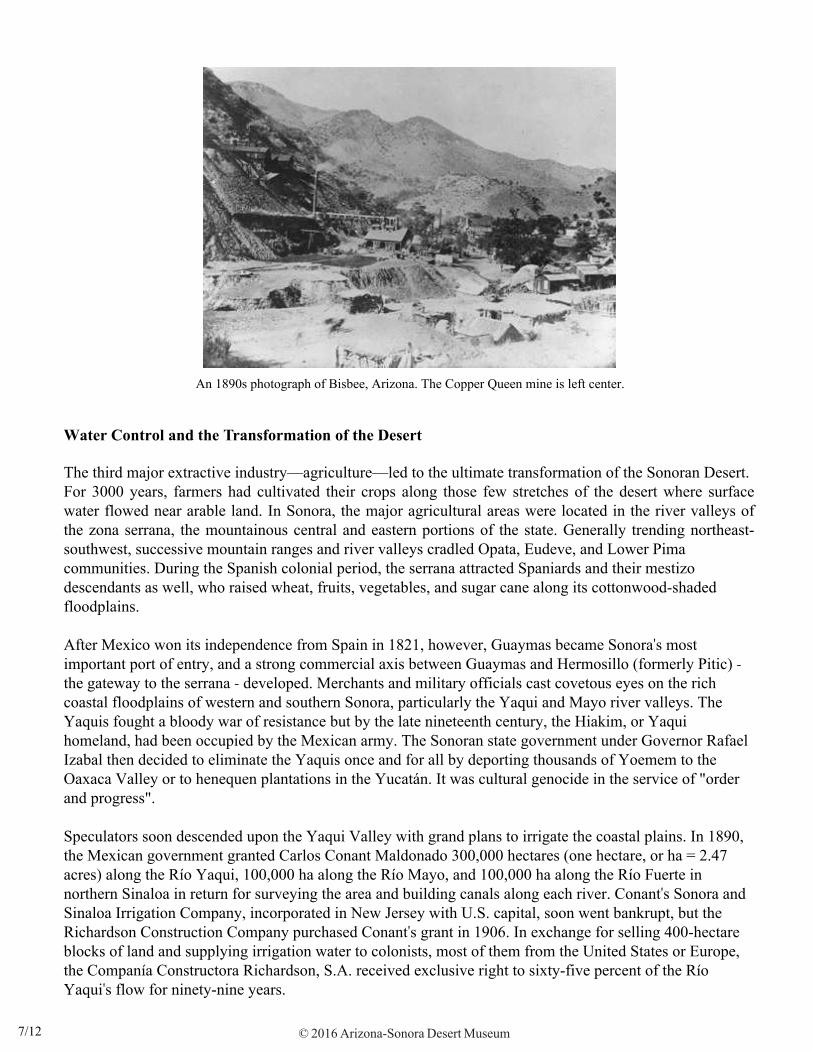
Water Control and the Transformation of the Desert
The third major extractive industry—agriculture—led to the ultimate transformation of the Sonoran Desert. For 3000 years, farmers had cultivated their crops along those few stretches of the desert where surface water flowed near arable land. In Sonora, the major agricultural areas were located in the river valleys of the zona serrana, the mountainous central and eastern portions of the state. Generally trending northeast-southwest, successive mountain ranges and river valleys cradled Opata, Eudeve, and Lower Pima communities. During the Spanish colonial period, the serrana attracted Spaniards and their mestizo descendants as well, who raised wheat, fruits, vegetables, and sugar cane along its cottonwood-shaded floodplains.
After Mexico won its independence from Spain in 1821, however, Guaymas became Sonora's most important port of entry, and a strong commercial axis between Guaymas and Hermosillo (formerly Pitic) - the gateway to the serrana - developed. Merchants and military officials cast covetous eyes on the rich coastal floodplains of western and southern Sonora, particularly the Yaqui and Mayo river valleys. The Yaquis fought a bloody war of resistance but by the late nineteenth century, the Hiakim, or Yaqui homeland, had been occupied by the Mexican army. The Sonoran state government under Governor Rafael Izabal then decided to eliminate the Yaquis once and for all by deporting thousands of Yoemem to the Oaxaca Valley or to henequen plantations in the Yucatán. It was cultural genocide in the service of "order and progress".
Speculators soon descended upon the Yaqui Valley with grand plans to irrigate the coastal plains. In 1890, the Mexican government granted Carlos Conant Maldonado 300,000 hectares (one hectare, or ha = 2.47 acres) along the Río Yaqui, 100,000 ha along the Río Mayo, and 100,000 ha along the Río Fuerte in northern Sinaloa in return for surveying the area and building canals along each river. Conant's Sonora and Sinaloa Irrigation Company, incorporated in New Jersey with U.S. capital, soon went bankrupt, but the Richardson Construction Company purchased Conant's grant in 1906. In exchange for selling 400-hectare blocks of land and supplying irrigation water to colonists, most of them from the United States or Europe, the Companía Constructora Richardson, S.A. received exclusive right to sixty-five percent of the Río Yaqui's flow for ninety-nine years.
An 1890s photograph of Bisbee, Arizona. The Copper Queen mine is left center.
© 2016 Arizona-Sonora Desert Museum 7/12
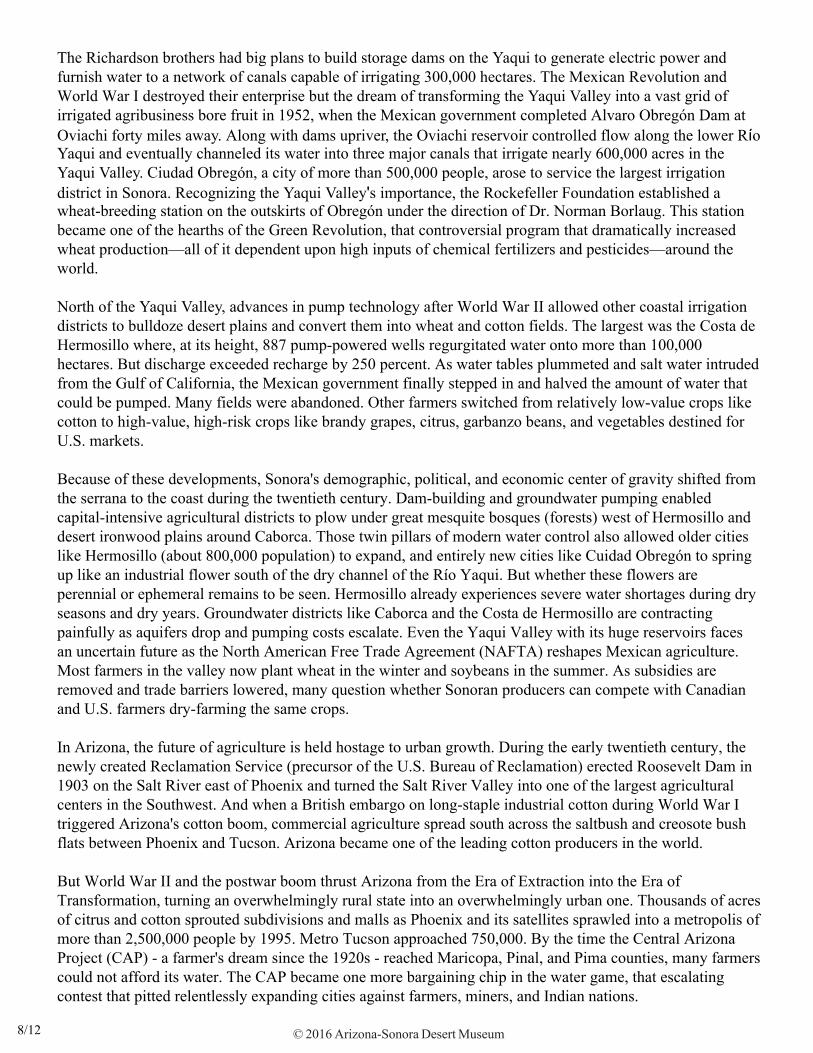
The Richardson brothers had big plans to build storage dams on the Yaqui to generate electric power and furnish water to a network of canals capable of irrigating 300,000 hectares. The Mexican Revolution and World War I destroyed their enterprise but the dream of transforming the Yaqui Valley into a vast grid of irrigated agribusiness bore fruit in 1952, when the Mexican government completed Alvaro Obregón Dam at Oviachi forty miles away. Along with dams upriver, the Oviachi reservoir controlled flow along the lower Río Yaqui and eventually channeled its water into three major canals that irrigate nearly 600,000 acres in the Yaqui Valley. Ciudad Obregón, a city of more than 500,000 people, arose to service the largest irrigation district in Sonora. Recognizing the Yaqui Valley's importance, the Rockefeller Foundation established a wheat-breeding station on the outskirts of Obregón under the direction of Dr. Norman Borlaug. This station became one of the hearths of the Green Revolution, that controversial program that dramatically increased wheat production—all of it dependent upon high inputs of chemical fertilizers and pesticides—around the world.
North of the Yaqui Valley, advances in pump technology after World War II allowed other coastal irrigation districts to bulldoze desert plains and convert them into wheat and cotton fields. The largest was the Costa de Hermosillo where, at its height, 887 pump-powered wells regurgitated water onto more than 100,000 hectares. But discharge exceeded recharge by 250 percent. As water tables plummeted and salt water intruded from the Gulf of California, the Mexican government finally stepped in and halved the amount of water that could be pumped. Many fields were abandoned. Other farmers switched from relatively low-value crops like cotton to high-value, high-risk crops like brandy grapes, citrus, garbanzo beans, and vegetables destined for U.S. markets.
Because of these developments, Sonora's demographic, political, and economic center of gravity shifted from the serrana to the coast during the twentieth century. Dam-building and groundwater pumping enabled capital-intensive agricultural districts to plow under great mesquite bosques (forests) west of Hermosillo and desert ironwood plains around Caborca. Those twin pillars of modern water control also allowed older cities like Hermosillo (about 800,000 population) to expand, and entirely new cities like Cuidad Obregón to spring up like an industrial flower south of the dry channel of the Río Yaqui. But whether these flowers are perennial or ephemeral remains to be seen. Hermosillo already experiences severe water shortages during dry seasons and dry years. Groundwater districts like Caborca and the Costa de Hermosillo are contracting painfully as aquifers drop and pumping costs escalate. Even the Yaqui Valley with its huge reservoirs faces an uncertain future as the North American Free Trade Agreement (NAFTA) reshapes Mexican agriculture. Most farmers in the valley now plant wheat in the winter and soybeans in the summer. As subsidies are removed and trade barriers lowered, many question whether Sonoran producers can compete with Canadian and U.S. farmers dry-farming the same crops.
In Arizona, the future of agriculture is held hostage to urban growth. During the early twentieth century, the newly created Reclamation Service (precursor of the U.S. Bureau of Reclamation) erected Roosevelt Dam in 1903 on the Salt River east of Phoenix and turned the Salt River Valley into one of the largest agricultural centers in the Southwest. And when a British embargo on long-staple industrial cotton during World War I triggered Arizona's cotton boom, commercial agriculture spread south across the saltbush and creosote bush flats between Phoenix and Tucson. Arizona became one of the leading cotton producers in the world.
But World War II and the postwar boom thrust Arizona from the Era of Extraction into the Era of Transformation, turning an overwhelmingly rural state into an overwhelmingly urban one. Thousands of acres of citrus and cotton sprouted subdivisions and malls as Phoenix and its satellites sprawled into a metropolis of more than 2,500,000 people by 1995. Metro Tucson approached 750,000. By the time the Central Arizona Project (CAP) - a farmer's dream since the 1920s - reached Maricopa, Pinal, and Pima counties, many farmers could not afford its water. The CAP became one more bargaining chip in the water game, that escalating contest that pitted relentlessly expanding cities against farmers, miners, and Indian nations.
© 2016 Arizona-Sonora Desert Museum 8/12
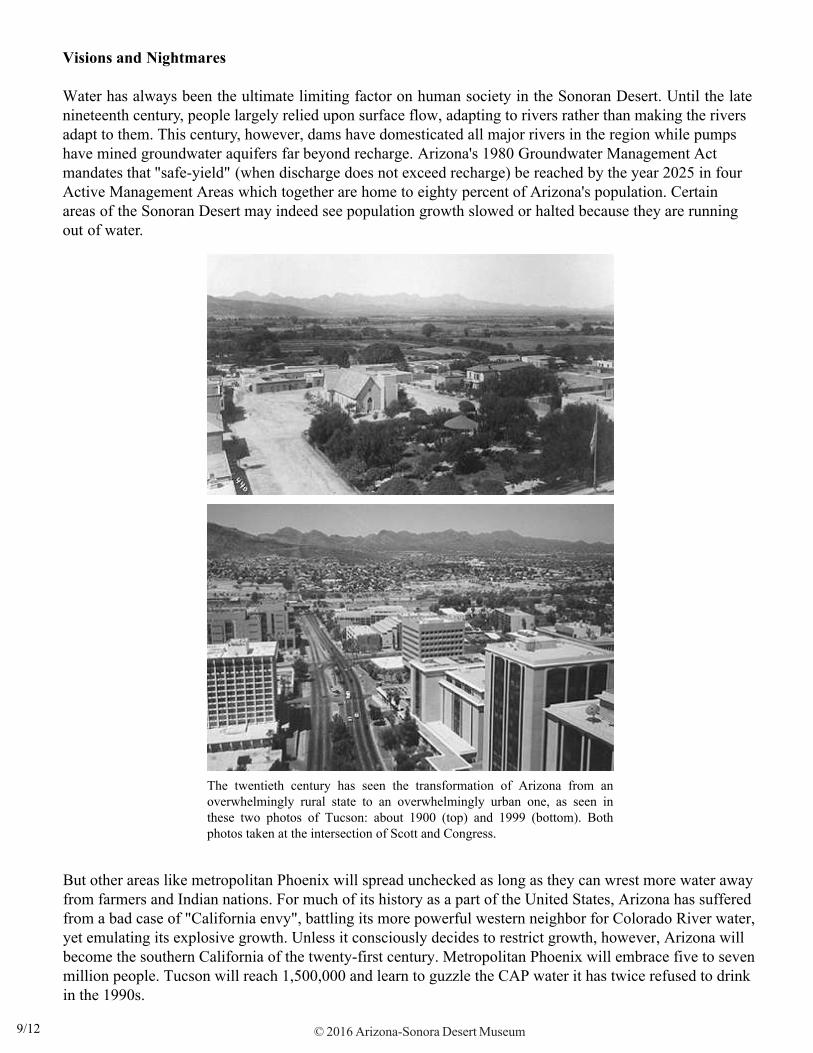
Visions and Nightmares
Water has always been the ultimate limiting factor on human society in the Sonoran Desert. Until the late nineteenth century, people largely relied upon surface flow, adapting to rivers rather than making the rivers adapt to them. This century, however, dams have domesticated all major rivers in the region while pumps have mined groundwater aquifers far beyond recharge. Arizona's 1980 Groundwater Management Act mandates that "safe-yield" (when discharge does not exceed recharge) be reached by the year 2025 in four Active Management Areas which together are home to eighty percent of Arizona's population. Certain areas of the Sonoran Desert may indeed see population growth slowed or halted because they are running out of water.
The twentieth century has seen the transformation of Arizona from an overwhelmingly rural state to an overwhelmingly urban one, as seen in these two photos of Tucson: about 1900 (top) and 1999 (bottom). Both photos taken at the intersection of Scott and Congress.
But other areas like metropolitan Phoenix will spread unchecked as long as they can wrest more water away from farmers and Indian nations. For much of its history as a part of the United States, Arizona has suffered from a bad case of "California envy", battling its more powerful western neighbor for Colorado River water, yet emulating its explosive growth. Unless it consciously decides to restrict growth, however, Arizona will become the southern California of the twenty-first century. Metropolitan Phoenix will embrace five to seven million people. Tucson will reach 1,500,000 and learn to guzzle the CAP water it has twice refused to drink in the 1990s.
© 2016 Arizona-Sonora Desert Museum 9/12
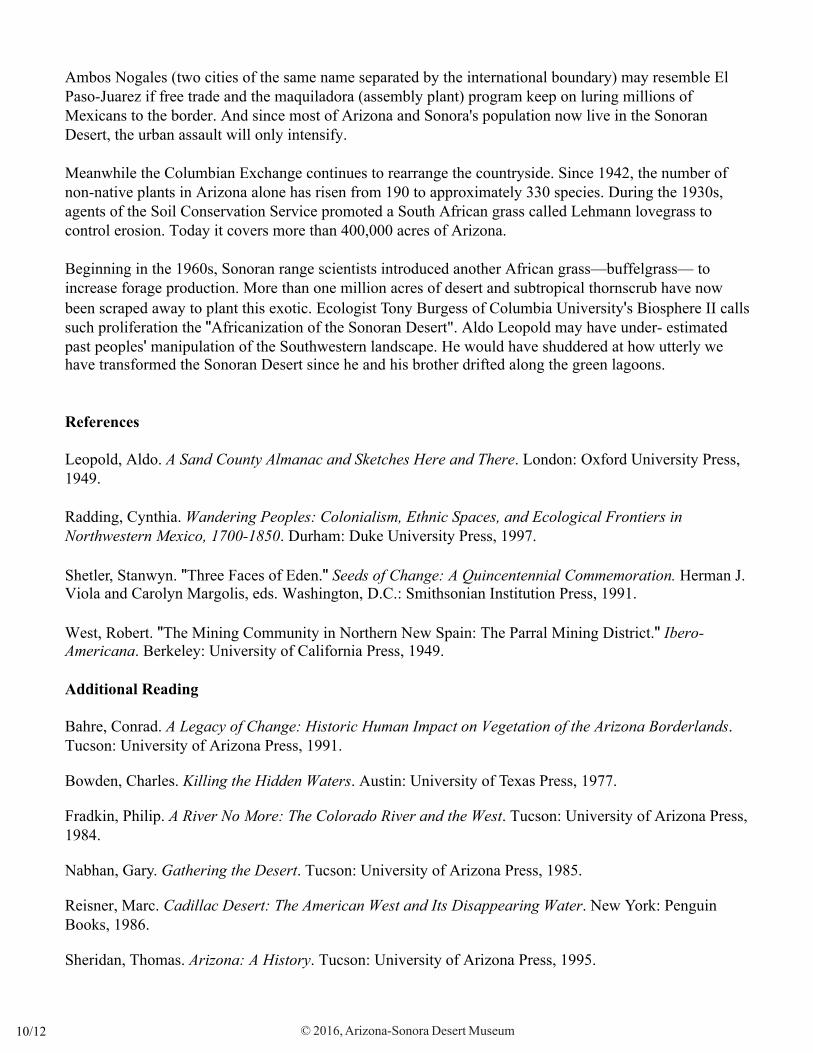
Ambos Nogales (two cities of the same name separated by the international boundary) may resemble El Paso-Juarez if free trade and the maquiladora (assembly plant) program keep on luring millions of Mexicans to the border. And since most of Arizona and Sonora's population now live in the Sonoran Desert, the urban assault will only intensify.
Meanwhile the Columbian Exchange continues to rearrange the countryside. Since 1942, the number of non-native plants in Arizona alone has risen from 190 to approximately 330 species. During the 1930s, agents of the Soil Conservation Service promoted a South African grass called Lehmann lovegrass to control erosion. Today it covers more than 400,000 acres of Arizona.
Beginning in the 1960s, Sonoran range scientists introduced another African grass—buffelgrass— to increase forage production. More than one million acres of desert and subtropical thornscrub have now been scraped away to plant this exotic. Ecologist Tony Burgess of Columbia University's Biosphere II calls such proliferation the "Africanization of the Sonoran Desert". Aldo Leopold may have under- estimated past peoples' manipulation of the Southwestern landscape. He would have shuddered at how utterly we have transformed the Sonoran Desert since he and his brother drifted along the green lagoons.
References
Leopold, Aldo. A Sand County Almanac and Sketches Here and There. London: Oxford University Press, 1949.
Radding, Cynthia. Wandering Peoples: Colonialism, Ethnic Spaces, and Ecological Frontiers in Northwestern Mexico, 1700-1850. Durham: Duke University Press, 1997.
Shetler, Stanwyn. "Three Faces of Eden." Seeds of Change: A Quincentennial Commemoration. Herman J. Viola and Carolyn Margolis, eds. Washington, D.C.: Smithsonian Institution Press, 1991.
West, Robert. "The Mining Community in Northern New Spain: The Parral Mining District." Ibero-Americana. Berkeley: University of California Press, 1949.
Additional Reading
Bahre, Conrad. A Legacy of Change: Historic Human Impact on Vegetation of the Arizona Borderlands. Tucson: University of Arizona Press, 1991.
Bowden, Charles. Killing the Hidden Waters. Austin: University of Texas Press, 1977.
Fradkin, Philip. A River No More: The Colorado River and the West. Tucson: University of Arizona Press, 1984.
Nabhan, Gary. Gathering the Desert. Tucson: University of Arizona Press, 1985.
Reisner, Marc. Cadillac Desert: The American West and Its Disappearing Water. New York: Penguin Books, 1986.
Sheridan, Thomas. Arizona: A History. Tucson: University of Arizona Press, 1995.
© 2016, Arizona-Sonora Desert Museum 10/12
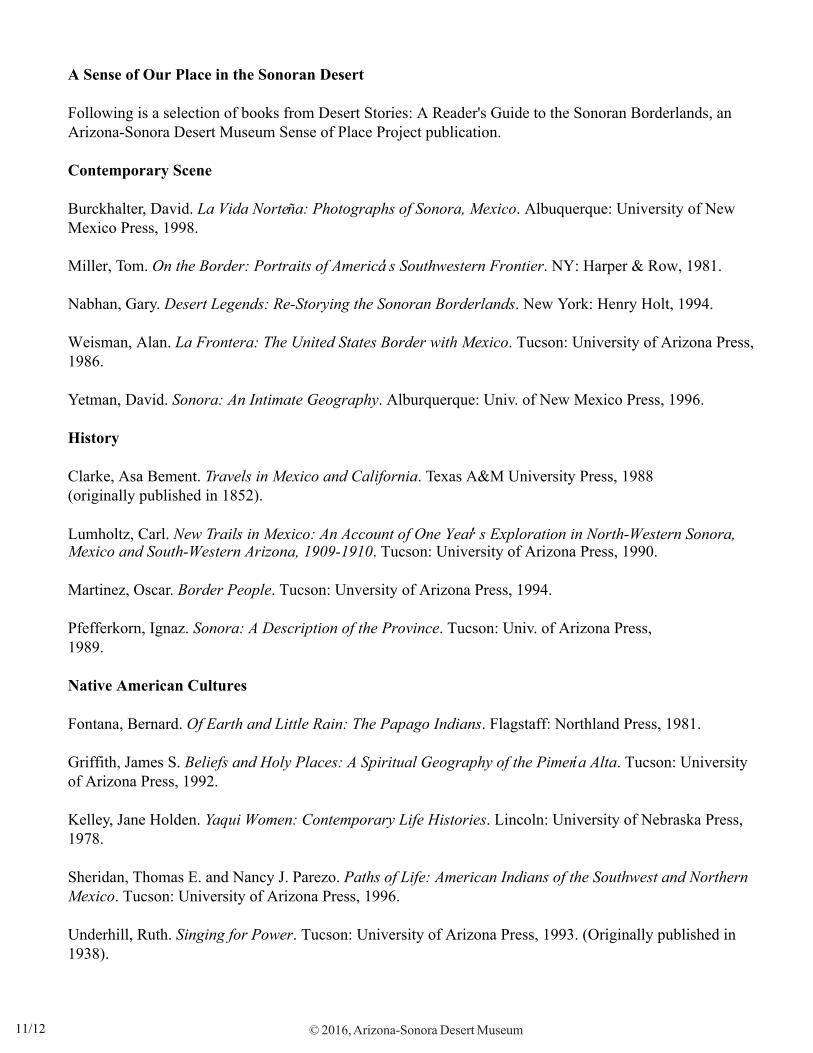
A Sense of Our Place in the Sonoran Desert
Following is a selection of books from Desert Stories: A Reader's Guide to the Sonoran Borderlands, an Arizona-Sonora Desert Museum Sense of Place Project publication.
Contemporary Scene
Burckhalter, David. La Vida Norteña: Photographs of Sonora, Mexico. Albuquerque: University of New Mexico Press, 1998.
Miller, Tom. On the Border: Portraits of America' s Southwestern Frontier. NY: Harper & Row, 1981.
Nabhan, Gary. Desert Legends: Re-Storying the Sonoran Borderlands. New York: Henry Holt, 1994.
Weisman, Alan. La Frontera: The United States Border with Mexico. Tucson: University of Arizona Press, 1986.
Yetman, David. Sonora: An Intimate Geography. Alburquerque: Univ. of New Mexico Press, 1996.
History
Clarke, Asa Bement. Travels in Mexico and California. Texas A&M University Press, 1988(originally published in 1852).
Lumholtz, Carl. New Trails in Mexico: An Account of One Year' s Exploration in North-Western Sonora, Mexico and South-Western Arizona, 1909-1910. Tucson: University of Arizona Press, 1990.
Martinez, Oscar. Border People. Tucson: Unversity of Arizona Press, 1994.
Pfefferkorn, Ignaz. Sonora: A Description of the Province. Tucson: Univ. of Arizona Press,1989.
Native American Cultures
Fontana, Bernard. Of Earth and Little Rain: The Papago Indians. Flagstaff: Northland Press, 1981.
Griffith, James S. Beliefs and Holy Places: A Spiritual Geography of the Pimería Alta. Tucson: University of Arizona Press, 1992.
Kelley, Jane Holden. Yaqui Women: Contemporary Life Histories. Lincoln: University of Nebraska Press, 1978.
Sheridan, Thomas E. and Nancy J. Parezo. Paths of Life: American Indians of the Southwest and Northern Mexico. Tucson: University of Arizona Press, 1996.
Underhill, Ruth. Singing for Power. Tucson: University of Arizona Press, 1993. (Originally published in 1938).
© 2016, Arizona-Sonora Desert Museum 11/12
Natural History and the Environment
Abbey, Edward. Cactus Country. New York: Time-Life, 1973.
Alcock, John. Sonoran Desert Summer. Tucson: University of Arizona Press, 1990.
Bowden, Charles. Sonoran Desert. New York: Harry N. Abrams, 1992.
Hayden, Julian D. The Sierra Pinacate. Tucson: Southwest Center Series, University of Arizona, 1998.
Hornaday, William T. Camp-fires on Desert and Lava. Tucson: University of Arizona Press, 1983.(First published in 1908).
Krutch, Joseph Wood. Desert Year. Tucson: University of Arizona Press, 1985.
Nabhan, Gary. The Desert Smells Like Rain. San Francisco: North Point Press, 1981.
West, Robert C. Sonora: Its Geographic Personality. University of Texas Press, 1993.
© 2016, Arizona-Sonora Desert Museum 12/12

The Schoolyard Bioblitz
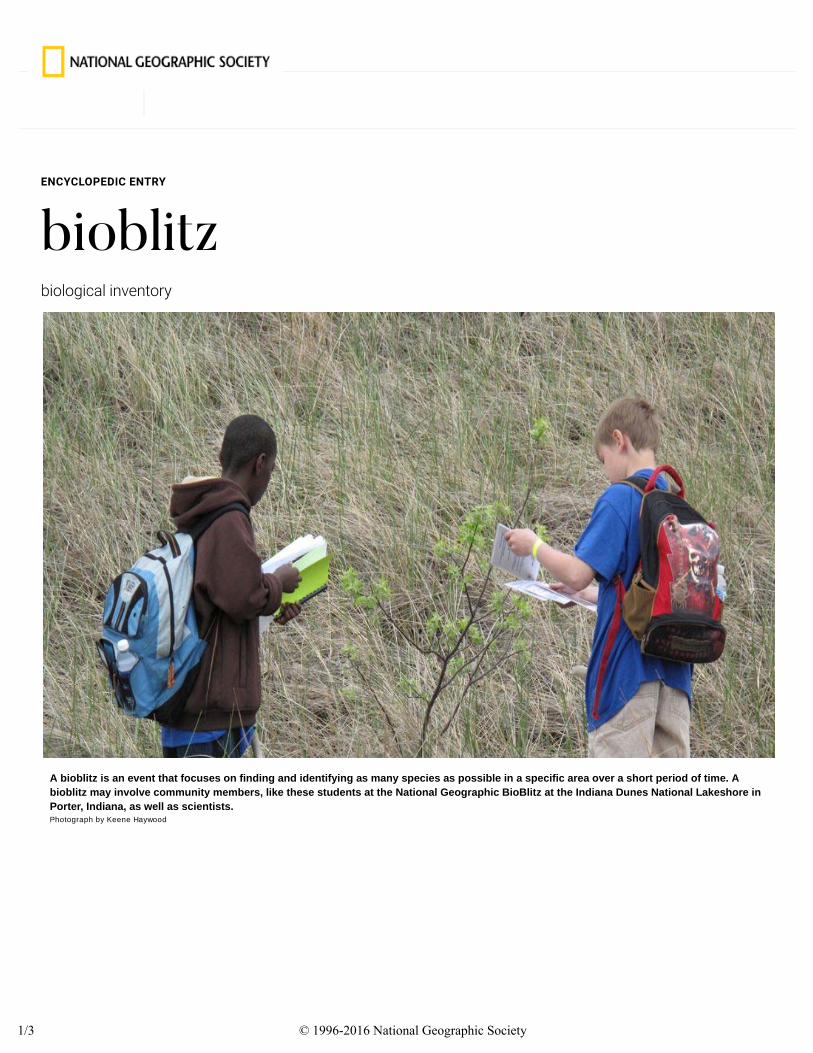
A bioblitz is an event that focuses on finding and identifying as many species as possible in a specific area over a short period of time. A bioblitz may involve community members, like these students at the National Geographic BioBlitz at the Indiana Dunes National Lakeshore in Porter, Indiana, as well as scientists.Photograph by Keene Haywood
© 1996-2016 National Geographic Society1/3
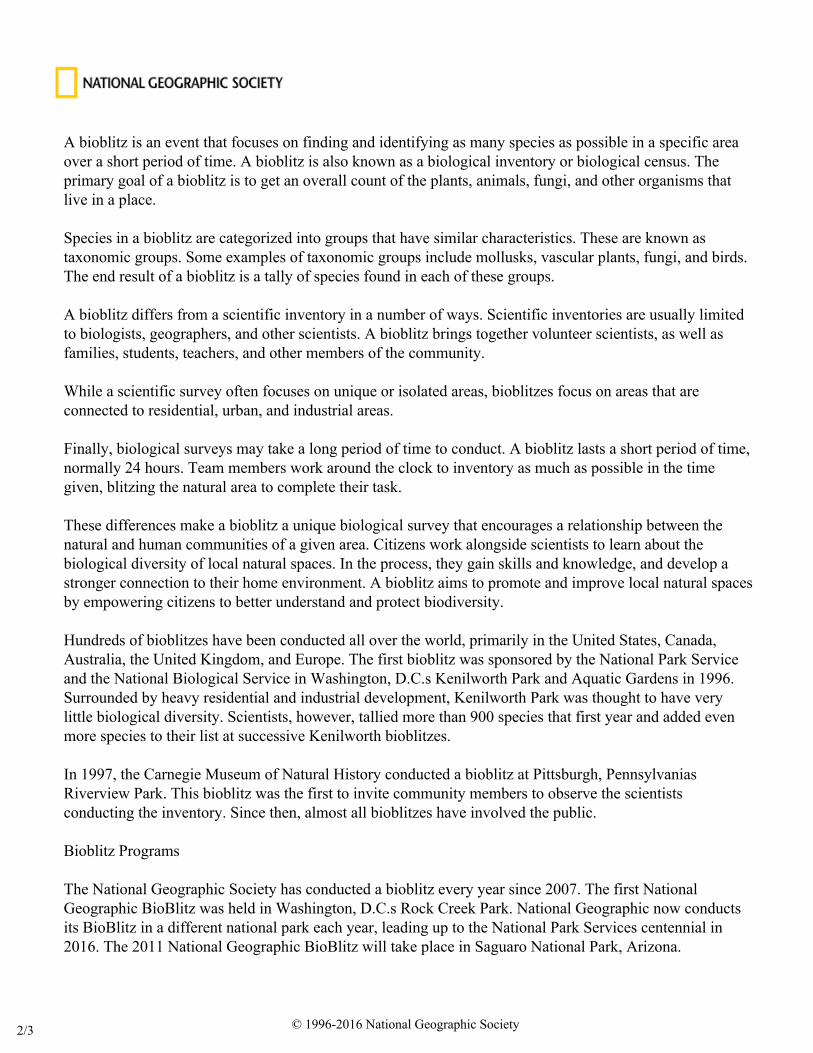
A bioblitz is an event that focuses on finding and identifying as many species as possible in a specific area over a short period of time. A bioblitz is also known as a biological inventory or biological census. The primary goal of a bioblitz is to get an overall count of the plants, animals, fungi, and other organisms that live in a place.
Species in a bioblitz are categorized into groups that have similar characteristics. These are known as taxonomic groups. Some examples of taxonomic groups include mollusks, vascular plants, fungi, and birds. The end result of a bioblitz is a tally of species found in each of these groups.
A bioblitz differs from a scientific inventory in a number of ways. Scientific inventories are usually limited to biologists, geographers, and other scientists. A bioblitz brings together volunteer scientists, as well as families, students, teachers, and other members of the community.
While a scientific survey often focuses on unique or isolated areas, bioblitzes focus on areas that are connected to residential, urban, and industrial areas.
Finally, biological surveys may take a long period of time to conduct. A bioblitz lasts a short period of time, normally 24 hours. Team members work around the clock to inventory as much as possible in the time given, blitzing the natural area to complete their task.
These differences make a bioblitz a unique biological survey that encourages a relationship between the natural and human communities of a given area. Citizens work alongside scientists to learn about the biological diversity of local natural spaces. In the process, they gain skills and knowledge, and develop a stronger connection to their home environment. A bioblitz aims to promote and improve local natural spaces by empowering citizens to better understand and protect biodiversity.
Hundreds of bioblitzes have been conducted all over the world, primarily in the United States, Canada, Australia, the United Kingdom, and Europe. The first bioblitz was sponsored by the National Park Service and the National Biological Service in Washington, D.C.s Kenilworth Park and Aquatic Gardens in 1996. Surrounded by heavy residential and industrial development, Kenilworth Park was thought to have very little biological diversity. Scientists, however, tallied more than 900 species that first year and added even more species to their list at successive Kenilworth bioblitzes.
In 1997, the Carnegie Museum of Natural History conducted a bioblitz at Pittsburgh, Pennsylvanias Riverview Park. This bioblitz was the first to invite community members to observe the scientists conducting the inventory. Since then, almost all bioblitzes have involved the public.
Bioblitz Programs
The National Geographic Society has conducted a bioblitz every year since 2007. The first National Geographic BioBlitz was held in Washington, D.C.s Rock Creek Park. National Geographic now conducts its BioBlitz in a different national park each year, leading up to the National Park Services centennial in 2016. The 2011 National Geographic BioBlitz will take place in Saguaro National Park, Arizona.
© 1996-2016 National Geographic Society2/3
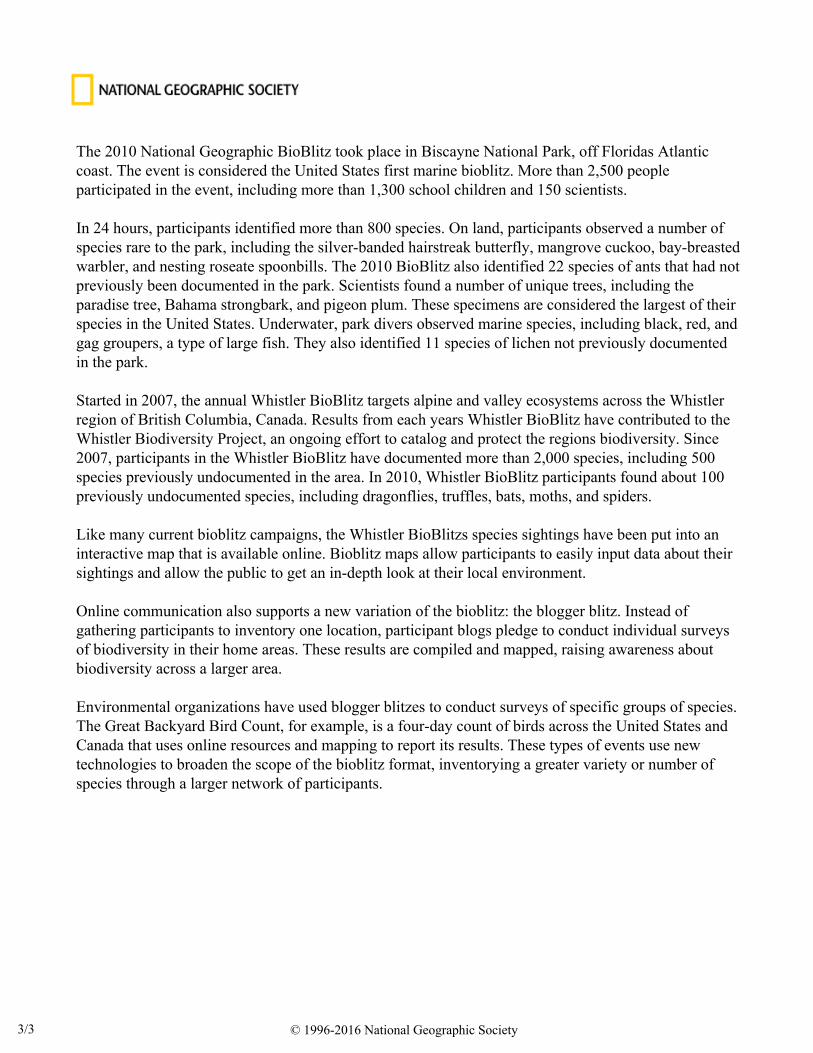
The 2010 National Geographic BioBlitz took place in Biscayne National Park, off Floridas Atlantic coast. The event is considered the United States first marine bioblitz. More than 2,500 people participated in the event, including more than 1,300 school children and 150 scientists.
In 24 hours, participants identified more than 800 species. On land, participants observed a number of species rare to the park, including the silver-banded hairstreak butterfly, mangrove cuckoo, bay-breasted warbler, and nesting roseate spoonbills. The 2010 BioBlitz also identified 22 species of ants that had not previously been documented in the park. Scientists found a number of unique trees, including the paradise tree, Bahama strongbark, and pigeon plum. These specimens are considered the largest of their species in the United States. Underwater, park divers observed marine species, including black, red, and gag groupers, a type of large fish. They also identified 11 species of lichen not previously documented in the park.
Started in 2007, the annual Whistler BioBlitz targets alpine and valley ecosystems across the Whistler region of British Columbia, Canada. Results from each years Whistler BioBlitz have contributed to the Whistler Biodiversity Project, an ongoing effort to catalog and protect the regions biodiversity. Since 2007, participants in the Whistler BioBlitz have documented more than 2,000 species, including 500 species previously undocumented in the area. In 2010, Whistler BioBlitz participants found about 100 previously undocumented species, including dragonflies, truffles, bats, moths, and spiders.
Like many current bioblitz campaigns, the Whistler BioBlitzs species sightings have been put into an interactive map that is available online. Bioblitz maps allow participants to easily input data about their sightings and allow the public to get an in-depth look at their local environment.
Online communication also supports a new variation of the bioblitz: the blogger blitz. Instead of gathering participants to inventory one location, participant blogs pledge to conduct individual surveys of biodiversity in their home areas. These results are compiled and mapped, raising awareness about biodiversity across a larger area.
Environmental organizations have used blogger blitzes to conduct surveys of specific groups of species. The Great Backyard Bird Count, for example, is a four-day count of birds across the United States and Canada that uses online resources and mapping to report its results. These types of events use new technologies to broaden the scope of the bioblitz format, inventorying a greater variety or number of species through a larger network of participants.
© 1996-2016 National Geographic Society3/3
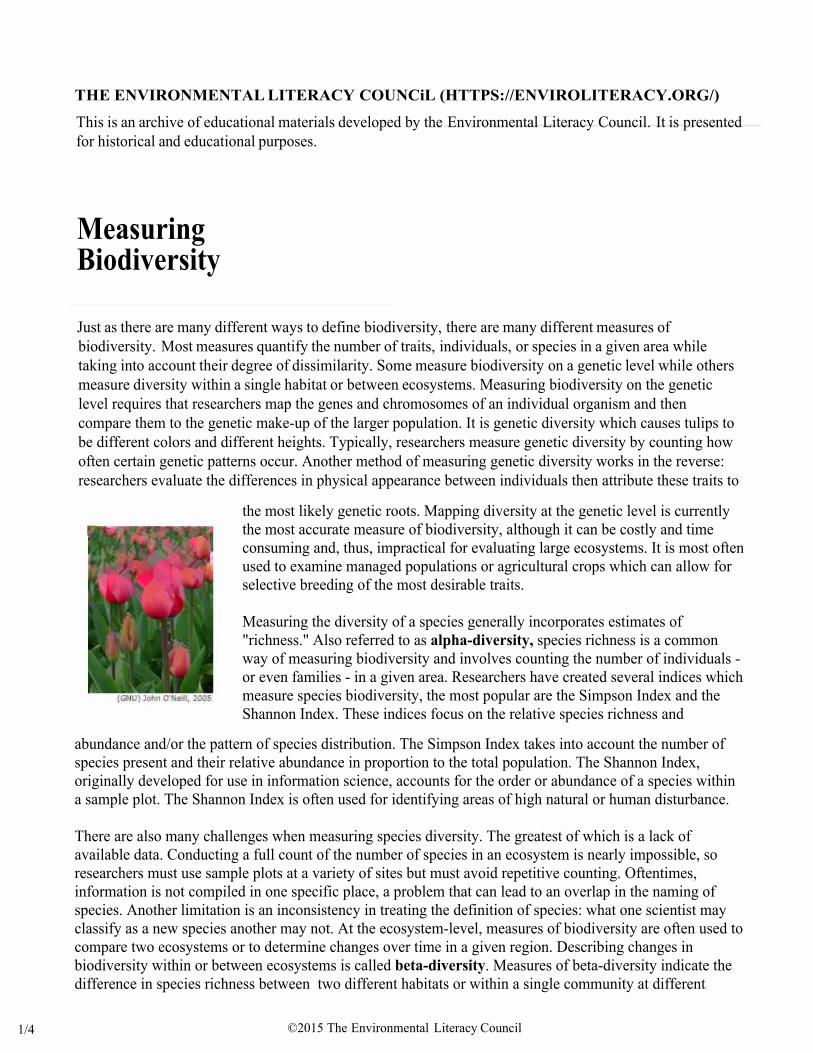
THE ENVIRONMENTAL LITERACY COUNCiL (HTTPS://ENVIROLITERACY.ORG/)
Measuring Biodiversity
Just as there are many different ways to define biodiversity, there are many different measures of biodiversity. Most measures quantify the number of traits, individuals, or species in a given area while taking into account their degree of dissimilarity. Some measure biodiversity on a genetic level while others measure diversity within a single habitat or between ecosystems. Measuring biodiversity on the genetic level requires that researchers map the genes and chromosomes of an individual organism and then compare them to the genetic make-up of the larger population. It is genetic diversity which causes tulips to be different colors and different heights. Typically, researchers measure genetic diversity by counting how often certain genetic patterns occur. Another method of measuring genetic diversity works in the reverse: researchers evaluate the differences in physical appearance between individuals then attribute these traits to
This is an archive of educational materials developed by the Environmental Literacy Council. It is presented for historical and educational purposes.
the most likely genetic roots. Mapping diversity at the genetic level is currently the most accurate measure of biodiversity, although it can be costly and time consuming and, thus, impractical for evaluating large ecosystems. It is most often used to examine managed populations or agricultural crops which can allow for selective breeding of the most desirable traits.
Measuring the diversity of a species generally incorporates estimates of "richness." Also referred to as alpha-diversity, species richness is a common way of measuring biodiversity and involves counting the number of individuals - or even families - in a given area. Researchers have created several indices which measure species biodiversity, the most popular are the Simpson Index and the Shannon Index. These indices focus on the relative species richness and
abundance and/or the pattern of species distribution. The Simpson Index takes into account the number of species present and their relative abundance in proportion to the total population. The Shannon Index, originally developed for use in information science, accounts for the order or abundance of a species within a sample plot. The Shannon Index is often used for identifying areas of high natural or human disturbance.
There are also many challenges when measuring species diversity. The greatest of which is a lack of available data. Conducting a full count of the number of species in an ecosystem is nearly impossible, so researchers must use sample plots at a variety of sites but must avoid repetitive counting. Oftentimes, information is not compiled in one specific place, a problem that can lead to an overlap in the naming of species. Another limitation is an inconsistency in treating the definition of species: what one scientist may classify as a new species another may not. At the ecosystem-level, measures of biodiversity are often used to compare two ecosystems or to determine changes over time in a given region. Describing changes in biodiversity within or between ecosystems is called beta-diversity. Measures of beta-diversity indicate the difference in species richness between two different habitats or within a single community at different
©2015 The Environmental Literacy Council 1/4
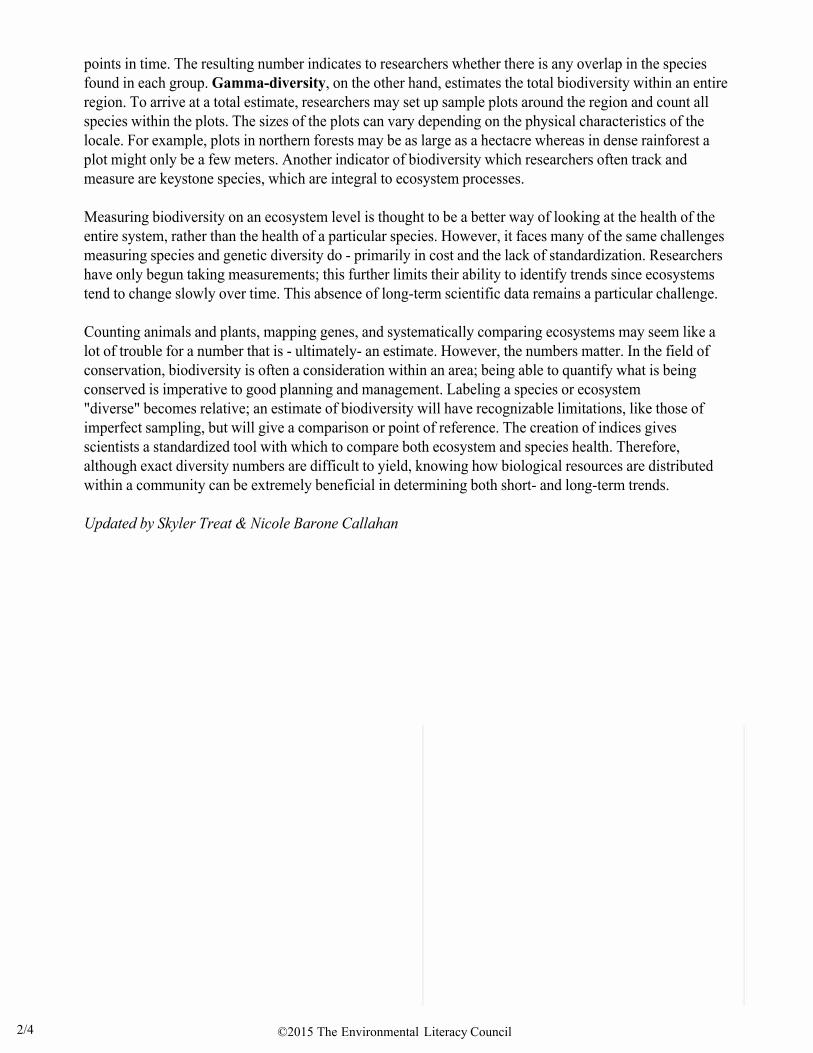
points in time. The resulting number indicates to researchers whether there is any overlap in the species found in each group. Gamma-diversity, on the other hand, estimates the total biodiversity within an entire region. To arrive at a total estimate, researchers may set up sample plots around the region and count all species within the plots. The sizes of the plots can vary depending on the physical characteristics of the locale. For example, plots in northern forests may be as large as a hectacre whereas in dense rainforest a plot might only be a few meters. Another indicator of biodiversity which researchers often track and measure are keystone species, which are integral to ecosystem processes.
Measuring biodiversity on an ecosystem level is thought to be a better way of looking at the health of the entire system, rather than the health of a particular species. However, it faces many of the same challenges measuring species and genetic diversity do - primarily in cost and the lack of standardization. Researchers have only begun taking measurements; this further limits their ability to identify trends since ecosystems tend to change slowly over time. This absence of long-term scientific data remains a particular challenge.
Counting animals and plants, mapping genes, and systematically comparing ecosystems may seem like a lot of trouble for a number that is - ultimately- an estimate. However, the numbers matter. In the field of conservation, biodiversity is often a consideration within an area; being able to quantify what is being conserved is imperative to good planning and management. Labeling a species or ecosystem "diverse" becomes relative; an estimate of biodiversity will have recognizable limitations, like those of imperfect sampling, but will give a comparison or point of reference. The creation of indices gives scientists a standardized tool with which to compare both ecosystem and species health. Therefore, although exact diversity numbers are difficult to yield, knowing how biological resources are distributed within a community can be extremely beneficial in determining both short- and long-term trends.
Updated by Skyler Treat & Nicole Barone Callahan
©2015 The Environmental Literacy Council 2/4
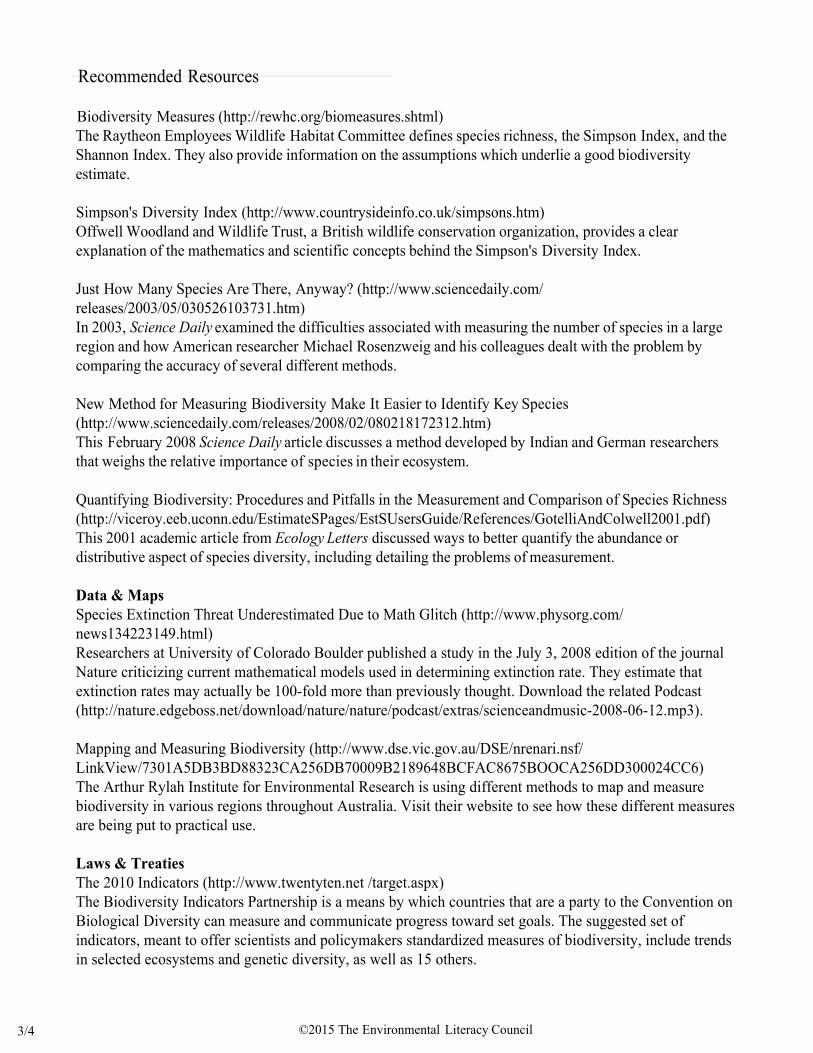
Recommended Resources
Biodiversity Measures (http://rewhc.org/biomeasures.shtml) The Raytheon Employees Wildlife Habitat Committee defines species richness, the Simpson Index, and the Shannon Index. They also provide information on the assumptions which underlie a good biodiversity estimate.
Simpson's Diversity Index (http://www.countrysideinfo.co.uk/simpsons.htm) Offwell Woodland and Wildlife Trust, a British wildlife conservation organization, provides a clear explanation of the mathematics and scientific concepts behind the Simpson's Diversity Index.
Just How Many Species Are There, Anyway? (http://www.sciencedaily.com/releases/2003/05/030526103731.htm) In 2003, Science Daily examined the difficulties associated with measuring the number of species in a large region and how American researcher Michael Rosenzweig and his colleagues dealt with the problem by comparing the accuracy of several different methods.
New Method for Measuring Biodiversity Make It Easier to Identify Key Species (http://www.sciencedaily.com/releases/2008/02/080218172312.htm) This February 2008 Science Daily article discusses a method developed by Indian and German researchers that weighs the relative importance of species in their ecosystem.
Quantifying Biodiversity: Procedures and Pitfalls in the Measurement and Comparison of Species Richness (http://viceroy.eeb.uconn.edu/EstimateSPages/EstSUsersGuide/References/GotelliAndColwell2001.pdf) This 2001 academic article from Ecology Letters discussed ways to better quantify the abundance or distributive aspect of species diversity, including detailing the problems of measurement.
Data & Maps Species Extinction Threat Underestimated Due to Math Glitch (http://www.physorg.com/news134223149.html) Researchers at University of Colorado Boulder published a study in the July 3, 2008 edition of the journal Nature criticizing current mathematical models used in determining extinction rate. They estimate that extinction rates may actually be 100-fold more than previously thought. Download the related Podcast (http://nature.edgeboss.net/download/nature/nature/podcast/extras/scienceandmusic-2008-06-12.mp3).
Mapping and Measuring Biodiversity (http://www.dse.vic.gov.au/DSE/nrenari.nsf/LinkView/7301A5DB3BD88323CA256DB70009B2189648BCFAC8675BOOCA256DD300024CC6) The Arthur Rylah Institute for Environmental Research is using different methods to map and measure biodiversity in various regions throughout Australia. Visit their website to see how these different measures are being put to practical use.
Laws & Treaties The 2010 Indicators (http://www.twentyten.net /target.aspx) The Biodiversity Indicators Partnership is a means by which countries that are a party to the Convention on Biological Diversity can measure and communicate progress toward set goals. The suggested set of indicators, meant to offer scientists and policymakers standardized measures of biodiversity, include trends in selected ecosystems and genetic diversity, as well as 15 others.
©2015 The Environmental Literacy Council 3/4
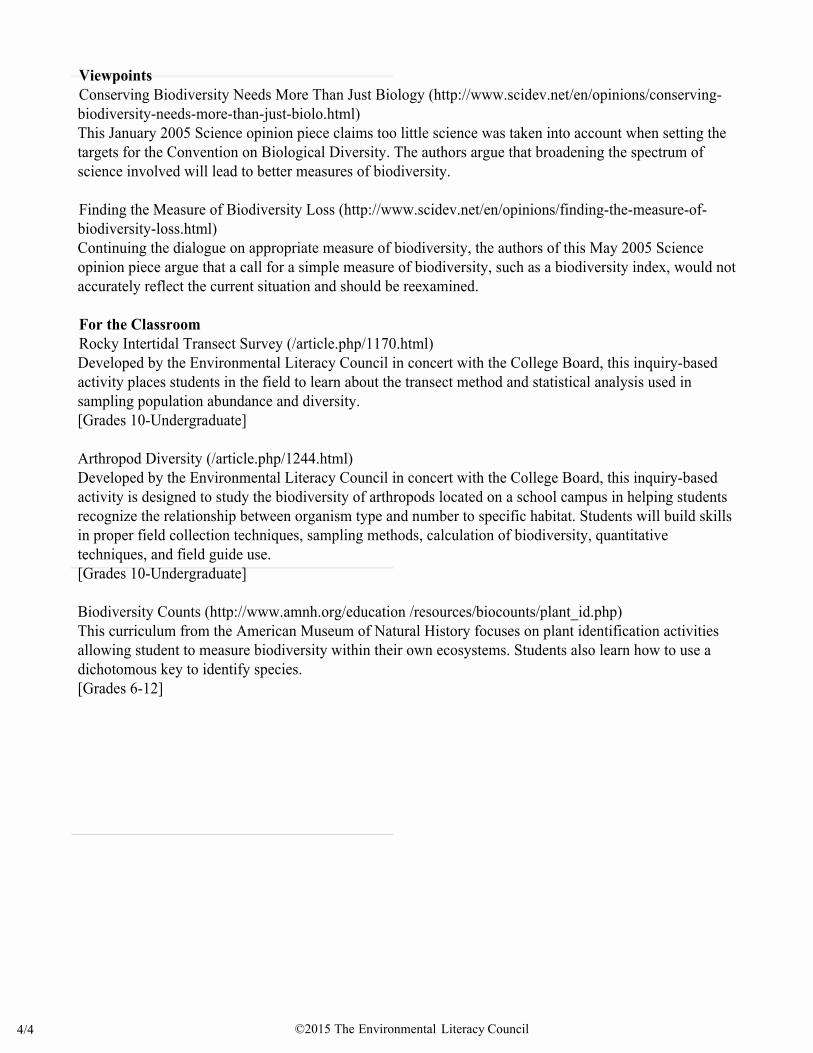
Viewpoints Conserving Biodiversity Needs More Than Just Biology (http://www.scidev.net/en/opinions/conserving-biodiversity-needs-more-than-just-biolo.html) This January 2005 Science opinion piece claims too little science was taken into account when setting the targets for the Convention on Biological Diversity. The authors argue that broadening the spectrum of science involved will lead to better measures of biodiversity.
Finding the Measure of Biodiversity Loss (http://www.scidev.net/en/opinions/finding-the-measure-of-biodiversity-loss.html) Continuing the dialogue on appropriate measure of biodiversity, the authors of this May 2005 Science opinion piece argue that a call for a simple measure of biodiversity, such as a biodiversity index, would not accurately reflect the current situation and should be reexamined.
For the Classroom Rocky Intertidal Transect Survey (/article.php/1170.html) Developed by the Environmental Literacy Council in concert with the College Board, this inquiry-based activity places students in the field to learn about the transect method and statistical analysis used in sampling population abundance and diversity. [Grades 10-Undergraduate]
Arthropod Diversity (/article.php/1244.html) Developed by the Environmental Literacy Council in concert with the College Board, this inquiry-based activity is designed to study the biodiversity of arthropods located on a school campus in helping students recognize the relationship between organism type and number to specific habitat. Students will build skills in proper field collection techniques, sampling methods, calculation of biodiversity, quantitative techniques, and field guide use. [Grades 10-Undergraduate]
Biodiversity Counts (http://www.amnh.org/education /resources/biocounts/plant_id.php) This curriculum from the American Museum of Natural History focuses on plant identification activities allowing student to measure biodiversity within their own ecosystems. Students also learn how to use a dichotomous key to identify species. [Grades 6-12]
©2015 The Environmental Literacy Council 4/4
The Schoolyard Bioblitz
Kim Franklin, Arizona-Sonora Desert Museum Supported by The Caterpillar Foundation
Teaching Scientific Practices Through an Investigation of Biodiversity: The Schoolyard Bioblitz
OverviewStudents will develop an understanding of the concept of biodiversity and the connections between organisms and their environment. They will engage in the scientific process by asking questions about biodiversity in their schoolyards, by designing a plan to carry out a ‘bioblitz,’ analyzing the resulting data, and developing new questions based on their results. The biodiversity data gathered by students during the bioblitz will be shared with other schools as well as scientists through an online data-sharing network called iNaturalist. They will analyze their own data but may also compare their data to data collected by students at other schools. Data analysis will lead to the development of new questions and hypotheses that may be explored in future investigations. In addition to advancing their STEM skills, students will develop a deeper appreciation of nature and an understanding of the importance of biodiversity.
Core Questions• What are the major components of biodiversity?• What is a ‘bioblitz’?• Why is biodiversity important?• What are the main drivers of biodiversity loss?
Arizona Academic Standards • Common Core Mathematics:
Grades 1, 2, & 3:Grades 4 & 5: Represent and Interpret Data (bar graphs, pie charts); Extend Understanding ofFraction Equivalence and OrderingGrade 6:Grade 7: Draw informal comparative inferences about two populationsGrade 8:
• Science:S1C1: Formulate predictions, questions or hypotheses based on observationsS1C2: Design and conduct controlled investigationsS1C3: Analyze and interpret data to explain results; Formulate new questionsS4C3: Analyze the relationships among various organisms and their environment
Next Generation Science and Engineering Practices• Asking questions (for science) and defining problems (for engineering)• Planning and carrying out investigations• Analyzing and interpreting data• Using mathematics and computational thinking• Constructing explanations (for science) and designing solutions (for engineering)• Engaging in argument from evidence• Obtaining, evaluating, and communicating information
© 2016 Arizona-Sonora Desert Museum 1/6
Background
The concept of biodiversity encompasses genetic diversity, species diversity and ecosystem diversity. In this lesson we focus on species diversity, which is arguable the simplest measure of biodiversity. Scientists have formally described nearly 2 million species from our planet, but this total makes up only a small proportion of the actual number of species on our planet, which a recent estimate puts at 8.7 million species, give or take 1.3 million. This means that the overwhelming majority of species on our planet still await discovery!
Who makes up these 2 million described species and over 6 million undescribed species? Animals make up about 1 million of our described species, plants about 250,000 described species, and fungi about 100,000 described species. The remaining species are protists (single-celled organisms that are not bacteria) and bacteria. Within Kingdom Animalia arthropods (animals with exoskeleton and jointed appendages, including arachnids, insects, and crustaceans) make up over 85% of described species.
So why do we care about biodiversity? Biodiversity provides us with myriad natural resources that sustain human life on our planet. The most basic of these resources are clean air and water, which are provided by healthy ecosystems made up of complex webs of interacting species. One of the best examples is that of New York City, which boasts the largest unfiltered water storage and supply system in the nation. In fact the water is purified, but the purification is performed by the soil, microbes, plants and animals in the watershed that lies northeast of the city. Preserving this watershed has eliminated the need to build a water filtration system with an estimated construction cost of $6-8 billion and annual operating costs in the hundreds of millions. Other resources derived from biodiversity include food, medicine, and raw materials used in a wide variety of industries. For example, the FAO estimates that of the slightly more than 100 food crops that comprise over 90% of global food supply, 71 are pollinated by bees, primarily wild bees. Or consider that 25% of prescription drugs in the U.S. contain ingredients derived from plants. Furthermore, there are many values of biodiversity that are more difficult to quantify. How much might the enormous biodiversity of southern Arizona contribute to the value of the region’s tourism industry?
The biodiversity of our planet is declining dramatically. This decline has direct consequences for the human population, such as the loss of species that we once depended upon for food and the deterioration of healthy ecosystems that provide us with a wide variety of services. Human actions are driving this decline in biodiversity. The most significant driver has been habitat loss and degradation. Over 83% of the ice-free land surface has been directly impacted by humanity (Sanderson et al. 2002). The other main drivers of biodiversity declines include invasive species, climate change, and nutrient enrichment, primarily the result of heavy fertilizer use.
Although the biodiversity of our planet is declining overall, scientists have been documenting recent increases in urban biodiversity. In the arid Southwest, you’ll find the highest concentrations of biodiversity in places with water. Increasingly, these places include our cities. For some species, our cities can also be places to find abundant food resources. Consider the floral resources available to bees in our cities or the abundance of rodents and pigeons available to the red tailed hawks and great horned owls that live with us in Tucson. Not only do many of our cities hold a wealth of biodiversity, but these species also perform valuable services for us, free of charge. Recently scientists measured the quantity of food waste processed by ants and other arthropods on the streets on New York City, finding that these animals consume about 14 pounds of food waste per city block per year!
© 2016 Arizona-Sonora Desert Museum 2/6
A bioblitz is a rapid biodiversity survey. Conducting a bioblitz in the schoolyard is an excellent way to engage students in science and hopefully give them a sense of appreciation for the biodiversity in their own neighborhoods. Also known as a biological inventory or biological census, a bioblitz is an event in which a group of people attempts to find and document as many species as possible in a specific area over a short period of time. The primary goal of a bioblitz is to get an overall count of the different types of plants, animals, fungi, and other organisms that live in a place. A bioblitz brings together volunteer scientists, as well as families, students, teachers, and other members of the community. Because bioblitzes can be conducted by basically anyone and happen in a short period of time—usually 24 hours—it is a good activity to do in the schoolyard with students. However, bioblitzes have been conducted all over the world. The National Geographic Society conducted one in the Saguaro National Park in 2011. Working together, scientists and the Tucson community documented nearly 1,000 species in the park in just 24 hours. But the desert doesn’t stop at park boundaries. We are excited to start learning about the species that are living with us in our city through the efforts of students across Tucson!
Recommended Reading• Causes and Consequences of Biodiversity Declines -
http://www.nature.com/scitable/knowledge/library/causes-and-consequences-of-biodiversity-declines-16132475
• Why Conserve Biodiversity? -http://www.nature.com/scitable/knowledge/library/conservation-of-biodiversity-13235087
• National Geographic: Bioblitz -http://education.nationalgeographic.com/education/encyclopedia/bioblitz/?ar_a=1
• National Geographic Bioblitz Educational Resources -http://education.nationalgeographic.com/education/programs/bioblitz/?ar_a=1
• Saguaro National Park Electronic Field Trip Educational Resources -http://www.electronicfieldtrip.org/saguaro/10modules.php
Materials Cameras Pencil and field notebook or Species Observation Worksheet and clipboard Hand-held GPS system (optional) Binoculars (optional)
Day 1: Concept introduction and preparation for fieldwork
Core Questions• What is biodiversity?• Why is biodiversity important?• What is a bioblitz?• What types of challenges face scientists as they try to measure biodiversity?
Introduction of Core Concepts Introduce the core concepts of biodiversity, species, and bioblitz through the provided presentation or other means.
© 2016 Arizona-Sonora Desert Museum 3/6
Optional Activities
Activity 1: (10 minutes) Put students into teams. Give teams a variety of categories for which they are to generate a list of species (eg. Sonoran Desert species, plants, animals, mammals or endangered species) Allow them to work for 5 minutes, writing down all the species they can think of. The team with the most organisms written down wins.
Activity 2: Watch the video on the 2011 Saguaro National Park Bioblitz and discuss the differences between a bioblitz at the scale of Saguaro National Park versus the scale of a schoolyard or neighborhood.
Have students form groups and design a plan for a bioblitz in the schoolyard. Each group will need at least one camera. If permitted, students may use their phone cameras. If students will be using their own camera, make sure they are capable of transferring the photos they take from their cameras to a computer; they must either have a usb cable to connect their phone to a computer or have email capability on their phone. One or more students in each group should be assigned to be the photographer(s) and official data recorder(s).
Day 2: The Bioblitz
Review the purpose of the bioblitz and have students review their plans. Important reminders for students:
• Photos should allow others to identify the observed species (eg. photos of plants should include thewhole plant, leaves, flowers, and other important parts; photos of insects should be taken atdifferent angles and might include the structures they build)
• Photos should be linked to the written observations on the Species Observation Worksheet or fieldnotebook
• Students should expect to find plants and a variety of animals (mostly insects, but also lizards,birds, and mammals)
• Students should explore all the different habitats present in the schoolyard. Moist areas or areaswith standing water are especially good places to look for plants and animals
• Students should spend at least a few minutes sitting quietly to collect observations of lizards, birds,& mammals
GPS Lesson (Optional): See Explanation of GPS, which explains how to use hand-held GPS units to record the precise location of observations.
Get into Groups: Students should have been assigned to groups on Day 1. Remind students of the roles of different group members. At a minimum each groups needs a photographer and official data recorder.
Distribute Materials: Distribute the Species Observation Worksheet and clipboards (optional), GPS units (optional), binoculars (optional), and plant press (optional) to students. Also remind the students to bring their cameras (not optional). If not using the Species Observation Worksheet, students should be prepared to record their observations in a notebook of some sort.
Collect Observations (Conduct the Bioblitz!): Allow the students at least 30 minutes to explore the schoolyard environment and make observations of all species that they encounter.
© 2016 Arizona-Sonora Desert Museum 4/6
Species Identification: Most likely the students will not know the names of the majority of the species they observed during their schoolyard explorations. It is not necessary to name each species, but it is necessary to differentiate one species from another in order to tally the total number of species observed during the bioblitz. Species identification does provide students with the opportunity to learn more about the biology and ecology of the organisms they observed. There are several options for species identification:
• Students can work in their groups on identification in the classroom with field guides and otherresources (eg. electronic field guides if access to internet is available) provided by teachers/edspecialists. The Easy Field Guide Series from American Traveler Press provides the opportunity tointroduce dichotomous keys for certain species groups (eg. cacti).
• Each student can be assigned a number of observations for identification as a homework assignment.A list of identification resources should be provided.
• Students (if using their own cameras) or teachers (if using borrowed cameras) can upload theirobservations to iNaturalist and invite others to identify the pictured species (see below).
Uploading Observations to iNaturalist: Observations lie at the core of iNaturalist. An observation is basically a species you observed, a time, and a place. Uploading species observations to iNaturalist is easy. Hopefully students will have taken a photo of each species they observed. Although observations without photos may be uploaded, this is discouraged. After all observations are uploaded, iNaturalist will tally the total number of observations and total number of species for you. See the iNaturalist instruction sheet for more information.
Alternative to iNaturalist: If your students do not have access to iNaturalist, you can still create a list of all observations and all species recorded by the class. Remember that the same species is likely to have been recorded by more than one group. Thus your species total will almost certainly be lower than your observations total.
Day 3: Data Analysis and Discussion
Core Questions• What is a habitat? a microhabitat?• What do organisms need to survive and reproduce?• What are native and non-native species?• What is a descriptive question? a causal question?
desert scrub habitat. Within each of these habitats we could likely find many different microhabitats.
Background
Measuring biodiversity is not easy. The simplest measure of diversity is just a count of the total number of species in a given area at a given time. This is known as species richness. There are also a variety of species diversity indices, none of which are without controversy. Calculating species diversity indices requires the collection of abundance data for each species (i.e. the number of individuals observed for each species), which is not the focus of a bioblitz.
A habitat is the place in which an organism lives. Let’s consider a species found in the Sonoran Desert. The Gila woodpecker is a species of bird found throughout the Sonoran Desert in low elevation desert scrub habitat. Although desert scrub is a habitat in its own right, there are many other smaller habitats contained within this larger habitat. Smaller habitats contained with larger habitats are called
© 2016 Arizona-Sonora Desert Museum 5/6
microhabitats. For example, cactus rots are important microhabitats within the desert scrub environment. A cactus rot is created when a cactus dies or is damaged and begins to decompose. Many species of bacteria, yeasts, and arthropods make their home in cactus rots.
In the schoolyard, different habitats may be distinguished from each other by differences in landscaping. For example, much of the schoolyard may be irrigated and landscaped mostly with non-native plants, while a portion of the schoolyard may be not be irrigated and planted with only native desert species. We might describe the former as urban desert habitat and the latter habitat as remnant desert scrub habitat. Within each of these habitats we could likely find many different microhabitats.
Data Analysis & Discussion Questions
• Make a bar chart showing the species totals for each schoolyard habitat that was explored. Whichhabitats within the schoolyard had the greatest species diversity? Why were some habitats morediverse than others?
• Make a bar chart that shows the species totals for plants and animals separately, for eachschoolyard habitat that was explored. Which habitats had the greatest diversity of plants andanimals? Are these the same habitats for each group of organisms? Why might one habitat supporta larger number of plant species while a different habitat supports a greater number of animalspecies?
• Explain some problems that scientists face when they try to quantify the biodiversity of a givenarea?
• What happens when new plants are introduced to a habitat? Do they have a negative impact on thenative plants growing there?
Optional Activities
Field Guide Have the class create a field guide for the plants they found. Each page should include a sketch of the plant and a description of its flower, leaves, size, bloom time, and a general description of the habitat, as well as a map of the range where the plant can be found. Gather the field guide pages together to use as reference for studying plants throughout the school year.
Classifying Organisms To help them study all the varied organisms that live on our planet, scientists have devised a system of classification that includes five different kingdoms—Archaea, Eubacteria (“true” bacteria), Protista, Plantae, Fungi, and Animalia. Have students name three species considered part of each kingdom, with the exception of Archaea, which may not be familiar to most students. Ask students to identify each organism as unicellular or multicellular and to describe its nutrition, movement, and whether it reproduces sexually or asexually.
© 2016 Arizona-Sonora Desert Museum 6/6
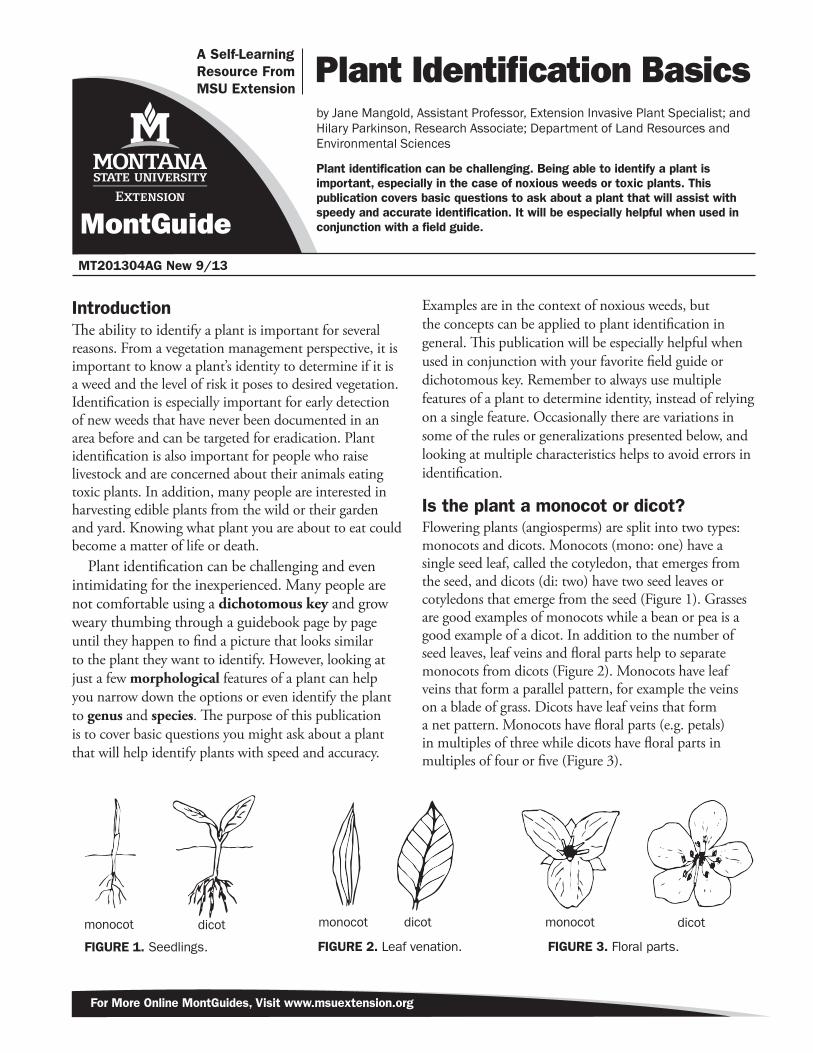
IntroductionThe ability to identify a plant is important for several reasons. From a vegetation management perspective, it is important to know a plant’s identity to determine if it is a weed and the level of risk it poses to desired vegetation. Identification is especially important for early detection of new weeds that have never been documented in an area before and can be targeted for eradication. Plant identification is also important for people who raise livestock and are concerned about their animals eating toxic plants. In addition, many people are interested in harvesting edible plants from the wild or their garden and yard. Knowing what plant you are about to eat could become a matter of life or death.
Plant identification can be challenging and even intimidating for the inexperienced. Many people are not comfortable using a dichotomous key and grow weary thumbing through a guidebook page by page until they happen to find a picture that looks similar to the plant they want to identify. However, looking at just a few morphological features of a plant can help you narrow down the options or even identify the plant to genus and species. The purpose of this publication is to cover basic questions you might ask about a plant that will help identify plants with speed and accuracy.
Examples are in the context of noxious weeds, but the concepts can be applied to plant identification in general. This publication will be especially helpful when used in conjunction with your favorite field guide or dichotomous key. Remember to always use multiple features of a plant to determine identity, instead of relying on a single feature. Occasionally there are variations in some of the rules or generalizations presented below, and looking at multiple characteristics helps to avoid errors in identification.
Is the plant a monocot or dicot?Flowering plants (angiosperms) are split into two types: monocots and dicots. Monocots (mono: one) have a single seed leaf, called the cotyledon, that emerges from the seed, and dicots (di: two) have two seed leaves or cotyledons that emerge from the seed (Figure 1). Grasses are good examples of monocots while a bean or pea is a good example of a dicot. In addition to the number of seed leaves, leaf veins and floral parts help to separate monocots from dicots (Figure 2). Monocots have leaf veins that form a parallel pattern, for example the veins on a blade of grass. Dicots have leaf veins that form a net pattern. Monocots have floral parts (e.g. petals) in multiples of three while dicots have floral parts in multiples of four or five (Figure 3).
FIGURE 1. Seedlings. FIGURE 2. Leaf venation. FIGURE 3. Floral parts.
monocot dicot monocot dicot monocot dicot
For More Online MontGuides, Visit www.msuextension.org
MontGuide MT201304AG New 9/13
Plant identification can be challenging. Being able to identify a plant is important, especially in the case of noxious weeds or toxic plants. This publication covers basic questions to ask about a plant that will assist with speedy and accurate identification. It will be especially helpful when used in conjunction with a field guide.
Plant Identification Basicsby Jane Mangold, Assistant Professor, Extension Invasive Plant Specialist; and Hilary Parkinson, Research Associate; Department of Land Resources and Environmental Sciences
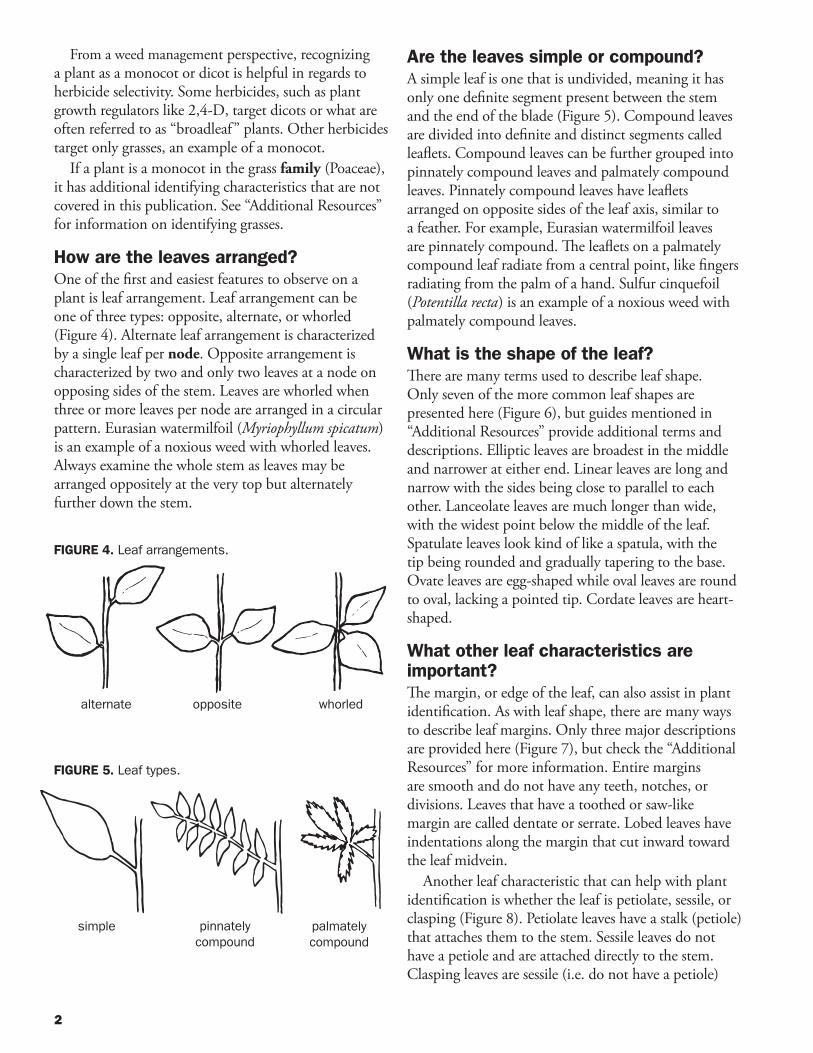
2
From a weed management perspective, recognizing a plant as a monocot or dicot is helpful in regards to herbicide selectivity. Some herbicides, such as plant growth regulators like 2,4-D, target dicots or what are often referred to as “broadleaf” plants. Other herbicides target only grasses, an example of a monocot.
If a plant is a monocot in the grass family (Poaceae), it has additional identifying characteristics that are not covered in this publication. See “Additional Resources” for information on identifying grasses.
How are the leaves arranged?One of the first and easiest features to observe on a plant is leaf arrangement. Leaf arrangement can be one of three types: opposite, alternate, or whorled (Figure 4). Alternate leaf arrangement is characterized by a single leaf per node. Opposite arrangement is characterized by two and only two leaves at a node on opposing sides of the stem. Leaves are whorled when three or more leaves per node are arranged in a circular pattern. Eurasian watermilfoil (Myriophyllum spicatum) is an example of a noxious weed with whorled leaves. Always examine the whole stem as leaves may be arranged oppositely at the very top but alternately further down the stem.
Are the leaves simple or compound?A simple leaf is one that is undivided, meaning it has only one definite segment present between the stem and the end of the blade (Figure 5). Compound leaves are divided into definite and distinct segments called leaflets. Compound leaves can be further grouped into pinnately compound leaves and palmately compound leaves. Pinnately compound leaves have leaflets arranged on opposite sides of the leaf axis, similar to a feather. For example, Eurasian watermilfoil leaves are pinnately compound. The leaflets on a palmately compound leaf radiate from a central point, like fingers radiating from the palm of a hand. Sulfur cinquefoil (Potentilla recta) is an example of a noxious weed with palmately compound leaves.
What is the shape of the leaf?There are many terms used to describe leaf shape. Only seven of the more common leaf shapes are presented here (Figure 6), but guides mentioned in “Additional Resources” provide additional terms and descriptions. Elliptic leaves are broadest in the middle and narrower at either end. Linear leaves are long and narrow with the sides being close to parallel to each other. Lanceolate leaves are much longer than wide, with the widest point below the middle of the leaf. Spatulate leaves look kind of like a spatula, with the tip being rounded and gradually tapering to the base. Ovate leaves are egg-shaped while oval leaves are round to oval, lacking a pointed tip. Cordate leaves are heart-shaped.
What other leaf characteristics are important?The margin, or edge of the leaf, can also assist in plant identification. As with leaf shape, there are many ways to describe leaf margins. Only three major descriptions are provided here (Figure 7), but check the “Additional Resources” for more information. Entire margins are smooth and do not have any teeth, notches, or divisions. Leaves that have a toothed or saw-like margin are called dentate or serrate. Lobed leaves have indentations along the margin that cut inward toward the leaf midvein.
Another leaf characteristic that can help with plant identification is whether the leaf is petiolate, sessile, or clasping (Figure 8). Petiolate leaves have a stalk (petiole) that attaches them to the stem. Sessile leaves do not have a petiole and are attached directly to the stem. Clasping leaves are sessile (i.e. do not have a petiole)
alternate opposite whorled
FIGURE 4. Leaf arrangements.
pinnatelycompound
FIGURE 5. Leaf types.
palmatelycompound
simple
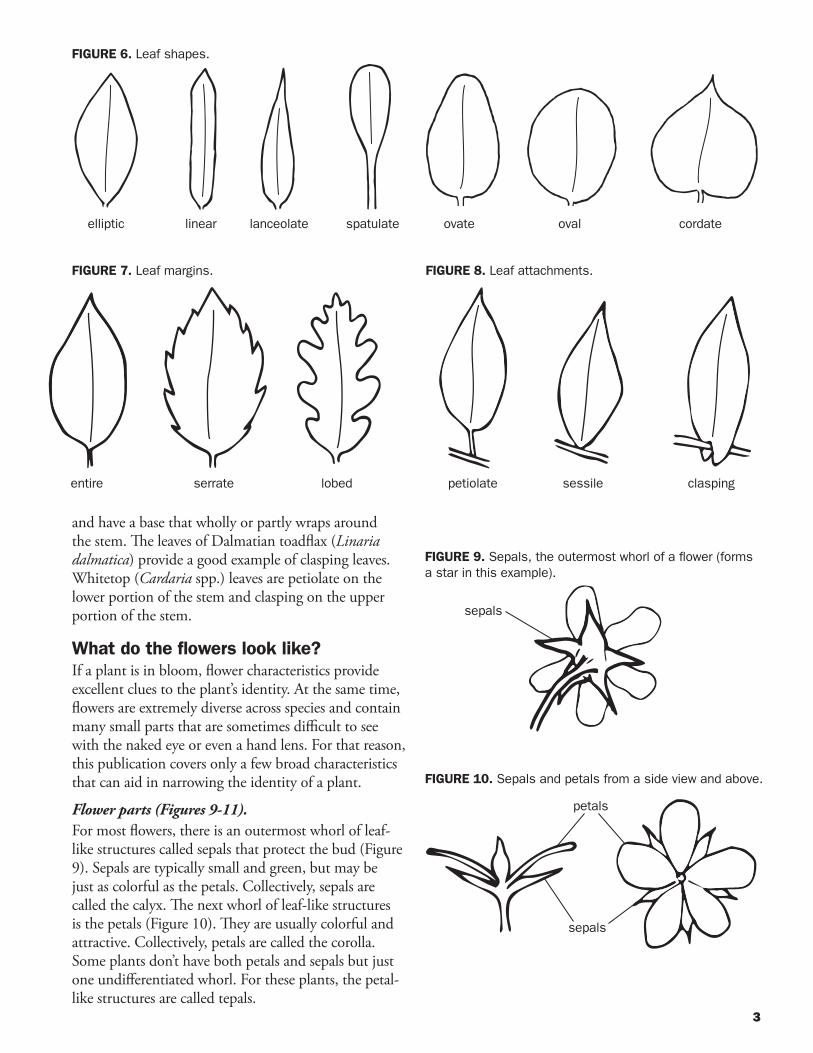
3
and have a base that wholly or partly wraps around the stem. The leaves of Dalmatian toadflax (Linaria dalmatica) provide a good example of clasping leaves. Whitetop (Cardaria spp.) leaves are petiolate on the lower portion of the stem and clasping on the upper portion of the stem.
What do the flowers look like?If a plant is in bloom, flower characteristics provide excellent clues to the plant’s identity. At the same time, flowers are extremely diverse across species and contain many small parts that are sometimes difficult to see with the naked eye or even a hand lens. For that reason, this publication covers only a few broad characteristics that can aid in narrowing the identity of a plant.
Flower parts (Figures 9-11). For most flowers, there is an outermost whorl of leaf-like structures called sepals that protect the bud (Figure 9). Sepals are typically small and green, but may be just as colorful as the petals. Collectively, sepals are called the calyx. The next whorl of leaf-like structures is the petals (Figure 10). They are usually colorful and attractive. Collectively, petals are called the corolla. Some plants don’t have both petals and sepals but just one undifferentiated whorl. For these plants, the petal-like structures are called tepals.
sepals
petals
FIGURE 9. Sepals, the outermost whorl of a flower (forms a star in this example).
FIGURE 10. Sepals and petals from a side view and above.
FIGURE 6. Leaf shapes.
linear lanceolate spatulate oval cordateelliptic ovate
FIGURE 7. Leaf margins. FIGURE 8. Leaf attachments.
entire lobedserrate claspingsessilepetiolate
sepals
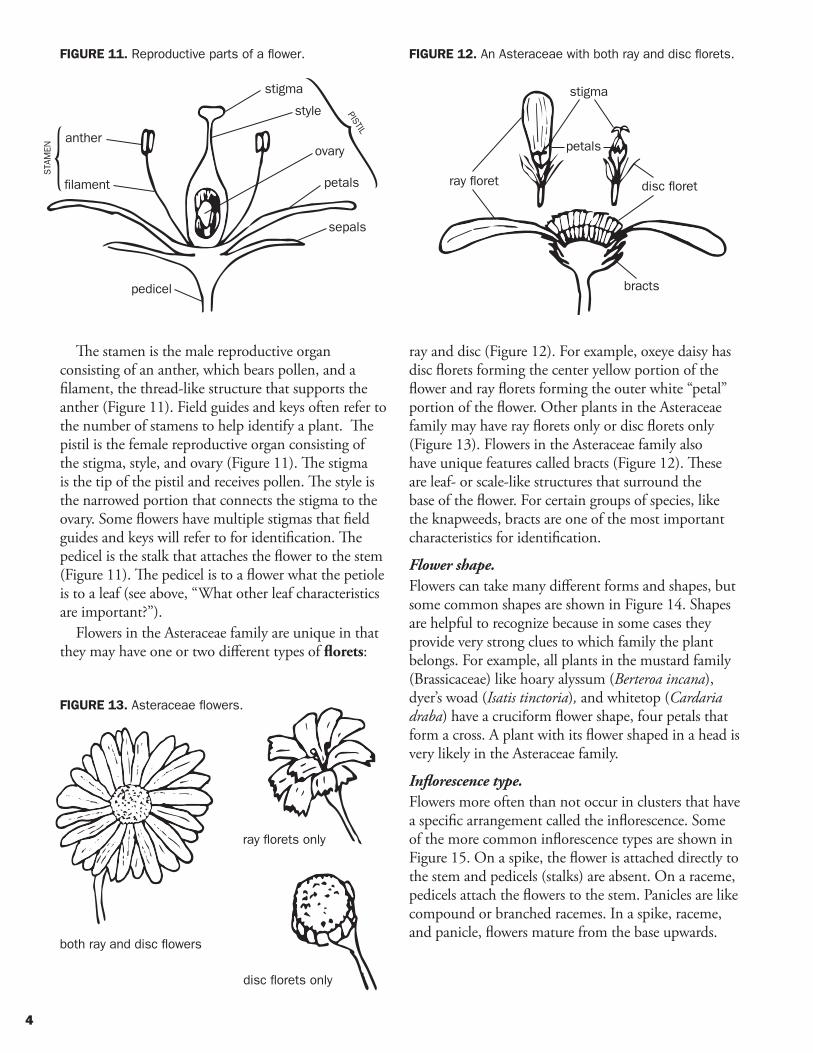
4
The stamen is the male reproductive organ consisting of an anther, which bears pollen, and a filament, the thread-like structure that supports the anther (Figure 11). Field guides and keys often refer to the number of stamens to help identify a plant. The pistil is the female reproductive organ consisting of the stigma, style, and ovary (Figure 11). The stigma is the tip of the pistil and receives pollen. The style is the narrowed portion that connects the stigma to the ovary. Some flowers have multiple stigmas that field guides and keys will refer to for identification. The pedicel is the stalk that attaches the flower to the stem (Figure 11). The pedicel is to a flower what the petiole is to a leaf (see above, “What other leaf characteristics are important?”).
Flowers in the Asteraceae family are unique in that they may have one or two different types of florets:
ray and disc (Figure 12). For example, oxeye daisy has disc florets forming the center yellow portion of the flower and ray florets forming the outer white “petal” portion of the flower. Other plants in the Asteraceae family may have ray florets only or disc florets only (Figure 13). Flowers in the Asteraceae family also have unique features called bracts (Figure 12). These are leaf- or scale-like structures that surround the base of the flower. For certain groups of species, like the knapweeds, bracts are one of the most important characteristics for identification.
Flower shape. Flowers can take many different forms and shapes, but some common shapes are shown in Figure 14. Shapes are helpful to recognize because in some cases they provide very strong clues to which family the plant belongs. For example, all plants in the mustard family (Brassicaceae) like hoary alyssum (Berteroa incana), dyer’s woad (Isatis tinctoria), and whitetop (Cardaria draba) have a cruciform flower shape, four petals that form a cross. A plant with its flower shaped in a head is very likely in the Asteraceae family.
Inflorescence type. Flowers more often than not occur in clusters that have a specific arrangement called the inflorescence. Some of the more common inflorescence types are shown in Figure 15. On a spike, the flower is attached directly to the stem and pedicels (stalks) are absent. On a raceme, pedicels attach the flowers to the stem. Panicles are like compound or branched racemes. In a spike, raceme, and panicle, flowers mature from the base upwards.
FIGURE 11. Reproductive parts of a flower.
anther
filament
stigma
style
ovary
petals
pedicel
sepals
pistil
sta
men
FIGURE 12. An Asteraceae with both ray and disc florets.
ray floret
stigma
petals
disc floret
bracts
FIGURE 13. Asteraceae flowers.
both ray and disc flowers
ray florets only
disc florets only
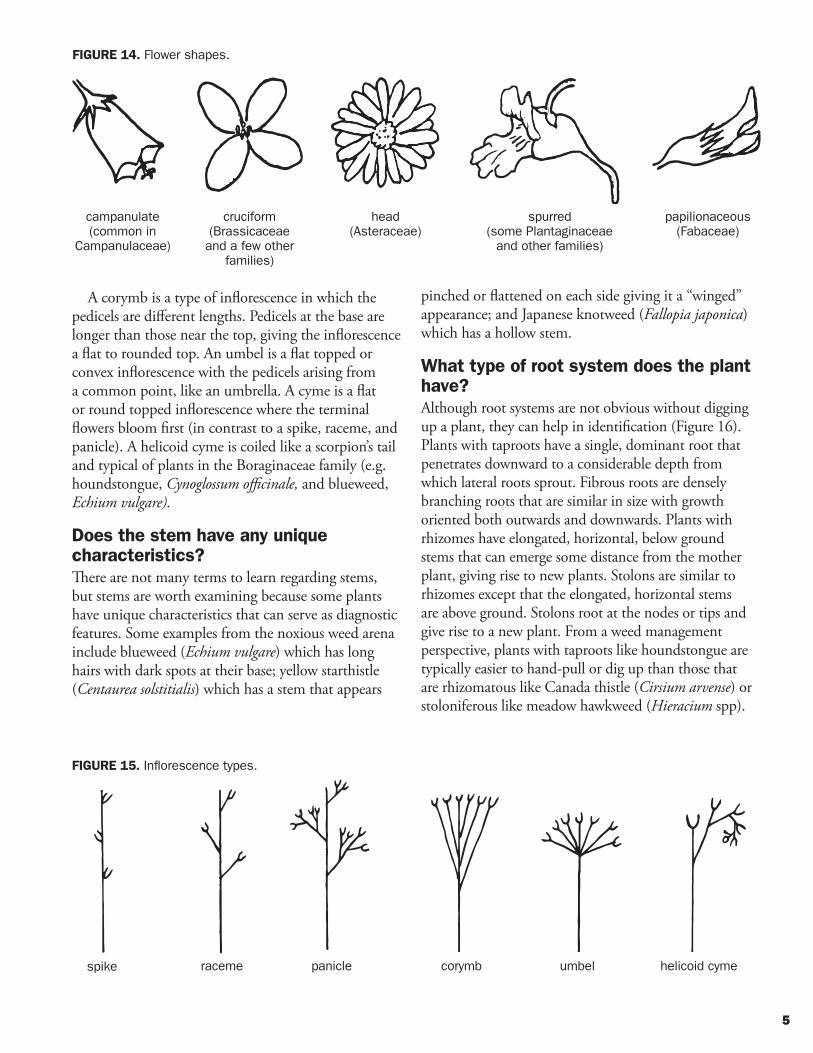
5
A corymb is a type of inflorescence in which the pedicels are different lengths. Pedicels at the base are longer than those near the top, giving the inflorescence a flat to rounded top. An umbel is a flat topped or convex inflorescence with the pedicels arising from a common point, like an umbrella. A cyme is a flat or round topped inflorescence where the terminal flowers bloom first (in contrast to a spike, raceme, and panicle). A helicoid cyme is coiled like a scorpion’s tail and typical of plants in the Boraginaceae family (e.g. houndstongue, Cynoglossum officinale, and blueweed, Echium vulgare).
Does the stem have any unique characteristics?There are not many terms to learn regarding stems, but stems are worth examining because some plants have unique characteristics that can serve as diagnostic features. Some examples from the noxious weed arena include blueweed (Echium vulgare) which has long hairs with dark spots at their base; yellow starthistle (Centaurea solstitialis) which has a stem that appears
FIGURE 14. Flower shapes.
campanulate(common in
Campanulaceae)
cruciform(Brassicaceae
and a few other families)
head(Asteraceae)
spurred (some Plantaginaceae
and other families)
papilionaceous (Fabaceae)
pinched or flattened on each side giving it a “winged” appearance; and Japanese knotweed (Fallopia japonica) which has a hollow stem.
What type of root system does the plant have?Although root systems are not obvious without digging up a plant, they can help in identification (Figure 16). Plants with taproots have a single, dominant root that penetrates downward to a considerable depth from which lateral roots sprout. Fibrous roots are densely branching roots that are similar in size with growth oriented both outwards and downwards. Plants with rhizomes have elongated, horizontal, below ground stems that can emerge some distance from the mother plant, giving rise to new plants. Stolons are similar to rhizomes except that the elongated, horizontal stems are above ground. Stolons root at the nodes or tips and give rise to a new plant. From a weed management perspective, plants with taproots like houndstongue are typically easier to hand-pull or dig up than those that are rhizomatous like Canada thistle (Cirsium arvense) or stoloniferous like meadow hawkweed (Hieracium spp).
FIGURE 15. Inflorescence types.
spike raceme panicle corymb umbel helicoid cyme
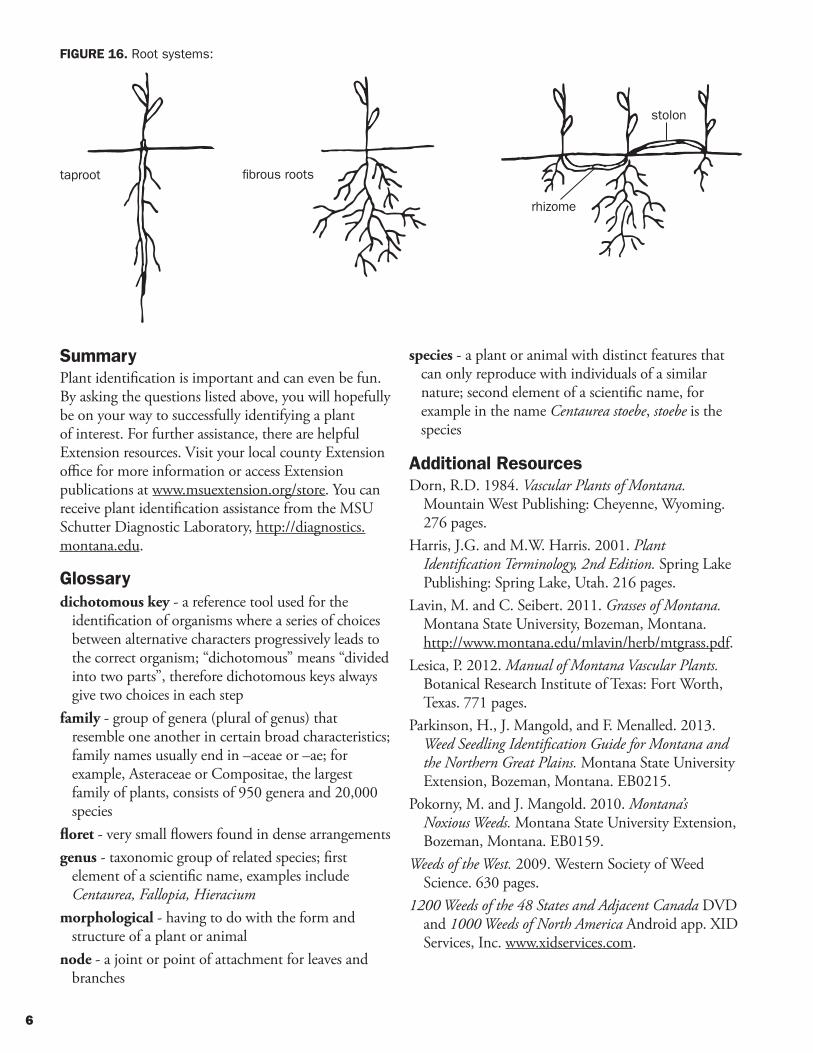
6
FIGURE 16. Root systems:
taproot fibrous roots
rhizome
stolon
SummaryPlant identification is important and can even be fun. By asking the questions listed above, you will hopefully be on your way to successfully identifying a plant of interest. For further assistance, there are helpful Extension resources. Visit your local county Extension office for more information or access Extension publications at www.msuextension.org/store. You can receive plant identification assistance from the MSU Schutter Diagnostic Laboratory, http://diagnostics.montana.edu.
Glossarydichotomous key - a reference tool used for the
identification of organisms where a series of choices between alternative characters progressively leads to the correct organism; “dichotomous” means “divided into two parts”, therefore dichotomous keys always give two choices in each step
family - group of genera (plural of genus) that resemble one another in certain broad characteristics; family names usually end in –aceae or –ae; for example, Asteraceae or Compositae, the largest family of plants, consists of 950 genera and 20,000 species
floret - very small flowers found in dense arrangementsgenus - taxonomic group of related species; first
element of a scientific name, examples include Centaurea, Fallopia, Hieracium
morphological - having to do with the form and structure of a plant or animal
node - a joint or point of attachment for leaves and branches
species - a plant or animal with distinct features that can only reproduce with individuals of a similar nature; second element of a scientific name, for example in the name Centaurea stoebe, stoebe is the species
Additional ResourcesDorn, R.D. 1984. Vascular Plants of Montana.
Mountain West Publishing: Cheyenne, Wyoming. 276 pages.
Harris, J.G. and M.W. Harris. 2001. Plant Identification Terminology, 2nd Edition. Spring Lake Publishing: Spring Lake, Utah. 216 pages.
Lavin, M. and C. Seibert. 2011. Grasses of Montana. Montana State University, Bozeman, Montana. http://www.montana.edu/mlavin/herb/mtgrass.pdf.
Lesica, P. 2012. Manual of Montana Vascular Plants. Botanical Research Institute of Texas: Fort Worth, Texas. 771 pages.
Parkinson, H., J. Mangold, and F. Menalled. 2013. Weed Seedling Identification Guide for Montana and the Northern Great Plains. Montana State University Extension, Bozeman, Montana. EB0215.
Pokorny, M. and J. Mangold. 2010. Montana’s Noxious Weeds. Montana State University Extension, Bozeman, Montana. EB0159.
Weeds of the West. 2009. Western Society of Weed Science. 630 pages.
1200 Weeds of the 48 States and Adjacent Canada DVD and 1000 Weeds of North America Android app. XID Services, Inc. www.xidservices.com.

DOWNL
OAD
E WE
FREE
Copyright © 2013 MSU ExtensionWe encourage the use of this document for nonprofit educational purposes. This document may be reprinted for nonprofit educational purposes if no endorsement of a commercial product, service or company is stated or implied, and if appropriate credit is given to the author and MSU Extension. To use these documents in electronic formats, permission must be sought from the Extension Communications Coordinator, 135 Culbertson Hall, Montana State University, Bozeman, MT 59717; E-mail: [email protected]
To order additional publications, please contact your county or reservation MSU Extension office, visit our online catalog at www.msuextension.org/store or e-mail [email protected]
The U.S. Department of Agriculture (USDA), Montana State University and the Montana State University Extension prohibit discrimination in all of their programs and activities on the basis of race, color, national origin, gender, religion, age, disability, political beliefs, sexual orientation, and marital and family status. Issued in furtherance of cooperative extension work in agriculture and home economics, acts of May 8 and June 30, 1914, in cooperation with the U.S. Department of Agriculture, Jill Martz, Director of Extension, Montana State University, Bozeman, MT 59717.
File under: Agriculture and Natural Resources (Weeds) New September 2013 913SA
Special thanks to Linnea Skoglund, Noelle Orloff, and Shantell Frame-Martin for reviewing this publication. All illustrations by Hilary Parkinson.
Resources for Learning and TeachingPLANT IDENTIFICATION
This guide is available on the KNPS website.
KNPS Members who have contributed to this document are: Nancy Goulden, Phyllis Scherich, Jeff Hansen, Mike Haddock, Karen Hummel and the Board Members who shared their “Words of Wisdom.”
Kansas Native Plant Society, RESOURCES FOR LEARNING AND TEACHING PLANT IDENTIFICATION Copyright © 2007 by Kansas Native Plant Society.
1/15
Resources for Learning and Teaching Plant Identification
INTRODUCTION
In the Kansas Native Plant Society Mission Statement, one of the goals related to native plant awareness and appreciation is “promoting education.” Central to helping members, friends, and other interested parties learn about the native plants of our state is to provide materials designed to develop and refine skills of plant identification.
There is no one “right” way to learn plant identification. Many of us just stumbled on what worked for us through trial and error. Others first met plant identification in a botany class. This document shares insights and discoveries from the varied experiences and reflections of KNPS members about plant identification.
Each of the following sections focuses on learners at different identification-skill levels, from novice to those with considerable experience. Most “units” can be used either by individuals working on their id skills alone or as lecture/discussion frameworks for workshops or training sessions. Some suggest a procedure; others focus on resource materials. Sections Coaching Plant Identification and Opportunities to Share Plant Identification Information fit more under the “teaching” category. The sections do not have to be used in the order they appear here. Users can pick and choose whatever fits their needs.
© 2007 by Kansas Native Plant Society2/15
Resources for Learning and Teaching Plant Identification
SECTIONS
I. Teaching Yourself to Identify Native Plants–Gives those who are just beginning to learnabout plant identification a process to use independently or with other beginners. Walksthe newcomer through the simple basic steps of using a field guide, in a natural setting,to identify and confirm frequently seen plants. Meant to provide the foundation forlater, higher-level learning about plant id.
II. How To Get the Most Out of Your Field Guide–Designed for those who have somebackground and experience in using a field guide for identification, but are now ready tomove beyond relying mostly on pictures. Provides many suggestions about using theplant descriptions and special features of the guide to accelerate identification success.
III. What To Do When A “Mystery Plant” Is Not In Your Field Guide–Provides lists ofrecommended resources including region-specific field guides and books, internetaddresses, and Kansas herbariums. This will be very helpful to those with experience inidentifying plants who occasionally get stymied by a “new” plant.
IV. Moving Beyond the Basics: Looking at Specific Plant and Location Features–Createdfor those experienced at identifying plants who are ready to learn and use less obviousfeatures of plant structure and plant habitat for identification. The section includes anextensive check-list of such features to serve as reminders or new clues fordistinguishing between similar species or those that are unusually difficult to identify.
V. Guidelines for Coaching Plant Identification–Presents an alternative for those teachingplant identification that goes beyond just naming plants or giving information. Givescoaching strategies that can be used during on-site outings that promote recognition ofplant and habitat features, while reinforcing retention of plant information. This sectionincludes techniques that encourage interactions and individual practice that strengthenindependent use of the process of plant identification.
VI. Opportunities to Share Plant Identification Information–Here are some suggestions ofevents and approaches that KNPS members can develop to teach and promote plantidentification. Some are related to KNPS events; others focus on occasions that wouldbe available to the public or special interest groups. Included is a section on KNPSWildflower Patch Classes.
VII. Words of Wisdom from Passionate Native Plant Fans–Individual KNPS members sharetheir favorite advice and suggestions about how to learn plant identification. No two arealike. All are useful and sound.
© 2007 by Kansas Native Plant Society3/15
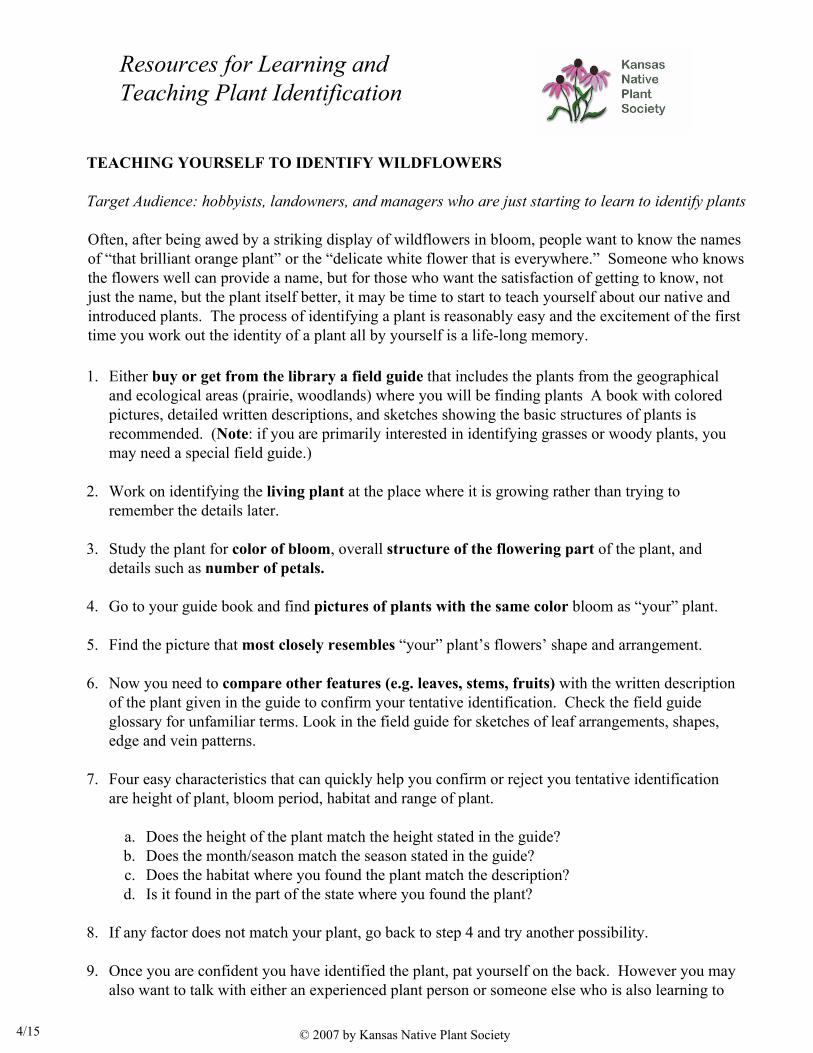
Resources for Learning and Teaching Plant Identification
TEACHING YOURSELF TO IDENTIFY WILDFLOWERS
Target Audience: hobbyists, landowners, and managers who are just starting to learn to identify plants
Often, after being awed by a striking display of wildflowers in bloom, people want to know the names of “that brilliant orange plant” or the “delicate white flower that is everywhere.” Someone who knows the flowers well can provide a name, but for those who want the satisfaction of getting to know, not just the name, but the plant itself better, it may be time to start to teach yourself about our native and introduced plants. The process of identifying a plant is reasonably easy and the excitement of the first time you work out the identity of a plant all by yourself is a life-long memory.
1. Either buy or get from the library a field guide that includes the plants from the geographicaland ecological areas (prairie, woodlands) where you will be finding plants A book with coloredpictures, detailed written descriptions, and sketches showing the basic structures of plants isrecommended. (Note: if you are primarily interested in identifying grasses or woody plants, youmay need a special field guide.)
2. Work on identifying the living plant at the place where it is growing rather than trying toremember the details later.
3. Study the plant for color of bloom, overall structure of the flowering part of the plant, anddetails such as number of petals.
4. Go to your guide book and find pictures of plants with the same color bloom as “your” plant.
5. Find the picture that most closely resembles “your” plant’s flowers’ shape and arrangement.
6. Now you need to compare other features (e.g. leaves, stems, fruits) with the written descriptionof the plant given in the guide to confirm your tentative identification. Check the field guideglossary for unfamiliar terms. Look in the field guide for sketches of leaf arrangements, shapes,edge and vein patterns.
7. Four easy characteristics that can quickly help you confirm or reject you tentative identificationare height of plant, bloom period, habitat and range of plant.
a. Does the height of the plant match the height stated in the guide?b. Does the month/season match the season stated in the guide?c. Does the habitat where you found the plant match the description?d. Is it found in the part of the state where you found the plant?
8. If any factor does not match your plant, go back to step 4 and try another possibility.
9. Once you are confident you have identified the plant, pat yourself on the back. However you mayalso want to talk with either an experienced plant person or someone else who is also learning to
© 2007 by Kansas Native Plant Society4/15
Resources for Learning and Teaching Plant Identification
identify plants. In either case, go through your evidence and support your choices step-by-step to the other party.
10. Some plant fans find it helpful to carry a small notebook in which to record the date, general andspecific locations of each new plant you identify. Another alternative is to write the date andlocation in YOUR field guide itself. Either way next time or next year you see the plant, you cancome back to your record.
11. Once you have experienced these basic building blocks, you can continue to add more “new”plants and extend your knowledge about botanical terms in the descriptions.
HOW TO GET THE MOST OUT OF YOUR FIELD GUIDE
Target Audience: Hobbyists, Landowners, and Managers with moderate plant-identification experience
1. Familiarize yourself with the guide.
a. Determine the geographic area covered by the guide.b. Determine the type of plants covered by the guide (e.g. prairie wildflowers, woody plants,
grasses)c. Locate the Glossary. Use it to look up unfamiliar terms.d. Locate and refer to sketches of plant structures to confirm your understanding of
botanical descriptors.e. Check for an Identification Key to identifying plants covered by the guide.f. Read the Introduction to the guide. Often it explains how to use the guide.
2. Know how the plants are organized in your field guide.
a. Check to see if there are separate sections for forbs, woody plants, grasses, sedges andrushes.
b. Determine the primary factor in the order of the plant pictures in the guide–color?families? other?
c. If pictures are arranged in color categories, note which colors are in the same sections.For example, purple, blue, and pink may all be in the same section in one book, but not inanother.
d. Within that first organizational scheme (e.g., color, families) determine the secondaryorder –seasonal blooming order? alphabetical by family?alphabetical by scientific name?
e. If text describing each species is in a separate section from thepictures, determine howthe text descriptions are arranged – by families? What is the order of families?
© 2007 by Kansas Native Plant Society5/15
Resources for Learning and Teaching Plant Identification
3. Use the pictures to begin to identify plants.
a. Find a picture that best matches the plant you are identifying.b. Look carefully at flowering structures, not just color.
4. Use the written description of the plant structures such as stems, leaf arrangement andshape, flower arrangement and shape and fruit/seeds appearance to confirm your tentativeidentification. Make sure you understand the botanical terms (see Glossary) used in thedescription. In your personal copy of the field guide in the margin near the text, you may want towrite your own translation of the term or make a sketch to help you remember the meaning.
5. Additional clues that can instantly confirm or reject your tentative identification are often foundin separate entries from the description of the plant structure. They include blooming period(month or season), sizes given in text (plant height, leaf width and length, and flower width areoften stated); habitat where you found the plant (prairie, woodland, roadside and waste places,fields, stream banks); soil types where the plant is found (sandy, rocky, clay); plant’s life cycle(annual, perennial, biennial)
6. If the picture, description and other features are similar to the plant you are identifying, but not agood match, note the family of the plant in the field guide. Then go to the index to find othermembers of the same family to compare to the plant you are working on.
7. If you still can’t find a match and your field guide has an Identification Key, work on keying theplant out.
WHAT DO YOU DO WHEN A “MYSTERY PLANT” IS NOT IN YOUR FIELD GUIDE
Target Audience: Hobbyists, Landowners, and Managers with moderate plant identification experience
1. Go to additional field guides.
a. Roadside Wildflowers of the Southern Great Plains by Craig C. Freeman and Eileen K.Schofield, University Press of Kansas (June 1991)
b. Wildflowers and Grasses of Kansas by Michael John Haddock, University Press ofKansas (April 2005)
c. Tallgrass Prairie Wildflowers by Doug Ladd and Frank Oberle, Falcon Pr Pub Co(September 2005)
d. Missouri Wildflowers by Edgar Denison, Missouri Department of Conservation (1998)e. Field Guide to the Common Weeds of Kansas by T.M. Barkley, University Press of
Kansas (1983)f. Trees, Shrubs, and Woody Vines in Kansas by H.A. Stephens, University Press of Kansas
(1969)g. Oklahoma Wildflowers by Doyle McCoy, McCoy Publishing Company
(March 1987)h. Ozark Wildflowers by Donald R. Kurz, Falcon Press (1999)
© 2007 by Kansas Native Plant Society6/15
Resources for Learning and Teaching Plant Identification
2. Check more comprehensive books (try a library or the Internet for older books).
a. Wildflowers and Weeds of Kansas by Janet E. Bare, The Regents Press of Kansas(1979)
b. Kansas Wild Flowers by William Chase Stevens. University of Kansas Press (1961)c. Weeds of the West edited by Tom Whitson, Cooperative Extension Service
(June 1996)d. Botany in a Day by Thomas J. Elpel, HOPS Press; 4th Edition (January 1, 2000)e. Flora of the Great Plains edited by Ted Barkley, University of Kansas Press (June
1986)
3. Try the Internet
a. Google Search Use if you know the plant’s common name or family.b. Mike Haddock’s site: http://www.lib.ksu.edu/wildflower/ Can search plants by
color.c. Jeff Hansen’s site
http://www.kansasnativeplants.com/plantsearch.html Can search byplantcharacteristics
d. USDA site: http://plants.usda.gov/ If you think you know plant name, can be usedto verify your identification; has maps that show presence of plant in specificcounties and states.
e. KSU Weed ID site: http://www.oznet.ksu.edu/weedmanagement/weedid.asp Goodsource for weedy plants growing in disturbed soil.
4. Compare notes with other native plant fans in your area
a. Find a partner or small group to walk with and puzzle out identification together.b. Use the KNPS discussion email address: [email protected]. Email pictures and
questions and let our membership help you ID your plant.
5. Contact a Kansas Herbarium
Often photographs of the flowers, fruits, or leaves can be e-mailed to the herbarium toidentify the plant.
Some plants need to be examined using magnification to determine the species. For this,take or mail a pressed specimen to the herbarium. Ideally the specimen should containflowers or fruits, the leaves and the root.
6. Contact a District Conservation Office
Your District Conservationist at your local Natural Resources Conservationist Servicesoffice is another source where you can take in a specimen.
© 2007 by Kansas Native Plant Society7/15
Resources for Learning and Teaching Plant Identification
MOVING BEYOND THE BASICS: LOOKING AT SPECIFIC PLANT AND LOCATION FEATURES
Target Audience: hobbyists, landowners, and managers with moderate plant identification experience.
In order to identify plants that are unfamiliar to you or to differentiate between plants with similar features, it is necessary to become familiar with specific distinguishing features. Below is a checklist of plant structure and plant location details that can be very helpful in identification. Don’t let the length and variety of topics on the list discourage or overwhelm you. You don’t need to learn them all at once. Learning to identify plants is an incremental process. We recommend that you read through the list a couple of times just to begin to alert yourself to some of the possible clues that can improve and speed up your identification skills. You may want to focus on just one category (e.g. leaves) at a time.
As you begin to notice and work with the features, expect to depend heavily on your field guide and other sources. You will need to read carefully the text descriptions in the field guides for each individual plant you are trying to identify, noticing the various features. Refer to the line drawings of plant structures and check the glossary as you encounter new terms.
You may find it useful to carry a 10x hand lens with you when identifying plants in the field to check details too small to see clearly with the naked eye such as hairs on leaves, flowers, and seeds.
i. PLANT STRUCTURES1. Inflorescence —the flowering part of the plant and associated structures
a. Arrangement1) Single - one flower on a stem (e.g. violet)2) Multiple - flower heads made up of many individual flowers on
separate stems (e.g. prairie parsley, milkweed)3) Composite - multiple small ray and disk flowers forming what may
look like a single flower (e.g. sunflower)b. Shape
1) Regular - symmetrical (e.g. rose family)2) Irregular - asymmetrical (e.g. bean family)
c. Parts associated with the flower head1) Petals – colorful part of flower2) Sepals – green leaf-like structures below the petals that form the
exterior of the floral envelope during the bud stage (e.g. spiderwort)3) Bracts – a modified leaf at the base of the flower (e.g. curly-cup
gumweed)4) Stamen—male part that carries pollen5) Pistil—female part
© 2007 by Kansas Native Plant Society8/15
Resources for Learning and Teaching Plant Identification
2. Leaves – form from a bud
a. Composition1) Leaf – the blade2) Petiole – the stem of the leaf, not always present3) Stipule – leaf-like structure at base of stem, not always present
b. Arrangement1) Opposite (e.g. blue sage)2) Alternate (e.g. sunflower)3) Whorled (e.g. sweet Joe-pye)
c. Type1) Simple – individual leaves (e.g. ironweed)2) Compound – leaf composed of smaller leaflets (e.g. tickclover)
d. Shape (e.g. grass-like, heart-shaped, rounded)e. Edges (e.g. toothed, smooth, lobed, wavy)f. Bases (e.g. rounded, pointed, square)g. Tips (e.g. rounded, pointed)h. Veins
1) Parallel (not branching, running alongside each other)2) Netted (branching in many directions)
i. Texture (e.g. smooth, wooly, hairy)
3. Stems – structure to which the leaves, flowers and fruit are attached
a. Number (e.g. single, multiple)b. Branching (e.g. none, frequent)
1) Location (e.g near the base, near the top)2) Arrangement (e.g. opposite, alternate)
c. Shape (e.g. rounded, square, triangular, flattened)d. Position (e.g. upright, along the ground)e. Surface (e.g. prickles, hairs, wings)f. Underground
1) Bulbs (e.g. onion)2) Corms (e.g. gayfeather)
g. Reproducing1) Stolons – above ground creeping stems rooting at point of contact, (e.g.
buffalograss)2) Runners – above ground creeping stems rooting at the node, (e.g.
strawberry)3) Rhizomes – below ground creeping stems, (e.g. Beebalm)
4. Roots - the below ground part of the plant
a. Type1) Tap - main tapering root that grows vertically down, (e.g. dandelion)2) Fibrous - many branched thin roots, (e.g grasses)
© 2007 by Kansas Native Plant Society9/15
Resources for Learning and Teaching Plant Identification
b. Depth1) Shallow – weak shallow roots are associated with annual
plants2) Deep – strong deep roots are associated with perennial plants
5. Fruits - the part containing seedsa. Shape (e.g. capsule, pod, berry)b. Texture (e.g. ridges, hairs, protrusions)
6. Seedsa. Shape (e.g. sphere, disc, kidney)b. Texture (e.g. veins, ridges, smooth)
7. Sap (e.g. milky, clear, slimy)
ii. PLANT LOCATION1. Region of state (e.g. east ½ , southwest ¼)
2. Physiographic region (e.g. Flint hills, Smokey hills, Ozarks)
3. Habitats (e.g. prairie, woodland, woodland edges, roadsides, waste places,agricultural lands, stream banks, lake shores)
4. Soil type (e.g. sandy, rocky, clay)
5. Slope (e.g. hillsides, valleys, hilltops)
iii. GROWTH FACTORS1. Growth habit
a. Colony forming - spreads by underground or above ground stemsb. Individual plants - does not spread by stems, only by seed
2. Above ground growtha. Woody - above ground part grows more than one season (e.g. sumac)b. Herbaceous - above ground part grows only one season (e.g. goldenrod)
iv. SENSES1. Smell (e.g. onion, mint)
© 2007 by Kansas Native Plant Society10/15
Resources for Learning and Teaching Plant Identification
GUIDELINES FOR COACHING PLANT IDENTIFICATION
Target Audience: experienced plant-enthusiasts coaching plant identification in the field.
1. Keep in mind the goal is NOT just to tell the name of a plant, but to give participants thetools to identify plants when you are not there.
2. Know and adapt for levels of knowledge and experience (novice, intermediate).
3. Build slowly and incrementally from where participants are.a. Don’t overwhelm with too much information at once.b. When using botanical terms, explain or paraphrase the term.c. Initially use common names of the plants.
4. Structure the walk or hike experience so participants get maximum practice andparticipation.
a. Don’t always jump into “lecture mode.” Try these alternatives to promote dialoguerather than monologue.
1) Sometimes when you approach a new plant ask if anyone knows the name ofthe plant–if they do, ask them to name it and tell how they know that is what itis.
2) Or ask if anyone knows the family of the plant or what other plants itreminds them of.
3) If there is time and participants have field guides, let them singly or as a grouptry to identify the plant using the field guides, while you coach them on theprocess.
4) Encourage relevant questions.5) Use techniques to promote understanding and retention.
b. In the field, point out features about a plant that will help them recognize it next time.1) Go beyond the color of the blooms to the leaf, stem, flower, fruit/seed structures
by which you identified the plant2) Note similarities to and differences from relatives or plants that appear to be
similar3) Observe the type of location where the plant is growing
c. Point out clues that will help them remember the name (e.g. meaning and origin ofname, translation of terms in name, features the name reflects, silly memory devices)
d. When a plant is encountered later, either repeat the name and key features, ORreinforce the process and identification by asking the group to name the plant and tellhow they know their i.d. is correct.
e. At the end of the session, ask participants (without looking at notes) to orallyconstruct a list of all the plants they have seen and identified.
© 2007 by Kansas Native Plant Society11/15
Resources for Learning and Teaching Plant Identification
OPPORTUNITIES TO SHARE PLANT IDENTIFICATION INFORMATION
Target Audience: KNPS Board and members who want to conduct training/mentoring
1. The KNPS Annual Wildflower Weekend (AWW)a. view plant family CDsb. hold short instructional sessionsc. coach small groups during scheduled hikes
2. Any KNPS sponsored outinga. offer a workshop prior to starting walkb. coaching at sites for those who want to become leaders
3. A KNPS sponsored workshopa. Schedule, organize, publicize an event in the member’s community or several
members collaborate in a central location.b. Could have special emphases (e.g. how to use a key, botanical terms, tips on leading
walks, identifying winter plants)c. Use handouts, slides/power point, field guides, plant specimens to introduce
processes and concepts.d. Include practice (fresh or dried specimens), living plants in natural settings.
4. Prairie Patch Classesa. The Patch award is an educational program where the student picks two species of
plants, researches them, and identifies them. The application is available on theKNPS web site.
b. KNPS members can arrange a class either through an already existing organization(scouts, 4-H, summer day camp, local library, after school care, school group) or canoffer and advertise a class on their own.
c. At the first meeting, introduce participants to the Patch materials and give them anintroduction to plant morphology and identification.
d. Arrange for the participants to take part in a KNPS outing. It may be most helpful ifyou accompany them to the event.
e. Arrange for participants to visit a location where they can collect data on their twoplants. Depending on age and experience, you may want to monitor their progressand be available for questions and help.
f. Check their completed “booklets” and assist in sending them in.g. Either arrange for class members to attend the AWW or be sure they receive their
patches (maybe even have a “class reunion” and presentation ceremony).
© 2007 by Kansas Native Plant Society12/15
Resources for Learning and Teaching Plant Identification
Words of “Wisdom”
Members of the KNPS Board share a variety of suggestions and techniques from their experiences identifying plants. As you can tell from their words, building knowledge about native plants is a complex, personal, but very rewarding process.
Identifying plants is easier than most people think. Become familiar with a small number each season and make it a life-long learning process. Each year your new plant friends will greet you with a bloom and you'll say, "I remember you from last season!"
Valerie Wright
When there are adequate numbers of plants, collect a specimen of the new plant. This will allow you to take it home for identification when you have more time, resources, etc. After ID'ing it, press and mount it with the appropriate labeling. This will enable you to review it and refer back to it the next time you see it. It also will allow you to compare it to other plants in its family to see how they are similar and different. Photos with appropriate labels also are a great help.
Phyllis Scherich
I always bring a pocket sized notebook and pencil to outings to record the names of the plants (or birds, insects, reptiles, rocks, mushrooms, etc.) that I want to learn more about later from resources at home. It's also very memorable to learn something useful about each plant; for example, is it a favorite food for certain caterpillars or other animals? Is it edible, medicinal, or poisonous? Etc. And I like to experience a new plant w/another sense in addition to sight: feel the leaves' smoothness/roughness, smell the flower or a crushed leaf.
Shirley Braunlich
I always try to get people to notice the leaf arrangement, basic flower structure, and specific family characteristics such as square stem. I encourage them to attempt identification themselves by looking for simple characters that they can recognize.
Iralee Barnard
As one who came to plant identification relatively late in life, I have been challenged to sort out wildflowers by the only two labels we're likely to hear: "genus" and "species." Then I realized that most of the botanical whizzes walking beside me were quietly using "family" as their first clue in identifying a mystery forb. A few plant families, most with quite distinctive features, contain a high proportion of the native plants we see, so I now knowingly say "it looks like an aster" (or "milkweed," or "bean") and go home feeling much younger.
Fred Coombs
© 2007 by Kansas Native Plant Society13/15
Resources for Learning and Teaching Plant Identification
When you photograph a plant, try to get the leaf, stem, flower, and seeding strategy (capsule, pod, etc). In your notes: type of soil, part of state, local topography, condition of soil (moist-dry...).
Sister Patricia Stanley
As for plant ID, in the beginning the scientific name seemed almost too difficult to learn. But as I slowly progress, common names seem far more challenging because they are so variable. I think it actually saves time and confusion to tackle a single scientific name for a plant than to try to remember several locale-specific names for a single plant, some of which may also be tacked onto a different plant!
Nancy Coombs
For beginners, learn to recognize the plant in its natural surroundings. Make a mental note about where it is located. Is it growing in thin soil with rocks or is it in a wetland? Observe closely, jot down characteristics, or take a picture of flowers and leaves. With the aid of regional plant ID books, the plant will likely be identified.
Cindy Ford
It helps me remember a new plant (or bird) when I take time to note in my favorite ID book where and when I first saw it. If it's similar to other species, I underline the distinguishing characteristics. If I'm not sure what I'm looking at, if possible, I press a sample in my book and find a "pro!"
Ann Feyerharm
I would recommend that you find a person who is a level or two above you in identifying plants and pick their brain as you drag them off into the prairie. I also would suggest that you attend wildflower walks whenever possible and most assuredly you should join the KNPS or other groups to find others in your area who would enjoy sharing their knowledge and love for our native plants with you. A modest selection of books is necessary to advance your knowledge, and eventually you will learn to see the similarities that group the plants into related families and genera. And finally, never be afraid to ask others for help!
June Kliesen
When identifying plants, it’s important to look at more than just the flower. Look at the flower in detail, count the petals; touch the leaves, what is the texture; pick a leaf, is there milky sap; smell the crushed leaf, what is the odor; look at the leaf arrangement, are the leaves opposite; look at the stem, what is its shape. I find it useful to study your field guides before you go out. That way when you see something, it might trigger your brain - hey I saw that in my field guide, it's blah blah blah.
Jeff Hansen
© 2007 by Kansas Native Plant Society14/15

Resources for Learning and Teaching Plant Identification
Become acquainted with a knowledgeable plant enthusiast. It always helps to have someone to ask for help with identification and to suggest good places to look for new, unusual, interesting plants.
Earl Allen
My insight is that when I tell people what these plants are, they can look up plants and learn all about them.
Carl Paulie
Find a plant ID partner who is about at the same level of expertise as you are and go out to natural areas on a regular basis. Two sets of eyes, two different minds, and constant challenges or confirmation of each other's identification will let you learn twice as many plants in half the time.
Nancy Goulden
© 2007 by Kansas Native Plant Society15/15
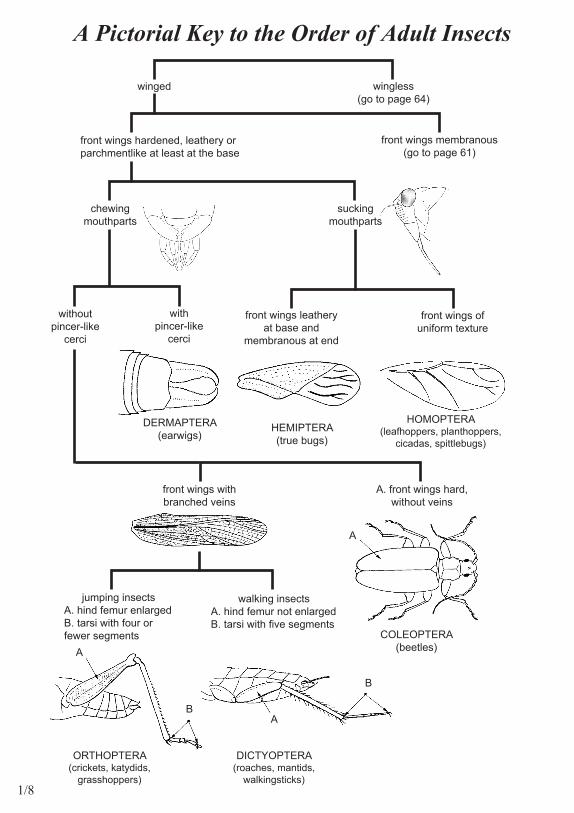
1/8
A Pictorial Key to the Order of Adult Insects
winged wingless(go to page 64)
front wings hardened, leathery or parchmentlike at least at the base
front wings membranous(go to page 61)
chewing mouthparts
sucking mouthparts
withoutpincer-like
cerci
withpincer-like
cerci
front wings leatheryat base and
membranous at end
front wings of uniform texture
DERMAPTERA(earwigs)
HEMIPTERA(true bugs)
HOMOPTERA(leafhoppers, planthoppers,
cicadas, spittlebugs)
front wings with branched veins
A. front wings hard,without veins
COLEOPTERA(beetles)
jumping insectsA. hind femur enlargedB. tarsi with four orfewer segments
walking insectsA. hind femur not enlargedB. tarsi with five segments
ORTHOPTERA(crickets, katydids,
grasshoppers)
DICTYOPTERA(roaches, mantids,
walkingsticks)
A
AB
B
A
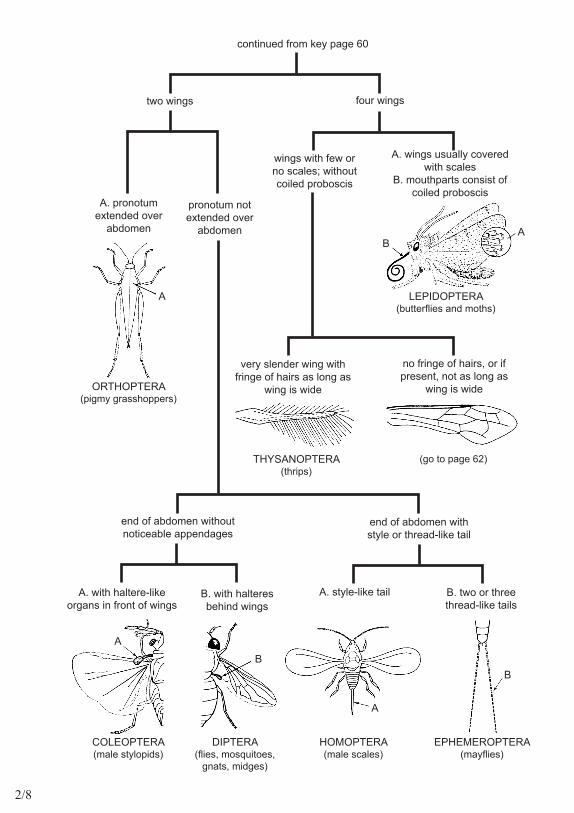
continued from key page 60
A. pronotumextended over
abdomen
two wings four wings
wings with few or no scales; without coiled proboscis
pronotum not extended over
abdomen
A. wings usually coveredwith scales
B. mouthparts consist ofcoiled proboscis
very slender wing with fringe of hairs as long as
wing is wide
no fringe of hairs, or if present, not as long as
wing is wide
end of abdomen without noticeable appendages
end of abdomen with style or thread-like tail
A. with haltere-likeorgans in front of wings
B. with halteresbehind wings
A. style-like tail B. two or threethread-like tails
ORTHOPTERA(pigmy grasshoppers)
LEPIDOPTERA(butterflies and moths)
THYSANOPTERA(thrips)
(go to page 62)
COLEOPTERA(male stylopids)
DIPTERA(flies, mosquitoes,
gnats, midges)
HOMOPTERA(male scales)
EPHEMEROPTERA(mayflies)
A
A
A
A
BB
B
2/8
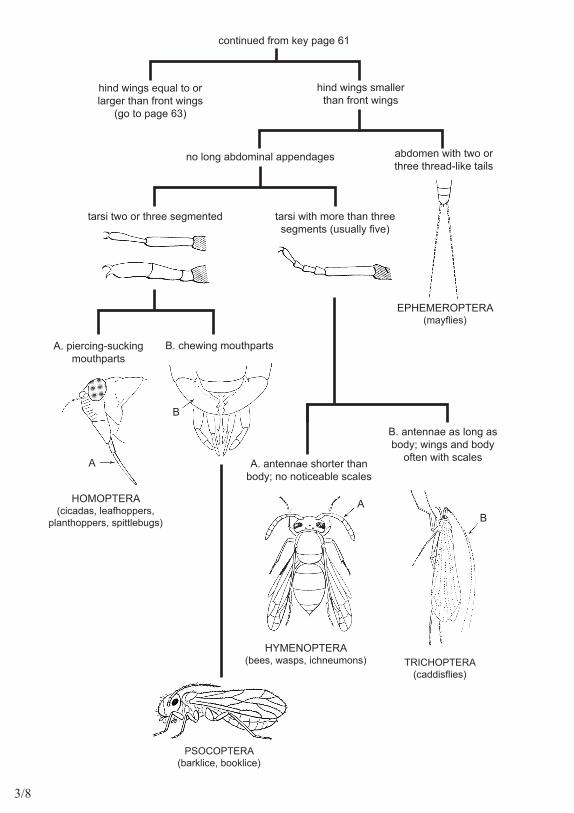
continued from key page 61
A. piercing-suckingmouthparts
hind wings equal to or larger than front wings
(go to page 63)
hind wings smaller than front wings
no long abdominal appendages
B. chewing mouthparts
abdomen with two or three thread-like tails
B. antennae as long asbody; wings and body
often with scales
HOMOPTERA(cicadas, leafhoppers,
planthoppers, spittlebugs)
EPHEMEROPTERA(mayflies)
HYMENOPTERA(bees, wasps, ichneumons) TRICHOPTERA
(caddisflies)
A
tarsi two or three segmented tarsi with more than three segments (usually five)
A. antennae shorter thanbody; no noticeable scales
PSOCOPTERA(barklice, booklice)
A
B
B
3/8
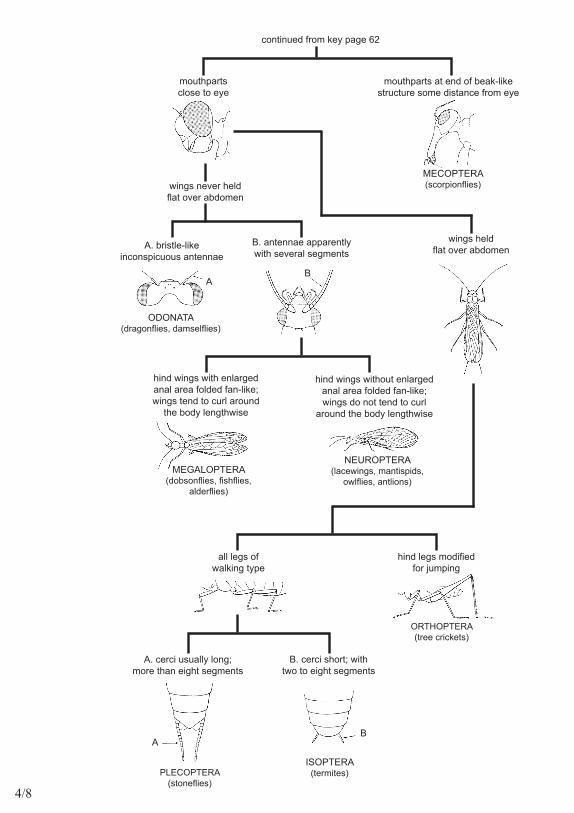
continued from key page 62
mouthparts close to eye
mouthparts at end of beak-like structure some distance from eye
A. bristle-likeinconspicuous antennae
B. antennae apparentlywith several segments
NEUROPTERA(lacewings, mantispids,
owlflies, antlions)
ISOPTERA(termites)PLECOPTERA
(stoneflies)
A
hind wings with enlarged anal area folded fan-like; wings tend to curl around
the body lengthwise
ORTHOPTERA(tree crickets)
all legs of walking type
A
B
ODONATA(dragonflies, damselflies)
wings heldflat over abdomen
wings never heldflat over abdomen
B
hind wings without enlarged anal area folded fan-like; wings do not tend to curl
around the body lengthwise
MEGALOPTERA(dobsonflies, fishflies,
alderflies)
hind legs modified for jumping
MECOPTERA(scorpionflies)
A. cerci usually long;more than eight segments
B. cerci short; withtwo to eight segments
4/8
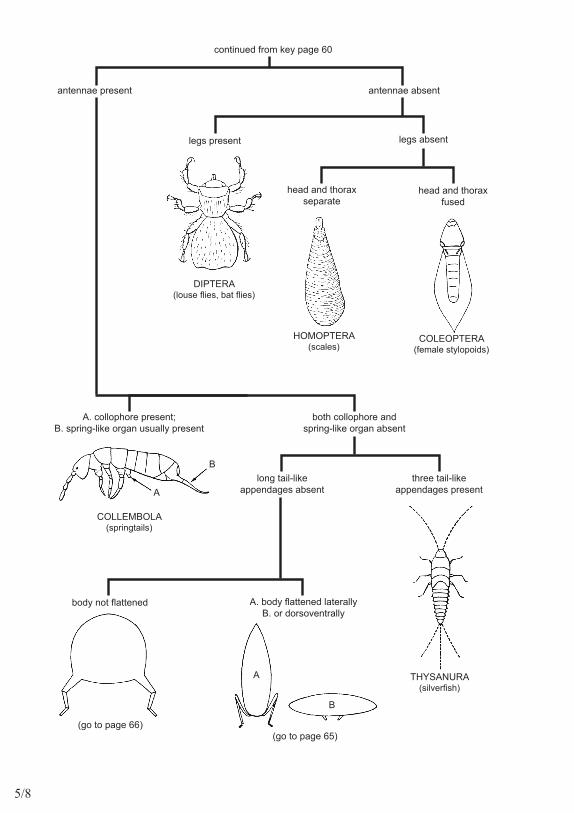
continued from key page 60
antennae present antennae absent
A. collophore present;B. spring-like organ usually present
THYSANURA(silverfish)
A
A
B
B
HOMOPTERA(scales)
(go to page 65)
legs absent
head and thorax separate
head and thorax fused
COLEOPTERA(female stylopoids)
DIPTERA(louse flies, bat flies)
legs present
both collophore and spring-like organ absent
three tail-like appendages present
long tail-likeappendages absent
body not flattened A. body flattened laterallyB. or dorsoventrally
(go to page 66)
COLLEMBOLA(springtails)
5/8
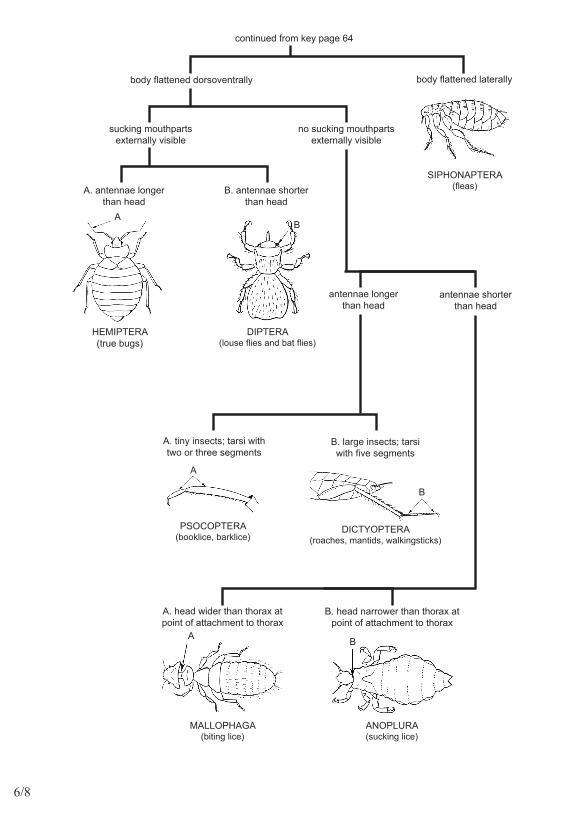
continued from key page 64
body flattened dorsoventrally body flattened laterally
A
SIPHONAPTERA(fleas)A. antennae longer
than head
antennae shorter than head
sucking mouthparts externally visible
no sucking mouthparts externally visible
B. antennae shorterthan head
DIPTERA(louse flies and bat flies)
antennae longer than head
A. tiny insects; tarsi withtwo or three segments
B. large insects; tarsiwith five segments
PSOCOPTERA(booklice, barklice)
DICTYOPTERA(roaches, mantids, walkingsticks)
A. head wider than thorax atpoint of attachment to thorax
B. head narrower than thorax atpoint of attachment to thorax
MALLOPHAGA(biting lice)
ANOPLURA(sucking lice)
B
A B
A
B
HEMIPTERA(true bugs)
6/8
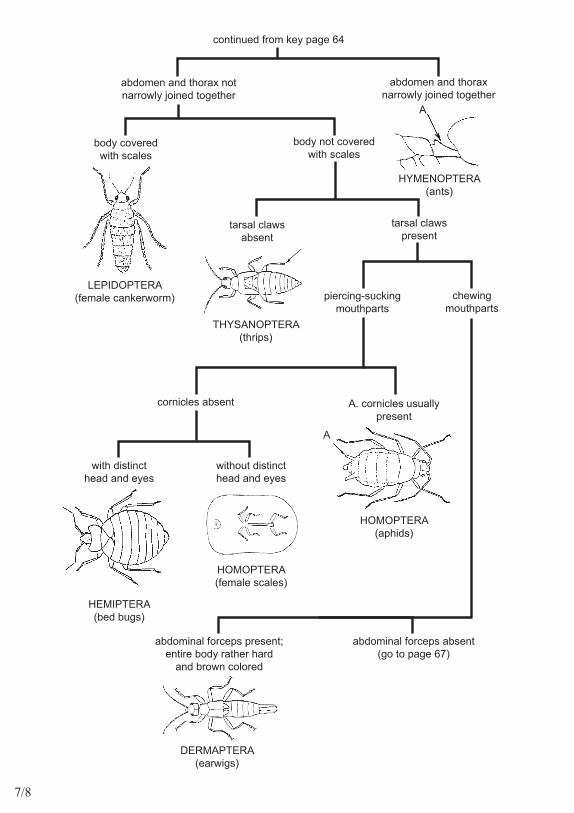
continued from key page 64
abdomen and thorax not narrowly joined together
abdomen and thorax narrowly joined together
LEPIDOPTERA(female cankerworm)
body covered with scales
body not covered with scales
THYSANOPTERA(thrips)
tarsal claws absent
tarsal claws present
HYMENOPTERA(ants)
piercing-sucking mouthparts
chewing mouthparts
cornicles absent A. cornicles usuallypresent
with distinct head and eyes
without distinct head and eyes
HEMIPTERA(bed bugs)
HOMOPTERA(female scales)
HOMOPTERA(aphids)
DERMAPTERA(earwigs)
abdominal forceps present;entire body rather hard
and brown colored
abdominal forceps absent(go to page 67)
A
A
7/8
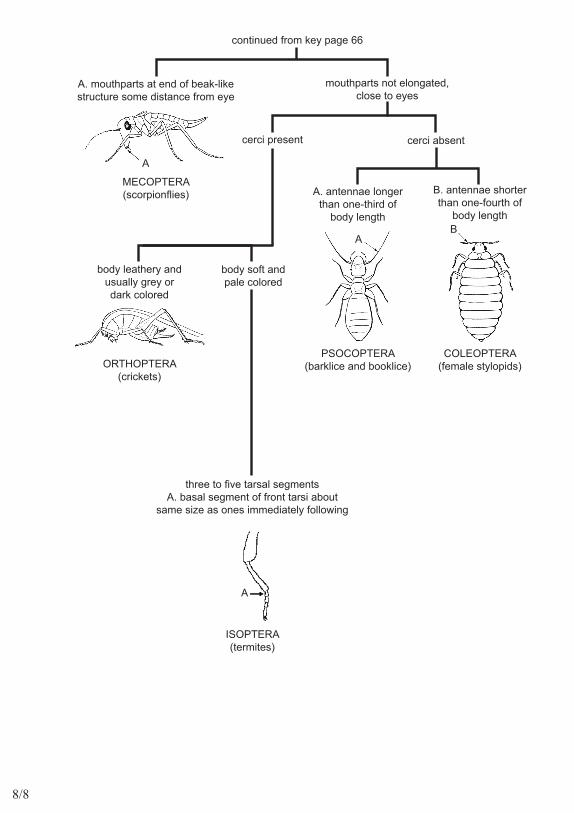
continued from key page 66
A. mouthparts at end of beak-likestructure some distance from eye
mouthparts not elongated, close to eyes
MECOPTERA(scorpionflies)
PSOCOPTERA(barklice and booklice)
cerci present
B. antennae shorterthan one-fourth of
body length
A
cerci absent
A. antennae longerthan one-third of
body length
COLEOPTERA(female stylopids)
body soft and pale colored
body leathery and usually grey or dark colored
ORTHOPTERA(crickets)
three to five tarsal segmentsA. basal segment of front tarsi about
same size as ones immediately following
ISOPTERA(termites)
A
B
A
8/8

Appendix
1/4
Vocabulary List
Alien species: Species introduced into ecosystems that are outside normal distribution areas.
Annual plant: A plant which completes its life cycle from seed germination, through reproduction, to death within one year.
Archaeologist: A person who studies past human history by digging up artifacts and remains, such as pottery, tools, and homes.
Arthropod: An invertebrate animal that has an exoskeleton, jointed legs and many body sections. A beetle is an arthropod.
Bioblitz: An effort that enlists the help of both scientists and non-scientists in documenting as many species as possible in a defined area over a short period of time (‘bio’ = life; ‘blitz’ = fast).
Biodiversity: The diversity, or variety, of plants and animals and other organisms in a particular area or region; this includes diversity within species, between species, and of ecosystems.
Biotic community: The plants and animals living and interacting with each other and with their physical environment in a given locality, such as in a salt marsh or in a bursage-creosote community.
Camouflage: An animal’s color patterns that help it blend in with the plants or rocks around it.
Carnivore: An animal or plant (particularly insect- and invertebrate-eating plants) that requires a staple diet consisting mainly or exclusively of animal tissue through predation or scavenging.
Climax community: Fairly stable, self-sustaining community in an advanced stage of ecological succession; usually has a diverse array of species and ecological niches; captures and uses energy and cycles critical chemicals more efficiently than simpler, immature communities.
Commensalism: An interaction between organisms of different species in which one type of organism benefits from the other without affecting it.
Competition: An interaction between individual organisms (intraspecific competition) or species
(interspecific competition) in which both the species are harmed. Limited supply of at least one resource (such as food, water, and territory) that is used by both organisms can be a factor in competition.
Deciduous plant: A plant that drops its leaves seasonally in response to a dry or cold period.
Decomposer: Organisms that break down dead or decaying plants or animals and return nutrients to the soil. Examples: termites, bacteria, millipedes, and fungus.
Disturbance: A discrete event that disrupts an ecosystem or community. Examples of natural disturbances include fires, hurricanes, tornadoes, droughts, and floods. Examples of human-caused disturbances include deforestation, overgrazing, and plowing.
Diurnal: Active during the day.
Dormancy: The temporary suspension of biological activity, such as growth or movement.
Drought: Prolonged and widespread deficit in naturally available water supplies, such as rain or snow.
Ecological succession: Process in which communities of plant and animal species in a particular area are replaced over time by a series of different and often more complex communities.
© 2017 UA Women in Science and Engineering Program
Ecology: The study of interrelationships among plants, animals and their physical environments. Ecosystem: A community of interacting living organisms and non-living physical components of an environment, through which energy moves and minerals are recycled; e.g., a small mud flat or the biosphere.
Ecosystem services: The benefits that people obtain from ecosystems. These include provisioning services such as food and water; regulating services such as flood and disease control; cultural services such as spiritual, recreational, and cultural benefits; and supporting services such as nutrient cycling that maintain the conditions for life on Earth.
Ectothermic: An animal that regulates its body temperature largely by exchanging heat with its surrounding environment; a cold-blooded animal.
Endangered: A plant or animal species that exists in such small numbers that it is in danger of becoming extinct.
Endemic: Growing or living exclusively within a particular region or locality, such as an island, nation, country or other defined zone, or habitat type
Evaporation: The sum of water lost from a given land area during any specific period of time by evaporation from water surfaces, moist soil, and snow, and by transpiration from vegetation and the building of plant tissue.
Exoskeleton: A hard outer structure, such as the shell of beetles and other arthropods, that provides protection or support for an organism.
Exotic species: Species that migrate into an ecosystem or are deliberately or accidentally introduced into an ecosystem by humans.
Extinct: When the individual of a species dies; or when a species is reduced to such low abundance that, although it is still present in the community, it no longer interacts significantly with other species. Food Chain: A group of animals and plants in a community through which energy flows in the form of food.
Fossil: The remains or impression of a prehistoric organism preserved in petrified form or as a mold or cast in rock.
Foundation species: Species that plays a major role in shaping communities by creating and enhancing a habitat that benefits other species.
Habitat: The place in which a plant or animal naturally lives that provides food, water, shelter and space. Habitat fragmentation: Process by which habitat loss results in the division of large, continuous habitats into smaller, more isolated remnants.
Herbivore: An animal that eats only plants.
Hibernate: To be in a dormant or torpid state during a cold period, especially during the winter.
Host: Plant or animal on which a parasite feeds.
Hybrid: Offspring which is the product of cross-fertilization between two different species, subspecies or varieties.
Immature community: Community at an early stage of ecological succession. It usually has a low number of species and ecological niches and cannot capture and use energy and cycle critical nutrients as efficiently as more complex, mature communities.
Indicator species: Species that serve as early warnings that the health of a community or ecosystem is being degraded.
Inertia: Ability of a living system to resist being disturbed or altered.
Interspecific competition: Individuals of different species compete for the same resource in an ecosystem.
Intraspecific competition: Individuals of the same species compete for the same resource in an ecosystem.
2/4 © 2017 UA Women in Science and Engineering Program
Invasive species: A non-native (or alien) species whose introduction causes or is likely to cause economic harm, environmental harm, or harm to human health.
Keystone species: Species, often dominant predators, that play a role in an ecosystem that affects many other organisms; removal of keystone species often allows a prey population to explode and decreases overall diversity.
Mammal: A warm-blooded, vertebrate animal of a class that is distinguished by the possession of hair or fur, the secretion of milk by females for the nourishment of the young, and (typically) the birth of live young.
Mano: A hand-held grinding stone. Mature community: Fairly stable, self-sustaining community in an advanced stage of ecological succession; usually has a diverse array of species and ecological niches; captures and uses energy and cycles critical chemicals more efficiently than simpler, immature communities.
Mesic: Of or pertaining to a habitat that has a moderate amount of moisture, such as a riparian area or cienega. Compare to xeric.
Metamorphosis: The process of physical transformation (in an insect or amphibian) from an immature form to an adult form in two or more distinct stages.
Metate: A stone base which holds corn and mesquite pods for grinding with a mano.
Microhabitat: A smaller, more specific habitat within the larger habitat in which a species lives, e.g. under a rock, on a certain species of plant.
Mutualism: Type of species interaction where organisms of different species exist in a relationship in which each individual benefits from the activity of the other.
Native species: Species that are indigenous to a given region or ecosystem; their presence in the region is the result of only natural process, with no human intervention.
Niche: The role or function of a particular species in its community or ecosystem.
Nocturnal: Active at night.
Non-native species: A species that is not indigenous to a given region or ecosystem. Compare to Native species.
Omnivore: An animal that eats either other animals or plants.
Orographic: Pertaining to mountain-building or orogeny.
Paleontologist: A scientist who studies past forms of life by examining fossils.
Parasite: Consumer organism that lives on or in and feeds on a living plant or animal, known as the host, over an extended period of time. The parasite draws nourishment from and gradually weakens its host; it may or may not kill the host.
Pathogen: Organism that produces disease.
Perennial: Plants that are present at all seasons of the year and persisting for several years, usually with new herbaceous growth
Petroglyph: A rock carving created by prehistoric peoples; typically a picture of animals, hunters, and scenes of daily life.
Pictograph: An ancient or prehistoric drawing or painting on a rock wall.
Pioneer community: First integrated set of plants, animals, and decomposers found in an area undergoing primary ecological succession.
Pioneer species: First hardy species, often microbes, mosses, and lichens, that begin colonizing a site as the first stage of ecological succession.
3/4 © 2017 UA Women in Science and Engineering Program
Pollination: The process by which pollen is moved from the male parts of one flower to the female parts of another flower of the same species. Pollination is a precondition for seed set and the development of fruit in most plants.
Population: all of the individuals of the same species within an ecological community.
Predation: Situation in which an organism of one species (the predator) captures and feeds on parts or all of an organism of another species (the prey).
Predator: An animal that kills other animals for food. (Try not to think of a predator as the enemy of the prey. A predator is simply getting its food in the way in which it is best adapted.)
Prey: An animal that is hunted for food by a predator. Example: a kangaroo rat may become prey for a coyote.
Primary succession: Ecological succession in a bare area that has never been occupied by a community of organisms.
Reptile: An animal that has dry, scaly skin, lays eggs, and is ectothermic. Snakes, lizards, and tortoises are reptiles.
Resilience: Ability of an ecosystem to respond to a perturbation or disturbance by resisting damage and recovering quickly.
Scavenger: An animal that is either carnivorous or herbivorous and feeds on dead animal and plant material present in its habitat.
Secondary succession: The ecological succession that occurs on a preexisting soil after the primary succession has been disrupted or destroyed due to a disturbance that reduced the population of the initial inhabitants.
Species: A distinct type of organism capable of reproducing with other individuals of the same type, but not with any other type of organisms. (For example, a fox and a coyote are similar, but they cannot breed with each other. A fox is one species and a coyote is another.)
Species evenness: Abundance of individuals within each of the species contained in a community.
Species richness: The number of species in a given area.
Succession: See ecological succession, primary succession, secondary succession.
Succulent: A plant that has thick or fleshy leaves and stems that retain water in arid climates or soil conditions.
Symbiosis: A close ecological relationship between the individuals of two (or more) different species; the term is often used to describe relationships that are mutually beneficial but it also includes other relationships. See commensalism, mutualism and parasitism.
Taxonomy: The science of finding, describing, classifying, and naming organisms.
Threatened: Plants or animals whose populations are decreasing and may become endangered.
Threshold effect: The harmful or fatal effect of a small change in environmental conditions that exceeds the limit of tolerance of an organism or population of a species.
Tolerance limits: Minimum and maximum limits for physical conditions (such as temperature) and concentrations of chemical substances beyond which no members of a particular species can survive.
Venom: A substance which may contain hemotoxins and/or neurotoxins and causes pain, paralysis, and/or death when injected by mouthparts (including fangs) or stinger.
Venomous: An animal that is capable of injecting venom by means of a bite or sting.
Xeric: Of or pertaining to a dry habitat such as a desert, or adapted to a dry habitat. Compare to mesic.
4/4 © 2017 UA Women in Science and Engineering Program

Arizona Science Standards
Composed of 6 strands and (up to) 5 unifying concepts per strand
Strand 4: Life Science Understanding life by focusing on the characteristics of living things, the diversity of life, and how organisms and populations change over time in terms of biological adaptation and genetics. This includes the relationship of structures to their functions and life cycles, interrelationships of matter and energy in living organisms, and the interactions of living organisms with their environment.
Strand 5: Physical Science Students gain an understanding of the nature of matter and energy, including their forms, the changes they undergo, and their interactions. By studying objects and the forces that act upon them, students develop an understanding of the fundamental laws between systems and surroundings.
Strand 6: Earth and Space Science Understanding the Earth, its history, composition, and formative processes, and understanding the solar system and the universe. Students study the regularities of the interrelated systems of the natural world.
Strands 1, 2, and 3 are designed to be explicitly taught and embedded within each of the content strands 4, 5, and 6, and are not intended to be taught in isolation:
Strand 1: Inquiry Process Students use scientific processes: questioning, planning and conducting investigations, using appropriate tools and techniques to gather data, thinking critically and logically about relationships between evidence and explanations, and communicating results.
Strand 2: History and Nature of Science Emphasizes the importance of the inclusion of historical perspectives and the advances that each new development brings to technology and human knowledge. This strand focuses on the human aspects of science and the role that scientists play in the development of various cultures.
Strand 3: Science in Personal and Social Perspectives Students develop the ability to design a solution to a problem, to understand the relationship between science and technology, and the ways people are involved in both. Students understand the impact of science and technology on human activity and the environment. Students understand their place in the world – as living creatures, consumers, decision makers, problem solvers, managers, and planners.
1/2 © 2017 UA Women in Science and Engineering Program
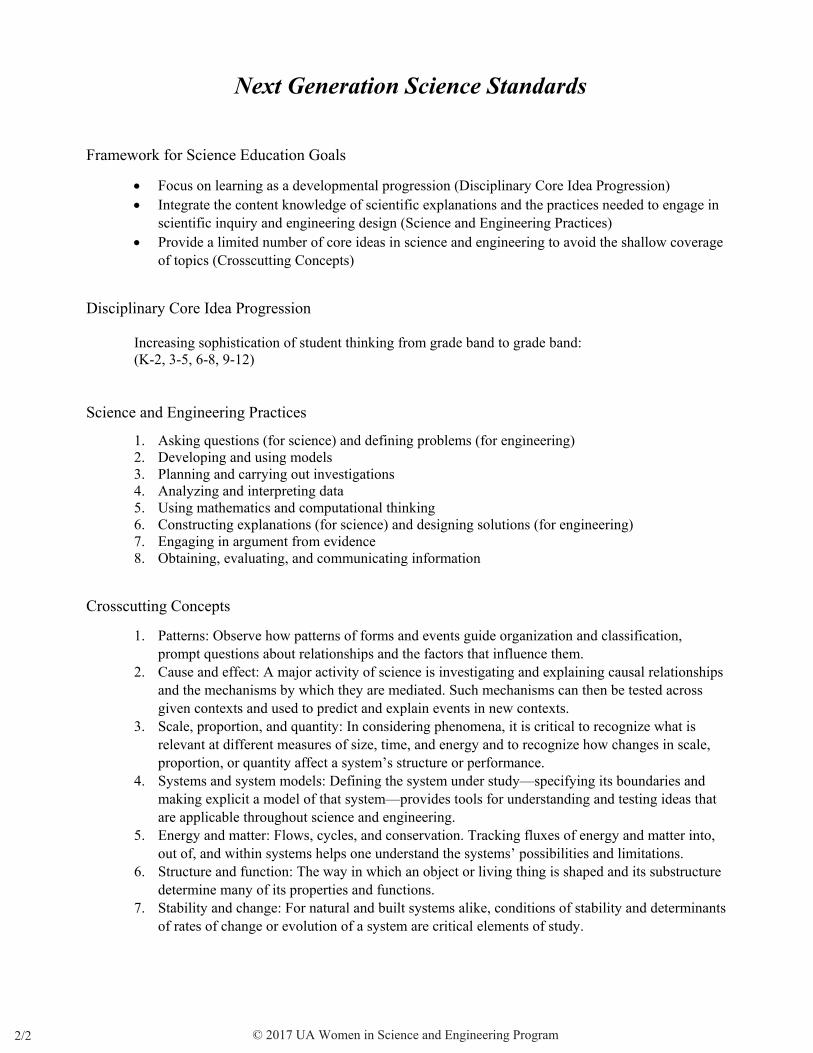
Next Generation Science Standards
Framework for Science Education Goals
• Focus on learning as a developmental progression (Disciplinary Core Idea Progression)• Integrate the content knowledge of scientific explanations and the practices needed to engage in
scientific inquiry and engineering design (Science and Engineering Practices)• Provide a limited number of core ideas in science and engineering to avoid the shallow coverage
of topics (Crosscutting Concepts)
Disciplinary Core Idea Progression
Increasing sophistication of student thinking from grade band to grade band: (K-2, 3-5, 6-8, 9-12)
Science and Engineering Practices
1. Asking questions (for science) and defining problems (for engineering)2. Developing and using models3. Planning and carrying out investigations4. Analyzing and interpreting data5. Using mathematics and computational thinking6. Constructing explanations (for science) and designing solutions (for engineering)7. Engaging in argument from evidence8. Obtaining, evaluating, and communicating information
Crosscutting Concepts
1. Patterns: Observe how patterns of forms and events guide organization and classification,prompt questions about relationships and the factors that influence them.
2. Cause and effect: A major activity of science is investigating and explaining causal relationshipsand the mechanisms by which they are mediated. Such mechanisms can then be tested acrossgiven contexts and used to predict and explain events in new contexts.
3. Scale, proportion, and quantity: In considering phenomena, it is critical to recognize what isrelevant at different measures of size, time, and energy and to recognize how changes in scale,proportion, or quantity affect a system’s structure or performance.
4. Systems and system models: Defining the system under study—specifying its boundaries andmaking explicit a model of that system—provides tools for understanding and testing ideas thatare applicable throughout science and engineering.
5. Energy and matter: Flows, cycles, and conservation. Tracking fluxes of energy and matter into,out of, and within systems helps one understand the systems’ possibilities and limitations.
6. Structure and function: The way in which an object or living thing is shaped and its substructuredetermine many of its properties and functions.
7. Stability and change: For natural and built systems alike, conditions of stability and determinantsof rates of change or evolution of a system are critical elements of study.
2/2 © 2017 UA Women in Science and Engineering Program
Related Documents