The biodiversity footprint of UK Foreign Direct Investment Joint Nature Conservation Committee Spring 2009

Welcome message from author
This document is posted to help you gain knowledge. Please leave a comment to let me know what you think about it! Share it to your friends and learn new things together.
Transcript

The biodiversity footprint of UKForeign Direct Investment
Joint Nature Conservation CommitteeSpring 2009
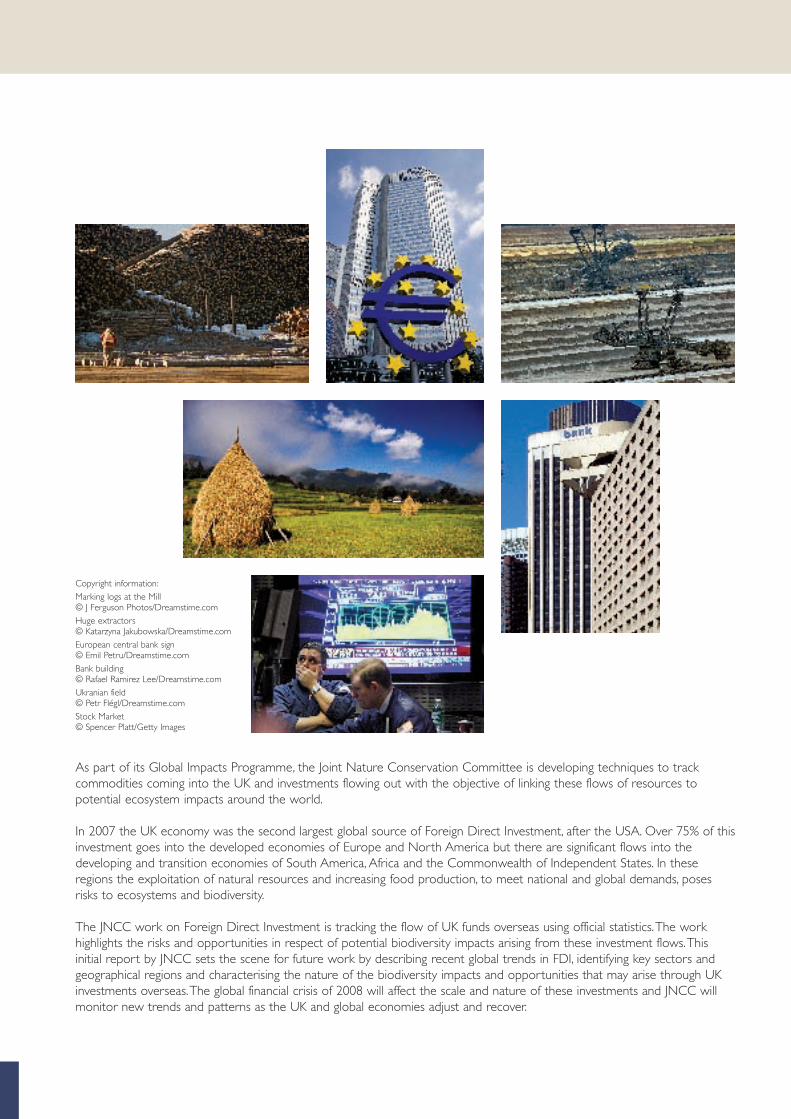
As part of its Global Impacts Programme, the Joint Nature Conservation Committee is developing techniques to trackcommodities coming into the UK and investments flowing out with the objective of linking these flows of resources topotential ecosystem impacts around the world.
In 2007 the UK economy was the second largest global source of Foreign Direct Investment, after the USA. Over 75% of thisinvestment goes into the developed economies of Europe and North America but there are significant flows into thedeveloping and transition economies of South America, Africa and the Commonwealth of Independent States. In theseregions the exploitation of natural resources and increasing food production, to meet national and global demands, posesrisks to ecosystems and biodiversity.
The JNCC work on Foreign Direct Investment is tracking the flow of UK funds overseas using official statistics.The workhighlights the risks and opportunities in respect of potential biodiversity impacts arising from these investment flows.Thisinitial report by JNCC sets the scene for future work by describing recent global trends in FDI, identifying key sectors andgeographical regions and characterising the nature of the biodiversity impacts and opportunities that may arise through UKinvestments overseas.The global financial crisis of 2008 will affect the scale and nature of these investments and JNCC willmonitor new trends and patterns as the UK and global economies adjust and recover.
Copyright information:Marking logs at the Mill © J Ferguson Photos/Dreamstime.comHuge extractors © Katarzyna Jakubowska/Dreamstime.comEuropean central bank sign © Emil Petru/Dreamstime.comBank building © Rafael Ramirez Lee/Dreamstime.comUkranian field © Petr Flégl/Dreamstime.comStock Market © Spencer Platt/Getty Images

The biodiversity footprint of UK Foreign Direct Investment 3
Contents
1 Summary 4
2 Scope and purpose of JNCC work on Foreign Direct Investment 5
3 Data sources for Foreign Direct Investment 6
4 Global trends in Foreign Direct Investment 7
5 UK Foreign Direct Investment 10
6 UK Foreign Direct Investment in selected economies 13
7 Global biodiversity implications for UK Foreign Direct Investment 16
8 UK flagship company identification – looking for best practice 21

1 Summary
4 The biodiversity footprint of UK Foreign Direct Investment
1.1 Global Foreign Direct Investment (FDI)
In 2007 global flow of Foreign Direct Investment (FDI)exceeded $1.8 trillion growing 30% on the previous year.FDI accounts for half of all net capital flows into developingcountries. reaching a record $500 billion in 2007, with thedeveloped countries currently providing the major sourceof funding. Trans National Companies (TNCs) are theleading sources of FDI accounting for over 80% of globaloutflows.This investment has the ability to impact upon theenvironment in countries receiving investment but alsoprovides the opportunity for corporations and investmentinstitutions based in developed countries to apply andshare sustainability best practice within their business sector.
Three principal FDI groups are recognised, namely; primaryresources, manufacturing and services. Since 2002, there hasbeen a steady overall growth in global FDI with increasedinvestment in services, particularly financial services, and lessdirect investment in manufacturing. Investment into primaryresources showed a relative decline until 2006 but in someregions has seen resurgence in response to increasedprimary commodity prices.
1.2 UK Foreign Direct Investment
There has been an overall increase in annual flows ofinvestment funds from the UK over the period 2002-2007reaching £49 billion in 2006 (UK Office of NationalStatistics) increasing three fold to £150 billion in 2007(UNCTAD figures).The UK was the 2nd largest globalsource of outward FDI in that year after the USA. Over75% of UK FDI goes into Europe and North America1 butthe principal areas of interest for this report are outsidethese regions, lying in a suite of countries across SouthAmerica, Africa, and Eastern Europe. Although thesecountries attracted less than 5% of total UK FDI in 2006these areas contain some of the world’s largest growingglobal economies (including Brazil and Russia) and largeareas of land which are potentially available for productionof agricultural foodstuffs, biomass based fuels andexploitation of other natural resources. Pressure on globalbiodiversity will inevitably result from these activities alongwith associated infrastructure developments.
1 Based on 2006 statistics breakdown
1.3 Sustainable development implicationsfor UK FDI
The UK is one of the major global sources of FDI. UKbased Trans National Corporations, therefore, have asignificant potential role to play as sector leaders intransferring environmental best practice to host countries.Understanding this role requires knowledge of FDI flows,not only in terms of countries and business sectorsreceiving UK FDI, but also requires identification of thosesectors that are most significant in terms of theirbiodiversity impacts. Different business sectors havedifferent potential biodiversity impacts. Combiningbiodiversity impact analysis with the review of the natureand distribution of UK FDI suggests that the followinginvestment sectors are of most relevance in terms of levelof investment and/or likely environmental impacts withinreceiving countries:
A financial services;A food products and agriculture, forestry & fishing;A extractive industries.
JNCC has undertaken new work and collated existingstudies to characterise these sector impacts and identifysources of information for use in identifying corporateleaders in each sector.
Patterns of foreign investment flow vary through timereflecting global economic cycles and changing corporatepriorities.The events of 2008 will have an impact on thescale and nature of future FDI by the UK economy.This initial report by JNCC on FDI sets the scene for future work.This work will track these changes on anannual basis and JNCC will monitor and report on theimplications of UK FDI into new geographical areasinvolving those investment sectors regarded as importantfor biodiversity.
The UK is one of the major sources of global foreign investment and UK based Trans National
Corporations have a significant global role in transferring environmental best practice and
promoting the value of ecosystems and biodiversity.

2
The biodiversity footprint of UK Foreign Direct Investment 5
Scope and purpose of JNCC work onForeign Direct Investment
The UK’s priorities for International SustainableDevelopment include promotion of corporate socialresponsibility.The high level aim in respect of this priority isfor government to foster :
‘…an enabling environment for responsible business practice tomaximise the positive contribution that business can make tothe UK’s objectives on international sustainable development -including human rights, trade and investment, povertyeradication, environmental protection and corruption - whilst atthe same time effectively tackling adverse impact2’.
Foreign Direct Investment, and the TNCs that invest thesefunds, have a significant global role both in global economicdevelopment and in managing the environmental impactsthat accompany such developments. JNCC has developed a work project to monitor UK FDI and characterise itspotential biodiversity impacts in terms of geography andbusiness sector. The work also identifies sources ofinformation to help identify UK corporations that may actas sector leaders for demonstrating best environmentalpractice.
Approximately 75% of UK FDI goes into developedeconomies in Europe and North America where theimpact of UK investment is likely to be minimal and scopefor UK business to transfer and encourage best practiceequally limited. Global FDI into the developing andtransition economies located in South America, Africa andEastern Europe is playing a key role in their growth and theUK is a significant contributor to these monetary flows.These regions of the planet have large areas of land thatare seen as available for food and biofuel production andvaluable mineral and forest resources. Increased foodproduction and natural resource exploitation carry withthem the potential for significant environmental impactsthrough land use change, infrastructure development and avariety of other pressures. All of these pressures canseriously affect biodiversity, with land use change probablybeing the most significant.
Key elements of the JNCC work on UK FDI are to:
A put the UK FDI streams into a global context (usingUNCTAD reports);
A identify key FDI sectors attracting UK investment (usingUK Office of National Statistics data) based on sectorimpacts and their relative importance in attractingfunding flows;
A identify key countries within the priority regions ofSouth America, Sub-Saharan Africa and Eastern Europewhere UK investment is important, quantifiable andtraceable to specific business sectors;
A characterise the biodiversity impacts of key businesssectors through new work or collation of existingstudies;
A identify mechanisms for recognising key UK Trans National Companies that may be regarded assector leaders demonstrating environmentalmanagement best practice; and,
A publish an annual overview of UK FDI highlightingtrends, identifying data sources and drawing attention toemerging issues in respect of the links betweeninvestment flows and biodiversity impacts overseas.
The objectives of the JNCC work on UK FDI are tohighlight trends in terms of key investment sectors,characterise sector impacts and the geographical areaswhere these impacts may occur. Detailed evaluation ofimpacts arising within individual countries is beyond thescope of the work programme.
The events of 2008 will have an impact on the scale andnature of future FDI by the UK economy. This initial reportby JNCC on FDI sets the scene for future work. This workwill track these changes on an annual basis and JNCC willmonitor and report on the implications of UK FDI intonew geographical areas involving those investment sectorsregarded as important for biodiversity.
2 www.defra.gov.uk/sustainable
JNCC’s work on FDI is directed towards monitoring and reporting on changing trends and
patterns of UK overseas investment and highlighting the risks and opportunities in the
context of those areas of the world where biodiversity is most vulnerable.

3 Data sources for Foreign DirectInvestment
6 The biodiversity footprint of UK Foreign Direct Investment
3.1 Overview
UK and UN sources of FDI statistics have been utilised inthe preparation of this report.These sources have beenaccessed either directly by JNCC or through contractedwork undertaken by GHK on JNCC’s behalf 3.
Principal sources include:
A UK Office for National Statistics: UK business investmentabroad (Foreign Direct Investment) is surveyed annuallyby the Office for National Statistics (ONS), thegovernment department responsible for collecting andpublishing official statistics about the UK’s society andeconomy;
A UNCTAD country and sector reports: UNCTAD analysesFDI trends and their impact on development, compilesdata on FDI 4 and has a comprehensive online database5.
The two key reporting mechanisms used in this report aremeasures of annual FDI flows and the cumulative FDIvalue (investment position). The former statistics reflectyear-by-year trends, the latter are an indication of long termvalue and growth of FDI. Care should be taken whenreading numbers within the text or in diagrams todiscriminate between these two indicators. In some casesvalue is a more useful indicator being independent of yearby year flow fluctuations which, in years of netdisinvestments, may actually be negative.
At the time of writing, detailed statistics for UK FDI havenot been released for 2007 and this report uses 2006statistics. UNCTAD has published (September 2008) theirannual FDI report6 which covers 2007 and released theassociated database from which gross figures for UK FDIcan be obtained, but contain no sector details.
3.2 Significant data gaps
Vital for understanding the implications of UK outward FDIis an analysis of which business sectors are involved in thekey host countries, but significant gaps have been identified.Examples of data gaps identified by GHK in respect of the2006 data from the UK ONS Business Monitor MA4report are:
i good data coverage is available for India and SouthAfrica, where sectoral data is undisclosed for onlybetween 6% and 12% of the total UK investment ineach respective country;
ii there is reasonable data for Brazil (28% unknown) andChina (37% unknown). By contrast, the 2004 sectoraldata for China was virtually complete with almost all ofthe total investment allocated to individual sectors;
iii there are significant confidentiality issues concerning UKinvestment in Indonesia (73% unknown) and Russia(99.5% unknown).
These data sets, and their limitations, are discussed inmore detail in the GHK report.
The ability of the UK ONS to identify the different sectorsattracting UK investment in certain key countries appearsto vary through time.When such information is notavailable through ONS datasets other sources need to be used, such as host country national datasets, majorcompany annual reports and business analyst reports.The reliability of these sources varies but their use canprovide useful background information to supplement theONS data.
3 Available on www.ukglobalinfluence.org/UKFDI4 www.unctad.org/en/docs/wir2008_en.pdf5 http://stats.unctad.org/FDI6 WORLD INVESTMENT REPORT 2008 UNITED NATIONS New York and Geneva, 2008-11-12.www.unctad.org/en/docs/wir2008_en.pdf
For some countries receiving UK FDI, there are major problems determining into which
business sectors the money is flowing. Based on official statistics for 2006, 99.5% of UK
investment into Russia remains confidential. Other sources must be used to assess how this
money has been invested.

upon the environment in countries receiving investment andprovides the opportunity for corporations and investmentinstitutes based in developed countries to apply and sharesustainability best practice in the developing world.
The developed country TNCs are the main source of FDI,accounting for 84% of global outflows in 2006 and half ofworld outflows of investment funds originate from theEuropean Union. TNCs from developing and transitioneconomies were growing in importance through to 2006with $193 billion, or 16% of world FDI, originating in thesecountries in that year led by China and Russia.The role ofTNCs is expanding and although manufacturing andpetroleum companies are still important their role in theservices sector is now growing.
FDI inflows accounted for half of all net capital flows todeveloping countries and this represents a significant sourceof funding for developing countries. The role of TNCs inproviding FDI, and the influence of both in influencingsustainable development policy in recipient countries needsto be recognised and addressed.
Figure 2. Global outward FDI (flow) 2001 – 2007. Source: data from UNCTAD
4
The biodiversity footprint of UK Foreign Direct Investment 7
Global trends in FDI – investors,recipients and sector analysis
4.1 Foreign Direct Investment background
Overseas (out of country) investment by private sectorbusiness is a major driver of the global economy. ThisForeign Direct Investment is defined as investment ‘made toacquire lasting interest in enterprises operating outside of theeconomy of the investor’ 7.
In terms of targeting investments, and funding sources,there are three main categories of FDI:
A Greenfield investment in new facilities or the expansionof existing facilities;
A Mergers and Acquisitions (M&A) - Cross-borderacquisitions occur when the control of assets andoperations is transferred from a local to a foreigncompany, with the local company becoming an affiliateof the foreign company;
A Reinvested earnings where local profits are reinvested inthe country in which they are made rather thanrepatriated as net earnings.
4.2 Foreign Direct Investment overviewfor 2006 and 2007
In 2007 global flow of FDI exceeded $1.8 trillion (£1250billion at the then exchange rate) growing 30% on theprevious year.This FDI growth reflected high economicgrowth and increased corporate profits but UNCTAD8
estimates the global economic slowdown in 2008 will resultin a 10% decline in FDI flow rates for the year although itpredicts that developing countries may be less affected. FDIaccounts for half of all net capital flows into developingcountries reaching a record $500 billion in 2007 whilst thedeveloped countries currently provide the major source offunding. These investment flows carry the potential to impact
7 UK Office of National Statistics.8 WORLD INVESTMENT REPORT 2008 UNITED NATIONS New York and Geneva, 2008-11-12.www.unctad.org/en/docs/wir2008_en.pdf
2.50
2.00
1.50
1.00
0.50
0.00
Trill
ions
$
2001 2002 2003 2004 2005 2006 2007
Figure 1. Global sources of FDI (flow) for 2007.Source: data from UNCTAD
1.2
1
0.8
0.6
0.4
0.2
0
Trill
ions
$
EU25 USA UK

4.3 Geographic patterns of FDI flow
The established pattern of FDI flows, with investmentsmoving from ‘north’ to ‘south’, has changed in recent years.Prior to 2008, new countries were emerging as significantoriginating and receiving economies. FDI from developing
8 The biodiversity footprint of UK Foreign Direct Investment
2
1.5
1
0.5
0
Trill
ions
$
2004 2005 2006 2007
Figure 4. Net resource flows (billions of US$) to developing countries by type of flow, 1990-2006. Source: UNCTAD
700
550
400
250
100
-501990 1991 1992 1993 1994 1995 1996 1997 1998 1999 2000 2001 2002 2003 2004 2005 2006
Figure 3. Global FDI inflow.Source: data from UNCTAD.
and transition economies and the growth of ‘South-South’FDI were important recent trends with outflows of $253billion in 2007.Well established bilateral relationshipsbetween individual countries, which have dominatedinternational investment flows, are being replaced by amore complex global position, reflecting the involvement ofmore countries.
In spite of these changing patterns of FDI flow, thedeveloped countries currently still provide the major sourceof funding with outflows from developed countries growingby 45% in 2006 to $1 trillion and continuing to grow to$1.5 trillion in 2007. The United States and four EUcountries comprised the 5 largest outward investoreconomies in the world.Within the EU France, Spain, theUK and Germany are the major FDI sources.
Developing countries saw record inflows of investment in2007 reaching £500 billion, about 27% of global FDI flowswith Asia being the recipient of almost half of thisinvestment. However, Latin America saw the largestincrease (36%) on the previous year.
World Developed world Developing world
In recent years there has been a resurgence of global investment into primary industries such as mining and quarrying. © Markwr/Dreamstime.com
Total resource flows FDI inflows Commercial bank loans Portfolio flows Official flows

The biodiversity footprint of UK Foreign Direct Investment 9
0.6
0.5
0.4
0.3
0.2
0.1
0
Trill
ions
$
2004 2005 2006 2007
4.4 Sectoral distribution of FDI
Three sectors are recognised and recorded for global FDIpurposes: primary resources (mining, agriculture, forestry,fisheries), manufacturing and services. During the past 25years there has been a steady shift away from FDI in theprimary sector and manufacturing and a shift towardsservices, in particular the financial services sub-sector (Fig 6). Recent increases in global demand for rawmaterials, primarily driven by the growth of the Chineseeconomy has, however, resulted in a resurgence of FDIflows into resource rich countries, mainly within Africa andSouth America. The primary sector’s share of FDI is nowcomparable to that of the late 1980s.
Growing global demand for food and bioenergy crops is driving increased
foreign investment in production of crops such as sugar cane (illustrated).
© Michael Jung/Dreamstime.com
© Jose Marques Lopes/Dreamstime.com
Figure 5. Global FDI inflow to developing world.Source: data from UNCTAD.
Developing world Asia Latin America
CIS Africa
700
600
500
400
300
200
100
0
Billi
ons
$
Prim
ary
Man
ufac
turi
ng
Serv
ice
Prim
ary
Man
ufac
turi
ngTotal Developing
Serv
ices
Figure 6. Global outward FDI (flow) sector changes 2004-2006. Source: UNCTAD
Figure 7. Global FDI (value, 2006) in developing countriesby sector. Source: Statistics from UNCTAD
M 1989/91 M 2006/08
Primary 10%
Services 55%
Manufacturing 35%

5 UK Foreign Direct Investment
10 The biodiversity footprint of UK Foreign Direct Investment
5.1 UK FDI overview
The UK Office for National Statistics (ONS), thegovernment department responsible for collecting andpublishing official statistics about the UK’s society andeconomy, reports annually on FDI. The investment figurespublished are net of disinvestments by companies into itssubsidiaries, associate companies and branches.
Within the UK ONS data collection systems, UKinvestment flows into and out of the country are measuredin three ways):
A Net direct investment abroad by UK companies – ameasure of annual net flows of UK investment moneyinto overseas economies;
160
140
120
100
80
60
40
20
0
Billi
ons
£
2001 2002 2003 2004 2005 2006 2007
9 Based on 2006 statistics breakdown.
A Net international investment position – direct investmentabroad by UK companies – a measure of the cumulativevalue of UK business investments overseas;
A Net earnings from direct investment abroad by UKCompanies – a measure of net earnings repatriated fromoverseas economies.
The two key reporting mechanisms used in this report aremeasures of annual FDI flows and the cumulative FDIvalue (investment position). There has been an overallincrease in annual flows of investment funds from the UKover the period 2002-2007 reaching £49 billion in 2006and then, according to UNCTAD figures, increasing threefold to £150 billion in 2007. The UK was the 2nd largestglobal source of outward FDI in that year (after the USA)with half of this investment expected to be going intoEurope and 25% into North America 9.
The growth of UK FDI in recent years has been driven by increasing corporate profits and rising share prices.The effects of the financial and economic crisis of 2008 will affect the ability and willingness of UK business to invest in overseas economies. UNCTAD estimates in mid 2008 suggest that a 10% reduction in global FDI as a result of these events. The true scale of the global crisis was not apparent at that time and it seems likely that global FDI flows will suffer a more significant interruption in the short term.
Figure 8. UK outward FDI (flow). Source: data from UNCTAD.
Figures in £ based on 2006 $ exchange rates.
The JNCC work on UK Foreign Direct Investment is tracking the flow of UK funds into
selected overseas economies.The work highlights the biodiversity risks and opportunities
associated with this flow of money.The global financial crisis of 2008 will affect the scale and
nature of these investments. JNCC will monitor new trends and patterns as the UK and global
economies adjust and recover.

Direct investment abroard by UK companies
Flows Level at Earnings
in 2006 end 2006 in 2006
Europe 16.0 393.8 39.0
The Americas 21.2 259.7 27.1
Asia 8.3 53.0 11.8
Australasia & Oceania 3.6 12.6 3.2
Africa 0.3 15.5 3.5
Total 49.4 734.7 84.6
Foreign direct investment 2006
5.2 UK FDI – geographical analysis
The UK ONS statistics for UK FDI include data forindividual countries receiving UK FDI grouped in fivegeographical regions (Table 1). Based on all three measures– annual flow, investment position (value) and earnings, thebulk of UK FDI goes into Europe and North America.Outside these regions Asia, Australasia and Africa follow inimportance in that order.The principal areas of interest forthe JNCC work lie outside the OECD where UK FDI isfocussed principally on countries across South America,Africa, and Eastern Europe.
The UK ONS data allows analysis of FDI at a regional level.Country specific FDI flows are available for only a limitedset of countries in the regions of interest. Figure 9 illustratesthe scale of investment across selected developing andtransitional economies, including some of those identified aspriorities for JNCC’s ongoing analysis and review.
Table 1. UK FDI, 2006. Figures (flow, value and earnings)in £ billions. Source: UK ONS
10,000
9,000
8,000
7,000
6,000
5,000
4,000
3,000
2,000
1,000
0
Mill
ions
£
Figure 9. UK FDI (value) as of 2006 into 12 key countries outside North America and Europe. Source: Data from UK ONS
Indi
a
Chi
na
Indo
nesi
a
Mex
ico
Braz
il
Chi
le
Col
ombi
a
Rus
sia
Sout
hA
fric
a
Ken
ya
Nig
eria
Zim
babw
e
The biodiversity footprint of UK Foreign Direct Investment 11

12 The biodiversity footprint of UK Foreign Direct Investment
Figure 11. Changing pattern of UK FDI (flow) in four key industry types, 2002-2006.
Figure 10. Percentage split of UK FDI (flow) by majorindustry type for 2006. Source: ONS
5.3 UK FDI – sectoral analysis
In 2006 the pattern of UK investment flows overseasshowed an approximately even distribution between thethree business sectors, manufacturing, primary resources andservices. Notable investment trends over recent years are:
A the continued pre-eminence of the Financial Servicessub-sector within the Service sector from 2003 to 2006;
A the decline of, and then a major resurgence in,investment into the extractive industries sub-sector(Primary Resources sector);
A the steady growth in investment into food products(Manufacturing sector).
Figures 10 to 12 show the relative distribution of UK FDIby sector and recent trends.
Figure 12. Sectoral trends in UK global FDI (flow) for 2006. Source: UK ONS
25
20
15
10
5
0
-5
-10
-15
Extractive industries Food products Financial services
Billi
ons
£
2003 2004 2005 2006
-25 -15 -5 5 15 25
Financial services
Mining & quarrying (including oil & gas)
Food products
Real estate & business services
Retail/wholesale trade & repairs
Remainder of industries
22.1
18.5
15.5
7.7
6.9
-21.3
Billions £
Primary 38%Services
29%
Manufacturing 33%

6
The biodiversity footprint of UK Foreign Direct Investment 13
UK Foreign Direct Investment in selected economies
Billi
ons
$
1200
1000
800
600
400
200
0Latin America Sub-Saharan Industrialised Transition East Asia South Asia North Africa& Caribbean Africa countries economies
M Total suitable rainfed land M Available M Current arable
6.1 Overview
The UK, as a major source of Foreign Direct Investment inthe global economy, has the ability to impact uponbiodiversity in those countries receiving investment flows.Over 75% of UK FDI, however, goes into the developedeconomies of Europe and North America where corporateand national environmental governance is well developedand where UK corporate influence may be minimal. Thelevel of development in these areas, and the extent of landuse change which has already taken place, also limits thepotential scale for future biodiversity loss. By contrast,although investment into the developing regions of theworld accounts for less than 25% of UK FDI these regionscontain areas of high biodiversity value and large land areaswhich are likely to be subject to major land use change inthe future.
Analysis of current global land use and future ‘availability’highlights Latin America, Sub-Saharan Africa and thetransition economies of Eastern Europe as having majorpotential for land use change and, by extension, loss ofbiodiversity.These changes will be driven by increasednational, regional and global demand for food, forest
Figure 13. FAO analysis of global land use and future availability for food and bioenergy use.
products and bioenergy with the potential for directbiodiversity impacts. Development of other naturalresources through hydrocarbon developments, mining andquarrying will also be significant in the developingeconomies as will growing infrastructure development.Collectively, all of these activities have the potential toimpact upon biodiversity and UK investment into theseactivities carries with it the opportunity and responsibilityto address these impacts.
The focus of the rest of this report is therefore on thosedeveloping regions where potential biodiversity impacts arelikely to be greatest and where there is correspondinglygreater scope for UK influence.
The scale, nature and geographical distribution of UK FDIwill change through time, and new areas of interest willemerge. For 2009 and 2010 JNCC’s analysis will focus onthe following:
A South America – Brazil, Chile, Colombia;A Sub-Saharan Africa – South Africa, Kenya, Nigeria;A Commonwealth of Independent States – Russia,
Ukraine, Kazakhstan (transition economies).
The biodiversity impacts, both positive and negative, of UK FDI are most likely to be felt in
those areas of the world where major land use change is expected to occur in the coming
10-20 year period. JNCC has identified South America, Sub-Saharan Africa and the transition
economies of Eastern Europe as the areas most at risk.

14 The biodiversity footprint of UK Foreign Direct Investment
6.2 Sector analysis across selectedeconomies/regions
South AmericaGlobal FDI flows to Latin America and the Caribbean rosein 2007 by 36%, to a record level of $126 billion. In general,FDI inflows continued to be drawn to this subregion byhigh commodity prices attracting inflows into extractiveactivities and resource-based manufacturing.The largestthree host countries (Brazil, Chile, Colombia) showed a
78% increase in investment. In Brazil, the greatest growthwas in the primary sector (mainly in metal mining) and innatural-resource-based manufacturing (basic metallurgy,food and beverages, refineries, chemical products). In Chileand Colombia the extractive industries attracted more thanhalf the inflows.
Government statistics allow UK investment into the threekey countries – Brazil10, Chile and Colombia - to be trackedin detail with food and the financial sectors dominating.Figure16.Distribution of UK FDI (value) inkey sectors inBrazil 2006Sub-Saharan AfricaIn 2007, global FDI inflows into Sub-Saharan Africa grew byaround 20% to reach over $30 billion in total. Analysis ofthe UK contribution to this flow for that year is not yetavailable but is likely to represent at least 10% of thisinvestment based on prior year statistics. UK investment inthe region is focussed on four countries, Kenya, Nigeria,Zimbabwe and South Africa where, in 2006 the value ofUK investment exceeded £8 billion out of a total UKinvestment for the continent of £15 billion. Analysis of theinward investment pattern for South Africa shows theimportance of UK investment in financial services withrelatively little money identified as going directly into naturalresources11. Identification of investment sectors in othercountries is more difficult, although the food sectoremerges as significant in Kenya.
A recent development in South East Africa is the biofuelsindustry, which has attracted significant foreign investmentincluding UK funds.
Figure 14. Split of UK FDI (value) in selected regions (£ billions) for 2006.
Figure 15. Distribution of UK FDI (value) in key sectors inBrazil 2006.
Figure 16. Distribution of UK FDI (value) in key sectors inSouth Africa 2006.
10 www.ukglobalinfluence.org/UKFDI11 www.ukglobalinfluence.org/UKFDI
Food products31%
Financial services 69%
Other 26%
Financial services 74%
Latin America & Caribbean
6.6
Transition economies
6.1
Sub-Saharan Africa 10.0

The biodiversity footprint of UK Foreign Direct Investment 15
Commonwealth of Independent StatesAs near neighbours to the EU, where economicredevelopment is following on from political change, thethree key countries of interest are Russia, the Ukraine andKazakhstan; the biggest recipients of FDI in the region.Theprimary and services sectors in the CIS receivedsignificantly higher inflows in 2007 than in the previous year,while flows to manufacturing declined. Foreign TNCs alsoincreased their investments in energy and natural-resource-related projects.
In 2007, FDI inflows to the Russian Federation grew by62%, reaching $52 billion. Kazakhstan, owing to thedevelopment of hydrocarbon projects, was the secondlargest recipient of FDI inflows. Ukraine attracted FDIinflows that reached a new high of almost $10 billionprincipally into financial services.
FDI into natural resources is expected to increase in futurewith the EU countries accounting for the bulk of investments.On the basis of available statistics, UK investment into the
Figure 18. Priority countries and regions for current and future JNCC analysis of UK FDI outside North America andWestern Europe.
Figure 17. UK FDI value in key sectors in Russia 2006.Source: UK ONS and GHK report
1%Agriculture, forestry
& fishing
Food products Mining & quarrying
& oil/gas 21%
Other 67%
4%
Financial services 7%
region can only be traced into Russia (although this analysis isitself difficult) where natural resources and food sectorsattract significant investment flows.
7.1Keybusinesssector identification

7 Global biodiversity implications for UK FDI
16 The biodiversity footprint of UK Foreign Direct Investment
7.1 Key business sector identification
The UK is one of the major global sources of FDI and UKbased Trans National Corporations (TNCs) therefore havea significant potential role to play as sector leaders intransferring environmental best practice to host countries.Understanding this role requires knowledge of FDI flowsnot only in terms of countries and business sectorsreceiving UK FDI, but also requires identification of thosesectors that are most significant in terms of theirbiodiversity impacts. Different business sectors havedifferent potential biodiversity impacts and JNCCcontracted GHK12 to develop a strategic overview of thepotential biodiversity impacts of specific industrial sectorsusing the five MEA drivers13. The sectors have beencategorised into three groups:
Group A: Sectors with very direct impacts onbiodiversity, which include the agriculture, forestry andfishing sectors.
Group B: Sectors with a mix of direct and indirectimpacts on biodiversity, which include mining andquarrying, food processing, electricity, gas and water,construction, and transport and communications. Thesesectors affect biodiversity through their direct use ofland as well as more indirect impacts through rawmaterial use, infrastructure development and pollution.
Group C: Sectors where specific impacts are moredifficult to determine, which include the remainingmanufacturing and service sectors. These sectors havemore indirect impacts, which may nevertheless besignificant in certain circumstances and locations.
For each sector and MEA driver, the scale of the impact hasbeen assessed (high, medium, low) alongside a descriptionof the impact.
Combining this biodiversity impact analysis with the reviewof the nature and distribution of UK FDI, suggests that thefollowing investment sectors are of most relevance in termsof level of investment and/or likely environmental impactswithin receiving countries. For the purposes of this report,this analysis places four key FDI investment sub-sectors (asemployed by the ONS) into three groups:
A extractive industries;A food products and agriculture, forestry & fishing;A financial services.
The biodiversity impacts of these sectors varies accordingto scale, location and the precise nature of operations. TheGHK overview, and more detailed government and NGOreviews, have characterised these impacts. Some of thesereviews are summarised in the following section. Thesereviews, combined with tracking FDI into individualcountries and business sectors, provide the basis foranalysing the potential scope for UK business to impactupon overseas ecosystems and their biodiversity.
12 www.ukglobalinfluence.org/UKFDI13 Habitat change, over exploitation, invasive species, pollution, climate change
© Mauricio Lima/Getty Images
Understanding the potential influence that UK investment, and UK companies, can have
on global biodiversity requires identification of key global business sectors attracting this
investment. Different business sectors have different potential impacts on the ecosystems
in which they operate.

The biodiversity footprint of UK Foreign Direct Investment 17
Table 2: Analysis of Direct vs Indirect Impacts of individual business sectors
Habitat Change Over Exploitation Invasive Species Pollution Climate Change
Agriculture 1 Direct Direct Direct Direct Direct
Forestry 1 Direct Direct Direct Direct Direct
Fishing 1 Direct Direct Direct Direct Direct
Mining & quarrying 2 Direct/Indirect Direct/Indirect Direct/Indirect Direct/Indirect Direct/Indirect
(including oil/gas)
Food products 2 Indirect Indirect Indirect Direct/Indirect Direct/Indirect
Transport & communications Direct/Indirect Indirect Direct/Indirect Direct/Indirect Direct/Indirect
Electricity, gas & water 2 Direct/Indirect Direct/Indirect Indirect Direct/Indirect Direct/Indirect
Textile & wood, printing 3 Indirect Indirect Indirect Direct/Indirect Direct/Indirect
& publishing
Chemical, plastic & fuel products 3 Indirect Indirect Indirect Direct/Indirect Direct/Indirect
Metal & mechanical products 3 Indirect Indirect Indirect Direct/Indirect Direct/Indirect
Office, IT & communications 3 Indirect Indirect Indirect Direct/Indirect Direct/Indirect
equipment
Transport equipment 3 Indirect Indirect Indirect Direct/Indirect Direct/Indirect
Construction 2 Direct/Indirect Indirect Direct/Indirect Direct/Indirect Direct/Indirect
Other manufacturing 3 Indirect Indirect Indirect Direct/Indirect Direct/Indirect
Hotels & restaurants 3 Indirect Indirect Indirect Direct/Indirect Direct/Indirect
Retail/ wholesale trade & repairs 3 Indirect Indirect Indirect Direct/Indirect Direct/Indirect
Financial services 3 Indirect Indirect Indirect Direct/Indirect Direct/Indirect
Real estate & business services 3 Indirect Indirect Indirect Direct/Indirect Direct/Indirect
Other services 3 Indirect Indirect Indirect Direct/Indirect Direct/Indirect
Key 1 Sectors with most direct impacts on biodiversity
2 Sectors with direct and indirect impacts on biodiversity
3 Sectors with more cryptic impacts on biodiversity
Analysis of the impacts of individual business sectors has been undertaken for JNCC using a matrix to assess the impacts of the different sectors on
biodiversity using the five Millennium Ecosystem Assessment drivers – Habitat change, Over Exploitation, Invasive Species, Pollution and Climate Change.
The sectors have been categorised into three groups, those with:
A clear, direct impacts on biodiversity – including the agriculture, forestry and fishing sectors.These sectors are direct users of ecosystems resources;
A a mix of direct and indirect impacts on biodiversity - including mining, quarrying, food processing, electricity, gas and water, construction, and transport
and communications.These sectors affect biodiversity through their direct use of land as well as more indirect impacts through raw material use,
infrastructure development and pollution;
A indeterminate impacts – including the remaining manufacturing and service sectors.These sectors have more indirect impacts, which may nevertheless
be significant in certain circumstances and locations.This is particularly true of the financial services sector which can fund direct impact activities.

18 The biodiversity footprint of UK Foreign Direct Investment
Table 3: Analysis of Impact Strength (on biodiversity) of individual business sectors
Habitat Change Over Exploitation Invasive Species Pollution Climate Change
Agriculture 1 High High High High High
Forestry 1 High High High Medium High
Fishing 1 Medium High Medium Low Low
Mining & quarrying 2 High Medium Low High High
(including oil/gas )
Food products 2 High High Medium Medium Medium
Electricity, gas & water 2 High Medium Low High High
Construction 2 High Low Low High High
Transport & communications 2 High Low Medium High High
Textile & wood, printing 3 Medium Medium Medium Medium Medium
& publishing
Chemical, plastic & fuel products 3 Medium Low Low High High
Metal & mechanical products 3 Medium Low Low High High
Office, IT & communications 3 Medium Low Low Medium Medium
equipment
Transport equipment 3 Medium Low Low Medium Medium
Other manufacturing 3 Medium Low Low Medium Medium
Retail/ wholesale trade & repairs 3 Low Low Low Low Low
Hotels & restaurants 3 Medium Medium Medium Low Low
Financial services 3 Medium Medium Medium Medium Medium
Real estate & business services 3 Low Low Low Low Low
Other services 3 Low Low Low Low Low
Key 1 Sectors with most direct impacts on biodiversity
2 Sectors with direct and indirect impacts on biodiversity
3 Sectors with more cryptic impacts on biodiversity
Analysis of the impacts of individual business sectors has been undertaken for JNCC using a matrix to assess the impacts of the different sectors on
biodiversity using the five Millennium Ecosystem Assessment drivers – Habitat change, Over Exploitation, Invasive Species, Pollution and Climate Change.
For each sector and MEA driver ; the scale of the impact has been assessed – High, Medium, Low.This approach allows the strategic nature and significance
of the biodiversity impact of individual business sectors to be assessed. For details of this evaluation see the GHK report on:
www.ukglobalinfluence.org/UKFDI.

The biodiversity footprint of UK Foreign Direct Investment 19
7.2 Key business sector impacts
OverviewThe Department for International Development has,through externally contracted work, undertaken a reviewof the potential global biodiversity impact of selectedeconomic sectors. This review involved both a screeningexercise to identify the most important sectors forbiodiversity impacts and identification of spatial andgeographical factors to assess the impacts of each selectedsector. Sectors shortisted by Dfid were energy, food supply,forestry, mining, tourism and transport14.
The potential significance of the six shortlisted sectors forbiodiversity were assessed by documenting their potentialimpacts through the five direct drivers of biodiversity loss(see footnote 13) as well as what are described as‘leverage’ opportunities for the UK Government. These areareas of British influence or investment where UKGovernment actions to promote the protection ofbiodiversity might have greater traction such as theCommonwealth or those countries that are the recipientsof significant UK development assistance or investment.
Finally, a range of spatial and geographical factors wereexamined to identify areas of global biodiversity valueglobally where impacts might be disproportionatelysignificant such as the WWF’s Global 200 Ecoregions.
This UK Government work, in combination with otherreviews, provides a framework for assessing the potentialbiodiversity impacts of the most important business sectorsattracting UK Foreign Direct Investment.
Extractive industriesThe Extractive industries sub-sector (within the PrimaryResources sector) as used by the ONS in FDI datacollation includes:
i coal/peat mining;ii oil/gas extraction and related services;iii mining of uranium/thorium ores;iv mining of metal ores;v other mining and quarrying.
This sub-sector contains a wide range of activities withpotential biodiversity impacts which vary greatly as a resultof their geographical locations, types of activity, andprocessing methods. Habitat loss and pollution impacts areprobably the most significant but the full range of impacts isreviewed in the relevant Dfid sponsored reports15. Thesereports stress that impact assessment is normally focussedon extraction and the early stages of processing and theseare the impacts that are likely to occur on or in closeproximity to the mining/oil development concession sites,many of which are located in environmentally sensitiveareas. For example, one third of all active mines andexploration sites are located within areas of intactecosystems of high conservation value.
Food products and agriculture, forestry & fishingThe food products and agriculture/forestry/fishing sub-sectors are two separate categories used by the ONS inFDI data collation. The former, as part of the ManufacturingIndustries sector includes food/tea/coffee/ beverageproduction and is a significant attractor of UK FDI growingsteadily over recent years (Fig 12). The agriculture, forestry& fishing sub-sector (within the Primary Resources sector)includes agriculture and fishing and forestry/logging. Giventhe links between food production and manufacture, andthe overall biological natural resource theme of thesebusiness areas, these two sub-sectors are linked togetherfor this analysis. The agriculture, forestry and fishing sub-sector attracts relatively low levels of direct investment butthese activities are highly significant from an ecosystemimpact perspective.
The Covalence16 Food & Beverage Industry Report for2007 shows a significant growth of interest in theenvironmental impact of food production (see Figure 19)and a series of Defra and Dfid commissioned reports areavailable reviewing impacts arising from this sector and alsofrom forestry. These impacts are as diverse as the widerange of activities grouped under this heading but primarilyinvolve land use change, over-exploitation and water use.
Financial servicesThe Financial Services sub-sector, within the ServiceIndustries sector, includes:
i financial intermediation services/banks/buildingsocieties/investment trusts/venture capital companies;
ii insurance services/life/non-life/pensions;iii other financial intermediation services.
13 Habitat change, overexploitation, invasive species, pollution, climate change14 www.ukglobalinfluence.org/index15 www.ukglobalinfluence.org/index Follow ‘Economics’ link16 www.covalence.ch17 www.ukglobalinfluence.org/index Follow ‘Economics’ link

The recognition of the Financial Services sector’s substantialindirect impacts on the environment led to promotion andadoption of the Equator Principles in 2003 designed to bringsocial and environmental concerns ‘into the heart of projectfinance’18. These voluntary Principles commit signatory banksto follow the environmental and social guidelines of theInternational Finance Corporation (IFC) of the World BankGroup. The Principles have become the standard for allbanks and investors on how to deal with potential social andenvironmental effects of projects to be financed.
The sector has a significant impact on biodiversity inparticular those institutions that provide financial supportto high-impact sectors such as forestry, mining, oil and gas,fisheries, water delivery and infrastructure, and agriculture.To fully comply with the Equator Principles banks should
adopt policies that take into account the protection ofbiodiversity (including ecosystems, species and geneticresources) as reflected in international conventions andnational laws. Banks should establish biodiversity policiesaimed at achieving the consensus goals of the CBD andother international instruments which embody threeprinciples:
A the conservation and protection of biodiversity;A the sustainable management and use of biodiversity;
and,A the fair and equitable sharing of benefits from
biodiversity.
Table 4 lists what such policies should involve based on aWWF/BankTrak report on sustainable finance19.
20 The biodiversity footprint of UK Foreign Direct Investment
18 The state of the art. Special Report: November 2006 www.ethicalcorp.com and www.equator-principles.com/principles.shtm19 Shaping the future of sustainable finance. Moving from paper promises to performance.WWF/BankTrak.
Table 4: WWF/BankTrak biodiversity guidelines for the finance sector
A Evaluate cumulative biodiversity impacts upstream and downstream (including impacts on ecosystems, species and genetic resources).
A Investments and financial services provided by the bank should not negatively impact upon any of the protected areas covered by the IUCN I-IV
categories or sites listed under UNESCO World Heritage and the Ramsar Conventions.
A Industrial extractive projects such as mining, oil, gas and forestry should not be financed within World Heritage Sites and IUCN I-IV protected
areas, nor where they negatively impact upon those sites and areas.
A Projects should be excluded if they: (i) could have an impact at a community or population level on a species identified on the IUCN Red List;
(ii) could lead to the commercial trade of any species listed as endangered under CITES; or (iii) are likely to involve the intentional or
unintentional introduction of invasive alien species.
A Natural resources such as fish, forests, animals and plants should be used and managed sustainably.
A Support for the production or trade in any living modified organism should be prohibited except with the approval of the importing country and
as otherwise required under the Cartagena Protocol.
A Any activity involving access to genetic resources must meet the consent and benefit-sharing requirements found in the CBD.
A The project should not lead any member country to violate any international treaty relating to biological diversity.
A Management systems should ensure the collection of baseline data and provide for the ongoing monitoring and reporting of impacts at least
consistent with the guidelines found in the Global Reporting Initiative for reporting on biodiversity and land use.

8
The biodiversity footprint of UK Foreign Direct Investment 21
UK flagship company identification – looking for best practice
8.1 Overview
Overseas investment activities by UK based corporationscan have significant influence on the ecosystems andbiodiversity of the host country either through their impacton these systems (the extractive industries, forestry, foodproduction) or through their dependence on ecosystemservices (fisheries, forestry). Corporate ability to avoid,mitigate or compensate for the consequences of theiractivities depends upon attitudes to corporate socialresponsibility and the financial and technical resources andcapabilities available to the organisation. These resourcesand capabilities are often business and sector specific. Bycontrast, many developing world FDI host countries havelimited capabilities at corporate and government level forassessing and dealing with environmental impacts (due toresource, managerial and other expertise limitations)preventing adequate environmental impact assessments atstrategic and project levels. This has implications forenvironmental governance in general, and biodiversity inparticular, in FDI host countries.
In addition to the flow of funds into a host country,knowledge and expertise are therefore importantadvantages which can be transferred to host-countryoperations by Trans National Corporations (TNCs).
Key points in respect of such transfer are:
A this transfer may occur within the same or differentbusiness sectors;
A use of international best environmental practice by hostcountry affiliates of TNCs can, through ‘spillover’ or‘demonstration effects’ lead to adoption of similarpractices by other foreign and domestic businessesoperating in the host country;
A host country regulatory authorities can be exposed tointernational best practice;
A a TNC may only have a limited financial role in aparticular business sector in a given host country butcan still be well placed to demonstrate best practiceand act as a sector leader – flagship company - inrespect of sustainability and environmental practices.
Analysing flows of UK finance into overseas economies interms of host country and business sector can therefore becomplimented by recognising those corporations that areactive within particular sectors. Potential flagship companiesfor demonstrating best practice can then be identified tohighlight the positive role UK companies can take at theglobal level.
8.2 Tools for identifying flagshipcorporations
The annual UNCTAD report 20 on FDI identifies majorTrans National Corporations involved in global investmentand such general listings can be used in conjunction withmore specific, environmentally focussed assessments, toseek out flagship companies. The increasing significance ofCorporate - Social Reporting (CSR) for maintainingbusiness reputations and protecting shareholder value hasresulted in a variety of screening tools being developed tomonitor business sector and individual corporateperformance. Such performance can be judged on a widerange of social and environmental criteria. Judgements andrankings may be derived through external monitoring ofcorporate activities based on such criteria or may involveindividual corporations actively seeking to comply withcriteria established by monitoring bodies.
A good example of an external monitoring programme isthe ethical quotation system operated by Switzerlandbased Covalence 21. This is a ‘reputation index’ based onquantifying data classified according to 45 criteria such aslabour standards, waste management, human rights policyand ‘Environmental Impact of Production’ (Covalence‘Criteria 26’). The system integrates information from themedia, NGO reports and corporate publications and canbe used to measure the evolution of the reputation ofindividual corporations through time and also to highlightwhich issues are important within selected business sectors.Within the banking 22 and food production sectors 23
Covalence recognises a significant recent growth in interestin respect of the environmental impacts of production (seeFig 19 for food production sector).
20 WORLD INVESTMENT REPORT 2008 UNITED NATIONS New York and Geneva, 2008-11-12.21 www.covalence.ch/22 Covalence Banking Industry Report 2008. Press release 3 July 2008.23 Covalence Food & Beverage Industry Report 2007. Press release 11 February 2008

22 The biodiversity footprint of UK Foreign Direct Investment
Table 5: Covalence top ten corporations in the Food & Beverage sector for 2007.
Food and Beverage
Rank Best Ethical Quote Score Best Ethical Quote Best Reported Performance
1 Unilever Coca-Cola Co Coca-Cola Co
2 Starbucks Unilever Starbucks
3 Diageo Starbucks Nestlé
4 Danone Nestlé Unilever
5 SABMiller PepsiCo PepsiCo
6 Kellogg Kellogg Kellogg
7 Heinekin SABMiller Danone
8 Kraft Foods Danone Kraft Foods
9 Cadbury Kraft Foods Cadbury
10 Heinz Heinz SABMiller
Figure 19.The environmental impact of the Food & Beverage industry has become a major sector issue in 2007.See section 8 for background information. Source: Covalence
26 - Environmental Impact of Production
25%13 - Social Impact 32 - Waste Management
20%
15%
27 - Product Human Risk 10% 41 - United Nations Policy
5%
0%
17 - Women Employed 11 - Joint Ventures
3 - Social Benefits 34 - Information to Consumers
28 - Product Social Utility
In recent years there has been a steady growth in UK FDI into the food production sector.
With the FAO projecting a 50% growth in food demand by 2030, and rising commodity prices,
this sector is becoming increasingly important. The Covalence analysis presented in the
above illustrations demonstrates how environmental issues are now critical to this sector.
This analysis also demonstrates how many ‘household’ name companies are well placed to
recognise and promote the value of the ecosystems goods and services that they rely upon.

The biodiversity footprint of UK Foreign Direct Investment 23
The FTSE4Good Index (Table 6) Series 24 has beendesigned to measure the performance of companies thatmeet globally recognised corporate responsibility standards.The series has several functions including use as a researchtool to identify environmentally and socially responsiblecompanies. Key features of the series are:
A evolving selection criteria to reflect changes in globallyaccepted corporate responsibility standards and codesof conduct over time;
A challenging yet achievable criteria that encouragecompanies to strive to meet them;
A higher impact companies have to meet higherstandards;
A transparent criteria and methodology;A criteria based on internationally respected codes and
principles with new criteria subjected to a widespreadconsultation and approved by an independent oversightcommittee.
Unlike the Covalence screening system, companies canchoose to be listed on the FTSE4Good Index and thenhave to meet the criteria or be delisted. Companies areclassified as High, Medium or Low Impact based on theenvironmental footprint of their activities. The higher theenvironmental impact of the company’s operations, themore stringent the inclusion criteria. The FDI investmentsectors identified as significant for biodiversity in this report- financial services, food products and agriculture, forestry & fishing, extractive industries - all fall into the high ormedium categories for the FTSE4Good Index.
These, and other emerging corporate screeningapproaches, offer an opportunity for UK Government andbusiness to identify and support UK companies thatdemonstrate the best environmental practice currentlyavailable. These companies have the potential to be theUK’s biodiversity champions overseas.
Table 6: FTSE4Good Index high and medium environmental impact sectors.
24 www.ftse.com/Indices/FTSE4Good_Index_Series
High Impact Sectors Medium Impact Sectors
Agriculture DIY & Building Supplies
Air Transport Electronic and Electrical equipment
Airports Energy and Fuel Distribution
Building Materials (includes Quarrying) Engineering and Machinery
Chemicals and Pharmaceuticals Financials not elsewhere classified
Construction Hotels, Catering and Facilities Management
Major Systems Engineering Manufacturers not elsewhere classified
Fast Food Chains Ports
Food, Beverages and Tobacco Printing and Newspaper Publishing
Forestry and Paper Property Developers
Mining and Metals Retailers not elsewhere classified
Oil and Gas Vehicle Hire
Power Generation Public Transport
Road Distribution and Shipping
Supermarkets
Vehicle Manufacture
Waste
Water
Pest Control

The Joint Nature Conservation Committee (JNCC) is the statutory adviser to Government on UK and internationalnature conservation. Its work contributes to maintaining and enriching biological diversity, conserving geological featuresand sustaining natural systems.
JNCC delivers the UK and international responsibilities of the Council for Nature Conservation and the Countryside(CNCC), the Countryside Council for Wales (CCW), Natural England, and Scottish Natural Heritage (SNH). Thefunctions that arise from these responsibilities are principally to:
A advise Government on the development and implementation of policies for, or affecting, nature conservation in the UKand internationally;
A provide advice and disseminate knowledge on nature conservation issues affecting the UK and internationally;
A establish common standards throughout the UK for nature conservation, including monitoring, research, and the analysisof results;
A commission or support research which it deems relevant to these functions.
The Committee comprises 14 members: a Chairman and five independent members appointed by the Secretary of State;the Chairman of CNCC; the Chairmen or deputy Chairmen of CCW, Natural England and SNH; and one other memberfrom each of these bodies.
JNCC, originally established under the Environmental Protection Act 1990, was reconstituted by the Natural Environmentand Rural Communities Act 2006. Support is provided to the JNCC by a company limited by guarantee (JNCC SupportCo) that the Committee established in 2005.
Details of publications produced by JNCC are available from:Communications Team, JNCC, Monkstone House, City Road, Peterborough PE1 1JY, UK.Telephone: +44 (0)1733 562626Fax: +44 (0)1733 555948Email: [email protected]
JNCC also provides extensive information through its website: www.jncc.gov.uk
Printed on Evolution Satin, 75% recycled post-consumer waste paper, Elemental Chlorine Free.Designed and printed by statusdesign.co.uk, 2M
ISBN-13: 978 1 86107 610 6© JNCC 2009JNCC SUPPORT CO. Registered in England and Wales, company no. 05380206
Related Documents