This article appeared in a journal published by Elsevier. The attached copy is furnished to the author for internal non-commercial research and education use, including for instruction at the authors institution and sharing with colleagues. Other uses, including reproduction and distribution, or selling or licensing copies, or posting to personal, institutional or third party websites are prohibited. In most cases authors are permitted to post their version of the article (e.g. in Word or Tex form) to their personal website or institutional repository. Authors requiring further information regarding Elsevier’s archiving and manuscript policies are encouraged to visit: http://www.elsevier.com/copyright

Welcome message from author
This document is posted to help you gain knowledge. Please leave a comment to let me know what you think about it! Share it to your friends and learn new things together.
Transcript

This article appeared in a journal published by Elsevier. The attachedcopy is furnished to the author for internal non-commercial researchand education use, including for instruction at the authors institution
and sharing with colleagues.
Other uses, including reproduction and distribution, or selling orlicensing copies, or posting to personal, institutional or third party
websites are prohibited.
In most cases authors are permitted to post their version of thearticle (e.g. in Word or Tex form) to their personal website orinstitutional repository. Authors requiring further information
regarding Elsevier’s archiving and manuscript policies areencouraged to visit:
http://www.elsevier.com/copyright

Author's personal copy
The bigger they are, the harder they fall: Linking team power, team conflict, andperformance
Lindred L. Greer a,⇑, Heather M. Caruso b, Karen A. Jehn c
a Work and Organizational Psychology, University of Amsterdam, The Netherlandsb Booth School of Business, University of Chicago, USAc Melbourne Business School, University of Melbourne, Australia
a r t i c l e i n f o
Article history:Received 25 March 2008Accepted 29 March 2011Available online 19 May 2011Accepted by Linn Van Dyne
Keywords:PowerIntragroup conflictTeams
a b s t r a c t
Across two field studies, we investigate the impact of team power on team conflict and performance.Team power is based on the control of resources that enables a team to influence others in the company.We find across both studies that low-power teams outperform high-power teams. In both studies, higherlevels of process conflict present in high-power teams explain this effect fully. In our second study, weshow that team interpersonal power congruence (i.e., the degree to which team members’ self-viewsof their individual power within the team align with the perceptions of their other team members) ame-liorates the relationship between team power and process conflict, such that when team interpersonalpower congruence is high, high-power teams are less likely to experience performance-detracting pro-cess conflict.
� 2011 Elsevier Inc. All rights reserved.
Introduction
Given the rise of work teams in recent decades (Cohen & Bailey,1997), enhancing team effectiveness has become a significant con-cern of modern organizations. Although an abundance of literatureexists on the hallmarks of effective teams (for a review, seeKozlowski & Ilgen, 2006), research has yet to systematically assesswhether teams at different levels in the organization—that is,teams with different levels of power—are equally effective. Thisis surprising given the pervasiveness of power in social interaction(Fiske, 1993; Magee & Galinsky, 2008) and the large impact powercan have on individual behavior (e.g., Keltner, Gruenfeld, &Anderson, 2003). Understanding the impact of team-held poweron intra-team interactions and performance may be critical tounderstanding how to create effective organizational teams (cf.Mannix & Sauer, 2006).
In this paper, we hope to help break new ground in understand-ing how team-held power affects the internal dynamics and per-formance of organizational teams. In particular, we are interestedin comparing teams with high and low levels of team power withinan organization. Team power is defined as the collective capacity ofa team to modify others’ states by administering (i.e., providing orwithholding) actual resources or punishments to others (French &
Raven, 1959; Keltner et al., 2003). Our definition of team powerthus aligns closely with past definitions of power held by individ-uals (with the sole difference being our focus on the collectivecapacity of a team to influence others), and we believe the main ef-fect of team power on the individual team members will be similarto that of individually held power on an individual. Indeed, re-search has shown that manipulating power by telling participantsthey belong to a high-power team leads to individual behaviorsthat are similar to those that result from manipulations of powerat the individual level (e.g., Guinote, Brown, & Fiske, 2006). How-ever, studies have not yet conclusively established this parallel,and additional uncertainty exists regarding what is likely to hap-pen when multiple high-power individuals interact in a high-power team setting (cf. Mannix & Sauer, 2006). Therefore, a centralfocus of our paper is on what team power does to team interaction.
Although team power can be rooted in various sources (e.g.,expertise, information, structural), we focus primarily on teampower as stemming from the team’s position in the formal organi-zational hierarchy (Astley & Sachdeva, 1984; Ragins & Sundstrom,1989). Research has suggested formal hierarchical level forms animportant basis of team power within the organization (e.g., Astley& Sachdeva, 1984; Fombrun, 1983; French & Raven, 1959; Mintz-berg, 1983). Teams with a high level of formal power in an organi-zation include, for example, management teams or advisory teamsthat are in a position to control the outcomes of others in the orga-nization; low-power teams include teams of entry-level employeeswho have less control over the outcomes of others in theorganization.
0749-5978/$ - see front matter � 2011 Elsevier Inc. All rights reserved.doi:10.1016/j.obhdp.2011.03.005
⇑ Corresponding author. Address: University of Amsterdam, Work and Organiza-tional Psychology, Roetersstraat 15, Amsterdam 1018 WB, The Netherlands. Fax:+31 (0)20 639 0531.
E-mail address: [email protected] (L.L. Greer).
Organizational Behavior and Human Decision Processes 116 (2011) 116–128
Contents lists available at ScienceDirect
Organizational Behavior and Human Decision Processes
journal homepage: www.elsevier .com/ locate /obhdp

Author's personal copy
Note that although a position of power may afford teams a cer-tain level of status, or respect and prominence, in the organization(e.g., Anderson & Berdahl, 2002; Guinote, Judd, & Brauer, 2002;Guinote et al., 2002; Ridgeway, 1991, 1997; Sidanius & Pratto,1999), power and status are conceptually distinct constructs(Anderson, Srivastava, Beer, Spataro, & Chatman, 2006; Keltneret al., 2003; Magee & Galinsky, 2008). For example, a managementteam that gives itself large bonuses at the same time it asks the restof the company to cut costs might have formal control over thecompany (high power) but is not likely to have the respect of itsemployees (low status). In this paper, our focus will be on the ef-fects of team power (based on the resources a team controls viaits position in the organizational hierarchy), although we acknowl-edge that much of our theorizing would likely be applicable for‘‘team status’’ as well.
We develop and test the general hypothesis that teams withhigh levels of formal power in an organization perform less wellthan teams with low levels of formal power within an organiza-tion, because of higher levels of conflict within high-power teams.We tested this hypothesis in two field studies of existing organiza-tional teams. In our first study, we find that teams with high, ratherthan low, formal power have substantially more intragroup conflictand lower team performance. Our second study replicated thisfinding utilizing a controlled information-sharing task with anobjective team performance outcome. The use of this task allowedus to control for potential variation in task type and performanceexpectations between low- and high-power organizational teams,as well as to better assess the causal linkages in our theoreticalmodel. We also introduced power congruence as a moderator ofthe relationship between team power and intragroup conflict.Our findings suggest that when members of high-power teamsagree with their teammates on the amount of individual powerthey themselves hold within the team, those teams experience lessintragroup conflict. This integration of team and individual poweroffers managers and researchers alike an important potential path-way by which high-power team performance can be improved.
Linking team power to intragroup conflict and teamperformance
At first blush, one may expect teams with a high level of formalpower in an organization to function better than low-power teams.High-power team members may have better education, more func-tional experience, and more highly developed political skills (Laz-ear & Rosen, 1981). Yet despite these positive qualities, wesuspect that, all else kept constant, high-power teams may actuallyperform worse than low-power teams due to dysfunctional intra-group processes such as conflict (cf. De Dreu & Weingart, 2003).
Intragroup conflict is defined as the process arising from per-ceived incompatibilities or differences between team members(e.g., De Dreu & Weingart, 2003; Thomas, 1992; Wall & Callister,1995). Research has suggested three types of conflict exist inteams: task conflict (regarding task goals or outcomes), processconflict (regarding the logistics of task accomplishment), and rela-tionship conflict (regarding personal clashes over topics such asvalues or personality) (Jehn, 1997; Jehn & Bendersky, 2003).
We propose that high-power teams will have higher levels of allthree types of intragroup conflict than low-power teams, driven bycompetition between members of high-power teams for positionsof power within their team (e.g., Bendersky & Hayes, in press;Chattopadhyay, Finn, & Ashkanasy, 2010; Greer & Van Kleef,2010). We suggest that this competition for power within high-power teams stems from the addictive nature of power (Mulder,1977). Possessing power can drive individuals to seek ever greaterlevels of power and control (Bruins & Wilke, 1992; Mulder, 1977),implying that membership in a high-power team can lead individ-
ual members to value and pursue power. In high-power teams,however, individual pushes for greater power may encounter fre-quent hindrances in the form of similarly power-hungry team-mates, who can potentially challenge one’s pursuit of power. Insupport of this idea of tense power dynamics in high-power teams,research has shown that high-power teams, such as top manage-ment teams (TMTs), are especially sensitive to inequities in the dis-tribution of within-group pay, power, and prestige (Eisenhardt &Bourgeois, 1988; Greer & van Kleef, 2010; Siegel & Hambrick,2005). These heightened anxieties about power may also predis-pose high-power teammates to lash out against each other(Baumeister, Smart, & Boden, 1996; Martorana, Galinsky, & Rao,2005). Indeed, research shows that when high-power people feelthreatened, as in the case of high-power groups in which high-power members interact with one another, they become defensive,dominant, aggressive, and rude (e.g., Chattopadhyay et al., 2010;Georgeson & Harris, 2006; Morrison, Fast, & Ybarra, 2009; Smith-Lovin & Brody, 1989). Furthermore, research has shown that thosein power are less likely to behave politely toward others (e.g.,Keltner, Young, Heerey, Oemig, & Monarch, 1998; Smith, Jost, &Vijay, 2008), attend to others’ perspectives (e.g., Galinsky, Gruen-feld, & Magee, 2003), feel compassion for others (e.g., Van Kleefet al., 2008), and are more likely to engage in aggressive, conflictualbehaviors (e.g., Anderson & Berdahl, 2002; Keltner et al., 1998;Smith et al., 2008). These negative tendencies are all likely to beamplified when high-power teammates threaten and interrupteach others’ quest for power. Thus struggles for individual powerare likely to produce high levels of intragroup conflict (task, pro-cess, and relationship) in high- more than in low-power teams.We propose the following:
Hypothesis 1. High-power teams will have higher levels of conflict(task, process, relationship) than low-power teams.
In line with recent literature reviews (De Dreu, 2007) and ameta-analysis (De Dreu & Weingart, 2003), we further suggest thatall three types of intragroup conflict (task, process, and relation-ship) will be negatively related to team performance. The theoret-ical mechanisms explaining this reasoning center around thecognitions and emotions that conflicts may provoke in team mem-bers. First, conflicts can distract members from task accomplish-ment, decreasing team productivity and task efficiency (Evan,1965). In addition, research suggests that conflicts of all types areoften linked to negative affect (cf. Jehn & Bendersky, 2003). Theperceived incompatibilities that give rise to conflict can lead to avariety of negative emotions (cf. Bell & Song, 2005; Lazarus,1991; Roseman, Antoniou, & Jose, 1996) such as frustration, resent-ment, and anger (e.g., Guetzkow & Gyr, 1954; Russell, 1978;Stearns, 1972). These negative emotions can impair the cognitivefunctioning of team members (Brief & Weiss, 2002). Therefore,based on these theoretical mechanisms (decreased task focus, neg-ative emotionality, and decreased cognitive capacity), we proposethat conflict and team performance will be negatively related:
Hypothesis 2. Conflict (task, process, relationship) will have anegative relationship to team performance.
Furthermore, we believe the performance disadvantage high-power teams experience relative to low-power teams will be pri-marily attributable to the higher levels of conflict in high-powerteams. Therefore, we propose the following:
Hypothesis 3. Conflict will mediate the relationship between teampower and team performance, such that high-power teams willhave higher levels of conflict than low-power teams, and conflictwill have a negative relationship to team performance.
L.L. Greer et al. / Organizational Behavior and Human Decision Processes 116 (2011) 116–128 117

Author's personal copy
Study 1 methods
We tested the hypotheses in a multi-source field study of pre-existing workgroups within the sales unit of a telecommunicationscompany located in the Netherlands. The sample included 22teams (94 employees). The average team size was 4.27(SD = 1.78), with team size ranging from 3 to 9 members. The aver-age age was 41.9 years old (SD = 4.6), and 24% of the participantswere female. The average team had worked together for 3.0 years(SD = 1.8).
Measures
Team members completed questionnaires while seated to-gether in a conference room on the day of the study, with at leastone empty seat between each member. Team leaders were notpresent and filled in the survey separately. Experimenters assuredanonymity to all participants. In return for their participation, teammembers and leaders received reports on how their team func-tioned compared with other teams in the organization. On the sur-vey, all items utilized a 7-point Likert scale, with 1 indicating lowagreement and 7 indicating high agreement.
Team powerWe assessed team power based on the organizational level of
the teams within the business unit. We obtained this informationfrom company records provided to us. In line with our definitionof team power, we classified teams that had control over otherteams or over important decisions that would impact the rest ofthe company as high-power teams. Seven teams were classifiedas high power and 15 as low power. Examples of high-power teamsincluded the management teams of several departments withinthe business unit, as well as an internal steering committee. Inaddition, as a measure check, we also asked team memberswhether their team occupied a high-power position within thecompany (specifically, members responded to the question ‘‘Howmuch influence does your team have in your company?’’). Thismeasure was successful, as high-power team members reportedtheir teams as having significantly more influence within the com-pany than members of low-power teams reported their teams ashaving (t(21) = 1.82, p < .05).
ConflictWe measured intragroup conflict by asking team members to
respond to Jehn’s (1995) 8-item scale measuring task and relation-ship conflict, and Jehn and Mannix’s (2001) 3-item scale measuringprocess conflict. Each scale exhibited sufficient internal reliability(task conflict a = .90; relationship conflict a = .76; process conflicta = .91). A confirmatory factor analysis revealed that a 3-factorstructure best fit the data (v2(94) = 336.33, p < .001, CFI = .96,NNFI = .95, RMSEA = .10).
Team performanceTo assess team performance, we had each team leader rate his
or her team’s performance on the basis of three items (‘‘I believethis group performs well at work,’’ ‘‘This group is effective in get-ting things done in time,’’ and ‘‘I think in general this group is effec-tive with respect to work’’). This scale had sufficient internalreliability (a = .93). For four of our teams, we were unfortunatelyunable to obtain leader ratings. As an additional measure, we alsohad all team members rate their own performance based on thesame items. This scale also had sufficient internal reliability(a = .87).
ControlsWe initially controlled for team size, team tenure, task interde-
pendence (four items, e.g., ‘‘I have to work closely with my col-leagues to do our work properly’’), organizational tenure, anddiversity in gender, nationality, and work function. However, thesevariables did not significantly affect the relationships in our modelnor did they significantly vary between high- and low-powerteams, so we removed them from ensuing analyses.
Treatment of multi-level nature of datasetBecause our dataset involves individuals within teams, two po-
tential levels of analyses exist—the team and individual levels.However, as we theorized all of our variables to be team-level vari-ables (and, methodologically, we worded the items to reflect thegroup level of analysis [i.e. ‘‘how much conflict of ideas is therein this team?’’]), we explored the appropriateness of aggregatingindividual responses to the team level. We examined the inter-rater agreement (rwg) and the inter-class correlation coefficients(ICCs) as well as their corresponding F-tests. For all three team con-flict types, as well as perceived team performance, F-tests indicatedsignificant between-group variance, and ICCs and rwgs exceededacceptable levels for aggregation (Klein & Kozlowski, 2000; LeBr-eton & Senter, 2008), indicating sufficient within-team agreement(task conflict: rwg = .76, ICC[1] = .31, ICC[2] = .66; relationship con-flict: rwg = .80, ICC[1] = .22, ICC[2] = .55; process conflict: rwg = .70,ICC[1] = .28, ICC[2] = .62; perceived team performance: rwg = .82,ICC[1] = .26, ICC[2] = .60). This evidence was sufficient to justifyaveraging individual responses to create team-level scores, whichwe then used in our hypothesis testing.
Study 1 results
Table 1 displays means, standard deviations, and correlations.Team power is positively related to process and relationship con-flict and negatively related to both measures of team perfor-mance.1 Table 2 shows the means and standard deviations foreach of the variables at low and high levels of team power.
In Hypothesis 1, we proposed that high-power teams wouldhave higher levels of conflict than low-power teams. In line withthis hypothesis, we found that high-power teams had significantlyhigher levels of relationship conflict (b = .57, t(20) = 3.11, p < .01)and process conflict (b = .54, t(20) = 2.89, p < .01). We did not finda significant effect on task conflict (b = �.27, t(20) = 1.24, n.s.). Forthe results of hierarchical regression analyses testing all our pro-posed relationships, please see Table 3.
In Hypothesis 2, we proposed that all three forms of conflictwould be negatively related to team performance. In line with thishypothesis, we found that all three forms of conflict were nega-tively related to team performance. Process conflict was negativelyrelated to both leader-rated performance (b = �.60, t(16) = �2.97,p < .01) and member-rated performance (b = �.72, t(20) = �4.68,p < .001). Relationship conflict was also negatively related to lea-der-rated performance (b = �.51, t(16) = �2.37, p < .05) and mem-ber-rated performance (b = �.58, t(20) = �3.14, p < .01). Task
1 When coding the organizational charts, we spoke with representatives from theorganization about the potential ways of rating team power, and they felt a very cleardifferentiation existed in their organization between teams that did and did not havepower. However, as power is often viewed as a continuous variable, we also includeda self-report measure of team power in our survey based on a continuous scale of 1–7.We ran supplemental analyses using this variable as a predictor variable, instead ofthe externally rated dichotomous variable. We compared linear and quadratic fit forthe relationship between team power and conflict and performance, and found alsothat when using this continuous measure, team power was linearly, positively relatedto conflict and linearly, negatively related to team performance, in line with theresults from our coder-rater classification of teams. We did not find the quadraticterms to reach significance.
118 L.L. Greer et al. / Organizational Behavior and Human Decision Processes 116 (2011) 116–128

Author's personal copy
conflict was marginally negatively related to leader-rated perfor-mance (b = �.41, t(16) = �1.79, p < .10) and significantly negativelyrelated to member-rated performance (b = �.66, t(20) = �3.94,p < .001).
Last, in Hypothesis 3, we proposed that conflict would mediatethe relationship between team power and team performance. Totest this hypothesis, we followed the four-step procedure Baronand Kenny (1986) suggest. First, we showed in our test of Hypoth-
Table 1Study 1 means, standard deviations, and correlations.a
Variable Mean SD 1 2 3 4 5
1. Team powerb – – –2. Task conflict 3.26 .82 .30 –3. Relationship conflict 2.00 .56 .65*** .65*** –4. Process conflict 3.01 .79 .56** .72*** .75*** –5. Team performance – leader Rating 5.25 .84 �.50** �.41+ �.51* �.60** –6. Team performance – team Rating 5.54 .71 �.46** �.66*** �.58** �.72*** .44+
+ p < .10.* p < .05.
** p < .01.*** p < .001.
a n = 22.b Dichotomous variable.
Table 2Study 1 mean comparisons.
Dependent variable F Low-power teams High-power teams
M SD M SD
Control variablesTeam size .41 4.53 1.81 3.40 1.52Team tenure .20 3.31 1.75 2.17 1.69Organizational tenure 2.21 10.91 5.61 11.37 8.15Task interdependence .01 5.52 .55 4.99 .58Gender diversity .01 .19 .21 .23 .22Nationality diversity 1.15 .21 .21 .14 .21Functional diversity .01 .58 .30 .77 .28
Hypothesized dependent variablesTask conflict 1.53 3.15 .20 3.65 .36Relationship conflict 9.67** 1.87 .44 2.57 .33Process conflict 8.32** 2.74 .63 3.78 .84Team performance (team-rated) 4.35* 5.76 .57 5.00 .89Team performance (leader-rated) 5.01* 5.50 .50 4.50 1.41
n = 22.* p < .05.
** p < .01.
Table 3Study 1 results of hierarchical regression analysis.
Intragrouptaskconflict
Intragrouprelationshipconflict
Intragroupprocessconflict
Leader-rated team performance Perceived team performance
Step 1Task conflict �.41 .05 �.66*** �.39Relationship
conflict�.51* �.23 �.58** �.17
Processconflict
�.60** �.40 �.72*** �.22
F 3.19+ 5.62* 8.80** 2.14 15.54** 9.86** 21.92*** 5.78**
R2/Adj. R2 .17/.11 .26/.21 .36/.32 .32/.17 .44/.41 .33/.30 .52/.50 .49/.41DR2 .11 .21 .32 .17 .41 .30 .50 .41
Step 2Team power .27 .57** .54** �.49* �.38 �.29 �.13 -.26 �.42* �.27 �.14 �.04 �.24F 1.53 9.67** 8.32** 5.01* 2.96+ 3.50 4.29⁄ 1.83 4.35* 9.60** 4.97* 10.47** 4.73**
R2/Adj. R2 .07/.03 .33/.29 .29/.26 .24/.19
.28/.19 .32/.23 .36/.28 .36/.16 .18/.14 .50/.45 .34/.27 .52/.47 .53/.42
DR2 .03 .29 .26 .19 .08 .02 .00 .00 .14 .04 .00 .00 .01
n = 22.+ p < .10.* p < .05.
** p < .01.*** p < .001.
L.L. Greer et al. / Organizational Behavior and Human Decision Processes 116 (2011) 116–128 119
Author's personal copy
esis 1 that the independent variable is related to the mediator—team power is positively significantly related to both relationshipand process conflict. Second, we showed in our test of Hypothesis2 that the mediator is related to the dependent variable—both rela-tionship and process conflict are negatively significantly related toboth leader-rated team performance and member-rated team per-formance. Third, we showed that the independent variable is di-rectly significantly related to the dependent variable—teampower is significantly negatively related to both leader-rated teamperformance (b = �.49, t(17) = �2.24, p < .05) and member-ratedteam performance (b = �.42, t(21) = �2.86, p < .05). Last, as re-quired for full mediation, we showed that the effect of the indepen-dent variable (team power) on the dependent variable (teamperformance, leader-rated and member-rated) becomes non-significant when we control for the mediator (conflict) (forleader-rated performance: b = �.26, t(17) = �.41, n.s. for member-rated performance: b = �.24, t(21) = �1.15, n.s.). Sobel tests con-firmed these analyses: process and relationship conflict mediatethe relationship between team power and leader-rated team per-formance (process conflict: z = �2.10, p < .05; relationship conflict:z = �1.99, p < .05) and member-rated team performance (processconflict: z = �2.50, p < .05; relationship conflict: z = �2.40,p < .05).2
Study 1 discussion
In this first study of the effects of team power, we find that teampower has a predominantly negative effect on teams. Teams withhigh levels of power had lower levels of team performance. The le-vel of process and relationship conflict in high-power teams fullyexplains this effect; that is, high-power teams had higher levelsof process and relationship conflict, and process and relationshipconflict were significantly negatively related to team performance.We did not find a significant effect of team power on task conflict,suggesting the effects of team power may be felt predominantly inthe interpersonal and process issues of teams. Issues of power arecentral to the allocation of resources at the heart of process con-flicts (Greer & Jehn, 2007) or the way in which members interper-sonally relate to one another, which is central to relationshipconflicts (Jehn, 1995).
Although this study provides an important first test of the no-tion that the power of a team may have an impact on its processesand performance, it has several limitations. First, the sample size issmall. Although tests for the inequality of variances were not vio-lated, we would still like to see replication of our findings in a lar-ger sample. Second, the teams in this organization performeddifferent tasks and had potentially different expectations for per-formance. Perhaps the tasks of the high-power teams were moredifficult, which is why they performed worse, or perhaps leaders
expected more from high-power teams than low-power teams.To remove extraneous factors, we would like to see an investiga-tion of the performance differences between low- and high-powerteams on a common task with an objective, task-based perfor-mance outcome. The cross-sectional nature of the data in thisstudy is also limiting insofar as it prevents us from drawing causalconclusions. Perhaps poor performance by high-compared to low-power teams leads to higher levels of conflict in high-power teams,rather than the other way around as we proposed. A controlledtask provides a distinct advantage in addressing this possibility,as we can show that conflict on a specific task can impede theeventual quality of task performance, strengthening our investiga-tion of our proposed causal path. Last, our findings paint a bleakpicture for organizations—namely, that the teams with power inan organization are often ineffective. Both theoretical and appliedvalue exists in investigating factors that can brighten this picture.By identifying conditions that may moderate the relationship be-tween team power and conflict and performance, researchersmay be able to provide organizations with ways to help theirhigh-power teams avoid the pitfalls of being in power.
Study 2: the moderating role of power congruence
In Study 2, we address the limitations of Study 1 as well asincorporate an important and theoretically relevant moderator ofthe relationship between team power and team conflict. We exam-ine the basic hypotheses proposed in Study 1 in a larger, more di-verse sample. We test the differences between high- and low-power teams during a controlled information-sharing task, whichsimulates a task common to the interactions of both low- andhigh-power teams.
Additionally, we suggest in this study that the relationship be-tween team power and intragroup conflict may be amelioratedwhen team members’ perceptions of the power they hold withinthe team are in alignment with others’ perceptions of their power,thereby integrating notions of team-held power and individuallyheld power within the team. When one investigates power in orga-nizations, perceptions of individual power are of critical impor-tance (Fast, Gruenfeld, Sivanathan, & Galinsky, 2009; cf. Fiol,O’Connor, & Aguinis, 2001; House, Rousseau, & Thomas-Hunt,1995). For example, a CFO may have considerable control over anorganization, but within the management team, her (presumablylesser) power relative to the CEO may dominate perceptions ofher ultimate behavior within the team and her capacity to influ-ence others. Theory on congruent team perceptions (the degreeto which team members see others in the team as they see them-selves; Polzer, Milton, & Swann, 2002) suggests congruency ofthese perceptions of power within the team are central to under-standing team interactions. Therefore, in this study, we look specif-ically at power congruence, or the degree to which members’perceptions of their individually held power within the team arein alignment with other members’ perceptions of their powerwithin the team. We integrate these two sides of team power(the team’s power in the organization and members’ perceptionsof individual power within the team) by looking at how power con-gruence might moderate the effects of team-level power in theorganization on intragroup conflict and team performance. We testHypotheses 1–3, as outlined in Study 1, and introduce a newhypothesis focusing on the moderating role of power congruence,which we will outline below. Fig. 1 illustrates the model proposedin this second study.
The moderating role of power congruence
In explaining the moderating role of power congruence, wedraw on research that has suggested that although hierarchies
2 We selected our measure of congruence to ensure we tapped into a specific kindof social perception within the team—self-other agreement and specifically thecorrespondence between targets’ self-views and perceivers’ appraisals. In line withpast research on social perception (Cronbach, 1955; Funder & West, 1993), we notethat power congruence is distinct from other measures of perceptual correspon-dence. For example, it is distinct from the more general construct of consensus(general agreement among perceivers in appraisals of a target), because high levels ofsuch consensus could still reflect low levels of power congruence if the consensusview differed greatly from the target’s self-view. Because of our focus on correspon-dence with self-view, our priority in measuring power congruence is to compareactual self-views and actual peer appraisals, rather than to examine, for example, thevariance created by unique targets, perceivers, or relationships in average perceptions(which is the focus of models such as SRM). Our analytical priorities are thereforesimilar to those of Anderson and colleagues (Anderson et al., 2006, p. 1099) in theiranalysis of elevation accuracy. Because we are likewise focused on a construct that isdefined in terms of the difference between actual self-ratings and actual peer ratings,we find that differences in raw ratings aggregated to the group level allow us tocapture our construct appropriately while still eliminating any problems with thedependence of raw ratings on group membership.
120 L.L. Greer et al. / Organizational Behavior and Human Decision Processes 116 (2011) 116–128

Author's personal copy
are inevitable in groups (Magee & Galinsky, 2008; Overbeck,Correll, & Park, 2005; Sidanius, 1993; Wegener, 1992), they are alsodynamic, and perceptions of relative individual power within theteam may conflict (Owens & Sutton, 2001); that is, how an individ-ual views his or her power may not be in agreement with howteammates view his or her power in the team (i.e., low power con-gruence). In contrast, the alignment of an individual’s self-perception of power with how others view the amount of powerhe or she holds (i.e., high power congruence) may reduce uncer-tainty over one’s place in the team’s hierarchy and provide com-mon internal scripts for expectations and coordinated action(Fiol, O’Connor, & Aguinis, 2001), alleviating the competitivebehaviors and power struggles among high-power team members.For low-power teams, which are not necessarily as plagued by suchproblems, we expect power congruence will not be of as muchbenefit.
Specifically, we suggest that, especially in high-power teams,high power congruence will ameliorate the effects of team poweron conflict, whereas low power congruence will exacerbate sucheffects, primarily because low power congruence implies membersmight not know their place within the team, which might exacer-bate the likelihood of conflict within high-power teams. Sensitivityto the internal hierarchy runs high in these teams, and if somemembers overstep the bounds of their intragroup power, othermembers may readily reject and even punish them for such a mis-step (e.g., Anderson, Ames, & Gosling, 2008; Anderson et al., 2006).The power literature has also shown that a sense of power willmake people more approach-oriented and more likely to engagein conflictual behavior (for reviews, see Keltner, Van Kleef, Chen,& Kraus, 2008; Keltner et al., 2003; Magee & Galinsky, 2008;Smith-Lovin & Brody, 1989). These tendencies imply that membersof high-power teams will be more likely than members of low-power teams to punish individuals who make a misstep by incor-rectly estimating how much power they have (e.g., Anderson et al.,2008), given the higher likelihood for those with high power totake action in such situations (Keltner et al., 2003). The personmaking the misstep may then also take aggressive action withinthe team as when those with power come to feel incompetent, theyhave been shown to lash out against others (e.g., Fast & Chen,2009). Therefore, low power congruence is particularly likely toexacerbate conflicts in high-power teams. In contrast, when highpower congruence exists, members may better know their placein the team, as clear power roles provide information about theappropriate degree of influence to wield within the team (Bales,1950; Berger, Rosenholtz, & Zelditch, 1980). By reducing uncer-tainty about appropriate behavior and providing common internalscripts for expectations and coordinated action (Fiol, O’Connor, &Aguinis, 2001), power congruence can thus temper tendencies to-
ward competitive behaviors and power struggles in high-powerteams.
Power congruence may also benefit high-power teams byreducing the threat members experience in interacting with theirteammates. The very nature of being in a high-power team canbe a threatening experience, as all members are likely to be inter-ested in maintaining and advancing their power positions withinthe team (Mulder, 1977), and this quest for power may come atthe cost of the power of other team members. When individualteam members feel threatened, they may become defensive anddominant toward their teammates (e.g., Georgeson & Harris,2006; Morrison et al., 2009). However, if these anxieties or feelingsof threat could be reduced, members of high-power teams mightbe less likely to lash out against each other (Baumeister et al.,1996; Martorana, Galinsky, & Rao, 2005) and become embroiledin team conflicts. We propose that power congruence may providesuch a means to potentially reduce the threat experienced in suchhigh-power teams. When power congruence exists, high-powerteam members’ perception of their individual power is in align-ment with how their teammates view their power within the team(Mead, 1934; Swann, 1987). This congruence allows high-powerteam members to form confident expectations of one another’sbehavior (cf. Swann, 1987) and may reduce uncertainty about theirown positions in the team’s hierarchy (cf. Berger, Ridgeway, Fisek,& Norman, 1998; De Cremer & Sedikides, 2005; Fiol, O’Connor, &Aguinis, 2001; Ridgeway & Berger, 1986; Van den Bos & Lind,2002). In high-power teams, this congruence may significantly re-duce the threat individuals feel when they interact with their otherhigh-power team members. In addition, high power congruence al-lows team members to avoid directing excessive amounts of atten-tion and energy to defending and advancing their self-viewthrough impression-management behaviors (e.g., Swann & Ely,1984), which high-power team members may already be overlydisposed to do, especially when interacting with high-power oth-ers (e.g., Chattopadhyay et al., 2010; Greer & van Kleef, 2010).Those personal resources are thus made more available to focuson facilitating smooth and effective achievement of work tasks.In such situations, when high power congruence exists in high-power teams, the potential benefits associated with being in ahigh-power team (e.g., greater resource control, more seasoned,politically savvy team members, or pride in being part of a high-power team) may more readily come into play and allow high-power teams to perform well. Therefore, we propose the following:
Hypothesis 4. Power congruence will weaken the positive rela-tionship between team power and conflict, such that high-powerteams will have lower levels of conflict (task, process, relationship)when power congruence exists.
Power Congruence
Intragroup Conflict
Team Performance
Team Power
Fig. 1. Study 2 model.
L.L. Greer et al. / Organizational Behavior and Human Decision Processes 116 (2011) 116–128 121

Author's personal copy
Study 2 methods
We tested our hypotheses using multi-source data collectedfrom 42 pre-existing work teams (322 employees) of a multina-tional financial corporation with offices in the Netherlands. Theaverage team size was 7.67 (SD = 3.04), with team sizes ranging be-tween 3 and 13. The average team tenure was 3.65 (SD = 2.01)years. Twenty-five percent of the respondents were non-Dutch,and 51% were female. The average age of employees was 32(SD = 5.19). The teams participating in our study came from a vari-ety of departments across the company, including internal audit,investment banking, and human resources.
Procedure
We recruited teams for our study by contacting departmentalheads within the financial corporation where the study took place.Departmental heads invited all teams within their department toattend the sessions in which we conducted our study. We toldteams that attended the sessions that participation was voluntaryand they could leave at any time. In return for their participation,teams received a training and individualized team-effectivenessreport.
On the day of our study, team members entered a conferenceroom and received an initial survey assessing demographic andother baseline team characteristics, including perceptions of powerwithin the team. Following survey completion, team memberslearned they were going to be doing a task together to assess teamdynamics. We then informed them that performance on the taskwas important for the quality of feedback they would get in theirpost-training report, in which they would be benchmarked againstother participating teams. Immediately following the task, weadministered a post-task survey regarding group dynamics duringthe decision-making task, such as the level of conflict team mem-bers experienced. Note that when we administered the surveys, atleast one empty seat separated team members from each other.We assured team members both orally and in writing that their re-sponses would remain anonymous to everyone at their company.After the completion of the post-task survey, we debriefed theteams.
For the task, teams completed a logic puzzle together, similar totraditional hidden-profile tasks (e.g., Stasser & Titus, 1985). In thislogic puzzle, teams received information about five different man-agers at their company who worked in five different business unitsin five different locations and were managing five different projectswith five different budgets. We asked teams to determine whichmanager worked in which business unit in which location onwhich project and with which budget, on the basis of clues distrib-uted to each of the team members (e.g., a member would receivefive clues, one of which would read ‘‘Manager D does not workin Asia’’). Each member received the same amount of clues andthe same amount of shared versus unshared clues as other teammembers. Because all clues were critical to full completion of thepuzzle, the presence of the unshared clues meant no one membercould solve the puzzle on his or her own—they had to share infor-mation to reach a joint solution. We then informed teams that theirperformance would be based on what they were able to completeon the team solution sheet before time (15 min) was up.
We chose this task because it resembles a common decision-making procedure for both high- and low-power teams, withmembers coming to the table to solve a dilemma based on theirown unique information. Indeed, effective teams are able to iden-tify a problem, gather relevant information, and evaluate and selectalternatives to the problem that emerge from the relevant informa-tion (e.g., Janis, 1982; Kahneman, Slovic, & Tversky, 1982; Simon,
1976). Not only must high-power teams in the organization, suchas TMTs, rely on their collective decision-making abilities (e.g.,Henderson & Fredickson, 1996), but low-level teams’ responsibili-ties (e.g., customer service, production) also increasingly includemaking collective decisions about operating procedures, memberroles, scheduling, and other issues (e.g., LaFollette, Hornsby, Smith,& Novak, 1996). A final advantage of this task is that its objectiveperformance outcome offers a clear and reliable measure of perfor-mance (McGrath, 1984).
Measures
We gathered our data in this study from multiple sources: teampower was based on organizational records, team conflict wasbased on student-assistant ratings of videotapes of the team inter-action as well as team member self-reports, power congruence wascalculated from scores given team members gave to themselvesand others, and team performance was based on an objective mea-sure of task performance.
All survey questions were answered on a 7-point scale, with 1being low agreement with the item and 7 being high agreement.
Team powerWe based our distinction between high- and low-power teams
on the organizational level of the teams. Fitting our definition ofteam power, and similar to Study 1, teams that had control overother teams and/or had the ability to make decisions that wouldimpact the whole company were classified as high-power teams.Two company experts (one internal who worked in human re-sources and had in depth-knowledge of the company structure,and one external from an outside consulting company who hadhelped to design the current company hierarchical structure)determined this classification using organizational charts and com-pany knowledge. Initial inter-rater agreement was 98%. The ex-perts discussed and resolved classification for the one teamabout which they initially disagreed. They then identified 12 teamsas high power and 30 teams as low power. Our team power vari-able is thus a dichotomous variable where 0 represents low-powerteams and 1 represents high-power teams.3 In addition, as a mea-sure check, we also asked team members whether their teams occu-pied a low- or high-power position within the company (specifically,we asked members to respond from 1 to 7 to the question ‘‘Howmuch influence does your team have within your company?’’). Thismeasure check was successful, as high-power teams reported occu-pying higher-power positions than low-power teams (t = �4.43,p < .001).
Of the 12 high-power teams, five were management teams,such as supervisory teams of business units (e.g., the managementteam of the internal auditing department), and seven were policy-setting teams that did not have teams reporting directly to thembut still controlled enormous resources in the organization andhad a large impact on company policy (i.e., the advisory teamsfor organizational communications). The low-power teams in-cluded, for example, secretarial teams and other lower-level teams,such as junior auditors.
Power congruenceWe measured individual-level power on the basis of a round-
robin question wherein team members had to respond to the ques-tion ‘‘How much influence does each member of your team havewithin the team?’’ for each of the members on their team, includ-
3 We operationalized team power in the same manner as in Study 1. Similarly toStudy 1, we found that the team power was linearly (and not quadratically) related toconflict and performance, using both continuous and dichotomous measures of teampower.
122 L.L. Greer et al. / Organizational Behavior and Human Decision Processes 116 (2011) 116–128
Author's personal copy
ing themselves. In other words, members rated on a scale of 1–7the capacity of each person in their team (including themselves)to exert influence. We based self-perceptions of power on partici-pants’ own ratings, and other-perceptions of power on the averageof other members’ ratings for each other. In rating the power oftheir teammates, members showed high agreement with eachother (ICC[1] = .49, ICC[2] = .88, F [1, 274] = 5.71, p < .001; rwg = .90).
To calculate the degree to which members’ power self-viewswere congruent with how others viewed them, we followed theprocedure employed by Polzer et al. (2002).2 We first arrived atan individual-level incongruence score for each participant by cal-culating the absolute difference between self-perception andothers-perception of one’s power. We then took the average ofthese difference scores across all team members who rated the fo-cal individual, resulting in an individual-level incongruence scorefor that person. Significant F-tests, ICCs, and rwg scores confirmedthe appropriateness of aggregating power congruence (ICC[1] =.19, ICC[2] = .44, F = 106.71, p < .001; rwg = .78) to the team level(Klein & Kozlowski, 2000; LeBreton & Senter, 2008). To obtain ateam-level incongruence score, we averaged the individual-levelincongruence score of all team members. We then reverse-codedthis team-level incongruence score to reflect congruence, to easeinterpretation of results.
Intragroup conflictCoders assessed intragroup conflict by rating the videos of the
team task, and team members also provided self-report ratingson intragroup conflict on the post-task survey. Such triangulationis especially important in studies of intragroup conflict, as De Dreuand Weingart (2003) note that too much conflict research has re-lied purely on self-report survey measures, which may not be asinsightful as behavioral ratings.
For the video-coder ratings, two coders, blind to the hypotheses,rated videos of team interactions during the 15-min decision-making task (due to logistical difficulties, videotaping was not pos-sible for 5 of the teams in our sample, so we excluded them fromanalyses). For the ratings of these videos, coders filled out the Jehn(1995) measure of task and relationship conflict and the Jehn andMannix (2001) measure of process conflict on a scale of 1–7 (7indicating high agreement). The coders exhibited high reliabilityin their rankings (for task conflict, rwg = .98, for relationship con-flict, rwg = .78, for process conflict, rwg = .99). Additionally, the inter-nal reliability of the scales for each conflict type was sufficient(task conflict a = .75, relationship conflict a = .91, process conflicta = .95), and a factor analysis showed high discriminant validityfor the conflict types (three distinct factors, with all loadings above.79).
For the self-report ratings, we used the same measures—theJehn (1995) scale for task and relationship conflict and the Jehnand Mannix (2001) scale for process conflict. These measures againshowed sufficient internal reliability (task conflict a = .92, relation-ship conflict a = .84, process conflict a = .91) and discriminantvalidity (a confirmatory factor analysis revealed that a 3-factorstructure was the best fit for the data (v2(322) = 400.53, p < .001,CFI = .96, NNFI = .95, RMSEA = .09).
We then triangulated these two sources—self-report survey rat-ings and video-coder ratings of actual behavior—to form our mea-sure of conflict. We found high agreement between these twosources (task conflict: rwg = .83; relationship conflict: rwg = .89; pro-cess conflict: rwg = .91), so we averaged them together for each con-flict type to form the final measures of conflict.
Task performanceWe assessed task performance by the number of correct an-
swers the teams had for the logic puzzle. For each correct match
(e.g., identifying a manager with the correct project he managed),teams received a point. Scores could and did range from 0 to 20.
ControlsWe initially controlled for gender diversity, national diversity,
educational heterogeneity, job department, average team andorganizational tenure, team size, general team interdependenceoutside of the training task (four items, e.g., ‘‘I have to work closelywith my colleagues to do our work properly’’), team communica-tion frequency outside of the task (‘‘How frequently does this teammeet?’’), a video-rating of task focus (‘‘How focused was this teamon the task?’’, rwg = .89) and of task effort (‘‘How hard did this teamwork on the task?’’, rwg = .88), self-report of task effort (‘‘To whatextent did you actively participate in this task?’’), and the routine-ness of the task for the team (‘‘How routine was the task in thisexercise for your team?’’). Initial regression tests showed that onlynational diversity, team tenure, team communication frequency,task routineness, and task focus affected our model, so to conservepower, they were the only variables we included in subsequentanalyses.
Treatment of multi-level nature of datasetAs this dataset involves individuals nested within the teams, we
first investigated the appropriateness of running our analyses atthe team level (as specified by our theory). We found support foraveraging individual team member responses to the team levelwith significant F-tests and inter-class correlation coefficients(ICCs) (task conflict: rwg = .82; ICC[1] = .33, ICC[2] = .79; relationshipconflict: rwg = .70; ICC[1] = .26, ICC[2] = .73, process conflict:rwg = .76; ICC[1] = .27, ICC[2] = .74; power congruence (rwg = .78;ICC[1] = .19, ICC[2] = .44).
Analysis
We tested our hypotheses using hierarchical regression analy-sis. All variables were centered, according to the procedure of Ai-ken and West (1991).
Study 2 results
Table 4 presents means, standard deviations, and correlations.As seen in Table 4, team power has a significant positive relation-ship with all three conflict types and a significant negative rela-tionship with task performance.3 Means and standard deviationsof these variables at low and high levels of team power are inTable 5.
To test our first hypothesis, we used hierarchical regressionanalysis to investigate if high-power teams differed from low-power teams in their amount of intragroup conflict. As seen in Ta-ble 6, high-power teams indeed had a significantly higher amountof conflict than low-power teams: high-power teams had higherlevels of task conflict (b = .53, t(36) = 3.18, p < .01), relationshipconflict (b = .49, t(36) = 2.90, p < .01), and process conflict (b = .63,t(36) = 4.14, p < .001).
In our second hypothesis, we proposed that intragroup conflictwould be negatively related to team performance. This hypothesiswas supported for process conflict (b = �.45, t(36) = �2.26, p < .05).We did not find a significant effect of task or relationship conflicton team task performance.
In our third hypothesis, we proposed that conflict would medi-ate the relationship between team power and task performance.This hypothesis is supported for process conflict. First, our testsof Hypothesis 1 show that team power is significantly related toprocess conflict. Second, tests of Hypothesis 2 show that processconflict is significantly, negatively related to task performance.
L.L. Greer et al. / Organizational Behavior and Human Decision Processes 116 (2011) 116–128 123

Author's personal copy
Third, team power is directly significantly, negatively related totask performance (b = �.36, t(36) = �2.33, p < .05), and this signifi-cant relationship disappears (b = �.29, t(36) = �1.85, n.s.) when weadd process conflict into the equation. We also tested for media-tion with a Sobel test, which yielded a significant result as well(z = �2.08, p < .05).
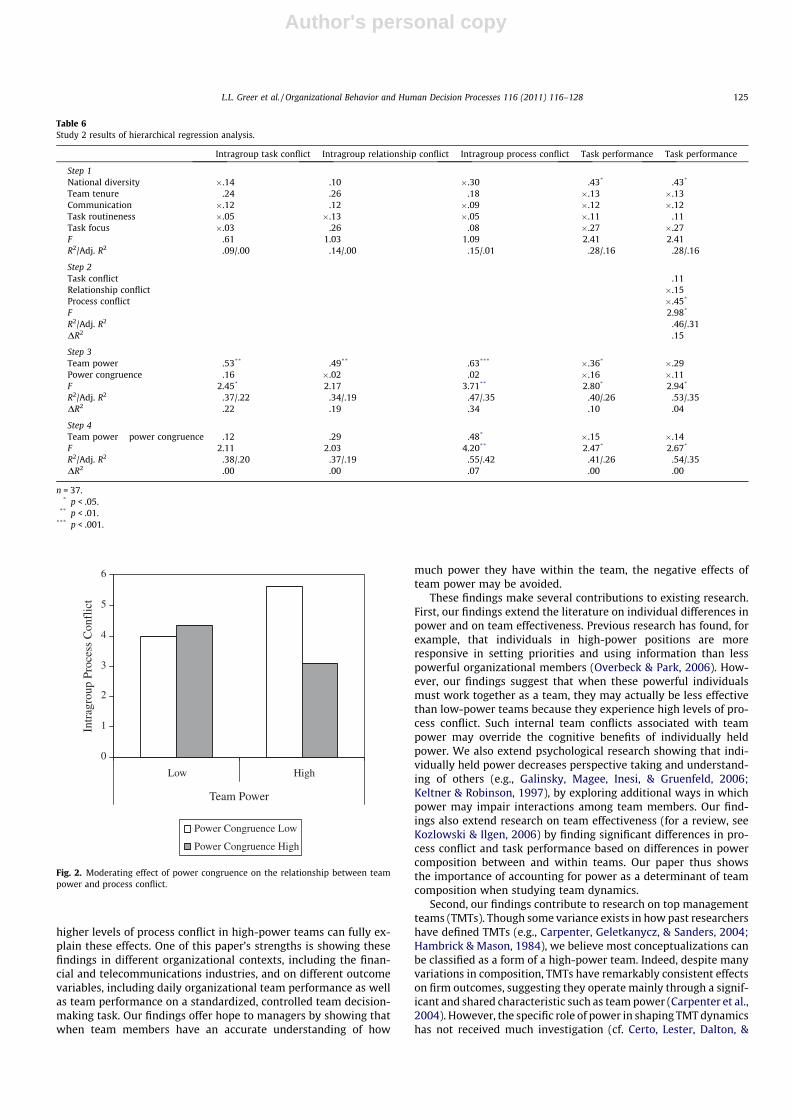
In our fourth hypothesis, we proposed that power congruencewould moderate the relationship between team power and con-flict, such that in teams with high power congruence, team powerwould be less positively related to conflict. This hypothesis wassupported for process conflict (b = .48, t(36) = 2.13, p < .05). A con-trast analysis showed that compared with all other teams, teamswith high power and low power congruence had the most processconflict (t(1, 34) = 9.18, p = .004, MeanHigh power-Low congruence = 3.47,SDHigh power-low congruence = .40, MeanAll other cells = 2.18, SDAll other
cells = .15). The interaction plot, as seen in Fig. 2, revealed an ordinalinteraction: power congruence did not appear to affect low-powerteams, but for high-power teams, when power congruence washigh, team power was less positively related to process conflict.We did not find effects of power congruence on the relationshipsbetween team power and task conflict, relationship conflict, or
team performance, preventing us from finding moderated media-tion. A Sobel test of an indirect moderated mediation path alsodid not reach significance.
Study 2 discussion
In this multi-source field study, we find that high-power teamsperform significantly worse than low-power teams on a decision-making task. Higher levels of performance-detracting process con-flict in high-power teams fully explain this effect. However, we dofind that team power is less negative when high-power teammembers’ perceptions of how much power they have within theirteam is in alignment with other members’ perceptions. This con-gruence allows high-power teams to have lower levels of processconflict, and therefore better team performance.
General discussion
Across two studies, we have shown that high-power teams per-form worse than low-power teams. In both studies, we find that
Table 4Study 2 means, standard deviations, and correlations.a
Variable Mean SD 1 2 3 4 5 6 7 8 9 10
1. National diversity .35 .252. Team tenure 3.65 2.01 .023. Communication 5.17 .55 �.08 �.064. Task routineness 3.67 1.12 .23 .18 �.015. Task focusb 3.22 1.41 .02 .13 �.21 �.026. Team powerc – – �.24 �.03 �.06 �.22 .067. Power congruence .74 .37 .21 .02 .21 .14 .14 �.198. Process conflictb 2.19 .94 �.43** �.05 �.06 �.07 .09 .62*** �.049. Task conflictb 1.98 .58 �.28 .10 �.14 �.05 .14 .44** �.23 .65***
10. Relationship conflictb 1.49 .38 .06 .15 �.09 �.04 .25 .44** �.17 .48** .64***
11. Task performance 7.05 4.16 .40* �.16 �.09 �.04 �.27 �.39* �.09 �.55** �.36* �.36*
* p < .05.** p < .01.
*** p < .001.a n = 42.b n = 37.c Categorical variable.
Table 5Study 2 mean comparisons.a
Dependent variable F Low-power teams High-power teams
M SD M SD
Team size .31 7.79 2.31 6.50 3.07Team tenure .11 1.46 .39 1.61 .44Organizational tenure .48 2.42 .54 2.95 .49Task interdependence 1.23 6.09 .77 6.16 .55Gender diversity 2.55 .36 .03 .45 .05Nationality diversity 1.19 .38 .26 .28 .33Functional diversity .10 .48 .25 .44 .32Communication .19 5.43 .50 4.59 .53Task routineness .10 2.91 1.03 3.14 .89Task effort – self-report .72 5.11 .16 5.22 .35Task effort – video-rated .08 4.75 .30 5.38 .67Task focus – video-rated .01 2.94 1.33 3.58 1.07
Task conflictb 8.30** 1.85 .10 2.46 .19Relationship conflictb 8.40** 1.41 .06 1.81 .12Process conflictb 6.29* 1.87 .44 2.85 .77Team power congruence 3.21 .79 .39 .55 .21Team task performance 6.09* 6.21 .60 3.00 1.15
* p < .05.** p < .01.
a n = 42.b n = 37.
124 L.L. Greer et al. / Organizational Behavior and Human Decision Processes 116 (2011) 116–128
Author's personal copy
higher levels of process conflict in high-power teams can fully ex-plain these effects. One of this paper’s strengths is showing thesefindings in different organizational contexts, including the finan-cial and telecommunications industries, and on different outcomevariables, including daily organizational team performance as wellas team performance on a standardized, controlled team decision-making task. Our findings offer hope to managers by showing thatwhen team members have an accurate understanding of how
much power they have within the team, the negative effects ofteam power may be avoided.
These findings make several contributions to existing research.First, our findings extend the literature on individual differences inpower and on team effectiveness. Previous research has found, forexample, that individuals in high-power positions are moreresponsive in setting priorities and using information than lesspowerful organizational members (Overbeck & Park, 2006). How-ever, our findings suggest that when these powerful individualsmust work together as a team, they may actually be less effectivethan low-power teams because they experience high levels of pro-cess conflict. Such internal team conflicts associated with teampower may override the cognitive benefits of individually heldpower. We also extend psychological research showing that indi-vidually held power decreases perspective taking and understand-ing of others (e.g., Galinsky, Magee, Inesi, & Gruenfeld, 2006;Keltner & Robinson, 1997), by exploring additional ways in whichpower may impair interactions among team members. Our find-ings also extend research on team effectiveness (for a review, seeKozlowski & Ilgen, 2006) by finding significant differences in pro-cess conflict and task performance based on differences in powercomposition between and within teams. Our paper thus showsthe importance of accounting for power as a determinant of teamcomposition when studying team dynamics.
Second, our findings contribute to research on top managementteams (TMTs). Though some variance exists in how past researchershave defined TMTs (e.g., Carpenter, Geletkanycz, & Sanders, 2004;Hambrick & Mason, 1984), we believe most conceptualizations canbe classified as a form of a high-power team. Indeed, despite manyvariations in composition, TMTs have remarkably consistent effectson firm outcomes, suggesting they operate mainly through a signif-icant and shared characteristic such as team power (Carpenter et al.,2004). However, the specific role of power in shaping TMT dynamicshas not received much investigation (cf. Certo, Lester, Dalton, &
Table 6Study 2 results of hierarchical regression analysis.
Intragroup task conflict Intragroup relationship conflict Intragroup process conflict Task performance Task performance
Step 1National diversity �.14 .10 �.30 .43* .43*
Team tenure .24 .26 .18 �.13 �.13Communication �.12 .12 �.09 �.12 �.12Task routineness �.05 �.13 �.05 �.11 .11Task focus �.03 .26 .08 �.27 �.27F .61 1.03 1.09 2.41 2.41R2/Adj. R2 .09/.00 .14/.00 .15/.01 .28/.16 .28/.16
Step 2Task conflict .11Relationship conflict �.15Process conflict �.45*
F 2.98*
R2/Adj. R2 .46/.31DR2 .15
Step 3Team power .53** .49** .63*** �.36* �.29Power congruence .16 �.02 .02 �.16 �.11F 2.45* 2.17 3.71** 2.80* 2.94*
R2/Adj. R2 .37/.22 .34/.19 .47/.35 .40/.26 .53/.35DR2 .22 .19 .34 .10 .04
Step 4Team power � power congruence .12 .29 .48* �.15 �.14F 2.11 2.03 4.20** 2.47* 2.67*
R2/Adj. R2 .38/.20 .37/.19 .55/.42 .41/.26 .54/.35DR2 .00 .00 .07 .00 .00
n = 37.* p < .05.
** p < .01.*** p < .001.
0
1
2
3
4
5
6
Low High
Team Power
Intr
agro
up P
roce
ss C
onfl
ict
Power Congruence Low
Power Congruence High
Fig. 2. Moderating effect of power congruence on the relationship between teampower and process conflict.
L.L. Greer et al. / Organizational Behavior and Human Decision Processes 116 (2011) 116–128 125

Author's personal copy
Dalton, 2006), nor have the underlying team dynamics or processesof TMTs (cf. Certo et al., 2006; Vyakaranam & Handelberg, 2005). Ourfindings suggest TMTs may actually have poorer performance thanother organizational teams when TMT members’ perceptions oftheir power within the team are not in alignment with theirteammates’ perceptions. These findings indicate the importance ofclarifying individual power positions within TMTs to help themachieve better team performance.
Third, our findings extend research on interpersonal congruencein organizations by showing the importance of interpersonal con-gruence processes can vary across team contexts. Specifically, ourfindings suggest power congruence has a larger impact on mem-bers of high-compared to low-power teams, perhaps because theaddictive nature of power (Mulder, 1977) makes individual intra-group power more salient and more important in high-power teaminteractions. Past literature has demonstrated that when individu-als consider a characteristic important, verification (or the lackthereof) becomes a greater and more influential concern (Swann& Pelham, 2002). Our results add nuance to this finding by suggest-ing the team context in which an individual operates, as well as hisor her personal feelings, determines a characteristic’s importance.In addition, our results suggest a characteristic’s importance mod-erates consequences not only for individuals but also for teams.
Last, our findings contribute to the intragroup conflict literature(e.g., De Dreu, 2007; De Dreu & Weingart, 2003; Jehn & Bendersky,2003) by looking at an important new antecedent of conflict: teampower. Our findings across both studies suggest a team’s power inthe organization may have substantial impact on the process con-flict that occurs in the team, and our findings in Study 2 suggestaccurate self-perceptions of power within the team may alleviatethis effect. This finding extends past research on the antecedentsof intragroup conflict, which has primarily focused on demo-graphic characteristics (e.g., Jehn, Northcraft, & Neale, 1999; Pelled,Eisenhardt, & Xin, 1999), by showing that power is a new andimportant factor of team composition that may influence intra-group conflict. Additionally, we found, in line with a growingamount of evidence (e.g., Greer & Jehn, 2007; Jehn et al., 1999), thatprocess conflict negatively affects team performance. Althoughpast research has suggested process conflict may benefit perfor-mance through improving task fit (cf. Jehn & Bendersky, 2003),other research has suggested process conflict may hurt perfor-mance because of the high emotionality associated with issuessuch as task delegation and its associated personal connotations(Greer & Jehn, 2007). Our findings inform this debate by showingsupport for the proposition that process conflict negatively affectsteam performance. We do not find a strong effect of task conflict onobjective team performance measures in our studies, though thisresult is not surprising, as a meta-analysis by De Dreu andWeingart (2003) also did not find a strong effect of task conflicton team performance. Future research would benefit from furtherinvestigation into the conditions under which task conflict is goodor bad for team performance.
Future directions and limitations
The findings in these studies open up the possibility for severalnew research directions. The first derives from our suggestion thatone of the primary theoretical mechanisms underlying our effectsis that being a member of a high-power team instills individualswith a high sense of power, which sets in play the processes de-scribed above and is compounded by the fact that in high-powerteams, multiple individuals with similarly high senses of powerare interacting. This should occur for all forms of high-powerteams, regardless of the type of high-power team (managementteam, policy-setting team, etc.). We believe this provides a moreparsimonious explanation for our effects than structural or func-
tional factors, as high-power teams come in many forms with dif-ferent internal power structures (e.g., power dispersion vs. sharedleadership) and different functional tasks and responsibilities (e.g.,policy-making teams vs. management teams). The one factor allforms of high-power teams have in common is their power, orinfluence, within the organization. However, future researchshould further investigate the exact nature and experience ofpower in high-power teams (from structural effects to psycholog-ical effects). A related avenue for future research would be to ex-tend our present focus on teams with high formal power, orhierarchical level in the organization, to teams with other formsof power. Although Mintzberg (1983) suggested formal powermay be the most influential form of power in organizations, exam-ining the generalizability of our findings to other bases of teampower, such as expertise, would still be valuable (French & Raven,1959).
Furthermore, although we feel we can treat our results withconfidence, as we controlled for a number of variables that couldpotentially differ between high- and low-power teams (includingthe task [in Study 2], and variables such as effort, focus, and diver-sity), alternative explanations could still exist. For example, per-haps high-power teams have less motivation to participate inresearch studies. Or perhaps high-power teams are more likely toconsist of individuals with certain personality types, such as so-cial-dominance orientation, need for power, or Machiavellianism,who are more sensitive to and reactive on power issues than thosein low-power teams. Future investigation of high- and low-powerteams in a laboratory environment would be valuable, as would re-search that pulls apart potential covarying factors, such as motiva-tion, status, and personality type. Also, given the organizations westudied, we limited our sample to the comparison of low- andhigh-power teams (as is common in power research; see Keltneret al. (2003), for a review). Investigation of team power in a labo-ratory setting where multiple levels of team power could bemanipulated more easily would be interesting.
One potential way to reduce process conflicts in high-powerteams is to identify and manage their root causes. One such rootcause may be the presence of status contests, or status conflicts,among high-power team members (e.g., Bendersky & Hayes, inpress; Overbeck et al., 2005). Recent work suggests a struggle forstatus, or power, is a real and powerful phenomenon in teams(Bendersky & Hayes, in press; Greer & van Kleef, 2010), and oneespecially likely to occur in high-power teams, given the addictive-ness of power (e.g., Mulder, 1977). This may explain why high-power team members, more than low-power team members,engage in process conflicts (such as trying to get better assign-ments than a rival; Bendersky & Hayes, in press; Greer & van Kleef,2010). Past research has noted that people tend to dress up con-flicts to hide the underlying issue (e.g., Harinck, De Dreu, & VanVianen, 2000), and that attempts to gain status must occur withinthe constraints of group norms and collective task completion (e.g.,Chizhik, Alexander, Chizhik, & Goodman, 2003; Ridgeway, 1982;Shelly & Troyer, 2001). For example, to gain status, one might tryto express an innovative but divergent perspective on how toaccomplish the task. Another member, who wants to also havehigher status, might try to discredit that member by disagreeingwith the proposal (not because he actually disagrees, but becausehe does not want others to buy into that member’s idea). In thisway, a status conflict can be dressed up as a conflict about anotherissue, such as the process. Future research into the exact ways inwhich status contests and power struggles may manifest them-selves in process conflicts, and what this transformation of statusand power issues to process conflicts implies for team functioning,would be interesting. In addition, investigating the exact mecha-nisms by which conflict impacts team performance would be valu-able. Although research has often speculated that negative
126 L.L. Greer et al. / Organizational Behavior and Human Decision Processes 116 (2011) 116–128

Author's personal copy
emotions and impaired task focus underlie the negative effects ofconflict (cf. De Dreu & Weingart, 2003; Jehn, 1995), scant researchhas empirically examined these relationships.
Relatedly, future research would benefit from further examina-tion of factors that can ameliorate the negative relationship be-tween team power and task performance. Although we identifiedpower congruence as one such factor, others are possible, such ascooperative norms within the team. Second, future research wouldbenefit from examining ways in which teams can ensure eachmember’s perceptions of his or her power within the team is con-gruent with other members’ perceptions. Work by Anderson et al.(2006, 2008) has shown that people often err on the side of cautionin reporting their own status; our findings urge caution in allowingincongruent perceptions of power to emerge, as they can cause ha-voc in high-power teams. Identifying exactly when power (in)con-gruence is likely to occur would thus be valuable. For example,when team members perceive their team’s hierarchy as illegiti-mate (e.g., Lammers, Galinksky, Gordijn, & Otten, 2008), powerincongruence may be more likely to exist. When members do notfully endorse the formal internal hierarchy, they may be morelikely to challenge the existing power structure within the teamand engage in power moves.
Additionally, although power congruence ameliorated the pro-cess conflicts present in high-power teams, we call for futureinvestigation of other factors that could reduce these negative con-flicts and enable high-power teams to better capitalize on their po-tential and outperform low-power teams should be investigated.For example, high-power teams have more resources, and there-fore more privileges and opportunities, than other teams. Becauseof this higher level of prestige, members are likely to value and beproud of their membership, which could lead to higher identifica-tion, loyalty, and cohesion within their high-power team—if theirpotential for destructive process conflicts can be overcome.
Conclusion
High-power teams are not always high performers. High-powerteams have high levels of process conflict, which can interfere witheffective team performance. As a result, low-power teams mayoutperform high-power teams. However, when high-power teammembers’ perceptions of their individual power within the teamis in alignment with how other team members perceive theirpower, high-power teams can avoid process conflicts and exhibitbetter team performance. Both managers and managementresearchers can use these findings to better understand howhigh-power teams (such as TMTs) differ from low-power organiza-tional teams and to identify ways in which high-power team per-formance can be improved.
Acknowledgments
We would like to thank Carsten De Dreu, Bart De Jong, AnneloesRaes, and three anonymous reviewers for their helpful commentson earlier drafts of this manuscript.
References
Aiken, L., & West, S. (1991). Multiple regression: Testing and interpreting interactions.Newbury Park, CA: Sage.
Anderson, C., Ames, D. R., & Gosling, S. D. (2008). Punishing hubris: The perils ofoverestimating one’s status in a group. Personality and Social Psychology Bulletin,34, 90–101.
Anderson, C., & Berdahl, J. (2002). The experience of power: Examining the effects ofpower on approach and inhibition tendencies. Journal of Personality and SocialPsychology, 83, 1362–1377.
Anderson, C., Srivastava, S., Beer, J. S., Spataro, S. E., & Chatman, J. A. (2006). Knowingyour place: Self-perceptions of status in face-to-face groups. Journal ofPersonality and Social Psychology, 91, 1094–1110.
Astley, W. G., & Sachdeva, P. S. (1984). Structural sources of intraorganizationalpower: A theoretical synthesis. Academy of Management Review, 9, 104–113.
Bales, R. F. (1950). Interaction process analysis: A method for the study of small groups.Chicago: University of Chicago Press.
Baron, R. M., & Kenny, D. A. (1986). The moderator-mediator variable distinction insocial psychological research: Conceptual, strategic and statistical considerations.Journal of Personality and Social Psychology, 51, 1173–1182.
Baumeister, R. F., Smart, L., & Boden, J. M. (1996). Relation of threatened egotism toviolence and aggression. Psychological Review, 103, 5–33.
Bell, C., & Song, F. (2005). Emotions in the conflict process: An application of thecognitive appraisal model of emotions to conflict management. TheInternational Journal of Conflict Management, 16(1), 30–54.
Bendersky, C., & Hayes, N. (in press). Status conflict in groups. Organization Science.Berger, J., Ridgeway, C. L., Fisek, M. H., & Norman, R. Z. (1998). The legitimation and
delegitimation of power and prestige orders. American Sociological Review, 63,379–405.
Berger, J., Rosenholtz, S. J., & Zelditch, M. Jr., (1980). Status organizing processes.Annual Review of Sociology, 6, 479–508.
Brief, A. P., & Weiss, H. M. (2002). Organizational behavior: Affect in the workplace.Annual Review of Psychology, 53, 279–307.
Bruins, J. J., & Wilke, H. A. M. (1992). Cognitions and behavior in a hierarchy: Mulder’spower theory revisited. European Journal of Social Psychology, 22, 21–39.
Carpenter, M. A., Geletkanycz, M. A., & Sanders, W. G. (2004). Upper echelonsresearch revisited: Antecedents, elements, and consequences of topmanagement team composition. Journal of Management, 30, 749–778.
Certo, S. T., Lester, R. H., Dalton, C. M., & Dalton, D. R. (2006). Top managementteams, strategy, and financial performance: A meta-analysis. Journal ofManagement Studies, 43, 813–839.
Chattopadhyay, P. J., Finn, C., & Ashkanasy, N. M. (2010). Affective responses toprofessional dissimilarity: A matter of status. Academy of Management Journal,53, 808–826.
Chizhik, A. W., Alexander, M. G., Chizhik, E. W., & Goodman, J. A. (2003). The rise andfall of power and prestige orders: Influence on task structure. SocialPsychological Quarterly, 66, 303–317.
Cohen, S. G., & Bailey, D. E. (1997). What makes teams work: Group effectivenessresearch from the shop floor to the executive suite. Journal of Management, 23,239–290.
Cronbach, L. J. (1955). Processes affecting scores on ‘‘understanding others’’ and‘‘assumed similarity’’. Psychological Bulletin, 52, 177–193.
De Cremer, D., & Sedikides, C. (2005). Self-uncertainty and responsiveness toprocedural justice. Journal of Experimental Social Psychology, 41, 157–173.
De Dreu, C. K. W. (2007). The virtue and vice of workplace conflict: Food for(pessimistic) thought. Journal of Organizational Behavior, 29, 5–18.
De Dreu, C. K. W., & Weingart, L. R. (2003). Task versus relationship conflict, teamperformance, and team member satisfaction: A meta-analysis. Journal of AppliedPsychology, 88, 741–749.
Eisenhardt, K. M., & Bourgeois, L. J. (1988). Politics of strategic decision making inhigh-velocity environments: Toward a midrange theory. Academy ofManagement Journal, 31, 737–770.
Evan, W. (1965). Conflict and performance in R&D organizations. IndustrialManagement Review, 7, 37–46.
Fast, N. J., & Chen, S. (2009). When the boss feels inadequate: Power, incompetence,and aggression. Psychological Science, 20, 1406–1413.
Fast, N. J., Gruenfeld, D. H., Sivanathan, N., & Galinsky, A. D. (2009). Illusory control:A generative force behind power’s far-reaching effects. Psychological Science, 20,502–508.
Fiol, C. M., O’Connor, E. J., & Aguinis, H. (2001). All for one and one for all? Thedevelopment and transfer of power across organizational levels. Academy ofManagement Review, 28, 224–242.
Fiske, S. T. (1993). Controlling other people: The impact of power on stereotyping.American Psychologist, 48, 621–628.
Fombrun, C. J. (1983). Attributions of power across a social network. HumanRelations, 36, 493–508.
French, J., & Raven, B. (1959). The bases of social power. In D. Cartwright (Ed.),Studies in social power (pp. 150–167). Ann Arbor, MI: Institute for SocialResearch.
Funder, D. C., & West, S. G. (1993). Viewpoints on personality: Consensus, self–other agreement and accuracy in judgments of personality: An introduction.Journal of Personality, 61(4), 457–476.
Galinsky, A. D., Gruenfeld, D. H., & Magee, J. C. (2003). From power to action. Journalof Personality and Social Psychology, 85, 453–466.
Galinsky, A. D., Magee, J. C., Inesi, M. E., & Gruenfeld, D. H. (2006). Power andperspective not taken. Psychological Science, 17, 1068–1074.
Georgeson, J., & Harris, M. J. (2006). Holding onto power: Effects of powerholders’positional instability and expectancies on interactions with subordinates.European Journal of Social Psychology, 36, 451–468.
Greer, L. L., & van Kleef, G. A. (2010). Equality versus differentiation: The effects ofpower dispersion on social interaction. Journal of Applied Psychology, 95,1032–1044.
Greer, L. L., & Jehn, K. A. (2007). The pivotal role of emotion in intragroup processconflict. In M. Neale, E. Mannix, & C. Anderson (Eds.). Research on managinggroups and teams (Vol. 10, pp. 23–45). Oxford, UK: Elsevier.
Guetzkow, H., & Gyr, J. (1954). An analysis of conflict in decision making groups.Human Relations, 7, 367–381.
Guinote, A., Brown, M., & Fiske, S. T. (2006). Minority status decreases sense ofcontrol and increases interpretive processing. Social Cognition, 24, 169–186.
L.L. Greer et al. / Organizational Behavior and Human Decision Processes 116 (2011) 116–128 127
Author's personal copy
Guinote, A., Judd, C. M., & Brauer, M. (2002). Effects of power on perceived andobjective group variability: Evidence that more powerful groups are morevariable. Journal of Personality and Social Psychology, 82, 708–721.
Hambrick, D. C., & Mason, P. (1984). Upper echelons: The organization as areflection of its top managers. Academy of Management Review, 9, 193–206.
Harinck, F., De Dreu, C. K. W., & Van Vianen, A. E. M. (2000). The impact ofconflict issue on fixed-pie perceptions, problem solving, and integrativeoutcomes in negotiation. Organizational Behavior and Human DecisionProcesses, 81, 329–358.
Henderson, A. D., & Fredickson, J. W. (1996). Information-processing demands as adeterminant of CEO compensation. Academy of Management Journal, 39,575–606.
House, R. J., Rousseau, R. M., & Thomas-Hunt, M. (1995). The meso paradigm: Aframework for the integration of micro and macro organizational behavior. In L.L. Cummings & B. M. Staw (Eds.). Research in organizational behavior (Vol. 17,pp. 71–114). Greenwich, CT: JAI Press.
Janis, I. L. (1982). Victims of groupthink (2nd ed.). Boston: Houghton Mifflin.Jehn, K. A. (1995). A multimethod examination of the benefits and detriments of
intragroup conflict. Administrative Science Quarterly, 40, 256–282.Jehn, K. A. (1997). Qualitative analysis of conflict types and dimensions in
organizational groups. Administrative Science Quarterly, 42, 530–557.Jehn, K. A., & Bendersky, C. (2003). Intragroup conflict in organizations: A
contingency perspective. Research in Organizational Behavior, 25, 189–244.Jehn, K. A., & Mannix, E. A. (2001). The dynamic nature of conflict: A longitudinal
study of intragroup conflict and group performance. Academy of ManagementJournal, 44, 238–251.
Kahneman, D., Slovic, P., & Tversky, A. (Eds.). (1982). Judgment under uncertainty:Heuristics and biases. New York: Cambridge University Press.
Jehn, K. A., Northcraft, G., & Neale, M. A. (1999). Why differences make a difference:A field study of diversity, conflict, and performance in workgroups.Administrative Science Quarterly, 44, 741–763.
Keltner, D., van Kleef, G. A., Chen, S., & Kraus, M. W. (2008). A reciprocal influencemodel of social power: Emerging principles and lines of inquiry. Advances inExperimental Social Psychology, 40, 151–192.
Keltner, D., Gruenfeld, D. H., & Anderson, C. (2003). Power, approach, and inhibition.Psychological Review, 110, 265–284.
Keltner, D., & Robinson, R. J. (1997). Defending the status quo: Power and bias insocial conflict. Personality and Social Psychology Bulletin, 23, 1066–1077.
Keltner, D., Young, R. C., Heerey, E. A., Oemig, C., & Monarch, N. D. (1998). Teasing inhierarchical and intimate relationships. Journal of Personality and SocialPsychology, 75, 1231–1247.
Klein, K. J., & Kozlowski, S. W. J. (2000). From micro to meso: Critical steps inconceptualizing and conducting multilevel research. Organizational ResearchMethods, 3, 211–236.
Kozlowski, S. W. J., & Ilgen, D. R. (2006). Enhancing the effectiveness of work groupsand teams. Psychological Science in the Public Interest, 7(3), 77–124.
LaFollette, W., Hornsby, J. S., Smith, B. N., & Novak, W. I. (1996). The use of workteams in organizations. Mid-American Journal of Business, 11, 55–61.
Lammers, J., Galinksky, A. D., Gordijn, E. H., & Otten, S. (2008). Illegitimacymoderates the effect of power on approach. Psychological Science, 19, 558–564.
Lazarus, R. S. (1991). Emotion and adaptation. New York: Oxford University Press.Lazear, E. P., & Rosen, S. (1981). Rank-order tournaments as optimum labor
contracts. Journal of Political Economy, 89, 841–864.LeBreton, J. M., & Senter, J. L. (2008). Answers to 20 questions about interrater
reliability and interrater agreement. Organizational Research Methods, 11,815–852.
Magee, J. C., & Galinsky, A. D. (2008). Social hierarchy: The self-reinforcing nature ofpower and status. Academy of Management Annals, 2, 351–398.
Mannix, E. A., & Sauer, S. J. (2006). Status and power in organizational groupresearch: acknowledging the pervasiveness of hierarchy. In E. Lawler & S. Thye(Eds.). Advances in group processes: Social psychology of the workplace (Vol. 23,pp. 49–182). New York: Elsevier.
Martorana, P. V., Galinsky, A. D., & Rao, H. (2005). From system justification tosystem condemnation: Antecedents of attempts to change power hierarchies. InM. A. Neale, E. A. Mannix, & M. Thomas-Hunt (Eds.). Research on managinggroups and teams (Vol. 7, pp. 283–313). Oxford: Elsevier.
McGrath, J. E. (1984). Groups: Interaction and performance. Englewood Cliffs, NJ:Prentice Hall.
Mead, G. H. (1934). Mind, self, and society. Chicago: University of Chicago Press.Mintzberg, H. (1983). Power in and around organizations. Englewood Cliffs, NJ:
Prentice Hall.Morrison, K. R., Fast, N. J., & Ybarra, O. (2009). Group status, perceptions of threat,
and support for social inequality. Journal of Experimental Social Psychology, 45,204–210.
Mulder, M. (1977). The daily power game. Leiden, Netherlands: H.E. Stenfert Kroese.Overbeck, J. R., Correll, J., & Park, B. (2005). Internal status sorting in groups: The
problem of too many stars. In M. A. Neale, E. A. Mannix, & M. Thomas-Hunt
(Eds.). Research on managing groups and teams (Vol. 7, pp. 169–199). Oxford:Elsevier.
Overbeck, J. R., & Park, B. (2006). Powerful perceivers, powerless objects: Flexibilityof powerholders’ social attention. Organizational Behavior and Human DecisionProcesses, 99, 227–243.
Owens, D. A., & Sutton, R. I. (2001). Status contests in meetings: Negotiating theinformal order. In M. Turner (Ed.), Groups at work: Advances in theory andresearch (pp. 299–316). Hillsdale, NJ: Lawrence Erlbaum.
Pelled, L. H., Eisenhardt, K. M., & Xin, K. R. (1999). Exploring the black box: Ananalysis of group diversity, conflict, and performance. Administrative ScienceQuarterly, 44, 1–28.
Polzer, J. T., Milton, L. P., & Swann, W. B. (2002). Capitalizing on diversity:Interpersonal congruence in small groups. Administrative Science Quarterly, 47,296–324.
Ragins, B. R., & Sundstrom, E. (1989). Gender and power in organizations: Alongitudinal perspective. Psychological Bulletin, 105, 51–88.
Ridgeway, C. (1982). Status in groups: The importance of motivation. AmericanSociological Review, 47, 76–88.
Ridgeway, C. L. (1991). The social construction of status value: Gender and othernominal characteristics. Social Forces, 70, 367–386.
Ridgeway, C. L. (1997). Where do status beliefs come from? New developments. In J.Szmatka, J. Skvoretz, & J. Berger (Eds.), Status, networks, and structure(pp. 137–158). Stanford, CA: Stanford University Press.
Ridgeway, C. L., & Berger, J. (1986). Expectations, legitimation, and dominancebehavior in task groups. American Sociological Review, 51, 603–617.
Roseman, I. J., Antoniou, A. A., & Jose, P. E. (1996). Appraisal determinants ofemotions: Constructing a more accurate and comprehensive theory. Cognition &Emotion, 10(3), 241–277.
Russell, J. (1978). Evidence of convergent validity on the dimensions of affect.Journal of Personality and Social Psychology, 37, 345–356.
Shelly, R. K., & Troyer, A. (2001). Emergence and completion of structure in initiallyundefined and partially defined groups. Social Psychological Quarterly, 64,318–322.
Sidanius, J. (1993). The psychology of group conflict and the dynamics ofoppression: A social dominance perspective. In S. Iyengar & W. J. McGuire(Eds.), Exploitation in political psychology (pp. 183–219). Durham, NC: DukeUniversity Press.
Sidanius, J., & Pratto, F. (1999). Social dominance: An intergroup theory of socialhierarchy and oppression. Cambridge, UK: Cambridge University Press.
Siegel, P. A., & Hambrick, D. C. (2005). Pay disparities within top managementgroups: Evidence of harmful effects on performance of high-technology firms.Organization Science, 16, 259–274.
Simon, H. A. (1976). Administrative behavior: A study of decision-making processes inadministrative organizations. New York: Free Press.
Smith, P. J., Jost, J. T., & Vijay, R. (2008). Legitimacy crisis? Behavioral approach andinhibition when power differences are left unexplained. Social Justice Research,21, 358–376.
Smith-Lovin, L., & Brody, C. (1989). Interruptions in group discussions: The effects ofgender and group composition. American Sociological Review, 54, 424–435.
Stasser, G., & Titus, W. (1985). Pooling of unshared information in group decision-making – Biased information sampling during discussion. Journal of Personalityand Social Psychology, 48, 1467–1478.
Stearns, F. (1972). Anger: Psychology, physiology, and pathology. Springfield, IL:Charles C. Thomas.
Swann, W. B. Jr., (1987). Identity negotiation: Where two roads meet. Journal ofPersonality and Social Psychology, 53, 1038–1051.
Swann, W. B., & Ely, R. J. (1984). A battle of wills: Self-verification versus behavioralconfirmation. Journal of Personality and Social Psychology, 46, 1287–1302.
Swann, W. B., Jr., & Pelham, B. W. (2002). Who wants out when the going gets good?Psychological investment and preference for self-verifying college roommates.Journal of Self and Identity, 1, 219–233.
Thomas, K. W. (1992). Conflict and negotiation processes in organizations. In M. D.Dunnette & L. Hough (Eds.), Handbook of industrial and organizational psychology(pp. 889–935). Palo Alto, CA: Consulting Psychologists Press.
Van den Bos, K., & Lind, E. A. (2002). Uncertainty management by means of fairnessjudgments. In M. P. Zanna (Ed.). Advances in experimental social psychology (Vol.34, pp. 1–60). San Diego, CA: Academic Press.
Van Kleef, G. A., Oveis, C., Van der Löwe, I., LuoKogan, A., Goetz, J., & Keltner, D.(2008). Power, distress, and compassion: Turning a blind eye to the suffering ofothers. Psychological Science, 19, 1315–1322.
Vyakaranam, S., & Handelberg, J. (2005). Four themes of the impact of managementteams on organizational performance. International Small Business Journal, 23,236–256.
Wall, J. A., & Callister, R. R. (1995). Conflict and its management. Journal ofManagement, 21, 515–558.
Wegener, B. (1992). Concepts and measurement of prestige. Annual Review ofSociology, 18, 253–280.
128 L.L. Greer et al. / Organizational Behavior and Human Decision Processes 116 (2011) 116–128
Related Documents