1 Running head: THE BIG FIVE ACROSS SOCIOECONOMIC STATUS The Big Five Across Socioeconomic Status: Measurement Invariance, Relationships, and Age Trends Bradley T. Hughes*, Cory K. Costello, Joshua Pearman, Pooya Razavi, Cianna Bedford-Petersen, Rita M. Ludwig, and Sanjay Srivastava University of Oregon Eugene, Oregon, USA Stage 1 Registered Report In-principle Acceptance, 01/05/2020 Collabra: Psychology *Correspondence concerning this article should be addressed to Bradley T. Hughes, Email: [email protected]

Welcome message from author
This document is posted to help you gain knowledge. Please leave a comment to let me know what you think about it! Share it to your friends and learn new things together.
Transcript

1 Running head: THE BIG FIVE ACROSS SOCIOECONOMIC STATUS
The Big Five Across Socioeconomic Status:
Measurement Invariance, Relationships, and Age Trends
Bradley T. Hughes*, Cory K. Costello, Joshua Pearman, Pooya Razavi,
Cianna Bedford-Petersen, Rita M. Ludwig, and Sanjay Srivastava
University of Oregon
Eugene, Oregon, USA
Stage 1 Registered Report
In-principle Acceptance, 01/05/2020
Collabra: Psychology
*Correspondence concerning this article should be addressed to Bradley T. Hughes, Email:

2 THE BIG FIVE ACROSS SOCIOECONOMIC STATUS
Abstract
Associations between socioeconomic status (SES) and personality, traits and developmental
trajectories, have important implications for theory and application. Progress in understanding
these associations depends on evaluating how well personality measures function in
socioeconomically diverse samples. In the present study, we will use the confirmatory dataset
from AIID, a large online study, to address three basic questions about personality and SES.
First, we will evaluate the measurement invariance of a common measure of personality, the Big
Five Inventory, across indicators of education, income, and occupational prestige. Second, we
will estimate previously reported associations between SES indicators and personality in new
data to see if they align with past evidence. Third, we will test whether mean-level age trends in
personality generalize across levels of SES. The results will have important implications for the
validity of past and future research on associations between personality and SES. Additionally,
the results will provide insight into differences in personality development trajectories that can
inform future work investigating the causal mechanisms between personality and SES.

3 THE BIG FIVE ACROSS SOCIOECONOMIC STATUS
The Big Five Across Socioeconomic Status:
Measurement Invariance, Relationships, and Age Trends
A growing body of evidence has observed a relationship between personality traits and
socioeconomic status (SES). For example, conscientiousness positively predicts SES over and
above intelligence (Heckman & Kautz, 2012) and neuroticism is negatively associated with
income (Kajonius & Carlander, 2017). Moreover, these relationships are linked to important
outcomes; for example, personality can explain ~20% of the increased all-mortality risk
associated with being lower in SES (Chapman, Fiscella, Kawachi, & Duberstein, 2009).
Documenting these kinds of associations is an important precursor to developing theories about
transactional pathways between personality and social contexts, including how social roles and
experiences might shape personality development and vice versa.
Before proceeding with such theoretical work, however, it is important to address basic
methodological and descriptive empirical questions about personality and SES. Personality
measures are often developed in samples of college students, but in order to study the
associations between personality and SES, the measures have to function equivalently in more
socioeconomically diverse samples. Few studies report analyses of measurement invariance
before presenting substantive associations. Thus, efforts to explain associations between SES and
personality may be misguided if those associations are not replicable and generalizable.
In this research we address three important questions in the study of personality and SES.
First, how valid are comparisons of personality across different socioeconomic strata? We
address this question by analyzing the measurement invariance of a widely used personality
measure, the Big Five Inventory (John & Srivastava, 1999), across multiple SES indicators.
Second, how do Big Five personality traits correlate with education, income, and occupational

4 THE BIG FIVE ACROSS SOCIOECONOMIC STATUS
prestige? We investigate the associations between the Big Five and socioeconomic indicators.
And third, how well do age trends in personality generalize across levels of socioeconomic
status? We consider mean-level age trends in the Big Five that are often described as
representing typical developmental pathways in adulthood.
Background: Socioeconomic Status and Its Relevance to Personality
SES is a widely studied contextual phenomenon in psychology. Broadly speaking, SES
refers to an individual’s standing within the social hierarchies of a society. More specific
definitions and approaches vary, with some researchers emphasizing economic hierarchies and
others emphasizing social variables like prestige (Bradley & Corwyn, 2002). In practice, SES is
frequently measured through one or more of three variables: educational attainment, income, and
occupational prestige (Adler et al., 1994 ; Diemer, Mistry, Wadsworth, Lopez, & Reimers, 2013;
Saegert et al., 2007). In the present research we will consider all three of these variables, each of
which has been shown to be associated with personality traits (Jonassaint, Siegler, Barefoot,
Edwards, & Williams, 2011).
Why is it important to study the relationship between SES and personality? SES is
defined by differential access to economic and social resources that can both affect (Bradley &
Corwyn, 2002; Conger et al., 2002; Jonassaint et al., 2011) and be affected by personality
(Damian, Su, Shanahan, Trautwein, & Roberts, 2015; Heckman & Kautz, 2012). For example,
childhood SES predicts patterns in personality, such that growing up in a high SES home is
associated with higher levels of Extraversion and Openness, whereas growing up in a low SES
home is associated with high neuroticism and low conscientiousness (Jonassaint et al., 2011).
Similarly, an individual’s personality measured in high school can better predict future
socioeconomic success than their parent’s SES (Damian et al., 2015). Researchers and

5 THE BIG FIVE ACROSS SOCIOECONOMIC STATUS
policymakers are increasingly recognizing the potential for interventions on personality
development to affect social and economic indicators and vice versa, making this a key area for
societally relevant basic and translational research (Bleidorn et al., in press).
Measurement Invariance
Prior to investigating the associations between SES and personality, it is important to
assess if personality, as measured, reflects the same construct (i.e., has the same structure) across
levels of SES. Measurement invariance concerns the extent to which a measure works similarly
across levels of some factor or group (e.g., across different cultures, age groups, gender, income
and education, etc.). It is important to examine measurement invariance for two reasons. First,
measurement invariance is an important aspect of structural validity, or the extent to which the
hypothesized structure of a measure is reflected empirically in the data (Flake, Pek, & Hehman,
2017; John & Soto, 2007). Thus, establishing measurement invariance is a psychometric goal in
its own right, providing evidence that a proposed measurement model is structurally valid.
Second, establishing measurement invariance is a precondition for unambiguously interpreting
differences in that measured construct across groups. For example, an observed relation between
conscientiousness and educational attainment (e.g., a correlation between conscientiousness and
years of educational attainment, or a mean difference in conscientiousness between high school
graduates and college graduates), could either reflect a true relation between these constructs or
differences in how people of varying educational backgrounds respond to the items of the scale
used to measure conscientiousness. Only by establishing measurement invariance across levels
of educational attainment could an analysis like this unambiguously reflect a relation between
the constructs.

6 THE BIG FIVE ACROSS SOCIOECONOMIC STATUS
Measurement invariance can be tested with multiple-group confirmatory factor analysis
(CFA) in which parameters are constrained to be equal across levels of a grouping variable
(Gregorich, 2006). Each level of measurement invariance enables the unambiguous interpretation
of certain comparisons. Metric invariance is established when factor loadings are equal across
groups, and it enables comparisons of variances and covariances among latent factors (e.g., a
correlation between latent conscientiousness and education). Scalar invariance is established
when item intercepts are equal, and it enables comparisons of both latent and observed means
(e.g., a mean difference between high school and college graduates). Strict factorial invariance is
established when residual variances are equal across groups, and it enables comparisons of
observed variances and covariances (e.g., a correlation between conscientiousness scale scores
and education; Gregorich, 2006). Our planned analyses include differences in Big Five observed
means and covariances (e.g., with age). Strict factorial invariance most fully supports these
analyses, though this is often considered too strict a test of measurement quality (Nye &
Drasgow, 2011), and so our approach will include a pragmatic assessment of its impact.
To our knowledge, measurement invariance of the Big Five across different categories of
SES has not been tested before, with one exception, where conscientiousness was shown to be
partially invariant across SES (Ludwig, Flournoy, & Berkman, 2019). However, there is a rich
literature on testing the measurement invariance across other variables, including nations
(Thalmayer & Saucier, 2017), US states (Gebauer et al., 2014), age groups (del Barrio, Carrasco,
& Holgado, 2006), cohorts (Borghuis et al., 2017), genders (Marsh et al., 2010), and ethnicity
(Schmitt, Golubovich, & Leong, 2011). These studies provide mixed results in terms of the
measurement invariance of the Big Five, with several studies demonstrating configural and
metric, but not scalar (nor full) invariance across different groups (e.g., Vecchione, Alessandri,

7 THE BIG FIVE ACROSS SOCIOECONOMIC STATUS
& Barbaranelli, 2012). Furthermore, a number of studies found measurement invariance for only
a subset of the traits (e.g., Borghuis et al., 2017), and others were suggestive of partial invariance
(e.g., Marsh et al., 2010). Most directly relevant to the current study, prior work has
demonstrated differences in acquiescent responding across levels of education attainment (one
pillar of SES), which could lead to differences in item loadings, intercepts, and residuals
(Rammstedt, Goldberg, & Borg, 2010). These results point out the necessity of conducting a
measurement invariance analysis of the Big Five across SES categories prior to conducting
further analyses for which the interpretations are conditional on the quality and equivalence of
our measurement (Borsboom, 2006).
Associations Between Personality and Socioeconomic Status
Relationships between socioeconomic status and Big Five traits have been previously
reported across multiple studies. Positive associations have been observed between SES and
agreeableness and emotional stability (Chapman et al., 2009), as well as openness and
extraversion (Jonassaint et al., 2011). The bulk of the evidence to date, however, has centered on
the association of SES with conscientiousness and neuroticism.
Multiple longitudinal studies have linked conscientiousness and its facets to two
components of SES, educational achievement (Chamorro-Premuzic & Furnham, 2003; Noftle &
Robins, 2007) and occupational attainment (Judge, Higgins, Thoresen, & Barrick, 1999; Shiner,
Masten, & Roberts, 2003). Further, conscientiousness has been shown to moderate individual
SES over the life course, such that those high in conscientiousness from low-SES backgrounds
are more likely to experience socioeconomic mobility later in life than low-SES, low-
conscientiousness peers (Damian et al., 2015). Proposed mechanisms for the observed positive
trend between conscientiousness and SES include proclivity for long-term planning (Ludwig,
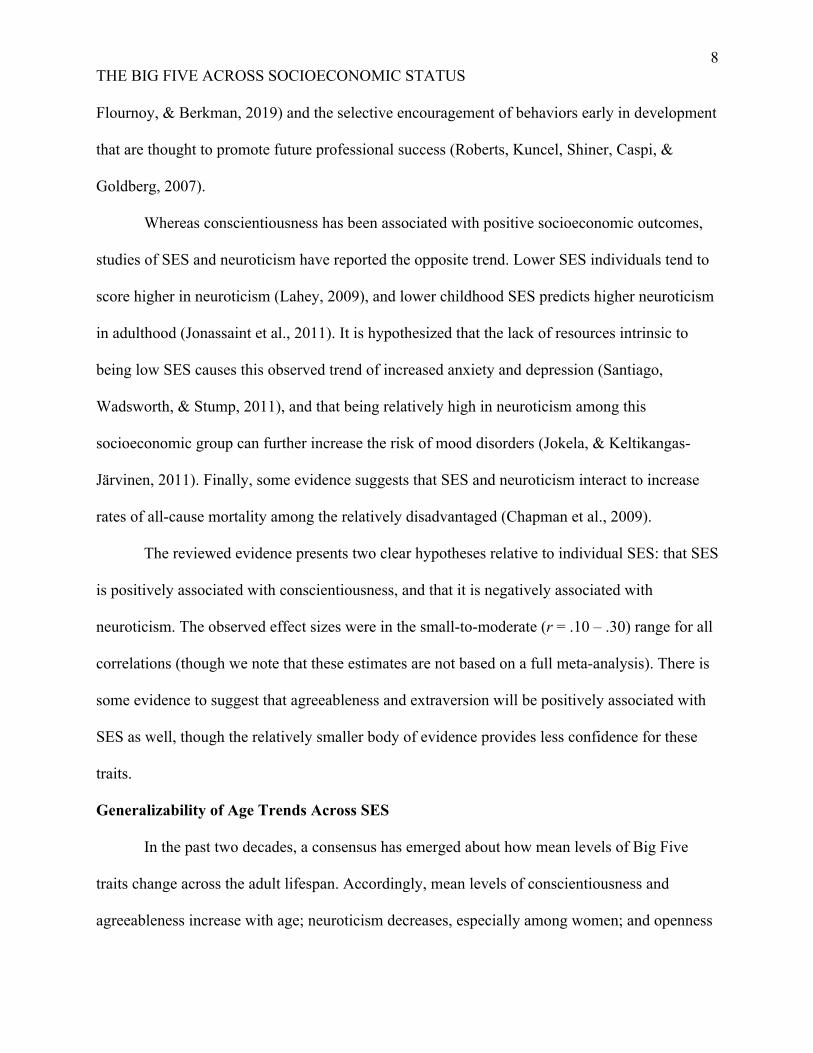
8 THE BIG FIVE ACROSS SOCIOECONOMIC STATUS
Flournoy, & Berkman, 2019) and the selective encouragement of behaviors early in development
that are thought to promote future professional success (Roberts, Kuncel, Shiner, Caspi, &
Goldberg, 2007).
Whereas conscientiousness has been associated with positive socioeconomic outcomes,
studies of SES and neuroticism have reported the opposite trend. Lower SES individuals tend to
score higher in neuroticism (Lahey, 2009), and lower childhood SES predicts higher neuroticism
in adulthood (Jonassaint et al., 2011). It is hypothesized that the lack of resources intrinsic to
being low SES causes this observed trend of increased anxiety and depression (Santiago,
Wadsworth, & Stump, 2011), and that being relatively high in neuroticism among this
socioeconomic group can further increase the risk of mood disorders (Jokela, & Keltikangas-
Järvinen, 2011). Finally, some evidence suggests that SES and neuroticism interact to increase
rates of all-cause mortality among the relatively disadvantaged (Chapman et al., 2009).
The reviewed evidence presents two clear hypotheses relative to individual SES: that SES
is positively associated with conscientiousness, and that it is negatively associated with
neuroticism. The observed effect sizes were in the small-to-moderate (r = .10 – .30) range for all
correlations (though we note that these estimates are not based on a full meta-analysis). There is
some evidence to suggest that agreeableness and extraversion will be positively associated with
SES as well, though the relatively smaller body of evidence provides less confidence for these
traits.
Generalizability of Age Trends Across SES
In the past two decades, a consensus has emerged about how mean levels of Big Five
traits change across the adult lifespan. Accordingly, mean levels of conscientiousness and
agreeableness increase with age; neuroticism decreases, especially among women; and openness

9 THE BIG FIVE ACROSS SOCIOECONOMIC STATUS
and extraversion change relatively little. This pattern has been documented in longitudinal
studies (Specht, Egloff, & Schmukle, 2011); cross-sectional studies (Soto et al., 2011;
Srivastava, John, Gosling, & Potter, 2003), and a meta-analysis (Roberts, Walton, &
Viechtbauer, 2006). The pattern has been described as a generalizable principle of development
(Roberts, Wood, & Caspi, 2008). We propose to test how well this pattern generalizes across
levels of SES.
Mean-level change findings have been interpreted through a variety of lenses by multiple
researchers, with different implications for generalizability. In their five-factor theory, McCrae
and Costa (2008) proposed the intrinsic maturation hypothesis, which held that these patterns
reflect endogenous development that is invariant across social environments (McCrae et al.,
1999; McCrae et al., 2000). Five-factor theory therefore implies that age trends in the Big Five
should be invariant across socioeconomic strata.
By contrast, Roberts et al. (2008) have described mean-level change as reflecting the
maturity principle: during adulthood, the average person’s personality changes to support them
becoming a more productive, steady, and prosocial member of society. A second principle, the
social investment principle, proposes a mechanism that drives these changes. According to the
social investment principle, changes in personality result from psychological commitments to
social institutions, such as work, family, and community. Through these role commitments,
people are exposed to new expectations and contingencies that shape their behavior. If
socioeconomic status is related to these role commitments and their normative timing, then
according to the social investment principle, the magnitude and possibly even direction of mean-
level change will vary as a function of socioeconomic class.

10 THE BIG FIVE ACROSS SOCIOECONOMIC STATUS
How do these broad principles translate into specific predictions about SES and age
trends in personality? In one test of the social investment principle, Bleidorn et al. (2013) studied
how nation-level differences in the timing of social roles that are linked to SES (e.g, marriage,
employment) were associated with age trends. Early normative timing of the completion of
education (used as a proxy for entering the workforce) was associated with more of a decrease in
neuroticism (a more negative slope) and more of an increase in conscientiousness (a more
positive slope). Early normative timing of family roles, as indicated by teen marriage rates, teen
birth rates, and mean age at first marriage, was associated with a more positive age slope for
openness. These national differences were interpreted as reflecting the social investment
processes that have been theorized to operate at an individual level.
The social role variables studied by Bleidorn et al. (2013) can be translated into
predictions for SES indicators. Timing of the completion of education is closely related to
educational attainment, a common status indicator, with higher SES reflecting later normative
completion of education. Marriage and family roles are also associated with socioeconomic
status. Education is associated with later normative age of marriage (Parker & Stepler, 2017;
Wang, 2018) and family socioeconomic status is associated with greater teen pregnancy
(Penman-Aguilar et al., 2013). Thus, applying the theoretical framework and findings of
Bleidorn et al. (2013), we can generate a prediction that higher socioeconomic status will be
positively associated with the age slope for neuroticism, negatively associated with the age slope
for conscientiousness, and negatively associated with the age slope for openness.
The Present Research
The goal of the present study is to better understand the relationship between SES and
personality by: (H1) testing if the BFI (John & Srivastava, 1999), a widely used personality
11 THE BIG FIVE ACROSS SOCIOECONOMIC STATUS
measure, is measuring the same constructs across economic groups using income, education,
occupational prestige, and occupational income as indicators of SES, (H2) estimating the
associations between Big Five traits and SES, in an economically diverse sample, to test if they
are consistent with previous findings, and (H3) test if the effect of the same four indicators of
SES on mean-level age trends in personality development are consistent with differences in
normative role timing.
We will test the following specific hypotheses for H2: (a) that the indicators of SES are
positively associated with conscientiousness, agreeableness, and extraversion, and (b) that the
indicators of SES are negatively associated with neuroticism. Based on the previously reviewed
literature we expect to observe correlations in the small-to-moderate (r = .10 – .30) range. In
addition to examining these bivariate relationships, using multiple regression, we will estimate
the unique relationship between three of the SES indicators, income, education, and occupational
prestige and each of the Big Five traits.
Based on normative role timing, we will test three specific hypotheses for H3: (a) that
SES will be positively associated with the age slope for neuroticism, (b) SES will be negatively
associated with the age slope for conscientiousness, and (c) SES will be negatively associated
with the age slope for openness. In cross-sectional data such as in the present study, mean-level
differences can also reflect cohort effects (Schaie, 1965). Convergence between cross-sectional
and longitudinal approaches, the latter of which are unaffected by cohort, has largely led
personality psychologists to interpret differences as reflecting age effects (Roberts et al., 2006).
However, we will also consider the possibility of cohort main effects or cohort-by-SES
interactions in interpreting the results.

12 THE BIG FIVE ACROSS SOCIOECONOMIC STATUS
Method
Participants and Procedure
Data for this study comes from the Attitudes, Identities, and Individual Differences study
(AIID; Hussey, Hughes, & Nosek, 2018). AIID was a large-scale (N ≈ 200,000) study that was
run on the Project Implicit website between 2004 and 2007. AIID participants were asked to
complete demographic measures, including indicating their occupation, income, and educational
attainment. In a planned missingness design, each AIID participant also completed a randomly
selected set of individual-difference items. Two of the subsets included items from the Big Five
Inventory (BFI; John & Srivastava, 1999). As a result of this design, the effective N for the
present analyses will be smaller than the full AIID dataset.
Exclusion Criteria. We will initially screen participants from the AIID data and only
include those who reside in the United States, completed one of the two BFI subsets
(Agreeableness and Openness or, Extraversion, Conscientiousness, and Neuroticism), and did
not select “unemployed” as their occupation. We will exclude “unemployed” individuals from
the analyses for several reasons. First, being unemployed is a transient state, and without further
information it is impossible to differentiate between short-term versus long-term unemployment,
voluntary versus involuntary unemployment versus retirement, etc. Second, it is difficult to
interpret self-reported income for individuals who select “unemployed” (e.g., given ambiguity in
the instructions, some participants may have significant part-time or investment income, whereas
others may have no current income but report a salary from their last job). Third, for these
reasons we did not believe it would be valid to derive occupational indices for the “unemployed”
category, which would leave unemployed participants missing on those variables. For analyses
including the income measure, we will also exclude participants who indicated “don’t know’
13 THE BIG FIVE ACROSS SOCIOECONOMIC STATUS
because for our analysis this response is equivalent to missing data. We will use all available
data for each analysis (pairwise deletion), which will result in a different number of participants
for each analysis.
For the measurement invariance analysis, we will include participants who indicated
“student” as their occupation as a reference category, since a substantial amount of the evidence
for the Big Five Inventory’s validity comes from student samples (John & Srivastava, 1999).
For the Big Five and SES relationship (H2) and the age trend analysis (H3), we will exclude
students and those under 25 in order to focus on the effects for individuals that are more likely to
have completed their educations (making the “education” variable less transient and more
indicative of social position), entered the workforce, and established an occupation.
Measures
Following recent recommendations for SES measurement (Diemer et al., 2013), we will
use three indicators of SES: educational attainment, income, and occupational prestige. In
addition, because of concerns about lack of fidelity in the AIID income measure, we will
calculate an additional indicator of SES, occupational income.
Educational attainment. AIID participants reported their educational attainment.
Different versions of the AIID questionnaire used slightly different sets of categories, so some of
the categories in the analyses reflect combinations of categories from different versions. In
addition, the “Not a high school graduate” had too few participants after exclusions, so we
combined it with “High school graduate” to create a “No college” category. The final education
categories for the analyses are: “No college,” “Some college or associate’s degree,” “Bachelor’s
degree,” and “Graduate degree or graduate education.” For correlation and regression analyses,

14 THE BIG FIVE ACROSS SOCIOECONOMIC STATUS
these categories will be assigned the numbers 1-4 respectively and entered into the models as a
continuous variable.
Income. Participants self-reported their household income by selecting one of the
following five categories: less than $25,000; $25,000 to $49,999; $50,000 to $74,999; $75,000 to
$149,999; greater than $150,000; and “don’t know.” For correlation and regression analyses,
“don’t know” responses will be excluded and the remaining categories will be assigned to the
numbers 1-5, respectively, and entered into the models as a continuous variable.
Occupational prestige. Respondents were asked to indicate their occupation by selecting
one of 98 job categories, including “student,” that most closely matched their current occupation,
or could indicate that they were unemployed. These 98 categories were derived by combining
similar job titles from the roughly 1,000 job titles in the U.S. Department of Labor/Employment
and Training Administration (USDOL/ETA) O*NET occupational data, which is a government
database that includes a list of job titles and associated characteristics.
To calculate the prestige scores for these 98 job categories, we begin with the prestige
scores for all of the O*NET job titles collected in a study of people’s ratings of the prestige of
various occupations (Hughes, Srivastava, Leszko, Condon, & Condon, n.p.). The prestige score
for each job title represents the average ratings of the prestige of that job title from a minimum of
150 unique judges. The occupational prestige scores for each of the 98 AIID job categories will
be the average of the prestige for the job titles within the category. For example, if a participant
selected “Operations Management,” their occupational prestige ratings would be the average of
the prestige ratings of the 20 job titles within this category (e.g., financial managers, purchasing
managers, human resource managers).

15 THE BIG FIVE ACROSS SOCIOECONOMIC STATUS
Occupational income. The income categories in the AIID study appear too broad to
capture the effects of interest. For example, the range from $25,000 - $50,000 may capture both
individuals who are living in poverty and those from lower-middle class homes. In addition, self-
reported income is commonly misreported by participants (Epstein, 2006). To address these
concerns, we will calculate a continuous occupational income score using national average
income data from O*NET. Occupational income scores for the 98 job categories will be
calculated in the same manner as prestige, by averaging the yearly income for each of the job
titles within the category. Because this data was collected from 2004 to 2007, we will use the
O*NET data for 2007 estimated average annual income for each of the job titles.
Personality traits. Big Five personality traits were assessed with items from the Big Five
Inventory (BFI; John & Srivastava, 1999). As part of the planned missingness design of the AIID
study, participants did not complete the entire BFI. Instead, a subset of AIID participants were
randomly assigned either one of two subsets of BFI items: one subset contained the
Agreeableness and Openness items; the other subset contained Extraversion, Conscientiousness,
and Neuroticism items. Responses were on a 6-point Likert scale, with 1 anchored with “strongly
disagree” and 6 anchored with “strongly agree.” The reversed keyed items in the BFI have
already been reverse scored in the AIID data. Therefore, to calculate traits scores, we will
average the items for that trait.
Analysis Plan
Inference Criteria
For H1 analyses, our interpretations and decisions will be based on fit indices; we discuss
these considerations in greater detail below. For H2 and H3 analyses, we will calculate effect
sizes (correlation and regression coefficients) and 95% confidence intervals, and we will base

16 THE BIG FIVE ACROSS SOCIOECONOMIC STATUS
our interpretations on those statistics. In addition, we will calculate p-values. Following the
recommendations of Benjamin et al (2018), we will interpret p <. 005 as “significant” and p <
.05 as “suggestive.” Given the large number of hypotheses to be tested, we have adopted this
conservative approach to interpreting p-values reduce the change of over-interpreting
unreplicable effects.
Measurement Invariance (H1)
We will examine measurement invariance across educational attainment, income,
occupational income, and occupational prestige separately for each of the Big Five domains,
resulting in a total of 20 sets of measurement invariance analyses. The correlation between
occupational prestige and occupational income is substantially larger (r = .74) than between any
of the other indicators of SES (next largest r = .50). This relationship may be artificially inflated
because both are based on the same aggregated occupation codes, but income and prestige are
conceptually distinct. For example, there are prestigious occupations (e.g., teachers) that have
low income and there are low prestige jobs (e.g., sanitation workers) that have high incomes. We
acknowledge that the measurement invariance analyses conducted with each of these
occupational indicators of SES are unlikely to produce different results. However, because it is
common practice for researchers to select a single indicator of SES for analysis it is important to
assess invariance across both occupational measures.
Testing for measurement invariance across the continuous SES indicators requires
splitting the respondents into discrete groups (Gregorich, 2006). The educational attainment and
income measures collected in the AIID study each had five response choices. The educational
attainment responses included a small number of participants in both the “not a high school
graduate” and “high school graduate” categories. We combined these categories into a “no

17 THE BIG FIVE ACROSS SOCIOECONOMIC STATUS
college” category and will test for invariance across this category and the three remaining
responses. The income measure had an adequate number of participants in each response choice
so we will consider each response choice a group and test for invariance across them. Unlike
these “naturally” occurring response choice groups, the occupational measures are continuous
and normally distributed (see Figure 1). We examined the distributions of occupational prestige
and occupational income in both the exploratory and masked data and considered dividing them
in a number of different ways, including tertile splits and by standard deviation. Figure 1 shows
that dividing the data (both the exploratory and masked) into even tertiles results in individuals
who clearly belong in the middle group being assigned to both the high and low groups. Dividing
participants one standard deviation above and below the mean, instead of splitting the data into
even groups, addresses this issue without relying on the idiosyncrasies of this data to determine
groups. Based on these distributions, we will split the occupational variables, prestige and
income, into three groups with low, medium, and high scores. Using standard deviations in this
way means that the medium group will have more participants, and the “low” and “high” groups
will be more extreme than they would be with an evenly spaced tertile split. In our judgment,
informed in part by observing where these cutpoints fell in the data, this approach fits better with
the everyday meaning of low and high standing in socioeconomic hierarchies.

18 THE BIG FIVE ACROSS SOCIOECONOMIC STATUS
Figure 1. Distribution of occupational prestige and income scores with tertile and standard
deviation splits.
Each of the Big Five will be fit as a single latent variable with all of the corresponding
items treated as indicators; for example, extraversion will be modeled as a latent variable with
the eight BFI extraversion items as its indicators. For each comparison, we will first fit an
unrestricted model that allows each group to have its own measurement mode, assuming only
configural invariance (i.e., that the items on an a priori scale have a one-factor structure). We
will then examine metric, scalar, and strict factorial invariance by assessing the decrement in fit
in increasingly constrained, nested models produced by setting the loadings, intercepts, and
residual variances equal across groups respectively. We will assess the magnitude of invariance
by calculating effect sizes created by Nye and Drasgow (2011), which provide item- and scale-
level estimates of the impact of differences in item loadings and intercepts across groups. Models

19 THE BIG FIVE ACROSS SOCIOECONOMIC STATUS
will be fit using the lavaan package (version ≥ 0.6.4; Rosseel, 2012) in R (version ≥ 3.6.1; R
Core Team, 2019) and we will use the dmacs package (version ≥ 0.1.0; Dueber, 2019) to
calculate the effect sizes.
We will evaluate measurement invariance by comparing model fit indices and the effect
sizes developed by Nye and Drasgow (2011). For fit indices, we will use change in McDonald’s
Noncentrality Index (∆MFI; as recommended by Kang, McNeish, and Hancock (2016), change
in Root Mean Squared Error of Approximation (∆RMSEA), and change in Akaike Information
Criterion (∆AIC); however, we will base our interpretations most heavily on ∆MFI if the different
fit measures are in conflict. We will also use the three effect sizes proposed by Nye and Drasgow
(2011). The first is an item-level effect size called dMACS that represents the extent of invariance
in the loadings and intercepts (together) of each item in a scale on a metric designed to be similar
to Cohen’s d; the empirically-derived benchmarks for small, medium, and large effects for dMACS
are .20, .40, and .70 respectively (Nye, Bradburn, Olenick, Bialko, Drasgow, 2019). In addition
to item-level dMACS, there are two scale-level estimates that capture the practical consequences of
measurement invariance on observed scale scores. They are ΔMean and ΔVar which correspond to
expected differences in observed means and variances (respectively) due to measurement
invariance (Nye & Drasgow, 2011; see also Clark et al., 2016) .
Interpretation can be based on fit indices in a continuous and calibrated way, and several
authors caution against using hard thresholds when not necessary (Kang et al., 2016; Nye &
Drasgow, 2011). However, thresholds are often needed for behavioral decisions; one such
decision is whether to proceed with analyses using an a priori scale, or to drop differentially
functioning items in order to produce an invariant scale. Regardless of the results of the
measurement invariance analyses, we will conduct the remaining analyses (for H2 and H3) with

20 THE BIG FIVE ACROSS SOCIOECONOMIC STATUS
a priori Big Five scale scores. In addition, if any Big Five scale(s) show a ∆MFI value greater
than .01 from configural to metric invariance or metric to scalar invariance and a ΔMean
greater than .20, we will attempt to construct invariant scales based on a subset of items, guided
principally by items’ dMACS (i.e., by dropping items with high dMACS). We will then report
results for the invariant scale(s) alongside the a priori scales and calibrate our interpretations
accordingly. The choice of a ∆MFI value of .01 as a cutoff is based on the recommendation of
Kang et al. (2016) and the choice of a ΔMean of .20 is based on practical considerations (i.e.,
that a difference of at least 0.20 on a likert scale mean is non-negligible).
Selecting the reference indicator. When pursuing a partial invariance model, the choice
of the reference indicator becomes consequential, as using a non-invariant reference indicator
might change the outcome of the measurement invariance analyses (Yoon & Millsap, 2007).
Based on simulation studies investigating measurement invariance across two groups, with
balanced sample sizes, Jung and Yoon (2017) recommend choosing the item with the smallest
modification index as the reference indicator. Although the present research will test for
invariance across more than two groups, with uneven group sizes, which makes Jung and Yoon’s
(2017) recommendations not directly applicable, the logic behind choosing the item with the
smallest modification index as the reference indicator is reasonable. Accordingly, if we find
evidence of non-invariance or partial invariance for any of the models, we will use the following
steps to select the reference indicator: 1) run a full invariance model, 2) calculate the mean of
modification indices for each indicator, and 3) select the indicator with the smallest mean of
modification indices as the reference indicator.
In addition to testing measurement invariance, we will look at the structural invariance
of the Big Five by determining the extent to which factor correlations vary across groups. As

21 THE BIG FIVE ACROSS SOCIOECONOMIC STATUS
noted above, participants completed one of two subsets of Big Five items, meaning we can
observe four possible factor inter-correlations: Agreeableness-Openness, Extraversion-
Conscientiousness, Extraversion-Neuroticism, and Conscientiousness-Neuroticism. We will
assess structural invariance by examining changes in fit due to constraining these correlations to
be equal across groups, as well as by examining the magnitude of group estimates of each
available correlation.
Big Five and SES Indicators (H2)
We will test for the positive associations of SES with conscientiousness, extraversion,
and agreeableness, and the negative association with neuroticism, through a series of bivariate
correlations. We will calculate the correlations between the four measured indicators of SES and
the Big Five scale scores, resulting in twenty bivariate correlations of interest. We will conduct
this analysis using the psych package in R (version ≥ 1.8.12; Revelle, 2018). In addition, we will
regress each Big Five scale on education, self-reported income, and occupational prestige to
assess the distinctive contribution of each variable. Because occupational income and
occupational prestige are both based on the same item and are collinear in the exploratory data,
we will not use occupational income and occupational prestige together in the same regression
analyses.
Age Trends by Socioeconomic Strata (H3)
The H3 analyses will be conducted using linear regression models. We will analyze one
Big Five trait and one SES indicator at a time, resulting in 20 different models. Each model will
have a single Big Five trait regressed on age (mean-centered), an SES indicator (mean-centered),
and an age-by-SES interaction term.
22 THE BIG FIVE ACROSS SOCIOECONOMIC STATUS
The results of these models will include estimates of the main effect of age on
personality, a main effect of SES on personality, and an interaction effect between age and SES
on personality. We will report the main effects of age on personality and later discuss if the
observed age trends, controlling for SES, are consistent with previous findings. The main
outcome of interest in this analysis is the coefficient of the interaction term. A significant effect
for the interaction term will be interpreted as indicating that age trends in development for that
trait vary as a function of SES.
Missing Data Approach
The planned missingness design of the AIID study resulted in no participants responding
to all Big Five measures. Instead, participants were randomly assigned to one of 20 individual
difference measures. For participants assigned to Big Five measures, some provided responses to
two trait measures, agreeableness and openness, and others to three trait measures, extraversion,
conscientiousness, and neuroticism. We will calculate observed scales scores across completed
items and include participants who made one or more responses to trait items for any subsequent
analysis which includes that trait, unless they are excluded for other reasons. In addition, to
address missing data in the measurement invariance analysis (H1) we will estimate the models
using full information maximum likelihood (fiml).
For the correlation analysis (H2), we will use pairwise deletion. Although this approach
is generally not recommended it is acceptable if, as in this case due to the planned missingness
design, the data is missing at random (MAR; Rubin, 1976). For the correlation analyses in H2
we will use listwise deletion. For the age trends analysis, we will exclude participants who did
not provide a response to the dependent variable of interest for each regression model. This may
result in participants being excluded from one analysis and included in another. For example, if

23 THE BIG FIVE ACROSS SOCIOECONOMIC STATUS
an individual provided information about their income but not their education, they would be
included in the age trends regression model predicting income but not the model predicting
education.
Sample Size Considerations
The data for this study have already been collected. Due to the planned missingness
design, the subsets of the data that will be used for this analysis are considerably smaller than the
total AIID sample size. We will use all available data (after exclusions discussed earlier) for each
analysis, resulting in different sample sizes for each analysis.
In addition to the exploratory dataset, we had access to a masked version of the
confirmatory dataset that replaced all nonmissing responses with the number 1. Because of
uncertainty regarding whether the data underlying the 1s in the masked data would meet
exclusion criteria, we cannot calculate an exact sample size for each analysis based on currently
available information. However, estimating the sample sizes in the masked confirmatory data for
each analysis suggests that they will be sufficient for valid inferences. We detail these
considerations below:
H1 analyses. For the measurement invariance analyses, we used the masked
confirmatory data (all responses replaced in the data with a 1) to estimate the final sample size
for each analysis. Across all the SES indicators for each Big five trait, the estimated number of
participants in each group ranges from N = 227 to N = 1681 (see Tables 1 – 4 for specific
anticipated sample sizes and demographics for each analysis). Sample-size planning in structural
equation modeling (SEM), like that used in the measurement invariance analysis, is notably
complex. However, for this analysis, the fit measure we will use to assess invariance, MFI, is
robust to sample sizes larger than 100 (Kang et al., 2016) and the dMACS effect size, the metric we

24 THE BIG FIVE ACROSS SOCIOECONOMIC STATUS
will use to construct invariant scales, is relatively stable in smaller samples (>250; Nye et al.,
2019), supporting that we will have enough data to draw valid inferences.
Table 1
Sample Sizes and Demographics for H1 Measurement Invariance Analysis Across Occupational
Prestige
Trait N Age (SD) % female % white High
Occupational Prestige
Low Occupational
Prestige
Medium Occupational
Prestige
extra 2288 35.03 (11.93) .67 .76 299 308 1681
agree 2322 34.71 (11.95) .66 .76 323 364 1635
open 2307 34.68 (11.93) .66 .76 322 359 1626
consc 2284 34.97 (11.88) .67 .76 301 311 1672
neuro 2279 35 (11.89) .67 .76 299 309 1671
Note. The values in the Occupational Prestige categories reflects the N for each category.
Table 2
Sample Sizes and Demographics for H1 Measurement Invariance Analysis Across Occupational
Income
Trait N Age (SD) % female % white High
Occupational Income
Low Occupational
Income
Medium Occupational
Income
extra 2611 35.35 (11.88) .67 .76 477 462 1672
agree 2631 35.01 (11.85) .66 .77 468 525 1638
open 2617 34.98 (11.84) .66 .77 468 520 1629
consc 2609 35.31 (11.83) .67 .76 481 464 1664
neuro 2602 35.33 (11.83) .67 .76 478 460 1664
Note. The values in the occupational income categories reflects the N for each category

25 THE BIG FIVE ACROSS SOCIOECONOMIC STATUS
Table 3
Sample Sizes and Demographics for H1 Measurement Invariance Analysis Across Income
Trait N Age (SD) % female % white < 25 25 - 50 50 - 75 75 – 150 > 150
extra 3032 34.3 (12.49) .66 .76 537 761 580 820 334
agree 3033 33.91 (12.45) .66 .77 526 741 639 816 311
open 3013 33.88 (12.43) .66 .77 516 738 634 811 314
consc 3036 34.23 (12.45) .66 .76 536 762 581 821 336
neuro 3025 34.25 (12.45) .66 .76 533 762 579 814 337
Note. Income is in thousands of dollars. The values in the income categories reflects the N for
each category.
Table 4
Sample Sizes and Demographics for H1 Measurement Invariance Analysis Across Education
Trait N Age (SD) % female % white No college
Some college or
AA
Bachelor's degree
Graduate degree
extra 3393 33.29 (12.7) .67 .75 227 1228 1096 842
agree 3454 32.82 (12.6) .67 .76 278 1225 1057 894
open 3434 32.79 (12.59) .67 .76 275 1218 1051 890
consc 3393 33.25 (12.67) .67 .75 227 1230 1095 841
neuro 3389 33.25 (12.67) .67 .75 229 1226 1093 841 Note. The values in the education categories reflects the N for each category.
H2 analyses. For the correlation and regression analysis for H2, we anticipate there will
be from N = 1763 to N = 2192 participants per pairwise observations for each of our 20 planned
bivariate correlations, and between N = 1692 and N = 1714 participants (see Table 5) for each of
the 5 regression analyses. Correlations stabilize at ~250 observations (Schönbrodt & Perugini,
2013) and thus we anticipate that this analysis will afford adequate precision. We also conducted

26 THE BIG FIVE ACROSS SOCIOECONOMIC STATUS
a sensitivity analysis in G*Power (Faul, Erdfelder, Buchner, & Lang, 2009) to determine the
smallest effect the planned analyses could detect. The results indicated that a fixed linear
multiple regression model with three predictors (corresponding to 3 SES predictors), a sample
size of 1692, desired power of 95%, and an alpha level of .05 can detect a small effect (f2 = .01,
or approximately R = .10). Based on this sensitivity analysis, we concluded that the proposed
analysis are adequately sensitive to detect effects at the smaller end of the range of those
previously reported in the literature.
Table 5
Sample Sizes and Demographics for H2 Regression Analysis
Trait N Age (SD) % female % white
extra 1694 38.94 (10.53) .66 .76
agree 1692 38.85 (10.49) .66 .76
open 1714 38.36 (10.76) .66 .77
consc 1692 38.85 (10.49) .66 .76
neuro 1686 38.89 (10.48) .66 .76
H3 analyses. For the age trends in personality moderated by SES analysis, we
anticipate there will be from N = 1758 to N = 2191 participants (see Table 6) for each linear
regression model. A sensitivity analysis for a fixed linear multiple regression model, conducted
in G*Power (Faul, Erdfelder, Buchner, & Lang, 2009), indicated that a model with a sample size
of 2096, desired power of 95%, and an alpha of .05 could detect a small interaction effect (f2 =
0.007; equivalent to a ∆R2 = .007 when adding the interaction term to the model). This
demonstrates that the planned analyses will be sensitive to detect interaction effects of
meaningful size.

27 THE BIG FIVE ACROSS SOCIOECONOMIC STATUS
Table 6
Sample Sizes and Demographics for H3 Age Trends Moderated by SES Analysis
Trait SES Indicator N Age (SD) % female % white
extra Occ Prestige 1765 39.04 (10.59) .67 .76
extra Occ Income 2053 39.12 (10.56) .67 .76
extra Income 2213 39.16 (11.16) .66 .76
extra Education 2306 39.2 (11.21) .66 .76
agree Occ Prestige 1821 38.42 (10.81) .66 .77
agree Occ Income 2095 38.52 (10.7) .66 .78
agree Income 2225 38.62 (11.22) .65 .79
agree Education 2346 38.61 (11.24) .66 .78
open Occ Prestige 1809 38.38 (10.79) .66 .77
open Occ Income 2084 38.48 (10.7) .66 .78
open Income 2211 38.59 (11.21) .65 .79
open Education 2331 38.59 (11.24) .66 .78
consc Occ Prestige 1763 38.96 (10.55) .66 .76
consc Occ Income 2053 39.05 (10.53) .67 .76
consc Income 2214 39.07 (11.13) .66 .76
consc Education 2308 39.13 (11.17) .66 .76
neuro Occ Prestige 1758 39 (10.55) .66 .76
neuro Occ Income 2047 39.08 (10.51) .67 .76
neuro Income 2207 39.09 (11.12) .66 .76
neuro Education 2302 39.16 (11.17) .66 .76

28 THE BIG FIVE ACROSS SOCIOECONOMIC STATUS
Timeline
Pending in-principle acceptance, the anticipated timeline for completing stage two of the
registered report is 4 months. This reflects the time to receive the full dataset from the AIID
study team, run analyses, and write the results and discussion sections of the manuscript.
Exploratory Data
The complete AIID dataset was split into two datasets, one exploratory (~15%) and
one confirmatory (~85%). The purpose of this split was to provide researchers an opportunity to
use the exploratory data to generate hypotheses that they will subsequently test in the
confirmatory data set. However, the hypotheses proposed in this manuscript and that we will test
in the confirmatory data were not generated through exploratory analysis of the data, but were
instead based on prevailing, but mostly untested, hypotheses in the personality literature.
We used the exploratory data to visually inspect the distribution of SES indicators and
to determine the categories of occupational prestige and occupational income for use in the
measurement invariance analysis. The proposed analyses were also run in the exploratory data to
test for model convergence and fit. We do not report the results from these analyses here because
they did not inform our substantive hypotheses, were not preregistered, and are in a smaller
sample. However, we will make them available with the final report in supplemental material for
interested readers. We will consider the final analyses in the confirmatory data to be the
substantively informative ones.

29 THE BIG FIVE ACROSS SOCIOECONOMIC STATUS
References
Adler, N. E., Boyce, T., Chesney, M. A., Cohen, S., Folkman, S., Kahn, R. L., & Syme, S. L.
(1994). Socioeconomic status and health: the challenge of the gradient. American
Psychologist, 49(1), 15. http://dx.doi.org/10.1037/0003-066X.49.1.15
Benjamin, D. J., Berger, J. O., Johannesson, M., Nosek, B. A., Wagenmakers, E.-J., Berk, R., …
& Cesarini, D. (2018). Redefine statistical significance. Nature Human Behaviour, 2(1),
6–10. https://doi.org/10.1038/s41562-017-0189-z
Bleidorn, W., Hill, P. L., Back, M. D., Denissen, J. J. A., Hennecke, M., Hopwood, C. J., Jokela,
M., Kandler, C., Lucas, R. E., Luhmann, M., Orth, U., Wagner, J., Wrzus, C.,
Zimmermann, J., & Roberts, B. W. (in press). The policy relevance of personality traits.
American Psychologist.
Bleidorn, W., Klimstra, T. A., Denissen, J. J., Rentfrow, P. J., Potter, J., & Gosling, S. D. (2013).
Personality maturation around the world: A cross-cultural examination of social-
investment theory. Psychological Science, 24(12), 2530-2540.
https://doi.org/10.1177/0956797613498396
Borghuis, J., Denissen, J. J. A., Oberski, D., Sijtsma, K., Meeus, W. H. J., Branje, S., . . .
Bleidorn, W. (2017). Big Five personality stability, change, and codevelopment across
adolescence and early adulthood. Journal of Personality and Social Psychology, 113(4),
641-657. http://dx.doi.org/10.1037/pspp0000138
Borsboom, D. (2006). The attack of the psychometricians. Psychometrika, 71(3), 425-440. doi:
10.1007/s11336-006-1447-6
Bradley, R. H., & Corwyn, R. F. (2002). Socioeconomic status and child development. Annual
review of psychology, 53(1), 371-399. DOI: 10.1146/annurev.psych.53.100901.135233
30 THE BIG FIVE ACROSS SOCIOECONOMIC STATUS
Chamorro-Premuzic, T., & Furnham, A. (2003). Personality predicts academic performance:
Evidence from two longitudinal university samples. Journal of Research in
Personality, 37(4), 319-338. https://doi.org/10.1016/S0092-6566(02)00578-0
Chapman, B. P., Fiscella, K., Kawachi, I., & Duberstein, P. R. (2009). Personality,
socioeconomic status, and all-cause mortality in the United States. American Journal of
Epidemiology, 171(1), 83-92. doi: 10.1093/aje/kwp323
Clark, D. A., Listro, C. J., Lo, S. L., Durbin, C. E., Donnellan, M. B., & Neppl, T. K. (2016).
Measurement invariance and child temperament: An evaluation of sex and informant
differences on the child behavior questionnaire. Psychological Assessment, 28(12),
1646–1662. https://doi.org/10.1037/pas0000299
Conger, R. D., Conger, K. J., & Martin, M. J. (2010). Socioeconomic Status, Family
Processes,and Individual Development. Journal of Marriage and Family, 72(3), 685–
704. doi: 10.1111/j.1741-3737.2010.00725.x
Conger, R. D., Wallace, L. E., Sun, Y., Simons, R. L., McLoyd, V. C., & Brody, G. H. (2002).
Economic pressure in African American families: A replication and extension of the
family stress model. Developmental Psychology, 38(2), 179.
http://dx.doi.org/10.1037/0012-1649.38.2.179
Damian, R. I., Su, R., Shanahan, M., Trautwein, U., & Roberts, B. W. (2015). Can Personality
Traits and Intelligence Compensate for Background Disadvantage? Predicting Status
Attainment in Adulthood. Journal of Personality and Social Psychology, 109(3), 473–
489. DOI: 10.1037/pspp0000024
Diemer, M. A., Mistry, R. S., Wadsworth, M. E., López, I., & Reimers, F. (2013). Best Practices
in Conceptualizing and Measuring Social Class in Psychological Research. Analyses of

31 THE BIG FIVE ACROSS SOCIOECONOMIC STATUS
Social Issues & Public Policy, 13(1), 77–113. http://dx.doi.org/10.1111/asap.12001
del Barrio, V., Carrasco, M. A., & Holgado, F. P. (2006). Factor structure invariance in the
Children's Big Five Questionnaire. European Journal of Psychological Assessment,
22(3), 158-167. http://dx.doi.org/10.1027/1015-5759.22.3.158
Dueber, D. (2019). dmacs: Measurement Nonequivalence Effect Size Calculator. R package
version 0.1.0. https://CRAN.R-project.org/package=dmacs
Epstein, W. M. (2006). Response bias in opinion polls and American social welfare. The Social
Science Journal, 43(1), 99–110. https://doi.org/10.1016/j.soscij.2005.12.010
Faul, F., Erdfelder, E., Buchner, A., & Lang, A.-G. (2009). Statistical power analyses using
G*Power 3.1: Tests for correlation and regression analyses. Behavior Research Methods,
41, 1149-1160.
Flake, J. K., Pek, J., & Hehman, E. (2017). Construct Validation in Social and Personality
Research: Current Practice and Recommendations. Social Psychological and Personality
Science, 8(4), 370–378. https://doi.org/10.1177/1948550617693063
Gebauer, J. E., Bleidorn, W., Gosling, S. D., Rentfrow, P. J., Lamb, M. E., & Potter, J. (2014).
Cross-cultural variations in Big Five relationships with religiosity: A sociocultural
motives perspective. Journal of Personality and Social Psychology, 107(6), 1064-1091.
http://dx.doi.org/10.1037/a0037683
Gregorich, S. E. (2006). Do Self-Report Instruments Allow Meaningful Comparisons Across
Diverse Population Groups? Testing Measurement Invariance Using the Confirmatory
Factor Analysis Framework. Medical Care, 44(11), S78–S94. DOI:
10.1097/01.mlr.0000245454.12228.8f

32 THE BIG FIVE ACROSS SOCIOECONOMIC STATUS
Heckman, J. J., & Kautz, T. (2012). Hard evidence on soft skills. Labour Economics, 19(4), 451–
464. doi: 10.1016/j.labeco.2012.05.014
Hussey, I., Hughes, S., & Nosek, B. A. (2018). The implicit and explicit Attitudes, Identities,
and Individual Differences (AIID) Dataset. URL: https://osf.io/pnjwf/
John, O. P., & Soto, C. J. (2007). The importance of being valid: Reliability and the process of
construct validation. Handbook of Research Methods in Personality Psychology, 461–
494.
John, O. P., & Srivastava, S. (1999). The Big Five Trait taxonomy: History, measurement, and
theoretical perspectives. In Handbook of personality: Theory and research, 2nd ed (pp.
102–138). New York, NY, US: Guilford Press.
Jokela, M., & Keltikangas-Järvinen, L. (2011). The association between low socioeconomic
status and depressive symptoms depends on temperament and personality traits.
Personality and Individual Differences, 51(3), 302-308.
https://doi.org/10.1016/j.paid.2010.05.004
Jonassaint, C. R., Siegler, I. C., Barefoot, J. C., Edwards, C. L., & Williams, R. B. (2011). Low
life course socioeconomic status (SES) is associated with negative NEO PI-R personality
patterns. International Journal of Behavioral Medicine, 18(1), 13-21. DOI:
10.1007/s12529-009-9069-x
Judge, T. A., Higgins, C. A., Thoresen, C. J., & Barrick, M. R. (1999). The big five personality
traits, general mental ability, and career success across the life span. Personnel
psychology, 52(3), 621-652. http://dx.doi.org/10.1111/j.1744-6570.1999.tb00174.x
Jung, E., & Yoon, M. (2017). Two-step approach to partial factorial invariance: Selecting a

33 THE BIG FIVE ACROSS SOCIOECONOMIC STATUS
reference variable and identifying the source of noninvariance. Structural Equation
Modeling: A Multidisciplinary Journal, 24(1), 65-79.
Kajonius, P. J., & Carlander, A. (2017). Who gets ahead in life? Personality traits and childhood
background in economic success. Journal of Economic Psychology, 59, 164–170.
https://doi.org/10.1016/j.joep.2017.03.004
Kang, Y., McNeish, D. M., & Hancock, G. R. (2016). The Role of Measurement Quality on
Practical Guidelines for Assessing Measurement and Structural Invariance. Educational
and Psychological Measurement, 76(4), 533–561. doi: 10.1177/0013164415603764
Lahey, B. B. (2009). Public health significance of neuroticism. American Psychologist, 64(4),
241. doi: 10.1037/a0015309
Lang, F. R., John, D., Lüdtke, O., Schupp, J., & Wagner, G. G. (2011). Short assessment of the
Big Five: Robust across survey methods except telephone interviewing. Behavior
Research Methods, 43(2), 548-567. doi: 10.3758/s13428-011-0066-z.
Ludwig, R. M., Flournoy, J. C., & Berkman, E. T. (2019). Inequality in personality and temporal
discounting across socioeconomic status? Assessing the evidence. Journal of Research in
Personality, 81, 79-87. https://doi.org/10.1016/j.jrp.2019.05.003
Marsh, H. W., Lüdtke, O., Muthén, B., Asparouhov, T., Morin, A. J., Trautwein, U., &
Nagengast, B. (2010). A new look at the big five factor structure through exploratory
structural equation modeling. Psychological Assessment, 22(3), 471-491. DOI:
10.1037/a0019227
McCrae, R. R., & Costa, P. T. (2008). Empirical and theoretical status of the five-factor model of
personality traits. The SAGE handbook of personality theory and assessment, 1, 273-294.
http://dx.doi.org/10.4135/9781849200462.n13

34 THE BIG FIVE ACROSS SOCIOECONOMIC STATUS
McCrae, R. R., Costa, P. T., de Lima, M. P., Simões, A., Ostendorf, F., Angleitner, A., ... &
Chae, J. H. (1999). Age differences in personality across the adult life span: parallels in
five cultures. Developmental psychology, 35(2), 466. http://dx.doi.org/10.1037/0012-
1649.35.2.466
McCrae, R. R., Costa Jr, P. T., Ostendorf, F., Angleitner, A., Hřebíčková, M., Avia, M. D., ... &
Saunders, P. R. (2000). Nature over nurture: temperament, personality, and life span
development. Journal of Personality and Social Psychology, 78(1), 173.
http://dx.doi.org/10.1037/0022-3514.78.1.173
Noftle, E. E., & Robins, R. W. (2007). Personality predictors of academic outcomes: big five
correlates of GPA and SAT scores. Journal of Personality and Social Psychology, 93(1),
116-130. doi:10.1037/0022-3514.93.1.116
Nye, C. D., & Drasgow, F. (2011). Effect Size Indices for Analyses of Measurement
Equivalence: Understanding the Practical Importance of Differences Between Groups.
Journal of Applied Psychology, 96(5), 966–980. https://doi.org/10.1037/a0022955
Nye, C. D., Bradburn, J., Olenick, J., Bialko, C., & Drasgow, F. (2019). How Big Are My
Effects? Examining the Magnitude of Effect Sizes in Studies of Measurement
Equivalence. Organizational Research Methods, 22(3), 678–709.
https://doi.org/10.1177/1094428118761122
Parker, K., & Stepler, R. (2017). As US marriage rate hovers at 50%, education gap in marital
status widens. PEW Research Center.
Penman-Aguilar, A., Carter, M., Snead, M. C., & Kourtis, A. P. (2013). Socioeconomic
disadvantage as a social determinant of teen childbearing in the US. Public Health
Reports, 128(2_suppl1), 5-22. DOI: 10.1177/00333549131282S102

35 THE BIG FIVE ACROSS SOCIOECONOMIC STATUS
R Core Team (2019). R: A language and environment for statistical computing. R Foundation for
Statistical Computing, Vienna, Austria. URL https://www.R-project.org/.
Rammstedt, B., Goldberg, L. R., & Borg, I. (2010). The measurement equivalence of Big-Five
factor markers for persons with different levels of education. Journal of Research in
Personality, 44(1), 53–61. doi: https://doi.org/10.1016/j.jrp.2009.10.005
Revelle, W. (2018) psych: Procedures for Personality and Psychological Research, Northwestern
University, Evanston, Illinois, USA, https://CRAN.R-project.org/package=psych,
Version = 1.8.12.
Roberts, B. W., Walton, K. E., & Viechtbauer, W. (2006). Patterns of mean-level change in
personality traits across the life course: a meta-analysis of longitudinal
studies. Psychological bulletin, 132(1), 1. DOI: 10.1037/0033-2909.132.1.1
Roberts, B. W., Kuncel, N. R., Shiner, R., Caspi, A., & Goldberg, L. R. (2007). The power of
personality: The comparative validity of personality traits, socioeconomic status, and
cognitive ability for predicting important life outcomes. Perspectives on Psychological
Science, 2(4), 313-345. DOI: 10.1111/j.1745-6916.2007.00047.x
Roberts, B. W., Wood, D., & Caspi, A. (2008). The development of personality traits in
adulthood. Handbook of Personality: Theory and research, 3, 375-398.
Rosseel, Y (2012). lavaan: An R Package for Structural Equation Modeling. Journal of
Statistical Software, 48(2), 1-36. URL http://www.jstatsoft.org/v48/i02/.
Rubin, D. B. (1976). Inference and missing data. Biometrika, 63(3), 581–592.
https://doi.org/10.1093/biomet/63.3.581

36 THE BIG FIVE ACROSS SOCIOECONOMIC STATUS
Saegert, S. C., Adler, N. E., Bullock, H. E., Cauce, A. M., Ming Liu, W., & Wyche, K. F. Report
of the APA Task Force on Socioeconomic Status. American Psychological Association,
2006.
Santiago, C. D., Wadsworth, M. E., & Stump, J. (2011). Socioeconomic status, neighborhood
disadvantage, and poverty-related stress: Prospective effects on psychological syndromes
among diverse low-income families. Journal of Economic Psychology, 32(2), 218-230.
https://doi.org/10.1016/j.joep.2009.10.008
Schaie, K. W. (1965). A general model for the study of developmental problems. Psychological
Bulletin, 64, 92. https://doi.org/10.1037/h0022371
Schmitt, N., Golubovich, J., & Leong, F. T. (2011). Impact of measurement invariance on
construct correlations, mean differences, and relations with external correlates: An
illustrative example using Big Five and RIASEC measures. Assessment, 18(4), 412-427.
doi: 10.1177/1073191110373223
Schönbrodt, F. D., & Perugini, M. (2013). At what sample size do correlations stabilize? Journal
of Research in Personality, 47(5), 609–612. https://doi.org/10.1016/j.jrp.2013.05.009
Shiner, R. L., Masten, A. S., & Roberts, J. M. (2003). Childhood personality foreshadows adult
personality and life outcomes two decades later. Journal of personality, 71(6), 1145-
1170.
Specht, J., Egloff, B., & Schmukle, S. C. (2011). Stability and change of personality across the
life course: The impact of age and major life events on mean-level and rank-order
stability of the Big Five. Journal of Personality and Social Psychology, 101(4), 862. doi:
10.1037/a0024950.
37 THE BIG FIVE ACROSS SOCIOECONOMIC STATUS
Srivastava, S., John, O. P., Gosling, S. D., & Potter, J. (2003). Development of personality in
early and middle adulthood: Set like plaster or persistent change?. Journal of Personality
and Social Psychology, 84(5), 1041. http://dx.doi.org/10.1037/0022-3514.84.5.1041
Thalmayer, A. G., & Saucier, G. (2017). The questionnaire big six in 26 nations: Developing
cross‐culturally applicable big six, big five and big two inventories. European Journal of
Personality, 28(5), 482-496. http://dx.doi.org/10.1002/per.2094
Vecchione, M., Alessandri, G., & Barbaranelli, C. (2012). The five factor model in personnel
selection: Measurement equivalence between applicant and non-applicant
groups. Personality and Individual Differences, 52(4), 503-508.
http://dx.doi.org/10.1016/j.paid.2011.11.014
Wang, W. (2018, March 16). Early Marriage Has Fallen, Especially Among Those Without a
College Degree [Blog post]. Retrieved from https://ifstudies.org/blog/early-marriage-has-
fallen-especially-among-those-without-a-college-degree
Yoon, M., & Millsap, R. E. (2007). Detecting violations of factorial invariance using data-based
specification searches: A Monte Carlo study. Structural Equation Modeling, 14(3), 435-
463.

38 THE BIG FIVE ACROSS SOCIOECONOMIC STATUS
Contributions
Contributed to conception and design: BTH, CC, JP, PR, CBP, RML, SS
Contributed to analysis and interpretation of data: BTH, CC, JP, PR, CBP, RML, SS
Drafted and/or revised the article: BTH, CC, JP, PR, RML, CBP, JP, SS
Approved the submitted version for publication: BTH, CC, JP, PR, RML, CBP, SS
Competing interests
The authors have no competing interests.
Data accessibility statement
The AIID study data is managed by other researchers and we do not have control over its
public release.
Related Documents