NBER WORKING PAPER SERIES THE BENEFITS OF REDUCING GUN VIOLENCE: EVIDENCE FROM CONTINGENT-VALUATION SURVEY DATA Jens Ludwig Philip J. Cook Working Paper 7166 http://www.nber.org/papers/w7 166 NATIONAL BUREAU OF ECONOMIC RESEARCH 1050 Massachusetts Avenue Cambridge, MA 02138 June 1999 This paper was supported by a grant from the Joyce Foundation and written in part while the first author was visiting scholar to the Northwestern University / University of Chicago Joint Center for Poverty Research. We are indebted to the Johns Hopkins Center for Gun Policy and Research and NORC for the opportunity to make use of their annual gun survey. Thanks to Mark Cohen, Ted Gayer, Arlene Greenspan, Jay Hamilton, Steve Hargarten, David Hemenway, Joel Huber, Arthur Kellermann, Debby Leff, Will Manning, Ted Miller, John Mullahy, Terry Richmond, Seth Sanders, Bill Schwab, Kurt Schwabe, Kerry Smith, Daniel Webster, and seminar participants at the 1998 ASC and 1999 AEA meetings for helpful comments. Thanks to Bruce Lawrence and Bob Malme for help with the calculations. Any errors of fact or interpretation are those of the authors. All opinions expressed are those of the authors and not those of the National Bureau of Economic Research. © 1999 by Jens Ludwig and Philip J. Cook. All rights reserved. Short sections of text, not to exceed two paragraphs, may be quoted without explicit permission provided that full credit, including © notice, is given to the source.

Welcome message from author
This document is posted to help you gain knowledge. Please leave a comment to let me know what you think about it! Share it to your friends and learn new things together.
Transcript
NBER WORKING PAPER SERIES
THE BENEFITS OF REDUCINGGUN VIOLENCE: EVIDENCE FROM
CONTINGENT-VALUATION SURVEY DATA
Jens LudwigPhilip J. Cook
Working Paper 7166http://www.nber.org/papers/w7 166
NATIONAL BUREAU OF ECONOMIC RESEARCH1050 Massachusetts Avenue
Cambridge, MA 02138June 1999
This paper was supported by a grant from the Joyce Foundation and written in part while the first author wasvisiting scholar to the Northwestern University / University of Chicago Joint Center for Poverty Research.We are indebted to the Johns Hopkins Center for Gun Policy and Research and NORC for theopportunityto make use of their annual gun survey. Thanks to Mark Cohen, Ted Gayer, Arlene Greenspan, JayHamilton, Steve Hargarten, David Hemenway, Joel Huber, Arthur Kellermann, Debby Leff, Will Manning,Ted Miller, John Mullahy, Terry Richmond, Seth Sanders, Bill Schwab, Kurt Schwabe,Kerry Smith, DanielWebster, and seminar participants at the 1998 ASC and 1999 AEA meetings for helpful comments. Thanksto Bruce Lawrence and Bob Malme for help with the calculations. Any errors of fact or interpretationarethose of the authors. All opinions expressed are those of the authors and not those of the National Bureauof Economic Research.
© 1999 by Jens Ludwig and Philip J. Cook. All rights reserved. Short sections of text, not to exceedtwoparagraphs, may be quoted without explicit permission provided that full credit, including © notice, is givento the source.
Jens Ludwig and Philip J. CookNBER Working Paper No. 7166June 1999JELNo. D8,J17,H51
ABSTRACT
This paper presents the first attempt to estimate the benefits of reducing crime using the
contingent-valuation (CV) method. We focus on gun violence, a crime of growing policy concern
in America. Our data come from a national survey in which we ask respondents referendum-type
questions that elicit their willingness-to-pay (WTP) to reduce gun violence by 30 percent. We
estimate that the public's WTP to reduce gun violence by 30 percent equals $23.8 billion, or
$750,000 per injury. Our estimate implies a statistical value of life ($4.05 to $6.25 million) that is
quite consistent with those derived from other methods.
Jens Ludwig Philip J. CookGeorgetown Public Policy Institute Terry Stanford Institute of Public PolicyGeorgetown University Box 902453600 N St, NW, Suite 200 Duke UniversityWashington, DC 20007 Durham, NC [email protected] and NBER
I. INTRODUCTION
In 1996 a total of 14,037 people were killed as the result of gun assaults in the United
States, and perhaps another 70,000 or so were non-fatally wounded (CDC, 1999, Cook et a!.,
1999). Concern about gun violence has prompted a substantial policy response. For example, in
New York City, the elite Street Crimes Unit employs aggressive stop-and-search tactics to reduce
illegal gun carrying in high-crime neighborhoods (Bratton and Kobler, 1998). In St. Louis the
police seek parental consent to search homes and seize illegal firearms kept by teens (Rosenfeld
and Decker, 1996), while the Boston Gun Project targets illegal gun trafficking and gang
shootings (Kennedy, Piehl and Braga, 1996, Piehl, Kennedy and Braga, 1998). At the national
level, policies ranging from background checks for gun-show sales to an outright ban on
handguns are being actively considered.'
While at least some of these programs may be effective in reducing gun violence
(Blumstein and Rosenfeld, 1998), each imposes some cost on society in the form of additional
government expenditures and inconvenience to citizens. Identifying the optimal amount of
enforcement and regulatory activity to reduce gun violence requires cost-benefit analysis
(Becker, 1968, Stigler, 1970, Rottenberg, 1970), which in turn requires estimates for the benefits
of reducing gun injuries. Such estimates are also relevant for the lawsuits that a growing number
of cities have filed against the gun industry, and for proposals to increase the tax on firearms.
The present paper represents the first attempt to estimate the benefits of reducing crime
1 See Fox Butterfield, "Small-Print Provisions of Gun Bill Please Federal Officials Best,"New York Times, May 22, 1999, and "Handguns: Who Will Stand Up?" Editorial, WashingtonPost, April 28, 1999.
—1—
using the contingent-valuation (CV) method. Our focus on gun violence in particular is
motivated by the growing policy concern about this issue. We adopt the standard approach of
public economics and define the benefit of a public good as what society is willing to pay (WTP)
to achieve some change in the level of the good (Viscusi, 1992). The public good in question
here is freedom from the ex ante risk of victimization, with the attendant reduction in fear and
self-protection effort. This ex ante approach is appropriate for the decision problem facing
policymakers, who must decide whether to fund crime-control programs that reduce future
crimes to anonymous victims.
In contrast, previous studies of the benefits of reducing gun violence have adopted an cx
post approach that begins with a count of the annual number of gunshot injuries and then
multiplies this figure by some estimate of the costs per injury.2 The primary limitation with this
framework is that it is incomplete, and ignores the costs that the risk of gun violence imposes on
even citizens who are not victimized. Much of this research has been conducted within the
public health 'cost-of-illness" (COT) tradition, which understates the cost per injury by focusing
only on the costs of medical treatment for gunshot injuries and other direct costs plus an
incomplete measure of lost productivity (Max and Rice, 1 993).3 More recent studies improve on
the COT approach by adding measures for the value of life and health obtained from the
2 Only a handful of studies have adopted an cx ante approach to evaluating the benefits ofreducing crime. All of these studies rely on hedonic-pricing methods to relate crime rates andhousing prices (Thaler, 1978, Hellman and Naroff, 1978, Rizzo, 1979). These estimates rely ondata from a single city, may confound the price effects of crime with other factors, and areincomplete. None of these studies focuses on gun violence specifically.
The COT approach defines lost productivity as foregone earnings plus the lost value ofhousehold work, which ignores all other forms of non-market production.
-2-

workplace-risk or jury-award literatures (Miller and Cohen, 1996, 1997, Miller Cohen and
Wiersema, 1996, Anderson, forthcoming), though even these studies still adopt an expost
framework.
The estimates presented in the current paper are obtained from a nationally representative
CV survey of 1,204 adults conducted in 1998. The survey elicits respondents' WTP to finance a
30 percent reduction in gun violence using a referendum-type CV question. The advantages of
our CV approach are that it yields comprehensive estimates for societal WTP, utilizes nationally
representative data, and allows a focus on a specific type of crime that is the subject of
considerable public-policy concern.
Our results suggest that a 30 percent reduction in gun violence is worth $23.8 billion to
the American public. Dividing this figure by the number of gunshot injuries in 1996 implies a
WTP per injury equal to around $750,000. Despite some limitations of the CV data used to
derive our estimates, these figures imply a value for one statistical life that is quite consistent
with those derived in other contexts (Viscusi, 1992, 1993).
The paper is organized as follows. The second section reviews the willingness-to-pay
approach and discusses the application of this method to the case of gunshot injuries. The third
section describes our data and the fourth presents the empirical results. The fifth section
discusses the implications of these findings.
II. THE WILLINGNESS-TO-PAY APPROACH
In this section we discuss the willingness-to-pay approach within the context of gun
violence, and then discuss different methods for estimating WTP.
-3-
A. Defining Willingness-to-Pay
Under the traditional benefit-cost framework of public economics, the benefits of a
violence-reduction program consists of the sum of the values that citizens are willing to pay
(WTP) to fund some program or policy that reduces the risk of injury. We assume that
individual WTP to support a program to reduce gun violence is motivated by three factors.
First, the individual may attach some value to the reduction in risk of being shot.
Second, she may value the reduction in risk to other members of her household. Becausewe assume that individuals value the well-being of others in the household and becausehouseholds pool income, we follow Manning et al. (1991) and treat households as theeconomic unit of interest.
Finally, she may receive some financial gain from reductions in the number of gunshotinjuries to strangers, since some of the relevant costs are shared across members of thecommunity through government programs and private insurance. Further, she maybenefit from a general improvement in the quality of life in the community, as a reducedthreat of being caught in the cross fire engenders more socializing.
Total social WTP is defined as the sum of what each individual household is willing to
pay. As a practical matter, whether financial and other externalities are actually reflected in
people's survey responses or market behaviors is not clear. Consumers may have imperfect
information about the external costs associated with injuries to others, or may simply not
consider these costs. While analysts could in principle directly measure the financial
externalities associated with gunshot injuries and add this to the results of a CV survey, the net
effect of financial and other externalities is unlikely to be a simple addition of these factors.
B. Measuring WTP
One way to measure societal WTP for programs that reduce health risks is to examine
marketplace behavior. For example, a widely used approach is to examine the extra wage
-4-
compensation that workers require in order to take risky jobs; these wage premiums reflect the
price of some health risk in the labor market.4 Another possibility is to examine variations in the
prices of housing5 or other consumer goods6 related to health risks to estimate the value that
people attach to risk reduction. These measures are in principle incomplete and in practice
difficult to implement due to the possibility of unobservables correlated with both prices and
risks.
When market behavior cannot be directly examined to estimate societal WTP for a public
good, the preferred method, known as "contingent valuation (CV)," is to survey a representative
group of respondents about how much they would be willing to pay. A 1992 panel sponsored by
the National Oceanic and Atmospheric Administration (NOAA) outlined the key components of
a CV study that would maximize the likelihood of producing reliable results (Arrow et a!., 1993),
which include the use of referendum formats that ask respondents to vote on a hypothetical
government program. The referendum format is deemed preferable to open-ended questions
because citizens have experience in casting such votes, and because the referendum format
minimizes incentives to free ride (Mitchell and Carson, 1989).
Whether even high-quality CV studies produce reliable estimates of WTP remains the
topic of ongoing debate. One concern stems from the tendency of survey respondents to present
themselves favorably to interviewers (Sudman and Bradburn, 1974), which produces social
See for example Smith and Gilbert (1985), Moore and Viscusi (1988a,b, 1990a,b), andViscusi and Moore (1989).
See for example Gayer, Hamilton and Viscusi (1998).
6 For a comprehensive review see Viscusi (1993).
-5-
desirability bias or yea-saying. A related concern is the possibility that CV responses are
motivated more by the respondent's desire to "purchase moral satisfaction" rather than support
the provision of a defined quantity of some public good (Kahneman and Knetsch, 1992). Both
problems may manifest themselves in what is known as the "embedding effect," where the
respondent's WTP is independent of the quantity of the public good that is being provided.
The empirical evidence on the existence of embedding effects is mixed (see, for example,
Desvousges et a!., 1993 versus Balson et a!., 1990). Other studies provide support for the CV
method using experimental designs that compare reported with actual WTP, or by comparing CV
responses to estimated travel times to use parks and other public goods or to wage premiums
associated with health risks (Brookshire et a!., 1982, Viscusi and O'Conner, 1984, Brookshire
and Coursey, 1987, Smith, 1992, Hanemann, 1994). Yet the evidence on the CV method is not
unequivocal (Hausman, 1993, Diamond and Hausman, 1994).
III. CONTINGENT VALUATION SURVEY DATA
The 1998 National Gun Policy Survey (NGPS) is a nationally representative telephone
survey of 1,204 American adults conducted during the Fall of 1998 by the National Opinion
Research Center (NORC) at the University of Chicago. Interviews were conducted with one
adult per sampled household, with the adult chosen randomly via the most-recent-birthday
method. The response rate for the NGPS was 61 percent (see Kuby, Imhof and Shin, 1999).
After a series of questions asking about their attitudes towards government and various
current or proposed gun regulations, respondents are asked the following questions: "Suppose
that you were asked to vote for or against a new program in your state to reduce gun thefts and
illegal gun dealers. This program would make it more difficult for criminals and delinquents to
-6-
obtain guns. It would reduce gun injuries by about 30 percent, but taxes would have to be
increased to pay for it. If it would cost you an extra [$50 / $100! $200] in annual taxes would
you vote for or against this new program?' The amount of the tax increase that the respondent is
asked about, either $50, $100 or $200, is randomly determined by the survey software.
Respondents are then asked a follow-up where the dollar amount asked about in the initial
referendum question is either doubled or halved, depending on whether the respondent's initial
answer was positive or negative, respectively.
As noted earlier, we assume that respondents are reporting on the total dollar value that
their household would be willing to pay to fund this program, rather than reporting strictly on the
value that they themselves would pay. Our assumption is conservative in that if respondents are
in fact reporting on personal rather than household WTP, our estimates will understate total
societal WTP to fund the hypothetical reduction in gun crime.7
The empirical work presented below provides some support for the credibility of these
CV responses. For example, WTP is positively related to household income. We also find that
WTP increases with household size; since the reduction in risk the household experiences is
related to the number of members, this finding suggests that the responses are not driven entirely
by social desirability bias or moral satisfaction.
One implication of this assumption is that our analysis should convert the NGPSsampling weights from person weights into household weights. The NGPS respondent weightscalculated by NORC equal one divided by the probability of the household's selection into thesample. The weights are then divided by the adult's probability of selection from within thehousehold, equal to (1/A) where A is the number of adults in the home. To convert these intohousehold weights we multiply by (1/A).
-7-
IV. EMPIRICAL RESULTS
We begin by presenting a non-parametric estimate for WTP to reduce gun violence by 30
percent. This estimate does not impose any assumptions on the population distribution of WTP,
and suggests a WTP equal to $21.2 billion. We then present a more elaborate set of maximum-
likelihood estimates that are derived under alternative assumptions about the distribution of
WTP. Our preferred estimates suggest a societal WTP equal to $23.8 billion, equal to around
$750,000 per gunshot injury avoided.
A. Non-parametric Estimates
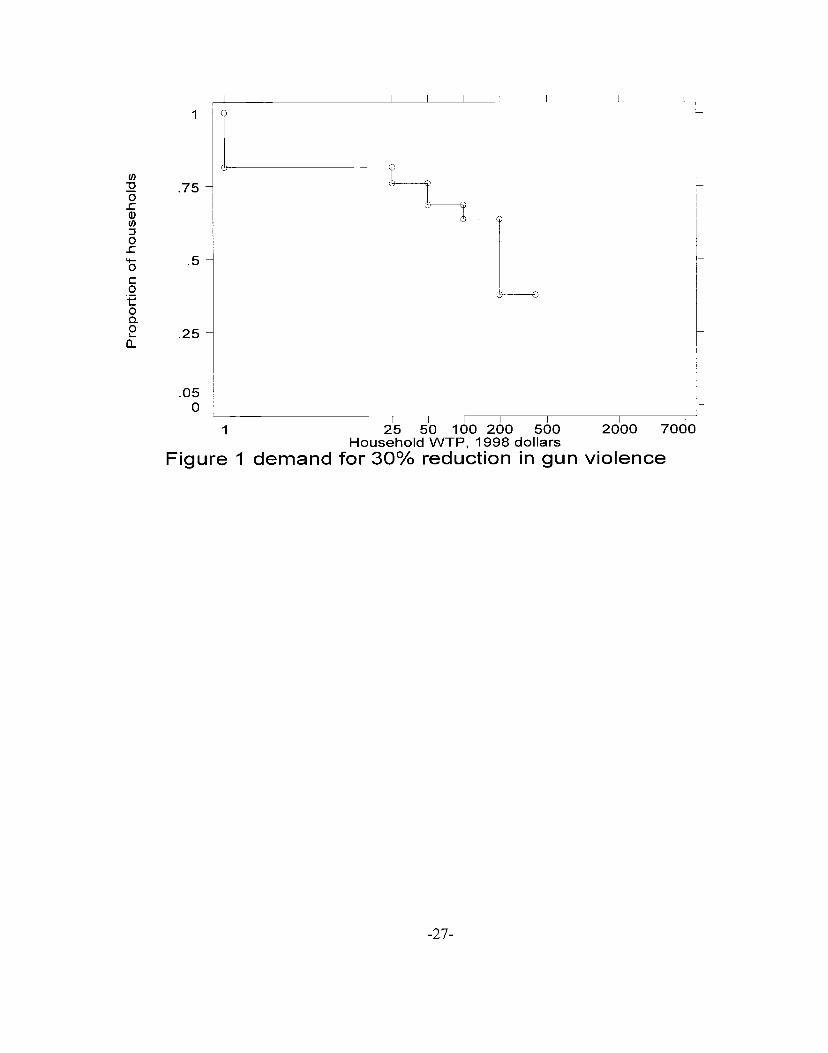
Table 1 presents the descriptive statistics from the NGPS data. The proportion of
respondents who vote to support the violence-reduction program decreases as the amount
required to fund the program increases, ranging from 76 percent at a cost of $50 more in annual
taxes to 38 percent at a cost of $400. Figure 1 provides a graphical representation of the
cumulative distribution function implied by these descriptive statistics.
If we integrate under the area shown in Figure 1 and multiply by the total number of
households in the U.S. — equal to 99.6 million in 1996 (U.S. Bureau of the Census, 1997) — we
obtain an estimated total WTP of $21.2 billion to reduce assault-related gunshot injuries by 30
percent. In these calculations we assign a WTP of $0 to those respondents who answer no to
both the first and follow-up CV questions, under the assumption that each individual's WTP to
reduce gunshot injuries must be non-negative. While some people may object to the specific
mechanism used to reduce gun injuries, presumably few people would be willing to pay to see
more Americans shot, and in any case it is not clear that such preferences should be given
standing in benefit-cost analyses. In order to convert this estimate into WTP per gunshot injury
-8-
avoided, we can divide total WTP by the estimated annual incidence of assault-related gunshot
woundings (106,000)8 multiplied by 30 percent. This suggests WTP per injury equal to
$667,000.
B. Parametric Estimates
The non-parametric estimate understates societal WTP because it does not interpolate the
underlying distribution between the CV bid values or extrapolate beyond the highest value used
in the survey. The non-parametric approach is also limited in that it only uses a fraction of the
information available with the CV data. In this section we develop refined estimates that use
maximum-likelihood methods to estimate societal WTP under a number of different
assumptions.
Our empirical strategy is based on the framework outlined by Cameron and James (1987)
and Cameron (1988). Let Y1 equal the (unobserved) WTP value that respondent (i) has in mind
when answering the first and second referendum questions in the NGPS. The respondent will
answer in the affirmative to the first referendum question (I=1) if the "price" of the program in
the form of higher taxes (t11) is not greater than the respondent's WTP (Y�t11). Similarly, the
respondent will support the program in the follow-up CV question (121=1) if the new price t2, is
less than WTP (Y1�t2), where t21 is equal to double t1 if 111=1 and half oft11 if I=0. We initially
assume that Y is log-normally distributed (equation 1), which constrains WTP to be positive.
8 The estimate is obtained by adding the 14,037 fatal gunshot assaults in 1996 to theestimated 73,096 non-fatal gun assaults that receive treatment in the ED (Cook et al., 1999). Toaccount for nonfatal gunshot injuries treated outside of the ED we estimate the ratio of nonfataldoctor's office- to ED-treated gunshot injuries (0.19) from the 1995-1996 National AmbulatoryMedical Care Survey and the ratio of untreated to ED-treated gunshot injuries (0.07) from the1987-1994 National Crime Victimization Survey.
-9-
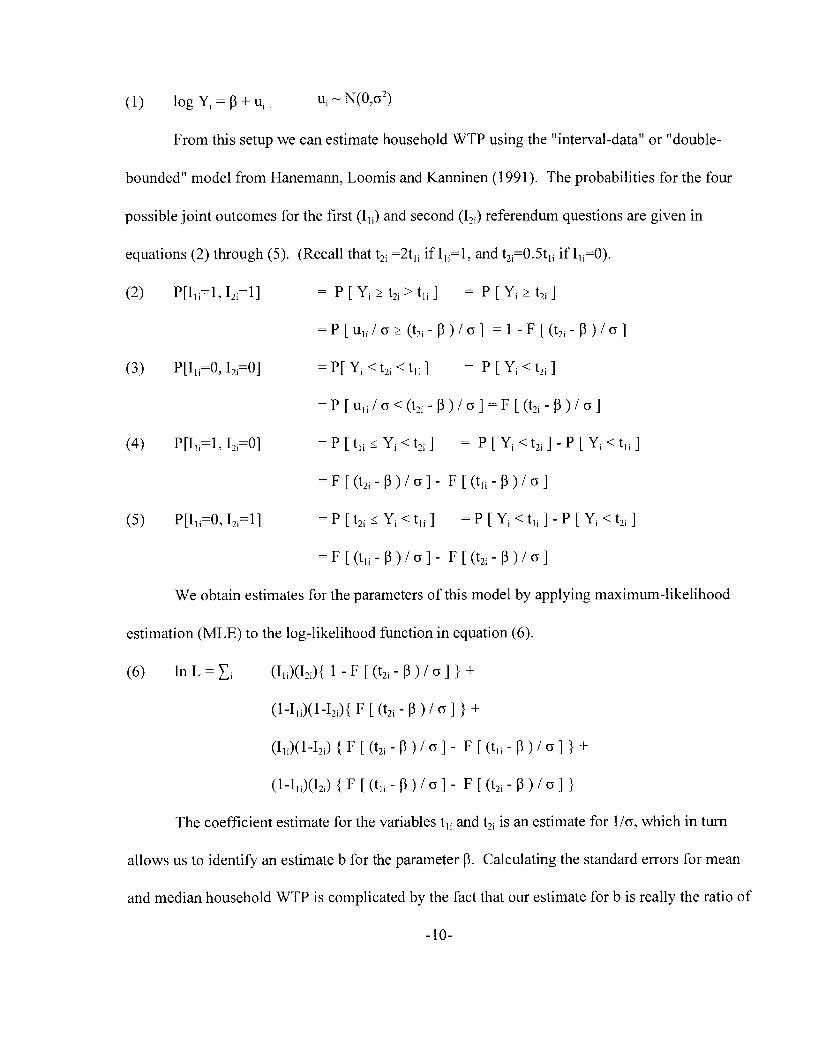
(1) logY1=13+u1. u1N(O,2)
From this setup we can estimate household WTP using the "interval-data" or "double-
bounded" model from Hanemann, Loomis and Kanninen (1991). The probabilities for the four
possible joint outcomes for the first (I) and second ('21) referendum questions are given in
equations (2) through (5). (Recall that t2, =2t11 if I=1, and t21=0.5t11 if 11=0).
= P [ Y, � t2 > t11 I
= P [ u11 / i � (t21 —
13
= P[ Y < t2, < t11 ]
= P [u1 / c < (t21-
= P [th � Y1 <t21 I
= F [(t21 - 13)! Q] -
= P [ t2, � Y, <t11 ]
= F [(t11 - 13)! ] -
P [Y, � t2 I
= 1 -F[(t21-13)I]
= P [Y1 <t21]
13)/G]=F [(t21-13)/
= P [Y1 <t2] - P
F [(t11 -13)' ]
=P[Y1 <t11]-P [Y1<t2]
F (t21 - 1 ) / c ]
(2) P[111=1, 121=1]
(3) P11111=0, 121=0]
(4) P[111=1, 121=0]
(5) P[111=O, 121h]
[ Yl < til I
We obtain estimates for the parameters of this model by applying maximum-likelihood
estimation (MLE) to the log-likelihood function in equation (6).
(6) in L = (II)(121){ 1 - F [ (t21— 13)! c ] } +
(l-I)(1-I2){ F [(t2 - 13)! ] } +
(I,1)(1-171){F[(t21-13)/Q]- F[(t11-13)/c]}+
(l-I1)(I2){F[(t11-13)/c]- F[(t21-13)/G]}
The coefficient estimate for the variables t1 and t21 is an estimate for hG, which in turn
allows us to identify an estimate b for the parameter 13. Calculating the standard errors for mean
and median household WTP is complicated by the fact that our estimate for b is really the ratio of
-10-

two estimates — the estimated value for 13I divided by an estimate for l/. Our method for
calculating standard errors is provided in the technical appendix. If w represents the NGPS
sampling weight for household (i), which equals the number of households in the population that
each sampled household represents, then estimated societal WTP is given by equation (7). While
b provides an unbiased estimate for the expected value of log WTP, for a log-normal variable the
mean of WTP itself will be given by exp(b)xexp(0.5o) as in equation (7) (Manning, 1998).
(7) Societal WTP = w xexp(b)xexp(0.5c2)
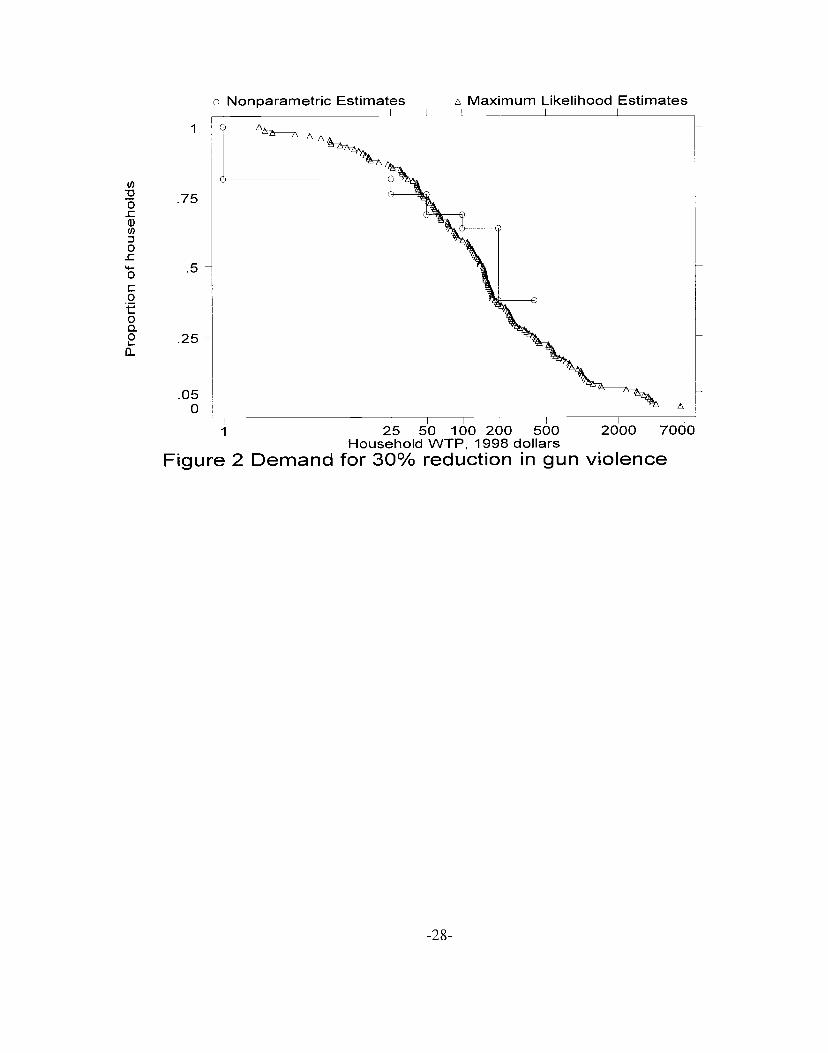
In Figure 2, we compare the cumulative distribution function for WTP implied by the
parametric estimates presented in Table 3 with the non-parametric function from Figure 1. The
MLE estimates imply mean and median household WTP equal to $203 and aggregate WTP equal
to $20.2 billion, or $635,000 per injury (Table 4). The parametric estimate does not exceed the
non-parametric figure as might be expected because the former uses data from both the first and
second CV questions, while the latter is based largely on responses to the first CV question.
We further refine our parametric estimates by calculating mean household WTP
conditional on a vector of household characteristics X1 that may affect the risk of gunshot injury,
attitudes towards risk, or ability to pay. In our empirical analysis the vector of household
variables includes income, household composition (the number of children under 6 or 6 to 17,
and the number of adults), household gun ownership, and race.9
As seen in Table 3, the coefficient estimates for these covariates provides some evidence
Since only 2.2 percent of all marriages were inter-racial in 1992, the last year for whichsuch data are available (U.S. Bureau of the Census, 1999), we infer "household race" from therespondent's race.
—11—
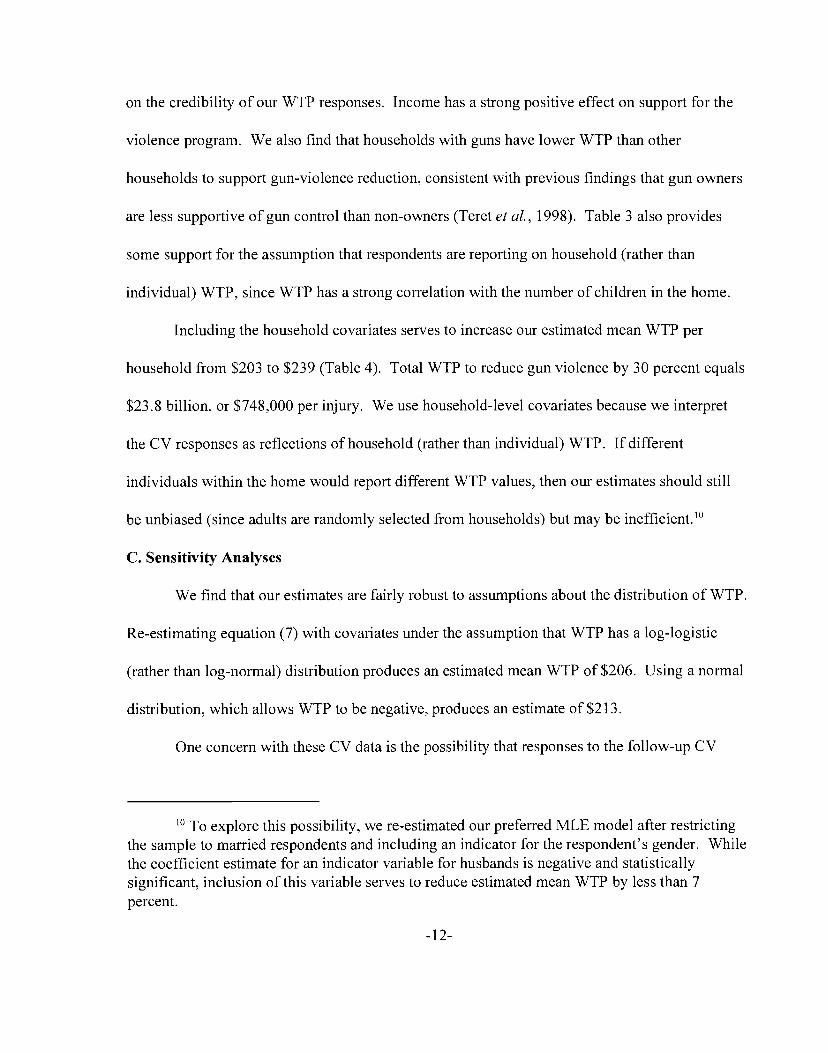
on the credibility of our WTP responses. Income has a strong positive effect on support for the
violence program. We also find that households with guns have lower WTP than other
households to support gun-violence reduction, consistent with previous findings that gun owners
are less supportive of gun control than non-owners (Teret et al., 1998). Table 3 also provides
some support for the assumption that respondents are reporting on household (rather than
individual) WTP, since WTP has a strong correlation with the number of children in the home.
Including the household covariates serves to increase our estimated mean WTP per
household from $203 to $239 (Table 4). Total WTP to reduce gun violence by 30 percent equals
$23.8 billion, or $748,000 per injury. We use household-level covariates because we interpret
the CV responses as reflections of household (rather than individual) WTP. If different
individuals within the home would report different WTP values, then our estimates should still
be unbiased (since adults are randomly selected from households) but may be inefficient,10
C. Sensitivity Analyses
We find that our estimates are fairly robust to assumptions about the distribution of WTP.
Re-estimating equation (7) with covariates under the assumption that WTP has a log-logistic
(rather than log-normal) distribution produces an estimated mean WTP of $206. Using a normal
distribution, which allows WTP to be negative, produces an estimate of $213.
One concern with these CV data is the possibility that responses to the follow-up CV
To explore this possibility, we re-estimated our preferred MLE model after restrictingthe sample to married respondents and including an indicator for the respondent's gender. Whilethe coefficient estimate for an indicator variable for husbands is negative and statisticallysignificant, inclusion of this variable serves to reduce estimated mean WTP by less than 7
percent.
-12-
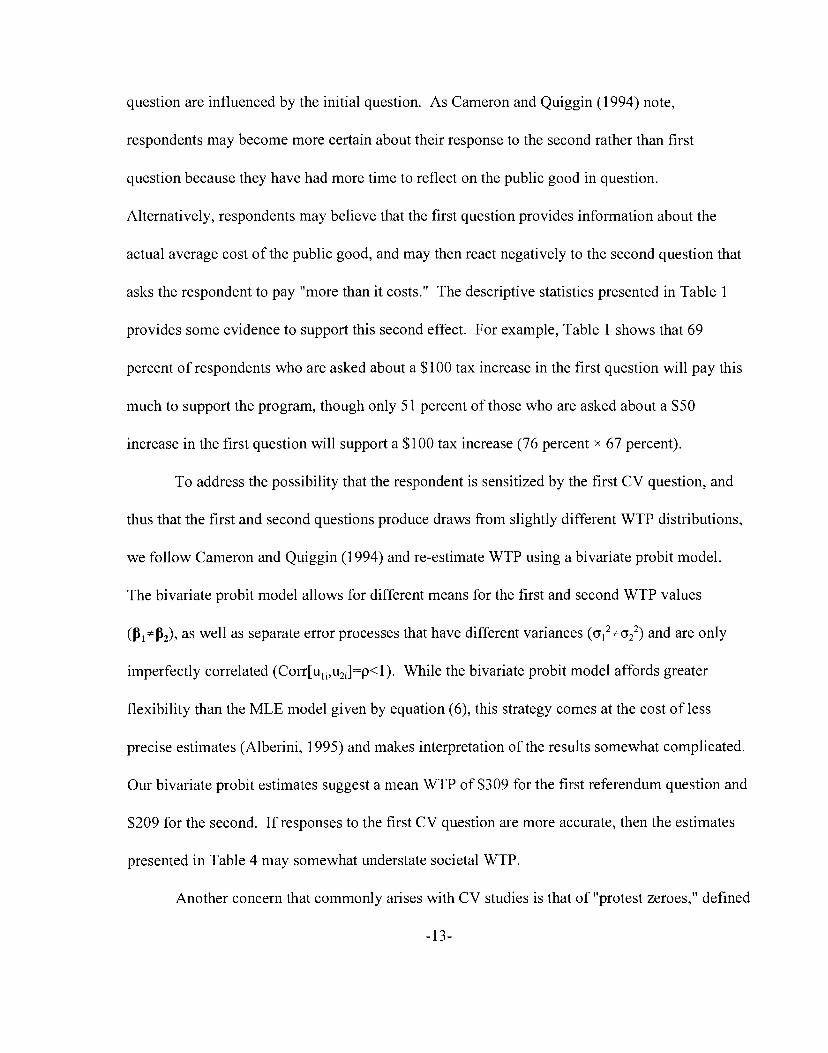
question are influenced by the initial question. As Cameron and Quiggin (1994) note,
respondents may become more certain about their response to the second rather than first
question because they have had more time to reflect on the public good in question.
Alternatively, respondents may believe that the first question provides information about the
actual average cost of the public good, and may then react negatively to the second question that
asks the respondent to pay "more than it costs." The descriptive statistics presented in Table 1
provides some evidence to support this second effect. For example, Table 1 shows that 69
percent of respondents who are asked about a $100 tax increase in the first question will pay this
much to support the program, though only 51 percent of those who are asked about a $50
increase in the first question will support a $100 tax increase (76 percent ><67 percent).
To address the possibility that the respondent is sensitized by the first CV question, and
thus that the first and second questions produce draws from slightly different WTP distributions,
we follow Cameron and Quiggin (1994) and re-estimate WTP using a bivariate probit model.
The bivariate probit model allows for different means for the first and second WTP values
as well as separate error processes that have different variances and are only
imperfectly correlated (Corr[u11,u21]=p<1). While the bivariate probit model affords greater
flexibility than the MLE model given by equation (6), this strategy comes at the cost of less
precise estimates (Alberini, 1995) and makes interpretation of the results somewhat complicated.
Our bivariate probit estimates suggest a mean WTP of $309 for the first referendum question and
$209 for the second. If responses to the first CV question are more accurate, then the estimates
presented in Table 4 may somewhat understate societal WTP.
Another concern that commonly arises with CV studies is that of "protest zeroes," defined
-13-

as cases in which the respondent rejects the hypothetical market scenario even though her true
WTP exceeds the stated "price" of the referendum (Mitchell and Carson, 1989). The proper
definition of protest zeroes is complicated in our application. Fairly uncontroversial is the case
of tax protestors — those respondents who object to financing the program out of tax revenues,
but who would be willing to pay the stated amount to achieve a 30 percent reduction in gun
violence if the program were financed by some other means. One possibility is to identify as tax
protesters the 24 percent of respondents who "strongly agree" with the survey question that
"taxes are too high." When we re-estimate our model without these respondents in the sample —
which is the preferred method for dealing with protesters (Freeman, 1993) —our estimate is only
13 percent higher than the $239 figure reported in Table 4.
More complicated are cases where the respondent objects to the mechanism for reducing
gun violence, rather than the mechanism for financing the program. The NGPS asks about
programs that target the illegal use or transmission of firearms, which in turn should reduce gun
violence holding the overall crime rate constant. Respondents who object to these interventions
should only be counted as protest zeroes if alternative interventions exist that could plausibly
reduce gun crime without reducing the overall crime rate, which is a debatable proposition. In
any case, we classify as intervention-protesters those who "strongly disagree" that "the
government should do everything it can to keep handguns out of the hands of criminals, even if it
means that it will be harder for law-abiding citizens to purchase handguns." Excluding these
respondents produces only a 7 percent increase in WTP compared with Table 4.
V. DISCUSSION
This paper presents the first attempt to estimate the demand for reductions in crime using
-14-
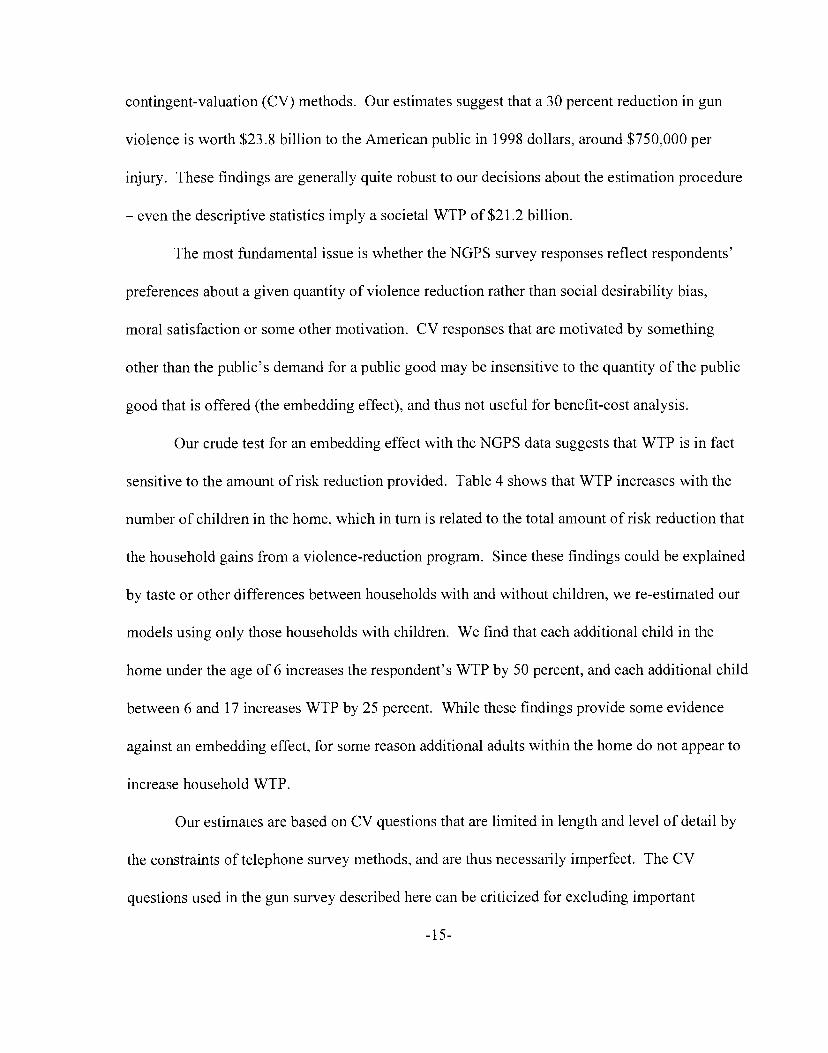
contingent-valuation (CV) methods. Our estimates suggest that a 30 percent reduction in gun
violence is worth $23.8 billion to the American public in 1998 dollars, around $750,000 per
injury. These findings are generally quite robust to our decisions about the estimation procedure
— even the descriptive statistics imply a societal WTP of $21.2 billion.
The most fundamental issue is whether the NGPS survey responses reflect respondents'
preferences about a given quantity of violence reduction rather than social desirability bias,
moral satisfaction or some other motivation. CV responses that are motivated by something
other than the public's demand for a public good may be insensitive to the quantity of the public
good that is offered (the embedding effect), and thus not useful for benefit-cost analysis.
Our crude test for an embedding effect with the NGPS data suggests that WTP is in fact
sensitive to the amount of risk reduction provided. Table 4 shows that WTP increases with the
number of children in the home, which in turn is related to the total amount of risk reduction that
the household gains from a violence-reduction program. Since these findings could be explained
by taste or other differences between households with and without children, we re-estimated our
models using only those households with children. We find that each additional child in the
home under the age of 6 increases the respondent's WTP by 50 percent, and each additional child
between 6 and 17 increases WTP by 25 percent. While these findings provide some evidence
against an embedding effect, for some reason additional adults within the home do not appear to
increase household WTP.
Our estimates are based on CV questions that are limited in length and level of detail by
the constraints of telephone survey methods, and are thus necessarily imperfect. The CV
questions used in the gun survey described here can be criticized for excluding important
-15-
information about the hypothetical interventions that respondents are asked to support, a problem
that plagues all CV studies to some degree. The NGPS questions do not specify the change in
risk to the respondent, although there is substantial heterogeneity in the risk of gunshot injury
within the population and a 30 percent reduction in gun injuries will imply somewhat different
changes for respondents according to their community's baseline risks. A related concern is that
the questions do not specify where the interventions will be targeted, and thus who will benefit
from the program, For example, what society will pay to reduce gun injuries to downtown office
workers may be different from what society will pay to reduce the number of gang shootings.
Despite the limitations of these CV survey data, our estimates for society's WTP to
reduce gun violence are remarkably consistent with previous estimates from wage-risk tradeoffs.
Deriving a value of statistical life from our CV results is complicated somewhat by the fact that
our question reflects WTP for both fatal and nonfatal gunshot injuries. If we start with the
extreme assumption that WTP is driven entirely by concern about fatal gunshot injuries, then
since we have shown that around 12 percent of assault-related gunshot injuries are fatal, our
preferred estimate of $750,000 per gunshot injury avoided implies a value per statistical life
equal to $6.25 million. But presumably part of WTP to reduce gun injuries is motivated by
concern about non-fatal gunshot injuries. If we assume that non-fatal gunshot injuries are twice
as undesirable as the average workplace injury, our estimates imply a value per statistical life of
$4.05 million." By way of comparison, studies of wage-risk tradeoffs produce estimates for the
This comes from multiplying twice the highest estimate for workplace injuries reportedin Viscusi (1993), around $300,000 in 1998 dollars, by the number of nonfatal gun injuries forevery fatality (7.33), and subtracting this figure ($2.2 million) from the estimated value of 8.33gun injuries ($6.25 million).
-16-

value of life (also in 1998 dollars) between $3.7 and $8.6 million (Viscusi, 1993).
We would expect societal WTP to be far smaller if citizens were concerned only about
reducing the risk of gun injury to themselves and members of their families. The reason is that
gunshot injuries in the U.S. are highly concentrated among a group of people who on average are
far less risk averse than are members of the general population. Two-thirds of all firearm
homicides in 1996 were to males between the ages of 15 and 39 (CDC, 1999), and three-quarters
of gun homicide victims under 21 in Boston in 1990-1994 had criminal records (Kennedy, Piehi
and Braga, 1996). Levitt and Venkatesh (1998) studied the records documenting the
opportunities and violence-victimization risks for members of a crack-dealing street gang:
Comparing the risk to the reward suggests that they placed a value on a statistical life ofjust
$55,000 on average. Our WTP estimates thus suggest that the benefits from reducing gun
violence in America are substantial, and accrue primarily to citizens at low personal risk of injury
through reductions in risk to others in the home, lower tax bills, or improvements to the overall
quality of community life.
-17-

REFERENCES
Alberini, Anna. (1995) "Efficiency vs Bias of Willingness-to-Pay Estimates: Bivariate andInterval-Data Models." Journal of Environmental Economics and Management. 29: 169-180.
Anderson, David A. (Forthcoming) "The Aggregate Burden of Crime." Journal of Law andEconomics.
Arrow, Kenneth et al (1993) "Report of the NOAA Panel on Contingent Valuation." FederalRegister. Washington, DC, January 15, 1993.
Balson, W.E. et al (1990) "Development and Design of a Contingent Valuation Survey forMeasuring the Public's Value for Visibility Improvements at the Grand Canyon National Park."
Working Paper.
Becker, Gary. (1968) "Crime and Punishment: An Economic Approach." Journal of PoliticalEconomy. 76(2): 169-2 17.
Blumstein, Alfred and Richard Rosenfeld (1998) "Explaining Recent Trends in U.S. HomicideRates." Journal of Criminal Law and Criminology. 88(4): 1175-1216.
Bratton, William and Peter Knobler (1998) Turnaround: HowAmerica's Top Cop Reversed theCrime Epidemic. New York: Random House.
Brookshire, David S. and Don L. Coursey (1987) "Measuring the Value of a Public Good: AnEmpirical Comparison of Elicitation Procedures." American Economic Review. 77(4): 554-566.
Brookshire, David S., Mark A. Thayer, William D. Schulze, and Ralph C. d'Arge. (1982)"Valuing Public Goods: A Comparison of Survey and Hedonic Approaches." AmericanEconomic Review. 72(1): 165-177.
Cameron, Trudy Ann (1988) "A New Paradigm for Valuing Non-Market Goods UsingReferendum Data: Maximum Likelihood Estimation by Censored Logistic Regression." Journalof Environmental Economics and Management. 15: 355-379.
Cameron, Trudy Ann and Michelle D. James (1987) "Efficient Estimation Methods for 'ClosedEnded' Contingent Valuation Surveys." Review of Economics and Statistics. 69: 269-276.
Cameron, Trudy Ann and John Quiggin (1994) "Estimation Using Contingent Valuation Datafrom a 'Dichotomous Choice with Follow-Up' Questionnaire." Journal of EnvironmentalEconomics and Management. 27: 218-234.
Centers for Disease Control (1999) Downloaded from <<www.cdc.gov/ncipc>> May 25, 1999.
-18-

Cook, Philip J., Bruce Lawrence, Jens Ludwig and Ted R. Miller (1999) "The Medical Costs ofGunshot Injuries in the United States." Working Paper, Duke University.
Desvousges, William H. et al. (1993) "Measuring Natural Resource Damages with ContingentValuation: Tests of Validity and Reliability." In Contingent Valuation: A Critical Assessment.Jeny A. Hausman (Ed.) Amsterdam: North Holland. pp. 91-164.
Diamond, Peter A. and Jerry A. Hausman (1994) "Contingent Valuation: Is Some Number Betterthan No Number?" Journal of Economic Perspectives. 8(4): 45-64.
Freeman, Myrick A. (1993) The Measurement of Environmental and Resource Values: Theoryand Methods. Washington, DC: Resources for the Future.
Gayer, Ted, James T. Hamilton, and W. Kip Viscusi. (1998) "Private Values of Risk Tradeoffs atSuperfund Sites: Housing market Evidence on Learning about Risk." Working Paper,Georgetown University.
Hanemann, Michael (1994) "Valuing the Environment Through Contingent Valuation." Journalof Economic Perspectives. 8(4): 19-43.
Hanemann, Michael, John Loomis and Barbara Kanninen (1991) "Statistical Efficiency ofDouble-Bounded Dichotomous Choice Contingent Valuation." American Journal ofAgricultural Economics. 1255-1263.
Hausman, Jerry A. (1993) Contingent Valuation: A Critical Assessment. Amsterdam: NorthHolland.
Hellman, Daryl A. and Joel L. Naroff (1979) "The Impact of Crime on Urban ResidentialProperty Values." Urban Studies. 16: 105-1 12.
Kahneman, Daniel and Jack L. Knetsch (1992) "Valuing Public Goods: The Purchase of MoralSatisfaction." Journal of Environmental Economics and Management. 22: 5 7-70.
Kennedy, David M., Anne M. Piehi, and Anthony A. Braga (1996) "Youth Violence in Boston:Gun Markets, Serious Youth Offenders and a Use-Reduction Strategy." Law and ContemporaryProblems. 59(1): 147-196.
Kuby, Alma M., Laurie Imhof, and Hee-Choon Shin. (1999) Fall 1998 National Gun PolicySurvey: Methodology Report. Chicago: National Opinion Research Center.
Levitt, Steven D. and Sudhir Alladi Venkatesh (1998) "An Economic Analysis of a Drug-SellingGang's Finances." University of Chicago Working Paper.
-19-

Maddala, G.S. (1977) Econometrics. New York: McGraw-Hill.
Manning, Willard G., Emmett B. Keeler, Joseph P. Newhouse, Elizabeth M. Sloss, and JeffreyWasserman (1991) The Costs of Poor Health Habits. Cambridge, MA: Harvard.
Manning, Willard G. (1998) "The Logged Dependent Variable, Heteroscedasticity, and theRetransformation Problem." Journal of Health Economics. 17: 283-295.
Max, Wendy and Dorothy P. Rice. (1993) "Shooting In the Dark: Estimating the Cost of FirearmInjuries." Health Affairs. 171-185.
Miller, Ted R. and Mark A. Cohen. (1996) "Chapter 5: Costs." In The Textbook of PenetratingTrauma. Rao R. Ivatury and C. Gene Cayten (Eds.) Baltimore: Williams & Wilkins.
Miller, Ted R. and Mark A. Cohen (1997) "Costs of Gunshot and Cut/Stab Wounds in the UnitedStates, With Some Canadian Comparisons." AccidentAnalysis and Prevention. 29(3): 329-341.
Miller, Ted R., Mark A. Cohen, and Brian Wiersema (1996) Victim Costs and Consequences: ANew Look. NCJ 155282. Washington, DC: NIJ.
Mitchell, Robert Cameron and Richard T. Carson (1989) Using Surveys to Value Public Goods.The Contingent Valuation Method. Washington, DC: Resources for the Future.
Moore, Michael J. and W. Kip Viscusi (1988a) "Doubling the Estimated Value of Life: ResultsUsing New Occupational Fatality Data." Journal of Policy Analysis and Management. 7(3): 476-490.
Moore, Michael J. and W. Kip Viscusi (1988b) "The Quantity-Adjusted Value of Life."Economic Inquiry. 26(3): 369-388.
Moore, Michael J. and W. Kip Viscusi (1990a) "Discounting Environmental Health Risks: NewEvidence and Policy Implications." Journal of Environmental Economics and Management.18(2): S51-S62,
Moore, Michael J. and W. Kip Viscusi (1990b) "Models for Estimating Discount Rates for Long-Term Health Risks Using Labor Market Data." Journal of Risk and Uncertainty. 3(4): 38 1-402.
Piehl, Anne M., David M. Kennedy and Anthony A. Braga (1998) "Problem Solving and YouthViolence: An Evaluation of the Boston Gun Project." Working paper, Harvard University.
Rizzo, Mario J, (1979) "The Costs of Crime to Victims: An Empirical Analysis." Journal ofLegal Studies. 8: 177-205.
-20-
Rosenfeld, Richard and Scott H. Decker (1996) "Consent to Search and Seize: Evaluating anInnovative Youth Firearm Suppression Program." Law and Contemporary Problems. 59(1):197-220.
Rottenberg, Simon (1970) "The Social Cost of Crime and Crime Prevention." In BarbaraMcLennan (Ed.) Crime in Urban Society. Cambridge, MA: University Press. pp. 43-60.
Smith, V. Kerry (1992) "Arbitrary Values, Good Causes, and Premature Verdicts." Journal ofEnvironmental Economics and Management. 22: 71-89,
Stigler, George J. (1970) "The Optimum Enforcement of Laws." Journal of Political Economy.78: 526-536.
Sudman, Seymour and Norman Bradburn (1974) Response Effects In Surveys: A Review andSynthesis. Chicago: Aldine.
Teret, Stephen P., Daniel W. Webster, Jon S. Vernick et al. (1998) "Support for New Policies toRegulate Firearms: Results of Two National Surveys." New England Journal of Medicine.339(12): 813-818.
Thaler, Richard (1978) "A Note on the Value of Crime Control: Evidence from the PropertyMarket." Journal of Urban Economics. 5: 137-145.
U.S. Bureau of the Census (1997) Statistical Abstract of the United States: 1997 (11 71Ed.)Washington, DC: GPO.
U.S. Bureau of the Census (1999) <<http ://www.census. gov/populationlsocdemo>>(downloadedon February 22, 1999).
Viscusi, W. Kip. (1992) Fatal Tradeoffs: Public and Private Responsibilities for Risk. NewYork: Oxford University Press.
Viscusi, W. Kip (1993) "The Value of Risks to Life and Health." Journal of EconomicLiterature. 31(4): 1912-1946.
Viscusi, W. Kip and Charles O'Connor (1984) "Adaptive Responses to Chemical Labeling: AreWorkers Bayesian Decision Makers?" American Economic Review. 74(5): 942-956.
Viscusi, W. Kip and Michael J. Moore (1989) "Rates of Time Preference and Valuations of theDuration of Life." Journal of Public Economics. 38: 297-3 17.
Yates, F. (1981) Sampling Methods for Censuses and Surveys, 4th Edition Revised and Enlarged.London: Charles Giffin & Co.
-21-
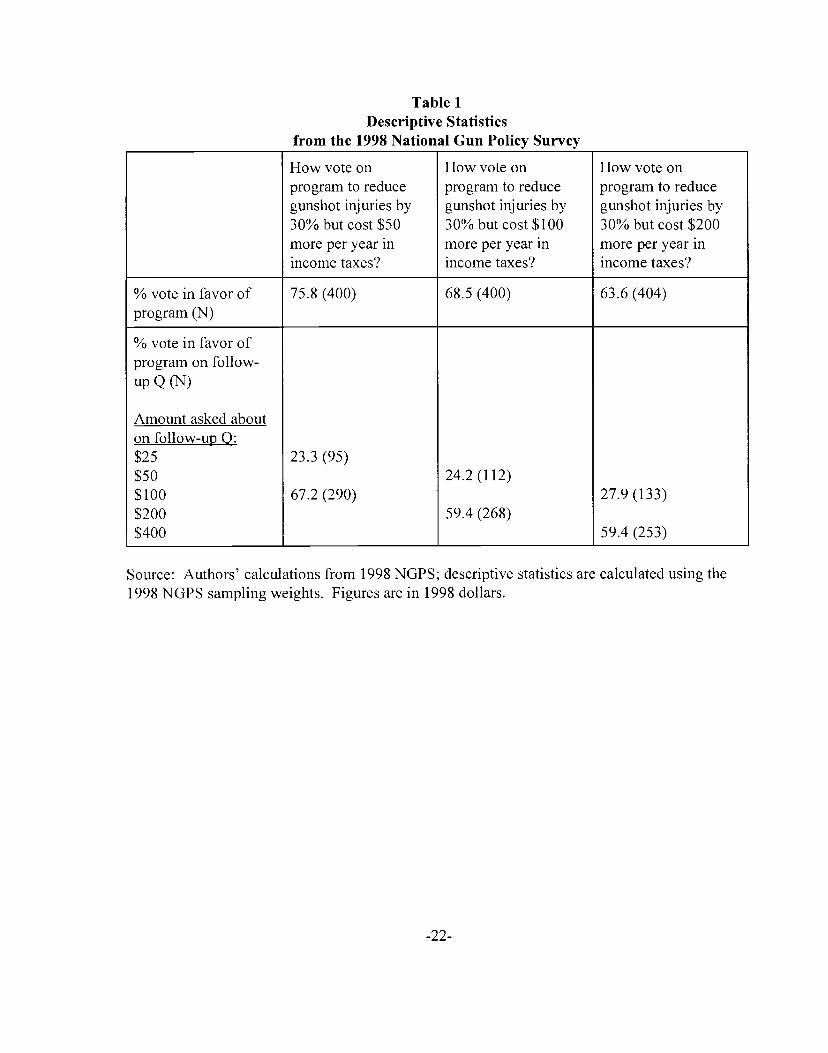
Table 1Descriptive Statistics
from the 1998 National Gun Policy Survey
How vote onprogram to reducegunshot injuries by30% but cost $50more per year inincome taxes?
How vote onprogram to reducegunshot injuries by30% but cost $100more per year inincome taxes?
How vote onprogram to reducegunshot injuries by30% but cost $200more per year inincome taxes?
% vote in favor ofprogram (N)
75.8 (400) 68.5 (400) 63.6 (404)
% vote in favor ofprogram on follow-upQ(N)
Amount asked about
23.3 (95)
67.2 (290)24.2 (112)
59.4 (268)27.9 (133)
59.4 (253)
on follow-up 0:$25$50$100$200$400
Source: Authors' calculations from 1998 NGPS; descriptive statistics are calculated using the1998 NGPS sampling weights. Figures are in 1998 dollars.
-22-
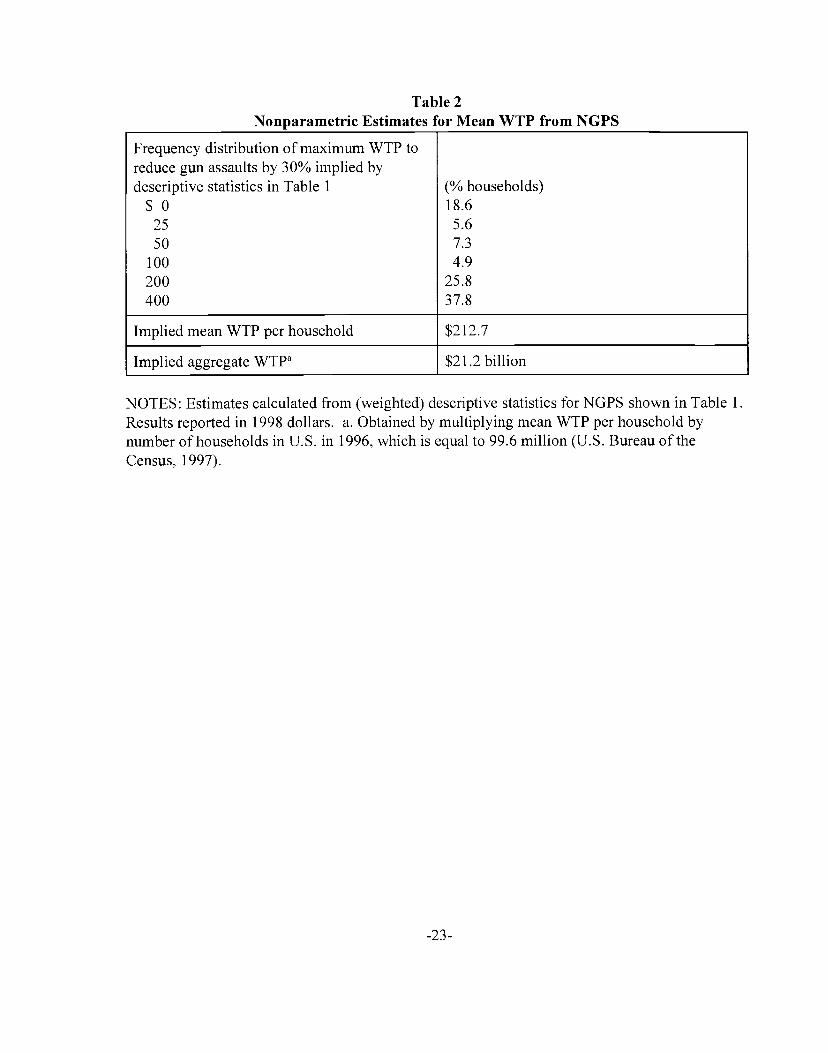
Table 2Nonparametric Estimates for Mean WTP from NGPS
Frequency distribution of maximum WTP to
reduce gun assaults by 30% implied bydescriptive statistics in Table 1$0
2550
100200400
(% households)18.65.67.34.9
25.837.8
Implied mean WTP per household $212.7
Implied aggregate WTP $21.2 billion
NOTES: Estimates calculated from (weighted) descriptive statistics for NGPS shown in Table 1.Results reported in 1998 dollars. a. Obtained by multiplying mean WTP per household bynumber of households in U.S. in 1996, which is equal to 99.6 million (U.S. Bureau of theCensus, 1997).
-23-
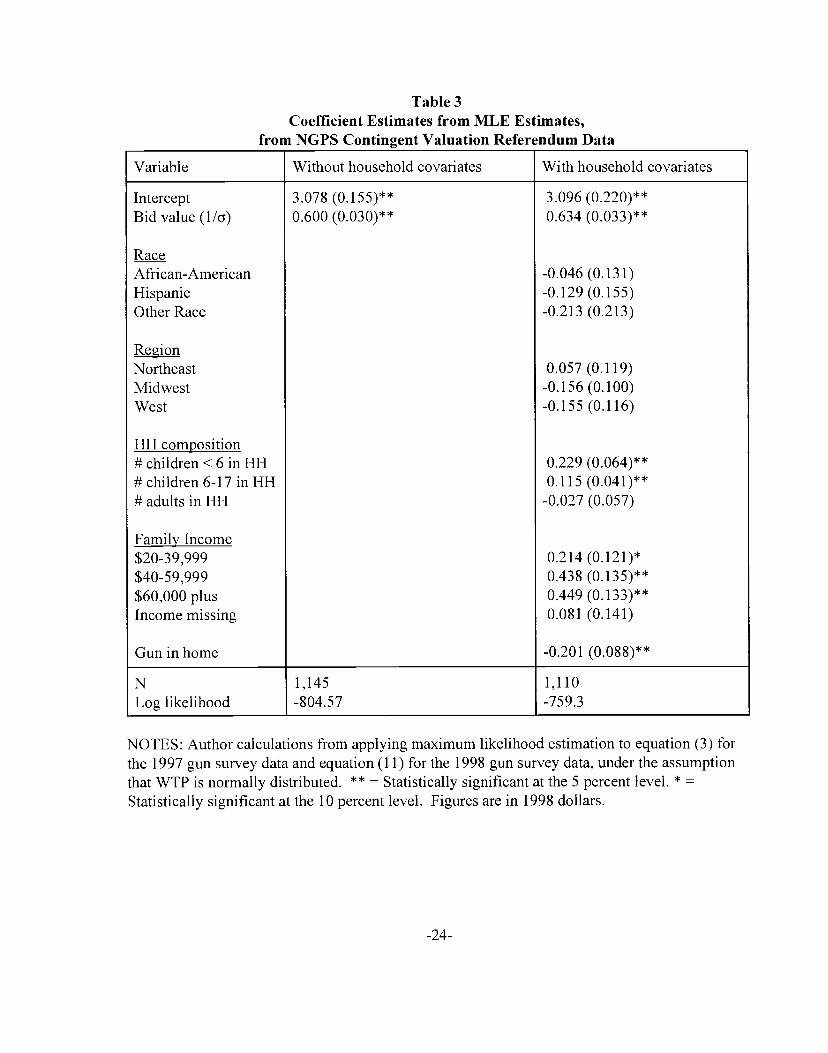
Table 3Coefficient Estimates from MLE Estimates,
from NGPS Contingent Valuation Referendum Data
Variable Without household covariates With household covariates
Intercept 3.078 (0.155)** 3.096 (0.220)**Bid value (1/a) 0.600 (0.030)** 0.634 (0.03 3)**
RaceAfrican-American -0.046 (0.13 1)Hispanic -0.129 (0.155)Other Race -0.213 (0.213)
RegionNortheast 0.057 (0.119)Midwest -0.156 (0.100)West -0.155(0.116)
HH composition# children < 6 in HH 0.229 (0.064)**# children 6-17 in HH 0.115 (0.041)**# adults in HH -0.027 (0.057)
Family Income$20-39,999 0.2 14 (0.121)*
$40-59,999 0.438 (0.135)**$60,000 plus 0.449 (0.133)**Income missing 0.081 (0.141)
Gun in home -0.201 (0.088)**
N 1,145 1,110Log likelihood -804.57 -759.3
NOTES: Author calculations from applying maximum likelihood estimation to equation (3) forthe 1997 gun survey data and equation (11) for the 1998 gun survey data, under the assumptionthat WTP is normally distributed. ** = Statistically significant at the 5 percent level. * =
Statistically significant at the 10 percent level. Figures are in 1998 dollars.
-24-
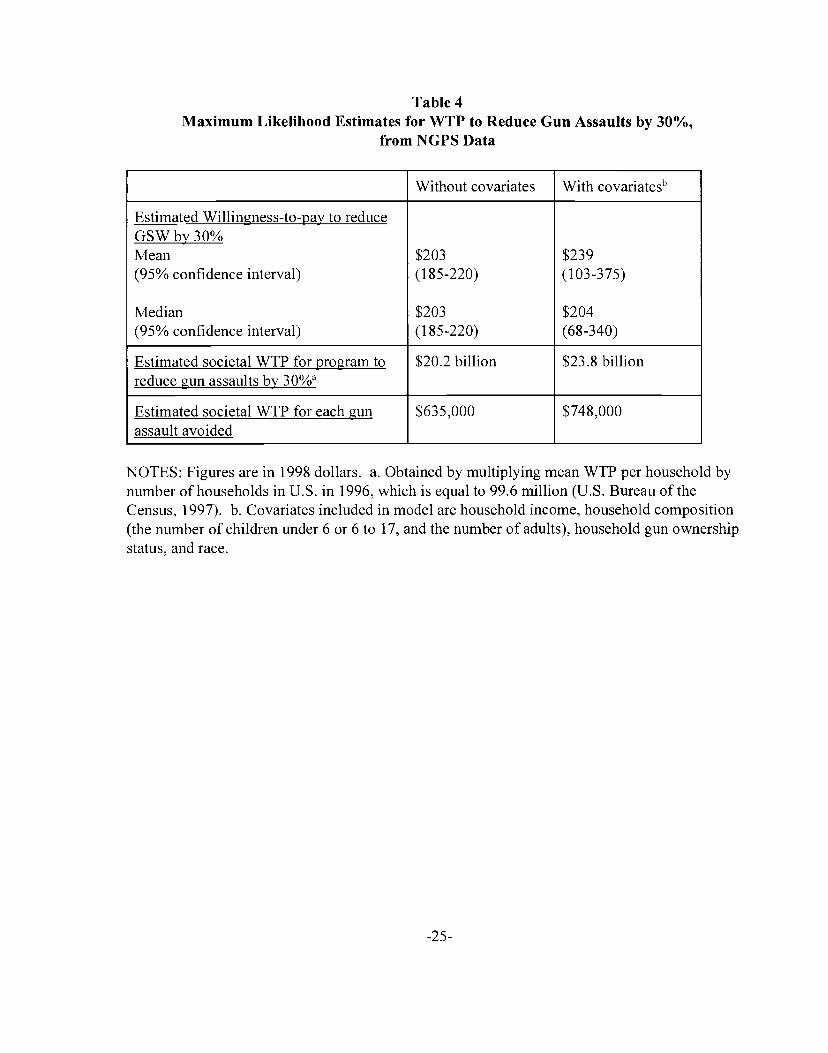
Table 4Maximum Likelihood Estimates for WTP to Reduce Gun Assaults by 30%,
from NGPS Data
Without covariates With covariatesh
Estimated Willingness-to-pay to reduce
$203(185-220)
$203(185-220)
$239(103-375)
$204(68-340)
GSWby3O%Mean(95% confidence interval)
Median(95% confidence interval)
Estimated societal WTP for program to $20.2 billion $23.8 billionreduce gun assaults by 30%
Estimated societal WTP for each gunassault avoided
$635,000 $748,000
NOTES: Figures are in 1998 dollars. a. Obtained by multiplying mean WTP per household bynumber of households in U.S. in 1996, which is equal to 99.6 million (U.S. Bureau of theCensus, 1997). b. Covariates included in model are household income, household composition(the number of children under 6 or 6 to 17, and the number of adults), household gun ownershipstatus, and race.
-25-

Technical AppendixCalculating Standard Errors for Mean and Median WTP
The usual standard error formula for a linear predictor evaluated at some value of theregressors x0 is given by equation (Al).
(Al) SE(x0b) = (xoVxo!)l2
Estimation of the log likelihood given in equation (7) is simplified somewhat because b isa scalar rather than a vector, so V is also a scalar equal to the variance of b, x0=l, and equation(Al) simplifies to (A2).
(A2) SE(b) = (V)112
The complication in our case comes from the fact that b is actually the ratio of twoestimates b'/s', where b' is an estimate for (13/op) and s' is an estimate for (11cr). In this case thevariance for b=b'/s' can be approximated by the formula given in equation (A3) (Yates, 1981, p.190).
(A3) V = Var(b) = Var(b'Is') (b'/s')2 [ (Var(b'))/(b')2 + (Var(s'))I(s')2 ]
The final complication is that (A3) gives us the variance for the estimated mean of thenatural log of Y (WTP), while ultimately we are interested in the variance of predicted mean ofthe untransformed WTP. With E[ln Y]=b and Var( E[ln Y])=V then the variance of E[Y1 isgiven by equation (A4) (Maddala, 1977, p. 33).
(A4) Var( E[Y1 ) = exp(2b + V)*(e\' - 1)
-26-
(0
0rai(0
0-c4-0c0
0a.00
1 25 50 100 200 500Household WTP, 1998 dollars
Figure 1 demand for 30% reduction in gun
-27-
2000 7000
violence
I
.75 -
.5 -
.25 -
05 -0-
.25 -
.050—
1 25 50 100 200 500Household WTP, 1998 dollars
Figure 2 Demand for 30% reduction in gun
Nonparametric Estimates A Maximum Likelihood Estimates
1—
.75 -
.5 -
U)
0-cU)U)
09-0C00a.00
2000 7000
violence
-28-
Related Documents