i The behavior of stock price on ex- dividend day A Study on New York Stock Exchange and London Stock Exchange. Authors: Islam Md. Amirul Chowdhury Biplob Supervisor: Isaksson Anders Student Umeå School of Business Spring semester 2011 Master thesis, one-year, 15 hp

Welcome message from author
This document is posted to help you gain knowledge. Please leave a comment to let me know what you think about it! Share it to your friends and learn new things together.
Transcript
i
The behavior of stock price on ex-dividend day
A Study on New York Stock Exchange and London Stock Exchange.
Authors: Islam Md. Amirul Chowdhury Biplob
Supervisor: Isaksson Anders
Student
Umeå School of Business
Spring semester 2011
Master thesis, one-year, 15 hp
i
ABSTRACT
The main aim of this thesis is to analyze the behavior of stock price on ex-dividend day in
London Stock Exchange and New York Stock Exchange and draw a conclusion about the
market efficiency based. We collect 200 sample companies dividend, ex-dividend day and
cum dividend day stock price to compare with NYSE composite index and FTSE 100 for
London Stock Exchange.
To answer the research question and specific purpose of our thesis we developed five null
hypothesis based on raw price ratio (RPR), market-adjusted price ratio (MAPR), raw price
drop ratio (RPD), market-adjusted price drop ratio (MAPD) and market-adjusted abnormal
return (MAAR). We used t-statistic to find the mean differences between observed values
and standard values. We also show multiple regression analysis to show the relationship
between ex-dividend day stock price and dividend, cum-dividend day stock price.
This thesis documented that same amount of stock price drop in 2008 New York Stock
Exchange compare with dividend amount. In this case our null hypothesis accepted. On the
other hand in London Stock Exchange shows higher drop of stock price than dividend
amount in 2008 against the taxation rate rules of prior study. In 2007 both stock market
shows the less drop of stock price than dividend amount. Therefore our null hypothesis
rejected. We also documented that London Stock Exchange more volatile than New York
Stock Exchange to consider the MAAR, tax rate and standard deviation. So we find
significant evidence of market abnormal return which create an opportunity of market
inefficiency and arbitrage opportunity for investors.
So, our thesis output shows mixed evidence for London Stock Exchange and New York
Stock Exchange.
Key words: Ex-dividend day, cum-dividend day, dividend, and market efficiency.

ii
ACKNOWLEDGEMETNS
We have the immense pleasure and satisfaction in presenting this thesis, which is
completing my MS Program in Finance. Thanks to Almighty who has given us the strength
& capability to complete this thesis. The gain of this thesis depends on the contribution of
many people, especially those who spare time to share their beautiful art of judging of
merits and faults and make suggestions.
First of all, we are grateful to one particular person who have helped and encouraged us at
each & every step. We would like to express our heartiest gratitude to our honorable
teachers and thesis supervisor Mr. Christer Petersen (Professor of Umeå School of
Business, Umeå University, Sweden). We were enriched by his kind encouragement and
co-operation. We could not complete this thesis successfully without his responsible
guidance, instruction, persuasion and advice.
We would like to extend our heartfelt thanks to Anders Isaksson (Assistant Professor of
Umeå School of Business, Umeå University, Sweden) for his last movement guidance,
advice and suggestions.
At last we thank our family and friends for their cordial co-operation, who have contributed
in preparing the report effectively.
Islam Md. Amirul
&
Chowdhury Biplob
iii
TABLE OF CONTENTS Chapter One (Introduction & Background)……………………………………. 01-05
1.1. Problem background……………………………………………….. 01
1.2. Research Question……………………………………………......... 03
1.3. Purpose of the study……………………………………………….. 03
1.4. Demarcation and Limitation of the study …………………………. 03
1.5. Terminology………………………………………………………... 04
1.6. Disposition…………………………………………………………. 04
Chapter Two (Theoretical Method)……………………………………………... 06-14
2.1. Choice of the topics………………………………………………... 06
2.2. Perceptions…………………………………………………………. 06
2.3. Perspectives…………………………………………………………07
2.4. Research types……………………………………………………... 08
2.5. Philosophy of Research……………………………………………. 09
2.6. Research Approach………………………………………………… 11
2.7. Research Strategy………………………………………………….. 12
2.8. Choice of Theories…………………………………………………. 13
2.9. Choice of Data Sources……………………………………………. 13
2.10. Criticism of Data Sources………………………………………….. 14
Chapter Three (Theories and literatures review)………………………………. 15-27
3.1. The efficient market hypothesis (EMH)…………………………… 15
3.1.1. Weak form of efficiency…………………………………….. 16
3.1.2. Semi-strong form of efficiency……………………………… 16
3.1.3. Strong form of efficiency…………………………………… 16
3.2. Dividend…………………………………………………………… 17
3.2.1. Dates of cash dividend payment……………………………. 18
3.3. Signaling Hypothesis………………………………………………. 20
3.4. Studies on Ex-dividend day……………………………………….. 20
3.4.1. Tax effect……………………………………………………. 21
3.4.2. Clientele effect………………………………………………. 24
3.4.3. Trading Volume around the Ex-dividend day………………. 26
3.4.4. Arbitrage opportunity……………………………………….. 26
3.4.5. Taxation in different market………………………………… 27
Chapter Four (Practical Methodology)…………………………………………. 28-33
4.1. Sample design……………………………………………………… 28
4.2. The selection of sample……………………………………………. 28
4.3. The collection of data……………………………………………… 30
4.4. Data processing and analysis………………………………………. 31
4.5. Mathematical model………………………………………………...31
4.6. Statistical tools……………………………………………………... 33
iv
Chapter Five (Empirical data and analysis of findings)……………………….. 34-40
5.1. Presentation of two stock markets…………………………………. 34
5.1.1. New York Stock Exchange………………………………….. 34
5.1.2. London Stock Exchange…………………………………….. 35
5.2. Findings from empirical data.……………………………………… 35
5.2.1. Multiple regression analysis…...……………………………. 35
5.2.2. Analysis of RPR, MAPR, RPD, MAPD and MAAR..……… 36
5.2.2.1. New York Stock Exchange………………………………. 36
5.2.2.2. London Stock Exchange…………………………………. 37
5.2.2.3. Explanation of empirical findings……………………….. 39
5.3. Market to market comparison……………………………………… 40
Chapter Six (Concluding remarks)……………………………………………… 41-44
6.1. Conclusion…………………………………………………………. 41
6.2. Practical and Theoretical contribution……………………………... 42
6.3. Recommendations…………………………………………………. 42
6.4. Further Research…………………………………………………… 43
6.5. The credibility of research…………………………………………. 43
6.5.1. Reliability………………………………………………….. 43
6.5.2. Validity…………………………………………………….. 44
6.5.3. Generalization……………………………………………… 44
References………………………………………………………………………… 45-50
List of Books……………………………………………………….. 45
List of Scientific Articles…………………………………………... 47
List of Scientific
Articles(Electronic)…………………………………………………………………50
Internet……………………………………………………………...50
Appendix…………………………………………………………………………... 51
v
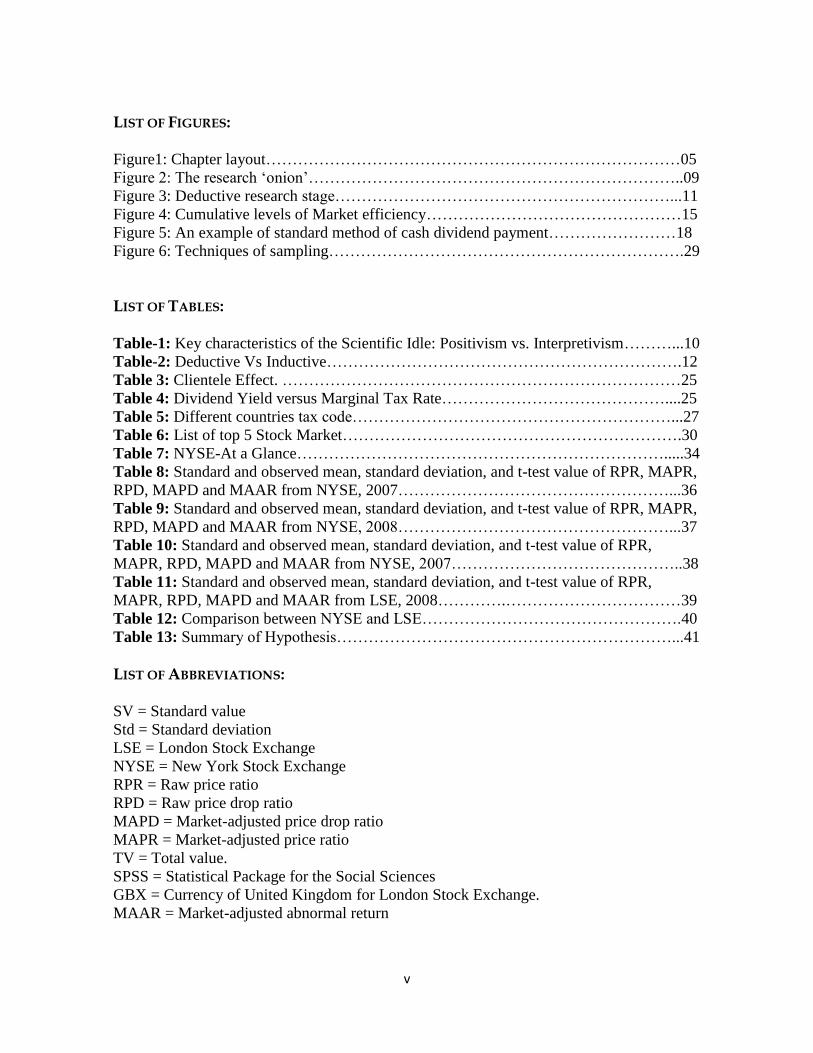
LIST OF FIGURES:
Figure1: Chapter layout……………………………………………………………………05
Figure 2: The research „onion‟……………………………………………………………..09
Figure 3: Deductive research stage………………………………………………………...11
Figure 4: Cumulative levels of Market efficiency…………………………………………15
Figure 5: An example of standard method of cash dividend payment……………………18
Figure 6: Techniques of sampling………………………………………………………….29
LIST OF TABLES:
Table-1: Key characteristics of the Scientific Idle: Positivism vs. Interpretivism………...10
Table-2: Deductive Vs Inductive………………………………………………………….12
Table 3: Clientele Effect. …………………………………………………………………25
Table 4: Dividend Yield versus Marginal Tax Rate……………………………………....25
Table 5: Different countries tax code……………………………………………………...27
Table 6: List of top 5 Stock Market……………………………………………………….30
Table 7: NYSE-At a Glance…………………………………………………………….....34
Table 8: Standard and observed mean, standard deviation, and t-test value of RPR, MAPR,
RPD, MAPD and MAAR from NYSE, 2007……………………………………………...36
Table 9: Standard and observed mean, standard deviation, and t-test value of RPR, MAPR,
RPD, MAPD and MAAR from NYSE, 2008……………………………………………...37
Table 10: Standard and observed mean, standard deviation, and t-test value of RPR,
MAPR, RPD, MAPD and MAAR from NYSE, 2007……………………………………..38
Table 11: Standard and observed mean, standard deviation, and t-test value of RPR,
MAPR, RPD, MAPD and MAAR from LSE, 2008………….……………………………39
Table 12: Comparison between NYSE and LSE………………………………………….40
Table 13: Summary of Hypothesis………………………………………………………...41
LIST OF ABBREVIATIONS:
SV = Standard value
Std = Standard deviation
LSE = London Stock Exchange
NYSE = New York Stock Exchange
RPR = Raw price ratio
RPD = Raw price drop ratio
MAPD = Market-adjusted price drop ratio
MAPR = Market-adjusted price ratio
TV = Total value.
SPSS = Statistical Package for the Social Sciences
GBX = Currency of United Kingdom for London Stock Exchange.
MAAR = Market-adjusted abnormal return
vi
LIST OF FORMULAS:
(P2-P1)/DPS= (1 - tp)/ (1- tpc)
This formula represents the relationship between the firm‟s share prices and its dividend.
Cum dividend day investors‟ wealth equal to ex-dividend stock price plus dividend paid.
RPR is the difference between cum dividend day stock price and ex-dividend day stock
price expressed by dividend paid. Its standard value is one.
RPD is the difference between cum dividend day stock price and ex-dividend day stock
price expressed by cum dividend day stock price. Its standard value is equal to dividend
yield.
MAPR is the difference between cum dividend day stock price and market adjusted ex-
dividend day stock price and which is expressed by dividend amount. Its Standard value is
one.
MAPD is the difference between cum dividend day stock price and market adjusted ex-
dividend day stock price and which is expressed by cum dividend stock price. Its Standard
value is equal to the dividend yield.
The dividend yield “d” is the ratio of dividend amount and cum dividend day stock price.
MAAR is expressed by the difference of ex-dividend day and market return.
Ro can be defined as the difference between ex-dividend day return plus dividend which is
expressed by cum dividend day stock price.
t-test value is the difference between observed mean value and standard value which is
expressed by standard deviation divided by route of total number of observations.
1
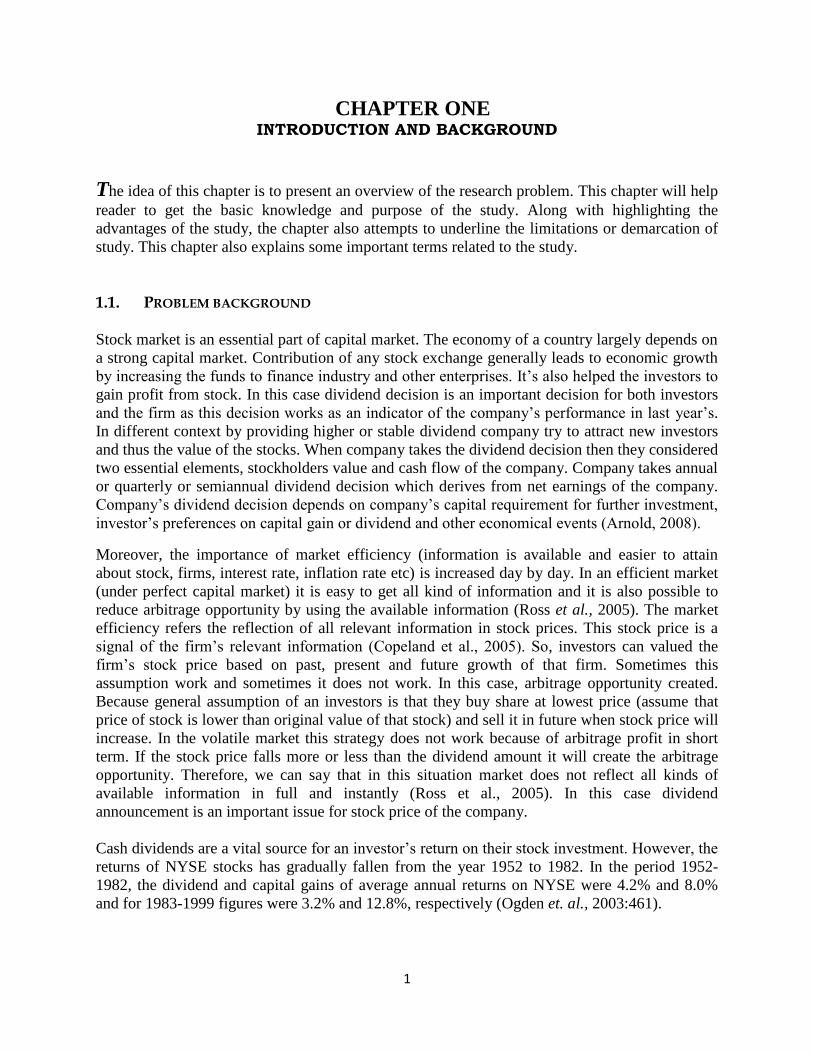
CHAPTER ONE INTRODUCTION AND BACKGROUND
The idea of this chapter is to present an overview of the research problem. This chapter will help
reader to get the basic knowledge and purpose of the study. Along with highlighting the
advantages of the study, the chapter also attempts to underline the limitations or demarcation of
study. This chapter also explains some important terms related to the study.
1.1. PROBLEM BACKGROUND
Stock market is an essential part of capital market. The economy of a country largely depends on
a strong capital market. Contribution of any stock exchange generally leads to economic growth
by increasing the funds to finance industry and other enterprises. It‟s also helped the investors to
gain profit from stock. In this case dividend decision is an important decision for both investors
and the firm as this decision works as an indicator of the company‟s performance in last year‟s.
In different context by providing higher or stable dividend company try to attract new investors
and thus the value of the stocks. When company takes the dividend decision then they considered
two essential elements, stockholders value and cash flow of the company. Company takes annual
or quarterly or semiannual dividend decision which derives from net earnings of the company.
Company‟s dividend decision depends on company‟s capital requirement for further investment,
investor‟s preferences on capital gain or dividend and other economical events (Arnold, 2008).
Moreover, the importance of market efficiency (information is available and easier to attain
about stock, firms, interest rate, inflation rate etc) is increased day by day. In an efficient market
(under perfect capital market) it is easy to get all kind of information and it is also possible to
reduce arbitrage opportunity by using the available information (Ross et al., 2005). The market
efficiency refers the reflection of all relevant information in stock prices. This stock price is a
signal of the firm‟s relevant information (Copeland et al., 2005). So, investors can valued the
firm‟s stock price based on past, present and future growth of that firm. Sometimes this
assumption work and sometimes it does not work. In this case, arbitrage opportunity created.
Because general assumption of an investors is that they buy share at lowest price (assume that
price of stock is lower than original value of that stock) and sell it in future when stock price will
increase. In the volatile market this strategy does not work because of arbitrage profit in short
term. If the stock price falls more or less than the dividend amount it will create the arbitrage
opportunity. Therefore, we can say that in this situation market does not reflect all kinds of
available information in full and instantly (Ross et al., 2005). In this case dividend
announcement is an important issue for stock price of the company.
Cash dividends are a vital source for an investor‟s return on their stock investment. However, the
returns of NYSE stocks has gradually fallen from the year 1952 to 1982. In the period 1952-
1982, the dividend and capital gains of average annual returns on NYSE were 4.2% and 8.0%
and for 1983-1999 figures were 3.2% and 12.8%, respectively (Ogden et. al., 2003:461).
2
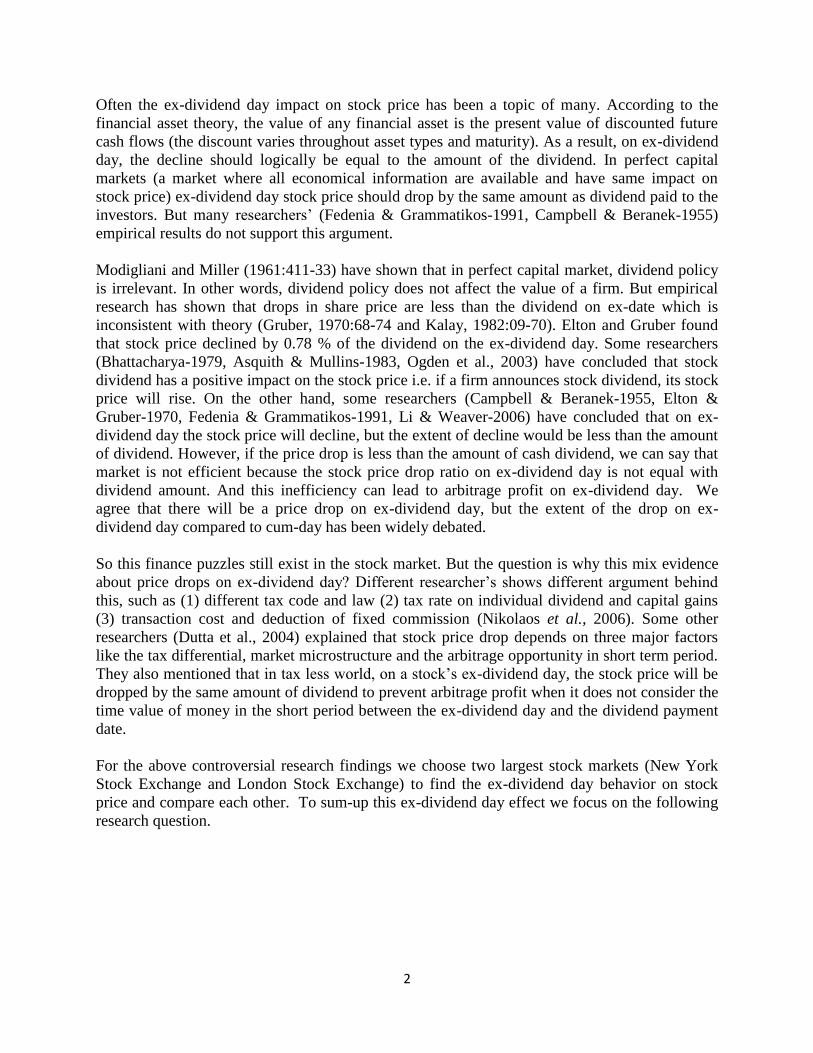
Often the ex-dividend day impact on stock price has been a topic of many. According to the
financial asset theory, the value of any financial asset is the present value of discounted future
cash flows (the discount varies throughout asset types and maturity). As a result, on ex-dividend
day, the decline should logically be equal to the amount of the dividend. In perfect capital
markets (a market where all economical information are available and have same impact on
stock price) ex-dividend day stock price should drop by the same amount as dividend paid to the
investors. But many researchers‟ (Fedenia & Grammatikos-1991, Campbell & Beranek-1955)
empirical results do not support this argument.
Modigliani and Miller (1961:411-33) have shown that in perfect capital market, dividend policy
is irrelevant. In other words, dividend policy does not affect the value of a firm. But empirical
research has shown that drops in share price are less than the dividend on ex-date which is
inconsistent with theory (Gruber, 1970:68-74 and Kalay, 1982:09-70). Elton and Gruber found
that stock price declined by 0.78 % of the dividend on the ex-dividend day. Some researchers
(Bhattacharya-1979, Asquith & Mullins-1983, Ogden et al., 2003) have concluded that stock
dividend has a positive impact on the stock price i.e. if a firm announces stock dividend, its stock
price will rise. On the other hand, some researchers (Campbell & Beranek-1955, Elton &
Gruber-1970, Fedenia & Grammatikos-1991, Li & Weaver-2006) have concluded that on ex-
dividend day the stock price will decline, but the extent of decline would be less than the amount
of dividend. However, if the price drop is less than the amount of cash dividend, we can say that
market is not efficient because the stock price drop ratio on ex-dividend day is not equal with
dividend amount. And this inefficiency can lead to arbitrage profit on ex-dividend day. We
agree that there will be a price drop on ex-dividend day, but the extent of the drop on ex-
dividend day compared to cum-day has been widely debated.
So this finance puzzles still exist in the stock market. But the question is why this mix evidence
about price drops on ex-dividend day? Different researcher‟s shows different argument behind
this, such as (1) different tax code and law (2) tax rate on individual dividend and capital gains
(3) transaction cost and deduction of fixed commission (Nikolaos et al., 2006). Some other
researchers (Dutta et al., 2004) explained that stock price drop depends on three major factors
like the tax differential, market microstructure and the arbitrage opportunity in short term period.
They also mentioned that in tax less world, on a stock‟s ex-dividend day, the stock price will be
dropped by the same amount of dividend to prevent arbitrage profit when it does not consider the
time value of money in the short period between the ex-dividend day and the dividend payment
date.
For the above controversial research findings we choose two largest stock markets (New York
Stock Exchange and London Stock Exchange) to find the ex-dividend day behavior on stock
price and compare each other. To sum-up this ex-dividend day effect we focus on the following
research question.
3
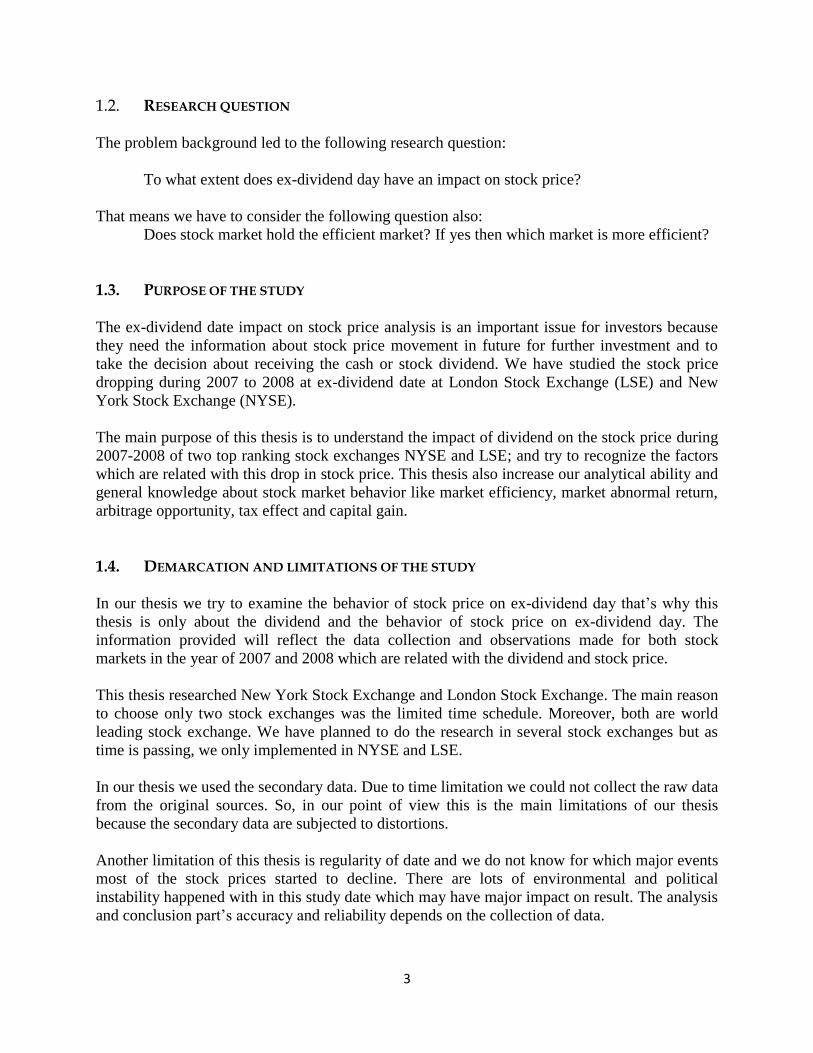
1.2. RESEARCH QUESTION
The problem background led to the following research question:
To what extent does ex-dividend day have an impact on stock price?
That means we have to consider the following question also:
Does stock market hold the efficient market? If yes then which market is more efficient?
1.3. PURPOSE OF THE STUDY
The ex-dividend date impact on stock price analysis is an important issue for investors because
they need the information about stock price movement in future for further investment and to
take the decision about receiving the cash or stock dividend. We have studied the stock price
dropping during 2007 to 2008 at ex-dividend date at London Stock Exchange (LSE) and New
York Stock Exchange (NYSE).
The main purpose of this thesis is to understand the impact of dividend on the stock price during
2007-2008 of two top ranking stock exchanges NYSE and LSE; and try to recognize the factors
which are related with this drop in stock price. This thesis also increase our analytical ability and
general knowledge about stock market behavior like market efficiency, market abnormal return,
arbitrage opportunity, tax effect and capital gain.
1.4. DEMARCATION AND LIMITATIONS OF THE STUDY
In our thesis we try to examine the behavior of stock price on ex-dividend day that‟s why this
thesis is only about the dividend and the behavior of stock price on ex-dividend day. The
information provided will reflect the data collection and observations made for both stock
markets in the year of 2007 and 2008 which are related with the dividend and stock price.
This thesis researched New York Stock Exchange and London Stock Exchange. The main reason
to choose only two stock exchanges was the limited time schedule. Moreover, both are world
leading stock exchange. We have planned to do the research in several stock exchanges but as
time is passing, we only implemented in NYSE and LSE.
In our thesis we used the secondary data. Due to time limitation we could not collect the raw data
from the original sources. So, in our point of view this is the main limitations of our thesis
because the secondary data are subjected to distortions.
Another limitation of this thesis is regularity of date and we do not know for which major events
most of the stock prices started to decline. There are lots of environmental and political
instability happened with in this study date which may have major impact on result. The analysis
and conclusion part‟s accuracy and reliability depends on the collection of data.
4
1.5. TERMINOLOGY
We study the ex-dividend day behavior of stock price. Three key words, which we will use
during the thesis, are ex-dividend day, cum-dividend day, dividend and market efficiency. We
discuss the concept of above key words in the below:
The term Dividend usually means a portion of company‟s earnings that is distributed and paid
among the stockholders. Generally two types of Dividend are distributed to the company‟s
shareholders either in form of Cash dividend or stock dividend (Arnold, 2008).
The second day before the date of record (declared by the company) is called the ex-dividend
day i.e. the date when the seller entitled to keep the dividend.
Cum dividend refers when a purchaser of stock is allowed to receive a dividend that has been
declared but not paid.
An efficient market refers all kinds of available information which reflected in stock prices
quickly and fully (Fama, 1970).
1.6. DISPOSITION
In this section we show the full outline of our study on “The Ex-dividend day behavior on stock
price”.
Chapter One:
In introduction chapter, we present our topic, problem background; research questions, purpose,
and demarcation, as well as we show the limitations of the study.
Chapter Two: Chapter two represents the theoretical methodology which we used during the course of our
study. It also shows the reason behind choosing the topics, perceptions, and which method we
used in our study as well as sources of data.
Chapter Three:
In this chapter, we collect a number of theories and literature and we discuss them providing a
theoretical framework and use these theories in the findings and analysis parts.
Chapter Four:
This chapter shows the practical methodology which is used in our study as well as the approach.
This chapter explains the methods of sampling, data collection and analysis, mathematical
model, and significance test etc.
5
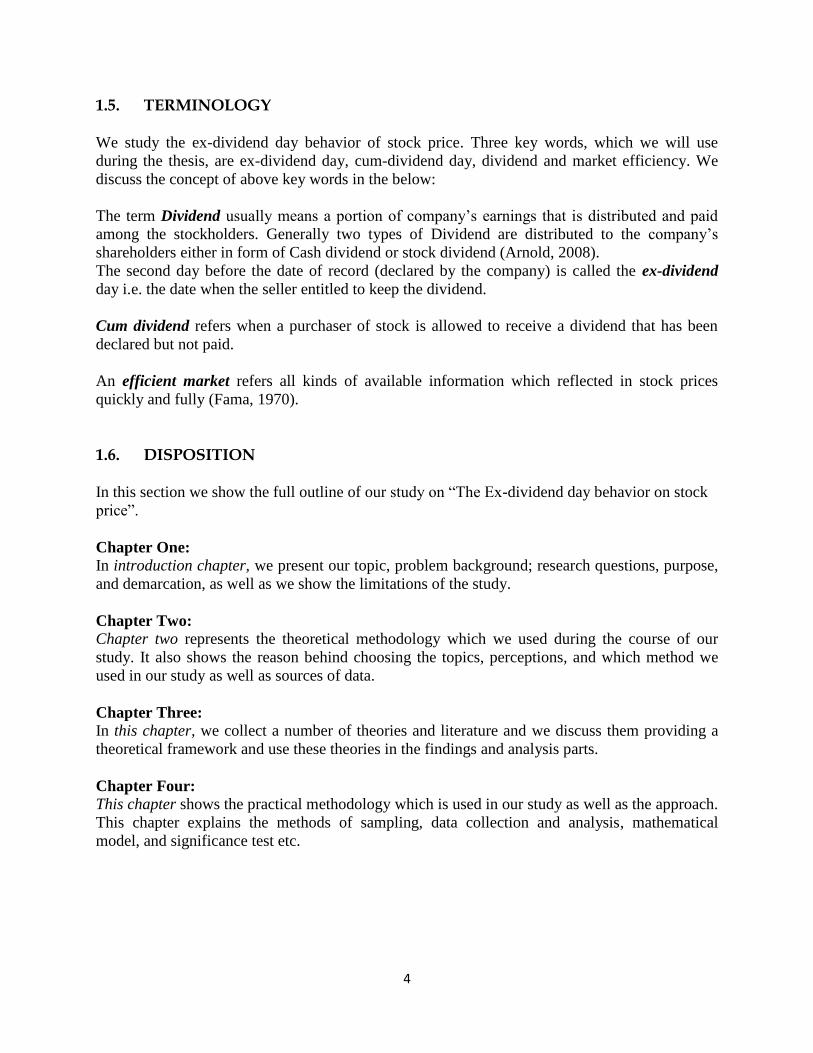
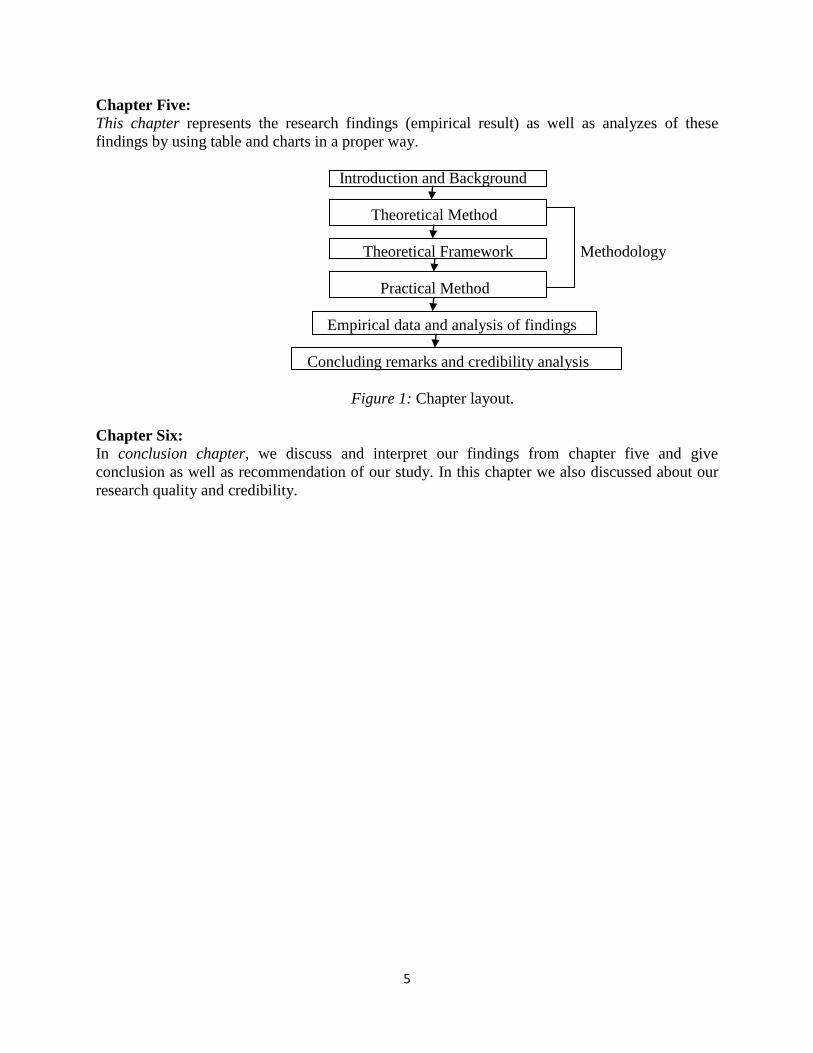
Chapter Five:
This chapter represents the research findings (empirical result) as well as analyzes of these
findings by using table and charts in a proper way.
Introduction and Background
Theoretical Method
Theoretical Framework Methodology
Practical Method
Empirical data and analysis of findings
Concluding remarks and credibility analysis
Figure 1: Chapter layout.
Chapter Six:
In conclusion chapter, we discuss and interpret our findings from chapter five and give
conclusion as well as recommendation of our study. In this chapter we also discussed about our
research quality and credibility.

6
CHAPTER TWO THEORETICAL METHOD
This chapter enlightens the reader on what purposes and for what reasons we choose this topic.
This chapter will also explain the perception, perspective and underlying philosophy of our
research as well as methodology used for the research.
2.1. CHOICE OF THE TOPICS
Nowadays, stock markets are a hub for world economy and also a sensitive issue; where
investors invest their savings for higher return. Stock market became modern business hub
because of new technology (internet), global business, and higher demand of stable economy.
Today many people invest money to buy stock and earning profits. But they face loss if stock
prices decline. How much stock price decline? It is an important issue for investors as well as
financial analyst.
For the above reason we selected this topic for our thesis. But it is so tough to choose a thesis
topic because there are lots of subject area available for research including finance, marketing,
management and accounting for business administration. Since we both are finance students, we
choose finance related topics.
The master thesis should be related with a student‟s academic background, work experiences and
future career aspirations. Master thesis topic should be influenced by at least two of these issues.
2.2. PERCEPTIONS
In this part researchers should say something about themselves for readers as the readers have
the right to know about the researchers and their background to understand why they chose the
topic and what relationship it has with their background. Topic and preconceptions regarding the
scope of study have been established in ours mind because of our educational background in
finance.
There are four major factors related with the preconceptions viz social background, past
experience, education and environmental influences. When someone investigates or studies
something all of above features will strongly influences the person‟s thinking, analyzing ability,
and the ability to distinguish right or wrong and their behavior. All of above four issues might
affect the researchers with the reality and their ability to critically examine the social, political
and educational factors. Preconceptions refer the theoretical knowledge related with the
researchers‟ field of interest and consist of particular subject and experiences (Johansson-
Lindfors, 1993: 76-77).
We, Md. Amirul Islam and Biplob Chowdhury, the authors of this thesis have the same origin
and have the common social, cultural, educational and environmental background. Mr. Islam was
7
born in Noakhali and Mr. Chowdhury was born in Chittagong, the largest sea port city of
Bangladesh. Bangladesh is a developing country. Population growth, unemployment, and
illiteracy are the main problem of Bangladesh. Our economy depends on agriculture and export
of garments. Bangladesh capital market is very young and more volatile. It has two capital
markets- Dhaka Stock Exchange (DSE) and Chittagong Stock Exchange (CSE), both under
Security of Exchange Commissions (SEC)‟s supervision.
We both have successfully completed our MBA (master of business administration), with major
in finance from Chittagong University, Bangladesh. After that we got admitted to Umeå
University for Masters Programme in Finance. Both of us did a bachelor programme in finance
and banking field. This education has helped to go gather lots of theoretical background about
financial management, corporate finance, economics, investment analysis and financial statement
analysis.
We have some practical experience also about stock market and finance issue as both we have
BO (beneficiary owners) account under CSE for trading stock. We also have some IPO (initial
public offering) share under our BO account. Recently Mr. Islam has invested in secondary
market also. So both authors have real theoretical and practical knowledge about dividend and
ex-dividend day. After MBA examination in 2008, Mr. Chowdhry successfully completed his
internship programme (3 months) under CSE and improved his knowledge in the field of capital
market investment and trading operation of CSE. On the other hand Mr. Islam successfully
completed his three month internship in a telecom company (TM international BD Limited)
under finance division, during which he learned practical knowledge about finance related area
and analyst. We both have intentions to start our career as financial and investment analyst in
future.
In conclusion, have academic and practical knowledge about finance related topics specifically
in dividend. We developed our concept on the basis of our academics and practical knowledge as
well as by studying previous literature and reviewing them. Our thesis is constructed on the basis
of real capital market situation of New-York Stock Exchange (NYSE) and London Stock
Exchange (LSE) and on some theoretical explanation.
2.3. PERSPECTIVES
The perspective of a study refers to the ideas and conceptual guideline of research aspects and
data collection for research (Hantrais, 1996). Perspective is a way to answer the research
question. In the same time different researchers have different perspectives for study and
sometime they give different outcome as well as interpretation on the result. Generally
perspectives refer the scientific reasons for which the research has been conducted. The research
perspective can be define as a research which conducts for improving and better understanding
the market or for scientific reasons to understand a process in more deeply way. A perspective is
the combinations of research ideas and conceptions (Hantrais, 1996).
In this thesis, we clearly mention our research perspectives in the consideration of two main
things. Firstly of all for the personal benefit to understand the ex-dividend day impact on stock
8
price in more detailed way and secondly for the investors‟ perspective. This study based on a
research perspective by reviewing the ex-dividend day related literatures in the field of stock
market. This literature review and research findings and analysis parts increase the authors
academic knowledge in the theoretically and practically also.
On the other hand this thesis can increase the awareness of the investors. Investors can get better
information about ex-dividend day and stock price relationship for their safe investment. If
investors can assume the future price change movement for the reason of dividend at ex-dividend
day they can take decision very easily for selling or holding stock. We will try to find the
empirical result of stock price dropping in the year of 2007 and 2008 at ex-dividend day and also
try to interpret it.
2.4. RESEARCH TYPES
Research is a systematic and methodical process of enquiry and investigation with a view to
increasing (or creating) new knowledge. Research is conducted in order to answer all or some of
the questions posed in a project. All research is connected to theory. Theory guides and
influences the collection and analysis of some or all the data associated with the research project.
Research refers to a scientific way by which a researcher find answers to some questions
investigating, exploring, examining and interpreting the findings. It is a systematic process to
gain knowledge by gathering and analyzing the data. A research conducted for the deep
understanding of some things and answers the related questions that ensure the low errors and
bias (Gail, 2002:5).
When researchers write their research report after investigation, they follow two types of
methods. One is applied research and other is basic research. Applied research report provides
information about some problem and tries to solve that problem. Applied research is used for
practical study and to resolve problem directly. The area of applied research is academic or
institution. On the other hand basic research is more difficult than applied research. Personal
interest and curiosity of authors is the main issue of basic research. In basic research the
researcher show their curiosity to increase knowledge. Basic research is the theoretical
experience for gaining knowledge. The main difference between applied and basic research is
applied research emphasize on the practical problem rather than the need to acquire knowledge
like basic research (Gail, 2002:5-7).
This thesis is one kind of applied research, as it is academic study writing and tries to find the
impact of ex-dividend day on stock price of NYSE and LSE. This thesis also works on the basis
of research problem statement and tries to find the solution of research question in its findings
and analysis part.
9
2.5. PHILOSOPHY OF RESEARCH
Research philosophy or scientific ideal is an important part of any research. Researchers should
concentrate on what scientific ideal they are going to undertake and this ideal influences the
whole study. As a result the researchers show the reader which ideal, following his own
thoughts, suits their study the best. There are two different types of ideal: positivism and
interpretivism related with the research. Both are related with the epistemological consideration
which refers the way of measures the ontology (the real world i.e., the reality of observation). In
another way we can say-how we can study (know) the real world? (Bryman & Bell, 2007:16).
It‟s very important issue for a researcher to recognize their belief about the topics they want to
develop. This belief of thinking is defined as the research philosophy or research paradigm
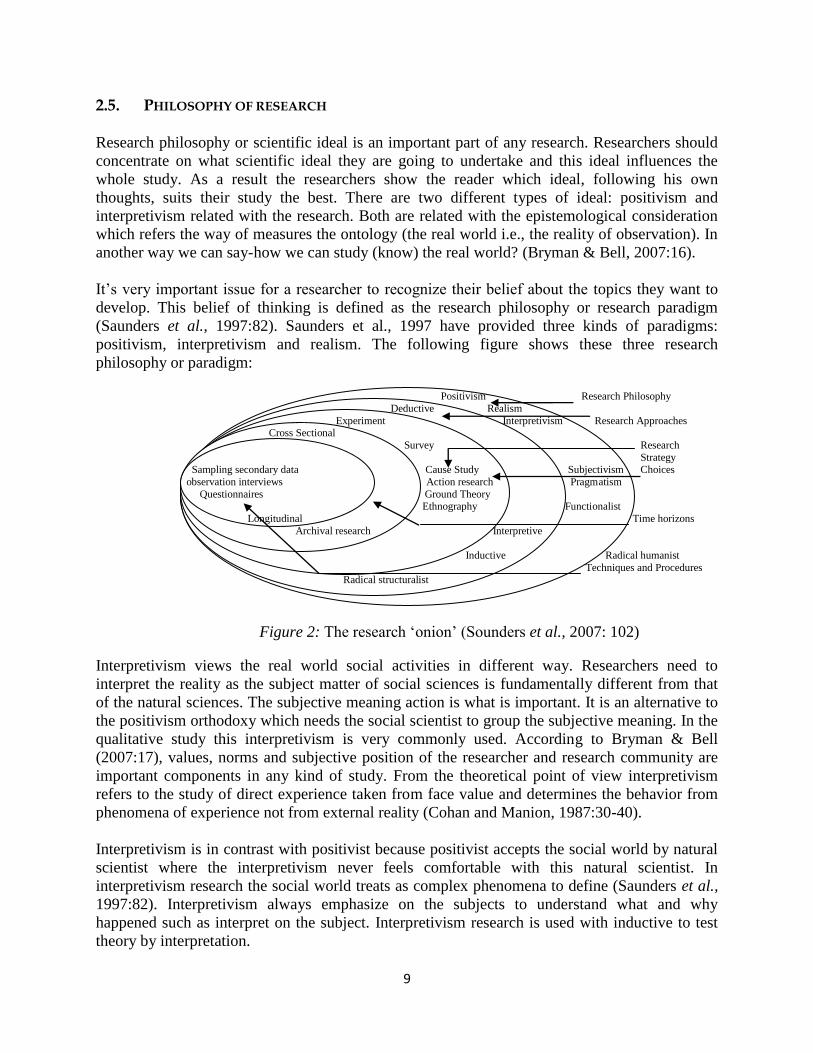
(Saunders et al., 1997:82). Saunders et al., 1997 have provided three kinds of paradigms:
positivism, interpretivism and realism. The following figure shows these three research
philosophy or paradigm:
Positivism Research Philosophy
Deductive Realism
Experiment Interpretivism Research Approaches Cross Sectional
Survey Research
Strategy Sampling secondary data Cause Study Subjectivism Choices
observation interviews Action research Pragmatism
Questionnaires Ground Theory Ethnography Functionalist
Longitudinal Time horizons
Archival research Interpretive
Inductive Radical humanist
Techniques and Procedures Radical structuralist
Figure 2: The research „onion‟ (Sounders et al., 2007: 102)
Interpretivism views the real world social activities in different way. Researchers need to
interpret the reality as the subject matter of social sciences is fundamentally different from that
of the natural sciences. The subjective meaning action is what is important. It is an alternative to
the positivism orthodoxy which needs the social scientist to group the subjective meaning. In the
qualitative study this interpretivism is very commonly used. According to Bryman & Bell
(2007:17), values, norms and subjective position of the researcher and research community are
important components in any kind of study. From the theoretical point of view interpretivism
refers to the study of direct experience taken from face value and determines the behavior from
phenomena of experience not from external reality (Cohan and Manion, 1987:30-40).
Interpretivism is in contrast with positivist because positivist accepts the social world by natural
scientist where the interpretivism never feels comfortable with this natural scientist. In
interpretivism research the social world treats as complex phenomena to define (Saunders et al.,
1997:82). Interpretivism always emphasize on the subjects to understand what and why
happened such as interpret on the subject. Interpretivism research is used with inductive to test
theory by interpretation.
10
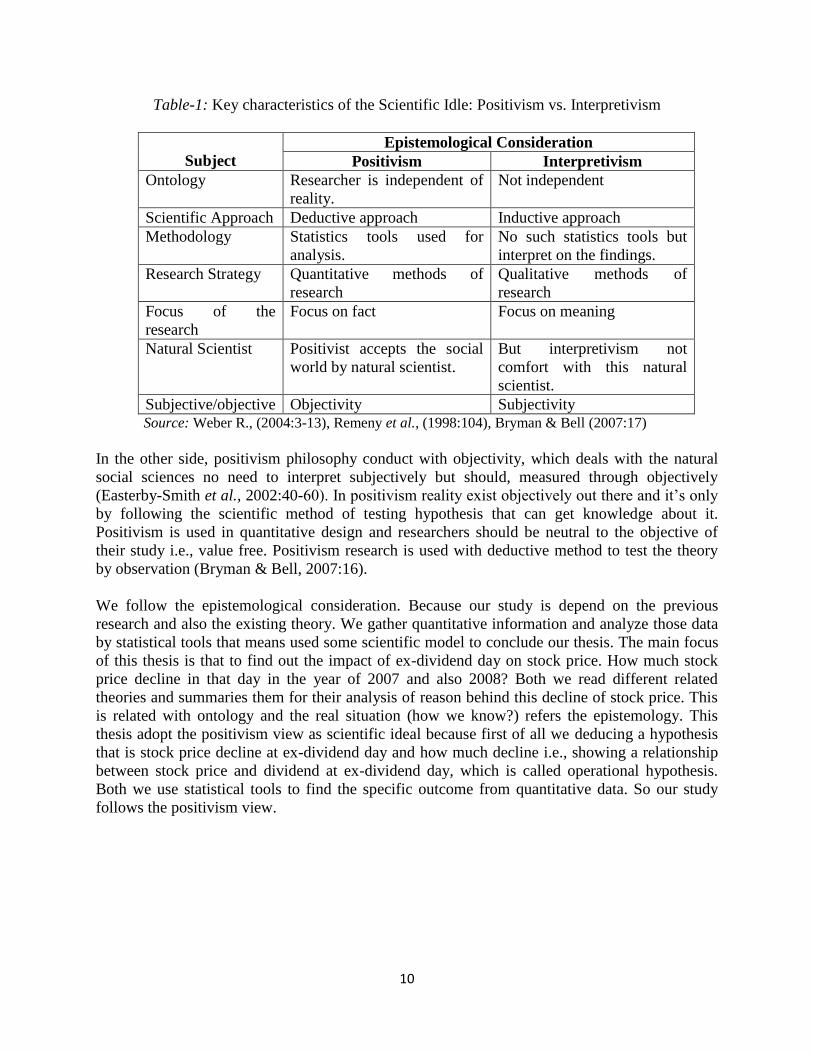
Table-1: Key characteristics of the Scientific Idle: Positivism vs. Interpretivism
Subject
Epistemological Consideration
Positivism Interpretivism
Ontology Researcher is independent of
reality.
Not independent
Scientific Approach Deductive approach Inductive approach
Methodology Statistics tools used for
analysis.
No such statistics tools but
interpret on the findings.
Research Strategy Quantitative methods of
research
Qualitative methods of
research
Focus of the
research
Focus on fact Focus on meaning
Natural Scientist Positivist accepts the social
world by natural scientist.
But interpretivism not
comfort with this natural
scientist.
Subjective/objective Objectivity Subjectivity Source: Weber R., (2004:3-13), Remeny et al., (1998:104), Bryman & Bell (2007:17)
In the other side, positivism philosophy conduct with objectivity, which deals with the natural
social sciences no need to interpret subjectively but should, measured through objectively
(Easterby-Smith et al., 2002:40-60). In positivism reality exist objectively out there and it‟s only
by following the scientific method of testing hypothesis that can get knowledge about it.
Positivism is used in quantitative design and researchers should be neutral to the objective of
their study i.e., value free. Positivism research is used with deductive method to test the theory
by observation (Bryman & Bell, 2007:16).
We follow the epistemological consideration. Because our study is depend on the previous
research and also the existing theory. We gather quantitative information and analyze those data
by statistical tools that means used some scientific model to conclude our thesis. The main focus
of this thesis is that to find out the impact of ex-dividend day on stock price. How much stock
price decline in that day in the year of 2007 and also 2008? Both we read different related
theories and summaries them for their analysis of reason behind this decline of stock price. This
is related with ontology and the real situation (how we know?) refers the epistemology. This
thesis adopt the positivism view as scientific ideal because first of all we deducing a hypothesis
that is stock price decline at ex-dividend day and how much decline i.e., showing a relationship
between stock price and dividend at ex-dividend day, which is called operational hypothesis.
Both we use statistical tools to find the specific outcome from quantitative data. So our study
follows the positivism view.
11
2.6. RESEARCH APPROACH
All kind of research project depends on the theories and empirical studies. Researchers now need
a scientific approach for their studies and they must select their scientific methods on the basis of
their scientific philosophy used in previous section. There are only two different approaches
available for researchers to study their research project such as inductive and deductive methods.
The researchers can start with an existing theoretical basis and then generating hypothesis. After
generating hypothesis they used empirical research result and data collection to test their
hypothesis. This is called deductive method that is use mainly in the quantitative research. It‟s
represent the relationship between existing theory and research. It is also called a hypothesis
testing theory because in this method a conceptual theoretical structure (model) is developed and
then tested it by using empirical data (Bryman and Bell, 2007:11).
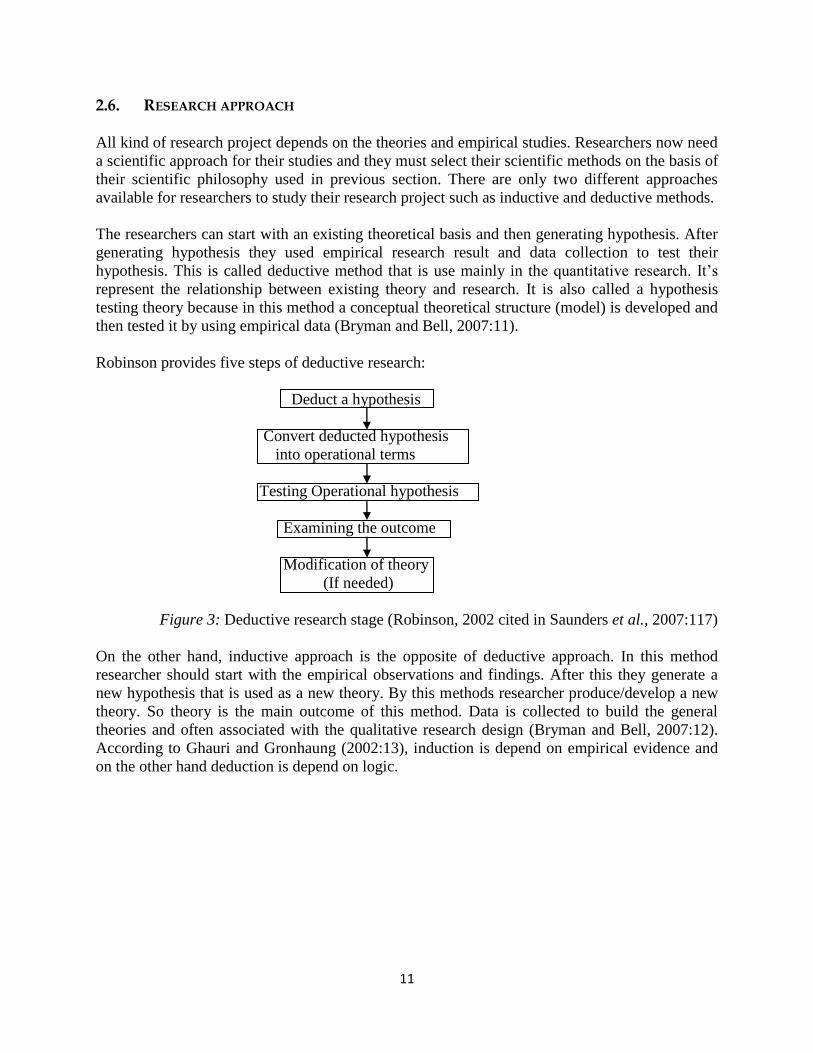
Robinson provides five steps of deductive research:
Deduct a hypothesis
Convert deducted hypothesis
into operational terms
Testing Operational hypothesis
Examining the outcome
Modification of theory
(If needed)
Figure 3: Deductive research stage (Robinson, 2002 cited in Saunders et al., 2007:117)
On the other hand, inductive approach is the opposite of deductive approach. In this method
researcher should start with the empirical observations and findings. After this they generate a
new hypothesis that is used as a new theory. By this methods researcher produce/develop a new
theory. So theory is the main outcome of this method. Data is collected to build the general
theories and often associated with the qualitative research design (Bryman and Bell, 2007:12).
According to Ghauri and Gronhaung (2002:13), induction is depend on empirical evidence and
on the other hand deduction is depend on logic.
12
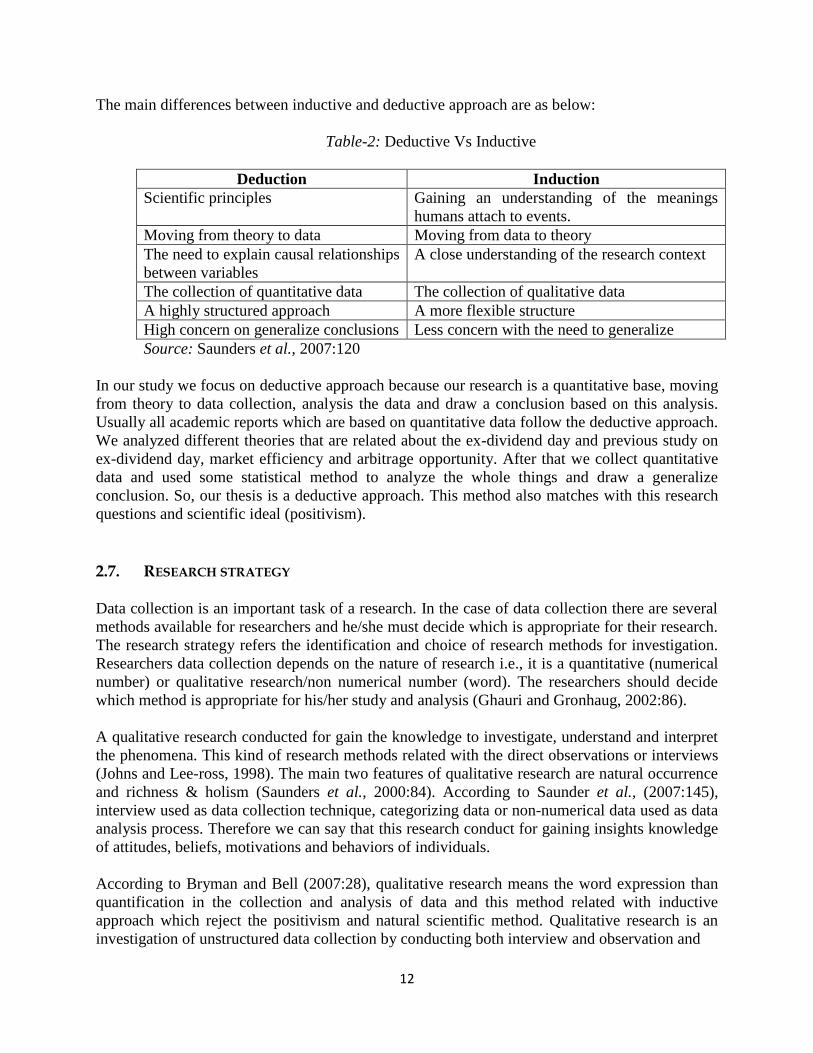
The main differences between inductive and deductive approach are as below:
Table-2: Deductive Vs Inductive
Deduction Induction
Scientific principles Gaining an understanding of the meanings
humans attach to events.
Moving from theory to data Moving from data to theory
The need to explain causal relationships
between variables
A close understanding of the research context
The collection of quantitative data The collection of qualitative data
A highly structured approach A more flexible structure
High concern on generalize conclusions Less concern with the need to generalize
Source: Saunders et al., 2007:120
In our study we focus on deductive approach because our research is a quantitative base, moving
from theory to data collection, analysis the data and draw a conclusion based on this analysis.
Usually all academic reports which are based on quantitative data follow the deductive approach.
We analyzed different theories that are related about the ex-dividend day and previous study on
ex-dividend day, market efficiency and arbitrage opportunity. After that we collect quantitative
data and used some statistical method to analyze the whole things and draw a generalize
conclusion. So, our thesis is a deductive approach. This method also matches with this research
questions and scientific ideal (positivism).
2.7. RESEARCH STRATEGY
Data collection is an important task of a research. In the case of data collection there are several
methods available for researchers and he/she must decide which is appropriate for their research.
The research strategy refers the identification and choice of research methods for investigation.
Researchers data collection depends on the nature of research i.e., it is a quantitative (numerical
number) or qualitative research/non numerical number (word). The researchers should decide
which method is appropriate for his/her study and analysis (Ghauri and Gronhaug, 2002:86).
A qualitative research conducted for gain the knowledge to investigate, understand and interpret
the phenomena. This kind of research methods related with the direct observations or interviews
(Johns and Lee-ross, 1998). The main two features of qualitative research are natural occurrence
and richness & holism (Saunders et al., 2000:84). According to Saunder et al., (2007:145),
interview used as data collection technique, categorizing data or non-numerical data used as data
analysis process. Therefore we can say that this research conduct for gaining insights knowledge
of attitudes, beliefs, motivations and behaviors of individuals.
According to Bryman and Bell (2007:28), qualitative research means the word expression than
quantification in the collection and analysis of data and this method related with inductive
approach which reject the positivism and natural scientific method. Qualitative research is an
investigation of unstructured data collection by conducting both interview and observation and
13
used the verbal description and explanations rather than quantifiable analysis (Hammersley,
1990).
In contrast a quantitative method refers the quantification of data, searching knowledge that will
measure, describe and explain in numerical way with reality. This method always well structured
and formalized by the researchers. This methods conduct in deductive approach with positivism
of scientific ideal and natural science of reality. (Bryman and Bell, 2007:28). Quantitative
research use questionnaire as collection technique, graphs, charts & statistical tools or uses
numerical data for analysis. Therefore we can say that this kind of research conduct with the
measurement of attitudes, behaviors and perceptions.
This thesis conducts as quantitative research on NYSE and LSE which reflects the 200
company‟s dividend and stock price. The impact of ex-dividend on stock price will measure by
the numerical and statistical tools. We can quantify data to describe and explain the changes of
stock price before and after dividend declaration in numerical way. We investigate secondary
data by using statistical tools for findings and analysis of assumption. So it is a purely
quantitative research.
2.8. CHOICE OF THEORIES
For the collection of theories we both give our concentration on findings related and interesting
literature, books and articles which are suit with our problem statement and purpose of the study.
Literature review refers the critical examination, summarization, interpretation or evaluation of
existing literature according to the subject matter of study. For this thesis both we prefer to
review the efficient market hypothesis, signaling hypothesis, studies on ex-dividend day, tax
effect, clientele effect, trading volume around the ex-dividend day, arbitrage opportunity etc. We
collected research methodologies books, finance related books and literature and also
summarized different theories according to research statement questions.
2.9. CHOICE OF DATA SOURCES
We used some data sources for our investigation and analysis by using internet sources, annual
reports, newspaper and academic articles published in different times. We collected stock and
dividend data from NYSE and LSE database system, USBE library database (Thomson
DataStream) and internet sources. For literature and theoretical review we used USBE library
database and also internet sources. We search word such as ex-dividend, dividend, stock price
impact etc. on internet or data base system.
14
2.10. CRITICISM OF DATA SOURCES
We both have an interest to use new sources for our study and it is an important issue to ensure
that uses of data are relevant, valid and up-to date. We used more up-to date information from
literature and articles which we have referred in our thesis. The literature review part gives the
up-to date information about the ex-dividend day impact on stock return. The sources we used in
our thesis are mostly taken from business and economics journals, previous academic research
and reports published by different universities.
We believe that their sources are more reliable and valid because they are published by well
known university, national and international journal publications authority, which ensures
reliability and quality also.
But it is really tough task to measure the quality, reliability and validity of the secondary sources.
Since, the secondary data are subject to manipulation that‟s why we have no control over
secondary data. There are some literatures used as secondary sources in the theoretical
framework which are not solely based on ex-dividend day theory. Many literatures emphasize on
the empirical result and the effect of ex-dividend day rather than theoretical matter.
15
CHAPTER THREE THEORIES AND LITERATURES REVIEW
In this section, we have tried to provide some key words and concepts which are related to the
thesis and try to also relate with the previous studies on the similar subject.
3.1. THE EFFICIENT MARKET HYPOTHESIS (EMH)
This hypothesis stated that the capital market is efficient and the behavior of stock prices is
related with the information i.e. under the efficient market hypothesis the investors are rational
and they all have right to use the same information and have similar expectations regarding their
investment. Also, in an efficient market, all available information is reflected in stock prices
quickly and fully (Fama, 1970).
According to Fama, the capital market is considered to be efficient in three different forms: the
weak form, semi-strong form and the strong form of efficiency. The different forms of efficient
market hypothesis have been tested by Fama and he also documented the evidence in favor of the
existence of efficient market.
According to the idea of the efficient market theory that in an efficient market the prices of stock
are continuously adjusted to new and correct levels as and when the new information arrives in
the market. As a result, investors cannot outperform consistently by doing the fundamental
analysis and technical analysis (Kevin, 2006:124).
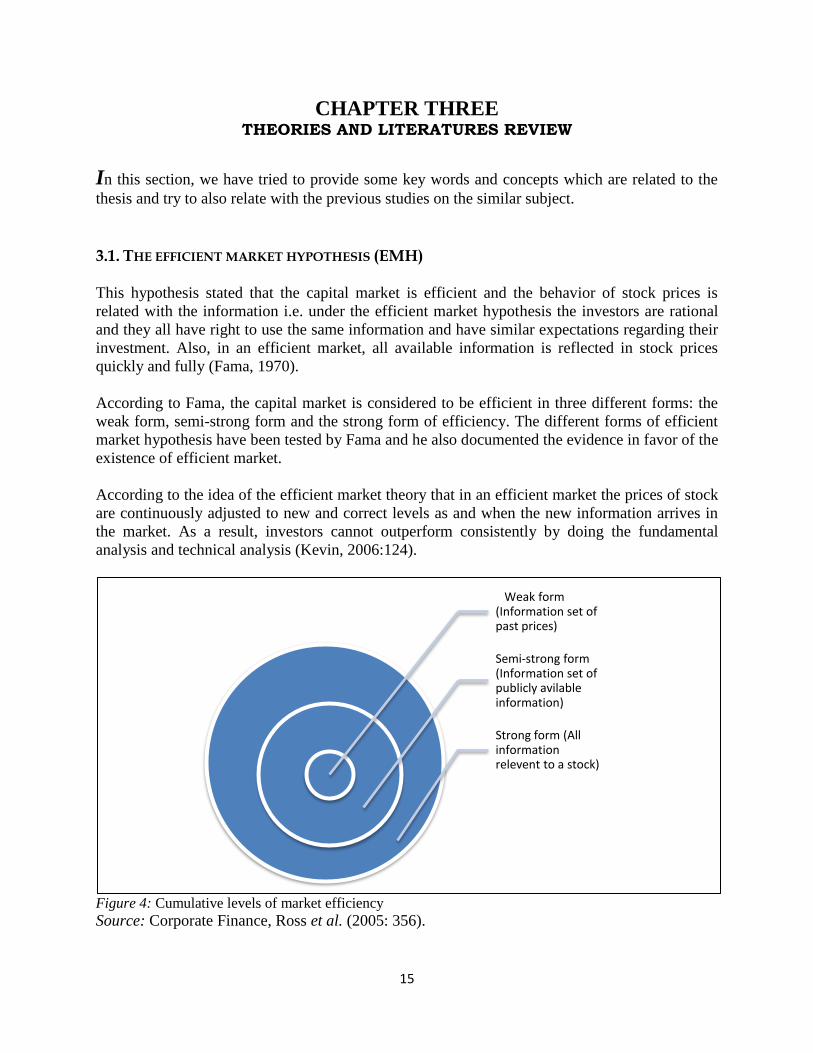
Figure 4: Cumulative levels of market efficiency Source: Corporate Finance, Ross et al. (2005: 356).
Weak form (Information set of past prices)
Semi-strong form (Information set of publicly avilable information)
Strong form (All information relevent to a stock)
16
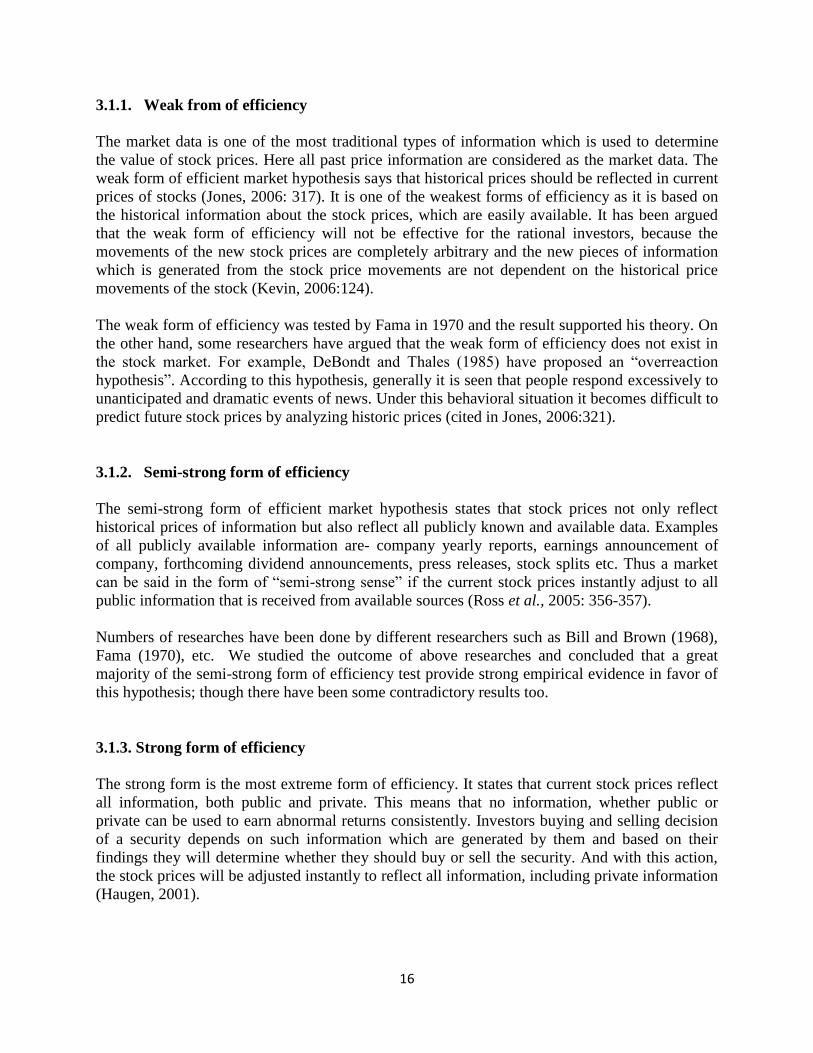
3.1.1. Weak from of efficiency
The market data is one of the most traditional types of information which is used to determine
the value of stock prices. Here all past price information are considered as the market data. The
weak form of efficient market hypothesis says that historical prices should be reflected in current
prices of stocks (Jones, 2006: 317). It is one of the weakest forms of efficiency as it is based on
the historical information about the stock prices, which are easily available. It has been argued
that the weak form of efficiency will not be effective for the rational investors, because the
movements of the new stock prices are completely arbitrary and the new pieces of information
which is generated from the stock price movements are not dependent on the historical price
movements of the stock (Kevin, 2006:124).
The weak form of efficiency was tested by Fama in 1970 and the result supported his theory. On
the other hand, some researchers have argued that the weak form of efficiency does not exist in
the stock market. For example, DeBondt and Thales (1985) have proposed an “overreaction
hypothesis”. According to this hypothesis, generally it is seen that people respond excessively to
unanticipated and dramatic events of news. Under this behavioral situation it becomes difficult to
predict future stock prices by analyzing historic prices (cited in Jones, 2006:321).
3.1.2. Semi-strong form of efficiency
The semi-strong form of efficient market hypothesis states that stock prices not only reflect
historical prices of information but also reflect all publicly known and available data. Examples
of all publicly available information are- company yearly reports, earnings announcement of
company, forthcoming dividend announcements, press releases, stock splits etc. Thus a market
can be said in the form of “semi-strong sense” if the current stock prices instantly adjust to all
public information that is received from available sources (Ross et al., 2005: 356-357).
Numbers of researches have been done by different researchers such as Bill and Brown (1968),
Fama (1970), etc. We studied the outcome of above researches and concluded that a great
majority of the semi-strong form of efficiency test provide strong empirical evidence in favor of
this hypothesis; though there have been some contradictory results too.
3.1.3. Strong form of efficiency
The strong form is the most extreme form of efficiency. It states that current stock prices reflect
all information, both public and private. This means that no information, whether public or
private can be used to earn abnormal returns consistently. Investors buying and selling decision
of a security depends on such information which are generated by them and based on their
findings they will determine whether they should buy or sell the security. And with this action,
the stock prices will be adjusted instantly to reflect all information, including private information
(Haugen, 2001).
17
Generally the efficient market hypothesis (EMH) states that the stock price should be reflected
all available information and in that sense it has an impact both for firms and investors. The fact
is that the prices of stock continuously absorb the all available market information. Due to this
reasons the investor cannot outperform successfully by using the available information in a
superior way. In this regard, investors always expect a usual rate of return as the prices of stock
are adjusted the available market information automatically before the trade. Furthermore, some
other mechanisms are also responsible for maintaining the market efficient (Ross et al., 2005).
It has been noted that the above three forms of market efficiency are cumulative. If one considers
the semi-strong form of efficiency, it includes the weak form of efficiency also and if one
considers the strong form of efficiency, weak form and semi-strong form of efficiencies are also
included (Jones, 2006).
In efficient capital market, stock prices reflect all the available information both public and
private. Also, it is generally known that stock price decline on ex-day, but we focus on the
amount of decline. Some school of thoughts agrees that drop of stock price on ex-dividend day is
same as amount of dividend paid on dividend day. However, other school of thought does not
agree on that notion. The following reasons are forwarded to explain the differences in the
behavior of stock prices on ex-dividend day. The first one is the tax differential between
dividends and capital gains, the second one is different countries have different tax factors, the
third one is cost of transactions, the forth one is the changes of tax policy and the fifth one is the
exclusion of fixed commission. A number of extensive researches were done by a number of
researchers in favor of above reasons. Like, Litzenberger and Ramaswamy (1979); Poterba &
Summers (1984); and Barclay (1987) did a study on US market and their study support on the
first one. The second reason was supported by following studies such as, Booth and Johnson
(1984) for Canada; Hietala and Keloharju, (1995) for Finland; Michaely and Murgia (1995) for
Italy; Lasfer (1995) for the U.K.; Kato & Loewenstein (1995) for Japan; and Frank &
Jagannathan (1998) for Hong Kong. In 1982, Kalay and in 1994, Boyd & Jagannathan did their
study in favor of the third reason. The study of Boyd & Jagannathan (1994) also supported the
fourth and fifth reason (Cited in Nikolaos et al., 2006).
3.2. DIVIDEND
Dividend as usually refers to any kind of direct cash distribution of company‟s earnings (after
tax) to the shareholders. Usually public companies pay regular cash payout as dividend and it
may be four times in a year. Sometimes the company declares stock as dividend, either as an
extra dividend or in place of cash dividend. The firm has various possibilities on how to use the
cash they have acquired from past operations (Rose et al., 2005:502).
The firm can use two types of sources for financing. One is internal financing and another one is
external financing. When a firm is able to generate a huge amount of cash, it has three general
purposes: firstly it can use this cash to pay salaries, cost of materials and pay taxes etc.; secondly
the firm can use this amount for development and the thirdly the firm can use the residual
amount to pay dividend to its shareholders. The proportion of earnings of the company can be
distributed to their shareholders in three different ways. Firstly it is made by a cash dividend,
18
secondly the firm can repurchase its stock and the thirdly the stock split or stock dividend
(Pinches, 1996 cited in Alm & Arefjäll, 1999).
Days
Monday Wednesday Friday Monday
January January January March
15 28 30 16
Declaration Ex-dividend Record Payment
Date Date Date Date
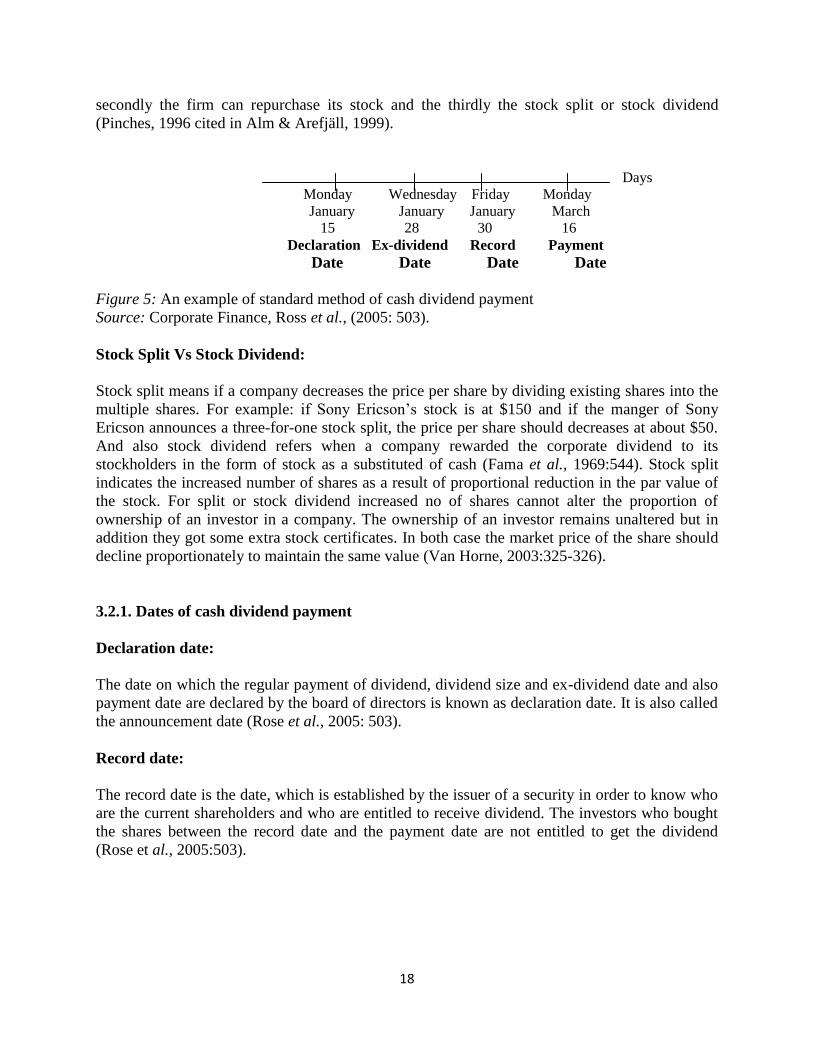
Figure 5: An example of standard method of cash dividend payment
Source: Corporate Finance, Ross et al., (2005: 503).
Stock Split Vs Stock Dividend:
Stock split means if a company decreases the price per share by dividing existing shares into the
multiple shares. For example: if Sony Ericson‟s stock is at $150 and if the manger of Sony
Ericson announces a three-for-one stock split, the price per share should decreases at about $50.
And also stock dividend refers when a company rewarded the corporate dividend to its
stockholders in the form of stock as a substituted of cash (Fama et al., 1969:544). Stock split
indicates the increased number of shares as a result of proportional reduction in the par value of
the stock. For split or stock dividend increased no of shares cannot alter the proportion of
ownership of an investor in a company. The ownership of an investor remains unaltered but in
addition they got some extra stock certificates. In both case the market price of the share should
decline proportionately to maintain the same value (Van Horne, 2003:325-326).
3.2.1. Dates of cash dividend payment
Declaration date:
The date on which the regular payment of dividend, dividend size and ex-dividend date and also
payment date are declared by the board of directors is known as declaration date. It is also called
the announcement date (Rose et al., 2005: 503).
Record date:
The record date is the date, which is established by the issuer of a security in order to know who
are the current shareholders and who are entitled to receive dividend. The investors who bought
the shares between the record date and the payment date are not entitled to get the dividend
(Rose et al., 2005:503).
19
Ex-dividend date:
According to NYSE rules, on and after the second business day of record called the ex-dividend
day. Therefore, we can say that the ex-dividend day refers the first trading day where a new
buyer is not entitled to the dividend declared on a company‟s share. In the standard method of
dividend payment at NYSE, 28th
January is the ex-dividend day which is two days before the
record date (30th
January) (Rose et al., 2005: 503).
Cum-dividend date:
The date before the ex-dividend date is called the cum-dividend date. The investors who buys
stock during the cum-dividend date they are allowed to receive the dividend. However, investors
who buy stock on the ex-dividend date they are not allowed to receive the dividend.
Payment date:
The payment date is the date on which the company mailed the check to those investors who
bought the shares before the ex-dividend date and the dividend payment is recorded (Rose et al.,
2005:503).
The ultimate goal of an organization is maximization of shareholders wealth. From the
shareholders point of view maximization of shareholders wealth is the main objective of a
manager. That‟s why, it is necessary to know that if the investors prefer dividends or capital
gains. Generally it is seen that, if the tax rate of capital gains is higher than the dividends, the
investors prefer dividend rather than the capital gain. And on the other hand if the tax rate of
dividend is higher than the capital gain, the investors prefer capital gain instead of dividend.
There are a number of different theories, which are related to investor‟s preference, and these
theories try to explain the reasons for certain dividend level (Brigham and Houston, 2004).
For example: The first theory is the “Dividend irrelevance theory” documented by Merton Miller
and Franco Modigliani (MM) in 1961. Dividend irrelevance theory states that dividend decisions
are irrelevant, as it does not affect the value of the firm or its cost of capital. This irrelevance
theory argues that the firm‟s stock is not affected by the dividend. Hence, it is called dividend
irrelevance theory as firm‟s dividend policy has no influence on the market price of the shares
(Brigham and Houston, 2004:523). MM argued that firm‟s value is related to the earnings that is
generated from its assets. It does not depend on dividend and retained earnings (1961, cited in
Brigham and Houston, 2004:523). The second theory is the “Bird in hand” theory by Gordon and
Linter. This theory is based on relevance concept of dividend policy. Gordon and Linter asserted
that the investors are usually risk averse, so they prefer the current income in form of dividend,
as against the uncertain future dividends and capital gains. In other word we can say that
investors are not interested to take risk for future dividend, they always put positive premium on
current dividend income. Gordon and Linter also argued that the value of share is adversely
affected when the firm retains its earnings instead of paying dividend. For this reason, investors
emphasize on less importance on future dividends (Gordon, 1963:264-272; Lintner, 1962:243-
269). The third theory is the “Tax preference theory”. Investors have a preference a low dividend
ratio is to high payout in spite of this theory (Brigham & Houston, 2004:523-524).
20
There are other competing theories which make the dividend related issues more complex. Some
of these theories include Signaling hypothesis, Tax effects, and Clientele effects.
3.3. SIGNALING HYPOTHESIS
According to Bhattacharya, the signaling theory refers that the positive excess of return is the
consequence of an unanticipated increase in dividend (Bhattacharya, 1979:259-270). Some
empirical research suggests that dividend acts as signal for a firm. Usually it is seen that the
stock price of a firm will increase if the firm declares to increase its dividend however, the stock
price of a firm will decrease if the firm announces to decrease its dividend (Ross et al., 2005:
519). In 1983, Asquith and Mullins estimated that on the declaration of dividend initiations the
prices of stock increases about 3%. On the other hand, Healy and Palepu (1988) and Michealy et
al., (1995) stated that on the declaration of dividend exclusions the prices of stock goes down
about 7%. Some authors argue that firms are not interested to cut the dividend but the firm will
only be interested to increase the dividend when there is a probability of increasing its future
earnings and cash flow (Ross et al., 2005: 519-520).
Moreover, empirical research have found that, usually, the market responds positively if the firm
declares to increase its dividend and the market responds negatively if the firm declares to reduce
its dividend. The announcement of dividend will convey information about the future prospects
of the firm (Ogden et al., 2003: 485).
3.4. STUDIES ON EX-DIVIDEND DAY
In this part we shall discuss the past study that has been done on Ex-divided day and what
affecting the stock price behavior on ex-divided day. Past research has been documented an
evidence that the stock price shall fall on ex-dividend day but did not documented the actual
amount of stock price drop under the tax environment. In this study, we attempted to find out the
amount of stock price fall on ex-dividend day in a tax environment. Most of the researcher
argued that the stock price fall less than the divided amount on ex-divided day because of tax
theory. Tax theory explains that due to higher tax tare on divided than capital gain, investor
prefer not to have the dividend.
The earliest studies of stock price behavior on ex-dividend day were done by Campbell and
Beranek in 1955. They observed that the price of stock on ex-dividend day drop less than the
amount of dividend but the drop amount is very less (cited in Duatta et al., 2004). After the
publication of the results of studies by Elton and Gruber (1970) the debate on the stock price
behavior on ex-dividend day has become wide spread. Different schools of thoughts have
suggested different reasons for the stock price behavior on ex-dividend day, some of which are
contradictory to each other.
When an individual investor buys shares before the ex-dividend day he will be entitle to get the
current dividend, on the other hand, an investor who buy shares on or after the ex-dividend day
will not be entitled to receive the dividend. So, when a company pays out dividend, generally it
21
is seen that the stock prices fall on the ex-dividend day because cash has been sent out (Ross et
al., 2005: 503-504).
Alm & Arefjall explained the effect of ex-dividend day. According to them, the effect is the
cause of two price differentiations between cum-dividend day and ex-dividend day compare to
the divided amount (Alm & Arefjäll, 1999).
Though many researchers have written and explained about ex-dividend day, Eades et al., (1984)
and Grinblatt et al., (1984) were the probably first writers who wrote about the so called ex-
dividend day effect on the surrounding ex-dividend days in their research paper. In fact, the word
ex-dividend day effect is first coined by the Claesson in 1987. She did a study on the efficiency
of the Stockholm Stock Exchange during the period from January 1978 to May 1985. In her
analysis, she divided the dividend with the stock price of cum-dividend day and the result on
average dividend yield was 4.25%. The average price dropped by 4.18% on the ex-day. The
price to dividend ratio was 0.984 and the return that was given by 0.07% units ((1-
0.984)*4.25%) is greater in comparison with the normal daily return. It is seen that on the ex-
dividend day the price of the stock is almost exactly same as the dividend paid out (cited in Alm
& Arefjäll, 1999).
Alm and Arefjäll, made an empirical study on the same topic. In their paper they investigated
the above topic with other sub- topic as regards arbitrage possibilities. The study is based on the
sample data of Stockholm Stock Exchange from the companies which paid dividend between
1996 and 1998. For testing the null hypothesis they did the t-test. They documented that on
average stock prices drop was less than the amount of dividend paid out (Alm & Arefjäll, 1999).
Eades et al., (1984:3-34) made a study on the ex-date dividend return for a nonconvertible
preferred share sample. The preferred stocks are characterized by a relatively preferred dividend
yield. They used data between the time period of January 1, 1974 and December 31, 1981. They
concluded that the average excess return was a considerably negative -0.141%, which indicates
that the price of the stock dropped by the more than the dividend amount.
3.4.1. Tax Effect
Usually it has been said that tax has a great impact on dividend and capital gain. Moreover,
market valuation of dividends depends on the tax, which is a gradually becoming more important
issue. If the corporate tax is higher than the personal tax, the company would have an intention to
increase the dividend yield and on the other hand if the corporate tax is lower than the personal
tax, the company would have an intention to reduce the dividend yield (Ross et al., 2005:515).
In 1970, Elton and Gruber published an article about the stock price behavior on the ex-dividend
day. They were the first researchers who said that the behavior of stock price on ex-dividend day
was due to the effect of taxation.
Elton and Gruber did a study to measure the clientele effect and also identify the investor‟s
marginal tax rate by examining the average price decline on the ex-dividend day. Their study
was based on the data of New York Stock Exchange. They used the data of all companies on
22
NYSE that paid dividend between the period of April 1, 1966 and March 31, 1967 and did trade
on the previous day and on the ex-dividend day. Furthermore they developed a formal equation
(1) given below.
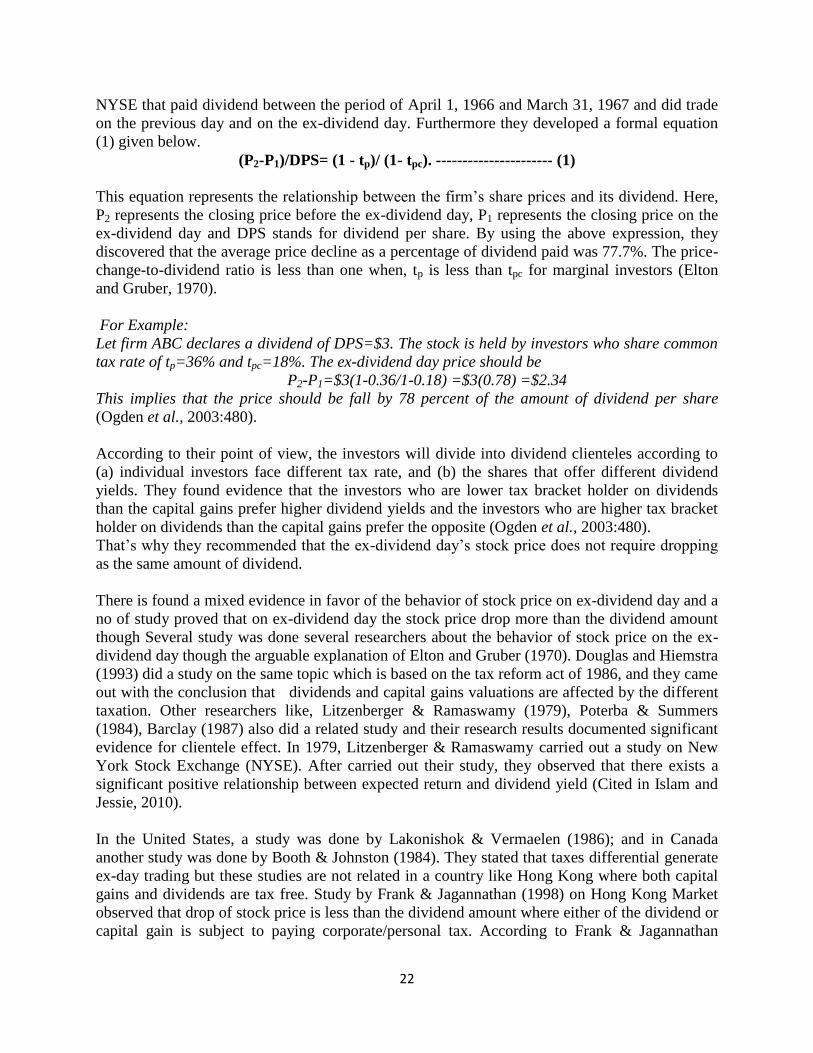
(P2-P1)/DPS= (1 - tp)/ (1- tpc). ---------------------- (1)
This equation represents the relationship between the firm‟s share prices and its dividend. Here,
P2 represents the closing price before the ex-dividend day, P1 represents the closing price on the
ex-dividend day and DPS stands for dividend per share. By using the above expression, they
discovered that the average price decline as a percentage of dividend paid was 77.7%. The price-
change-to-dividend ratio is less than one when, tp is less than tpc for marginal investors (Elton
and Gruber, 1970).
For Example:
Let firm ABC declares a dividend of DPS=$3. The stock is held by investors who share common
tax rate of tp=36% and tpc=18%. The ex-dividend day price should be
P2-P1=$3(1-0.36/1-0.18) =$3(0.78) =$2.34
This implies that the price should be fall by 78 percent of the amount of dividend per share
(Ogden et al., 2003:480).
According to their point of view, the investors will divide into dividend clienteles according to
(a) individual investors face different tax rate, and (b) the shares that offer different dividend
yields. They found evidence that the investors who are lower tax bracket holder on dividends
than the capital gains prefer higher dividend yields and the investors who are higher tax bracket
holder on dividends than the capital gains prefer the opposite (Ogden et al., 2003:480).
That‟s why they recommended that the ex-dividend day‟s stock price does not require dropping
as the same amount of dividend.
There is found a mixed evidence in favor of the behavior of stock price on ex-dividend day and a
no of study proved that on ex-dividend day the stock price drop more than the dividend amount
though Several study was done several researchers about the behavior of stock price on the ex-
dividend day though the arguable explanation of Elton and Gruber (1970). Douglas and Hiemstra
(1993) did a study on the same topic which is based on the tax reform act of 1986, and they came
out with the conclusion that dividends and capital gains valuations are affected by the different
taxation. Other researchers like, Litzenberger & Ramaswamy (1979), Poterba & Summers
(1984), Barclay (1987) also did a related study and their research results documented significant
evidence for clientele effect. In 1979, Litzenberger & Ramaswamy carried out a study on New
York Stock Exchange (NYSE). After carried out their study, they observed that there exists a
significant positive relationship between expected return and dividend yield (Cited in Islam and
Jessie, 2010).
In the United States, a study was done by Lakonishok & Vermaelen (1986); and in Canada
another study was done by Booth & Johnston (1984). They stated that taxes differential generate
ex-day trading but these studies are not related in a country like Hong Kong where both capital
gains and dividends are tax free. Study by Frank & Jagannathan (1998) on Hong Kong Market
observed that drop of stock price is less than the dividend amount where either of the dividend or
capital gain is subject to paying corporate/personal tax. According to Frank & Jagannathan
23
(1998) the reason of such stock price movement is bid and ask spread where investors
expectation act as a rules of thumbs of such stock price behavior. By support of Frank &
Jagannathan (1998), Bali and Hite (1998: 127-159) has been performed to observe the trading
around ex-dividend day. His model explained that the stock prices are discrete and dividends are
continuous and small. The study documented that the fall of stock price less the dividend amount
is not tax effect but short-term trading effect.
In Japan, the tax system is quietly different from other countries in regards to dividend income.
There is a complete different tax system for the short term and long term trading in other
countries. But in the stock market of Japan, investors have no variation in their tax system either
short term or long term trading (Kato & Lowenstein, 1995). This unique attribute of Japan stock
market always create pressure on the corporate trading. Kato & Lowenstein (1995) also found
that dividend or tax have no direct effect on the stock price behavior around ex-dividend day.
According to some previous studies on the stock volume reveals that selling pressure and buying
pressure increase before and after the declaration of ex-date respectively.
Changing of tax code has noticeable impact on the stock price behavior and volume on ex-date
(Michaely & Murgia, 1995). In 1988, UK stock market has dramatically changed after the
changes of income and corporate tax. A. Lasfer (1995) studied the UK stock market behavior
before and after the changes in the taxation system. Significant differentiation in taxation
especially on capital gains and dividends made positive effect on the stock return as well as when
the differentiation was withdrawn it made return negative. A. Lasfer (1995) also found positive
stock return on ex-date. Before tax, investors equally evaluated the dividend and capital gains.
So, on ex-day stock price will fall the same amount as the dividend (Barclay, 1987).
The greater variation between the dividends and capital gains on the basis of tax rate gives higher
returns on ex-date (Lasfer & Zenonos, 2003). Lasfer & Zenonos (2003) studied France,
Germany, Italy & Uk stock market for the ex-date stock price behavior and got a positive
relation with the modified tax rate.
Barclay‟s (1987) documented strong evidence in support of tax effect. He stated in his study that
before confirmation of income tax in US market, the drop of stock amount was same as the
amount of dividend. A number of empirical researches presented evidence in support of tax
effect. For example: Study done by Lakonishok & Vermaelen in 1983 and Booth & Johnston in
1984 for Canada; Lasfer in 1995 for U.K; Sarig & Tolkowsky in 1997 for Israel; Jacob &
Akhmedov in 2006 for Denmark; and Hietala & Keloharju in 1995 on Finnish market (Cited in
Islam and Jessie, 2010).
In 2002, Nikolaos et al., made a research on the behavior of ex-dividend day on share prices in
the Chinese stock market. In his study, he used the data of companies in the share between the
time periods of January, 1996 to December, 1998 and showed that the fall of stock price on ex-
dividend day is exactly same as the amount of dividend.
For examining the non-taxable sample observations he used four hypotheses that added the raw
price ratio (RPR), Market adjusted price ratio (MAPR), raw price drop ratio (RPD), and also the
Market adjusted price drop (MAPD). The experimental and theoretical values of mean and
median for RPR, MAPR, RPD, MAPD were represented and also the standard deviation. The
differences that happened as regard the mean from their relating theoretical values where tested
using the t-test.

24
They came out with the conclusion for their hypothesis testing that the results indicating that in
non-taxable observations, the share price fall on the ex-dividend day is exactly same as the
amount of dividend and for the taxable stock, he came out with the solution that the price of the
stock drops as regard as the same amount of dividend (Nikolaos et al., 2002).
A number of empirical studies have challenged Elton and Gruber‟s analysis. Due to the
following two biases Kalay did not support the tax hypothesis. The following two potential biases
are:
“First, the documented positive correlation can be the result of an incomplete adjustment for the
"normal" daily price movement and the use of closing prices on the ex-dividend day.”
“Second, the statistical significance of the measured correlation is questionable as some of the
observations are likely to be depended” (Kalay, 1982:1067-1068).
Another study done by Bhardwaj & Brooks (1999:503-514) has been performed on NYSE from
year 1986 to year 1989. They compared the drop of stock price with dividend yield. The study
argued that tax clientele effect play a vital role on ex-divided day stock price behavior.
Nikolaos & Travlos (2006) did a study on Athens Stock Exchange where both capital gains and
dividends were tax-free income. They documented that the price of stocks drops less than the
amount of dividend which is the result of microstructure effect not tax effect.
3.4.2. Clientele effect
The theory that is related on the idea that that a company‟s share price depends on the following
factors such as investors‟ preferences on different tax policies, investors demand, dividend or
other policy change that affects the company. The clientele effect implies that investors are
attracted to different company policies, and that an investor will adjust his stock holdings in
correspondence with the change of company policies. So, the stock price will move due to this
adjustment (Ross et al., 2005).
In 1961, Miller and Modigliani was suggested the clientele effect which states that clientele
effect is the cause of management‟s unwillingness of setting an exact payout ratio which may
motivate stockholders to pay unwanted transaction cost (cited in Copeland et al., 2005: 663).
Elton and Gruber (1970) argued that an individual investor will not be able to receive the
declared dividend if he sells the shares before the ex-dividend day. But on the other hand that if
he sells the shares on the ex-dividend day, he has to sell it at a very low price since the dividend
he has to retain.
Moreover, they also argued that a company‟s share price will vary in relation to the demand and
goal of investors in reaction to tax policies and other policies. According to this theory it has
been said that investors always concern about their interest i.e. they always think about the
policies of different companies and they will adjust their holdings of stock quickly, if the
company change their policy. The price will react because of these changes. For example
imagine there are two companies A and B respectively. In order to attract the investor company,
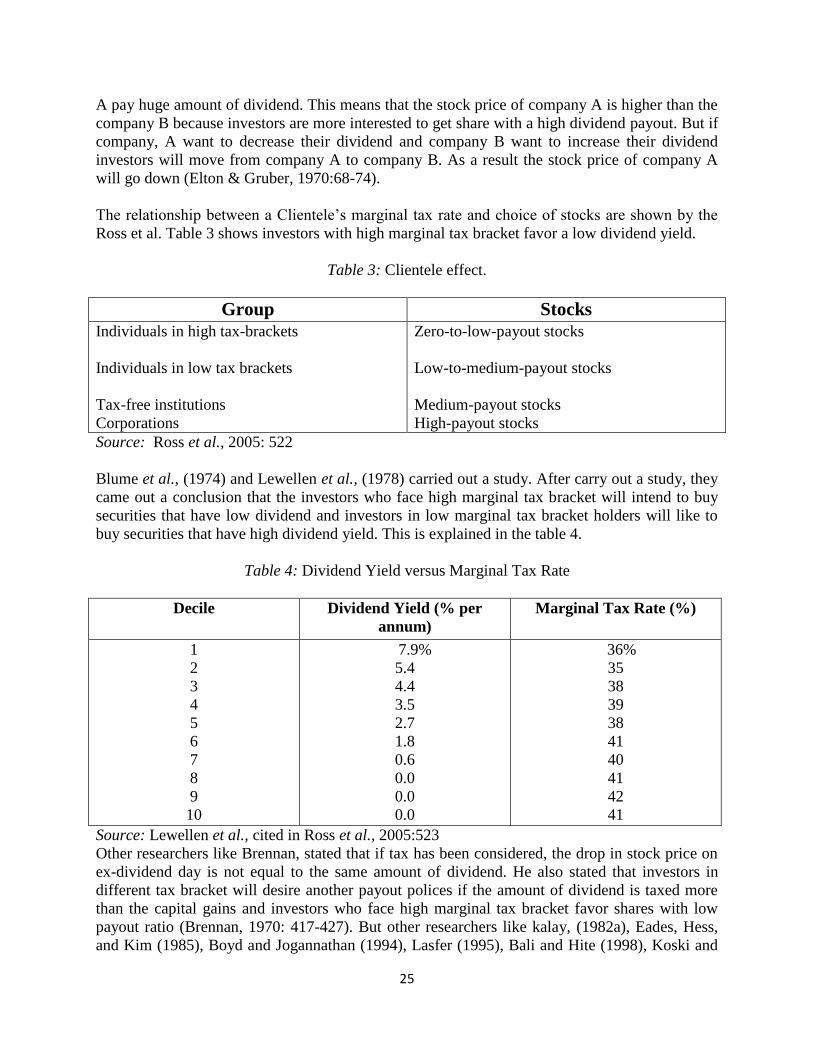
25
A pay huge amount of dividend. This means that the stock price of company A is higher than the
company B because investors are more interested to get share with a high dividend payout. But if
company, A want to decrease their dividend and company B want to increase their dividend
investors will move from company A to company B. As a result the stock price of company A
will go down (Elton & Gruber, 1970:68-74).
The relationship between a Clientele‟s marginal tax rate and choice of stocks are shown by the
Ross et al. Table 3 shows investors with high marginal tax bracket favor a low dividend yield.
Table 3: Clientele effect.
Group Stocks
Individuals in high tax-brackets
Individuals in low tax brackets
Tax-free institutions
Corporations
Zero-to-low-payout stocks
Low-to-medium-payout stocks
Medium-payout stocks
High-payout stocks Source: Ross et al., 2005: 522
Blume et al., (1974) and Lewellen et al., (1978) carried out a study. After carry out a study, they
came out a conclusion that the investors who face high marginal tax bracket will intend to buy
securities that have low dividend and investors in low marginal tax bracket holders will like to
buy securities that have high dividend yield. This is explained in the table 4.
Table 4: Dividend Yield versus Marginal Tax Rate
Decile Dividend Yield (% per
annum)
Marginal Tax Rate (%)
1
2
3
4
5
6
7
8
9
10
7.9%
5.4
4.4
3.5
2.7
1.8
0.6
0.0
0.0
0.0
36%
35
38
39
38
41
40
41
42
41
Source: Lewellen et al., cited in Ross et al., 2005:523
Other researchers like Brennan, stated that if tax has been considered, the drop in stock price on
ex-dividend day is not equal to the same amount of dividend. He also stated that investors in
different tax bracket will desire another payout polices if the amount of dividend is taxed more
than the capital gains and investors who face high marginal tax bracket favor shares with low
payout ratio (Brennan, 1970: 417-427). But other researchers like kalay, (1982a), Eades, Hess,
and Kim (1985), Boyd and Jogannathan (1994), Lasfer (1995), Bali and Hite (1998), Koski and
26
Scruggs (1998), and Kalay and Michalely (2000) research papers suggesting that the behavior of
stock prices on ex-dividend day is not only the result of tax effects ( cited in Ogden et al.,
2003:480).
In our thesis we are not going to examine the tax effect, clientele effect. But it is necessary to
understand clientele effect in order to understand the ex-dividend day effect. The central theme
of this thesis is, if the drop of stock price is more than the amount of dividend declared on ex-
dividend day.
3.4.3. Trading volume around the ex-dividend day
In 1986, Lakonishok and Vermaelen made an empirical study on tax arbitrage by examining the
volume of trading around the ex-dividend day. After carry out of their study, they suggested that
the volume should be unusually high around the ex-dividend day. Moreover, it should be
positively related to dividend yield and negatively related to costs of transactions and it is the
result of existence of tax arbitrage. The outcome of their findings is that around the ex-dividend
days the trading volume increasing extensively (Lakonishok, and Vermaelen, 1986, cited in
Copeland et al., 2005:666-667).
Generally trading volume increases during the time of dividend declaration date and the ex-
dividend date. One of the reasons for this incident is to shareholder‟s tax category. If the
shareholders are in the high tax bracket, they usually sell their share within the time of
declaration date and the ex-dividend date to get the capital gain. On the other hand, shareholders
in the low tax bracket do the opposite; they buy the share‟s to get the dividend gain. Either
capital gain or dividend induced the shareholders to change their ownership of shares which
ultimately create the result of high volume of trading in the period of announcement and ex-
dates. In 1974 Richardson et al., and in 1985 Acquith & Krasker studied the trading volume
around the declaration date and also during the time of declaration date and ex-dates. Both
studies find statistically unusual trading volume in that period (Copeland et al., 2005:673).
3.4.4 Arbitrage opportunity
Arbitrage is a mechanism by buying an asset in a lower price in one market and simultaneously
selling the same product at a higher price on different market in order to make profit.
The theory that is documented by Ross in 1976 is called the “Arbitrage pricing theory.” The APT
theory is based on these assumptions-1) the capital marker are perfectly competitive 2) all
investors are risk-averse and they all have same expectations regarding their investments 3) the
market are frictionless. APT represents a relationship between risk and return. In 2005, Ross
states the factor model. Factor model explain different economic factors which has direct relation
to determine the return of an assets. The factor model also explains that the risky assets expected
return has linier relation with the different factors of the model (Ross et al., 2005).
Generally it is considered that arbitrage opportunity is the result of information asymmetry. For
example, an investor who purchases a share of Volvo for 20 SEK from one market and
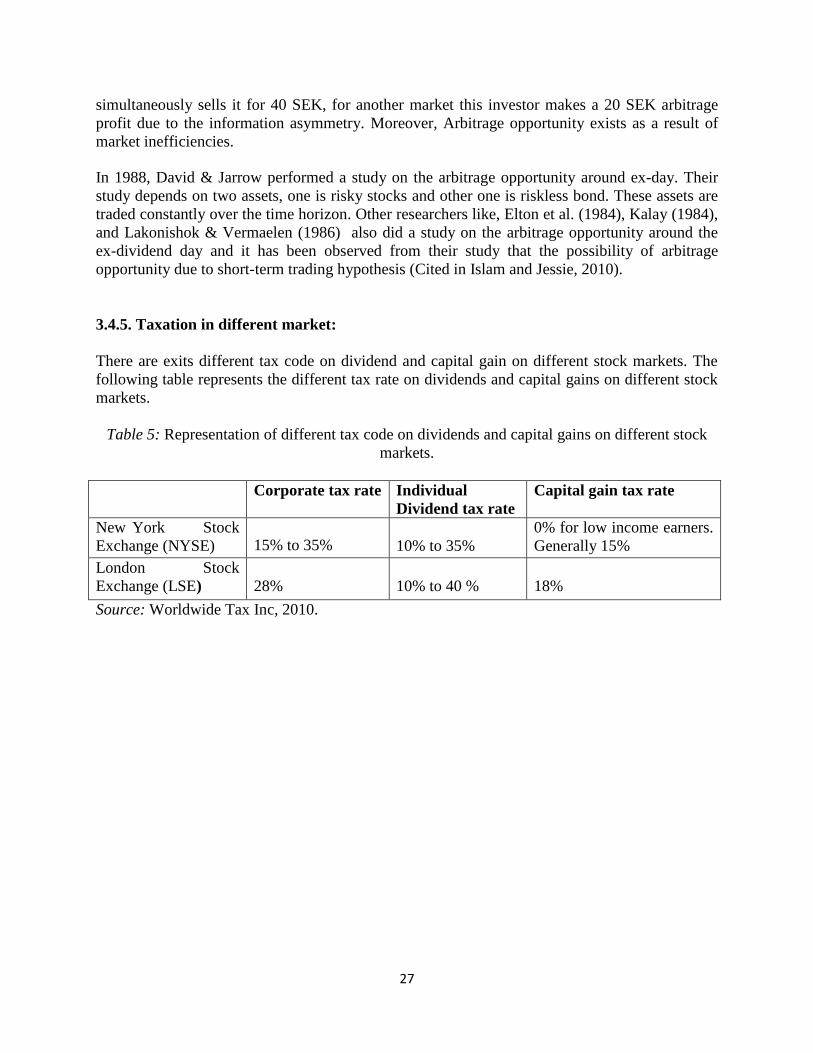
27
simultaneously sells it for 40 SEK, for another market this investor makes a 20 SEK arbitrage
profit due to the information asymmetry. Moreover, Arbitrage opportunity exists as a result of
market inefficiencies.
In 1988, David & Jarrow performed a study on the arbitrage opportunity around ex-day. Their
study depends on two assets, one is risky stocks and other one is riskless bond. These assets are
traded constantly over the time horizon. Other researchers like, Elton et al. (1984), Kalay (1984),
and Lakonishok & Vermaelen (1986) also did a study on the arbitrage opportunity around the
ex-dividend day and it has been observed from their study that the possibility of arbitrage
opportunity due to short-term trading hypothesis (Cited in Islam and Jessie, 2010).
3.4.5. Taxation in different market:
There are exits different tax code on dividend and capital gain on different stock markets. The
following table represents the different tax rate on dividends and capital gains on different stock
markets.
Table 5: Representation of different tax code on dividends and capital gains on different stock
markets.
Corporate tax rate
Individual
Dividend tax rate
Capital gain tax rate
New York Stock
Exchange (NYSE)
15% to 35%
10% to 35%
0% for low income earners.
Generally 15%
London Stock
Exchange (LSE)
28%
10% to 40 %
18%
Source: Worldwide Tax Inc, 2010.
28
CHAPTER FOUR PRACTICAL METHOD
The practical method section consists of sampling selection, data collection tools and types, data
processing and data analysis. This section actually gives an idea to the readers about statistical
and mathematical tools with hypothetical criteria used in our study to reach the research
questions.
4.1. SAMPLE DESIGN
Every researcher must use samples from a population for their investigation and analysis.
Population refers the total set of observation from which a sample is constructed. When every
respondent of a population responses in a survey, then it is called census. But in research, it is
not an easy task to manage and conduct a survey for the whole population. Better to select a
sample that represents the whole population (Saunders et al., 2007:204-6). Therefore, a sampling
is a technique of segmenting the whole population in small group of respondents that minimizes
cost and time for data collection. This thesis also use quantitative methods and sampling from
large population.
4.2. THE SELECTION OF SAMPLE
According to Bryman and Bell (2007:182), sample represents the part of population which is
collected by observation for investigation. Sample is classified in two major categories -
probability and non probability. In a probability sampling, each element or unit has the same
chance or probability of being selected in a random basis. This sampling minimizes the sampling
error. This is also called representative sampling. Probability sampling technique mostly
conducts with a survey and experimental research in order to answer researchers‟ questions and
meet the objectives. There are five probability sampling techniques available; Simple Random
Sampling, Systematic Sampling, Stratified Random Sampling, Cluster and Multistage Sampling
(Saunders et al., 2007:207).
On the other hand, non-probability sampling is an alternative and more practical sampling
technique which is based on subjective judgment of researchers i.e., researchers personal
judgment. Non-probability survey associated as a pilot survey (Saunders et al., 2007:226). In this
technique sample is not selected in random basis. There are three main categories of Non-
probability Sample: the convenience sample, the quota sample and the snowball sample (Bryman
and Bell, 2007:197)
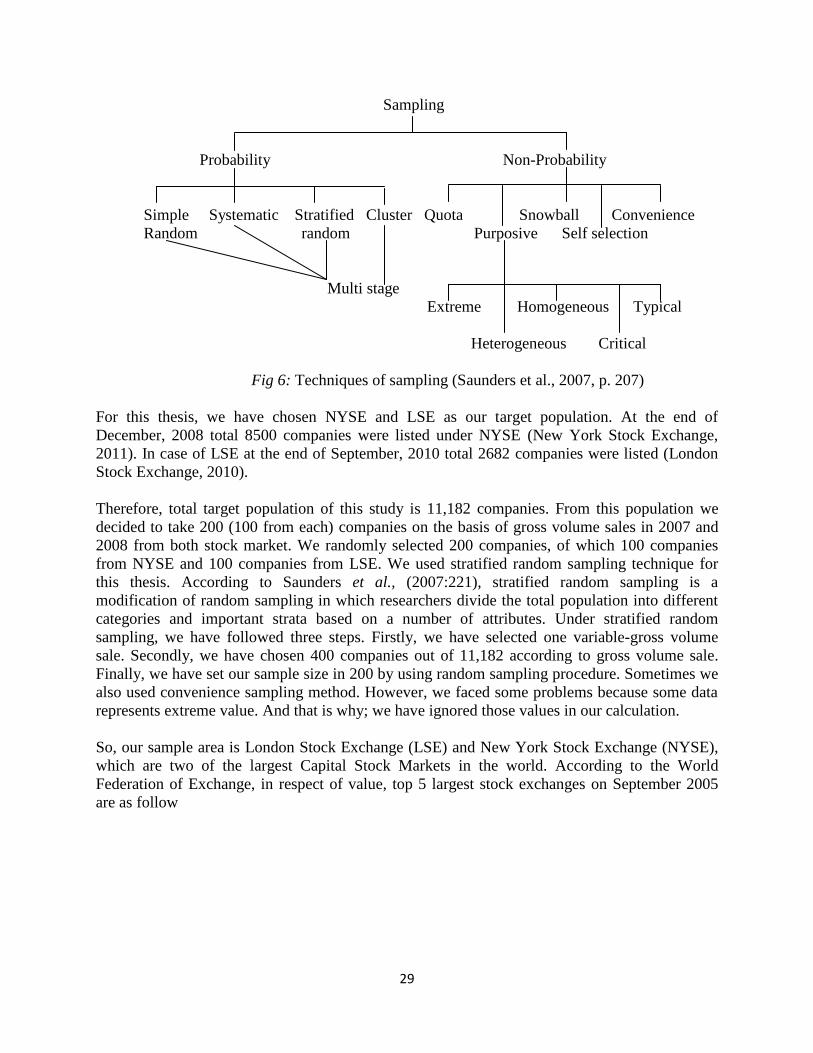
29
Sampling
Probability Non-Probability
Simple Systematic Stratified Cluster Quota Snowball Convenience
Random random Purposive Self selection
Multi stage
Extreme Homogeneous Typical
Heterogeneous Critical
Fig 6: Techniques of sampling (Saunders et al., 2007, p. 207)
For this thesis, we have chosen NYSE and LSE as our target population. At the end of
December, 2008 total 8500 companies were listed under NYSE (New York Stock Exchange,
2011). In case of LSE at the end of September, 2010 total 2682 companies were listed (London
Stock Exchange, 2010).
Therefore, total target population of this study is 11,182 companies. From this population we
decided to take 200 (100 from each) companies on the basis of gross volume sales in 2007 and
2008 from both stock market. We randomly selected 200 companies, of which 100 companies
from NYSE and 100 companies from LSE. We used stratified random sampling technique for
this thesis. According to Saunders et al., (2007:221), stratified random sampling is a
modification of random sampling in which researchers divide the total population into different
categories and important strata based on a number of attributes. Under stratified random
sampling, we have followed three steps. Firstly, we have selected one variable-gross volume
sale. Secondly, we have chosen 400 companies out of 11,182 according to gross volume sale.
Finally, we have set our sample size in 200 by using random sampling procedure. Sometimes we
also used convenience sampling method. However, we faced some problems because some data
represents extreme value. And that is why; we have ignored those values in our calculation.
So, our sample area is London Stock Exchange (LSE) and New York Stock Exchange (NYSE),
which are two of the largest Capital Stock Markets in the world. According to the World
Federation of Exchange, in respect of value, top 5 largest stock exchanges on September 2005
are as follow
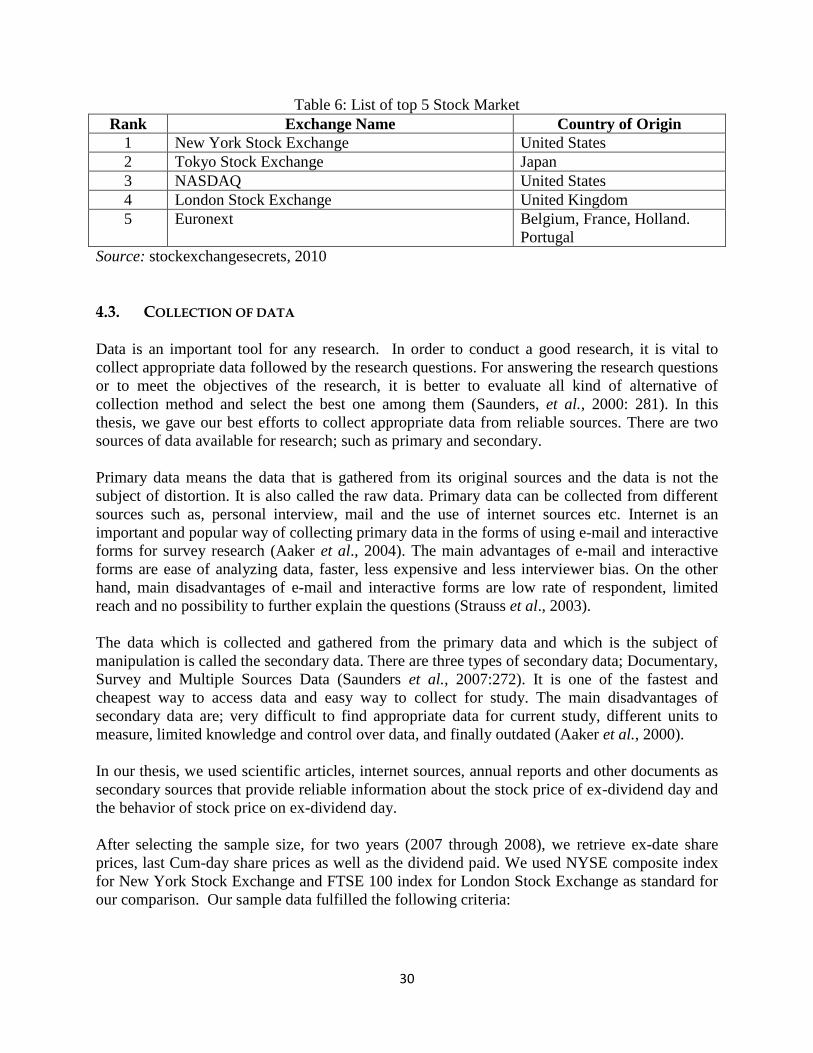
30
Table 6: List of top 5 Stock Market
Rank Exchange Name Country of Origin
1 New York Stock Exchange United States
2 Tokyo Stock Exchange Japan
3 NASDAQ United States
4 London Stock Exchange United Kingdom
5 Euronext Belgium, France, Holland.
Portugal
Source: stockexchangesecrets, 2010
4.3. COLLECTION OF DATA
Data is an important tool for any research. In order to conduct a good research, it is vital to
collect appropriate data followed by the research questions. For answering the research questions
or to meet the objectives of the research, it is better to evaluate all kind of alternative of
collection method and select the best one among them (Saunders, et al., 2000: 281). In this
thesis, we gave our best efforts to collect appropriate data from reliable sources. There are two
sources of data available for research; such as primary and secondary.
Primary data means the data that is gathered from its original sources and the data is not the
subject of distortion. It is also called the raw data. Primary data can be collected from different
sources such as, personal interview, mail and the use of internet sources etc. Internet is an
important and popular way of collecting primary data in the forms of using e-mail and interactive
forms for survey research (Aaker et al., 2004). The main advantages of e-mail and interactive
forms are ease of analyzing data, faster, less expensive and less interviewer bias. On the other
hand, main disadvantages of e-mail and interactive forms are low rate of respondent, limited
reach and no possibility to further explain the questions (Strauss et al., 2003).
The data which is collected and gathered from the primary data and which is the subject of
manipulation is called the secondary data. There are three types of secondary data; Documentary,
Survey and Multiple Sources Data (Saunders et al., 2007:272). It is one of the fastest and
cheapest way to access data and easy way to collect for study. The main disadvantages of
secondary data are; very difficult to find appropriate data for current study, different units to
measure, limited knowledge and control over data, and finally outdated (Aaker et al., 2000).
In our thesis, we used scientific articles, internet sources, annual reports and other documents as
secondary sources that provide reliable information about the stock price of ex-dividend day and
the behavior of stock price on ex-dividend day.
After selecting the sample size, for two years (2007 through 2008), we retrieve ex-date share
prices, last Cum-day share prices as well as the dividend paid. We used NYSE composite index
for New York Stock Exchange and FTSE 100 index for London Stock Exchange as standard for
our comparison. Our sample data fulfilled the following criteria:
31
- Companies must be listed under NYSE composite index for New York Stock
Exchange and FTSE 100 index for London Stock Exchange.
- Sample companies should pay cash dividend.
- Stock price must be available within (-4,+3) around ex-dividend day
- No stock dividends and stock splits.
We observed all of our data collected to conclude our empirical findings and results. We studied
a total 1029 observations from LSE and 2265 observations from NYSE (including ex-dividend
day stock price, cum-dividend stock price and dividend). In case of calculation, we excluded
some extreme values which could provide unacceptable outcomes.
4.4. DATA PROCESSING AND ANALYSING
We collected data (secondary) from Thomson DataStream, company‟s web site and internet. We
summarized the collected data according to our research problem statement. We categorized the
total 200 company‟s dividend, ex and cum dividend stock price information for the year 2007
and 2008.
After data collecting and sorting, we analyzed the whole findings of our investigation. There are
five issues must be considered when researchers try to analyze their findings: type of data
(categorical and quantifiable), format of data to input for analysis software, impact of data
coding, weight cases and methods for checking data errors. (Saunders et al., 2007: 408).
We choose the mathematical and statistical tools in our data analysis. The most statistical tools
used for analyzing data are chi square, correlation coefficient and regression coefficient analysis.
Chi square used to determine and verify the hypothesized results. A correlation coefficient is
used to assess the strength of relationship between pairs of variables. On the other hand,
regression coefficient used to assess the strength of a cause and effect relationship between
variables-quantifiable dependent and one or more quantifiable independent variable. This is also
called regression analysis (Saudners et al., 2007:451). In this thesis we constructed regression
coefficient (using SPSS software) for analyzing linear relationship. For analysis we used some
statistical graphical presentation and table for presenting data and results of findings; like scatter
plot. In mathematical model we used Nikolas & Travlos, (2006) model.
4.5. MATHEMATICAL MODEL
Our main objective of this paper is to find the stock price behavior on ex-dividend day compare
to cum-dividend day stock price. In a general sense an investors always prefer to cash or
liquidity of stock i.e., sell of stock on cum-dividend day. On the other hand some investors prefer
to hold the stock and take dividend if tax effects zero (Nikolas & Travlos, 2006:4-5). They
provide the mathematical model to examine the direction of stock price change on ex-dividend
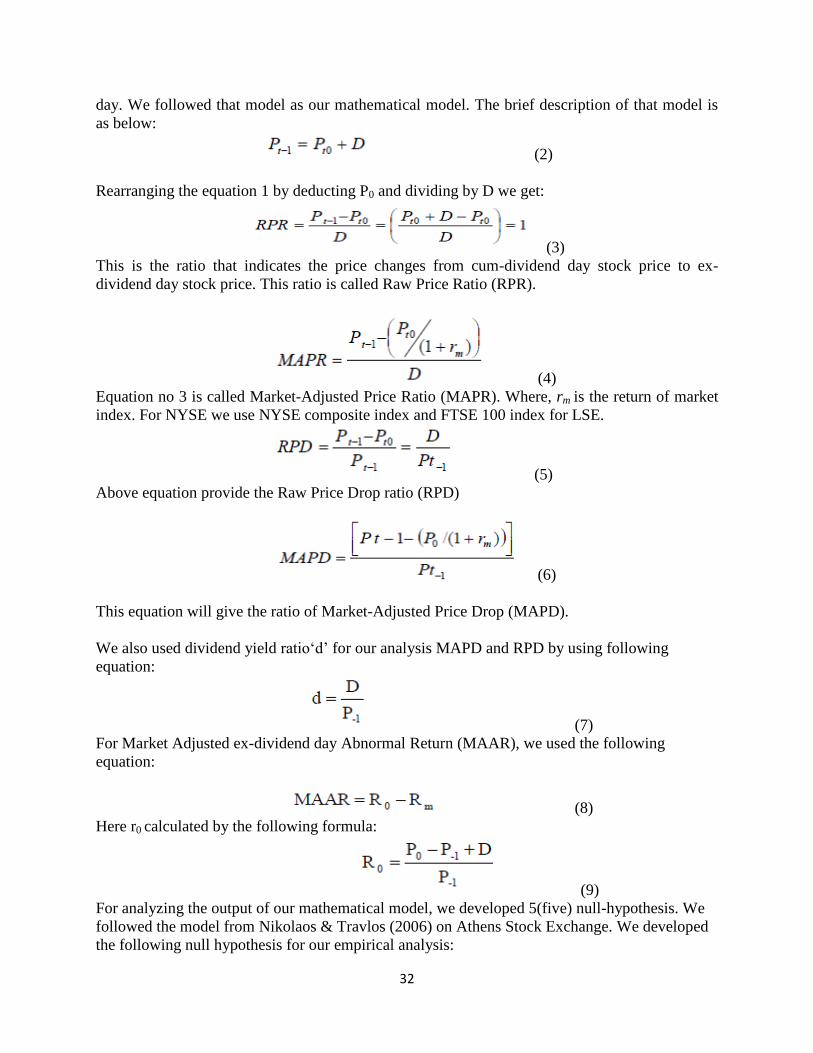
32
day. We followed that model as our mathematical model. The brief description of that model is
as below:
(2)
Rearranging the equation 1 by deducting P0 and dividing by D we get:
(3)
This is the ratio that indicates the price changes from cum-dividend day stock price to ex-
dividend day stock price. This ratio is called Raw Price Ratio (RPR).
(4)
Equation no 3 is called Market-Adjusted Price Ratio (MAPR). Where, rm is the return of market
index. For NYSE we use NYSE composite index and FTSE 100 index for LSE.
(5)
Above equation provide the Raw Price Drop ratio (RPD)
(6)
This equation will give the ratio of Market-Adjusted Price Drop (MAPD).
We also used dividend yield ratio„d‟ for our analysis MAPD and RPD by using following
equation:
(7)
For Market Adjusted ex-dividend day Abnormal Return (MAAR), we used the following
equation:
(8)
Here r0 calculated by the following formula:
(9)
For analyzing the output of our mathematical model, we developed 5(five) null-hypothesis. We
followed the model from Nikolaos & Travlos (2006) on Athens Stock Exchange. We developed
the following null hypothesis for our empirical analysis:
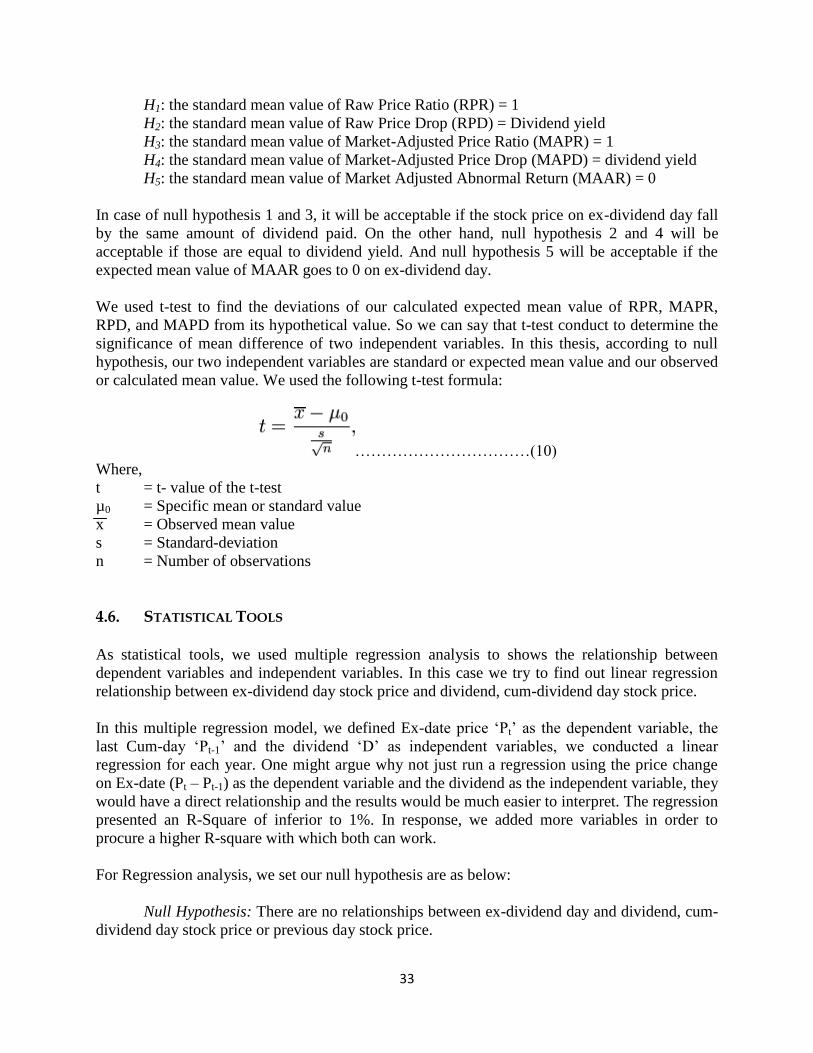
33
H1: the standard mean value of Raw Price Ratio (RPR) = 1
H2: the standard mean value of Raw Price Drop (RPD) = Dividend yield
H3: the standard mean value of Market-Adjusted Price Ratio (MAPR) = 1
H4: the standard mean value of Market-Adjusted Price Drop (MAPD) = dividend yield
H5: the standard mean value of Market Adjusted Abnormal Return (MAAR) = 0
In case of null hypothesis 1 and 3, it will be acceptable if the stock price on ex-dividend day fall
by the same amount of dividend paid. On the other hand, null hypothesis 2 and 4 will be
acceptable if those are equal to dividend yield. And null hypothesis 5 will be acceptable if the
expected mean value of MAAR goes to 0 on ex-dividend day.
We used t-test to find the deviations of our calculated expected mean value of RPR, MAPR,
RPD, and MAPD from its hypothetical value. So we can say that t-test conduct to determine the
significance of mean difference of two independent variables. In this thesis, according to null
hypothesis, our two independent variables are standard or expected mean value and our observed
or calculated mean value. We used the following t-test formula:
……………………………(10)
Where,
t = t- value of the t-test
µ0 = Specific mean or standard value
x = Observed mean value
s = Standard-deviation
n = Number of observations
4.6. STATISTICAL TOOLS As statistical tools, we used multiple regression analysis to shows the relationship between
dependent variables and independent variables. In this case we try to find out linear regression
relationship between ex-dividend day stock price and dividend, cum-dividend day stock price.
In this multiple regression model, we defined Ex-date price „Pt‟ as the dependent variable, the
last Cum-day „Pt-1‟ and the dividend „D‟ as independent variables, we conducted a linear
regression for each year. One might argue why not just run a regression using the price change
on Ex-date (Pt – Pt-1) as the dependent variable and the dividend as the independent variable, they
would have a direct relationship and the results would be much easier to interpret. The regression
presented an R-Square of inferior to 1%. In response, we added more variables in order to
procure a higher R-square with which both can work.
For Regression analysis, we set our null hypothesis are as below:
Null Hypothesis: There are no relationships between ex-dividend day and dividend, cum-
dividend day stock price or previous day stock price.
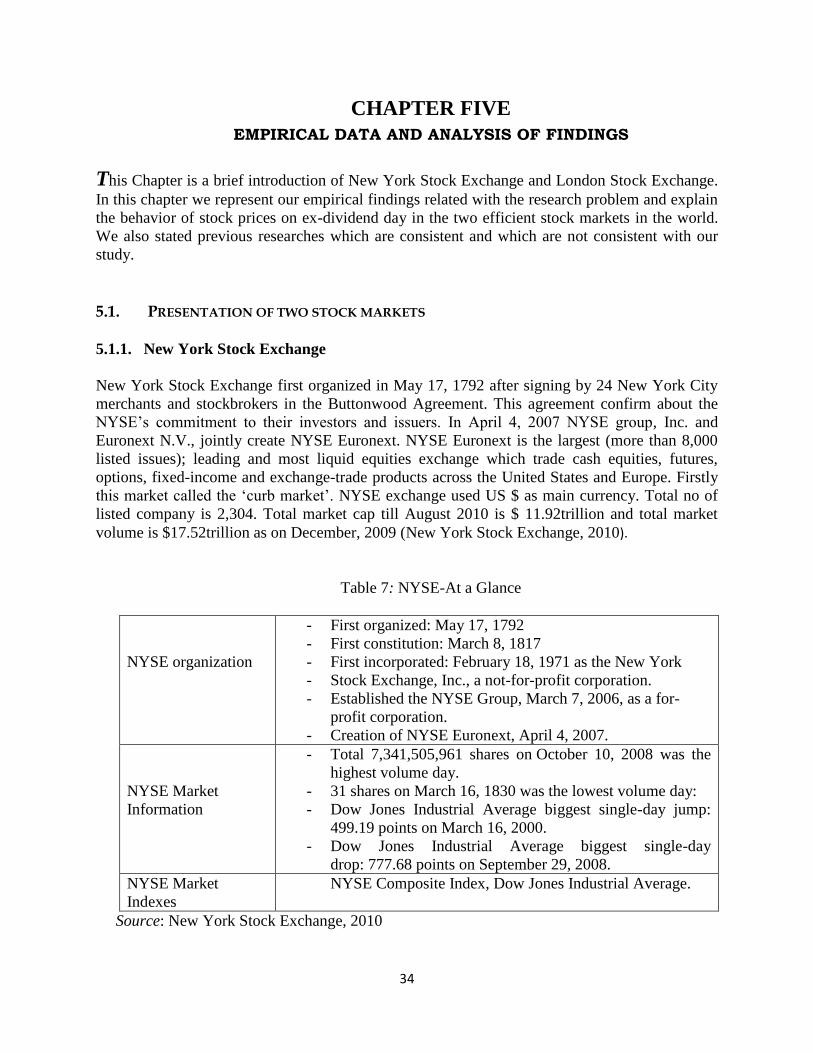
34
CHAPTER FIVE
EMPIRICAL DATA AND ANALYSIS OF FINDINGS
This Chapter is a brief introduction of New York Stock Exchange and London Stock Exchange.
In this chapter we represent our empirical findings related with the research problem and explain
the behavior of stock prices on ex-dividend day in the two efficient stock markets in the world.
We also stated previous researches which are consistent and which are not consistent with our
study.
5.1. PRESENTATION OF TWO STOCK MARKETS
5.1.1. New York Stock Exchange
New York Stock Exchange first organized in May 17, 1792 after signing by 24 New York City
merchants and stockbrokers in the Buttonwood Agreement. This agreement confirm about the
NYSE‟s commitment to their investors and issuers. In April 4, 2007 NYSE group, Inc. and
Euronext N.V., jointly create NYSE Euronext. NYSE Euronext is the largest (more than 8,000
listed issues); leading and most liquid equities exchange which trade cash equities, futures,
options, fixed-income and exchange-trade products across the United States and Europe. Firstly
this market called the „curb market‟. NYSE exchange used US $ as main currency. Total no of
listed company is 2,304. Total market cap till August 2010 is $ 11.92trillion and total market
volume is $17.52trillion as on December, 2009 (New York Stock Exchange, 2010).
Table 7: NYSE-At a Glance
NYSE organization
- First organized: May 17, 1792
- First constitution: March 8, 1817
- First incorporated: February 18, 1971 as the New York
- Stock Exchange, Inc., a not-for-profit corporation.
- Established the NYSE Group, March 7, 2006, as a for-
profit corporation.
- Creation of NYSE Euronext, April 4, 2007.
NYSE Market
Information
- Total 7,341,505,961 shares on October 10, 2008 was the
highest volume day.
- 31 shares on March 16, 1830 was the lowest volume day:
- Dow Jones Industrial Average biggest single-day jump:
499.19 points on March 16, 2000.
- Dow Jones Industrial Average biggest single-day
drop: 777.68 points on September 29, 2008.
NYSE Market
Indexes
NYSE Composite Index, Dow Jones Industrial Average.
Source: New York Stock Exchange, 2010
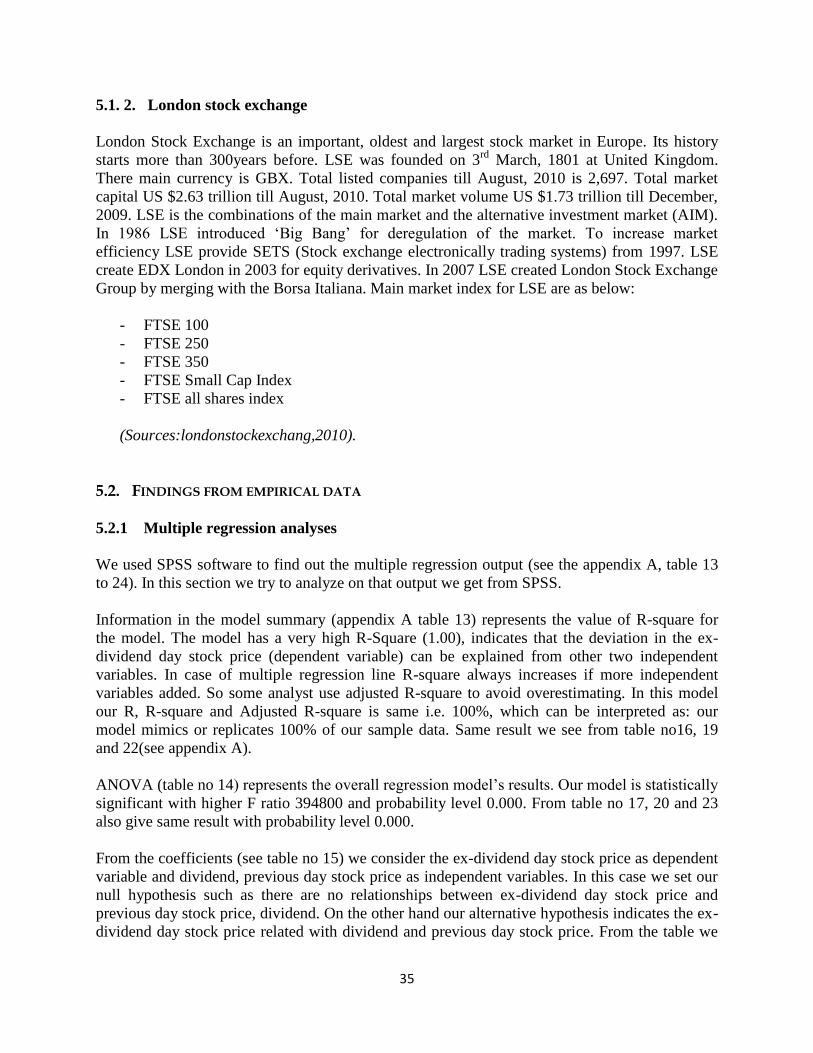
35
5.1. 2. London stock exchange
London Stock Exchange is an important, oldest and largest stock market in Europe. Its history
starts more than 300years before. LSE was founded on 3rd
March, 1801 at United Kingdom.
There main currency is GBX. Total listed companies till August, 2010 is 2,697. Total market
capital US $2.63 trillion till August, 2010. Total market volume US $1.73 trillion till December,
2009. LSE is the combinations of the main market and the alternative investment market (AIM).
In 1986 LSE introduced „Big Bang‟ for deregulation of the market. To increase market
efficiency LSE provide SETS (Stock exchange electronically trading systems) from 1997. LSE
create EDX London in 2003 for equity derivatives. In 2007 LSE created London Stock Exchange
Group by merging with the Borsa Italiana. Main market index for LSE are as below:
- FTSE 100
- FTSE 250
- FTSE 350
- FTSE Small Cap Index
- FTSE all shares index
(Sources:londonstockexchang,2010).
5.2. FINDINGS FROM EMPIRICAL DATA
5.2.1 Multiple regression analyses
We used SPSS software to find out the multiple regression output (see the appendix A, table 13
to 24). In this section we try to analyze on that output we get from SPSS.
Information in the model summary (appendix A table 13) represents the value of R-square for
the model. The model has a very high R-Square (1.00), indicates that the deviation in the ex-
dividend day stock price (dependent variable) can be explained from other two independent
variables. In case of multiple regression line R-square always increases if more independent
variables added. So some analyst use adjusted R-square to avoid overestimating. In this model
our R, R-square and Adjusted R-square is same i.e. 100%, which can be interpreted as: our
model mimics or replicates 100% of our sample data. Same result we see from table no16, 19
and 22(see appendix A).
ANOVA (table no 14) represents the overall regression model‟s results. Our model is statistically
significant with higher F ratio 394800 and probability level 0.000. From table no 17, 20 and 23
also give same result with probability level 0.000.
From the coefficients (see table no 15) we consider the ex-dividend day stock price as dependent
variable and dividend, previous day stock price as independent variables. In this case we set our
null hypothesis such as there are no relationships between ex-dividend day stock price and
previous day stock price, dividend. On the other hand our alternative hypothesis indicates the ex-
dividend day stock price related with dividend and previous day stock price. From the table we

36
documented that the beta coefficient for previous day is significant because it‟s higher than
dividend‟s beta coefficient with probability level 0.000. So our null hypothesis rejected i.e., there
are a relationship between ex-dividend day and cum-dividend day stock price. Almost same
result we get from table no 18, 21 and 24 (see appendix A).
5.2.2 Analyses of RPR, MAPR, RPD, MAPD and MAAR
5.2.2.1 New York Stock Exchange
Table no 8 represents both standard value and observed value of Raw Price Ratio (RPR),
Market-Adjusted Price Ratio (MAPR), Raw Price Drop Ratio (RPD), Market-Adjusted Price
Drop Ratio (MAPD) and Market Adjusted Abnormal Return (MAAR) from New York Stock
Exchange in 2007. We also presented standard deviation and t-test value of RPR, MAPR, RPD
and MAPD. T-test has been used at 95% confidence level to find the differences between
observed mean value and Standard Value.
From New York Stock market, 2007, we documented that Raw Price Ratio (RPR) 0.8505 and
corresponding t-statistic -0.4884. This indicates that stock price drop almost 85% of dividend
amount. So the drop ratio of stock price on ex-dividend day is less than the dividend amount in
2007. Market-Adjusted Price Ratio (MAPR) of New York Stock market is 0.8078 (81% of
dividend) and corresponding t-statistic -0.7174. It represents that stock price fall less than the
dividend amount. So in both case our null hypothesis rejected and accept the alternative
hypothesis.
Table 8: Standard and observed mean, standard deviation, and t-test value of RPR,
MAPR, RPD, MAPD and MAAR from NYSE, 2007
NYSE 2007 RPR MAPR RPD MAPD MAAR Mean 0.8505 0.8078 0.0043 0.0049 0.556
Standard value 1.0000 1.0000 0.0053301 0.0053301 0000
T-test value -0.4884 -0.7174 -1.0406915 -0.3704139
We also can explain the behavior of stock prices on Ex-day by RPD and MAPD. Our observed
Raw Price Drop ratio (RPD) 0.0043 and corresponding t-statistic -1.0406915, and Market-
Adjusted Price Drop Ratio (MAPD) 0.0049 and corresponding t-statistic -0.3704139. Both RPD
and MAPD explain that stock price fall less than the dividend amount on ex-day. In this case
again our null hypothesis rejected because there are significant difference between standard and
observed value of RPD and MAPD. This finding is consistent with prior study by Campbell &
Beranek (1955), Elton & Gruber (1970), Fedenia & Grammatikos (1991), Lamdin & Hiemstra
(1993) and Cloyd, Li & Weaver (2006); in general who documented that stock price fall less
than the dividend amount. According to them, the behavior of such stock price is due to higher
taxation on dividend amount than the capital gain. However this findings is not consistent with
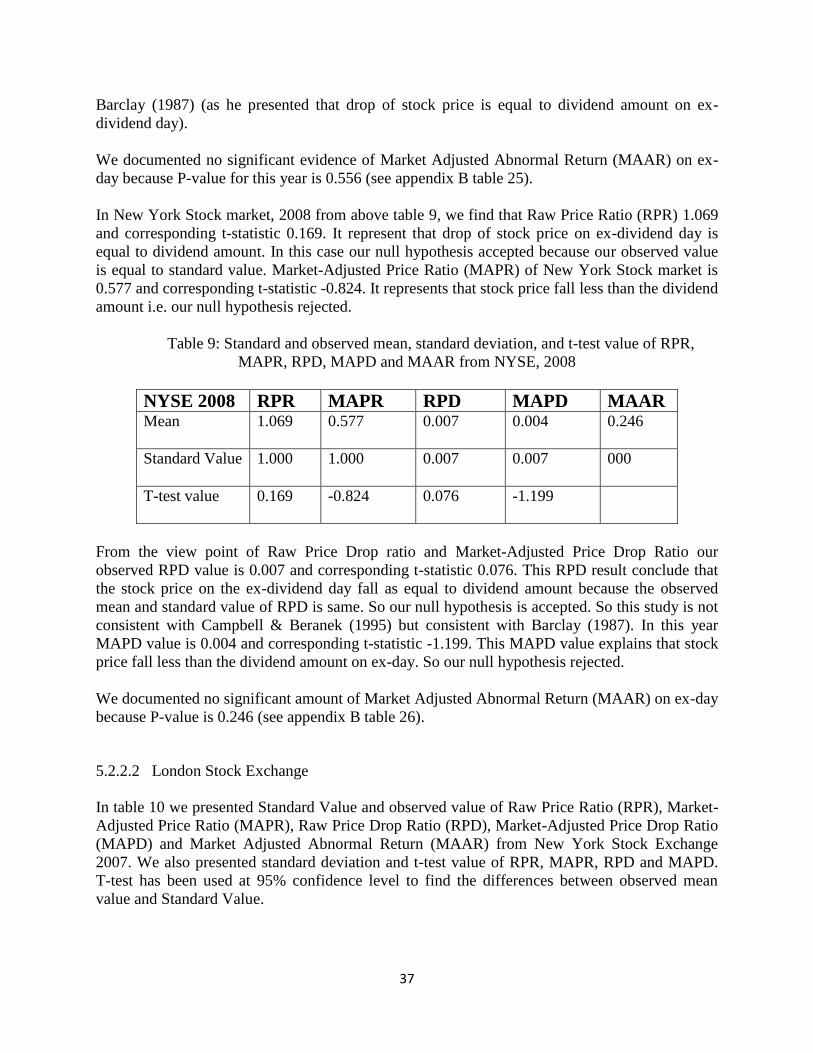
37
Barclay (1987) (as he presented that drop of stock price is equal to dividend amount on ex-
dividend day).
We documented no significant evidence of Market Adjusted Abnormal Return (MAAR) on ex-
day because P-value for this year is 0.556 (see appendix B table 25).
In New York Stock market, 2008 from above table 9, we find that Raw Price Ratio (RPR) 1.069
and corresponding t-statistic 0.169. It represent that drop of stock price on ex-dividend day is
equal to dividend amount. In this case our null hypothesis accepted because our observed value
is equal to standard value. Market-Adjusted Price Ratio (MAPR) of New York Stock market is
0.577 and corresponding t-statistic -0.824. It represents that stock price fall less than the dividend
amount i.e. our null hypothesis rejected.
Table 9: Standard and observed mean, standard deviation, and t-test value of RPR,
MAPR, RPD, MAPD and MAAR from NYSE, 2008
NYSE 2008 RPR MAPR RPD MAPD MAAR Mean 1.069 0.577 0.007 0.004 0.246
Standard Value 1.000 1.000 0.007 0.007 000
T-test value 0.169 -0.824 0.076 -1.199
From the view point of Raw Price Drop ratio and Market-Adjusted Price Drop Ratio our
observed RPD value is 0.007 and corresponding t-statistic 0.076. This RPD result conclude that
the stock price on the ex-dividend day fall as equal to dividend amount because the observed
mean and standard value of RPD is same. So our null hypothesis is accepted. So this study is not
consistent with Campbell & Beranek (1995) but consistent with Barclay (1987). In this year
MAPD value is 0.004 and corresponding t-statistic -1.199. This MAPD value explains that stock
price fall less than the dividend amount on ex-day. So our null hypothesis rejected.
We documented no significant amount of Market Adjusted Abnormal Return (MAAR) on ex-day
because P-value is 0.246 (see appendix B table 26). 5.2.2.2 London Stock Exchange
In table 10 we presented Standard Value and observed value of Raw Price Ratio (RPR), Market-
Adjusted Price Ratio (MAPR), Raw Price Drop Ratio (RPD), Market-Adjusted Price Drop Ratio
(MAPD) and Market Adjusted Abnormal Return (MAAR) from New York Stock Exchange
2007. We also presented standard deviation and t-test value of RPR, MAPR, RPD and MAPD.
T-test has been used at 95% confidence level to find the differences between observed mean
value and Standard Value.
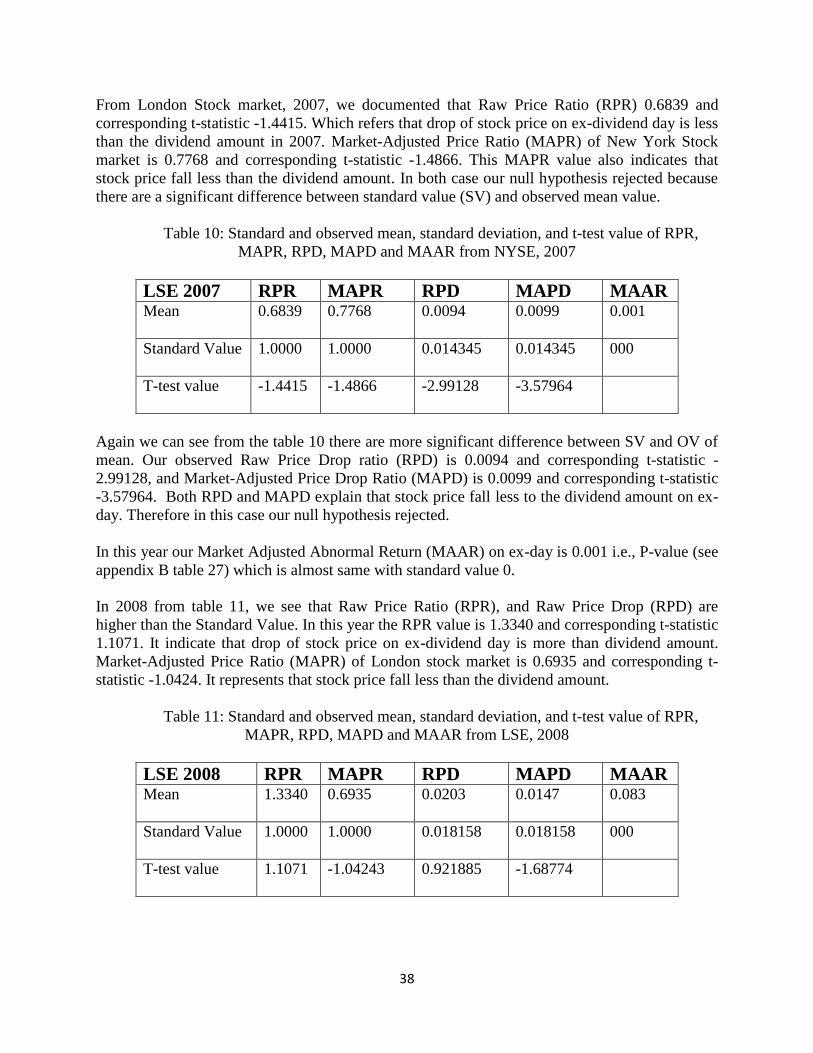
38
From London Stock market, 2007, we documented that Raw Price Ratio (RPR) 0.6839 and
corresponding t-statistic -1.4415. Which refers that drop of stock price on ex-dividend day is less
than the dividend amount in 2007. Market-Adjusted Price Ratio (MAPR) of New York Stock
market is 0.7768 and corresponding t-statistic -1.4866. This MAPR value also indicates that
stock price fall less than the dividend amount. In both case our null hypothesis rejected because
there are a significant difference between standard value (SV) and observed mean value.
Table 10: Standard and observed mean, standard deviation, and t-test value of RPR,
MAPR, RPD, MAPD and MAAR from NYSE, 2007
LSE 2007 RPR MAPR RPD MAPD MAAR Mean 0.6839 0.7768 0.0094 0.0099 0.001
Standard Value 1.0000 1.0000 0.014345 0.014345 000
T-test value -1.4415 -1.4866 -2.99128 -3.57964
Again we can see from the table 10 there are more significant difference between SV and OV of
mean. Our observed Raw Price Drop ratio (RPD) is 0.0094 and corresponding t-statistic -
2.99128, and Market-Adjusted Price Drop Ratio (MAPD) is 0.0099 and corresponding t-statistic
-3.57964. Both RPD and MAPD explain that stock price fall less to the dividend amount on ex-
day. Therefore in this case our null hypothesis rejected.
In this year our Market Adjusted Abnormal Return (MAAR) on ex-day is 0.001 i.e., P-value (see
appendix B table 27) which is almost same with standard value 0.
In 2008 from table 11, we see that Raw Price Ratio (RPR), and Raw Price Drop (RPD) are
higher than the Standard Value. In this year the RPR value is 1.3340 and corresponding t-statistic
1.1071. It indicate that drop of stock price on ex-dividend day is more than dividend amount.
Market-Adjusted Price Ratio (MAPR) of London stock market is 0.6935 and corresponding t-
statistic -1.0424. It represents that stock price fall less than the dividend amount.
Table 11: Standard and observed mean, standard deviation, and t-test value of RPR,
MAPR, RPD, MAPD and MAAR from LSE, 2008
LSE 2008 RPR MAPR RPD MAPD MAAR Mean 1.3340 0.6935 0.0203 0.0147 0.083
Standard Value 1.0000 1.0000 0.018158 0.018158 000
T-test value 1.1071 -1.04243 0.921885 -1.68774
39
According to Raw Price Drop ratio and Market-Adjusted Price Drop ratio our observed RPD
value is 0.0203 and corresponding t-statistic 0.921885. This RPD result represent that the stock
price on the ex-dividend day fall more than dividend amount because the mean value is higher
than the Standard Value of RPD. This finding are inconsistent with prior study (see analysis of
5.2.2.1) who told that stock price decline less than the dividend amount and some told that equal
amount of dividend. So, why a steeper decline in prices? On the other hand the MAPD value is
0.0147 and corresponding t-statistic -1.68774. This MAPD value indicates that stock price fall
less to dividend amount on ex-day.
We find significant evidence of Market Adjusted Abnormal Return (MAAR) is 0.083 P-value
(see appendix B table 28) on ex-day.
5.2.3. Explanation of empirical findings
Why do our findings differ from other empirical studies? The answer to the later resides in the
financial crisis. Begins of financial meltdown, a time when the stock market started a nose dive.
2008 has been a very difficult, tearful and devastating year for the financial sector in general.
The financial crisis mutated into a recession. The recession was the most severe since the great
depression (1929). All companies were affected either by drop in revenues or lower margins
because all are correlated more of less with to the global economy. In the stock market this
translates in price drops through the mechanism of lower future cash flow.
In the this period the markets plummeted to new levels, the NYSE Composite dropped from
8347.24 points to 7073.94 point a free all of just over 15%. This period (last quarter of 2008) is
characterized by:
September 15th
Lehman Brothers, the fourth largest I-Bank, on wall street files
for bankruptcy
September 16th
American International Group (AIG) is rescued by an $85 Billion
loan by the Federal Reserve of New York.
September 17th
Emergency short selling ban on stocks of all companies in the
financial sector.
September 25th
Washington Mutual (WaMu) falls in the hand of JP Morgan
Chase in an emergency rescue.
October 3rd
, Wachovia is acquired by Well Fargo
October 8th
, new rescue package for AIG ($37.8 Billion)
December 19th
, General Motor and Chrysler are bailed out for $13.4 billion and
$4 billion respectively.
No need to say neither theory nor empirical research on ex-date stock price behavior holds in
such conditions. The stock market continues plunging erasing more half a decade‟s worth of
gains.
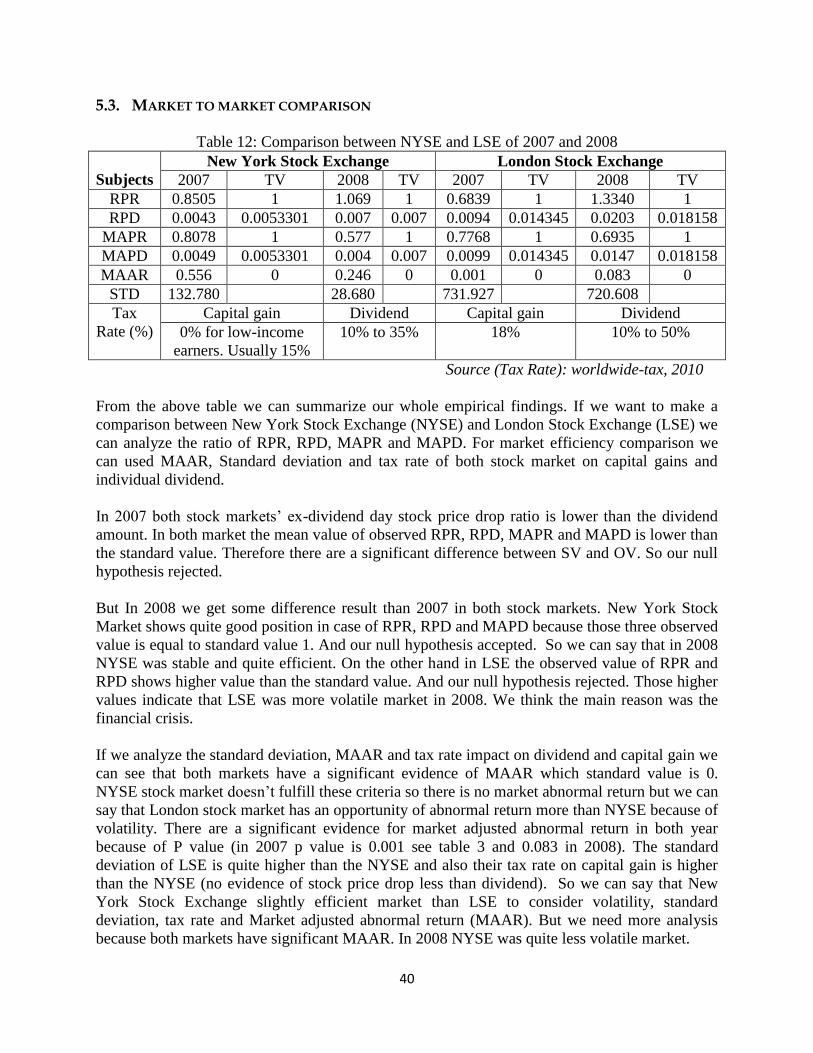
40
5.3. MARKET TO MARKET COMPARISON
Table 12: Comparison between NYSE and LSE of 2007 and 2008
Subjects
New York Stock Exchange London Stock Exchange
2007 TV 2008 TV 2007 TV 2008 TV
RPR 0.8505 1 1.069 1 0.6839 1 1.3340 1
RPD 0.0043 0.0053301 0.007 0.007 0.0094 0.014345 0.0203 0.018158
MAPR 0.8078 1 0.577 1 0.7768 1 0.6935 1
MAPD 0.0049 0.0053301 0.004 0.007 0.0099 0.014345 0.0147 0.018158
MAAR 0.556 0 0.246 0 0.001 0 0.083 0
STD 132.780 28.680 731.927 720.608
Tax
Rate (%)
Capital gain Dividend Capital gain Dividend
0% for low-income
earners. Usually 15%
10% to 35% 18% 10% to 50%
Source (Tax Rate): worldwide-tax, 2010
From the above table we can summarize our whole empirical findings. If we want to make a
comparison between New York Stock Exchange (NYSE) and London Stock Exchange (LSE) we
can analyze the ratio of RPR, RPD, MAPR and MAPD. For market efficiency comparison we
can used MAAR, Standard deviation and tax rate of both stock market on capital gains and
individual dividend.
In 2007 both stock markets‟ ex-dividend day stock price drop ratio is lower than the dividend
amount. In both market the mean value of observed RPR, RPD, MAPR and MAPD is lower than
the standard value. Therefore there are a significant difference between SV and OV. So our null
hypothesis rejected.
But In 2008 we get some difference result than 2007 in both stock markets. New York Stock
Market shows quite good position in case of RPR, RPD and MAPD because those three observed
value is equal to standard value 1. And our null hypothesis accepted. So we can say that in 2008
NYSE was stable and quite efficient. On the other hand in LSE the observed value of RPR and
RPD shows higher value than the standard value. And our null hypothesis rejected. Those higher
values indicate that LSE was more volatile market in 2008. We think the main reason was the
financial crisis.
If we analyze the standard deviation, MAAR and tax rate impact on dividend and capital gain we
can see that both markets have a significant evidence of MAAR which standard value is 0.
NYSE stock market doesn‟t fulfill these criteria so there is no market abnormal return but we can
say that London stock market has an opportunity of abnormal return more than NYSE because of
volatility. There are a significant evidence for market adjusted abnormal return in both year
because of P value (in 2007 p value is 0.001 see table 3 and 0.083 in 2008). The standard
deviation of LSE is quite higher than the NYSE and also their tax rate on capital gain is higher
than the NYSE (no evidence of stock price drop less than dividend). So we can say that New
York Stock Exchange slightly efficient market than LSE to consider volatility, standard
deviation, tax rate and Market adjusted abnormal return (MAAR). But we need more analysis
because both markets have significant MAAR. In 2008 NYSE was quite less volatile market.
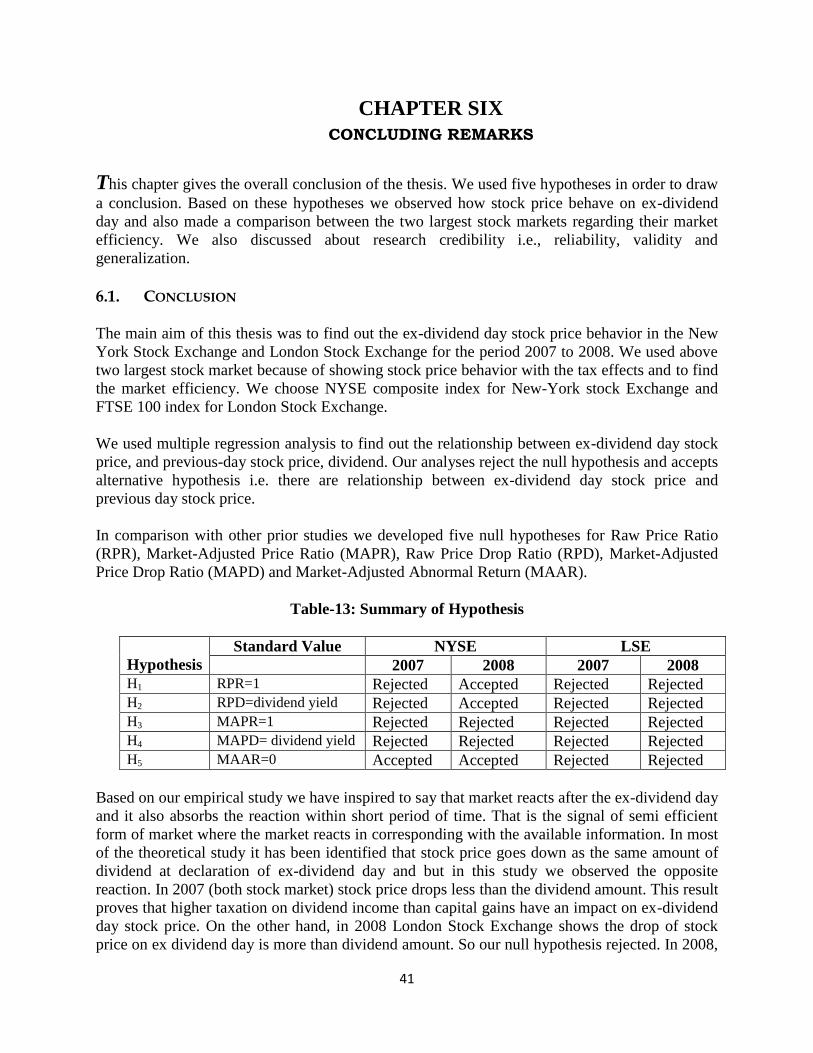
41
CHAPTER SIX
CONCLUDING REMARKS
This chapter gives the overall conclusion of the thesis. We used five hypotheses in order to draw
a conclusion. Based on these hypotheses we observed how stock price behave on ex-dividend
day and also made a comparison between the two largest stock markets regarding their market
efficiency. We also discussed about research credibility i.e., reliability, validity and
generalization.
6.1. CONCLUSION
The main aim of this thesis was to find out the ex-dividend day stock price behavior in the New
York Stock Exchange and London Stock Exchange for the period 2007 to 2008. We used above
two largest stock market because of showing stock price behavior with the tax effects and to find
the market efficiency. We choose NYSE composite index for New-York stock Exchange and
FTSE 100 index for London Stock Exchange.
We used multiple regression analysis to find out the relationship between ex-dividend day stock
price, and previous-day stock price, dividend. Our analyses reject the null hypothesis and accepts
alternative hypothesis i.e. there are relationship between ex-dividend day stock price and
previous day stock price.
In comparison with other prior studies we developed five null hypotheses for Raw Price Ratio
(RPR), Market-Adjusted Price Ratio (MAPR), Raw Price Drop Ratio (RPD), Market-Adjusted
Price Drop Ratio (MAPD) and Market-Adjusted Abnormal Return (MAAR).
Table-13: Summary of Hypothesis
Hypothesis
Standard Value NYSE LSE
2007 2008 2007 2008 H1 RPR=1 Rejected Accepted Rejected Rejected H2 RPD=dividend yield Rejected Accepted Rejected Rejected H3 MAPR=1 Rejected Rejected Rejected Rejected H4 MAPD= dividend yield Rejected Rejected Rejected Rejected H5 MAAR=0 Accepted Accepted Rejected Rejected
Based on our empirical study we have inspired to say that market reacts after the ex-dividend day
and it also absorbs the reaction within short period of time. That is the signal of semi efficient
form of market where the market reacts in corresponding with the available information. In most
of the theoretical study it has been identified that stock price goes down as the same amount of
dividend at declaration of ex-dividend day and but in this study we observed the opposite
reaction. In 2007 (both stock market) stock price drops less than the dividend amount. This result
proves that higher taxation on dividend income than capital gains have an impact on ex-dividend
day stock price. On the other hand, in 2008 London Stock Exchange shows the drop of stock
price on ex dividend day is more than dividend amount. So our null hypothesis rejected. In 2008,
42
New York Stock Exchange shows that stock price drops similar with the dividend amount i.e.,
null hypothesis accepted.
We examine the market efficiency hypothesis by analyzing Market-Adjusted Abnormal Return
(MAAR), standard deviation and tax code of both countries. In case of MAAR and standard
deviation London Stock Exchange shows significant evidence of market abnormal return than
NYSE. In London Stock Exchange tax on dividend is higher than the capital gain but in 2008
stock price decline more than the dividend is inconsistent with prior results. So, in case of
London Stock Exchange market anomaly exist and no market anomaly in New York Stock
Exchange.
6.2. PRACTICAL AND THEORETICAL CONTRIBUTION Form the investors‟ point of view; this paper will increase the awareness of an investor regarding
the investment decision. By studying the level of market efficiency, investors can get better
information about ex-dividend day and stock price relationship for their safe investment. In the
question of investment decision, investors can take decision easily by analyzing and predicting
the future price movement of a stock.
In the field of research, the thesis states about the behavior of stocks which are traded in the New
York Stock Exchange and London Stock Exchange. From the stand of efficient market
hypothesis, this paper also makes a comparison between two largest stock markets in the world.
By explaining the stock market efficiency, this study makes a link between the stock market
efficiency of the 20th century and that of the 21st century.
6.3. RECOMMENDATIONS
The chaos and turmoil that has prevailed throughout 2008, makes it impossible to analyze any
specific rational behavior in stocks price on Ex-day. We, at our level cannot dissociate the fall in
price due to EPS, future EPS, disappointment in regards to analyst predictions etc… or a price
drops simply due to the fact that future buyer is not entitled to the next dividend. Therefore we
are not able to make any thorough analysis of Ex-day prices based on our data.
It has been documented that before ex-divided day investors may have some abnormal return so
we are suggesting buying before ex-divided day and selling it after wards which might allow
investors to gain short term abnormal return. However in long run this theory may not works.
In recession period, investors generally try to convert their investment in more risk free area like
government bond, gold etc. instead of shares which creates downward pressure on share price
much of the fall is led by fear rather than fundamentals.
43
6.4. FURTHER RESEARCH
From our empirical findings we concluded that there are mixed results in different years. London
Stock exchange shows stock price drops more than the amount of dividend in 2008 but in 2007
stock price drops less than the amount of dividend. We cannot conclude about real reason for
that. Hence, further study is needed in case of London Stock Exchange. Stock price decreases
more in London Stock Exchange in 2008 against the taxation effect on dividend. LSE is more
volatile market than NYSE. So, further research is required to find out the behavior of investors
and also for mixed evidence.
6.5. THE CREDIBILITY OF RESEARCH In this section we try to give conclusion about our research credibility according to truth criteria
for measuring quality or credibility of research i.e., the accuracy of the research findings
according to research problem. This section enlightens to describe the credibility of research
design: reliability and validity. “Scientific methodology needs to be seen for what truly is, a way
of preventing me from deceiving me in regard to my creatively formed subjective hunched which
have developed out of the relationship between me and my material”(Raimand, 1993:55).
6.5.1 Reliability
Reliability concerned with the exactness and accuracy of information collected and analysis.
Reliability of a research can measure by the consistency of empirical findings. In fact reliability
concerns a researcher‟s conformability (Brayman, and Bell, 2007). “Is whether the findings of
the research can be confirmed by another similar study” (Remenyi et al., 1998). “The
economist’s advice of minimum number of 30 for statistical analyses provides a useful rule of
thumb for the smallest number in each category within your overall sample” (Saunders et al.,
2003:155).
We give our best efforts to get a high reliability of their study. From choice of topics we try to
satisfy the above requirements. We design their research question statement and collect data and
gather literature review of ex-dividend to solve the research problem statement and show the
impact of ex-dividend on stock price.
We give the whole description of topics, research questions, preconceptions, theoretical
framework and collect the data by using different methods and analysis the whole data by using
reliable statistical tools. Therefore we ensured the reliability and transparency of the study to the
reader.
We take our sample size very carefully so that this sample represents the whole study accurately.
We take randomly 200 company‟s stock price and dividend data to minimize the sampling error.
We collect all data from Thomson DataStream so reliability is accurate and transparent one. We
analyses the data to follow the research questions and interpreted the findings on theoretical
framework to draw a best conclusions. For this reason we think that our findings and analysis
give better reliable results and conclusion according to Saunders.
44
6.5.2. Validity
Validity is the second criteria for ensuring the credibility of a research. High validity rate ensure
the greater acceptance of research.
Validity of a research shows the relationship between the theoretical framework (related with
research question) and empirical findings. Validity concerned with the methodology of data
collection and theory which used to achieve and solve the researcher problem questions (Cooper
and Schindler, 2003:30-40). Both Saunders et al., (2007:149) and Remenyi et al., (1998) told
that validity is concern with the result of research findings which match with the appropriate
answer of research questions. According to Bryman and Bell (2007: 41), validity indicates the
integrity of the empirical results conclusions. They divided validity into four types such as
measurement or construct validity, external validity, internal validity and ecological validity.
Measurement or constructive validity refers the measure of a concept which truly reflects that
concept. Internal validity is concern with a causal relationship between two or more variables is
match or not.
So data collection and literature review is an important elements of a research on which a
conclusion about research question will be drawn.
In this study we used the valid data of ex-dividend day stock price and dividend from Thomson
DataStream directly and we analyzed many literatures about related theories of impact on stock
price on ex-dividend day. As a result we select the key important and reliable information for
using theoretical framework part (chapter three). This theoretical positions part reflects and lead
the authors to find out the appropriate answer in the empirical findings (chapter five) part.
In chapter five we use regression analysis for finding the relationship (between adjusted ex-
dividend day stock prices with dividend) and mathematical model (RPR, RPD, MAPD, MAPR
& MAAR) to find the stock price dropping position in 2007 and 2008. And finally we reached
our research goal points i.e., achieve to solve the research questions.
6.5.3. Generalization
Generalization refers the transferability of research into different other study. Generalization is
concern with an application of conducted research with other related organizations (Saunders et
al., 2000:102). This word is used to know “to what extent the findings from a study can be
generalized to other settings” (Ghauri and Gronhaug, 2002:10-20).
We generalized our result and interpret it on the basis of data collected and compare with the
previous literature. We have studied on ex-dividend day and found the kind of changes happened
on the stock price of 200 companies of NYSE and LSE respectively. And this study transferable
to other stock exchange also. This study has the practical applicability to analyze the stock
market behavior and investors preference also for any kind of stock market.
45
REFERENCE
LIST OF BOOKS:
Aaker, D.A., Kumar, V. And Day, G.S., (2004). Marketing Research, 8th
edition, NJ:John Wiley
& Son, United States.
Arnold, Glen (2008). Corporate Financial Management, 4th
edition, Pearson Education Limited,
England.
Brigham, Eugene. F. and Houston, Joel F. (2004). Fundamentals of Financial Management 10th
edition. US: Thomson South-Western.
Bryman, A., & Bell, E. (2007). Business Research Methods, 2nd
edition, Oxford University Press,
Oxford, UK.
Cooper, D. R., Schindler, P. S. (2003), Business Research Method, 8th
Edition, McGraw-Hill
Higher Education, Boston.
Copeland Thomas E., Weston J. Fred and Shastri Kuldeep, (2005). Financial theory and
Corporate Policy, 4th
edition, Pearson Addison Wesley, USA.
Easterby-Smith, M., Thrope, R., Lowe, A. (2002). Management Research-An Introduction. 2nd
edition, SAGE publications Ltd., UK. P:10-20.
Ghauri P., Gronhaug, K. (2002). Research Methods in Business Studies-A PracticAL Guide.
Pearson Education Limited, UK.
Hantrais Linda, (1996). Cross national Research methods in the Social Sciences, Continuum
International Publishing Group.
Hammersley, M. (1990). The dilemma of Qualitative Method: Herbert Bulmer and the Chicago
Tradition, Rout ledge, London and New York.
Haugen Robert A. (2001). Modern Investment Theory. 5th
edition, Prentice Hall, New Jersey,
USA.
Johns, N., and Lee-Ross, D., (1998). Research Methods in Service Industry management,
Cassell, London.

46
Johansson-Lindfos, Maj-Britt (1993). Att Utvekla Kunska-Om Methodologiska och andra vaval
vis samhallsvetenskaplig kunskapsbildning, studentlitterature, Lund, Sweden. P:10-77
Gail, Johanson (2002). Research methods for Public Administrations, Quorum Books. United
states:Greenwood Publishing Group.
Jones, Charles P. (2006). Investments Analysis and Management, 9th
edition, John Wiley & Sons
(Asia) Pte. Ltd., India.
Kevin, S. (2006). Portfolio Management. 2nd
edition, Prentice- Hall of India Private Limited,
New Delhi, India.
Ogden Joseph P., Jen Frank C. and O‟Connor Philip F., (2003). Advanced Corporate Finance,
Pearson Education (Singapore) Pte. Ltd., Indian Branch, India.
Pinches George (1996). Essentials of Financial Management. 5th
edition, Harper Collins College
Publishers, New York.
Raimond, P. (1993). Management projects, Chapman & Hall, London.
Ross Stephen A., Westerfield Randolph W. & Jaffe Jeffrey, (2005). Corporate Finance, 7th
edition, McGraw-Hill Irwin, USA.
Robinson C (2002). Real world research, 2nd
edition, Oxford, Blackwell.
Saunders M.; Lewis, P.; Thornill A. (1997). Research Methods for Business Students, Pitman
Publishing, Great Britain.
Saunders M.; Lewis, P.; Thornill A. (2000). Research Methods for Business Students, 2nd
edition. Harlow: England. Pearson Educaiton Limited.
Saunders M.; Lewis, P.; Thornill A. (2003). Research Methods for Business Students, 3rd
edition. Pitman Publishing, England.
Saunders M.; Lewis, P.; Thornill A. (2007). Research Methods for Business Students, Prentice
Hall, 4th
edition. P:102-150
Strauss, J., El-Ansary, A.I. and Forst, R., (2003). E-Marketing, 3rd
edition, NJ: Prentice Hall.
Van Horne, James C. (2003), Financial Management & Policy, 12th
edition, Prentice-Hall of
India Private Limited, New Delhi, India.
47
LIST OF SCIENTIFIC ARTICLES:
Alm, kristofer & Arefjäll, Magnus (1999). Arbitrage possibilities on the ex-dividend day-A study
on the ex-dividend day stock price behavior on the Swedish Stock market. Goteborg University.
Bali, Rakesh &Gailen L. Hite (1998). Ex dividend day stock price behavior; discreteness or tax
induced clienteles? Journal of Financial Economics, 47(2) 127-159.
Bhardwaj, Ravinder K., & Leroy D. Brooks (1999). Further evidence on dividend yields and the
ex-dividend day stock price effect. The Journal of Financial Research, 22(4), 503-514.
Brennan M. J., (1970). Taxes, Market Valuation and Financial Policy. National Tax Journal, 22,
417-427.
Barclay, M. (1987). Dividends, Taxes and Common Stock Prices: the Ex-dividend Day Behavior
of Common Stock Prices Before the Income Tax. Journal of Financial Economics, 19, 31-44.
Blume, M., Crockett, J., and Friend, I., (1974). Stockownership in the United States:
Characteristics and Trends. Survey of Current Business, 54, 11.
Booth L. D. & Johnston D. J. (1984). The Ex-Dividend Day Behavior of Canadian Stock Prices:
Tax Changes and Clientele Effects. The Journal of Finance, 39(2), 457-476.
Boyd, John, & Jagannathan, Ravi (1994). Ex-Dividend Price Behavior of Common Stocks.
Review of Financial Studies, 7, 711-741.
Bhattacharya, S. (1979). Imperfect information, dividend policy, and “the bird in the hand”
fallacy. Bell Journal of Economics, 10, 259-270.
Campbell, J. & A., Beranek (1955). Stock Price Behavior on Ex-dividend dates, Journal of
Finance, 10, 125-429.
Cohen and Manion (1987) in Remenyi, D., Williams, B., Money, A., Swartz, E., Doing Research
in Business and Management: An Introduction to Process and Method, SAGE publications,
1998, 30-40
Cloyd, C. B., O. Z. Li, & C. D. Weaver (2006). Ticks and tax: The joint effects of price
discreteness and taxation on ex-dividend returns. Journal of the American Taxation Association,
28(2), 23-46.
David C. Heath & Robert A. Jarrow (1988). Ex-Dividend Stock Price Behavior and Arbitrage
Opportunities. The Journal of Business, 61(1), 95-108.
48
Datta, Shantanu; Jog, Vijay M., and Saddi, Samir (2004). Re-examination of the Ex-Dividend
Day Behavior of Canadian Stock Prices. Sprott School of Business, Carlton University.
Douglas, Lamdin J., & Hiemstra, Craig (1993). Ex-Dividend Day Share Price Behavior: Effects
of the Tax Reform Act of 1986. The Review of Economics and Statistics, 75, 778-783.
Elton Edwin J & Gruber Martin J, (1970). Marginal Stockholder Tax rates and the Clientele
Effect, Review of Economics and Statistics, 52, 68-74.
Eades, K., Hess, P., and Kim, E. H., (1984). On Interpreting Security Returns during the Ex-
Dividend Period. Journal of Financial Economics, 3-34.
Frank, Murray & Ravi Jagannathan (1998). Why do stock prices drop by less than the value of
the dividend? Evidence from a country without taxes. Journal of Financial Economics,
47(2)161-188.
Fedenia, Mark & Theoharry Grammatikos (1993). Risk premia and the ex-dividend stock price
behavior. Journal of Banking & Finance, 17(4), 575-590.
Fama, Eugene F., Fisher, Lawrence, Jensen, Michaled C., and Roll, Richard (1969) “The
adjustment of stock prices to New Information”. International economics review, 1-21
Fama, E., (1970). Efficient Capital Markets: A Review of Theories and Empirical Work. Journal
of Finance, 25, 383-417.
Gordon, Mayron J. (1962). Optimal Investment and Financing Policy. Journal of Finance, 264-
272.
Grinblatt, S. M.,Masulis, W. R. & Titman, S. (1984).The valuation effects of stock splits and
stock dividends. Journal of Financial Economics,13(4), 461-490
Healy, P.M., and Palepu, K.G. (1988). Earnings Information Conveyed by Dividend Initiations
and Omissions. Journal of Financial Economics, 21.
Hietala, P. & Keloharju, M. (1995). The Ex-dividend Day Behavior of Finnish Restricted and
Unrestricted Shares. Applied Economic Letters, 467-468.
Islam, Md Mohibul and Jessie, Cadilac (2010). Market Anamoly and Arbitage Opportunity
around ex-dividend day. Umeå University.
Kalay, A. (1982). The Ex-dividend Day Behavior of Stock Prices: A Re-examination of the
Clientele Effect. Journal of Finance, 37(39), 1059-1070.
49
Kato, K. & Loewenstein, U. (1995). The Ex-dividends-day Behavior of Stock Prices: The Case
of Japan. The Review of Financial Studies, 8, 817-847.
Koski, Jennifer Lunch & John T. Scruggs (1998). Who trades around the ex-dividend day?
Evidence from NYSE audit files data. Financial Management, 27(3), 58-73.
Lakonishok, J. & Vermaelen, T. (1986). Tax-induced Trading around Ex-dividend Days. Journal
of Financial Economics, 16(3), pp 287-319.
Lamdin, D.J. & C. Hiemstra (1993). Ex-dividend Day Share Price Behavior: Effects of the Tax
Reform Act of 1986. The Review of Economics and Statistics, 778-783.
Lewellen, W., Stanely, k.L., Lease R.C., and Schlarbaum, G.C. (1978). Some direct evidence on
the Dividend clientele Phenomenon. Journal of Finance 33, 5.
Linter, John (August, 1962). Dividends, Earnings, Leverage, Stock Prices & the supply of capital
to corporations. Review of Economics & Statistics, 243-269.
Litzenberger, R. & Ramaswamy, K. (1979). The Effect of Personal Taxes and Dividends on
Capital Asset Pricing. Journal of Financial Economics, 7, 163-195.
Meziane A. Lasfer (1999). Ex-day Pricing and Post-Announcement Drift. The Uk evidence,
Journal of Banking and Finance.
M. Ameziane Lasfer (1995). Ex-Day Behavior: Tax or Short-Term Trading Effects. The Journal
of Finance, 50 (3), 875-897.
Michaely, R. & Murgia, M. (1995). The Effect of Tax Heterogeneity on Prices and Volume
around the Ex-dividend Day: Evidence from the Milan Stock Exchange. The Review of Financial
Studies, 8, 369-399.
Michealy R., Thaler H., and Womack K.(1995). Price Reactions to Dividend Initiations an
Omissions: Overreactions or Drift. Journal of Finance 50.
Miller, M. H., and Modigliani, F. (October, 1961). Dividend policy, Growth and the Valuation
of Shares. Journal of Business, 411-433.
Nikolaos T. Milonas, Nickolaos G. Travlos & Jason Zezhong Xiao (2002). The Ex-Dividend
Day Stock Price Behavior in the Chinese Stock Market. Pacific-Basin Finance Journal, 14 (2),
155-174.
Remenyi, D., Williams, B., Money, A., Swartz, E., (1998). Doing Research in Business and
Management: An Introduction to Process and Method, SAGE Publications.
50
Poterba, J. & Summers, L. (1984). New Evidence that Taxes Affect the Valuation of Dividends,
Journal of Finance, 39, 1397-1415.
Sarig, O., & E. Tolkowsky (1997). Dividend effects in Israel: A puzzle. Economics Letters, 54,
169-174.
Weber R (2004). The Rhetoric of Positivism Versus Interpretivism: A Personal View. MIS
Quarterly,28(1),3-13.
LIST OF SCIENTIFIC ARTICLES (ELECTRONIC):
Jakob, K., & U. Akhmedov (2006). The ex-dividend day stock price anomaly: Evidence from
Denmark, University of Montana working paper, Available at SSRN:
http://ssrn.com/abstract=896987.
Lasfer, M. Ameziane & Zenonos, Maria (2003). The Tax Impact on the Ex-dividend dates:
Evidence from European firms. Cass Business School Research Paper, EFA 2003 Annual
Conference Paper, No. 885, doi:10.2139/ssrn.423880.
Nikolaos, Milonas T., & Nickolaos, Travlos G.(2006). The Ex-dividend Day Stock Price
Behavior in the Athens Stock Exchange. Available at SSRN: id314881
INTERNET SOURCES:
New York Stock Exchange (2010), New York Stock Exchange website
<http://www.nyse.com/about/listed/1170350259411.html> [Retrieved 2010-11-11].
London Stock Exchange (2010), London Stock Exchange website
<http://www.londonstockexchange.com/statistics/companies-and-issuers/companies-and-
issuers.htm> [Retrieved 2010-11-11].
The top 10 largest Stock Exchanges, Stockexchangesecrets website,
<http://www.stockexchangesecrets.com/largest-stock-exchanges.html> [Retrieved 2010-11-11].
Worldwide Tax Inc. (2010), Complete worldwide tax website, Worldwide Tax Inc. website
<http://www.worldwide-tax.com/uk/uk_taxes_rates.asp> [Retrieved 2010-11-17].
Worldwide Tax Inc. (2010), Complete worldwide tax website, Worldwide Tax Inc. website
<http://www.worldwide-tax.com/us/us_taxes.asp> [Retrieved 2010-11-17].
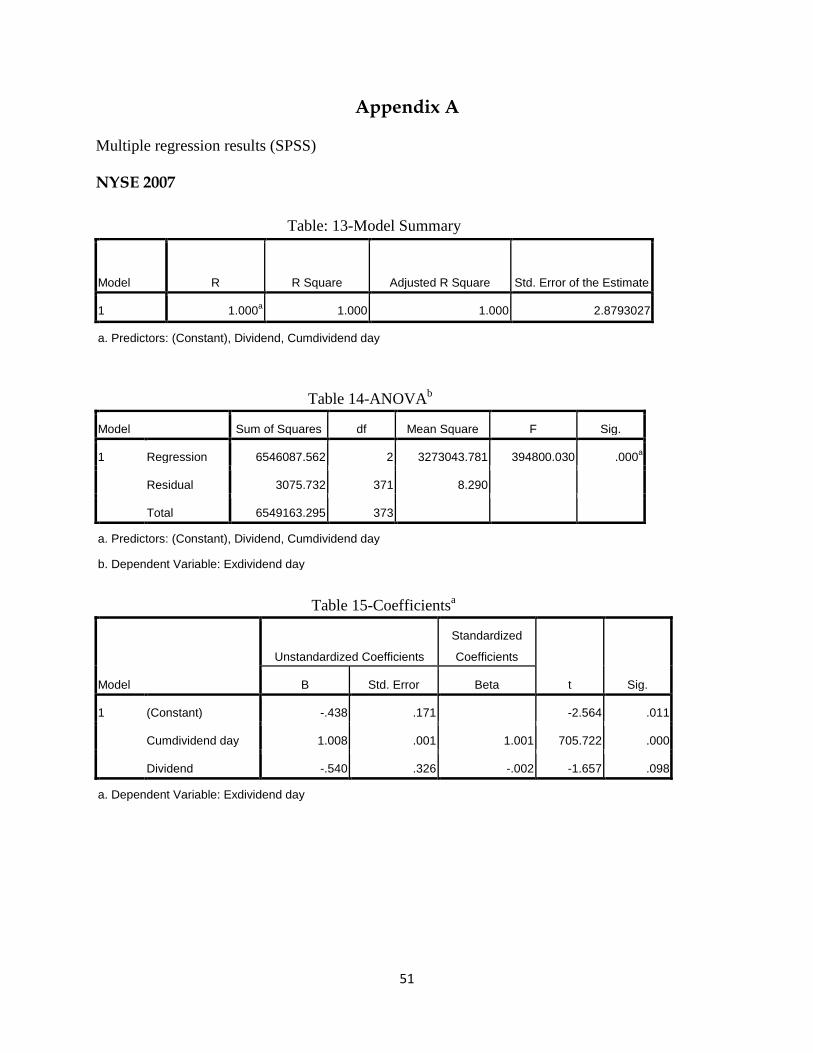
51
Appendix A
Multiple regression results (SPSS)
NYSE 2007
Table: 13-Model Summary
Model R R Square Adjusted R Square Std. Error of the Estimate
1 1.000a 1.000 1.000 2.8793027
a. Predictors: (Constant), Dividend, Cumdividend day
Table 14-ANOVAb
Model Sum of Squares df Mean Square F Sig.
1 Regression 6546087.562 2 3273043.781 394800.030 .000a
Residual 3075.732 371 8.290
Total 6549163.295 373
a. Predictors: (Constant), Dividend, Cumdividend day
b. Dependent Variable: Exdividend day
Table 15-Coefficientsa
Model
Unstandardized Coefficients
Standardized
Coefficients
t Sig. B Std. Error Beta
1 (Constant) -.438 .171 -2.564 .011
Cumdividend day 1.008 .001 1.001 705.722 .000
Dividend -.540 .326 -.002 -1.657 .098
a. Dependent Variable: Exdividend day
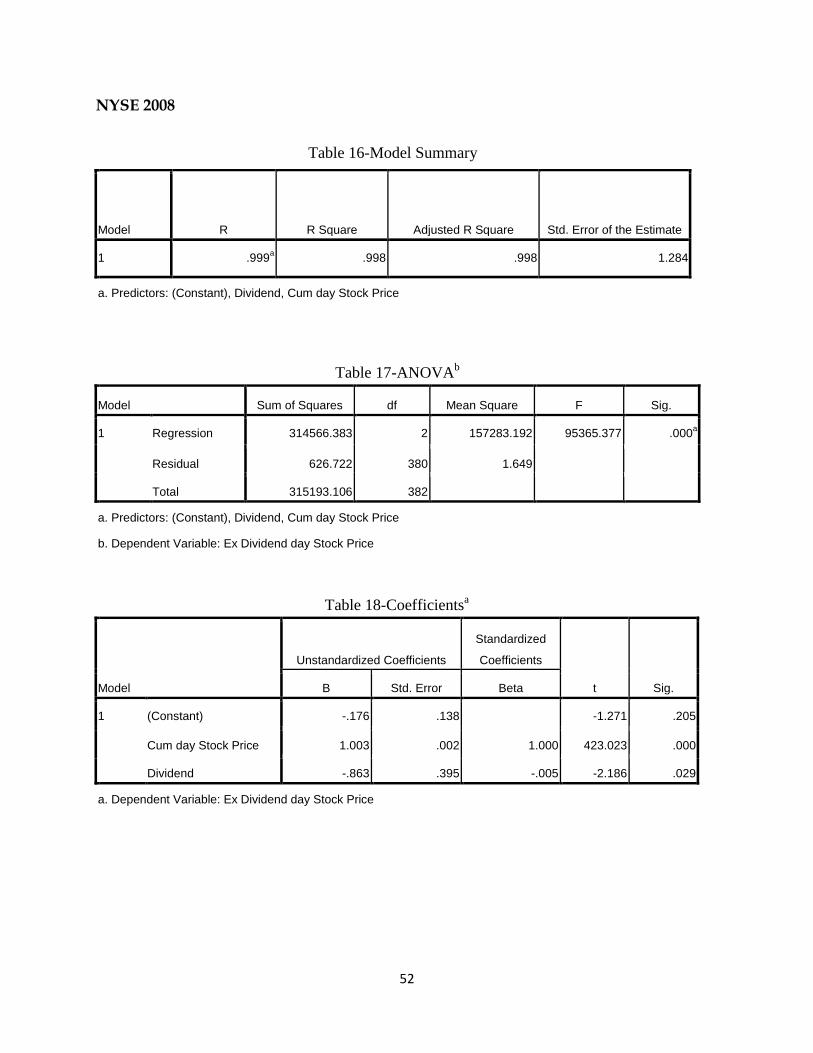
52
NYSE 2008
Table 16-Model Summary
Model R R Square Adjusted R Square Std. Error of the Estimate
1 .999a .998 .998 1.284
a. Predictors: (Constant), Dividend, Cum day Stock Price
Table 17-ANOVAb
Model Sum of Squares df Mean Square F Sig.
1 Regression 314566.383 2 157283.192 95365.377 .000a
Residual 626.722 380 1.649
Total 315193.106 382
a. Predictors: (Constant), Dividend, Cum day Stock Price
b. Dependent Variable: Ex Dividend day Stock Price
Table 18-Coefficientsa
Model
Unstandardized Coefficients
Standardized
Coefficients
t Sig. B Std. Error Beta
1 (Constant) -.176 .138 -1.271 .205
Cum day Stock Price 1.003 .002 1.000 423.023 .000
Dividend -.863 .395 -.005 -2.186 .029
a. Dependent Variable: Ex Dividend day Stock Price
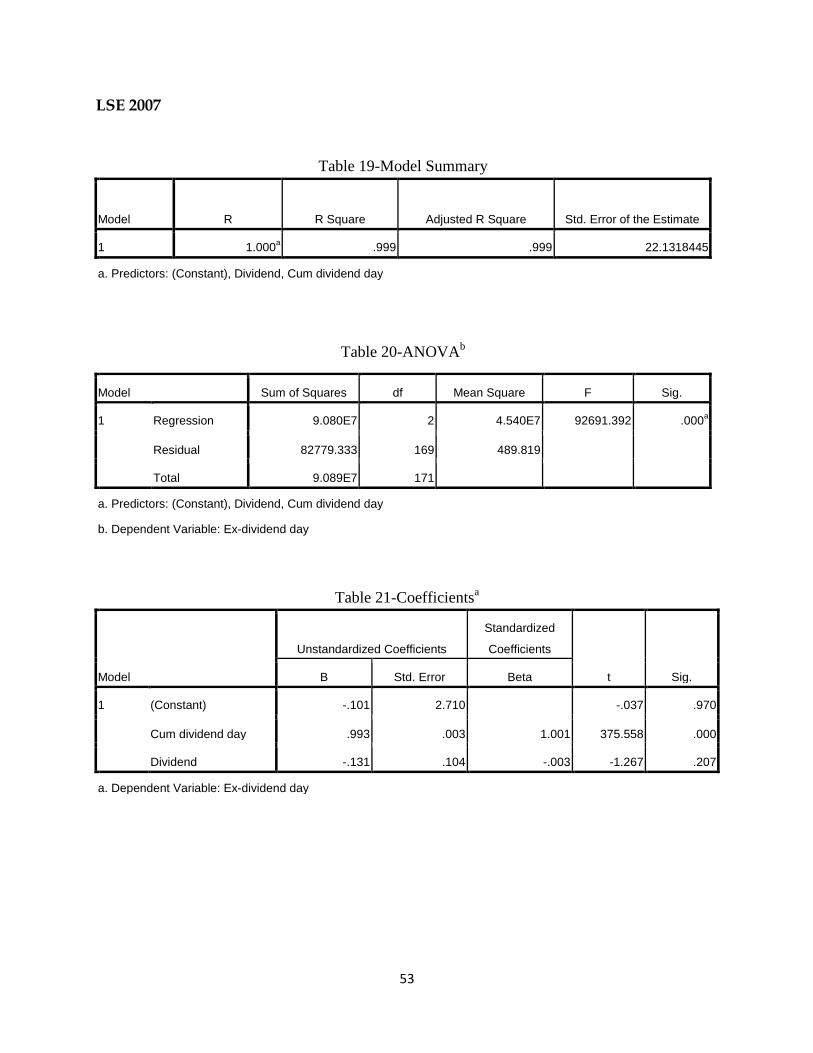
53
LSE 2007
Table 19-Model Summary
Model R R Square Adjusted R Square Std. Error of the Estimate
1 1.000a .999 .999 22.1318445
a. Predictors: (Constant), Dividend, Cum dividend day
Table 20-ANOVAb
Model Sum of Squares df Mean Square F Sig.
1 Regression 9.080E7 2 4.540E7 92691.392 .000a
Residual 82779.333 169 489.819
Total 9.089E7 171
a. Predictors: (Constant), Dividend, Cum dividend day
b. Dependent Variable: Ex-dividend day
Table 21-Coefficientsa
Model
Unstandardized Coefficients
Standardized
Coefficients
t Sig. B Std. Error Beta
1 (Constant) -.101 2.710 -.037 .970
Cum dividend day .993 .003 1.001 375.558 .000
Dividend -.131 .104 -.003 -1.267 .207
a. Dependent Variable: Ex-dividend day
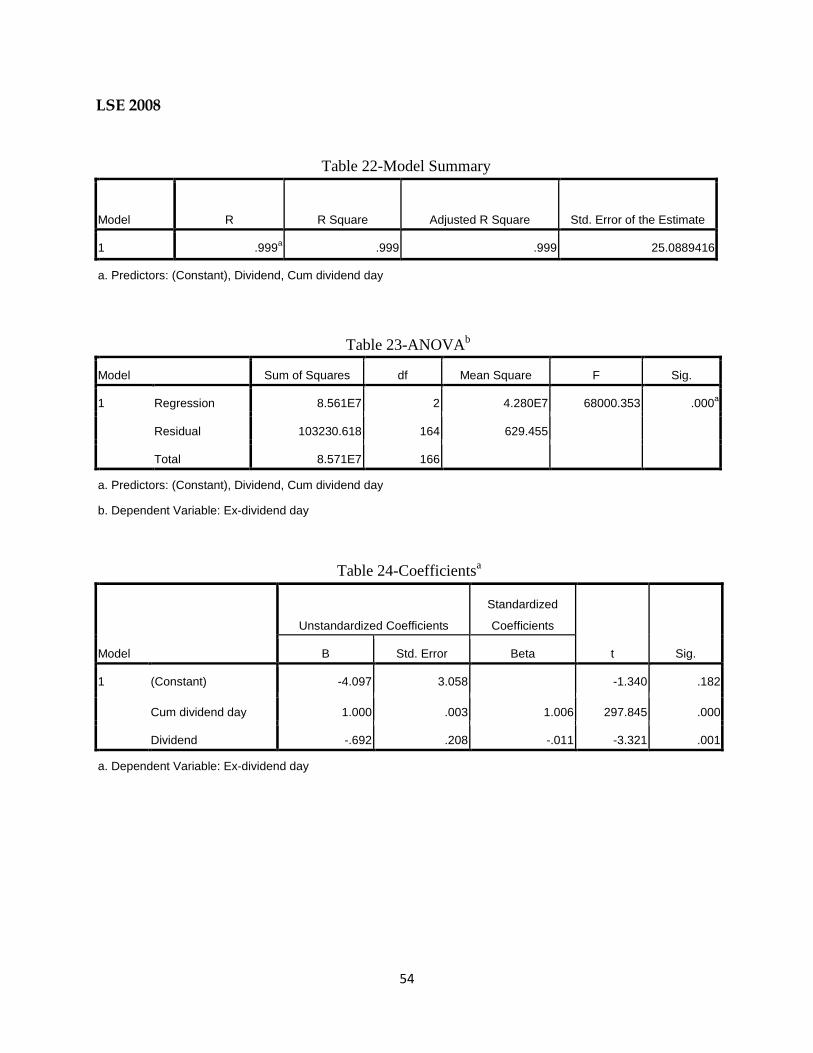
54
LSE 2008
Table 22-Model Summary
Model R R Square Adjusted R Square Std. Error of the Estimate
1 .999a .999 .999 25.0889416
a. Predictors: (Constant), Dividend, Cum dividend day
Table 23-ANOVAb
Model Sum of Squares df Mean Square F Sig.
1 Regression 8.561E7 2 4.280E7 68000.353 .000a
Residual 103230.618 164 629.455
Total 8.571E7 166
a. Predictors: (Constant), Dividend, Cum dividend day
b. Dependent Variable: Ex-dividend day
Table 24-Coefficientsa
Model
Unstandardized Coefficients
Standardized
Coefficients
t Sig. B Std. Error Beta
1 (Constant) -4.097 3.058 -1.340 .182
Cum dividend day 1.000 .003 1.006 297.845 .000
Dividend -.692 .208 -.011 -3.321 .001
a. Dependent Variable: Ex-dividend day
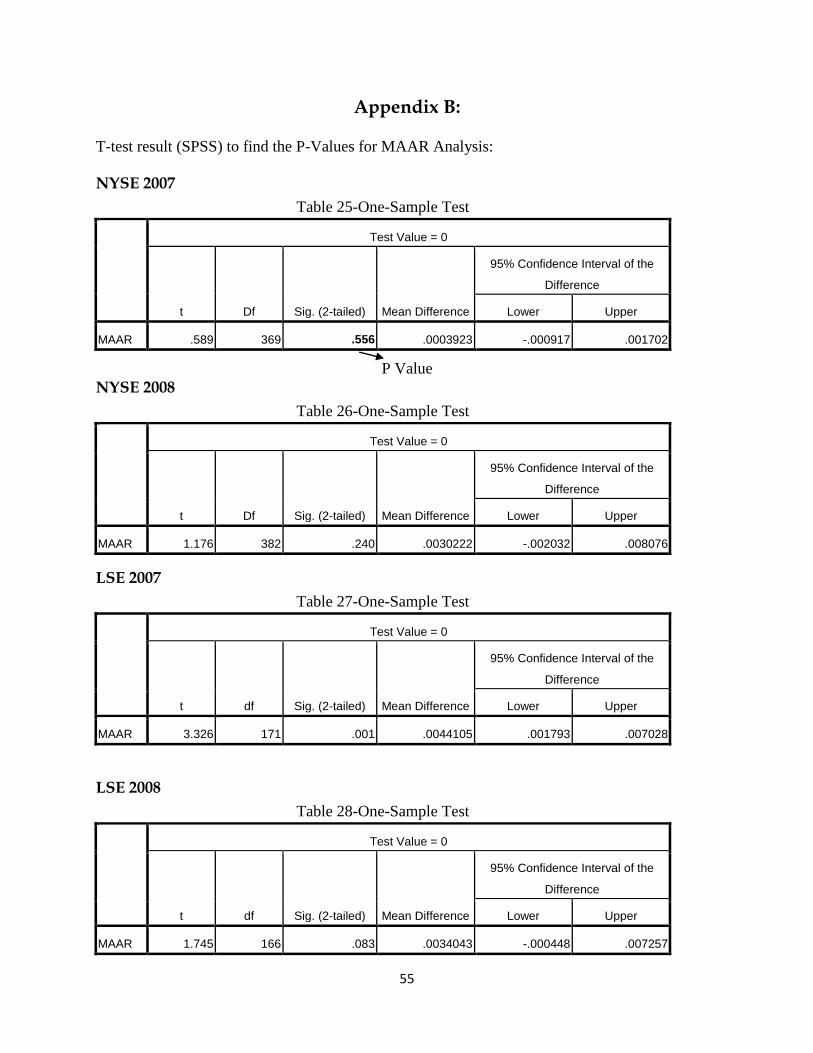
55
Appendix B: T-test result (SPSS) to find the P-Values for MAAR Analysis:
NYSE 2007
Table 25-One-Sample Test
Test Value = 0
t Df Sig. (2-tailed) Mean Difference
95% Confidence Interval of the
Difference
Lower Upper
MAAR .589 369 .556 .0003923 -.000917 .001702
P Value
NYSE 2008
Table 26-One-Sample Test
Test Value = 0
t Df Sig. (2-tailed) Mean Difference
95% Confidence Interval of the
Difference
Lower Upper
MAAR 1.176 382 .240 .0030222 -.002032 .008076
LSE 2007
Table 27-One-Sample Test
Test Value = 0
t df Sig. (2-tailed) Mean Difference
95% Confidence Interval of the
Difference
Lower Upper
MAAR 3.326 171 .001 .0044105 .001793 .007028
LSE 2008
Table 28-One-Sample Test
Test Value = 0
t df Sig. (2-tailed) Mean Difference
95% Confidence Interval of the
Difference
Lower Upper
MAAR 1.745 166 .083 .0034043 -.000448 .007257

56
Umeå School of Business
Umeå University
SE-901 87 Umeå, Sweden
www.usbe.umu.se
Related Documents