The Economic Impact of Arizona’s Renewable Energy Standard and Tariff THE BEACON HILL INSTITUTE AT SUFFOLK UNIVERSITY 8 Ashburton Place Boston, MA 02108 Tel: 617-573-8750, Fax: 617-994-4279 Email: [email protected], Web: www.beaconhill.org APRIL 2013 The Beacon Hill Institute

Welcome message from author
This document is posted to help you gain knowledge. Please leave a comment to let me know what you think about it! Share it to your friends and learn new things together.
Transcript
The Economic Impact of
Arizona’s Renewable Energy
Standard and Tariff
THE BEACON HILL INSTITUTE AT SUFFOLK UNIVERSITY
8 Ashburton Place Boston, MA 02108
Tel: 617-573-8750, Fax: 617-994-4279
Email: [email protected], Web: www.beaconhill.org
APRIL 2013
Th
e B
eaco
n H
ill
Inst
itu
te

The Economic Impact of Arizona’s Renewable Energy Standard & Tariff / April 2013 2
TABLE OF CONTENTS
Executive Summary ................................................................................................................................. 3
Introduction .............................................................................................................................................. 4
Emissions: Life Cycle Analysis .............................................................................................................. 9
Conclusion .............................................................................................................................................. 13
Appendix ................................................................................................................................................. 15
TABLE OF TABLES
Table 1: The Cost of the 15 percent REST Mandate on Arizona (2013 $) ........................................ 8
Table 2: Annual Effects of REST on Electricity Ratepayers (2013 $) ................................................ 9
Table 3: Emissions by Source of Electricity Generation (Grams/kWh) .......................................... 11
Table 4: Change in Emissions Due to the Arizona REST Mandates ............................................... 13
Table 5: Levelized Cost of Electricity from Conventional and Renewable Sources (2009 $) ..... 16
Table 6: Projected Electricity Sales, Renewable Sales and 15 Percent REST Requirement .......... 21
Table 7: LEC and Capacity Factors for Electricity Generation Technologies ................................ 22
Table 8: Medium Cost Case of 15 Percent REST Mandate from 2013 to 2025 ............................... 24
Table 9: Low Cost Case of 15 Percent REST Mandate from 2013 to 2025 ...................................... 25
Table 10: High Cost Case of a 15 Percent REST Mandate from 2013 to 2025 ................................ 25
Table 11: Elasticities for the Economic Variables .............................................................................. 28
© The Beacon Hill Institute 2013
The Economic Impact of Arizona’s Renewable Energy Standard & Tariff / April 2013 3
Executive Summary
In 2006, the Arizona Corporation Commission adopted a Renewable Energy Standard and
Tariff (REST) rule. The rule requires Arizona’s regulated electric utilities to produce 15 percent
or more of their energy from specific renewable sources by 2025.
The Beacon Hill Institute has applied its STAMP® (State Tax Analysis Modeling Program) to
estimate the economic effects of these REST mandates. The U.S. Energy Information
Administration (EIA), a division of the Department of Energy, provides optimistic estimates of
renewable electricity costs and capacity factors. This study bases our estimates on EIA
projections, but we also provide three estimates of the cost of Arizona’s REST mandates ─ low,
medium and high ─ using different cost and capacity factor estimates for electricity-generating
technologies from the academic literature. Our major findings show:
The current REST rule will raise the cost of electricity by $389 million for the state’s
electricity consumers in 2025, within a range of $239 million and $626 million
The REST mandate will cost Arizona’s electricity consumers $1.383 billion from 2013 to
2025, within a range of $857 million and $2.221 billion
Arizona’s electricity prices will rise by 6 percent by 2025, within a range of 3.7 percent
and 9.7 percent
These increased energy prices will hurt Arizona’s households and businesses and, in turn,
inflict harm on the state economy. In 2025, the REST would:
Lower employment by 2,500 jobs, within a range of 1,500 jobs and 4,100 jobs
Reduce real disposable income by $334 million, within a range of $202 million and $543
million
Decrease investment in the state by $38 million, within a range of $23 million and $61
million
Increase the average household electricity bill by $128 per year; commercial businesses
by an average of $686 per year; and industrial businesses by an average of $28,600 per
year
The Economic Impact of Arizona’s Renewable Energy Standard & Tariff / April 2013 4
Introduction
After a three-year review the Arizona Corporation Commission adopted the Arizona
Renewable Energy Standard and Tariff (REST) in November 2006. The rule requires that all
regulated electric utilities to generate 15 percent of their retail electricity sales from eligible
renewable energy sources by 2025. The rule initially set the mandate at 1.25 percent in 2006,
with one-half percentage point increases in each year, making the 2015 requirement 5 percent.
In the years 2016 through 2025, the REST mandate increases by one percentage point each
year. 1
Utilities are required to file with the commission annual compliance reports, implementation
plans, and notices of non-compliance. The commission may assess penalties for non-
compliance with the REST, subject to a review process. The commission may also waive
compliance with any provision of the rules for “good cause,” but the rule fails to define what
constitutes “good cause.” 2
The REST allows utilities to use solar, wind, biomass, biogas, geothermal and other similar
technologies. The policy also allows new electricity generated by hydroelectric power facilities
built before 1997 provided the additional electricity results from increased capacity due to
technological and operational efficiencies. The policy also allows for new hydroelectric
facilities used to regulate the output of other eligible, intermittent renewable resources (wind
and solar), or new facilities with a capacity of less than 11 megawatts (MWs) that does not
require new damming of a river. The rules allow for new and emerging technologies to be
added as they become feasible.3
The REST requires a growing percentage of the total resource portfolio to come from
distributed generation – such as a large solar installation on the roof of a shopping mall, or
solar panels at a residential building. Fifty-percent of the distributed renewable energy
requirement must come from residential sources and the remaining fifty-percent from
nonresidential, non-utility sources. The distributed energy requirement started at 5 percent of
1 The Arizona Corporation Commission, Utilities Division, Renewable Energy Standard and Tariff, Internet
http://www.azcc.gov/divisions/utilities/electric/environmental.asp, (accessed January 2013) 2 Arizona Administrative Code, Title 14. Public Service Corporations; Corporations and Associations; Securities Regulation, Chapter 2. Corporation Commission Fixed Utilities, Article 18, Renewable Energy Standard and Tariff, R14-2-1802. Eligible Renewable Energy Resources, http://www.azsos.gov/public_services/Title_14/14-02.htm#ARTICLE_18, (accessed January 2013)
3 Ibid, R14-2-1816. Waiver from the Provisions of this Article.
© The Beacon Hill Institute 2013
The Economic Impact of Arizona’s Renewable Energy Standard & Tariff / April 2013 5
the total renewable generation in 2007 and peaked at 30 percent of the total renewable
generation after 2011. The rules include funding for utility customers to build distributed
renewable energy resources and net metering that allow these projects to provide energy to
the electricity grid. 4
Utilities must obtain Renewable Energy Credits (RECs) for each kilowatt-hour (kWh) of
electricity generated by renewable sources. For distributed renewable energy heating and
cooling resources, one REC is issued for each 3,415 British Thermal Units (BTU) of heat
produced by the resource. RECs can be acquired as long as the transaction is documented and
the utility can demonstrate the renewable electricity was delivered to their customers. The
RECs are also bankable for use in future years.5
The REST rule also applies several extra credit multipliers for electricity produced from: (1)
“early installation” of renewable facilities built between 2001 and 2003; (2) a 0.5 multiplier for
facilities built in Arizona prior to January 1, 2006; (3) 0.5 for facilities built in Arizona prior to
January 1, 2006 and contain components manufactured in Arizona; (4) 0.5 for distributed solar
electric generator facilities built in Arizona prior to January 1, 2006 that satisfy two conditions
related to location and participation in green pricing – net metering or solar leasing programs.
The multipliers are additive, except that the maximum combined Extra Credit Multiplier
cannot exceed 2.6
REST also provides for a credit that applies to utilities that own or make a significant
investment in a solar manufacturing located in Arizona. The credits are equal to the nameplate
capacity of solar electric generators produced and sold in a calendar year multiplied by 2,190
hours, which approximates a 25 percent capacity factor. The extra credit multipliers cannot be
combined with this manufacturing credit.7
REST outlines a “tariff” to allow utilities “for recovering the reasonable and prudent costs of
complying” with the rules. Utilities must file an annual report for a tariff application that
includes data to support the level of costs designed to recover only the costs in excess of the
market cost of comparable conventional generation. The rule also sets out a process for utilities
4 Ibid, subsection B. 5 Ibid, R14-2-1803. Renewable Energy Credits.
6 Ibid, R14-2-1806. Extra Credit Multipliers. 7 Ibid, R14-2-1806. Extra Credit Multipliers.

The Economic Impact of Arizona’s Renewable Energy Standard & Tariff / April 2013 6
to adjust the tariff to reflect changes in costs and provides a monthly “sample tariff” as a
guide. The sample tariff is $1.05 per service for residential customers; $39.00 for non-
residential customers; and $117.00 for non-residential customers whose metered demand is
3,000 kW or more for three consecutive months.8
The utility compliance reports provide cost estimates of the REST through 2011. Since 2007 the
largest utilities, Arizona Public Service Company and Tucson Electric Power Company, have
collected about $469 million from their customers under REST.9 Some of these funds were not
spent and were carried into 2012. The cost should only increase in the future as the REST
requirements increase and the lowest cost and most efficient projects are funded first and the
higher cost projects are delayed into the future.
In this paper the Beacon Hill Institute at Suffolk University (BHI) estimates the costs of
Arizona’s REST Act and its impact on the state’s economy. To that end, BHI applied its
STAMP® (State Tax Analysis Modeling Program) to estimate the economic effects of the state
REST mandate.10
Since renewable energy generally costs more than conventional energy, many have voiced
concerns about these higher electric rates. A wide variety of cost estimates exist for renewable
electricity sources. The EIA provides estimates for the cost of conventional and renewable
electricity generating technologies. However, the EIA’s assumptions are optimistic about the
capacity of renewable electricity to generate cost-efficient and reliable energy.
A review of the literature shows that in most cases the EIA’s projected costs can be found at
the low end of the range of estimates, with the EIA’s capacity factor for wind at the high end of
the range. The EIA does not take into account the actual experience of existing renewable
electricity power plants. The EIA cost estimates include the Federal Renewable Electricity
Production Tax Credit and “a 3-percentage point increase in the cost of capital is added when
evaluating investments in greenhouse gas (GHG) intensive technologies like coal-fired power
and coal-to-liquids (CTL) plants without carbon control and sequestration (CCS).” The EIA
8 Ibid, R14-2-1808.
9 The Arizona Corporation Commission, Utilities Division, Renewable Energy Standard and Tariff, Internet http://www.azcc.gov/divisions/utilities/electric/environmental.asp,( Accessed January 2013) 10 Detailed information about the STAMP® model can at
http://www.beaconhill.org/STAMP_Web_Brochure/STAMP_HowSTAMPworks.html.
© The Beacon Hill Institute 2013
The Economic Impact of Arizona’s Renewable Energy Standard & Tariff / April 2013 7
admits that the “adjustment is somewhat arbitrary” and is similar to that of an emissions fee of
$15 per metric ton of carbon dioxide (CO2).11
None of the assumptions used by EIA or others are certain or likely to be in place in 2025,
when the REST mandate peaks. The production tax credit is controversial and was only
extended for only one year as part of the so called “Fiscal Cliff” resolution. Congress has not
enacted any GHG legislation, and in its current form, is unlikely to in the future.
One could justify the higher electricity costs if the environmental benefits – in terms of reduced
GHG and other emissions – outweighed the costs. However, it is unclear that the use of
renewable energy resources – especially wind and solar – significantly reduces GHG
emissions. Due to their intermittency, wind and solar require significant backup power
sources that are cycled up and down to accommodate the variability in the production of wind
and solar power. A recent study found that wind power actually increases pollution and
greenhouse gas emissions.12 Thus, there appear to be few, if any, benefits to implementing
REST policies based on heavy uses of wind.
Governments enact REST-type policies because most sources of renewable electricity
generation are less efficient and thus more costly than conventional sources of generation. The
REST policy forces utilities to buy electricity from renewable sources and thus guarantees a
market for them. These higher costs are passed on to electricity consumers, including
residential, commercial and industrial customers.
Increases in electricity costs are known to have a negative effect on the economy – not unlike
taxes – as prosperity and economic growth are dependent upon access to reliable and
affordable energy. Since electricity is an essential commodity, consumers will have limited
opportunity to avoid these costs. For the poorest members of society, these energy taxes will
compete directly with essential purchases in the household budget, such as food,
transportation and shelter.
11
http://www.eia.gov/forecasts/aeo/electricity_generation.cfm 12 See “How Less Became More: Wind, Power and Unintended Consequences in the Colorado Energy Market,”
http://goo.gl/kr6qN Bentek Energy, LLC. Evergreen Colorado: May 2010.

The Economic Impact of Arizona’s Renewable Energy Standard & Tariff / April 2013 8
Estimates and Results
In light of the wide divergence in the costs and capacity factor estimates available for the
different electricity generation technologies, we provide three estimates of the effects of
Arizona’s REST. Each estimate represents the change that will take place in the indicated
variable against the counterfactual assumption that the REST mandate would not be
implemented. The appendix contains details of our methodology. Table 1 displays the cost
estimates and economic impact of the 15 percent REST mandate in 2025, compared to a
baseline of no REST policy.
Table 1: The Cost of the 15 percent REST Mandate on Arizona (2013 $)
Costs Estimates Low Medium High
Total Net Cost 2025 ($ million) 239 389 626
Total Net Cost 2013-2025 ($ million) 857 1,383 2,221
Electricity Price Increase in 2025 (cents per kWh) 0.42 0.68 1.09
Percentage Increase 3.7 6.0 9.7
Economic Indicators
Total Employment (jobs) (1,500) (2,500) (4,100)
Investment ($ million) (23) (38) (61)
Real Disposable Income ($ million) (202) (334) (543)
The current REST will impose costs of $389 million by 2025, within a range of $239 million and
$626 million. As a result, the REST mandate would increase expected electricity prices by 0.68
cents per kilowatt hour (kWh) or by 6.0 percent, within a range of 0.42 cents per kWh, or by 3.7
percent, and 1.09 cents per kWh, or by 9.7 percent.
The STAMP model simulation indicates that, upon full implementation, the REST law will
harm Arizona’s economy. The state’s ratepayers will face higher electricity prices that will
increase their cost of living, which will in turn put downward pressure on households’
disposable income. By 2025 the Arizona economy will shed 2,500 jobs, within a range of 1,500
and 4,100 jobs.
The job losses and price increases will reduce real incomes as firms, households and
governments spend more of their budgets on electricity and less on other items, such as home
goods and services. In 2025, real disposable income will fall by an average of $334 million,
© The Beacon Hill Institute 2013
The Economic Impact of Arizona’s Renewable Energy Standard & Tariff / April 2013 9
between $202 million and $543 million under the low and high cost scenarios respectively.
Furthermore, net investment will fall by $38 million, within a range of $21 million and $61
million.
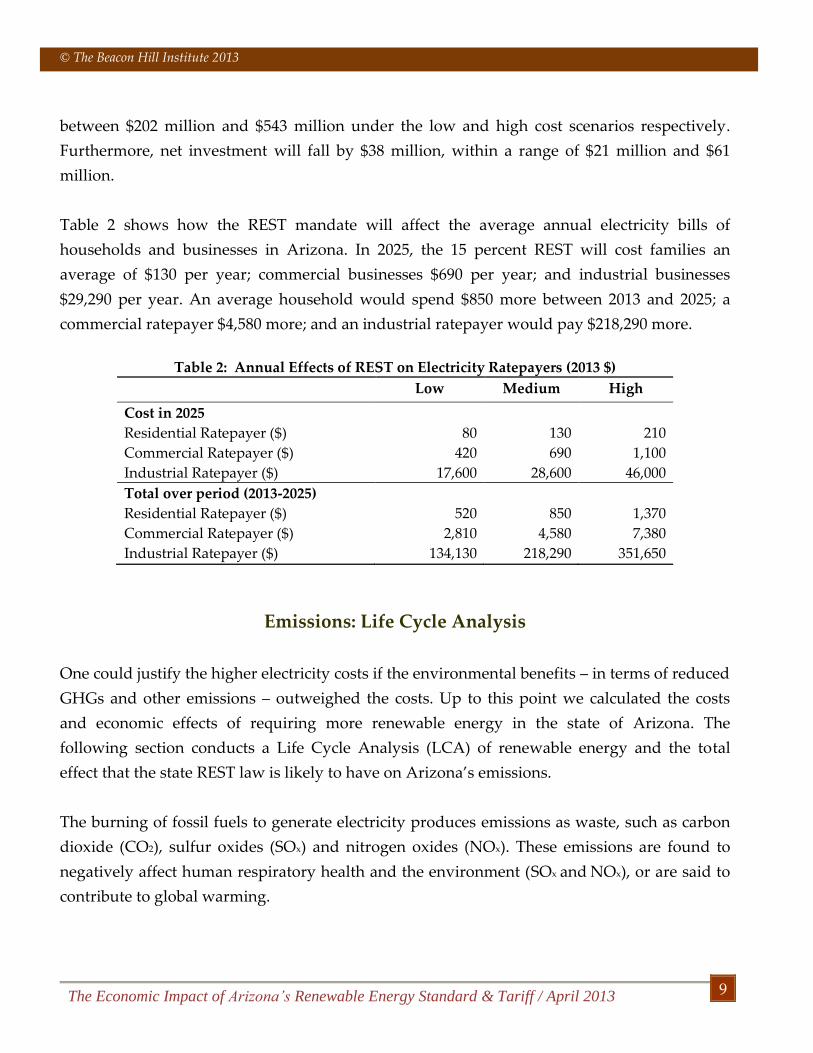
Table 2 shows how the REST mandate will affect the average annual electricity bills of
households and businesses in Arizona. In 2025, the 15 percent REST will cost families an
average of $130 per year; commercial businesses $690 per year; and industrial businesses
$29,290 per year. An average household would spend $850 more between 2013 and 2025; a
commercial ratepayer $4,580 more; and an industrial ratepayer would pay $218,290 more.
Table 2: Annual Effects of REST on Electricity Ratepayers (2013 $)
Low Medium High
Cost in 2025
Residential Ratepayer ($) 80 130 210
Commercial Ratepayer ($) 420 690 1,100
Industrial Ratepayer ($) 17,600 28,600 46,000
Total over period (2013-2025)
Residential Ratepayer ($) 520 850 1,370
Commercial Ratepayer ($) 2,810 4,580 7,380
Industrial Ratepayer ($) 134,130 218,290 351,650
Emissions: Life Cycle Analysis
One could justify the higher electricity costs if the environmental benefits – in terms of reduced
GHGs and other emissions – outweighed the costs. Up to this point we calculated the costs
and economic effects of requiring more renewable energy in the state of Arizona. The
following section conducts a Life Cycle Analysis (LCA) of renewable energy and the total
effect that the state REST law is likely to have on Arizona’s emissions.
The burning of fossil fuels to generate electricity produces emissions as waste, such as carbon
dioxide (CO2), sulfur oxides (SOx) and nitrogen oxides (NOx). These emissions are found to
negatively affect human respiratory health and the environment (SOx and NOx), or are said to
contribute to global warming.

The Economic Impact of Arizona’s Renewable Energy Standard & Tariff / April 2013 10
Many proponents of renewable energy, such as wind power, solar power and municipal solid
waste (MSW) justify the higher electricity prices, and the negative economic effects that follow,
based on the claim that these sources produce no emissions (see examples below). But this is
misleading. The fuel that powers these services, such as the sun and wind, create no emissions.
However, the process of construction, operation and decommissioning of renewable power
plants does create emissions. This begs the question:
Is renewable energy production as environmentally friendly as some proponents claim?
“Harnessing the wind is one of the cleanest, most sustainable ways to generate
electricity. Wind power produces no toxic emissions and none of the heat trapping
emissions that contribute to global warming.”13
“Wind turbines harness air currents and convert them to emissions-free power.”14
~Union of Concerned Scientists
“As far as pollution…Zip, Zilch, Nada… etc. Carbon dioxide pollution isn’t in the
vocabulary of solar energy. No emissions, greenhouse gases, etc.”15
~Let’s Be Grid Free. Solar Energy Facts
The affirmative argument is usually based on the environmental effects of the operational
phase of the renewable source (that will produce electricity with no consumption of fossil fuel
and no emissions), but excluding the whole manufacturing phase (from the extraction to the
erection of the turbine or solar panel, including the production processes and all the
transportation needs) and the decommission phase. LCA offers a framework to provide a
more complete answer the question.
LCA is a “cradle-to-grave” approach for assessing industrial systems. LCA begins with the
gathering of raw materials from the earth to create the product and ends at the point when all
materials are returned to the earth. By including the impacts throughout the product life cycle,
LCA provides a comprehensive view of the environmental aspects of the product or process
and a more accurate picture of the true environmental trade-offs in product and process
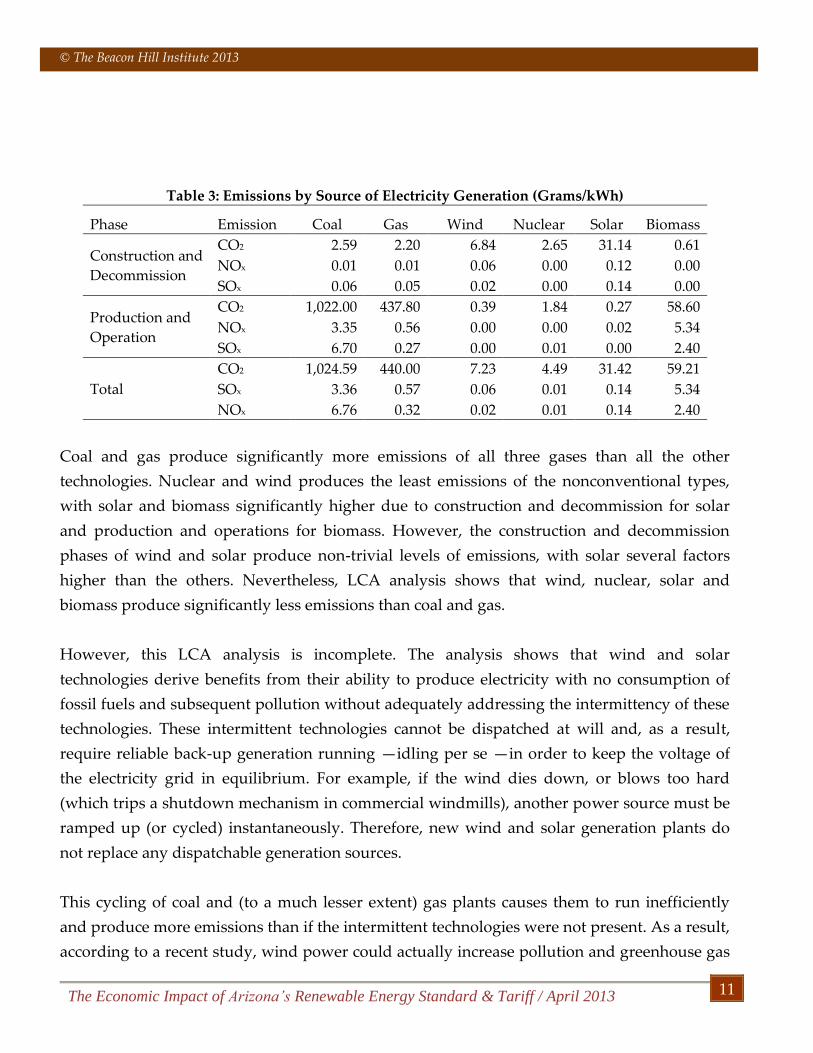
selection. Table 3 displays LCA results for conventional and nonconventional sources.
13 How Wind Energy Works. Union of Concerned Scientists. http://www.ucsusa.org/clean_energy/our-energy-choices/renewable-energy/how-wind-energy-works.html. 14 Our Energy Choices: Renewable Energy. Union of Concerned Scientists. http://www.ucsusa.org/clean_energy/our-energy-choices/renewable-energy/. 15 Solar Energy Facts. Let’s Be Grid Free. http://www.letsbegridfree.com/solar-energy-facts/.
© The Beacon Hill Institute 2013
The Economic Impact of Arizona’s Renewable Energy Standard & Tariff / April 2013 11
Table 3: Emissions by Source of Electricity Generation (Grams/kWh)
Phase Emission Coal Gas Wind Nuclear Solar Biomass
Construction and
Decommission
CO2 2.59 2.20 6.84 2.65 31.14 0.61
NOx 0.01 0.01 0.06 0.00 0.12 0.00
SOx 0.06 0.05 0.02 0.00 0.14 0.00
Production and
Operation
CO2 1,022.00 437.80 0.39 1.84 0.27 58.60
NOx 3.35 0.56 0.00 0.00 0.02 5.34
SOx 6.70 0.27 0.00 0.01 0.00 2.40
Total
CO2 1,024.59 440.00 7.23 4.49 31.42 59.21
SOx 3.36 0.57 0.06 0.01 0.14 5.34
NOx 6.76 0.32 0.02 0.01 0.14 2.40
Coal and gas produce significantly more emissions of all three gases than all the other
technologies. Nuclear and wind produces the least emissions of the nonconventional types,
with solar and biomass significantly higher due to construction and decommission for solar
and production and operations for biomass. However, the construction and decommission
phases of wind and solar produce non-trivial levels of emissions, with solar several factors
higher than the others. Nevertheless, LCA analysis shows that wind, nuclear, solar and
biomass produce significantly less emissions than coal and gas.
However, this LCA analysis is incomplete. The analysis shows that wind and solar
technologies derive benefits from their ability to produce electricity with no consumption of
fossil fuels and subsequent pollution without adequately addressing the intermittency of these
technologies. These intermittent technologies cannot be dispatched at will and, as a result,
require reliable back-up generation running —idling per se —in order to keep the voltage of
the electricity grid in equilibrium. For example, if the wind dies down, or blows too hard
(which trips a shutdown mechanism in commercial windmills), another power source must be
ramped up (or cycled) instantaneously. Therefore, new wind and solar generation plants do
not replace any dispatchable generation sources.
This cycling of coal and (to a much lesser extent) gas plants causes them to run inefficiently
and produce more emissions than if the intermittent technologies were not present. As a result,
according to a recent study, wind power could actually increase pollution and greenhouse gas

The Economic Impact of Arizona’s Renewable Energy Standard & Tariff / April 2013 12
emissions in areas that generate a significant portion of their electricity from coal.16 The current
LCA literature ignores this important portion of the analysis, which provides a distorted
assessment of wind and solar power.
Nevertheless, even incorporating renewable sources does, in and of themselves, produce much
less emissions than conventional sources, displacing only a small amount of emissions from
conventional sources. Indeed, this amount is multiplied, due to lower capacity ratings of many
green energy sources and required backup generation.
To better judge the actual total benefit derived from switching from the current energy source
portfolio to one that involves more renewable energy, as the REST dictates in Arizona, BHI
compared the total emissions impact according to our projections using a life cycle analysis for
the various energy sources. Table 4 on the following page displays the results.
16 See “How Less Became More: Wind, Power and Unintended Consequences in the Colorado Energy Market,”
Bentek Energy, LLC. (Evergreen Colorado: May, 2010).
© The Beacon Hill Institute 2013
The Economic Impact of Arizona’s Renewable Energy Standard & Tariff / April 2013 13
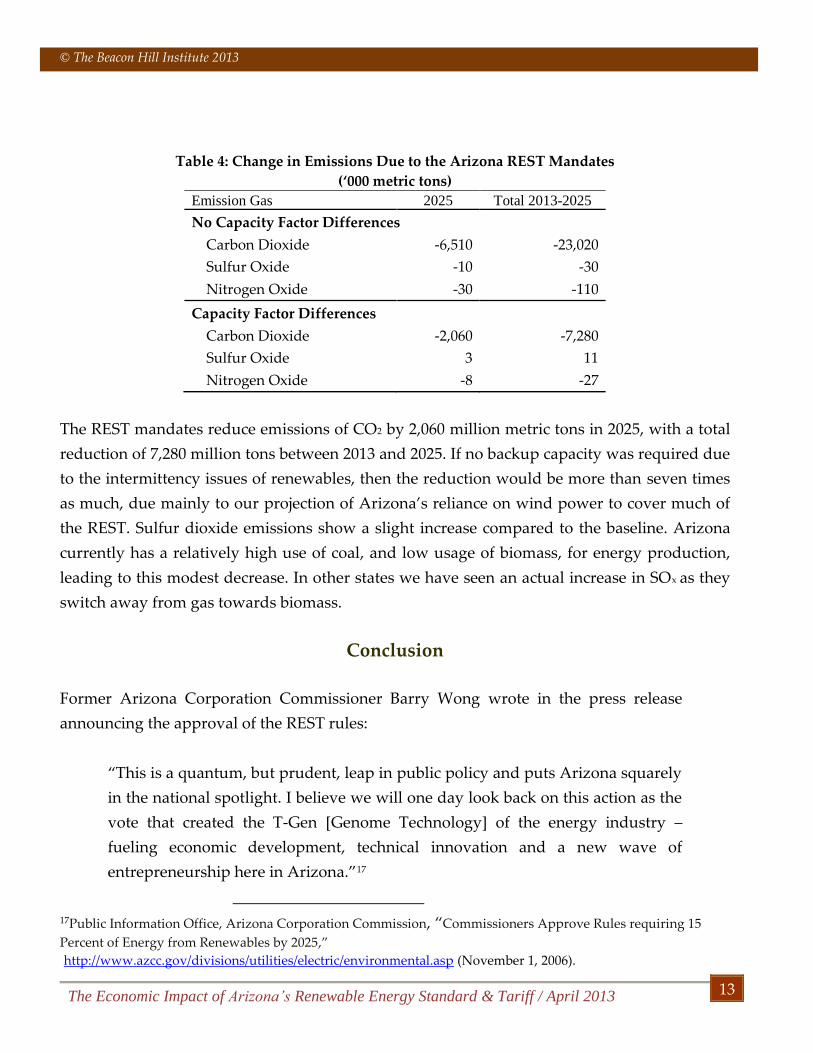
Table 4: Change in Emissions Due to the Arizona REST Mandates
(‘000 metric tons)
Emission Gas 2025 Total 2013-2025
No Capacity Factor Differences
Carbon Dioxide -6,510 -23,020
Sulfur Oxide -10 -30
Nitrogen Oxide -30 -110
Capacity Factor Differences
Carbon Dioxide -2,060 -7,280
Sulfur Oxide 3 11
Nitrogen Oxide -8 -27
The REST mandates reduce emissions of CO2 by 2,060 million metric tons in 2025, with a total
reduction of 7,280 million tons between 2013 and 2025. If no backup capacity was required due
to the intermittency issues of renewables, then the reduction would be more than seven times
as much, due mainly to our projection of Arizona’s reliance on wind power to cover much of
the REST. Sulfur dioxide emissions show a slight increase compared to the baseline. Arizona
currently has a relatively high use of coal, and low usage of biomass, for energy production,
leading to this modest decrease. In other states we have seen an actual increase in SOx as they
switch away from gas towards biomass.
Conclusion
Former Arizona Corporation Commissioner Barry Wong wrote in the press release
announcing the approval of the REST rules:
“This is a quantum, but prudent, leap in public policy and puts Arizona squarely
in the national spotlight. I believe we will one day look back on this action as the
vote that created the T-Gen [Genome Technology] of the energy industry –
fueling economic development, technical innovation and a new wave of
entrepreneurship here in Arizona.”17
17Public Information Office, Arizona Corporation Commission, “Commissioners Approve Rules requiring 15
Percent of Energy from Renewables by 2025,”
http://www.azcc.gov/divisions/utilities/electric/environmental.asp (November 1, 2006).
The Economic Impact of Arizona’s Renewable Energy Standard & Tariff / April 2013 14
Commissioner Wong was correct that the law has fueled economic development and
entrepreneurship in Arizona. However, these entrepreneurs do not seek to provide innovative
products that customers demand. Rather government incentivizes behavior that tilts public
policy in their favor by mandating costlier and inefficient electricity production.
While REST generates economic benefits for a small group of favored industries, all of
Arizona’s electricity customers pay higher rates, diverting resources away from household
spending and savings and business investment. As a result, Arizona residents will have fewer
employment opportunities and watch investment flee to other states with more favorable
business climates.
Firms with high electricity usage will likely move their production, and emissions, out of
Arizona to locations with lower electricity prices. Therefore, the REST Arizona policy will not
reduce global emissions, but rather send jobs and capital investment outside the state.
© The Beacon Hill Institute 2013
The Economic Impact of Arizona’s Renewable Energy Standard & Tariff / April 2013 15
Appendix
Electricity Generation Costs
As noted above, governments enact REST-type policies to prop up the price of renewable
electricity generation. They begin with two disadvantages: renewables are less efficient and
more costly than conventional sources of generation. Renewables suffer weak demand in the
open market place. REST policies force utilities to buy electricity from renewable sources.
These policies guarantee a market for the renewable sources. The higher costs are passed to
electricity consumers, including residential, commercial and industrial customers.
The U.S. Department of Energy’s Energy Information Administration estimates the “levelized
energy cost” (LEC) — or financial breakeven cost per MWh — to produce new electricity in its
Annual Energy Outlook.18 The EIA provides LEC estimates for conventional and renewable
electricity technologies — coal, nuclear, geothermal, landfill gas, solar photovoltaic, wind and
biomass — assuming the new sources enter service in 2017. The EIA also provides LEC
estimates for conventional coal, combined cycle gas, advanced nuclear and onshore wind only,
assuming the sources enter service in 2020 and 2035.
While the EIA does not provide LEC for hydroelectric, solar photovoltaic, geothermal and
biomass for 2020 and 2035, it does project overnight capital costs for 2015, 2025 and 2035. We
can estimate the LEC for these technologies and years using the percent change in capital costs
to inflate the 2017 LECs. In its Annual Energy Outlook, the EIA incorporates many assumptions
about the future price of capital, materials, fossil fuels, maintenance and capacity factor into
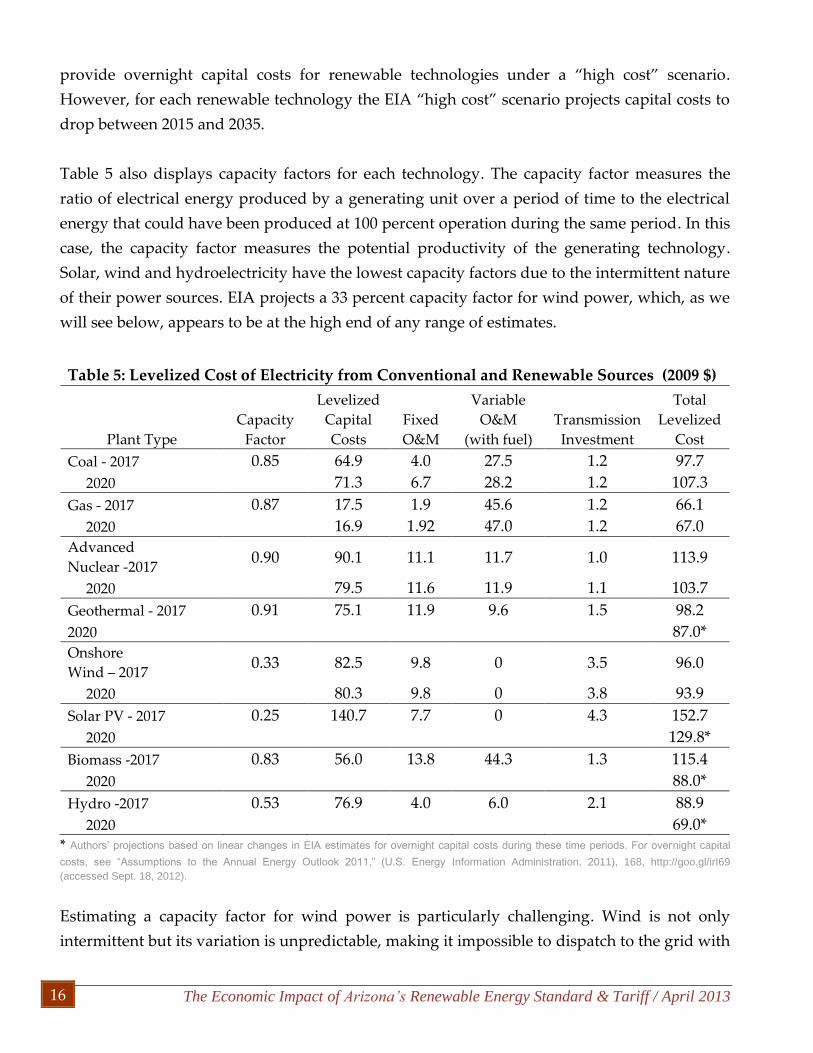
their forecast. Table 5 on the following page shows the EIA projections that the LEC for all four
electricity sources (coal, gas, nuclear and wind) will fall significantly from 2017 to 2025. The
fall in capital costs drives the drop in total system LEC over the period.
Using the EIA change in overnight capital costs for solar and biomass produces reductions in
LECs similar to wind from 2017 to 2020. The biomass LEC drops by 23.7 percent and solar by
15 percent over the period. These compare modest cost increases of 13.2 percent for coal and
1.4 percent for gas, and a drop of 8.9 percent for nuclear over the same period. EIA does
18 "Levelized Cost of New Generation Resources in the Annual Energy Outlook 2012," (U.S. Energy Information
Administration, 2011), http://goo.gl/DG6Qk (accessed Oct. 2, 2012).
The Economic Impact of Arizona’s Renewable Energy Standard & Tariff / April 2013 16
provide overnight capital costs for renewable technologies under a “high cost” scenario.
However, for each renewable technology the EIA “high cost” scenario projects capital costs to
drop between 2015 and 2035.
Table 5 also displays capacity factors for each technology. The capacity factor measures the
ratio of electrical energy produced by a generating unit over a period of time to the electrical
energy that could have been produced at 100 percent operation during the same period. In this
case, the capacity factor measures the potential productivity of the generating technology.
Solar, wind and hydroelectricity have the lowest capacity factors due to the intermittent nature
of their power sources. EIA projects a 33 percent capacity factor for wind power, which, as we
will see below, appears to be at the high end of any range of estimates.
Table 5: Levelized Cost of Electricity from Conventional and Renewable Sources (2009 $)
Plant Type Capacity
Factor
Levelized
Capital
Costs Fixed
O&M
Variable
O&M
(with fuel) Transmission
Investment
Total
Levelized
Cost
Coal - 2017 0.85 64.9 4.0 27.5 1.2 97.7
2020 71.3 6.7 28.2 1.2 107.3
Gas - 2017 0.87 17.5 1.9 45.6 1.2 66.1
2020 16.9 1.92 47.0 1.2 67.0
Advanced
Nuclear -2017 0.90 90.1 11.1 11.7 1.0 113.9
2020 79.5 11.6 11.9 1.1 103.7
Geothermal - 2017 0.91 75.1 11.9 9.6 1.5 98.2
2020 87.0*
Onshore
Wind – 2017 0.33 82.5 9.8 0 3.5 96.0
2020 80.3 9.8 0 3.8 93.9
Solar PV - 2017 0.25 140.7 7.7 0 4.3 152.7
2020 129.8*
Biomass -2017 0.83 56.0 13.8 44.3 1.3 115.4
2020 88.0*
Hydro -2017 0.53 76.9 4.0 6.0 2.1 88.9
2020 69.0* * Authors’ projections based on linear changes in EIA estimates for overnight capital costs during these time periods. For overnight capital
costs, see “Assumptions to the Annual Energy Outlook 2011,” (U.S. Energy Information Administration, 2011), 168, http://goo.gl/irI69
(accessed Sept. 18, 2012).
Estimating a capacity factor for wind power is particularly challenging. Wind is not only
intermittent but its variation is unpredictable, making it impossible to dispatch to the grid with

© The Beacon Hill Institute 2013
The Economic Impact of Arizona’s Renewable Energy Standard & Tariff / April 2013 17
any certainty. This unique aspect of wind power argues for a capacity factor rating of close to
zero. Nevertheless, wind capacity factors have been estimated to be between 20 percent and 40
percent.19 The other variables that affect the capacity factor of wind are the quality and
consistency of the wind and the size and technology of the wind turbines deployed. As the
U.S. and other countries add more wind power over time, presumably the wind turbine
technology will improve, but the new locations for power plants will likely have less
productive wind resources.
The EIA estimates of LEC and capacity factors paint a particularly rosy view of the future cost
of renewable electricity generation, particularly wind. Other forecasters and the experience of
current renewable energy projects portray a less sanguine outlook.
Wind, solar and biomass are the largest renewable power sources and are the most likely to
satisfy future REST mandates. The most prominent issues that will affect the future availability
and cost of renewable electricity resources are diminishing marginal returns and competition
for scarce resources. These issues will affect wind, solar and biomass in different ways as the
REST mandates ratchet up over the next decade.
Wind, solar and biomass resources face land use issues. Conventional energy plants can be
built within a space of several acres, but wind and solar power plants with the same nameplate
capacity (not actual capacity) would require many square miles of land While solar power
suffers from similar land needs, it can be more easily adapted to suburban and urban areas in
a small scale, such as building rooftops. Nevertheless, industrial scale solar plants still require
much larger landmass than conventional plants.
After taking into account capacity factors, a wind power plant would need a land mass of 20
by 25 kilometers to produce the same energy as a nuclear power plant that can be situated on
500 square meters (one-quarter square kilometer).20
19 Renewable Energy Research Laboratory, University of Massachusetts at Amherst, “Wind Power, Capacity
Factor and Intermittency: What Happens When the Wind Doesn’t Blow?” Community Wind Power Fact Sheet
#2a, http://goo.gl/24r2u. 20 “Evidence to the House of Lords Economic Affairs Committee Inquiry into ‘The Economics of Renewable
Energy’,” Memorandum by Dr. Phillip Bratby, May 15, 2008. http://goo.gl/oyh1Y (accessed Oct. 2, 2012).

The Economic Impact of Arizona’s Renewable Energy Standard & Tariff / April 2013 18
Solar also suffers from larger land use issues. Solana Generating Station, the largest solar plant
in the United States near Gila Bend, Arizona will have a total capacity of 270 megawatts (MW)
and will cover an area of 1,900 acres or 7.7 square kilometers.21
The need for large areas of land to site wind and solar power plants will require the purchase
of vast areas of land by private wind developers and/or allowing wind production on public
lands. In either case land acquisition/rent or public permitting processes will likely increase
costs as wind power plants are built.
The swift expansion of wind power will also suffer from diminishing marginal returns as new
wind capacity will be located in areas with lower and less consistent wind speeds. As a result,
fewer megawatt hours of power will be produced from newly built wind projects. The new
wind capacity will be developed in increasingly remote areas that will require larger
investments in transmission and distribution, which will drive costs even higher.
The EIA estimates of the average capacity factor used for onshore wind power plants, at 34.4
percent, appears to be at the higher end of the estimates for current wind projects and 25
percent for solar p.v. and 20 percent for solar thermal. This figure is inconsistent with
estimates from other studies.22 According to the EIA’s own reporting from 137 current wind
power plants in 2003, the average capacity factor was 26.9 percent.23 In addition, a recent
analysis of wind capacity factors around the world finds an actual average capacity factor of 21
percent.24 Estimates find solar p.v. capacity factor of 19 percent .25
Biomass is a more promising renewable power source. Biomass combines low incremental
costs relative to other renewable technologies and reliability. Biomass is not intermittent and
therefore it is dispatchable and is competitive with conventional energy sources. Moreover,
biomass plants can be located close to urban areas with high electricity demand. But biomass
electricity suffers from land use issues even more so than wind.
21 National Renewable Energy Laboratory, Concentrating Solar Power Projects, Internet,
http://www.nrel.gov/csp/solarpaces/project_detail.cfm/projectID=23, 22 Nicolas Boccard, “Capacity Factors for Wind Power: Realized Values vs. Estimates,” Energy Policy 37, no. 7 (July
2009): 2680. http://goo.gl/oyh1Y. 23 Cited by Tom Hewson, Energy Venture Analysis, “Testimony for East Haven Windfarm,” January 1, 2005,
http://www.windaction.org/documents/720. 24 Boccard. 25 Laumer, John (June 2008). "Solar Versus Wind Power: Which Has The Most Stable Power Output?". Treehugger.
Retrieved 2008-10-16.
© The Beacon Hill Institute 2013
The Economic Impact of Arizona’s Renewable Energy Standard & Tariff / April 2013 19
The expansion of biomass power plants will require huge additional sources of fuel. Wood and
wood waste comprise the largest source of biomass energy today. According to the National
Renewable Energy Laboratory, other sources of biomass “include food crops, grassy and
woody plants, residues from agriculture or forestry, oil-rich algae, and the organic component
of municipal and industrial wastes.”26 Biomass power plants will compete directly with other
sectors (construction, paper, furniture) of the economy for wood and food products and arable
land.
One study estimates that 66 million acres of land would be required to provide enough fuel to
satisfy the current state REST mandates and a 20 percent federal REST in 2025.27 When the
clearing of new farm and forestlands are figured into the GHG production of biomass, it is
likely that biomass increases GHG emissions.
The competition for farm and forestry resources would not only cause biomass fuel prices to
skyrocket, but also cause the prices of domestically-produced food, lumber, furniture and
other products to rise. The recent experience of ethanol and its role in surging corn prices can
be casually linked to the recent food riots in Mexico, and also to the struggle facing
international aid organizations that address hunger in places such as the Darfur region of
Sudan.28 These two examples serve as reminders of the unintended consequences of
government mandates for biofuels. The lesson is clear: Biofuels compete with food production
and other basic products, and distort the market.
Calculation of the Net Cost of New Renewable Electricity
To calculate the cost of renewable energy under the RES, BHI used data from the Energy
Information Administration (EIA), a division of the U.S. Department of Energy, to determine
the percent increase in utility costs that Arizona residents and businesses would experience.
This calculated percent change was then applied to calculated elasticities, as described in the
STAMP modeling section.
26 "Biomass Energy Basics," (National Renewable Energy Laboratory),
http://www.nrel.gov/learning/re_biomass.html. 27 Hewson, 61. 28 Heather Stewart, "High costs of basics fuels global food fights," The Observer, February 17, 2007,
http://goo.gl/7tL9a (accessed Oct. 2, 2012); See also Celia W. Dugger, "As Prices Soar, U.S. Food Aid Buys Less,"
New York Times, Sept. 29, 2007, 2007, http://goo.gl/SYFCA.

The Economic Impact of Arizona’s Renewable Energy Standard & Tariff / April 2013 20
We collected historical data on the retail electricity sales by sector from 1990 to 2010 and
projected its growth through 2025 using its historical compound annual growth rate (see
Table 6).29 To these totals, we applied the percentage of renewable sales prescribed by the
Arizona REST. By 2025, renewable energy sources must account for 15 percent of total
electricity sales in Arizona.
Next we projected the growth in renewable sources that would have taken place absent REST.
We used an average of the EIA’s projection of renewable energy sources by fuel for the SERC
Reliability Corporation/Gateway and the Southwest Power Pool/North areas through 2025 as a
proxy to grow renewable sources for Arizona. We used the growth rate of these projections to
estimate Arizona’s renewable generation through 2025 absent the REST. In addition, we
projected growth in the “Green Choice” program of Arizona Public Service Company, which
offers customers the option to pay higher rates for renewable energy.30 The combination of
these two numbers provides us with our baseline percentage of total electricity sales from
renewables between 2013 and 2025, 0.39 percent and 0.86 percent respectively.
We subtracted our baseline projection of renewable sales from the REST-mandated quantity of
sales for each year from 2013 to 2025, to obtain our estimate of the annual increase in
renewable sales induced by the REST in megawatt-hours. The REST mandate exceeds our
projected renewables in all years (2013 to 2025).
Next we used generation and costs information from the utilities REST compliance reports
from 2007- 2011 to build a picture of how the utilities are complying with REST. For the years
2012 – 2025, we assumed the future mix of renewable resources would resemble the current
2011 mix. The major utilities, Arizona Service Company and Tucson Electric Power Company,
were exceeding the modest REST mandates in each compliance year and thus were able to
build banks of 654,000 MWhs of RECs in 2011. We assume that the utilities continue to add to
29 "Electric Power Monthly: Table 8. Retail Sales, Revenue, and Average Retail Price by Sector, 1990 Through
2012," (U.S. Energy Information Administration, 2012),
http://www.eia.gov/electricity/state/missouri/xls/sept08mo.xls. The historical compound growth rate was
calculated independently for each sector — residential, commercial, industrial and transportation — using the
years for which data was available. These independent rates were then used to project sales for each sector in
subsequent years, with the projected total annual retail sales calculated as the sum of the projected annual sector
sales. The result is a growth rate of 2.85% compared to a 3.0% projection by the Arizona Public Service Company.
See: http://www.aps.com/_files/various/ResourceAlt/2012ResourcePlan.pdf. 30 U.S. Department of Energy, Energy Information Administration, Annual Energy Outlook 2012, “Table 99:
Renewable Electricity Generation by Fuel.”
© The Beacon Hill Institute 2013
The Economic Impact of Arizona’s Renewable Energy Standard & Tariff / April 2013 21
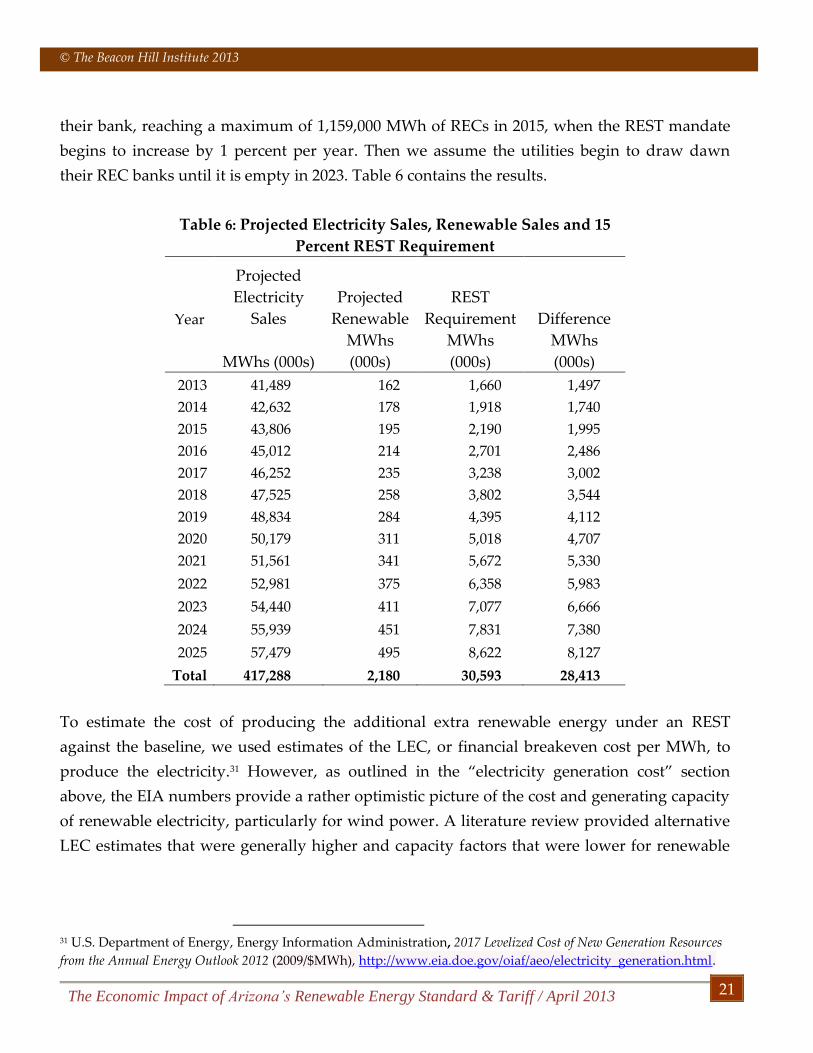
their bank, reaching a maximum of 1,159,000 MWh of RECs in 2015, when the REST mandate
begins to increase by 1 percent per year. Then we assume the utilities begin to draw dawn
their REC banks until it is empty in 2023. Table 6 contains the results.
Table 6: Projected Electricity Sales, Renewable Sales and 15
Percent REST Requirement
Year
Projected
Electricity
Sales
Projected
Renewable
REST
Requirement Difference
MWhs (000s)
MWhs
(000s)
MWhs
(000s)
MWhs
(000s)
2013 41,489 162 1,660 1,497
2014 42,632 178 1,918 1,740
2015 43,806 195 2,190 1,995
2016 45,012 214 2,701 2,486
2017 46,252 235 3,238 3,002
2018 47,525 258 3,802 3,544
2019 48,834 284 4,395 4,112
2020 50,179 311 5,018 4,707
2021 51,561 341 5,672 5,330
2022 52,981 375 6,358 5,983
2023 54,440 411 7,077 6,666
2024 55,939 451 7,831 7,380
2025 57,479 495 8,622 8,127
Total 417,288 2,180 30,593 28,413
To estimate the cost of producing the additional extra renewable energy under an REST
against the baseline, we used estimates of the LEC, or financial breakeven cost per MWh, to
produce the electricity.31 However, as outlined in the “electricity generation cost” section
above, the EIA numbers provide a rather optimistic picture of the cost and generating capacity
of renewable electricity, particularly for wind power. A literature review provided alternative
LEC estimates that were generally higher and capacity factors that were lower for renewable
31 U.S. Department of Energy, Energy Information Administration, 2017 Levelized Cost of New Generation Resources
from the Annual Energy Outlook 2012 (2009/$MWh), http://www.eia.doe.gov/oiaf/aeo/electricity_generation.html.
The Economic Impact of Arizona’s Renewable Energy Standard & Tariff / April 2013 22
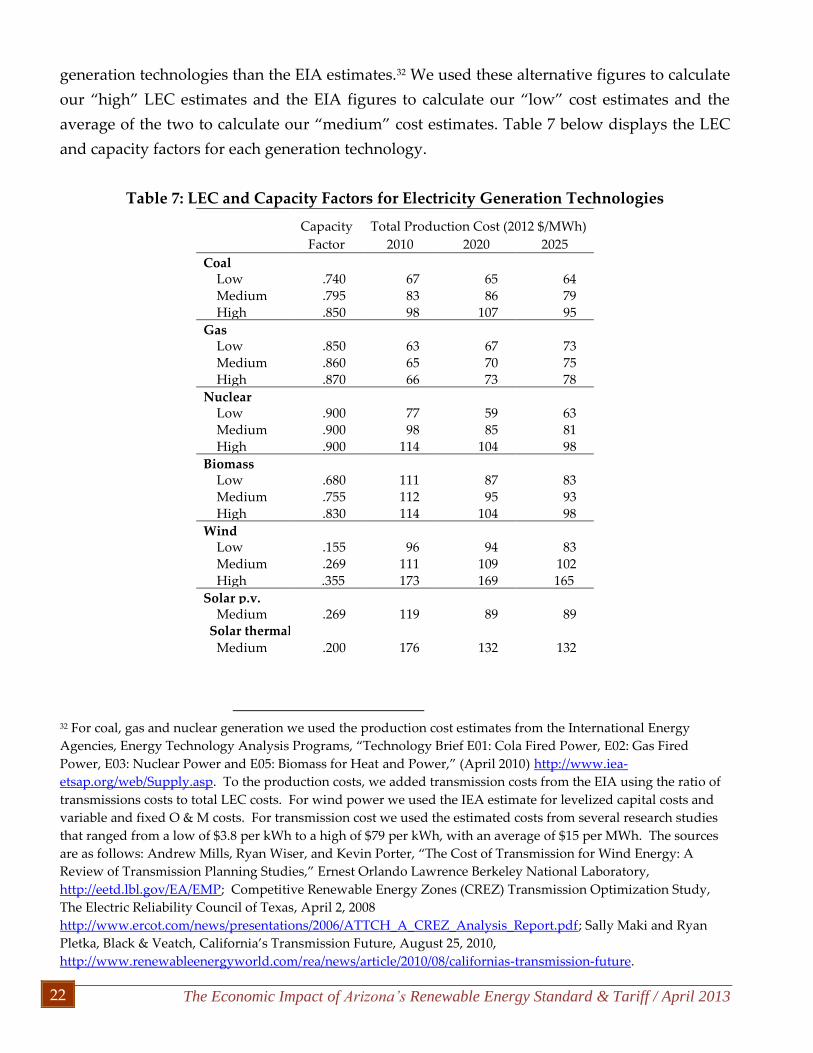
generation technologies than the EIA estimates.32 We used these alternative figures to calculate
our “high” LEC estimates and the EIA figures to calculate our “low” cost estimates and the
average of the two to calculate our “medium” cost estimates. Table 7 below displays the LEC
and capacity factors for each generation technology.
Table 7: LEC and Capacity Factors for Electricity Generation Technologies
Capacity Total Production Cost (2012 $/MWh)
Factor 2010 2020 2025
Coal Low .740 67 65 64 Medium .795 83 86 79 High .850 98 107 95
Gas Low .850 63 67 73 Medium .860 65 70 75 High .870 66 73 78
Nuclear Low .900 77 59 63 Medium .900 98 85 81 High .900 114 104 98
Biomass Low .680 111 87 83 Medium .755 112 95 93 High .830 114 104 98
Wind Low .155 96 94 83 Medium .269 111 109 102 High .355 173 169 165
Solar p.v. Medium .269 119 89 89
Solar thermal Medium .200 176 132 132
32 For coal, gas and nuclear generation we used the production cost estimates from the International Energy
Agencies, Energy Technology Analysis Programs, “Technology Brief E01: Cola Fired Power, E02: Gas Fired
Power, E03: Nuclear Power and E05: Biomass for Heat and Power,” (April 2010) http://www.iea-
etsap.org/web/Supply.asp. To the production costs, we added transmission costs from the EIA using the ratio of
transmissions costs to total LEC costs. For wind power we used the IEA estimate for levelized capital costs and
variable and fixed O & M costs. For transmission cost we used the estimated costs from several research studies
that ranged from a low of $3.8 per kWh to a high of $79 per kWh, with an average of $15 per MWh. The sources
are as follows: Andrew Mills, Ryan Wiser, and Kevin Porter, “The Cost of Transmission for Wind Energy: A
Review of Transmission Planning Studies,” Ernest Orlando Lawrence Berkeley National Laboratory,
http://eetd.lbl.gov/EA/EMP; Competitive Renewable Energy Zones (CREZ) Transmission Optimization Study,
The Electric Reliability Council of Texas, April 2, 2008
http://www.ercot.com/news/presentations/2006/ATTCH_A_CREZ_Analysis_Report.pdf; Sally Maki and Ryan
Pletka, Black & Veatch, California’s Transmission Future, August 25, 2010,
http://www.renewableenergyworld.com/rea/news/article/2010/08/californias-transmission-future.
© The Beacon Hill Institute 2013
The Economic Impact of Arizona’s Renewable Energy Standard & Tariff / April 2013 23
We adjusted the LECs for solar p.v. and solar thermal down to the EIA regional minimum to
reflect the fact that Arizona likely has a cost advantage in solar energy over other U.S. regions.
We then reduced the LEC for biomass until our estimated gross total costs for the year 2011
matched that of the compliance reports for all utilities. This averages $112.38 per MWh across
all renewable technologies for 2011.
We use the EIA’s reference case scenario for all technologies. We adjusted the 2017 LECs to
2025 by using the percentage change in the capital costs from 2017 to 2025, since capital costs
often represent the largest component of the cost structure for most technologies. For the
technologies that the EIA does not forecast LECs in 2020, we used the average of the 2016 and
2025 LEC calculations, assuming a linear change over the period.
Once we computed new LECs for 2020, we applied these figures to the renewable energy
estimates for the remainder of the period.
For conventional electricity, we assumed that the technologies are avoided based on their
costs, with the highest cost combustion turbine avoided first. For coal and gas, we assumed
they are avoided based on their estimated proportion of total electric sales for each year.
Although hydroelectric and nuclear are not the cheapest technology, we assume no
hydroelectric or nuclear sources are displaced since most were built decades ago with large
sunk costs and offer relatively cheap and clean electricity today.
To determine the impact of the REST standard in a given year, we calculated the amount of
renewable energy the REST would require that year and compared it to our renewable energy
baseline sales for that year; the difference represents the renewable sales attributable to the
REST policy. We then determined which renewable energy source(s) would be used to meet
the renewable energy sales attributable to the REST and calculated the additional renewable
energy costs by using the LEC(s) for the relevant energy source(s).
The increased total costs in renewable energy lead to decreased total costs in conventional
energy, since less conventional energy would be needed and sold. The decrease in
conventional energy production is not as large as the increase in renewable energy production,
however. Wind power and solar power in particular are intermittent (as reflected in their
relatively low capacity factors), and it would still be necessary to keep backup conventional

The Economic Impact of Arizona’s Renewable Energy Standard & Tariff / April 2013 24
energy sources online and ready to meet any sudden electrical demands that renewable
sources could not instantly provide. To estimate the share of conventional energy that would
still be running as backup, we used a ratio of the renewable energy capacity factor to the
conventional energy capacity factor.33
Tables 8, 9 and 10 on the following pages display the results of our medium-, low- and high-
cost calculations for the 15 percent REST respectively. We converted the aggregate cost of the
REST into a cost per-kWh by dividing the cost by the estimated total number of kWh sold for
that year. We converted the aggregate cost of the REST into a cost per-kWh by dividing the
cost by the estimated total number of kWh sold for that year. For example, for 2025 under the
medium cost scenario above, we divided $389.316 million into 57,479 billion kWhs for a cost of
0.68 cents per kWh.
Table 8: Medium Cost Case of 15 Percent REST Mandate from 2013 to 2025
Year Gross Cost
Less
Conventional Total
(2010 $000s) (2010 $000s) (2010 $000s)
2013 206,230 124,297 81,933
2014 236,586 140,429 96,158
2015 268,455 158,304 110,151
2016 296,673 176,104 120,569
2017 358,432 214,389 144,043
2018 423,363 255,737 167,627
2019 491,593 296,444 195,149
2020 563,255 344,139 219,116
2021 638,483 389,823 248,660
2022 717,421 439,204 278,217
2023 800,215 489,579 310,637
2024 906,486 555,393 351,093
2025 997,988 608,672 389,316
Total 3,483,071 2,099,666 1,383,405
33 For example, if the REST will require 100 MWh more wind than would otherwise be produced, then that 100
MWh of wind will produced at the LEC for wind. Ideally, then 100 MWh of natural gas-based energy would no
longer be needed, and the foregone costs would be computed at the LEC for natural gas. Since wind would
require a backup, however, we would estimate the amount of natural gas energy production needed on standby
by employing a ratio of the capacity factors of the two energy sources (using, for example, the mid-range
estimates from Table 6): 0.269/0.86 * 100 MWh of natural gas = 31.3 MWh of natural gas energy production.

© The Beacon Hill Institute 2013
The Economic Impact of Arizona’s Renewable Energy Standard & Tariff / April 2013 25
Table 9: Low Cost Case of 15 Percent REST Mandate from 2013 to 2025
Year Gross Cost
Less
Conventional Total
(2010 $000s) (2010 $000s) (2010 $000s)
2013 190,556 141,219 49,337
2014 218,602 157,878 60,724
2015 248,045 177,032 71,013
2016 274,118 197,598 76,520
2017 331,172 240,506 90,665
2018 391,156 287,576 103,581
2019 454,189 332,306 121,883
2020 520,392 387,959 132,433
2021 589,891 438,790 151,102
2022 662,818 494,700 168,119
2023 739,308 550,940 188,368
2024 837,484 624,848 212,636
2025 922,020 683,004 239,017
Total 3,218,122 2,360,863 857,258
Table 10: High Cost Case of a 15 Percent REST Mandate from 2013 to 2025
Year Gross Cost
Less
Conventional Total
(2010 $000s) (2010 $000s) (2010 $000s)
2013 243,529 109,425 134,104
2014 279,265 126,042 153,223
2015 316,791 143,448 173,343
2016 350,069 158,626 191,444
2017 422,619 193,188 229,431
2018 498,907 229,463 269,444
2019 579,086 267,502 311,583
2020 663,313 307,387 355,926
2021 751,751 349,164 402,588
2022 844,571 392,924 451,646
2023 941,946 438,711 503,235
2024 1,066,839 497,915 568,924
2025 1,174,506 548,261 626,245
Total 4,105,329 1,884,243 2,221,085
The Economic Impact of Arizona’s Renewable Energy Standard & Tariff / April 2013 26
Ratepayer Effects
To calculate the effect of the REST on electricity ratepayers we used EIA data on the average
monthly electricity consumption by type of customer: residential, commercial and industrial.34
The monthly figures were multiplied by 12 to compute an annual figure. We inflated the 2011
figures for each year using the average annual increase in electricity sales over the entire
period.35
We calculated an annual per-kWh increase in electricity cost by dividing the total cost increase
– calculated in the section above ─ by the total electricity sales for each year. We multiplied the
per-kWh increase in electricity costs by the annual kWh consumption for each type of
ratepayer for each year. For example, we expect the average residential ratepayer to consume
17,489 kWhs of electricity in 2025 and we expect the medium cost scenario to raise electricity
costs by 0.68 cents per kWh in the same year. Therefore we expect residential ratepayers to pay
an additional $130 in 2025.36
Modeling the REST using STAMP
We simulated these changes in the STAMP model as a percentage price increase on electricity
to measure the dynamic effects on the state economy. The model provides estimates of the
proposals’ impact on employment, wages and income. Each estimate represents the change
that would take place in the indicated variable against a “baseline” assumption of the value
that variable for a specified year in the absence of the REST policy.
Because the REST requires Arizona households and firms to use more expensive “green”
power than they otherwise would have under a baseline scenario, the cost of goods and
services will increase under the REST. These costs would typically manifest through higher
utility bills for all sectors of the economy. For this reason we selected the sales tax as the most
fitting way to assess the impact of the REST. Standard economic theory shows that a price
increase of a good or service leads to a decrease in overall consumption, and consequently a
34 U.S. Department of Energy, Energy Information Administration, “Average electricity consumption per
residence in MT in 2008,” (January 2010) http://www.eia.gov/electricity/sales_revenue_price/index.cfm. 35 U.S. Department of Energy, Energy Information Administration, Annual Energy Outlook 2010, “Table 8:
Electricity Supply, Disposition, Prices, and Emissions,” http://www.eia.doe.gov/oiaf/aeo/aeoref_tab.html. 36
We rounded the figure to the nearest $10s.

© The Beacon Hill Institute 2013
The Economic Impact of Arizona’s Renewable Energy Standard & Tariff / April 2013 27
decrease in the production of that good or service. As producer output falls, the decrease in
production results in a lower demand for capital and labor.
BHI applied its STAMP (State Tax Analysis Modeling Program) model to identify the
economic effects and understand how they operate through a state’s economy. STAMP is a
five-year dynamic CGE (computable general equilibrium) model that has been programmed to
simulate changes in taxes, costs (general and sector-specific) and other economic inputs. As
such, it provides a mathematical description of the economic relationships among producers,
households, governments and the rest of the world. It is general in the sense that it takes all the
important markets, such as the capital and labor markets, and flows into account. It is an
equilibrium model because it assumes that demand equals supply in every market (goods and
services, labor and capital). This equilibrium is achieved by allowing prices to adjust within
the model. It is computable because it can be used to generate numeric solutions to concrete
policy and tax changes.37
In order to estimate the economic effects of a national REST we used a compilation of six
STAMP models to garner the average effects across various state economies: New York, North
Carolina, Washington, Kansas, Indiana and Pennsylvania. These models represent a wide
variety in terms of geographic dispersion (northeast, southeast, midwest, the plains and west),
economic structure (industrial, high-tech, service and agricultural), and electricity sector
makeup.
First we computed the percentage change to electricity prices as a result of three different
possible REST policies. We used data from the EIA from the state electricity profiles, which
contains historical data from 1990-2011 for retail sales by sector (residential, commercial,
industrial, and transportation) in dollars and MWhs and average prices paid by each sector.38
We inflated the sales data (dollars and MWhs) though 2020 using the historical growth rates
for each sector for each year. We then calculated a price for each sector by dividing the dollar
value of the retails sales by kWhs. Then we calculated a weighted average kWh price for all
37 For a clear introduction to CGE tax models, see John B. Shoven and John Whalley, “Applied General-
Equilibrium Models of Taxation and International Trade: An Introduction and Survey,” Journal of Economic
Literature 22 (September, 1984): 1008. Shoven and Whalley have also written a useful book on the practice of
CGE modeling entitled Applying General Equilibrium (Cambridge: Cambridge University Press, 1992). 38 Electric Power Monthly: Table 8. Retail Sales, Revenue, and Average Retail Price by Sector, 1990 Through 2011,"
(U.S. Energy Information Administration, 2012), http://www.eia.gov/electricity/state/missouri/xls/sept08mo.xls.
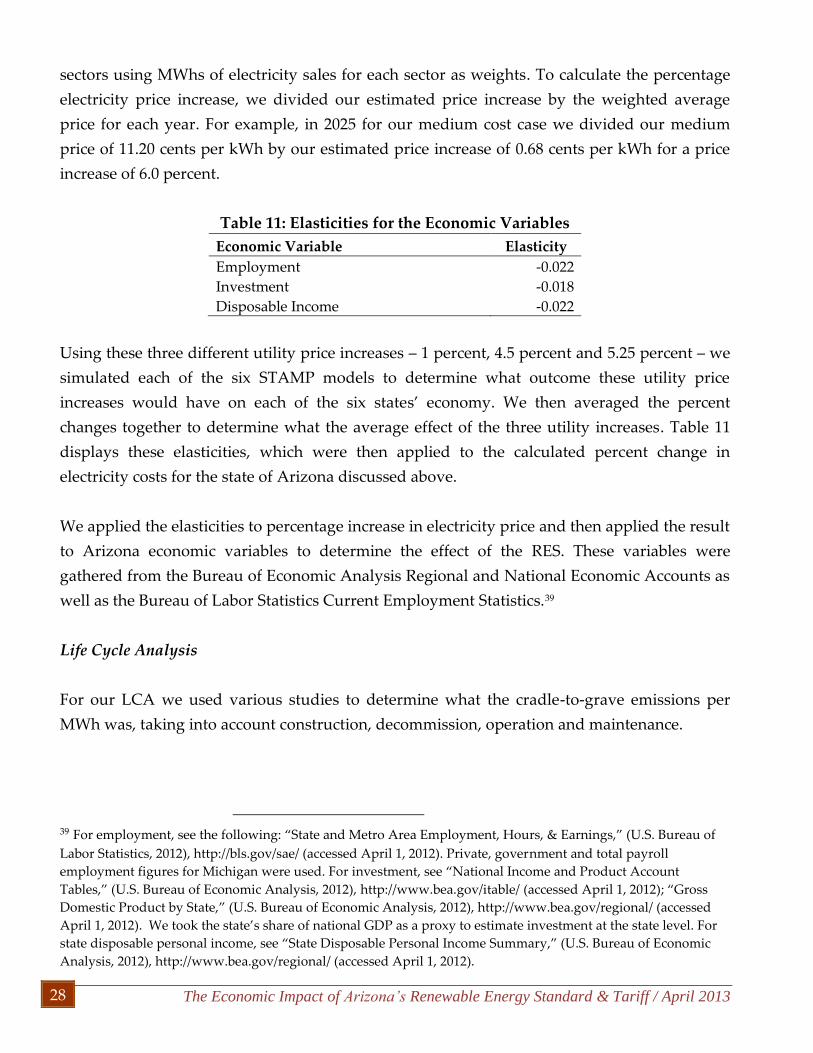
The Economic Impact of Arizona’s Renewable Energy Standard & Tariff / April 2013 28
sectors using MWhs of electricity sales for each sector as weights. To calculate the percentage
electricity price increase, we divided our estimated price increase by the weighted average
price for each year. For example, in 2025 for our medium cost case we divided our medium
price of 11.20 cents per kWh by our estimated price increase of 0.68 cents per kWh for a price
increase of 6.0 percent.
Table 11: Elasticities for the Economic Variables
Economic Variable Elasticity
Employment -0.022 Investment -0.018 Disposable Income -0.022
Using these three different utility price increases – 1 percent, 4.5 percent and 5.25 percent – we
simulated each of the six STAMP models to determine what outcome these utility price
increases would have on each of the six states’ economy. We then averaged the percent
changes together to determine what the average effect of the three utility increases. Table 11
displays these elasticities, which were then applied to the calculated percent change in
electricity costs for the state of Arizona discussed above.
We applied the elasticities to percentage increase in electricity price and then applied the result
to Arizona economic variables to determine the effect of the RES. These variables were
gathered from the Bureau of Economic Analysis Regional and National Economic Accounts as
well as the Bureau of Labor Statistics Current Employment Statistics.39
Life Cycle Analysis
For our LCA we used various studies to determine what the cradle-to-grave emissions per
MWh was, taking into account construction, decommission, operation and maintenance.
39 For employment, see the following: “State and Metro Area Employment, Hours, & Earnings,” (U.S. Bureau of
Labor Statistics, 2012), http://bls.gov/sae/ (accessed April 1, 2012). Private, government and total payroll
employment figures for Michigan were used. For investment, see “National Income and Product Account
Tables,” (U.S. Bureau of Economic Analysis, 2012), http://www.bea.gov/itable/ (accessed April 1, 2012); “Gross
Domestic Product by State,” (U.S. Bureau of Economic Analysis, 2012), http://www.bea.gov/regional/ (accessed
April 1, 2012). We took the state’s share of national GDP as a proxy to estimate investment at the state level. For
state disposable personal income, see “State Disposable Personal Income Summary,” (U.S. Bureau of Economic
Analysis, 2012), http://www.bea.gov/regional/ (accessed April 1, 2012).
© The Beacon Hill Institute 2013
The Economic Impact of Arizona’s Renewable Energy Standard & Tariff / April 2013 29
For coal we reviewed three different system types: an ‘average system’ that accounts for
emissions from typical coal fired generation in 1995; New Source Performance Standards
based on requirements put into effect for all plants built after 1978; and Low Emission Boiler
Systems, which are newer, more efficient coal plants.40 The LCA calculations account for
various inputs including, but not limited to, mining, transportation of minerals, power plant
operation as well as decommissions and disposal of a plant. Natural gas plants’ LCAs were
based on the LCA for Gas Combined Cycle Power Generation plants, a type of plant that is
similar to the majority of the natural gas plants in the United States.41
The LCA for wind power accounted for both onshore and off shore wind power, which has
different values for manufacturing, dismantling, operation and transportation for each type.42
Solar photovoltaic estimates were wide ranging, but a Science Direct paper supplied an in-
depth, comprehensive review.43 It reviewed three different types of crystalline silicone
modules as well as a CdTe thin film version and induced many different costs such as
emissions from building the module and frame (for the crystalline silicone version) as well as
operation and maintenance emissions. For biomass and wood waste LCA we used a report
that looked at the production of energy using wood and biomass byproducts to produce
energy.44 There different types of delivery systems (lorry, train and barge) for the fuel, as well
as construction, operation and decommissioning.
With total emissions per MWh calculated, we were able to use our in-house model to calculate
the total emissions that would be added to and removed from the Arizona energy system. The
first calculation used the amount of renewable energy added per the Class I REST law, as well
as the amount of conventional power that would be removed, after accounting for capacity
factor requirements to keep a constant amount of energy produced. Each MWh added was
multiplied by its respective LCA emission, and then we subtracted the amount of conventional
time LCA emissions. With a basic conversion from grams to metric tons, we had calculated the
40 Pamela L Spath, Margaret K Mann, Dawn R Kerr. “Life Cycle Assessment of Coal-fired Power Production.”
National Renewable Energy Laboratory. June 1999. 41 Pamela L Spath, Margaret M Mann. “Life Cycle Assessment of a Natural Gas Compbined-Cycle Power
Generation System.” National Renewable Energy Laboratory. September 2000. 42 “Life Cycle Assessment of Offshore and Onshore Sited Wind Farms.” ELSAM Engineering S/A. October 2004. 43 V M Fethankis, H C Kim. “Photovoltaics: Life Cycle Analysis.” Science Direct. October 2009. 44 Christian Bauer. “Life Cycle Assessment of Fossil and Biomass Power Generation Chains.” Paul Sherrer
Institute. December 2008.

The Economic Impact of Arizona’s Renewable Energy Standard & Tariff / April 2013 30
results seen in Table 4. An identical calculated was done, but not accounting for capacity
factors.
© The Beacon Hill Institute 2013
The Economic Impact of Arizona’s Renewable Energy Standard & Tariff / April 2013 31
About the Authors
David G. Tuerck is executive director of the Beacon Hill Institute for Public Policy Research at
Suffolk University, where he also serves as chairman and professor of economics. He holds a
Ph.D. in economics from the University of Virginia and has written extensively on issues of
taxation and public economics.
Paul Bachman is director of research at BHI. He manages the institute's research projects,
including the development and deployment of the STAMP model. Mr. Bachman has authored
research papers on state and national tax policy and on state labor policy and produces the
institute’s state revenue forecasts for the Massachusetts legislature. He holds a Master Science
in International Economics from Suffolk University.
Michael Head is a research economist at BHI. He holds a Master of Science in Economic Policy
from Suffolk University.
The authors would like to thank Frank Conte, BHI Director of Communications, for his editorial assistance.
Related Documents