The Basics of Canopy Measurement WAWGG – February 4, 2009 James M. Meyers & Justine E. Vanden Heuvel, Cornell University

Welcome message from author
This document is posted to help you gain knowledge. Please leave a comment to let me know what you think about it! Share it to your friends and learn new things together.
Transcript

The Basics of Canopy Measurement
WAWGG – February 4, 2009
James M. Meyers & Justine E. Vanden Heuvel, Cornell University

Agenda Canopy Architecture and Sunlight
Measuring Canopy Architecture Point Quadrat Analysis (PQA) Enhanced Point Quadrat Analysis (EPQA)
Measuring Sunlight Distribution Cluster Exposure Mapping Leaf Exposure Mapping

Why We Measure Canopies
Canopy measurements provide insight into vine performance and fruit quality.
Energy Production (photosynthesis) Exposed Leaf Area
Fruit Quality Cluster Exposure Functional Crop Load (yield vs.
exposed leaf area)


Agenda Canopy Architecture and Sunlight
Measuring Canopy Architecture Point Quadrat Analysis (PQA) Enhanced Point Quadrat Analysis (EPQA)
Measuring Sunlight Distribution Cluster Exposure Mapping Leaf Exposure Mapping

Point Quadrat Analysis (PQA)
What is PQA? PQA is a simple field method for measuring
key parameters of canopy architecture Why perform PQA?
PQA metrics quantify canopy differences PQA metrics provide insight into vine
performance

Measurements are taken at consistent height (usually middle of the fruiting zone), but can be somewhat dynamic due to variations in vineyard floor and trellising.
Point Quadrat Measurement Zone
(Photo J. Meyers)

Canopy is sampled, at the designated height, at consistent intervals along the row.
Sampling Frequency
(Photo J. Meyers)

At each sampling location, data is collected from one outer edge of the other outer edge.
Sampling Vector
(Photo J. Meyers)

A tape measure or meter stick is used to ensure consistently spaced measurements.
Point Quadrat Data Collection
(Photo from Sunlight into Wine, credited to B.W.)
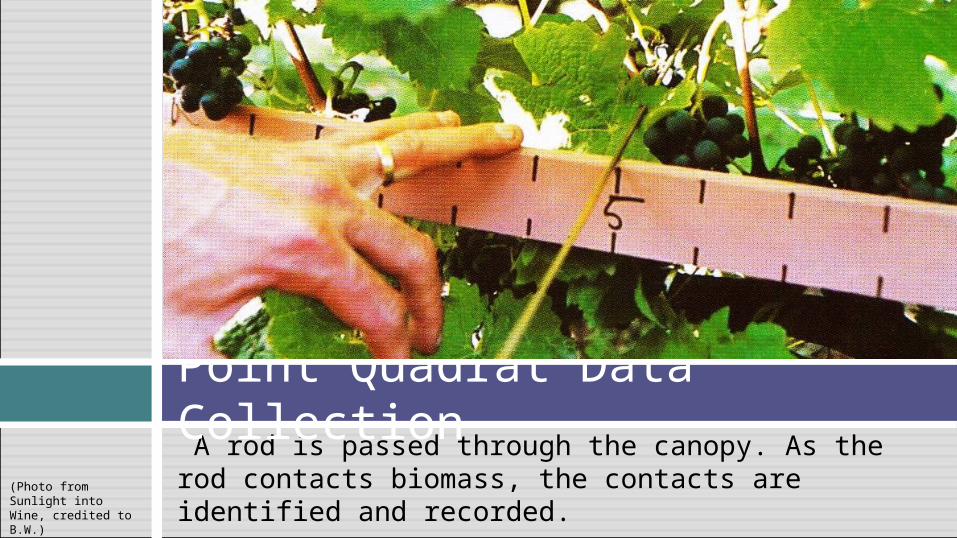
A rod is passed through the canopy. As the rod contacts biomass, the contacts are identified and recorded.
Point Quadrat Data Collection
(Photo from Sunlight into Wine, credited to B.W.)

In this example, ignoring shoots, the first insertion produces the following dataset: “L L C”.
Sample Dataset
(Photo from Sunlight into Wine, credited to R.S.)
Vigor Light Environment
Metric% Gaps
(PG)Leaf Layer Num (LLN)
% Interior Leaves (PIL)
% Interior Clusters (PIC)
Formula
Result 33.33 3 55.55 100
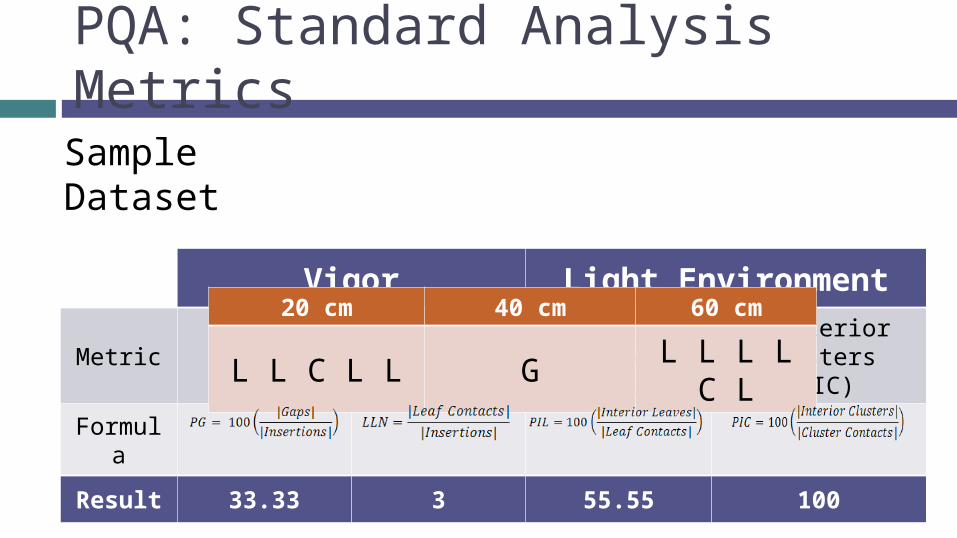
PQA: Standard Analysis Metrics
20 cm 40 cm 60 cm
L L C L L GL L L L C
L
Sample Dataset

PQA: Standard Analysis Metrics
Vigor Light Environment
Metric% Gaps
(PG)Leaf Layer Num (LLN)
% Interior Leaves (PIL)
% Interior Clusters (PIC)
Formula
Result 33.33 3 55.55 100
20 cm 40 cm 60 cm
L L C L L GL L L L C
L
Sample Dataset

PIC: Simplified Analysis Results
Control Treatment
Panel 1 94.1 80
Panel 2 77.8 66.7
Average 85.9 73.3
% Difference 14.8
PIC is often used to establish treatment efficacy.

Enhanced Point Quadrat Analysis (EPQA) What is EPQA?
Data collection method is the same as standard PQA EPQA uses computer software to calculate canopy
parameters with more precision than standard PQA metrics
Why perform EPQA? EPQA is more descriptive than standard PQA EPQA adds metrics for canopy symmetry and trellising
consistency EPQA provides the foundation for canopy exposure
mapping

Agenda Canopy Architecture and Sunlight
Measuring Canopy Architecture Point Quadrat Analysis (PQA) Enhanced Point Quadrat Analysis (EPQA)
Measuring Sunlight Distribution Cluster Exposure Mapping Leaf Exposure Mapping

Calibrated Exposure Mapping
(Photo from Sunlight into Wine, credited to B.W.)
(Photo from Decagon website)

Calibrating a Canopy Sunlight calibration curve
is unique to each canopy Curve can be fitted with
only two known %PPF points 100% PPF always at layer 0 Measure %PPF at a second
known canopy layer (OLN/2)
Fit curve to the two points Sample the fitted curve at
layer 1 to determine calibration value (Ep1)
0 1 2 3 4 5 6
100908070605040302010
Canopy Layer
(x=1, y=Ep1)
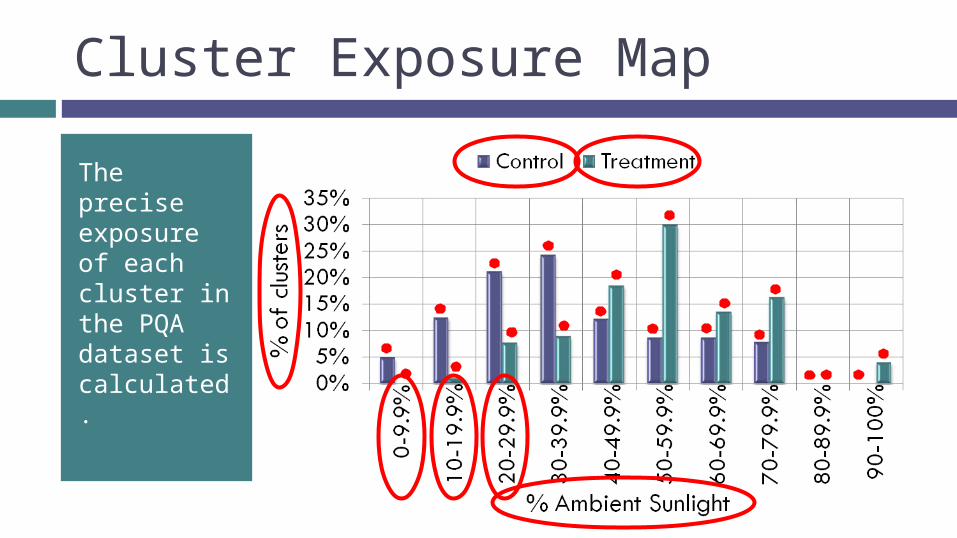
Cluster Exposure Map
The precise exposure of each cluster in the PQA dataset is calculated.

Leaf Exposure Map
The precise exposure of each leaf in the PQA dataset is calculated.

Treatment Effect: Cluster Exposure Map
Umbrella trained hybrid canopy in Finger Lakes subjected to:
Shoot Thinning (ST)
Hedging (H)
Combination (ST-H)
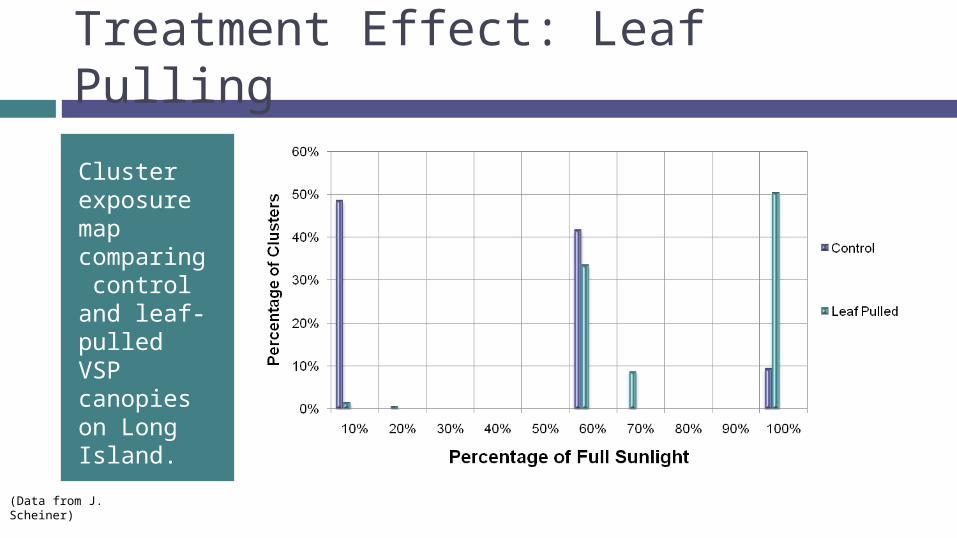
Treatment Effect: Leaf Pulling
Cluster exposure map comparing control and leaf-pulled VSP canopies on Long Island.
(Data from J. Scheiner)
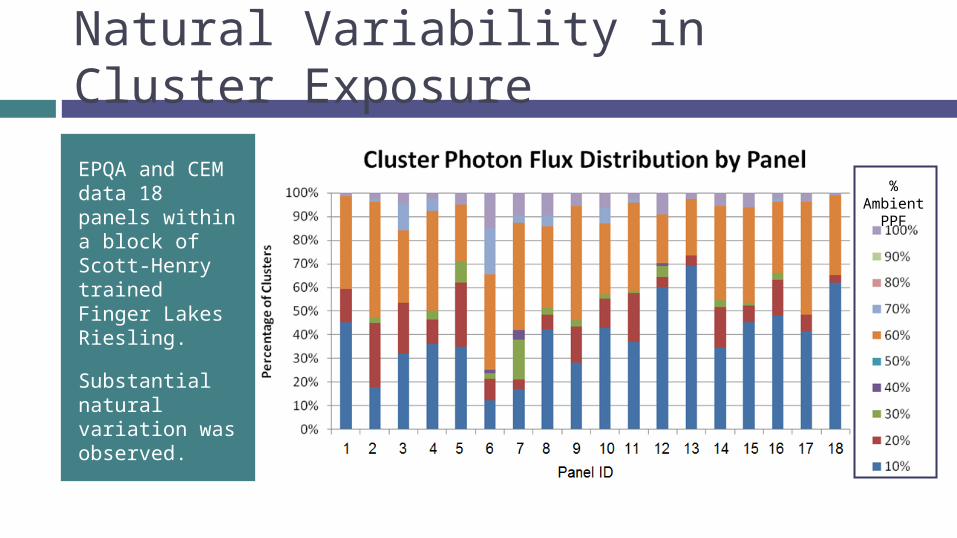
Natural Variability in Cluster Exposure
EPQA and CEM data 18 panels within a block of Scott-Henry trained Finger Lakes Riesling.
Substantial natural variation was observed.
% Ambient PPF

Map Your Own Canopies
An Excel spreadsheet is available for growers and researchers who wish to map exposure in their own canopies.
Contact:
Jim Meyers

The Basics of Canopy Measurement
WAWGG – February 4, 2009
James M. Meyers & Justine E. Vanden Heuvel, Cornell University
Related Documents